Abstract
In the field of intelligent transportation, the planning of traffic flows that meet energy-efficient driving requirements necessitates the acquisition of energy consumption data for each vehicle within the traffic flow. The current methods for calculating vehicle energy consumption generally rely on longitudinal dynamics models, which require comprehensive knowledge of all vehicle power system parameters. While this approach is feasible for individual vehicle models, it becomes impractical for a large number of vehicle types. This paper proposes a digital model for vehicle driving energy consumption using vehicle speed, acceleration, and battery state of charge (SOC) as inputs and energy consumption as output. The model is trained using an optimized CNN-BiLSTM-Attention (OCBA) network architecture. In comparison to other methods, the OCBA-trained model for predicting PHEV driving energy consumption is more accurate in simulating the time-dependency between SOC and instantaneous fuel and power consumption, as well as the power distribution relationship within PHEVs. This provides an excellent framework for the digital modeling of complex power systems with multiple power sources. The model requires only 54 vehicle tests for training, which is significantly fewer than over 2000 tests typically needed to obtain parameters for power system components. The model’s prediction error for fuel consumption under unknown conditions is reduced to 5%, outperforming the standard error benchmark of 10%. Furthermore, the model demonstrates high generalization capability with an R2 value of 0.97 for unknown conditions.
1. Introduction
Transportation is the world’s largest consumer of oil and the second-largest source of carbon dioxide emissions, which has led to increasingly serious energy and environmental problems. The development of effective ecological planning systems, such as intelligent transportation systems (ITS), eco-driving assistance systems, and eco-route assistance systems, is of critical importance in order to control and reduce greenhouse gas emissions. Currently, ITS is rapidly developing, with an increasing number of vehicles gaining the ability to communicate with public transportation systems. The primary objective of ITS is to address the issues of frequent safety accidents and high energy consumption in traditional transportation systems. A significant reason for high energy consumption is the lack of accurate methods for estimating the energy consumption of all vehicles within the transportation system.
The majority of existing vehicle energy consumption models are longitudinal dynamic models based on physical characteristics, developed primarily for the purpose of energy management strategy design. These models are constructed using parameters such as vehicle configuration, power system efficiency MAP, and vehicle resistance [1,2,3,4,5,6,7,8]. This method is suitable for the vehicle development phase when a complete vehicle is not yet available for testing. However, this approach has the disadvantage of requiring comprehensive parameters of the powertrain components, which necessitates substantial testing efforts and is applicable only to a single-vehicle model. Once the vehicle prototype is completed, further calibration of the model is necessary based on full vehicle test data to enhance the model’s accuracy.
To extend the applicability of the longitudinal dynamic model, efficiency-related parameters can be simplified into several efficiency factors, which are obtained through simulation and then fed back into the longitudinal dynamic model [9]. This method assumes that vehicles can be categorized into several classes, each with similar efficiency factors. Representative vehicle parameters are entered into the model within simulation software, and different operating conditions are set. Efficiency factors are then derived by analyzing the simulation results.
The disadvantage of this approach is that it still necessitates the input of powertrain parameters in order to calculate the efficiency factors. These factors represent average values over a section of road, which cannot change instantaneously. Furthermore, for PHEVs, the calculation of efficiency factors introduces a generic energy management strategy that may not align with the actual energy management strategy employed in real vehicles. The model’s energy consumption error rates are as follows: gasoline vehicles (1.1%), diesel vehicles (9.7%), HEVs (10.6%), and PHEVs (8.7%), with significant errors for all types except gasoline vehicles.
In the field of intelligent transportation, the study of vehicle energy consumption models is primarily based on the statistical characteristics of different vehicle energy consumption data. These data include vehicle-specific power probability distributions and fuel factors for various roads, which are used to calculate the energy consumption of vehicles in traffic flow [10]. This method is suitable for estimating the overall energy consumption of the traffic flow, but it cannot predict the energy consumption of individual vehicles in detail or study the instantaneous changes in vehicle energy consumption. Other factors that influence the energy consumption of pure electric vehicles include trip conditions, weather, driving behavior, and road characteristics [11,12,13].
It is becoming increasingly common to construct energy consumption models using actual collected data. Various statistical methods, including linear regression (LR), random forest (RF), support vector regressor (SVR), and neural networks (NN), have been employed to train energy consumption models for pure electric buses [14,15,16]. The input features for these models typically include travel distance, mean speed, average number of passengers, mean and standard deviation of road slope, mean ambient temperature, and solar irradiance. This approach introduces the concept of using data to construct energy consumption models. However, these models only predict the total energy consumption over a period of time and cannot provide real-time predictions, and the neural network employed is the simplest form, as a feed-forward neural network (FNN).
In addition to utilizing actual collected data, data generated by simulation models can also be employed for energy consumption modeling [17]. The advantage of employing physical models to obtain data lies in the capacity to arbitrarily set the values of input features in the simulation, allowing for the facile acquisition of large amounts of data. The significance of each feature is analyzed, and the quadratic regression method is employed to train the model.
In the longitudinal dynamics analysis of vehicles, data-driven linear state space models and neural network models can be employed to investigate the vehicle acceleration response resulting from inputs such as driving force, braking force, and gear position as they act through various components of the vehicle power system [18,19,20]. These models can be constructed using deep feed-forward neural networks to represent individual components related to energy consumption, such as the SOC estimation model for batteries [21]. The influence of human driving behavior on energy consumption is analyzed based on measured data, with human driving behavior represented by the force and frequency of accelerator and brake pedal inputs, which are collected and used as model inputs. The model is built using an LSTM network, and the output is the vehicle’s energy consumption over 100 km [22]. Furthermore, models employing convolutional neural networks (CNN), long short-term memory (LSTM), or bidirectional long short-term memory recurrent neural networks with full convolutional networks are utilized to predict vehicle speed trajectories over a future period, contingent on road and traffic conditions [23,24].
The longitudinal dynamic model, which is based on physical characteristics, requires extensive testing of power system components in order to obtain efficiency parameters. Furthermore, each vehicle type necessitates separate tests, which makes it difficult to obtain and unsuitable for large-scale modeling. Using the statistical characteristics of vehicle energy consumption data can estimate the energy consumption of a vehicle over a certain distance or period, but it cannot calculate the instantaneous energy consumption. Additionally, a model of power system components alone cannot fully predict vehicle energy consumption. In the case of PHEVs, in addition to the vehicle model, an energy management strategy model is also required in order to predict vehicle energy consumption. However, obtaining the energy management strategy, which represents the core strategy of PHEVs, is even more challenging.
To address the above issues, this paper develops a PHEV energy consumption prediction model based on an optimized CNN-BiLSTM-Attention network (OCBA). The main contributions of this method are as follows:
- The proposed vehicle energy consumption prediction model, OCBA, does not necessitate the provision of accurate powertrain parameters and efficiency or power loss maps by vehicle manufacturers, thereby enhancing the efficacy of current energy consumption prediction models.
- Our proposed vehicle energy consumption prediction model, OCBA, is independent of vehicle manufacturers in providing models for PHEV energy management strategies.
- The proposed vehicle energy consumption prediction model, OBCA, is based on the learning of empirical data collected from vehicles and is trained using optimized convolutional neural networks (CNNs), bidirectional long and short-term memory (BiLSTMs), and attention mechanisms. The results of experiments demonstrate that OBCA has a higher prediction accuracy compared to other commonly used methods.
The structure of this paper is as follows: the Section 2 describes the configuration of the target vehicle and its energy consumption prediction model based on physical characteristics. The Section 3 presents the construction of the Optimized CNN-BiLSTM-Attention neural network architecture. The Section 4 is a comparative analysis of the training results of the neural network model. The Section 5 is the application of the model. The Section 6 is the conclusion of this paper.
2. Vehicle Configuration and Physical Model
The configuration of the PHEV under investigation in this paper and the methodology employed to construct the energy consumption prediction model based on physical characteristics are presented below. The majority of existing vehicle energy consumption prediction models are based on the knowledge of component physical characteristics and system dynamics. The initial step in establishing these models is to analyze the configuration of the vehicle power system in order to clarify the vehicle’s power transmission path.
As illustrated in Figure 1, the PHEV power system comprises the engine, generator MG1, drive motor MG2, power battery, clutch, and gear transmission system. The vehicle’s driving mode can be altered by controlling the clutch:
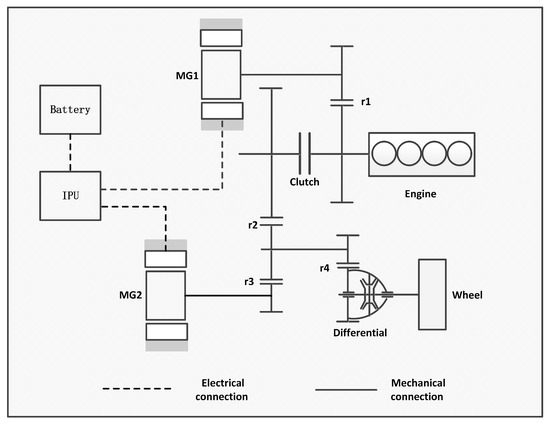
Figure 1.
PHEV powertrain configuration.
- (1)
- When the clutch is disengaged, the engine and generator disconnect from the transmission system, and the vehicle is driven directly by the drive motor. If the drive motor’s electrical energy is derived exclusively from the power battery, the vehicle operates in pure electric mode. Conversely, if the engine drives the generator to provide electricity in conjunction with the battery, the vehicle operates in series drive mode.
- (2)
- When the clutch is engaged, the engine/generator and transmission system connect mechanically to jointly drive the vehicle, providing power through the motor.
As illustrated in Figure 2, the conventional energy consumption prediction model employs a driver model to calculate the requisite driving and braking force requirements. The vehicle control unit (VCU) determines the optimal vehicle operation mode (pure electric drive, series drive, or parallel drive) based on these requirements and vehicle state parameters (actual vehicle speed and battery SOC). The vehicle control unit (VCU) also determines the clutch status and allocates corresponding torque values to the engine, MG1, and MG2. The power system’s torque is transmitted to the wheels through the transmission system, influencing vehicle acceleration along with driving resistance. The vehicle acceleration is integrated to obtain the actual vehicle speed, which is fed back to the driver model to adjust driving and braking force requirements, completing the speed curve following the process. This requires a comprehensive vehicle dynamics model, which includes the following components:
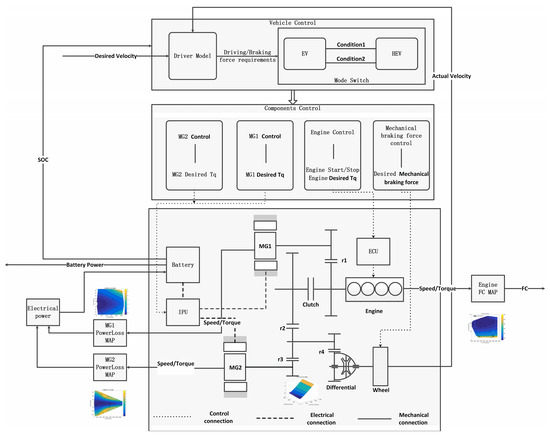
Figure 2.
Traditional vehicle energy consumption model.
- (1)
- Driver model: This model is used to follow the expected vehicle speed.
- (2)
- Vehicle energy management strategy model: This model is used to calculate the expected driving mode and allocate the expected torque of components.
- (3)
- Component control model: This model is used to limit the expected torque of components within a reasonable range.
- (4)
- Power system model: The model is employed to simulate the motion relationship of the vehicle transmission system, including gear transmission efficiency, transmission ratio relationships, and so forth. It is then used to transmit the component torque to the wheels in order to form driving force.
- (5)
- Vehicle resistance model: This model is employed to simulate vehicle driving resistance, including wind resistance, rolling resistance, mechanical resistance, and so forth. It is then used to calculate vehicle acceleration with driving force.
Once the aforementioned model has been established, the simulation of the vehicle can be completed, and the expected speed curve can be followed. However, energy consumption modeling has not yet been completed. At this point, the model can obtain the speed and torque signals of the engine, MG1, and MG2. The speed and torque signals of the engine are used to determine its fuel consumption by referencing the engine’s universal characteristic MAP. In a similar manner, the speed and torque signals of MG1 and MG2 are employed to ascertain their respective electrical power consumption with reference to their respective power loss MAPs. The electrical power consumption of the two motors is considered to be the electrical power output of the battery. Finally, the battery’s total power consumption is calculated using parameters such as internal resistance and open circuit voltage.
To illustrate, consider a motor with a maximum torque of 160 Nm and a maximum speed of 18,000 r/min. In order to obtain its power loss MAP, it is necessary to test the torque at intervals of 10 Nm and the speed at intervals of 500 r/min, which results in approximately 1000 tests. As a PHEV has two motors and one engine, the number of tests required to obtain the powertrain efficiency MAP is at least 2000.
In summary, the difficulties in establishing a traditional vehicle energy consumption model can be summarized as follows:
- (1)
- A large number of parameters for the entire vehicle and powertrain components are required, necessitating coordination between the vehicle manufacturer and component suppliers, making them difficult to obtain. Additionally, these parameters only represent the initial state of the vehicle design and cannot be updated in real-time as the vehicle is used.
- (2)
- A detailed energy management strategy model is required. As a core strategy of new energy vehicles, the energy management strategy is generally proprietary to vehicle manufacturers and is not disclosed to the public. In order to address these challenges, a deep learning-based method was developed in this paper with the objective of establishing a PHEV energy consumption prediction model.
3. Energy Consumption Prediction Model Based on Deep Learning
Establishing a deep learning-based energy consumption prediction model requires designing a neural network architecture. Energy consumption prediction is a regression operation on time series data [25,26,27,28].
The initial step in modeling PHEV energy consumption is to extract the features most closely related to energy consumption. To avoid the potential issues associated with manual feature selection, the energy consumption prediction model employs a convolutional neural network (CNN) to automatically extract features. Unlike the single energy source of fuel cars and EVs, the energy consumption of PHEVs includes both engine fuel consumption and battery energy consumption, with a significant time lag between them. When the battery is fully charged, PHEV energy management strategies tend to utilize the battery to power the vehicle, consuming only electrical energy. As the battery’s SOC (state of charge) drops, the PHEV will inevitably start the engine, which may charge the battery while driving the vehicle.
To capture the time-related aspects of PHEV energy consumption, the prediction model employs a BiLSTM (bidirectional long short-term memory) network. Even when the battery SOC is high, the engine may be started due to high-load operations, such as rapid acceleration or high-speed conditions. Conversely, even under low-load conditions, the engine may be started if the battery SOC reaches its lower limit.
In summary, the fuel or electricity consumed by a PHEV depends on the vehicle’s operating state, battery SOC, and other factors, and the importance of these factors varies under different conditions. In order to simulate the varying importance of different characteristics on PHEV energy consumption, the prediction model incorporates an attention network.
In order to enhance the accuracy of PHEV energy consumption prediction, a more sophisticated and sophisticated composite neural network architecture, CNN-BiLSTM-Attention, is introduced in this paper. This network architecture integrates convolutional neural networks (CNN), bidirectional long short-term memory networks (BiLSTM), and self-attention mechanisms, which can more effectively capture the interrelationships and temporal dynamics between feature parameters. The architecture of the CNN-BiLSTM-Attention network is depicted in Figure 3.
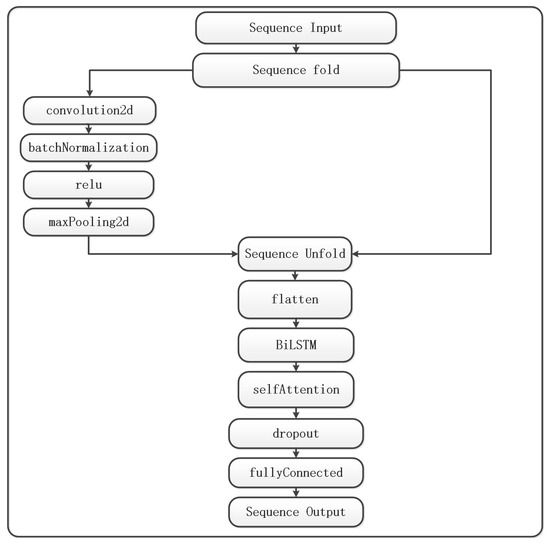
Figure 3.
CNN-BiLSTM-Attention network architecture.
BiLSTM (bi-directional long short-term memory) is composed of forward LSTM and backward LSTM. As illustrated in Figure 4, a path from back to front is incorporated on the basis of data dissemination from front to back. Each path is capable of calculating the hidden state and unit state at each time point in accordance with the requirements of the LSTM network. The output at each time point is determined collectively by the state parameters of the two paths. The structure of BiLSTM enables it to represent the impact of past time periods on the current time point and also express the impact of future time periods on the current time point.
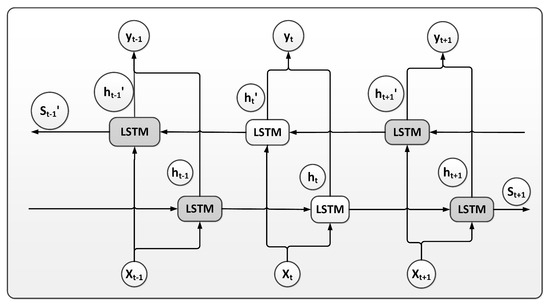
Figure 4.
BiLSTM network architecture.
The self-attention network is depicted in Figure 5. For input X, the query value (Q), key value (K), and value (V) are calculated following Formulas (2) to (4) in order. represents the degree of similarity between the Q value of each input and the K value of other inputs. is the dimension of the k-vector employed to prevent gradient vanishing. The softmax function can be employed to normalize the similarity, ensuring that their sum is equal to one and enabling weight allocation. Finally, the weight coefficients are multiplied by V to achieve the self-attention mechanism. The weight parameters , , and must be learned. The calculation of the correlation between all inputs and self-attention allows for a comprehensive description of the relationship between feature quantities and outputs.
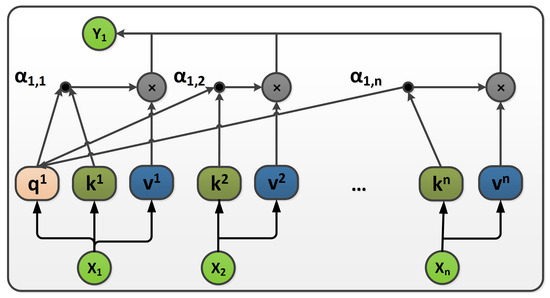
Figure 5.
Self-attention network architecture.
4. Test Results and Analysis
4.1. Experimental Data Preprocessing
The PHEV energy consumption test was conducted on a chassis dynamometer, which offers the advantage of controllable external environmental conditions. This ensures consistency in the vehicle’s state across each test. The chassis dynamometer was equipped with an emission analyzer, allowing the use of the carbon balance method to accurately calculate the vehicle’s fuel consumption. However, it is not possible to use this method to calculate the actual fuel consumption values of vehicles in real traffic scenarios, as exhaust emissions cannot be collected in such environments. Therefore, the instantaneous fuel consumption signal from the engine, directly obtained from the vehicle control unit (VCU), was used as the basis for calculating fuel consumption, and battery power was used to calculate electrical energy consumption. These two signals served as the outputs of the PHEV energy consumption prediction model.
The vehicle status was represented by vehicle speed, vehicle acceleration, and battery SOC. Vehicle speed represented the energy consumption components such as air resistance, rolling resistance, and internal mechanical loss during constant speed driving. Vehicle acceleration characterized the energy consumption during acceleration and deceleration, while battery SOC characterized the current available power state of the battery. These three signals were inputs to the PHEV energy consumption prediction model.
The slope was not included in the experimental setup. While actual roads do exhibit some slope, this is typically minimal and can be reasonably disregarded in energy consumption modeling. However, if the measured data include slope signals or related signals for calculating their values, these can be incorporated into the model inputs. Similarly, the steering angle or heading angle signal of a vehicle can be used to characterize the impact of turning conditions on energy consumption. However, the correlation between longitudinal and lateral vehicle movements can generally be ignored due to their weak correlation in vehicle energy consumption models.
The vehicle data were collected after the engine was fully warmed up, thus avoiding cold start conditions. This setup aligns more closely with the continuous operation conditions of vehicles in real traffic scenarios, differing from emission and fuel consumption tests that start the engine from a cold start. Furthermore, air conditioning was always deactivated to eliminate the impact of other high-voltage components on energy consumption.
The vehicle data were collected at intervals of 0.01 s to ensure high accuracy. The data were categorized into three types based on the driver’s pedal operation: single acceleration tests, single braking tests, and cyclic operation condition tests. The test results are shown in Table 1.

Table 1.
The type of driver operation data in the experiment.
In order to enhance the velocity and precision of training energy consumption models, it is of paramount importance to procure comprehensive test data. The tests must primarily regulate the model’s input parameters and encompass the potential range of values for these inputs. The acceleration levels are achieved by adjusting the accelerator pedal from 0 to 100%, with increments of 5% for positions below 40% and 10% for positions above 40%. This approach provides complete acceleration data while reducing the number of tests, as the acceleration gradient is smaller at larger pedal openings. Different SOC levels are achieved by setting the initial SOC value at the start of the test, with initial SOC values set at 30% and 80%, representing the charge-sustaining and charge-depleting phases, respectively. The control of vehicle speed is a natural consequence of acceleration tests, as the vehicle accelerates from a standstill to a certain speed, reaching maximum speed at larger pedal openings. Consequently, speed data can be obtained for the entire range from 0 to the maximum velocity.
Similarly, deceleration conditions are achieved by adjusting the brake pedal from 0 to 50%, with increments of 2% for positions below 15% and 5% for positions above 15%. This is due to the fact that the brake pedal is more sensitive at smaller openings. Furthermore, pedal positions above 50% correspond to emergency braking, which is rarely used in practice and has a negligible impact on energy consumption. During braking, the vehicle decelerates from a given speed to a standstill, and the corresponding speed data are naturally collected. Since the state of charge (SOC) has little effect on braking conditions, only data with an initial SOC of 30% are used. The cyclic operation condition test comprises a series of processes, including acceleration, driving at a constant speed, and deceleration. These are conducted in addition to the single acceleration and braking tests. The driver is required to follow a specified speed profile in order to complete the test.
In establishing a PHEV energy consumption prediction model, single acceleration, single braking, JC08, and HWY test data were used as training data, while NEDC test data were used as validation data. The JC08 operation condition supplements the training data with deceleration data points from low-speed frequent acceleration, while the HWY operation condition adds high-speed operation data points. This enriches the training dataset and prevents data distribution bias caused by incomplete training data. The data sampling interval used in the training process was 1 s.
Vehicle acceleration was not directly collected and had to be derived from the vehicle speed signal. The formula for differentiating the vehicle speed signals is as follows:
The vehicle speed V is expressed in units of distance per unit of time, with the sampling time point k expressed in units of time and the sampling step expressed in units of time. As an illustration, Figure 6 depicts the acceleration calculated directly by differentiation, using the NEDC driving cycle as a case study. Due to the high frequency of data collection, the acceleration signal obtained directly from the differentiation of the vehicle speed signal contained excessive noise, necessitating filtering. In this paper, Gaussian filtering was employed. The standard deviation of the Gaussian distribution was set to 70. Each calculation utilized 50 data points, and the results are presented in Figure 7. The filtered acceleration values correspond to the vehicle speed signal, thus satisfying the requirements of the energy consumption model for the acceleration signal.
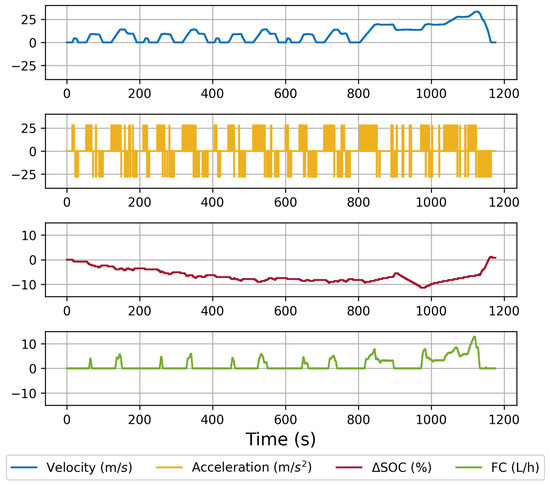
Figure 6.
Condition acceleration data of NEDC operation, unfiltered.
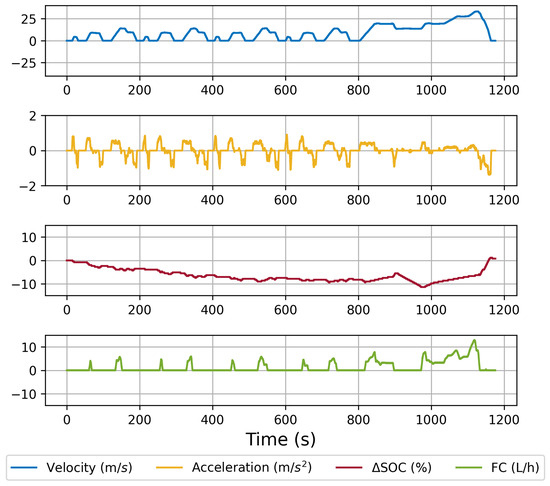
Figure 7.
Condition acceleration data of NEDC operation, filtered.
The experimental data were subjected to a further verification process, in which they were compared with the acceleration values under standard cyclic operation conditions. This comparison was conducted in order to ascertain the accuracy of the filtered acceleration data, as illustrated in Figure 8. The comparison revealed that the values were essentially consistent, although there were specific instances of acceleration fluctuations that were attributable to the fluctuation of the driver’s actual following speed.
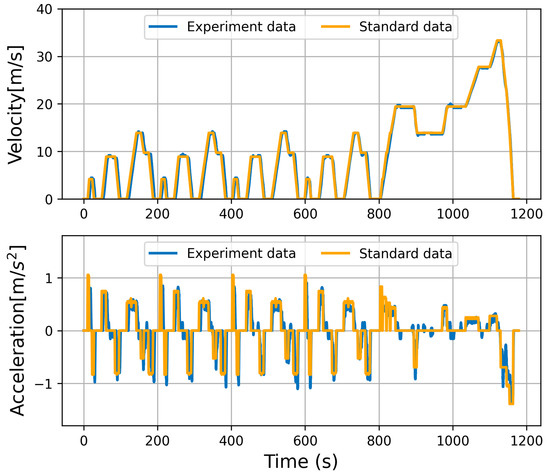
Figure 8.
Comparison between experimental data and standard cyclic operation condition data.
4.2. Performance Indicators
The training data were input into the neural network model in order to continuously optimize the parameters through training, thereby reducing the discrepancy between the predicted output and the actual output. The training effect can be represented by performance indicators such as mean absolute error (), mean absolute percentage error (), mean square error (), root mean square error (), and R Squared () between the two outputs. The parameter definitions are as follows:
where i represents each time step, n represents the total time step, represents the actual output value of the ith step, represents the predicted output value of the ith step, and represents the average of all actual output values.
Among the above indicators, the closer the MAE, MAPE, MSE, and RMSE are to 0, the smaller the error is, and the closer the is to 1, the smaller the error is.
4.3. Neural Network Hyperparameters
Once the architecture of the neural network model has been established, the hyperparameters of the model exert the greatest influence on the training effect [27,28,29]. The main hyperparameters of the neural network are shown in Table 2.

Table 2.
Neural network hyperparameters.
The parameters for the FNN/LSTM/GRU networks were relatively straightforward, allowing for the selection of an optimized value of 125 for the number of neurons in the FNN/LSTM/GRU layers. The CNN-BiLSTM-Attention network architecture had a considerable number of parameters, necessitating the optimization of the initial learning rate, the number of BiLSTM layer neurons, the number of self-attention layer key channels, and regularization parameters within a certain parameter range to achieve the optimal training effect. The parameter ranges were [0.001, 0.01], [10, 50], [2, 50], and [0.0001, 0.001], with initial values of 0.01, 25, 2, and 0.001, respectively. The optimized values calculated using optimization algorithms were 0.001, 17, 30, and 0.0001 for instantaneous fuel consumption and 0.0061, 41, 25, and 0.0008 for battery power, respectively. The results displayed for FNN/LSTM/GRU networks are based on the optimized parameters, while the CNN-BiLSTM-Attention network displays the prediction results for both the initial and optimized parameters.
4.4. Test Results
Figure 9a illustrates the observed battery power values (observed), the FNN training values (FNN), the LSTM training values (LSTM), the GRU training values (GRU), the initial CNN-BiLSTM-Attention training values (CBA), and the optimized CNN-BiLSTM-Attention training values (OCBA) of the tested vehicle under NEDC conditions. Figure 9b illustrates the corresponding test results of the engine’s instantaneous fuel consumption of the tested vehicle under the NEDC operation condition.
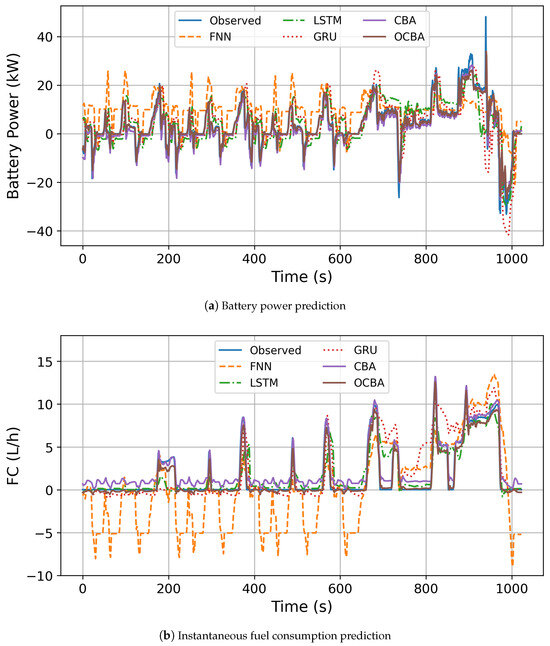
Figure 9.
Analysis of prediction results.
From the figure, it can be observed that FNN has the poorest prediction performance. In the initial 700 s, the battery power predicted by FNN was significantly higher than the measured values, with an overall increase of 10 kW. During periods when the measured power consumption was 0, FNN still showed battery power output. Furthermore, the prediction of instantaneous fuel consumption by FNN also deviated significantly from the measured values, often predicting negative values where there were none in the measured data.
The predicted values of LSTM and GRU generally followed the measured values when the battery power and engine’s instantaneous fuel consumption were low. In particular, when the battery power and engine’s instantaneous fuel consumption were both at zero, both predicted values were also zero. However, when the values of battery power and instantaneous fuel consumption of the engine were higher, GRU’s predictions deviated significantly, while LSTM’s predictions deviated slightly less.
The initial training values of CBA were significantly positive when the engine’s instantaneous fuel consumption was zero, while the rest closely followed the measured values. The training values optimized by OCBA demonstrated superior performance to the initial training values, exhibiting the ability to closely follow the curve even when the engine’s instantaneous fuel consumption was 0.
In order to compare the accuracy of the energy consumption of different models, the difference between the predicted and measured fuel consumption of the vehicle per 100 km is usually expressed as shown in Equation (11):
Here, is the model error as a percentage (%). is the predicted fuel consumption for each model in L/100 km. is the measured fuel consumption in L/100 km. The error for each model is as follows: FNN (84%), LSTM (15%), GRU (22%), CBA (30%), and OCBA (5%). The baseline model error is 10% [29], so only the OCBA-trained model meets the baseline and is better than the 8.7% error for PHEV reported in the literature [9].
The five performance indicator parameters mentioned above are listed in Table 3 in order to quantitatively compare the training effects of the five models. At the same time, for a more intuitive comparison, a radar chart comparing the training performance indicators of battery power and instantaneous fuel consumption models is presented in Figure 10.

Table 3.
Neural network hyperparameters.
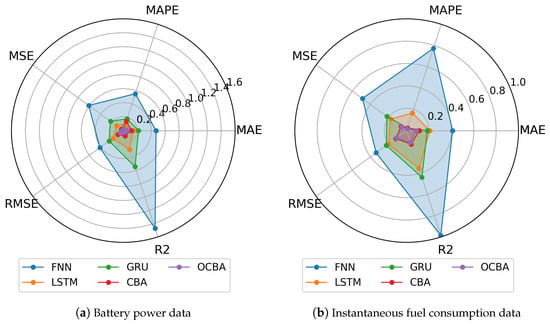
Figure 10.
Comparison of training results with radar charts.
Before Table 3 data were used to draw radar charts, it was necessary to normalize the performance indicator parameters and process MAE, MAPE, MSE, RMSE, and with Formula (12).
where represents the indicator parameters (MAE, MAPE, MSE, RMSE, and ) calculated after model training. The i-values of 1–5 represent the five training models, and represents the normalized indicators obtained.
Based on Formula (12), each indicator parameter can be processed as a number from 0 to 1, and the sum of each indicator parameter is 1. Since the fitting performance relationship between the size of and the model is the opposite of other indicators, Formula (13) was used to process for unification. At this point, the normalized values of all five indicator parameters were obtained, and the larger indicator reflected the poorer fitting ability of the model.
Figure 10a,b illustrates the performance indicators of the battery power and instantaneous fuel consumption prediction models, respectively. The five performance indicators for FNN in Figure 10a,b are significantly higher than those for other networks. Overall, LSTM exhibited slightly superior performance to GRU, particularly in predicting instantaneous fuel consumption. The performance of OCBA was superior to that of CBA, with a clear advantage in predicting instantaneous fuel consumption. A comparison of the predictive performance of the models reveals that the optimal choice is the OCBA model, followed by the CBA, LSTM, GRU, and finally, the FNN model.
The superior training efficacy of OCBA, CBA, LSTM, and GRU relative to FNN can be attributed to their structural capabilities for continuous hidden state transmission. This enables them to characterize the dependency between PHEV energy consumption output and data from previous time points, which FNN is unable to do. This dependency is primarily reflected in the time-dependence of battery SOC.
To analyze the differences between the different models in detail, the test data for each common mode of the PHEV are shown in Figure 11. The left part of each figure shows the input signals, while the right part shows the predicted energy consumption data. Figure 11, Figure 12, Figure 13, Figure 14 and Figure 15 exhibit similar phenomena, where the training effects of OCBA, CBA, LSTM, and GRU are superior to those of the FNN. The most representative data in Figure 12 are taken as an example for the analysis below.
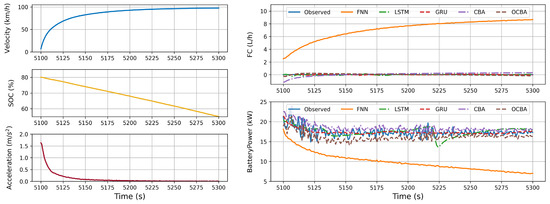
Figure 11.
EV mode: separate battery drive.
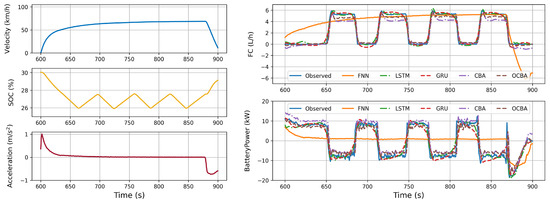
Figure 12.
HEV mode: periodic changes in SOC.
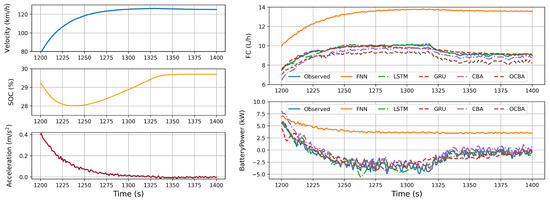
Figure 13.
HEV mode: battery charging.
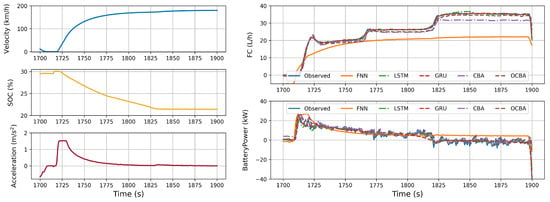
Figure 14.
HEV mode: battery discharging.
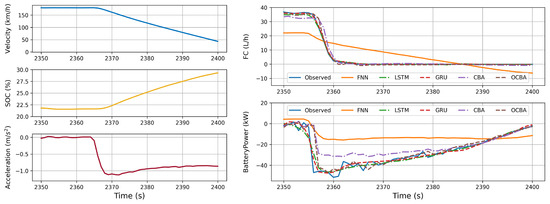
Figure 15.
Regenerative braking.
In Figure 12, the operating data at a constant speed of 60 km/h are shown. The left side of the figure shows that the vehicle quickly reaches a constant speed state after accelerating from a standstill. In this constant speed state, where the vehicle speed remains unchanged and acceleration is zero, only the SOC state variable changes. It can be observed that, at this point, the vehicle alternates between pure electric drive and engine drive. When the SOC decreases to a certain value, the engine starts and drives the vehicle while charging the battery, causing the SOC to increase. When the battery SOC increases to a certain value, the engine shuts down again, and pure electric drive causes the SOC to decrease.
When the vehicle maintains a constant speed, the battery undergoes a cyclical process of charging and discharging, with the engine fuel consumption following this cycle. In this situation, the vehicle’s energy consumption is not solely dependent on the current state of charge (SOC) but also on the stage of SOC change. For instance, when a horizontal line is drawn during the cyclic switching process in the graph, it can be observed that the input data (vehicle speed, acceleration, and SOC) of the points on the line are identical, yet the fuel consumption is sometimes zero and sometimes positive. This indicates that fuel consumption is related not only to the current input data but also to previous data.
The right side of the figure shows the predictions of battery power and instantaneous fuel consumption using three different networks. This indicates that FNN is unable to predict values that vary over time, whereas the other models are capable of following the cyclic changes in the measured data. This dependency underscores the necessity of using a network model with an LSTM-like architecture to predict PHEV energy consumption.
Figure 16 shows that the training effect of OCBA and CBA is superior to that of LSTM, GRU, and FNN. At this juncture, the vehicle is in the high-speed stage, and the vehicle mode has undergone multiple rapid switches between HEV modes: battery charging, EV mode, and HEV mode: battery discharging. Only the models trained with OCBA and CBA can accurately reflect the fluctuations in instantaneous engine fuel consumption and battery power. This phenomenon suggests that, under these conditions, only the attention network can effectively represent the correlation between model input parameters and energy consumption parameters.
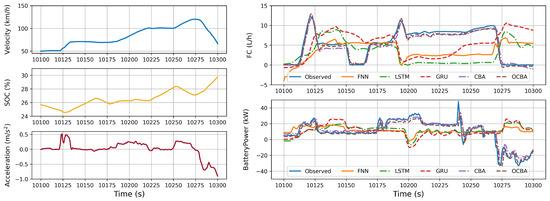
Figure 16.
Fast mode switching at high speeds.
5. Application of the Model
The trained PHEV energy consumption prediction model has a variety of applications. In the following section, the trained energy consumption model is used to predict the energy consumption of a PHEV at different vehicle speeds.
5.1. Energy Consumption Prediction Model Simulation Process
To predict PHEV energy consumption using the energy consumption prediction model, it is necessary to know the vehicle speed curve and the initial SOC value of the battery. Depending on the vehicle speed, the acceleration can be calculated by differentiation. Based on the current speed, acceleration, and SOC, the model can predict fuel consumption and battery power. Using the battery power and SOC at the current moment, the battery SOC at the next moment can be calculated. This allows the completion of the vehicle energy consumption prediction for the entire process. The energy consumption prediction process is shown in Figure 17.
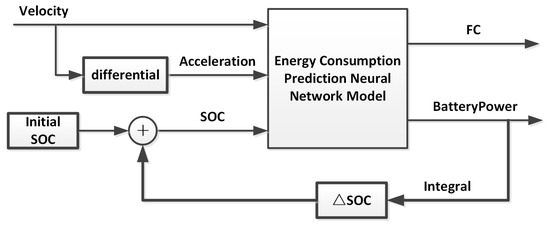
Figure 17.
Energy consumption prediction model simulation process.
5.2. Prediction of Energy Consumption under Unknown Conditions
It is evident that different countries will select varying standard cyclic operating conditions when testing vehicle energy consumption. Furthermore, there are instances where it is necessary to ascertain the energy consumption of the vehicle under specific non-standard conditions. The financial implications of conducting repeated tests are significant. Consequently, it is of paramount importance to utilize an energy consumption prediction model to predict the vehicle’s energy consumption under all operational conditions.
In the case of the PHEV discussed in this paper, the WLTC operating condition is not measured. The following is a simulation of the predicted energy consumption of the vehicle under WLTC, according to the simulation process described above. During the simulation process, the initial SOC of the vehicle is set to 80%, and the vehicle runs continuously until it enters the charge-sustaining phase. The simulation data are shown in Figure 18.
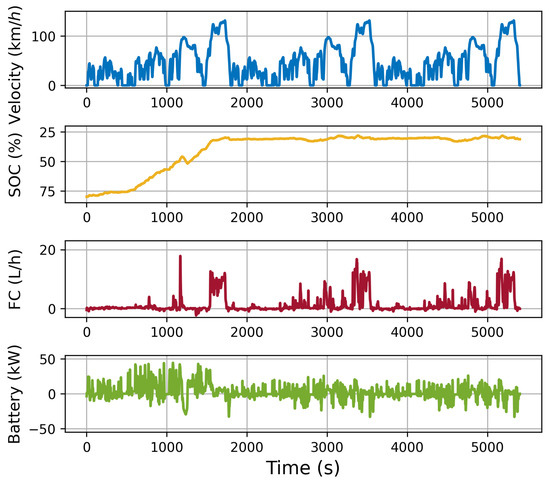
Figure 18.
WLTC energy consumption prediction.
The simulation indicates that, in the initial WLTC cycle, the vehicle is in the charge-depleting phase, primarily powered by the battery, with the engine only engaged during instances of high-speed acceleration. In the final two WLTC cycles, the vehicle transitions into the charge-sustaining phase, maintaining a SOC of approximately 30%. During this phase, the engine provides the majority of the energy, with the battery serving as a supplementary source. It can be observed that the engine fuel consumption significantly increases at low-speed stages while the battery discharge power significantly decreases.
From the simulation process, it can be observed that for unknown operating conditions, the vehicle energy consumption can be accurately predicted using this model. The model can set any SOC initial value and any speed curve. The simulation speed is fast and consumes fewer computing resources, making it very suitable for predicting the energy consumption of a large number of vehicles with random states in real traffic scenarios. Furthermore, it serves as a pivotal reference index for subsequent vehicle speed or trajectory planning.
6. Conclusions
In this paper, a deep neural network model for predicting PHEV energy consumption was established, capable of training four neural network architectures: FNN, LSTM, GRU, and CNN-BiLSTM-Attention. The model optimizes the parameters of CNN-BiLSTM-Attention using vehicle speed, vehicle acceleration, and SOC as inputs, and instantaneous engine fuel consumption and battery power as outputs.
The training results are as follows:
- (1)
- Comparison of model prediction performance: OCBA > CBA LSTM > GRU FNN. The models with both self-attention and LSTM network architectures performed the best, followed by models with only LSTM network architecture, and FNN performed the worst.
- (2)
- Training effectiveness: the effectiveness of the training was evaluated by comparing the performance of OCBA, CNN-BiLSTM-Attention, LSTM, and GRU against that of FNN. The results demonstrated that the aforementioned models exhibited significantly superior performance. This can be attributed to the fact that PHEV energy consumption is contingent upon battery SOC, which exhibits a time-dependent behavior. Consequently, a network model with an LSTM-like architecture is deemed optimal for predicting PHEV energy consumption.
- (3)
- Practical application: The model trained on deep neural networks is capable of accurately predicting the fuel and electricity consumption of vehicles with low-demand signals, rendering it applicable in the field of intelligent transportation.
Although the PHEV energy consumption prediction model can achieve a certain level of accuracy, there is still significant room for improvement. One avenue for further development is the exploration of the Transformer model architecture, which could enhance the accuracy and practicality of PHEV energy consumption prediction. Additionally, the current energy consumption prediction model does not consider the influence of vehicle steering and road slope in actual traffic environments. In order to achieve more accurate vehicle energy consumption simulations, data such as vehicle steering angle and slope can be collected using a gyroscope and incorporated into the model’s input signals.
Author Contributions
Conceptualization, X.Z. and Z.C.; methodology, X.Z. and Z.C.; software, X.Z.; validation, X.Z., W.W. and X.F.; formal analysis, X.Z. and X.F.; investigation, X.Z. and W.W.; resources, X.Z. and X.F.; data curation, X.Z. and X.F.; writing—original draft preparation, X.Z. and Z.C.; writing—review and editing, X.Z. and W.W.; visualization, X.Z. and W.W.; supervision, X.Z. and X.F.; project administration, X.Z. and X.F.; funding acquisition, X.Z. and X.F. All authors have read and agreed to the published version of the manuscript.
Funding
This work was supported by the Quzhou Science and Technology Key Research Projects: Research and development of intelligent calibration equipment for energy management strategy of new energy vehicles (Grant number: QZYHX2023034); Research on key technologies of intelligent calibration of energy management strategy for new energy vehicles (Grant number: ZD2022159); Research on intelligent detection methods for electromagnetic interference attacks in industrial IoT (2023K252).
Institutional Review Board Statement
Not applicable.
Informed Consent Statement
Not applicable.
Data Availability Statement
Data are available upon request from the authors.
Conflicts of Interest
The authors declare no conflicts of interest.
References
- Zhang, H.; Lei, N.; Liu, S.; Fan, Q.; Wang, Z. Data-driven predictive energy consumption minimization strategy for connected plug-in hybrid electric vehicles. Energy 2023, 283, 128514. [Google Scholar] [CrossRef]
- Yang, C.; Du, X.; Wang, W.; Yuan, L.; Yang, L. Variable optimization domain-based cooperative energy management strategy for connected plug-in hybrid electric vehicles. Energy 2024, 290, 130206. [Google Scholar] [CrossRef]
- Zhang, Y.; Wu, H.; Mi, S.; Zhao, W.; He, Z.; Qian, Y.; Lu, X. Comparative study of hybrid architectures integrated with dual-fuel intelligent charge compression ignition engine: A commercial powertrain solution towards carbon neutrality. Energy Convers. Manag. 2023, 292, 117423. [Google Scholar] [CrossRef]
- Vignesh, R.; Ashok, B. Intelligent energy management through neuro-fuzzy based adaptive ECMS approach for an optimal battery utilization in plugin parallel hybrid electric vehicle. Energy Convers. Manag. 2023, 280, 116792. [Google Scholar] [CrossRef]
- Pu, S.; Chu, L.; Hu, J.; Li, S.; Hou, Z. An Equivalent Consumption Minimization Strategy for a Parallel Plug-In Hybrid Electric Vehicle Based on an Environmental Perceiver. Sensors 2022, 22, 9621. [Google Scholar] [CrossRef] [PubMed]
- Li, B.; Zhuang, W.; Zhang, H.; Zhao, R.; Liu, H.; Qu, L.; Zhang, J.; Chen, B. A comparative study of energy-oriented driving strategy for connected electric vehicles on freeways with varying slopes. Energy 2024, 289, 129916. [Google Scholar] [CrossRef]
- Liang, Y.; Dong, H.; Li, D.; Song, Z. Adaptive eco-cruising control for connected electric vehicles considering a dynamic preceding vehicle. eTransportation 2024, 19, 100299. [Google Scholar] [CrossRef]
- Wu, F.; Adulyasak, Y.; Cordeau, J.F. Modeling and Solving the Traveling Salesman Problem with Speed Optimization for a Plug-In Hybrid Electric Vehicle. Transp. Sci. 2024, 58, 562–567. [Google Scholar] [CrossRef]
- Zacharof, N.; Doulgeris, S.; Zafeiriadis, A.; Dimaratos, A.; van Gijlswijk, R.; Díaz, S.; Samaras, Z. A simulation model of the real-world fuel and energy consumption of light-duty vehicles. Front. Future Transp. 2024, 5, 1334651. [Google Scholar] [CrossRef]
- Huang, J.; Song, G.; Wu, Y.; Zhai, Z.; Zhang, Z.; Zhang, L. A fuel consumption model for mixed traffic flow in multiple connected and autonomous scenarios. IET Intell. Transp. Syst. 2024, 18, 480–494. [Google Scholar] [CrossRef]
- Pang, Q.; Chen, S.; Ma, Y.; Qiao, F.; Zhang, Z.; Liu, H. Estimating of energy consumption of electric vehicles under different road characteristics: A case study for Nanjing, China. Int. J. Green Energy 2024, 1–16. [Google Scholar] [CrossRef]
- Chen, B.; Wang, M.; Hu, L.; He, G.; Yan, H.; Wen, X.; Du, R. Data-driven Koopman model predictive control for hybrid energy storage system of electric vehicles under vehicle-following scenarios. Appl. Energy 2024, 365, 123218. [Google Scholar] [CrossRef]
- Zhang, J.; Gao, Q.; Tian, J.; Cui, F.; Wang, T. Car-following model based on spatial expectation effect in connected vehicle environment: Modeling, stability analysis and identification. Phys. A Stat. Mech. Its Appl. 2024, 641, 129747. [Google Scholar] [CrossRef]
- Basso, F.; Feijoo, F.; Pezoa, R.; Varas, M.; Vidal, B. The impact of electromobility in public transport: An estimation of energy consumption using disaggregated data in Santiago, Chile. Energy 2024, 286, 129550. [Google Scholar] [CrossRef]
- Ramoliya, F.; Trivedi, C.; Darji, K.; Kakkar, R.; Gupta, R.; Tanwar, S.; Polkowski, Z.; Alqahtani, F.; Tolba, A. ML-based Energy Consumption and Distribution Framework Analysis for EVs and Charging Stations in Smart Grid Environment. IEEE Access 2024, 12, 23319–23337. [Google Scholar] [CrossRef]
- Doulgeris, S.; Zafeiriadis, A.; Athanasopoulos, N.; Tzivelou, N.; Michali, M.; Papagianni, S.; Samaras, Z. Evaluation of energy consumption and electric range of battery electric busses for application to public transportation. Transp. Eng. 2024, 15, 100223. [Google Scholar] [CrossRef]
- Dabčević, Z.; Škugor, B.; Cvok, I.; Deur, J. A Trip-Based Data-Driven Model for Predicting Battery Energy Consumption of Electric City Buses. Energies 2024, 17, 911. [Google Scholar] [CrossRef]
- James, S.S.; Anderson, S.R.; Da Lio, M. Longitudinal vehicle dynamics: A comparison of physical and data-driven models under large-scale real-world driving conditions. IEEE Access 2020, 8, 73714–73729. [Google Scholar] [CrossRef]
- Guo, Z.; Wu, W.; Yuan, S. Longitudinal-vertical dynamics of wheeled vehicle under off-road conditions. Veh. Syst. Dyn. 2022, 60, 470–490. [Google Scholar] [CrossRef]
- Da Lio, M.; Bortoluzzi, D.; Rosati Papini, G.P. Modelling longitudinal vehicle dynamics with neural networks. Veh. Syst. Dyn. 2020, 58, 1675–1693. [Google Scholar] [CrossRef]
- Vidal, C.; Kollmeyer, P.; Naguib, M.; Malysz, P.; Gross, O.; Emadi, A. Robust xev battery state-of-charge estimator design using a feedforward deep neural network. SAE Int. J. Adv. Curr. Pract. Mobil. 2020, 2, 2872–2880. [Google Scholar] [CrossRef]
- Huang, Y.; Zhu, L.; Sun, R.; Yi, J.; Liu, L.; Luan, T.H. Save or waste: Real data based energy-efficient driving. IEEE Access 2020, 8, 133936–133950. [Google Scholar] [CrossRef]
- Kim, N.; Song, J.; Lee, S.; Choe, J.; Han, K.; Park, S.; Kim, S.W. APOTS: A model for adversarial prediction of traffic speed. In Proceedings of the 2022 IEEE 38th International Conference on Data Engineering (ICDE), Virtual, 9–12 May 2022; IEEE: Piscataway, NJ, USA, 2022; pp. 3353–3359. [Google Scholar]
- Riaz, A.; Rahman, H.; Arshad, M.A.; Nabeel, M.; Yasin, A.; Al-Adhaileh, M.H.; Eldin, E.T.; Ghamry, N.A. Augmentation of Deep Learning Models for Multistep Traffic Speed Prediction. Appl. Sci. 2022, 12, 9723. [Google Scholar] [CrossRef]
- Li, F.; Sun, C.; Han, W.; Yan, T.; Li, G.; Zhao, Z.; Sun, Y. Medium-term load forecasting of power system based on BiLSTM and parallel feature extraction network. IET Gener. Transm. Distrib. 2024, 18, 190–201. [Google Scholar] [CrossRef]
- Fu, H.; Zhang, J.; Xie, S. A Novel Improved Variational Mode Decomposition-Temporal Convolutional Network-Gated Recurrent Unit with Multi-Head Attention Mechanism for Enhanced Photovoltaic Power Forecasting. Electronics 2024, 13, 1837. [Google Scholar] [CrossRef]
- Xu, H.; Hu, F.; Liang, X.; Zhao, G.; Abugunmi, M. A framework for electricity load forecasting based on attention mechanism time series depthwise separable convolutional neural network. Energy 2024, 299, 131258. [Google Scholar] [CrossRef]
- Ma, Z.; Sun, Y.; Ji, H.; Li, S.; Nie, S.; Yin, F. A CNN-BiLSTM-Attention approach for EHA degradation prediction based on time-series generative adversarial network. Mech. Syst. Signal Process. 2024, 215, 111443. [Google Scholar] [CrossRef]
- Mogno, C.; Arcidiacono, V.; Ciuffo, B.; Maineri, L.; Makridis, M.; Pavlovic, J.; Tsiakmakis, S.; Fontaras, G. Tools for Customized Consumer Information on Vehicle Energy Consumption and Costs-A European Case Study. Transp. Res. Procedia 2020, 48, 1493–1504. [Google Scholar] [CrossRef]
Disclaimer/Publisher’s Note: The statements, opinions and data contained in all publications are solely those of the individual author(s) and contributor(s) and not of MDPI and/or the editor(s). MDPI and/or the editor(s) disclaim responsibility for any injury to people or property resulting from any ideas, methods, instructions or products referred to in the content. |
© 2024 by the authors. Licensee MDPI, Basel, Switzerland. This article is an open access article distributed under the terms and conditions of the Creative Commons Attribution (CC BY) license (https://creativecommons.org/licenses/by/4.0/).