Abstract
Battery cells experience volume changes due to intercalation and ageing processes, which may pose a challenge when integrating cells into a battery module. This study presents an innovative, numerical model, which spatially resolved predicts the time-dependent, overall mechanical behaviour of battery modules caused by volume changes in built-in cells. An already self-developed battery module model, which statically describes the three-dimensional (3D), mechanical behaviour in a 0D simulation environment, is extended by the time dimension for dynamic modelling. The existing model abilities and features are maintained, such as the inclusion of multiple size scales from the cell to module level as well as the automatized model building process for the investigation of different module designs in regard to the number and arrangement of foam pads and multiple other design parameters. The validation of the predication abilities against those of complex, commercial software solutions, which use Finite Element Analysis (FEA) in a 3D model environment, have shown good agreement regarding sensitivity, robustness and numerical stability, revealing the impact and interdependencies of model parameters as well as the numerical limits of the model. In this study, the potential of the novel model regarding computational time and resources is underlined, making it a useful and effective tool for fast optimization studies.
Keywords:
battery module; pouch cell; lithium ion; simulation; dynamic; time-dependent; swelling; breathing; multi-scale; ageing; mechanical 1. Introduction
It has become generally known that lithium-ion battery cells show electrothermal in addition to mechanical behaviour. Here, reversible and irreversible volume change in cells can be distinguished between each other. On the one hand, intercalation and extraction processes while charging and discharging are expressed through a reversible increasing and decreasing of the cell thickness [,,,,]. Even small lithium-ion cells show that the volume expansion of their electrode sandwich can be as much as 1.5%, when charging with low current rates from 0% to 100% SOC (state of charge) []. On the other hand, lithium-ion cells experience an irreversible volume expansion over their cycle and calendar life due to internal degradation processes [,,,,]. Post-mortem analyses show that they include processes such as lithium plating or the growth of the solid electrolyte interphase (SEI) [,]. For example, in automotive applications like battery-driven electric vehicles, an increased number of large-size, high-energy lithium-ion cells are electrically connected and integrated into a mechanical housing structure []. This time-dependent, geometrical behaviour of the cells must be considered in the early development phase of the constructive design of a battery module. The most common measurement to consider this challenge is the application of foam pads between the cells of the module. The assessment of the mechanical design of a battery module by experimental testing is a long-lasting process, which consumes a lot of financial resources. A design development without any analytical simulation tool, which maps the spatially resolved, time-dependent force displacement of a battery module according to physical laws, is inefficient and demands multiple optimization loops, which multiplies the time and cost of the product development phase.
There have been publications in recent years which have investigated the topic of swelling modelling with different approaches on the cell as well as module level. Generally, the previously proposed models can be categorized on the basis of the included number of dimensions in 1D, 2D and 3D simulation models. On the cell level, the mechanical swelling model is either single-domain and standalone or part of a coupled, multiphysical model. As a standalone model, it has been shown that a simple phenomenological model can effectively predict global swelling forces over cycles for prismatic cells, using an experimentally calibrated, stress–strain-based constitutive model []. Modelling a cell two-dimensionally also enables the prediction of cell swelling and stress, spatially solved as a position within electrode layers. Therefore, a 2D mechanical model as part of a multiphysical cell model to predict the electrochemical–mechanical coupled behaviour for prismatic cells has also been developed []. The calculation of swelling is conducted as a function of position within the electrode layer and time []. For swelling prediction on the cell level, a homogenization scheme is applied and solved by finite element software and then validated against a detailed cell model also using the same software []. A similar modelling approach was used in a publication which investigated the ageing and swelling behaviour of cylindrical cells []. Using simplified 2D geometries in finite element software, a swelling simulation study was conducted to support the experimental ageing results []. In a different publication, it was also shown by a similar modelling technique, which couples the electrochemical and mechanical behaviour, that it is possible to model the influence of the cell casing on the swelling behaviour []. When modelling the cell swelling three-dimensionally, there are also two different approaches, standalone and coupled. Similar to the previously described 1D approach [], there is also a publication where the global swelling force of a prismatic cell due to internal degradation processes is measured in cycle life tests, and a model is derived by fitting a 3d model in finite element software to the measurement data, which describe the desired free swelling of the cell []. On the other side, there have been numerous publications which have focused on the 3D simulation of battery cell swelling as part of a multiphysical cell model, where different physical processes are coupled with their mechanical behaviour. A 3D mechanical model as part of a multiphysical cell model to predict the mechanical pouch cell behaviour of two interacting cells under overcharge conditions was developed by fluid–structure coupling simulation using finite element software []. Another model which couples the electrothermal and mechanical cell behaviour during cycling was also presented previously. The model fully couples the three physical domains in finite element software and three-dimensionally spatially resolves it in dependence of time []. In a different previously published paper, the methodology and results of a battery cell model were presented, which is not only multiphysical, coupling electrothermal–chemical–mechanical behaviour, but also multi-scale []. In this time-dependent model, even the porous microstructures based on the images of the surface morphologies of anode and cathode surfaces are included in finite element software []. Therefore, mechanical stress in particles is also simulated during cycling [].
On the battery module level, there have also been some publications examining the effects of cell breathing or swelling. These simulation models can also be divided according to the number of spatial dimensions included in 1D as well as 3D. Numerous studies have mainly focused on the 3D simulation of the swelling of battery modules. In the course of the experimental characterization of possible mechanical inhomogeneities within prismatic modules due to breathing and swelling, appropriate 3D simulations, considering cells and other built-in components, were conducted, using finite element software in order to study the effects on stress distribution and end plate deformation on the module level []. Similar approaches were also used in further simulation studies of battery module swelling [,], while in all 3D studies, the degree of details differs. On the one hand, simplified 3D geometries for module components are examined for rough estimations of module elongations []. On the other hand, a different model includes geometries closer to reality, in order to calculate exact mechanical stresses and their distributions on module housing components []. Studies presenting 1D model approaches for the swelling behaviour of battery modules show that their results can also agree well with more complex and time-consuming 3D simulations. These models resemble each other in the regard that they simplify the geometry of module components drastically to an equivalent spring stiffness one at a time [,,]. In the next step, the stiffnesses of all cells in the module are summed up to one cumulative, equivalent stiffness [,,]. If other components are considered, such as foam pads, the same procedure is conducted for them as well [,]. All equivalent component springs are connected in series afterwards. Applying a force equilibrium equation then allows for the calculation of the global resulting displacements and forces at the border region of the considered components, when a load is applied. In a previous publication, the global swelling force on the module end plate was calculated by applying a free swelling force on the equivalent spring for the cells at first, which acted on the equivalent spring for the pads, behind which an ideal stiff end plate was located []. In the next step, the force equilibrium was applied. A different publication introduced a model in dependence of state of charge and state of health (SOH) by applying the force equilibrium between the module frame and cell stack stiffness, in order to predict module deformation and average pressure for the cells inside []. Even though no publication gives specific details about calculation power and time, it can be assumed that 1D simulation models offer a potential advantage in regard to calculation time and resources, while on the other hand, they lack spatial and temporal resolution.
A substantial development in that regard was made in a previously published paper which introduced a novel method for the three-dimensional simulation of battery module swelling []. Within the framework of the study, a newly developed simplified 0D mathematical model was presented, which is able to predict the three-dimensional, mechanical battery module behaviour. In comparison to previous publications in the field of the simplified mathematical modelling of battery modules based on mass–spring systems [,,], the new model is able to predict global module deformations not one- but three-dimensionally. The biggest achievement of the model is the tremendous calculation time advantage in comparison to complex 3D simulations, which use commercial finite element software, without sacrificing much degree of detail by still modelling the module three-dimensionally. The main input for the model is a cell swelling model, which is implemented in the module model []. The module model then calculates the module force–displacement behaviour over its lifetime statically. A successful validation against experimental test data was also conducted.
In this study, the previously published static, mathematical model for the three-dimensional simulation of the force–displacement behaviour of battery modules is extended by the time dimension for application in dynamic modelling. Consequently, the newly developed model distinguishes itself from previous publications in the field of the simplified mathematical modelling of battery modules based on mass–spring systems [,,] not only by modelling the force–displacement behaviour three-dimensionally but also now is capable of dynamic modelling for time-dependent behaviour, which is a clear distinguishing factor in comparison to the previous publication, which only applied static modelling []. The key model features as well as the automatic model building process, which comfortably and quickly allows us to investigate different module designs, are kept for the novel model as well. The mathematical model as well as the fundamental technical mode of operation are described, at first; in the next step, its prediction abilities are validated against those of complex software solutions using Finite Element Analysis (FEA) by means of a systematic sensitivity and robustness study. In addition, the ability to predict the effects of design variations as well as the robustness and numerical stability of the model are investigated. After a presentation and discussion of the simulation and validation results, at the end, a conclusion is drawn, and an outlook is given.
2. Simulation Model
The newly developed dynamic model for the three-dimensional simulation of the mechanical battery module behaviour due to cell volume change is described in the first part of this chapter. Consequently, an overview of the complex battery module model is given, which is used for the validation of the simplified model. Since in this study the focus is placed on dynamic modelling, in addition to the applied geometrical and material parameters, the temporal and numerical parameters of the simulation need to be investigated and are therefore described as well.
2.1. Simplified Dynamic Modelling by Novel Mathematical Approach
As an alternative to an FEA model, another 3D mathematical model for the mechanical behaviour of battery modules is developed in the commercial software MATLAB/Simulink R2022b. This model is a further development of an existing static, mathematical model []. It is intended to map the overall mechanical force–displacement behaviour of battery modules due to cell volume change in a spatially and also time-resolved manner over their cycle and service life, considering their individual components, such as cells, foam pads and housing parts. By the inclusion of time, dynamic loads can be applied. The density and mass of components are also considered, so that dynamic effects, such as impact loads, can be mapped. On the other hand, damping effects are neglected in the novel model.
The automatized model building process by intelligent algorithms is maintained by adopting it into the Simulink simulation environment. By simply providing the algorithm with the data it needs via predefined constant blocks, such as geometrical and design information about the module as well as its components and their mechanical material behaviour, the algorithm processes the information to build up a mathematical equations system, which represents the time-dependent force–displacements of the defined module. In the same step, a geometrical discretization of the module and its components is conducted, similar to complex finite element software. In comparison, though, the number of elements, in which the module is geometrically discretized, is higher by several orders of magnitude in commercial software. The model and consequently the fundamental mathematical equations are based on physical laws and realized as a mass–spring system with time-dependent behaviour, which can be described in matrix notations as follows in Equation (1):
The global mass and stiffness matrices are represented by [M] and [K], while {U} and stand for the global displacement and acceleration vectors. The global force vector {F} is equated to the sum of the products, as described in Equation (2). In explicit notation, considering each vector and matrix entry, the equation can be described as follows:
The battery module is geometrically discretized by mass nodes and interconnecting springs with stiffnesses according to this modelling approach. All masses and spring stiffnesses can be written into a mass and stiffness matrix. The displacement and acceleration of each mass node as well the forces which act on them are accordingly represented by vectors. By setting up Equation (2), a mathematical equation system is formed for describing the mechanical behaviour of each node as a result of the acting forces. By determining the movement of each mass node, it is possible to describe the mechanical behaviour of the entire module. The equations generated by the algorithm are subsequently solved with the Newmark-beta method []. The numerical integration method is paramount for the model and follows a general procedure, consisting of a series of iteration steps to solve the following by Newman-defined relations []:
While h stands for the time interval and u for the displacements, the two parameters γ and β were introduced as part of the method. Basically, they allow the user to have influence on the numerical integration process by adjusting them. While the parameter γ affects the accuracy of the results, the parameter β has influence on the stability of the numerical integration procedure []. The parameter γ is fixed, since an artificial damping is introduced into the investigated system, if it differs from the value of 0.5 []. In contrast, the parameter β may vary and should lie between 0 and 0.25 []. The selection of the parameter β not only influences the acceleration during a time interval but also shows a general correspondence for some values []. Specifically, consistent variation in acceleration during a time interval can be determined for at least four β-values [], which are shown in Table 1.

Table 1.
Influence of numerical stability parameter β on acceleration during time interval [].
Analogous to complex FEA software Abaqus 2023 Hotfix 1, the nodes of the elements are shared by adjusting elements. To simulate multiple components of the battery module, such as cells, compression pads and housing and their interaction, additional air layers with very low stiffness and negligible thickness are modelled around each component. This helps to capture the individual deformations of the components similar to multi-body simulations.
The jelly stack inside the cell is modelled as a homogeneous body, on which the swelling forces are applied, leading to the deformation of the cell casing and subsequently other components, causing neighbouring elements to collide with each other. This is mainly due to the very low stiffness and thickness of air layers. For the calculation of the force, when two components come in contact, the following Equation (5) is used []:
Here, stands for the contact force, for the penalty factor, for the gap function and for normal direction vectors.
Furthermore, the model offers the possibility to restrict the displacement and rotation of user-defined nodes. Therefore, the fixation of the module at its corners by screws according to a specific mounting position inside a battery system or test jig is applicable. Also, the fixation of components by adhesive joints, such as between cell cans and the adjacent module frame, can be implemented and investigated.
Besides the previously mentioned input data, the algorithm needs information about the type of investigated battery module, since the simulation model is suitable for modules, which consists of pouch or prismatic cells, also considering a parameterizable metal case of the cells. When it comes to parametrizing the mechanical material behaviour of the other module components, there are different options. Simplified material behaviour can be entered, such as the Young’s Modulus (YM) for cell and its jelly stack and module housing components, as well as more complex force–deflection curves (FDCs) for foam pads. Due to the wide range of selection options in pre-processing, the developed model offers maximum flexibility for modelling battery modules of different geometries, arrangements, materials, cells and other properties. A geometric visualization of the configured battery module is also available for checking the input data. Due to the model’s dynamic nature and in order to calculate the time-dependent displacements and velocities, it is required to specify a time step size and a total simulation time. Figure 1 gives an overview of the relations of the processes of the newly developed dynamic simulation model. As already mentioned, a necessary data and information set about the module and its components is needed as an input for the algorithm to build up the model. This information is only needed once at the beginning of the simulation. On the other hand, since the simulation is time-dependent, for the mechanical state of each cell, information about its respective jelly stack needs to be provided for each time step, because after model build-up, the simulation starts running and processing the information. The momentary, spatially resolved Young’s Modulus and dimensions of each cell jelly stack can be provided by submodels, which are connected to the module simulation model.
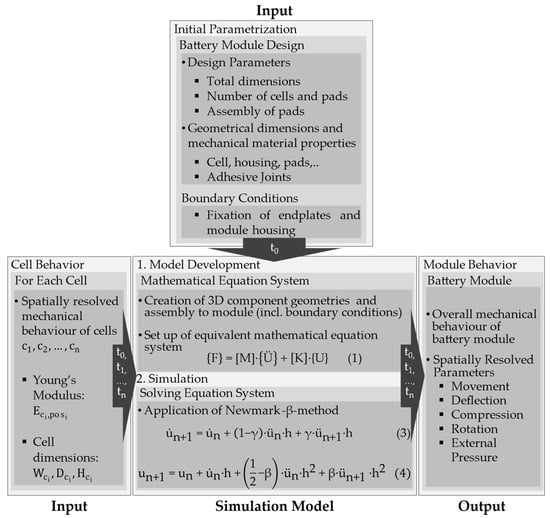
Figure 1.
An overview of the processes for the novel dynamic simulation model (updated).
After defining the model parameters and input data, all components of the battery module are created as 3D volume elements with linear interpolation so that the complex model can be simplified, using a mathematical system of equations. The simulation model then solves the equation system applying the Newmark-beta method, in order to map the swelling behaviour of an entire battery module. Once the equation system is solved, the results of each time step are outputted, which includes spatially resolved displacements, movements, compressions, deflections and much more information about the current state of the module at each time step. Finally, the visualization of the deformed module geometry with the display of displacements is implemented for a meaningful interpretation of the simulation results.
2.2. Complex Dynamic Modelling by Commercial FEA Software
In order to validate the previously described simplified model, a complex model of a battery module is created by the use of the commercial software Abaqus FEA. A direct comparison of the results allows for not only a qualitative but also quantitative assessment of the newly developed simplified model. The steps for the model build-up follow the common state of the art, which were already used in a previous publication regarding the static model for mechanical battery module behaviour []. Mainly, the steps consist of modelling the geometries of each component at first, before their material behaviour is parametrized. All components, such as cells, jelly stacks, pads, module frame and end plates are assembled together, afterwards. The meshing as part of the geometrical discretization is conducted in the next step. Here, it must be noted that the number of elements used is significantly higher in contrast to the previously described mathematical model. After contact definitions, boundary conditions and loads are set, the simulation time and time step size have to be defined. In order to have comparability between the models, it is important to set up the same total simulation time in order to see if dynamic effects are mapped accordingly. A dynamic, explicit solver is configured in the complex model, in order to simulate with high accuracy by the application of small time step sizes. Finally, after all the parametrization is finished, the simulation is started. The investigated battery module is also identical to the one from the previous paper []. The investigated module consists of 24 pouch cells with multiple foam pads, which are all integrated into a single-part mechanical housing. End plates are welded onto the open ends of the housing. By setting limiting boundary conditions, the module is mounted at its corners. In the following Figure 2, a schematic representation of the 3D model in the Abaqus FEA software environment is shown. Additionally, a section cut is placed, and a cross-sectional view of the module is pictured. Meanwhile, Figure 3 shows the model after the meshing process is finished, and the high number of elements can be reviewed.
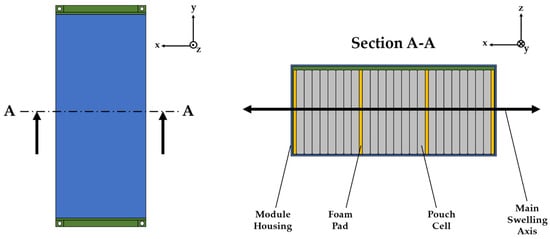
Figure 2.
The view of the investigated battery module in the complex 3D simulation environment as the top (left) and sectional (right) view [,]. Redrawn with permission from Bozalp et al., Proceedings of the 11th International Conference on Simulation and Modeling Methodologies, Technologies and Applications SIMULTECH; published by SIMULTECH, 2021. Redrawn with permission from Bozalp et al., Proceedings of the International Conference and Exhibition SIA Paris 2021 Powertrain & Power Electronics; published by SIA, 2021.
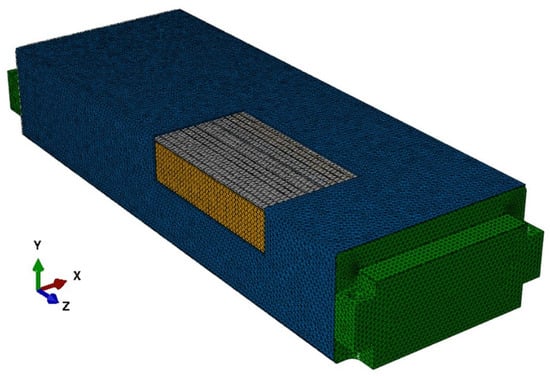
Figure 3.
The view of the investigated battery module in the complex 3D simulation environment after the meshing process with the cut-off module frame [,]. Redrawn with permission from Bozalp et al., Proceedings of the 11th International Conference on Simulation and Modeling Methodologies, Technologies and Applications SIMULTECH; published by SIMULTECH, 2021. Redrawn with permission from Bozalp et al., Proceedings of the International Conference and Exhibition SIA Paris 2021 Powertrain & Power Electronics; published by SIA, 2021.
3. Model Validation by Study of Sensitivity, Robustness and Numerical Stability
A modified local sensitivity study is conducted not only to validate the simplified model regarding its prediction ability for the dynamic swelling behaviour of the investigated battery module but also to prove its robustness. For this reason, a systematic simulation study will be conducted in this section. The effect of the stiffness of different battery module components on the overall module force–displacement behaviour is studied. Therefore, the focus is placed on the module components along the main axis of cell swelling, which have the highest impact on module deformation (Figure 2). These include the stiffnesses of the jelly stack of the cells, the module housing, which consists of multiple components, such as the top, bottom and end plate, and foam pads. In Figure 4, a schematic overview of the local sensitivity study is pictured.
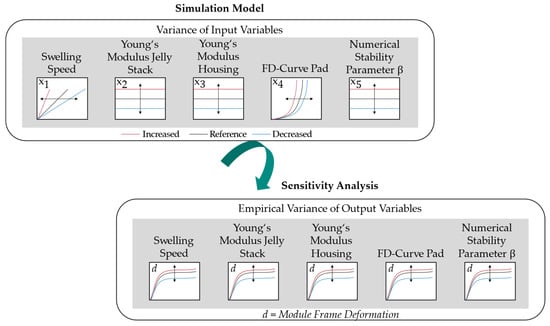
Figure 4.
An overview of the local sensitivity study. Based on [].
Another input parameter, which is of the same importance as the other just described mechanical design parameters, is the configured simulation time. Provided that all the parameters of the models are the same, especially the applied time-dependent, linear swelling strain on the cell jelly stacks and their mass, the simulation time defines the resulting dynamic effects of the system and therefore the end results. The numerical stability of the model is also examined in this chapter. For this reason, the impact of the previously described numerical stability parameter β on the overall module results is investigated by taking on the values of Table 1 one at a time while investigating the other input variables. Since preliminary investigations have revealed that the simplified model does not converge for the border limit operation value of , the focus of this investigation is placed on to .
In view of the above, the model of the investigated pouch battery module is set up with the simplified mathematical model in Simulink as well as with the commercial software Abaqus FEA. In the first step, this is conducted by using the reference geometrical and material properties for each component and the overall module. It is also ensured that both the simplified mathematical and complex model have the same input parameters regarding the total simulation time as well as the temporal evolvement of the cell jelly stack swelling ratio. After model development is completed, one investigated input parameter is systematically changed by a specifically defined value around the reference centre value for each simulation case. An overview of the applied Design of Experiments (DoE) is shown in Table 2. While 0 stands for the reference value of an input parameter, −1 and +1 represent the expression of a characteristic. The investigated input parameter is changed by a fixed value. While +1 means that a fixed value is added to the reference value, −1 stands for the opposite. During the analysis of the mechanical material input parameters, additionally for each test also, the numerical stability parameter β is changed, in order to investigate its effect on the results.

Table 2.
Design of Experiments (DoE) for model validation study. Increase of reference value by fixed value (+1) represented in green and decrease (−1) in orange. Numeric stability parameter is investigated in each test case by use of (light blue), (light green) or (light yellow).
The aim of the first three simulations is to map the ability of the simplified model for dynamic behaviour over time. Secondly and equally important, the first simulations are needed to determine the optimal total simulation time and time step size for the simplified model. In general, the trade-off between the time step size and the accuracy as well as stability of a numerical simulation is well known. While a small time step size provides high accuracy and stability, it extends the computing time. Therefore, a small time step size and total simulation need to be chosen for the simulations in this study. But due to varying model properties and settings, such as the number of elements or simplified physical equations, as well as a different solver type and method, it is necessary for the numerical stability of the simplified model to apply a time step size different to the complex FEA, while the total simulation is set as identical. For the following Tests 4–27, the same determined total simulation time and time step size are applied for each model itself.
The results of the simulations will be evaluated at defined points on the battery module housing. Specifically, the deformations of the defined characteristics points are examined to assess the quality of the spatially resolved prediction of the mechanical battery module behaviour. In Figure 5, it is schematically shown which points on the battery module housing are investigated.
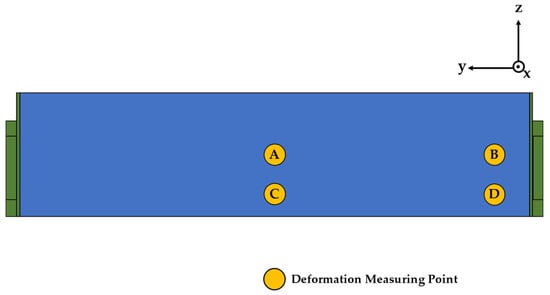
Figure 5.
Illustration of deformation measuring points on battery module housing [,]. Redrawn with permission from Bozalp et al., Proceedings of the 11th International Conference on Simulation and Modeling Methodologies, Technologies and Applications SIMULTECH; published by SIMULTECH, 2021. Redrawn with permission from Bozalp et al., Proceedings of the International Conference and Exhibition SIA Paris 2021 Powertrain & Power Electronics; published by SIA, 2021.
4. Results of Model Validation
In this chapter, the results of the previously described systematic sensitivity, robustness and numerical stability analysis of the simplified model are presented. The impact of each investigated parameter is presented in a separate subchapter one at a time.
4.1. Variation in Swelling Speed
In this subchapter, the simplified model is examined regarding its ability to map the dynamic evolvement of the mechanical force–displacement behaviour of the investigated battery module spatially resolved over time during cell jelly stack swelling. In the first step, the examined components of the module, represented as the input parameters to , are simulated with a fixed set of mechanical properties and stiffnesses in Test 1. This set up also represents the reference module design and test. The results of the simplified model in Test 1 are shown in Figure 6.
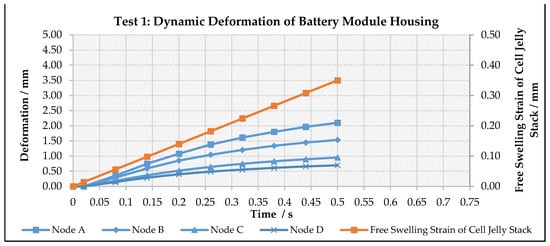
Figure 6.
Temporal and spatial evolvement of battery module housing deformation in response to cell jelly stack swelling (Test 1).
The swelling speed as input parameter is varied in Tests 2 and 3 as the only model parameter. The results of these simulations are shown in Figure 7. For each assessed node, there is a diagram, which shows a comparison of the results of the simplified and the complex model with changing simulation time.
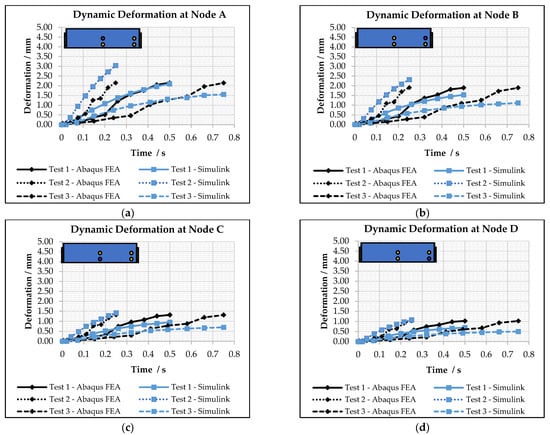
Figure 7.
Comparison of time-dependent deformations of battery module housing at different nodes in dependence of swelling speed of cell jelly stacks (Test 1–3). Considered deformation point on the module housing is highlighted in purple: (a) node A (b) node B (c) node C (d) node D.
The results show that the simulation time of 0.5 s shows the best agreement between Simulink and Abaqus FEA regarding the total predicted displacements, when the cells reach their total swelling strain. Therefore, for the following sensitive analyses, this simulation time and time step size are used.
4.2. Variation in Young’s Modulus of Cell Jelly Stack
In Tests 10 to 15, the impact of the cell jelly stack stiffness on the overall mechanical behaviour of the module during cell jelly stack swelling is presented. The Young’s Modulus of the jelly stack of the cells is reduced and then increased by a fixed value around the reference centre value (13 MPa). Figure 8 shows a comparison of the deformation results at the end of the simulation time of 0.5 s for the different nodes on the battery module housing. In each diagram, it is also demonstrated how the numerical stability parameter β effects the prediction of the simplified model.
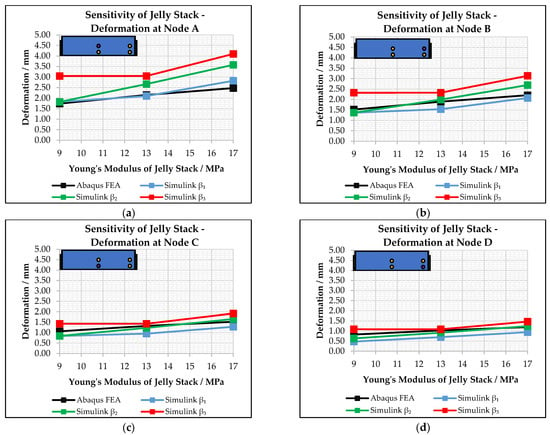
Figure 8.
Comparison of time-dependent deformations of battery module housing at different nodes in dependence of Young’s Modulus of cell jelly stacks and β-parameter. Considered deformation point on the module housing is highlighted in purple: (a) node A (b) node B (c) node C (d) node D.
4.3. Variation in Young’s Modulus of Battery Module Housing Components
In the next step, it is shown how the stiffness of the battery module housing, expressed by its Young’s Modulus, influences its deformation due to the built-in, swollen cells (Tests 16 to 21). The Young’s Modulus of the module housing is reduced and then increased by a fixed value around the reference centre value (69 MPa). Also, in this case, the simulations are conducted with the simplified model first and then validated against the complex model, using finite element software Abaqus FEA. The impact of the numerical stability parameter β in the simplified model is again included. These results are shown in the following Figure 9.
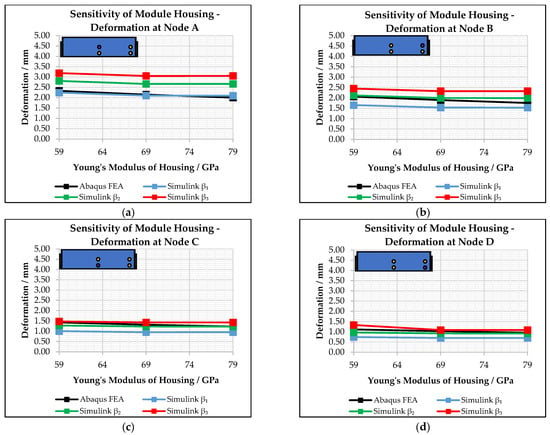
Figure 9.
Comparison of time-dependent deformation of battery module housing at different nodes in dependence of Young’s Modulus of battery module housing and β-parameter. Considered deformation point on the module housing is highlighted in purple: (a) node A (b) node B (c) node C (d) node D.
4.4. Variation in Force–Deflection Curve of Foam Pad
At last, the sensitivity study focuses on the impact of the foam pad, which has the main function of offering space for cell swelling, while its increase in reaction forces is moderate. Therefore, the force–displacement curve of the applied pad is influential for the mechanical behaviour of the module. For the last Tests 22 to 27, the force–displacement curve of the pad of the reference module from Test 1 is adopted. While in Tests 22–24 a curve for a softer pad is used (Pad Stiffness 1), the pad of Tests 25–27 has a steeper increase in reaction force (Pad Stiffness 3). These results are graphically summarized in Figure 10. When changing the β-parameter for the soft pad from its reference value, the simulation becomes instable, and the calculation is aborted in the simplified model.
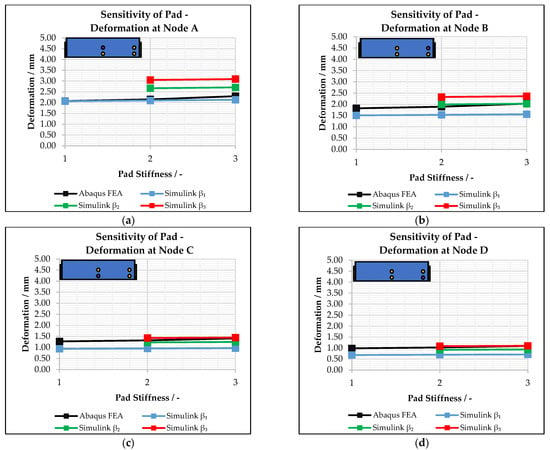
Figure 10.
Comparison of time-dependent deformation of battery module housing at different nodes in dependence of pad force–deflection curve and β-parameter. Considered deformation point on the module housing is highlighted in purple: (a) node A (b) node B (c) node C (d) node D.
5. Discussion
In this chapter, the previously shown results of the sensitive analyses are interpreted and discussed. For this reason, the outcomes of each investigated input parameter are analyzed one at a time and in the same order as previously presented, starting from Test 1 as the reference module. Subsequently, putting the partial analyses of all tests together, an overall assessment of the novel model is conducted.
In the first step of Test 1, the reference setting of the module design was configured, and its swelling behaviour was simulated. The results, presented in Figure 6, clearly show that the novel model not only has the ability of resolving the overall module spatially but also temporally. While in the first time steps until 0.02 s each cell jelly stack swells by 0.014 mm, the module housing does not show any deformation, which is mainly due to the foam pads, which absorb the forces during that time and doing so, largely restrain them from being passed on to the module frame. Afterwards, the forces act on the inside of the module housing, and a deformation is effective on the module outside. The deformations are distributed inhomogeneously over the housing area in the main swelling direction, while the biggest deformation can be observed in the centre region (Node A). This proportionally large area has a lower structural stiffness compared to the edge and corner regions (Node B and D) and therefore gives in more easily, even though the material stiffness is parametrized the same for the whole housing components. When comparing the results of the simplified model from Simulink with different simulation times and therefore different swelling speeds of the cell jelly stacks, the slope of the module housing deformations also develops accordingly to the speed (Figure 7). A comparison of the results of Test 1 with those of the complex model reveals that they match well after firstly overpredicting them. On the other hand, when comparing the results of Tests 2 and 3, where the simulation time is reduced and elongated, the simplified model firstly also overpredicts the deformations (Figure 7). While in Test 2, the overpredicted deformations keep increasing, in Test 3, at first, they level but end up underestimating the deformations towards the end of the simulation time. Consequently, the complex model predicts, independent of the swelling speed, the same total module housing deformations, while in the simplified model, the deformations increase with higher swelling speeds. One possible explanation for this behaviour in the simplified model is the non-consideration of damping effects in its main underlying Equation (2). For example, vibrations or structural responses in the model are not damped and therefore can build up over the simulation time, leading to higher total deformations. On the other hand, accuracy differences between the model results in general are due to the different time step sizes used in each model. Specifically, the time step size in the simplified model is greater than the one used in Abaqus FEA by a factor of nearly 800, allowing for much shorter total computation times (Figure 11). Since there is a general correspondence between time step size as well as number and model prediction accuracy, this in turn implies that deviations in the results are to be expected. Furthermore, the novel model has more simplifications to it, such as a significantly lower number of volume elements, which would also explain deviations and lower accuracy. In total, the number of elements used in the complex model is higher by a factor of nearly 2300 (Figure 11). Not only does the number of elements differ but also their shape. While the complex model uses different kind of element shapes, depending on the component and its geometric complexity, in order to simulate with best possible accuracy, the simplified model only uses one particular shape for the reasons of simplification and speed in the model build-up phase. Due to the listed model parameters, which are known for having a strong influence on the results, further analyses are recommended to fully clarify their effects on the results of the simplified model.
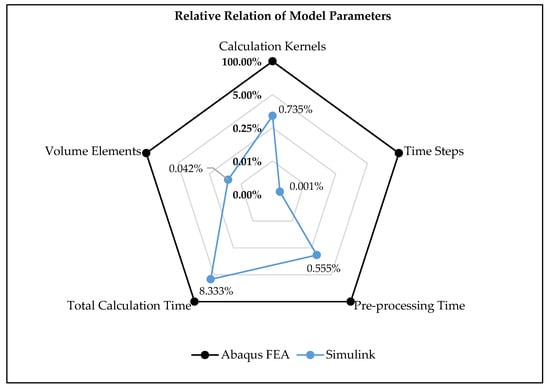
Figure 11.
Relative relations between simplified and complex model parameters on average.
After the simulation time of 0.5 s was identified as the one with the best matching of the results, the following sensitive analyses were conducted, applying the determined simulation time. In general, the sensitive analyses show that the novel model is robust and able to predict the effect of design changes on the mechanical stiffnesses of the investigated components, when the cells reach their maximum swelling state at the end of the simulation time. As seen in Figure 8, Figure 9 and Figure 10, the model maps the slope and direction of the deformation gradient correctly, when changing the stiffnessor force–displacement curve of an investigated design input parameter. Considering the reference β-parameter, it is noticeable that the highest match of the model results is provided for Node A, while the other nodes follow the general trend well, when changing the stiffness of a parameter but keeping an off-set. The previously described model parameter differences, such as element number, size and shape, have a major influence on the displacement of nodes, possibly explaining this behaviour. Another factor which needs to be considered when it comes to the accuracy of the novel model is the numerical stability factor β. The acceleration during the time intervals, expressed by the parameter, impacts the calculated displacement of the model nodes and consequently the accuracy of the predictions, which is most likely also due to the non-consideration of damping effects. In Figure 8, Figure 9 and Figure 10, it is shown that a change in the parameter influences the simplified model results in comparison to the ones of the complex model. Especially, nodes B, C and D can reach a much better accuracy by adopting the parameter β. In the considered range for the input parameters, all the simulated test cases finished without any instability in the numeric procedure except for the investigated ones of the soft pad. Here, a variation in the β-parameter from its reference value leads to instabilities in the numerical solving procedure, ending with a numerical abortion. This is another good example for the influence and effectiveness of the parameter to actively control the numerical stability of a simulation.
6. Conclusions
Within the framework of this study, an existing simplified mathematical model, which statically describes the overall three-dimensional, mechanical behaviour of battery modules under cell swelling conditions, was successfully further developed by adding the time dimension to it. By the expansion of the fundamental physical equations that are underlying the model, the module behaviour is not only spatially but also temporally resolved, enabling it to map time-dependent, dynamic effects. In the field of the simplified mathematical modelling of battery modules based on mass–spring systems, the novel model shows significant progress that has been made by creating a model which distinguishes itself from previous publications by mapping the three-dimensional force–displacement behaviour and at the same time enables dynamic modelling for time-dependent behaviour, which is also a clear step forward in comparison to the previous publication applying static modelling []. Furthermore, the included algorithm, which automatically builds up a mathematical equation system representing the investigated module by simply provided module parameters, such as the number of cells and pads and their arrangement, was also further developed. In doing so, the maximum flexibility for modelling battery modules of different designs is offered. New features added to it include the spatial fixation of individual or a group of nodes, in order to consider design properties, such as adhesive joints between components or the mounting conditions of the module in a battery system as well. Besides the geometrical configuration of all the module components, such as cells, jelly stacks, pads and module housing parts, their mechanical material behaviour is also parametrized by adding information, such as Young’s Modulus or even force–deflection curves.
The ability of the model to predict the overall time-dependent mechanical behaviour of battery modules was investigated for an exemplary battery module design. For validation purposes, a module, consisting of 24 pouch cells and multiple foam pads, was modelled with the novel mathematical model as well as in complex finite element software Abaqus FEA. In the process of conducting the first small study regarding the optimal simulation time and time step size, the simplified model’s ability to spatially and temporally resolve the force–displacement behaviour with the biggest deformations to be observed in the centre region (Node A) was revealed. In doing so, the novel proved its ability to map structural inhomogeneous stiffness distributions, e.g., of the module frame. A subsequent local sensitivity study demonstrated that the novel model is also able to predict the global force–displacement behaviour well, mapping the slope and direction of the deformation gradient accurately, when changing the stiffness or force–displacement curve of the investigated design input parameter. In this process, this study affirms that numerical stability parameter β needs to be chosen carefully in order to predict the spatially resolved deformations of the module. Due to the fact that the novel model simplifies and reduces not only the geometrical but also temporal discretization, it reveals its potential regarding the total computation time and capacity needed. Even though in comparison to the complex model, the novel model does not even need 1% of the number of calculation kernels and 10% of the total calculation time on average, the examined deformation results show a good agreement between the two models, which can make it a useful and effective tool in the early development phase for fast optimization studies.
To the best knowledge of the authors, it is the first time that a simulation model allows for the mapping of time-dependent mechanical battery module behaviour three-dimensionally under cell swelling conditions, which is based on a simplified mathematical approach in a 0D simulation environment. Even though the novel model in its current state shows good results and has brought significant improvements to the mathematical simulation of mechanical battery module behaviour, there is still optimization potential left to increase the accuracy and structural model behaviour. Especially the impact and interdependencies of model parameters as well as the demonstrated numerical limits of the model need further investigations.
7. Outlook
In view of the above, multiple model parameters need further examination regarding their impact and interdependencies. For example, the effect of the non-consideration of damping processes in the main underlying equation needs to be investigated in following studies, possibly explaining if undamped vibrations and structural responses in the model build up over simulation time lead to higher total deformations. Another aspect which needs further examination is the potential increase in accuracy by raising the number of time steps and volume elements used in the simplified model.
Moreover, the numerical boundaries and instabilities of the model need to be explored more extensively. In the current state, there are already exemplary model limits demonstrated, such as during the sensitivity analysis of the soft pad. In this context, the influence of the numerical stability parameter β on the numerical procedure as well as on the overall results is another research aspect for further studies of the model. The effect of the time step size on the prediction accuracy of the novel model as well as on its numerical stability also needs further examination and is highly recommended for future work.
The results, opinions and conclusions expressed in this publication are not necessarily those of Volkswagen Aktiengesellschaft.
Author Contributions
Conceptualization, T.B. and H.O.; methodology, T.B. and S.S.K.; validation, T.B.; formal analysis, T.B. and S.S.K.; investigation, T.B.; resources, T.B. and H.O.; writing—original draft preparation, T.B. and S.S.K.; writing—review and editing, T.B. and S.S.K.; visualization, T.B.; supervision, T.V. and H.O. All authors have read and agreed to the published version of the manuscript.
Funding
The support of the German Research Foundation (DFG) and the Open Access Publication Fund of Technische Universität Braunschweig is acknowledged by the authors.
Data Availability Statement
For confidentiality reasons, there will be no further data or information provided. This also applies to the developed models and its codes.
Conflicts of Interest
The authors declare no conflicts of interest.
References
- Jiang, W.; Li, H.; Wang, S.; Wang, S.; Wang, W. Dynamic Volumography of Cylindrical Li-Ion Battery Cells by Watching Its Breath During Cycling. CCS Chem. 2023, 5, 1308–1317. [Google Scholar] [CrossRef]
- Lee, J.H.; Lee, H.M.; Ahn, S. Battery dimensional changes occurring during charge/discharge cycles—Thin rectangular lithium ion and polymer cells. J. Power Sources 2003, 119–121, 833–837. [Google Scholar] [CrossRef]
- Yuan, C.; Hahn, Y.; Lu, W.; Oancea, V.; Xu, J. Quantification of electrochemical-mechanical coupling in lithium-ion batteries. Cell Rep. Phys. Sci. 2022, 3, 101158. [Google Scholar] [CrossRef]
- Oh, K.; Siegel, J.B.; Secondo, L.; Kim, S.U.; Samad, N.A.; Qin, J.; Anderson, D.; Garikipati, K.; Knobloch, A.; Epureanu, B.I.; et al. Rate dependence of swelling in lithium-ion cells. J. Power Sources 2014, 267, 197–202. [Google Scholar] [CrossRef]
- Mohtat, P.; Lee, S.; Siegel, J.B.; Stefanopoulou, A.G. Reversible and Irreversible Expansion of Lithium-Ion Batteries Under a Wide Range of Stress Factors. J. Electrochem. Soc. 2021, 168, 100520. [Google Scholar] [CrossRef]
- Willenberg, L.K.; Dechent, P.; Fuchs, G.; Sauer, D.U.; Figgemeier, E. High-Precision Monitoring of Volume Change of Commercial Lithium-Ion Batteries by Using Strain Gauges. Sustainability 2020, 12, 557. [Google Scholar] [CrossRef]
- Louli, A.; Ellis, L.; Dahn, J. Operando Pressure Measurements Reveal Solid Electrolyte Interphase Growth to Rank Li-Ion Cell Performance. Joule 2019, 3, 745–761. [Google Scholar] [CrossRef]
- Cannarella, J.; Arnold, C.B. Stress evolution and capacity fade in constrained lithium-ion pouch cells. J. Power Sources 2014, 245, 745–751. [Google Scholar] [CrossRef]
- Simunovic, Z.; Dressler, R.; Alter, E.D.; Trussler, S.; Harlow, J.; Johnson, M.; McMonigle, C.; Fisher, M.; Metzger, M. Laser Scanning Method for High-Resolution Thickness Mapping of Lithium-Ion Pouch Cells. J. Electrochem. Soc. 2023, 170, 120532. [Google Scholar] [CrossRef]
- Dörnhöfer, A. Konzept zur Betriebsfestigkeitsanalyse von Hochvoltspeichern. In Betriebsfestigkeitsanalyse Elektrifizierter Fahrzeuge, 1st ed.; Springer: Berlin/Heidelberg, Germany, 2019; pp. 39–68. [Google Scholar]
- Govindaraj, A.L. Phenomenological Swelling Model of Battery Module. Master’s Thesis, KTH Royal Institute of Technology, Stockholm, Sweden, 2022. [Google Scholar]
- Gupta, P.; Gudmundson, P. A multi-scale model for simulation of electrochemically induced stresses on scales of active particles, electrode layers, and battery level in lithium-ion batteries. J. Power Sources 2021, 511, 230465. [Google Scholar] [CrossRef]
- Blazek, P.; Westenberger, P.; Erker, S.; Brinek, A.; Zikmund, T.; Rettenwander, D.; Wagner, N.P.; Keckes, J.; Kaiser, J.; Kazda, T.; et al. Axially and radially inhomogeneous swelling in commercial 18650 Li-ion battery cells. J. Energy Storage 2022, 52, 104563. [Google Scholar] [CrossRef]
- Chen, Y.; Yang, L.; Guo, F.; Liu, D.; Wang, H.; Lu, J.; Zheng, J.; Yu, X.; Li, H. Mechanical-electrochemical modeling of silicon-graphite composite anode for lithium-ion batteries. J. Power Sources 2022, 527, 231178. [Google Scholar] [CrossRef]
- Knutsson, A.; Trombati, J. Finite Element Modelling of Cell Swelling for Traction Batteries. Master’s Thesis, Chalmers University of Technology, Gothenburg, Sweden, 2021. [Google Scholar]
- Sun, Y.; Lu, H.; Jin, Y. Experimental and Numerical Study on Mechanical Deformation Characteristics of Lithium Iron Phosphate Pouch Battery Modules under Overcharge Conditions. Energy Fuels 2021, 35, 15172–15184. [Google Scholar] [CrossRef]
- Mei, W.; Duan, Q.; Lu, W.; Sun, J.; Wang, Q. An investigation on expansion behavior of lithium ion battery based on the thermal-mechanical coupling model. J. Clean. Prod. 2020, 274, 122643. [Google Scholar] [CrossRef]
- Hong, Y.; Zheng, J.; Deng, D.; Wu, Q.; Shen, W. Heterogeneous aging of large-scale flexible lithium-ion batteries based on micro-heterostructures and simulation. Int. J. Energy Res. 2020, 44, 12112–12125. [Google Scholar] [CrossRef]
- Zhong, X.; Yang, L.; Li, N.; Chu, Z.; Chen, J.; Zhu, S.; Song, W.; Ai, S.; Chen, H. In-situ characterizations and mechanism analysis of mechanical inhomogeneity in a prismatic battery module. J. Power Sources 2022, 548, 232053. [Google Scholar] [CrossRef]
- Li, Y.; Wei, C.; Sheng, Y.; Jiao, F.; Wu, K. Swelling force in Lithium-Ion power batteries. Ind. Eng. Chem. Res. 2020, 59, 12313–12318. [Google Scholar] [CrossRef]
- Hahn, S.; Theil, S.; Kroggel, J.; Birke, K.P. Pressure Prediction Modeling and Validation for Lithium-Ion Pouch Cells in Buffered Module Assemblies. J. Energy Storage 2021, 40, 102517. [Google Scholar] [CrossRef]
- Cai, T.; Mohtat, P.; Stefanopoulou, A.G.; Siegel, J.B. Li-ion Battery Fault Detection in Large Packs Using Force and Gas Sensors. IFAC-Pap. 2020, 53, 12491–12496. [Google Scholar] [CrossRef]
- Bozalp, T.; Siddiqui, M.A.R.; Opfer, H.; Vietor, T. Novel Method for the Three-Dimensional Simulation of Mechanical Ageing of Battery Modules. In Proceedings of the 11th International Conference on Simulation and Modeling Methodologies, Technologies and Applications SIMULTECH, Paris, France, 7–9 July 2021. [Google Scholar]
- Newmark, N.M. A Method of Computation for Structural Dynamics. ASCE J. Eng. Mech. Div. 1959, 85, 67–94. [Google Scholar] [CrossRef]
- Kim, N. Finite Element Analysis for Contact Problems. In Introduction to Nonlinear Finite Element Analysis, 1st ed.; Springer: New York, NY, USA, 2014; pp. 367–426. [Google Scholar]
- Bozalp, T.; Opfer, H.; Wurzenberger, J.C. Innovative Method for Coupled, Multi-Physical Simulation of Battery Modules. In Proceedings of the International Conference and Exhibition SIA Paris 2021 Powertrain & Power Electronics, Paris, France, 9–10 June 2021. [Google Scholar]
- Siebertz, K.; Van Bebber, D.; Hochkirchen, T. Sensitivitätsanalyse. In Statistische Versuchsplanung, 2nd ed.; Springer: Berlin/Heidelberg, Germany, 2017; pp. 415–430. [Google Scholar]
Disclaimer/Publisher’s Note: The statements, opinions and data contained in all publications are solely those of the individual author(s) and contributor(s) and not of MDPI and/or the editor(s). MDPI and/or the editor(s) disclaim responsibility for any injury to people or property resulting from any ideas, methods, instructions or products referred to in the content. |
© 2024 by the authors. Licensee MDPI, Basel, Switzerland. This article is an open access article distributed under the terms and conditions of the Creative Commons Attribution (CC BY) license (https://creativecommons.org/licenses/by/4.0/).