Article

A Graph-Based Genetic Algorithm for Distributed Photovoltaic Cluster Partitioning

1
Qingyuan Yingde Power Supply Bureau, Guangdong Electric Power Co., Ltd., Yingde 513000, China
2
School of Electrical Engineering and Automation, Wuhan University, Wuhan 430072, China
3
Foshan Power Supply Bureau, Guangdong Electric Power Co., Ltd., Foshan 528000, China
4
Electric Power Science Research Institute, Guangdong Electric Power Co., Ltd., Guangzhou 510080, China
*
Author to whom correspondence should be addressed.
Current address: China Southern Power Grid Research Technology Co., Ltd., Guangzhou 510663, China.
Energies 2024, 17(12), 2893; https://doi.org/10.3390/en17122893
Submission received: 1 May 2024 / Revised: 3 June 2024 / Accepted: 11 June 2024 / Published: 13 June 2024

Abstract

:
To easily control distributed photovoltaic power stations and provide fast responses for their regulation, this paper proposes an optimal cluster partitioning method based on a graph-based genetic algorithm (GA). In this approach, a novel structure utilizing a graph model is designed for chromosomes, and enhancements are made to the selection, crossover, and mutation models of the evolutionary to generate a search population for dividing distributed photovoltaic (PV) power grids into clusters. Moreover, the modularity and active power balance degree of the classic Girvan–Newman algorithm are employed as optimal objectives to establish a basis and evaluation system for cluster partitioning. Additionally, a Simulink simulation platform is established for the IEEE 33-bus time-varying scenario to validate its performance. A comparative analysis with some classic PV cluster partitioning algorithms demonstrates that the proposed method can achieve a more accurate and stable division of distributed PV units.

1. Introduction

In recent years, the development of renewable energies, such as photovoltaic (PV) energy, has garnered increasing attention within the power industry. More and more large-scale distributed photovoltaic power stations are being connected to power grids [1]. However, the inherent fluctuation and uncertainty of photovoltaic grid-connected generation have a huge impact on power grids, including equipment overload [2,3], voltage surges [4], voltage imbalances, and harmonic disturbances [5]. In particular, issues such as communication delay, high time complexity, and an excessive number of device controls mean that the traditional centralized control method is unable to regulate the distribution networks with a large number of distributed photovoltaic connections [6]. Instead, clustering technology as a unit for control can simplify complex control problems in distribution networks into multiple simple sub-problems, improving solution efficiency [7,8,9]. It is believed that distributed power generation cluster partitioning has the advantages of displaying overall characteristics to the outside world and providing fast response for regulation [10].
Generally, the research on distributed PV cluster partitioning is generated from two perspectives: selecting appropriate cluster performance indicators [8,9] and designing partitioning algorithms [10]. Cluster performance indicators usually indicate cluster internal connections and inter-cluster sparsity. Pereira et al. [11] utilized power sensitivity and Euclidean distance to describe electrical distance, achieving cluster partitioning with modularity. Vinothkumar et al. [12] employed Euclidean distance and a hierarchical clustering algorithm to simplify distributed generation location in network planning. Wang et al. [13] proposed a node membership indicator to prevent isolated nodes and reduce the complexity of cluster optimization models. Additionally, cluster performance indicators have the functional performance for cluster partitioning, such as assessing the adjustable power capabilities of resources within the cluster for voltage regulation. For instance, Du et al. [14] proposed voltage regulation and continuous power regulation capacity indicators to meet distribution network voltage requirements. Moreover, the flexibility balance indicator ensures that the supply of flexible resources within the cluster meets or exceeds the net load demand at any time scale [15], including supply–demand balance and time balance indicators. According to the cluster performance indicators, cluster partitioning algorithms are then developed, including affinity propagation (AP) clustering [16], K-means clustering [17], and spectral clustering [18].
For years, much research has been devoted to PV cluster partitioning. For instance, Li et al. [19] introduced dimension reduction based on daily load indicators and enhanced the k-means clustering algorithm using the entropy weight method to discern consumption patterns. Mo et al. [20] employed fuzzy clustering methods to improve partitioning accuracy. Additionally, community discovery algorithms such as the Girvan–Newman (GN) algorithm [21], the Louvain algorithm [22], and the Fast–Newman (FN) algorithm [23] have been applied to the distributed PV cluster partitioning. Moreover, an improved particle swarm optimization algorithm based on fuzzy theory [24], and a tabu search algorithm incorporating adaptive memory and responsive search mechanisms [25], is developed to guide optimization processes and avoid local optima. However, due to variations of indicators for partitions, particularly during model establishment, the extensive data within each node necessitate further exploration of comprehensive indicators and more efficient solution algorithms.
Hence, to control the distributed photovoltaic power stations easily and provide fast responses for regulation, an optimal cluster partitioning method is proposed based on a graph-based genetic algorithm. This approach leverages the search mechanism of a genetic algorithm in conjunction with modularity and active power balance metrics. By constructing a genetic chromosome coding strategy using a graph model, it facilitates the crossover, mutation, and selection processes of chromosomes, thereby achieving a complementary and interrelated partitioning of nodes within the cluster.
The organization of this paper is as follows: in Section 2, the distributed PV cluster partitioning indicators and optimization objective function is presented, and a modified genetic algorithm for distributed PV cluster partitioning is described in Section 3. In Section 4, the experimental results are presented, and the performance of the proposed method is then compared with that of some existing methods to demonstrate its effectiveness in the partitioning clusters. Finally, conclusions are drawn in Section 5.

2. Distributed PV Cluster Partitioning Indicators and Objective Function

2.1. Cluster Partitioning Indices for Distributed PV

In this study, the design of cluster partitioning indicators is specifically reflected in two aspects: (1) the modularity index considers the degree of geographical proximity or electrical coupling to ensure a tight internal connection within the cluster and a sparse connection between different clusters. (2) The active power balance index ensures the rationality of source–load matching within the cluster and the stability of power interactions between clusters. In the following, the description will be given in detail.

2.1.1. Modularity Index

Modularity index serves as a metric for assessing the robustness of network structures, is initially introduced by the Girvan–Newman algorithm [26], and is defined as
σ m = 1 2 m T r [ M c r T ( B i j k i k j 2 m ) M c r ] ,
m = i , j c B i j / 2 ,
k i = j c B i j ,
where Bij represents the weighted adjacency matrix of electrical distance weight, indicating the weight of the edge between node i and node j; the superscript T denotes transpose; Mcr represents the community allocation matrix after partitioning all nodes, where Mir = 1 denotes the i-th node belonging to the r-th community post-division. Tr(.) denotes the trace of a matrix; c is the set of all nodes within the network system; m is the sum of all edge weights in the network; ki is the sum of weights of all edges connected to node i.
Considering the distinction between electrical distance in the distributed PV network and the original community network, the tightness of electrical coupling between two nodes in the network is adopted instead, and electrical distance utilizing reactive voltage sensitivity [27] is defined as
d i j = k = 1 n ( D i k D j k ) 2 ,
D i j = lg S V Q , j j S V Q , i j ,
where dij represents the electrical distance between node i and node j; SVQ,ij represents the value of the element in row i and column j of the reactive power/voltage sensitivity matrix, i.e., SVQ,ij = (∂Qi/∂Vj) × Vj. In Formula (5), the logarithm lg is utilized to calculate the voltage influence of node j on node i. Notably, a smaller Dij indicates a stronger electrical connection between node j and node i, with the corresponding electrical distance being closer.
To further assess the relationship of the electrical distance between nodes dij and the weight Bij of the edge, the weight of the edge between nodes is defined as
B i j = 1 d i j max ( d ) ,
where max(d) represents the maximum value of elements in the electrical distance matrix d.
Due to the negligible impact of reactive voltage sensitivity to the electrical distance, the incremental effect of power P can be disregarded [27]. In other words, assuming ∆P = 0, the relationship between reactive power and voltage in the power system under a steady state can be derived by solving the Newton–Raphson power flow equation under steady state as follows:
Δ P Δ Q = P θ   P V Q θ   Q V Δ θ Δ V = S P θ   S P V S θ Q   S V Q Δ θ Δ V ,
Δ Q = S θ Q Δ θ + S V Q Δ V   = ( S θ Q S P θ 1 S P V + S V Q ) Δ V ,
where ΔP and ΔQ, respectively, represent the increment of active and reactive power injected by nodes; Δθ and ΔV represent the increment of node voltage phase angle and voltage amplitude, respectively; SPθ, SPV, SθQ and SVQ are Jacobian block matrices; SVQ represents the sensitivity matrix of active power/voltage amplitude, which directly reflects the relationship between node voltage and injected power.
In the power grid, the reactance of typical components significantly exceeds the resistance [28]. When considering P and Q decoupling, Equation (8) can be simplified as
Δ Q = S V Q Δ V .
Notably, the modularity index, which takes into account the electrical distance between nodes as the weight of the edges, can effectively capture the structural attributes of the distribution network. It delineates the electrical interconnection density among nodes within clusters, facilitates the partitioning of the network, and provides a quantifiable measure of the structural integrity of communities.

2.1.2. Active Power Balance Index

Active power balance index is an effective metric for assessing the voltage overcrossing of distributed clusters, and is defined as
φ P = 1 N P c = 1 N c 1 1 T t = t 1 t n P c ( t ) max P c ( t ) ,
P c ( t ) = i O c P i ( t ) ,
where T is the duration of the time-varying scenario, namely tn t1; NP indicates the number of clusters to be divided; Nc indicates the number of clusters in cluster c; Pc(t) denotes the net power of cluster c at time t; Pi(t) denotes the net load power of node i in the cluster at time t; and Oc indicates the set of nodes in cluster c.
The active power balance metric fosters the autonomous functionality of the cluster through the harmonization of node compatibility within the network. By accounting for the dynamic attributes of each node and capitalizing on their mutual compensatory features, it enables a reciprocal balance between sources and/or loads. This strategy effectively maintains a stable power equilibrium within the cluster and mitigates the fluctuations and unpredictability inherent in photovoltaic power generation systems.

2.2. Cluster Partitioning Indices for Distributed PV Energy

To comprehensively synthesize the indicators of distributed PV nodes and reflect the attributes of individual nodes, the objective function of the cluster partitioning optimization model integrates the index of modularity and the cluster net power balance, and is formulated as follows
max   F 1 = ρ m + λ Ω 1 Ω max   F 2 =   φ P + λ Ω 2 Ω s . t .   Ω 0 , 1 ,
where ρm represents the modularity value after cluster division; φP represents the active power balance degree after cluster division; Ω indicates the cluster division parameter indicator, which measures the number of clusters to be divided and the potential existence of a single node in the network; λΩ1 and λΩ2 represent the weight values, respectively.

2.3. Objective Function

The values of index can be calculated using Formula (12). Nevertheless, normalization processing is required to determine the maximum electrical coupling degree and the autonomous coordination capability within the cluster:
f 1 = lg ( F 1 ) / lg ( max F 1 ) f 2 = lg ( F 2 ) / lg ( max F 2 ) ,
where f1 and f2, respectively, denote the normalized modularity and active power balance; max F1 or max F2 is obtained by the single optimal function in Formula (12).
To simplify the multi-objective programming problem described in Equation (12), the objective function of the model can be designed by a weighting method as follows:
max   F = λ 1 f 1 + λ 2 f 2 ,
where λ1 and λ2 represent, respectively, the weights of the modularity index and the active power balance index based on electrical distance.

3. A Modified Genetic Algorithm for Distributed PV Cluster Partitioning

Formula (14) highlights that the objective function for distributed cluster partitioning represents a multi-parameter solving model, where traditional search methods may easily converge to local optima. Therefore, a group search mechanism, named the modified GA (MGA) is proposed, adapting its chromosome structure to align with the objective function of cluster partitioning.

3.1. The Original GA

The GA was pioneered by John Holland in the United States, who initially explored computer simulations of biological system evolution [29]. The optimized problem-solving processes were then transformed into mathematical operations, which takes the selection, crossover, and mutation of chromosome genes in biological evolution. Through these operations, optimized results can be swiftly and effectively achieved. The entire process is depicted in Figure 1.
It is worth noting that the evolution process is dependent on the selection, crossover, and mutation of chromosome. Selection operations in GA choose superior individuals from the old population. A new generation is then formed by individual selection probabilities, which are correlated to their fitness values. Generally, individuals with higher fitness values have a greater chance of selection. The crossover operation generates a new generation of individuals that inherit traits from their parents. Usually, two individuals are randomly selected from the population, and their chromosomes undergo exchange, passing on advantageous genes from the parent strings to the offspring. Thereby, new superior individuals are produced. The mutation operation is introduced to increase the diversity of the population and avoid the algorithm getting stuck in local optima, simulating the evolutionary process.

3.2. Improved Chromosome Encoding

Traditional GA is typically employed to solve numerical values or functions. However, some limitations occur in analyzing network topologies. Hence, a novel chromosome encoding will be designed to partition the network of distributed PV power grid nodes, enabling the resolution of network topology node divisions. In the following, the description will be given in detail.

3.2.1. Encoding and Initialization

Chromosome coding serves as the foundation of GA and plays a significant role in the selection, crossover, and mutation processes during the evolutionary process. To facilitate cluster partitioning, a coding method based on the adjacency matrix is devised and is defined as
d i = j = 0 n A i j × 2 j ,
where Aij is set to 0 or 1, indicating disconnection or connection between node i and node j in the cluster; n denotes the number of nodes; and di represents the sum of edge weights of the network edges in row i.
For clarity, Figure 2 illustrates the generation framework of chromosome encoding. Firstly, the adjacency matrix is initially converted into an upper triangular matrix form. Subsequently, the binary values 0/1 in the upper triangle are transformed into decimal numbers, forming a column vector representing a chromosome. It is evident that different forms of the adjacency matrix can generate multiple chromosomes for subsequent selection, crossover, and mutation processes.
In our method, the initialization of the adjacency matrix represents the network connection conditions prior to cluster division. The random search of GA should have various network topologies. To achieve a random search, Figure 3 illustrates two integer values i and j for example, where i = [1, 2, 3, …, numnode] and j = [1, 2, 3, …, numnode], with numnode representing the maximum number of nodes in the network. The adjacency matrix Aij is randomly set to 1 if the index value at the i-th row and j-th column corresponds to an element of the adjacency matrix with a value of 1. This process thereby generates a chromosome.

3.2.2. Crossover Operation

To enhance population diversity and avoid local optima, this study adopts the uniform crossover method. If the random number within the interval [0, 1] is less than the crossover probability, a crossover operation is performed between two randomly selected chromosomes. This process is defined as follows:
P c _ r a n d = U ( 0 , 1 ) ,
P c _ r a n d P c ,
where Pc_rand represents the randomly obtained crossover probability for the genetic factor, and Pc denotes the adaptive crossover probability that is adjusted based on fitness throughout the entire genetic process; U(0,1) denotes the selection of a random number from the interval [0, 1].
When the crossover probability condition is satisfied, the X-th and Y-th chromosomes of length n are selected for crossover operation. Setting the uniform crossover probability ρ , each gene in the chromosomes is traversed and a random number ri is generated. If the condition ri < ρ is satisfied, the newly generated chromosomes X′ and Y′ are as follows
r i ~ U ( 0 , 1 ) ,
X = [ x 1 , x 2 , , x n ] new   chromosome X = [ x 1 , x 2 , , y i , , x n ] Y = [ y 1 , y 2 , , y n ] new   chromosome Y = [ y 1 , y 2 , , x i , , y n ]   ,

3.2.3. Mutation Operation

Similar to the crossover operation, if a randomly generated number within the interval [0, 1] is less than the mutation probability and satisfies the constraint defined by Formula (21), a binary mutation operation is conducted. Specifically, this involves
P m _ r a n d = U ( 0 , 1 ) ,
P m _ r a n d P m ,
where Pm_rand represents the randomly obtained mutation probability for the genetic factor, and Pm denotes the adaptive mutation probability that adjusts based on fitness during the evolutionary process.
Accordingly, when the chromosome mutation probability satisfies the condition, it is necessary to transform the adjacency matrix as follows
ϕ N = ( X 1 , X 2 , , X m , , X N ) ,
X m = [ x 1 , x 2 , , x i , , x n ] ,
a i j = x i % 2 j = 1 x i / 2 j 1   % 2 j > 1   a n d   x i > 0   0 x i = 0 ( j = 1 , 2 , , n ) ,
where n represents the length of the chromosome; N represents the number of chromosomes; ϕN represents the set of all chromosomes in a given mutation generation; Xm denotes the m-th chromosome.; ⌊.⌋ is the floor function, which rounds down to the nearest integer; xi represents the i-th decimal value; and aij represents the binary value at the i-th row and j-th column of the adjacency matrix Aij after the genetic factor m is transformed into it.
To enhance the stability of results and prevent local optima, this study adopts the adaptive crossover and mutation probabilities proposed by Srinivas [30], which are expressed as follows
P c = P c _ max ( P c _ max P c _ min g max ) g , f c f a v g P c _ max , f c < f a v g ,
P m = P m _ min + ( P m _ max P m _ min g max ) g , f m f a v g P c _ min , f m < f a v g ,
where Pc and Pm represent the crossover probability and mutation probability, respectively; Pc_max and Pc_min denote the maximum and minimum values for the crossover probability, while Pm_max and Pm_min denote the maximum and minimum values for the mutation probability; g and gmax represent the current iteration number and the maximum number of iterations, respectively; fc, fm, and favg denote the maximum fitness of the two chromosomes in crossover, the fitness of the chromosome in mutation, and the average fitness value of the chromosomes at the g-th iteration, respectively.

3.2.4. Selection Operation and Termination Conditions

To ensure the best individuals are passed down to the next generation, the elitism strategy [29] is adopted by copying the top m individuals with high fitness (where m is a predefined number of individuals) to the next generation. These elite individuals still participate in the selection process, which helps accelerate the convergence speed and rediscover the optimal solution. Generally, elitism in genetic algorithms helps maintain population diversity and prevents the loss of optimal solutions.
Alternatively, to quickly and effectively obtain the final result, the stop criterion is built based on the maximum number of iterations and the rate of change in fitness during iterations, and is designed as follows:
g > g max ,
F ( f 1 ( g ) , f 2 ( g ) ) F ( f 1 ( g k ) , f 2 ( g k ) ) ξ ,
where gmax represents the preset maximum number of iterations; k represents any constant such that kgmax; ξ represents a predefined small value, and ξ = 0.05 is set in this study.
For ease of understanding, Table 1 illustrates the whole flowchart of the proposed method.

4. Experimental Analysis

4.1. Simulation Platform

4.1.1. Background of Simulink Simulation Platform

To evaluate the effectiveness of the proposed method, the widely-used IEEE 33-bus standard distribution network system [31] is employed, which has its line parameters and the load data of nodes. Moreover, the simulation of the IEEE 33-bus distribution system is built using MATLAB R2020b. Simulation data can be then generated by varying temperature differences and light intensities.

4.1.2. Design and Construction of the IEEE 33-Node Distribution Network

The IEEE 33-bus power system comprises 37 branches and 32 PQ (active–reactive power) nodes (load nodes), in addition to one balancing node. Table 2 illustrates the node voltage limits for the IEEE 33-node system. The simulation platform establishes a three-phase voltage source with an input of 10 kV, a phase angle of 0 degrees, and a frequency of 50 Hz. Thereby, the simulation is devised to emulate the line impedance and the rated load at each node.

4.1.3. Design of Distributed PV Power Grid Model

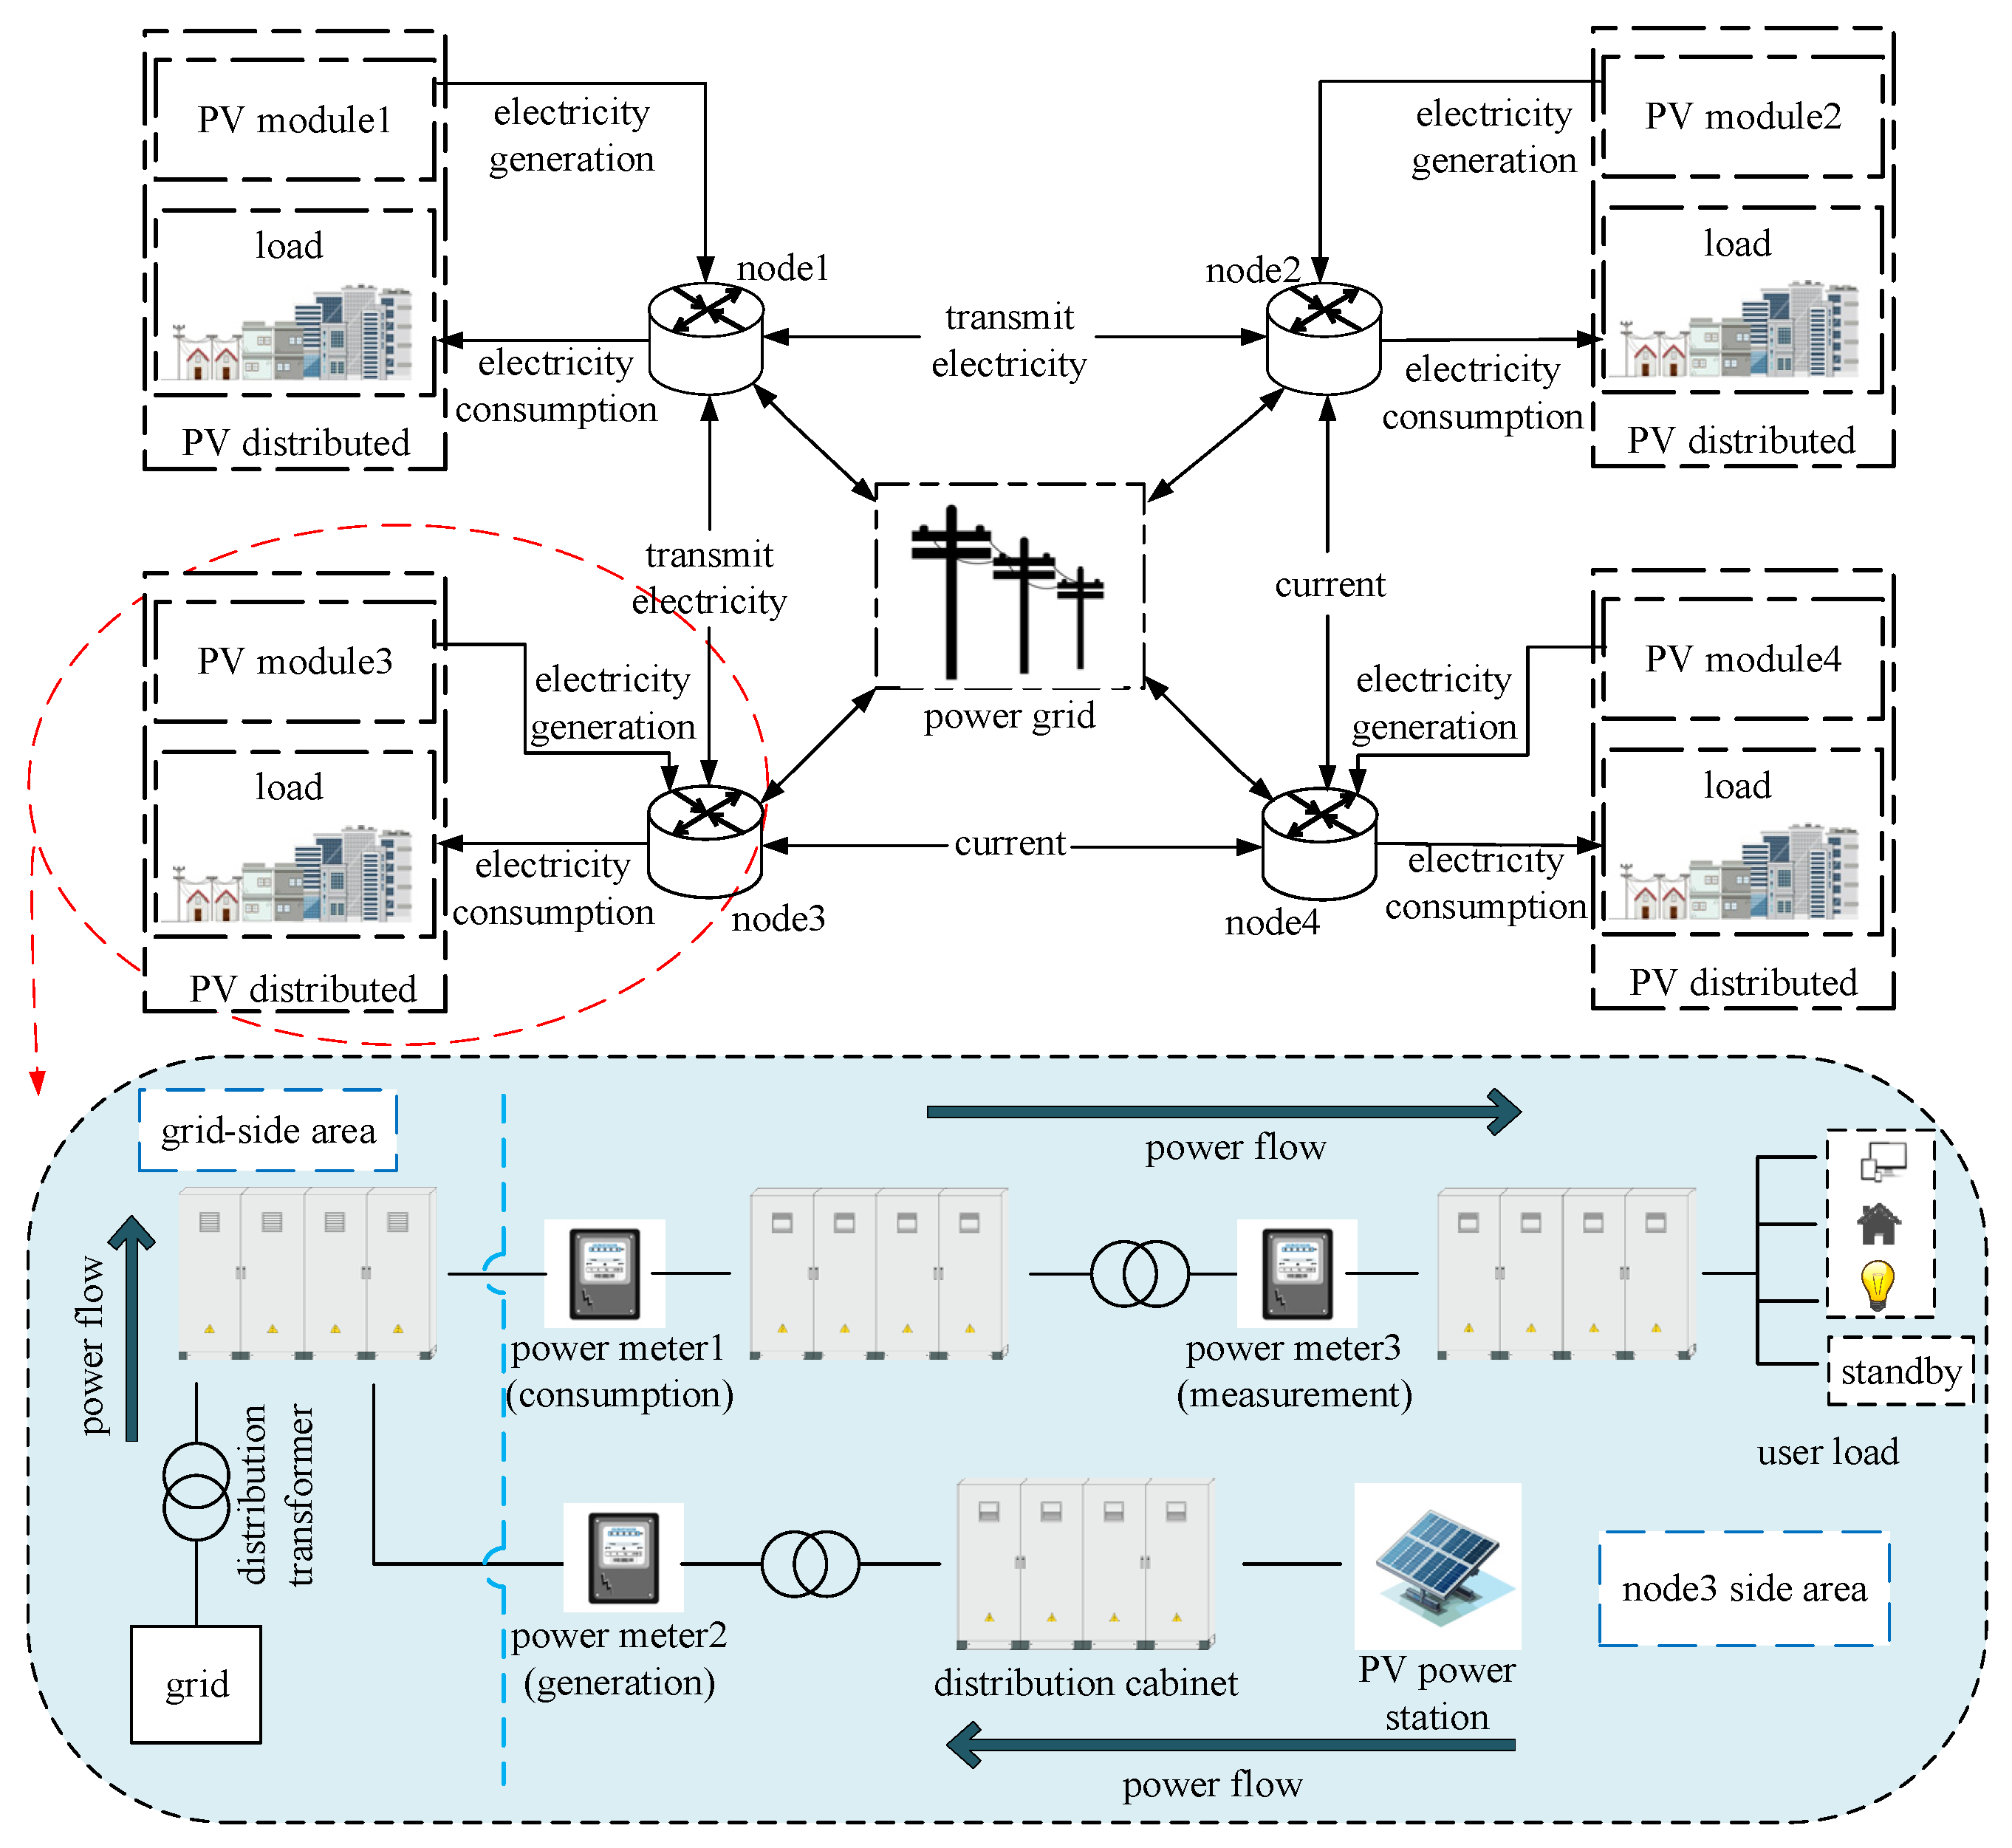
PV modules are capable of energy transmission, managing electrical loads, and consuming electrical energy. During the simulation process on the platform, the individual output power of a PV panel can be altered by adjusting its temperature and light intensity. Additionally, the simulation can model the charging and discharging functions of a PV power station at a certain point by varying the number of PV panels in series and parallel and modifying the output parameters of individual panels, thus facilitating the collection of PV power station data. Taking an 18-node system for example, a PV array is designed to be connected to the load of this node, with the simulation diagram shown in Figure 4.
Designing multiple PV arrays to connect to nodes enables the creation of a distributed PV power generation network, facilitating the integrated utilization and sharing of electrical energy. Figure 5 illustrates the energy transmission within the distributed generation network and the network topology, where individual nodes adopt a self-generation and self-consumption model.
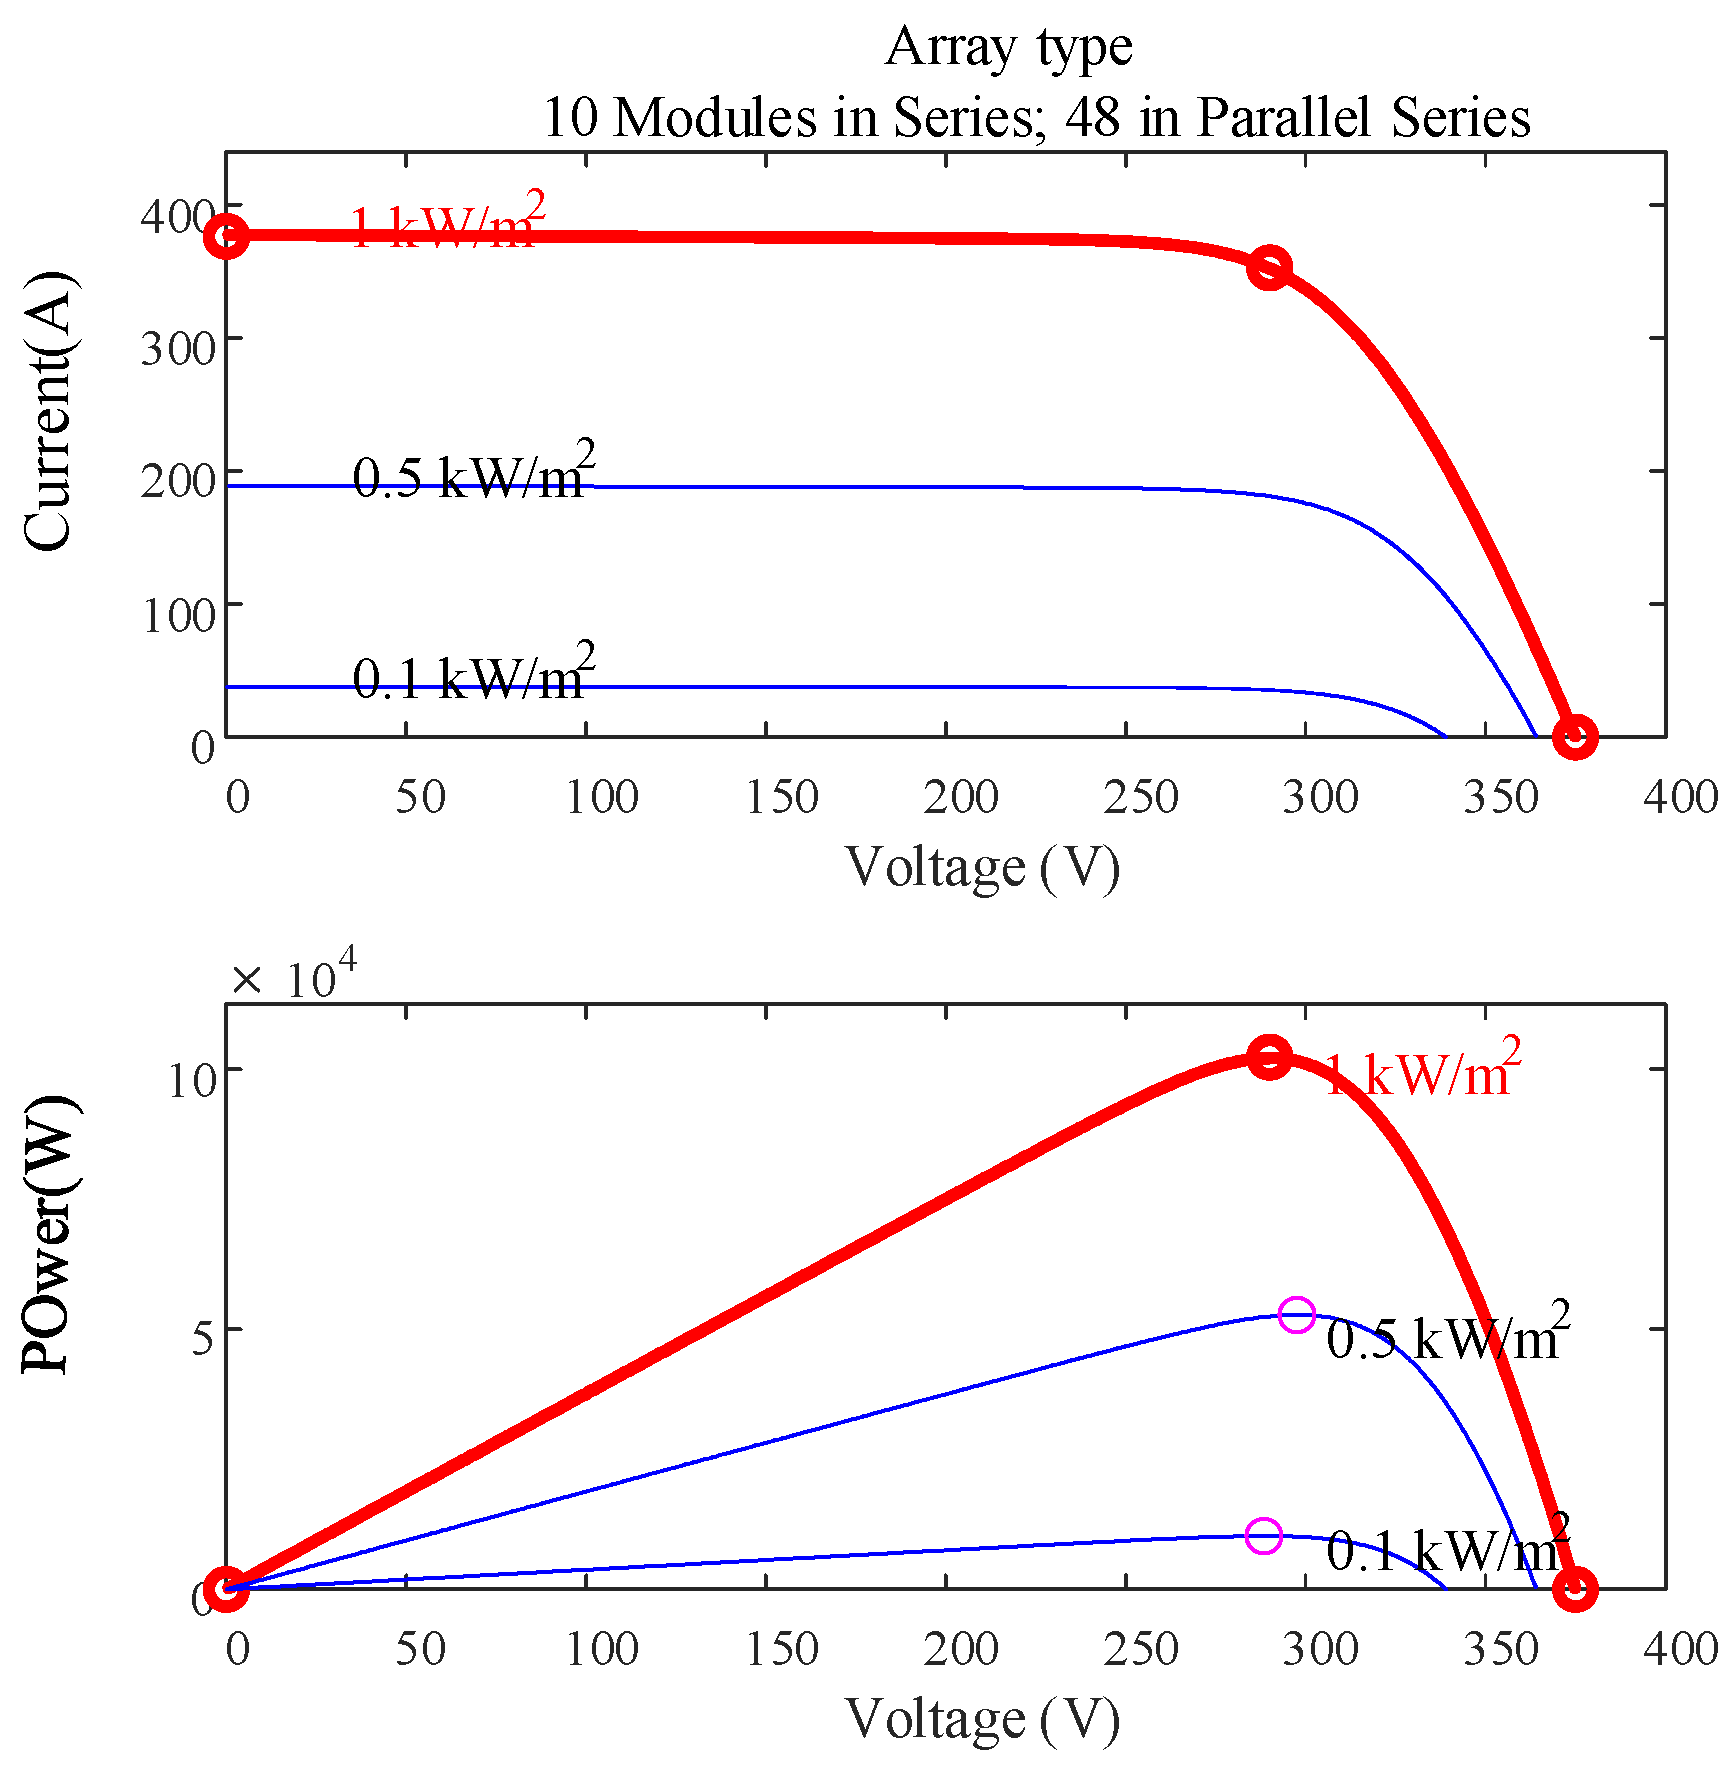
The PV array is modeled using a current source, diodes, series resistance, and parallel resistance to capture the irradiance and temperature characteristics of the module. For instance, the 18-node PV array consists of 48 parallel strings, each containing 10 series-connected PV panel modules. The I-V (current–voltage) and P-V (power–voltage) characteristics of this module array are depicted in Figure 6. It can be seen that the output electrical energy rises as irradiance increases. With an irradiance of 1 kW/m2, the open-circuit voltage is 375 V, the short-circuit current is 376 A, and the maximum output power can reach 102.31 kW.
In the testing phase, the temperature and light intensity at time t = 12 are selected as the design parameter values for the PV module, resulting in a power output characteristic curve as shown in Figure 7. The active and reactive power output curves tend to flatten around 0.8 s, achieving stable output of the PV array at any given moment through the MPPT (Maximum Power Point Tracking) control strategy. Among them, node 20 exhibits the highest penetration rate of renewable energy output at time t = 12 h, with an output value of 108.27 kW.
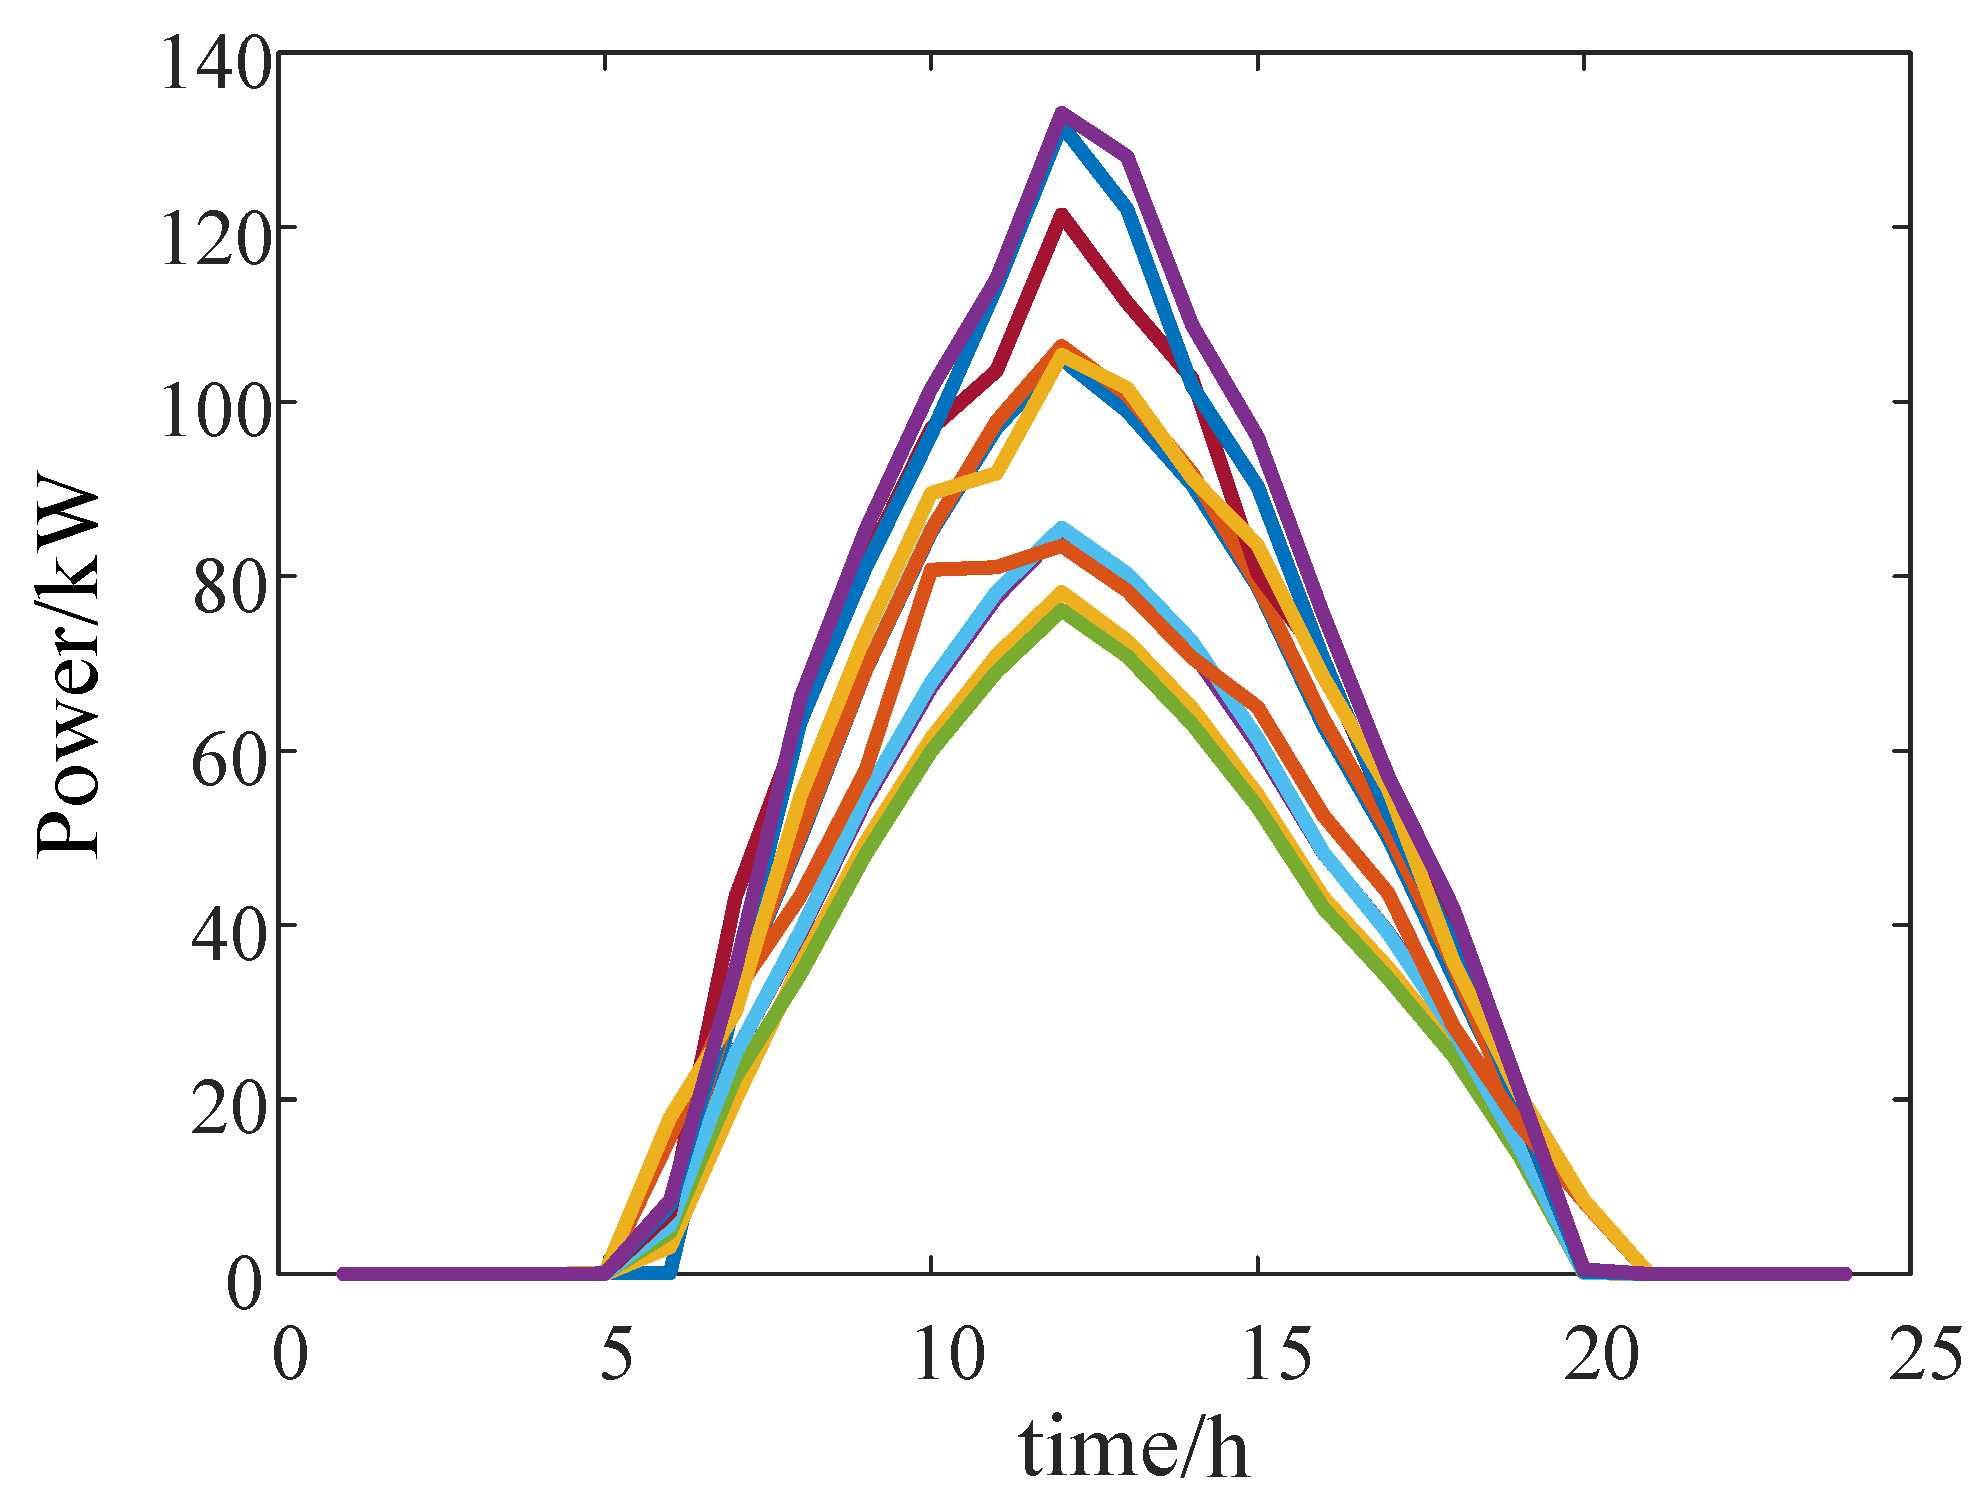
The simulation platform incorporates 11 nodes (6, 9, 10, 14, 18, 20, 21, 24, 26, 30, and 33) for PV power generation. The total installed capacity of the PV system is 1.5 MW. The output data following the installation of the PV nodes are depicted in Figure 8.
The output data illustrate the typical daily net power curve for the load nodes in the IEEE 33-bus network, as depicted in Figure 9. Among the total of 32 load nodes, nodes 6, 9, 10, 21, 26, and 33 exhibit a negative net load power.

4.2. Cluster Division Results

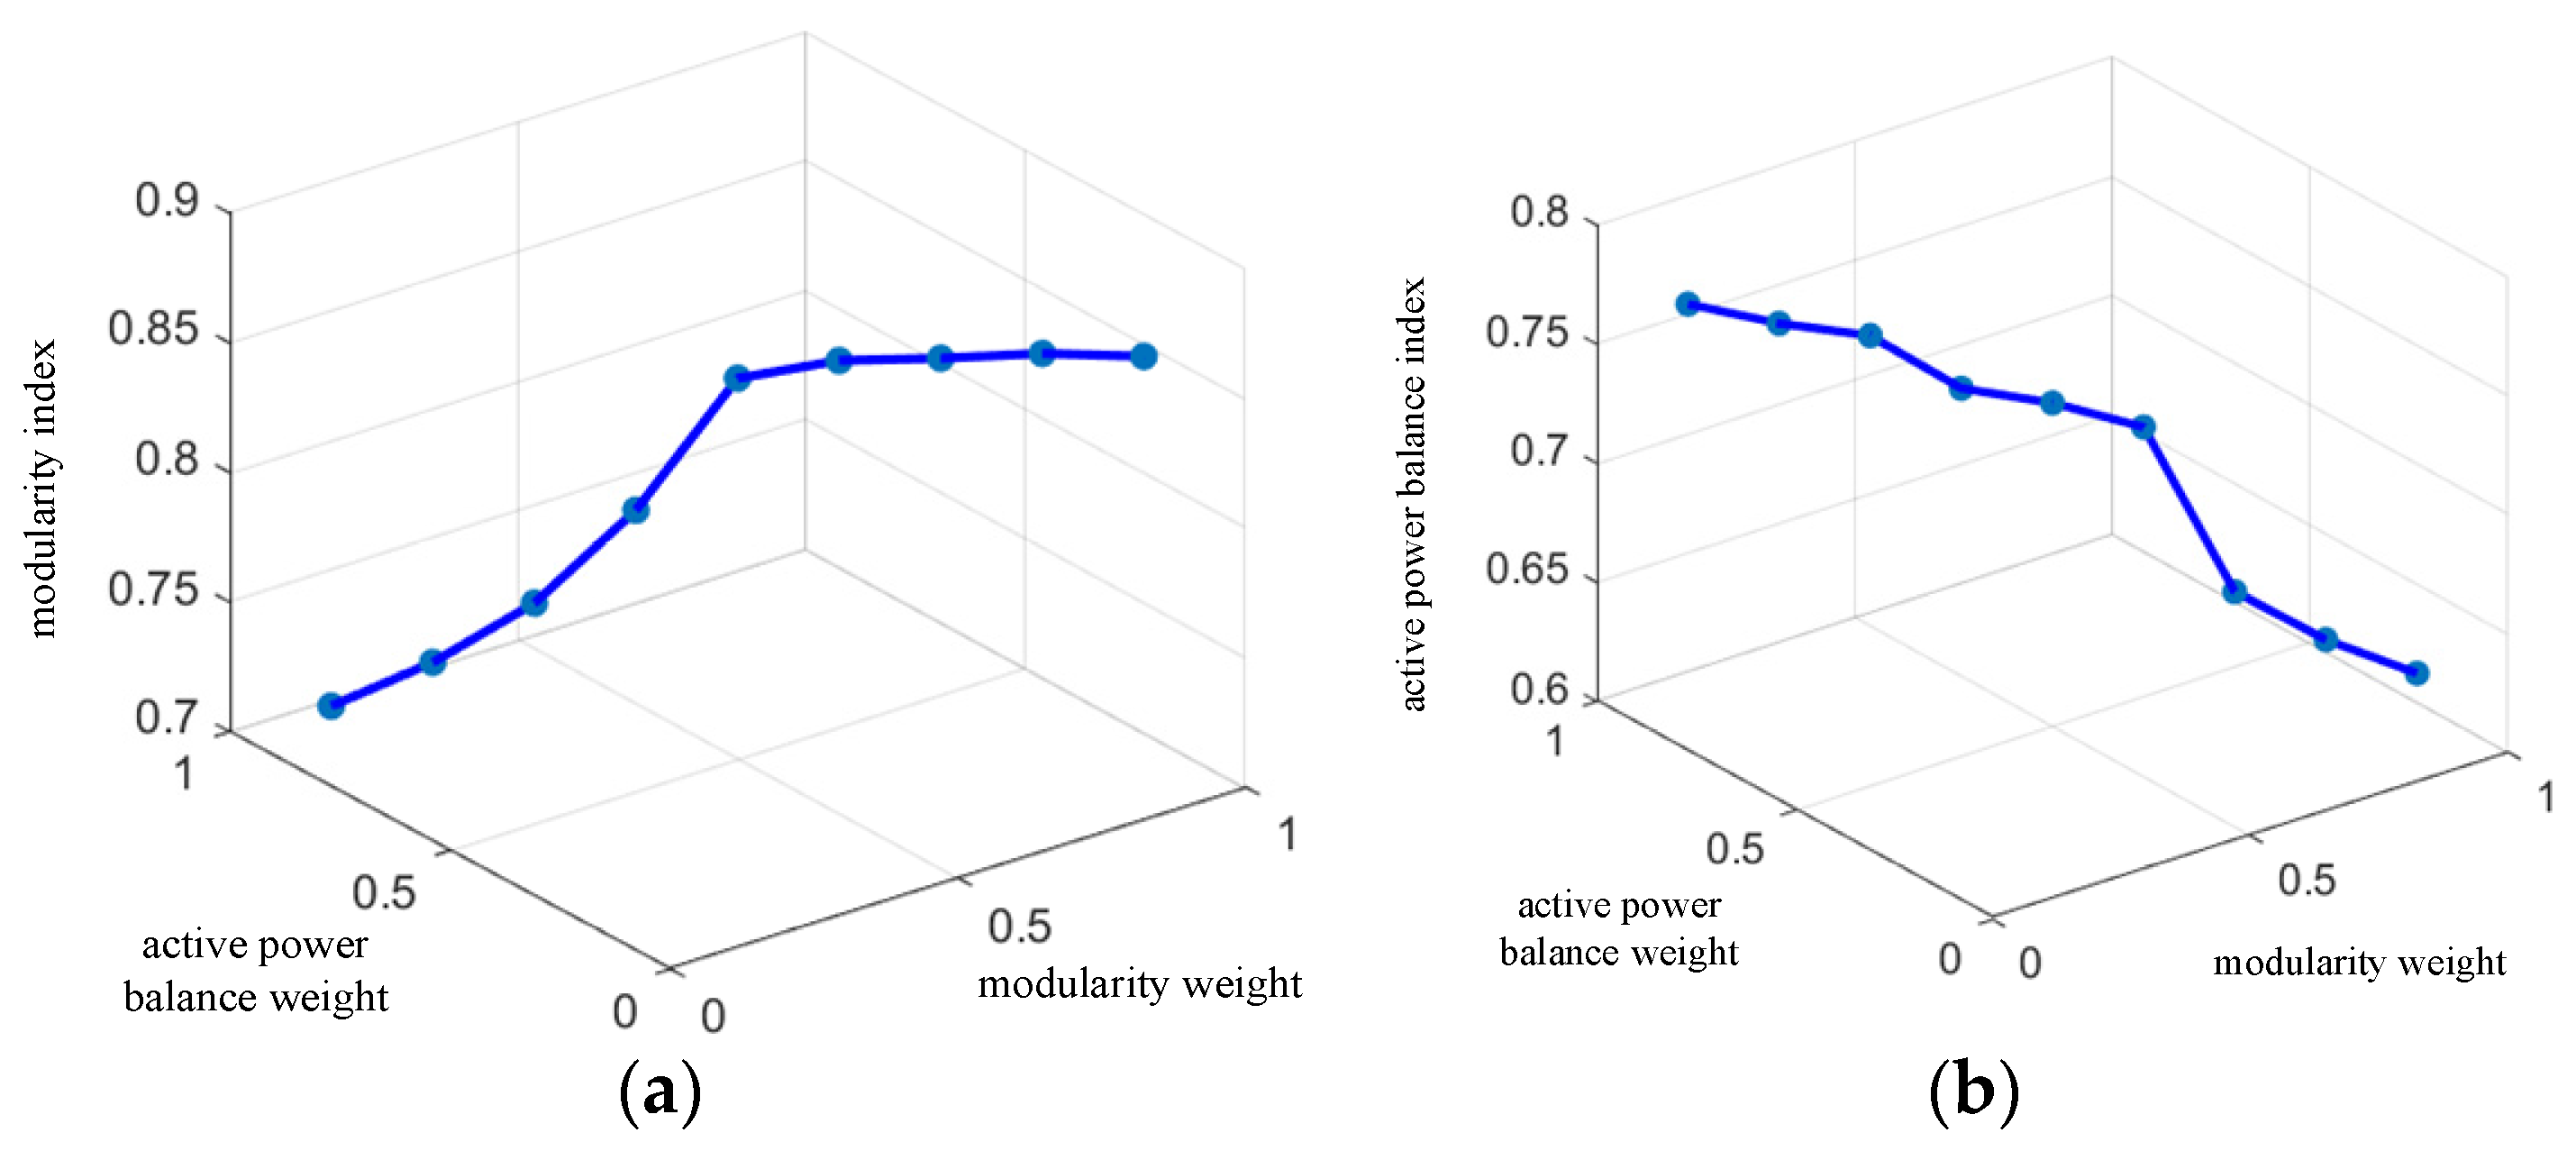
The proposed method sets the population size N = 40 and the maximum number of iterations gmax = 200. Considering that the fitness index is influenced by factors such as modularity, active power balance, and cluster division parameters, it is necessary to continuously adjust weight proportions to calculate the maximum fitness value under the optimal weight combination. Figure 10 compares the modularity index and active power balance index under varying weights for cluster division.
It can be seen from Figure 10 that changes in the weights correspond to variations in both the modularity index and the active power balance index. The curves’ trends indicate that the modularity and active power balance indices exhibit steeper changes when the weight values fall between 0.3 and 0.7. Therefore, the comparison is performed on the node coupling degree index, cluster net power balance index, and comprehensive performance index under different weight combinations within the range from 0.3 to 0.7, with the results presented in Table 3.
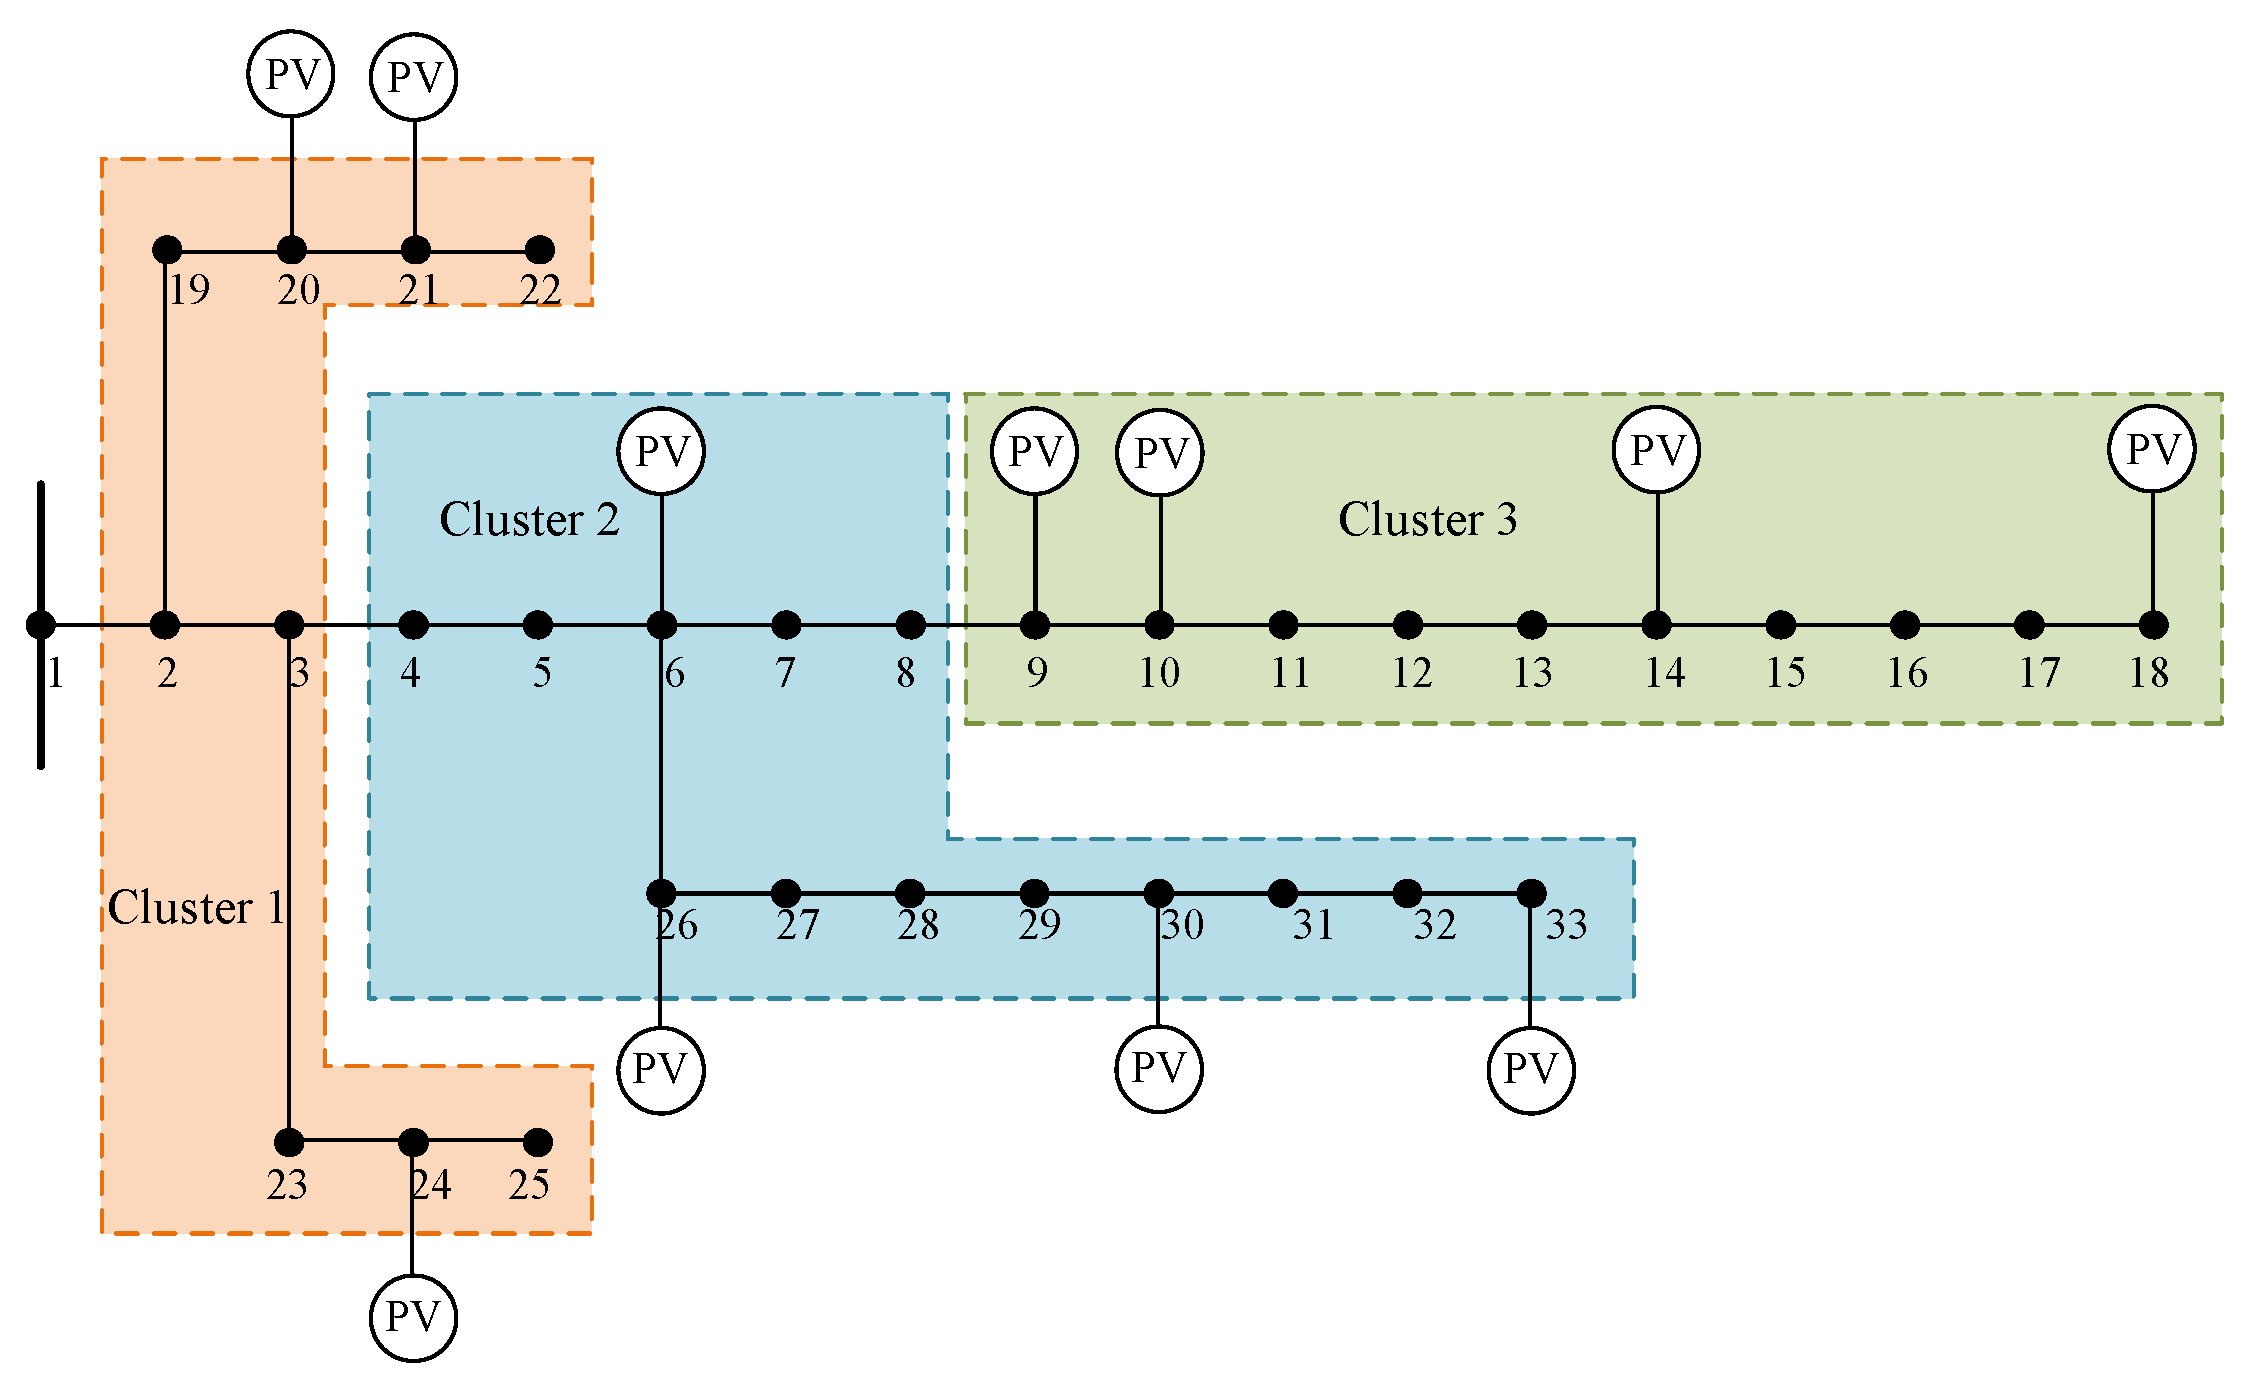
From Table 3, the weights λ1 = 0.6 and λ2 = 0.4 yield the optimal objective function value for cluster division. The entire PV grid is divided into three clusters, as illustrated in Figure 11.
Figure 12 illustrates the relationship between the optimal fitness function and the corresponding number of cluster divisions. Its comprehensive index increases as the genetic algorithm iterates, indicating increasingly favorable cluster division results. In the case of the IEEE 33-bus system, the optimal objective function value is reached after 74 iterations, and the result of cluster division is three clusters.

4.3. Comparison of Indicators

To further demonstrate the validity of the fitness function, two indicators, modularity based on the MGA algorithm and active power balance, are compared with other design control groups as follows.

4.3.1. Comparison of Modularity Indicator

Using the IEEE33-node simulation data designed earlier, this test compares the proposed method with the Louvain algorithm, Fast–Newman algorithm (FN), Fuzzy C-means clustering algorithm (FCM), and K-means algorithm. The corresponding cluster division results and modularity values are shown in Table 4. It is noteworthy that a weighted adjacency matrix based on electrical distance is uniformly used as the input. However, in the process of using the K-means algorithm and the MGA algorithm, photovoltaic power grid data and power flow calculations are considered, making the calculation process relatively complex.
From Table 4, it can be seen that when comparing modularity indicators, the Louvain algorithm and the MGA algorithm proposed in this study both exhibit high modularity values, specifically 0.7866 and 0.8560, respectively. This indicates a good performance in terms of the degree of node connectivity, demonstrating excellent operational management capabilities. The difference in modularity, Δσm = 0.0694, showing that the results are quite similar. However, due to the singularity of the input data in the Louvain, FN, and FCM algorithms, the partitioning results may include isolated nodes or unreasonable node allocation. In contrast, under the influence of the modularity indicator, our method achieves a higher degree of coupling between nodes within clusters, better defining the intra-cluster connectivity and inter-cluster independence.
Additionally, the FN algorithm has the shortest computation time but results in unreasonable partitions. Regarding the number of clusters, both the K-means algorithm and the method proposed in this study have fewer and more well-planned clusters.

4.3.2. Comparison of Active Power Balance Indicator

To verify the degree of energy planning based on the active power balance indicator, cluster partitioning is performed using the fitness function under dual performance indicators and using only modularity as the indicator. The MGA simulation and the final division results are shown in Table 5.
From Table 5, it can be seen that, in terms of modularity, the cluster partitioning results under both types of indicators exhibit good node coupling, with a small difference of Δ σ m = 0.0075. In terms of active power balance, the maximum fluctuation value of the active power balance indicator under the dual performance indicators decreased by 5.57% compared to the single modularity indicator. This indicates that the active power balance indicator can improve the power distribution performance. From an energy planning perspective, it is more conducive to achieving the self-balancing ability and energy absorption within the cluster, fulfilling the balance and complementarity of sources, loads, and storage in the distribution system, and mitigating the instability of photovoltaic output.

5. Conclusions

Regarding the partitioning problem of distributed PV clusters, active power balance as comprehensive performance indicators are incorporated into an optimal cluster partitioning method, which is based on a graph-based genetic algorithm. The genetic algorithm structure factor is transformed based on electrical grid network topology to partition distributed PV clusters. Finally, experiments on a Simulink simulation platform demonstrate the effectiveness of the proposed method in searching the partitioning clusters by using indicators of the modularity value and active power balance. Moreover, in contrast to some classic clustering partitioning methods, the proposed method has advantages in terms of indicators and cluster partitioning results, ensuring the closeness of electrical coupling between nodes within the cluster and the stability of the structure.
In further research, we plan to introduce coordinated control for distributed voltage in PV distribution networks after a partitioning cluster using our method. A two-layer voltage optimization method for clusters will be performed to minimize the loss of PV generation and active networks, including autonomous optimization within clusters and distributed optimization between clusters.

Author Contributions

Methodology, Z.L. and W.H.; Validation, J.W.; Data curation, L.X. and F.H.; Writing—review & editing, D.Z.; Project administration, G.G. All authors have read and agreed to the published version of the manuscript.

Funding

This research was funded by Southern Power Grid Network-level Science and Technology Project grant number GDKJXM20222474.

Data Availability Statement

The original contributions presented in the study are included in the article, further inquiries can be directed to the corresponding author.

Conflicts of Interest

Authors Zhu Liu, Lingfeng Xuan and Feiwu He were employed by the company Qingyuan Yingde Power Supply Bureau, Guangdong Electric Power Co., Ltd. Author Guowei Guo was employed by the company Foshan Power Supply Bureau, Guangdong Electric Power Co., Ltd. Author Jinfeng Wang was employed by the company Electric Power Science Research Institute, Guangdong Electric Power Co., Ltd. The remaining authors declare that the research was conducted in the absence of any commercial or financial relationships that could be construed as a potential conflict of interest.

References

  1. Shi, M.; Yin, R.; Jiang, W.; Wang, Y.; Hu, P.; Hu, X. Overview of flexible grid-connected cluster control technology for distributed photovoltaic. Electr. Meas. Instrum. 2021, 58, 1–9. [Google Scholar]
  2. Le, J.; Zhu, J.; Sun, M.; Zeng, W. Research on the risk assessment and countermeasures of distribution network with large scale distributed PV accessing. Electr. Meas. Instrum. 2019, 56, 28–33. [Google Scholar]
  3. Du, X.; Zhao, J.; Liu, K.; Zhan, H. A digital twin early warning method study for overload risk of distribution network with a high proportion of photovoltaic access. Power Syst. Prot. Control 2022, 50, 136–144. [Google Scholar]
  4. Zhou, J.; Zhang, J.; Xi, D.; Zhang, A.; Zhang, W.; Cai, X. Terminal voltage overlimit mitigation for low-voltage distribution network based on coordinated active and reactive power control of soft open point. Autom. Electr. Power Syst. 2023, 47, 110–122. [Google Scholar]
  5. Li, F.; Ding, J.; Zhou, C.; Yong, W.; Huang, Y.; Wang, J.; Xu, X. Key technologies of large-scale grid-connected operation of distributed photovoltaic under new-type power system. Power Syst. Technol. 2024, 48, 1–16. [Google Scholar]
  6. Zhang, W.; Xu, Y.; Li, Z.; Wang, Z.; Niu, Q.; Li, J. Decision-making of voltage control strategy for distribution network after large-scale PV participation. Electr. Meas. Instrum. 2018, 55, 6–10. [Google Scholar]
  7. Sheng, W.; Wu, M.; Ji, Y.; Kou, L.; Pan, J.; Shi, H.; Niu, G.; Wan, Z. Key techniques and engineering practice of distributed renewable generation clusters integration. Proc. CSEE 2019, 39, 2175–2186. [Google Scholar]
  8. Xiao, C.; Zhao, B.; Zhou, J.; Li, P.; Ding, M. Forecasting model of saturated load based on chaotic particle swarm and optimization-gaussian process regression. Autom. Electr. Power Syst. 2017, 41, 9–15. [Google Scholar]
  9. Li, Y.; Lv, N.; Lin, X.; Hu, J.; Hu, Y. Output evaluation method of distributed photovoltaic cluster considering renewable energy accommodation and power loss of network. Electr. Power Constr. 2022, 43, 136–146. [Google Scholar]
  10. Liang, Z.F.; Ye, C.; Liu, Z.W.; Li, M.; Wang, P.; Cao, K.; Zhao, J. Grid-connected scheduling and control of distributed generations clusters: Architecture and key technologies. Power Syst. Technol. 2021, 45, 3791–3802. [Google Scholar]
  11. Pereira, L.D.L.; Yahyaoui, I.; Fiorotti, R.; de Menezes, L.S.; Fardin, J.F.; Rocha, H.R.O.; Tadeo, F. Optimal allocation of distributed generation and capacitor banks using probabilistic generation models with correlations. Appl. Energy 2022, 307, 118097. [Google Scholar] [CrossRef]
  12. Vinothkumar, K.; Selvan, M.P. Hierarchical agglomerative clustering algorithm method for distributed generation planning. Int. J. Electr. Power Energy Syst. 2014, 56, 259–269. [Google Scholar] [CrossRef]
  13. Wang, J.J.; Yao, L.Z.; Liu, K.Y.; Cheng, F.; Xu, J.; Wang, J. Dynamic network partitioning method of distribution networks considering regional autonomy. Power Syst. Technol. 2024. [CrossRef]
  14. Du, H.W.; Wei, T.Z.; Xia, D.; Zhou, S.Y.; Han, T. Self-regulated-cooperative control of reactive voltage in distribution networks based on cluster dynamic segmentation. Autom. Electr. Power Syst. 2024. [CrossRef]
  15. Zhao, J.J.; Zhu, J.D.; Li, Z.K.; Zhang, Y.; Liu, S.; Li, Z.B. Two-stage intraday distributed optimal dispatch for distribution network considering robust balance between flexibility supply and demand. Autom. Electr. Power Syst. 2022, 46, 61–71. [Google Scholar]
  16. Yang, Y.; Chen, Y.H.; Cheng, L. Power reserve and gin centrality of buses considered dynamic cluster voltage control of active distribution networks. Power Syst. Technol. 2024, 48, 618–632. [Google Scholar]
  17. Wei, T.Z.; Du, H.W.; Xia, D.; Han, T.; Wu, X.Q.; Xu, Z. Distributed power cluster partitioning method based on LGWO improved K-means clustering algorithm. J. North China Electr. Power Univ. 2024. Available online: https://kns.cnki.net/kcms/detail//13.1212.TM.20230217.1641.004.html (accessed on 1 February 2023).
  18. Zhang, Q.; Ding, J.; Zhang, D.N.; Wang, Q.; Ma, J. Reactive power optimization of high-penetration distributed generation system based on clusters partition. Autom. Electr. Power Syst. 2019, 43, 130–137. [Google Scholar]
  19. Li, B.; Lei, C.; Fan, B.; Huang, Y.; Jia, W.; Ma, Y. Research on typical electricity consumption law based on daily load indicator and improved distributed k-means clustering. Electr. Meas. Instrum. 2023, 60, 104–111. [Google Scholar]
  20. Mo, L.; Li, L.; Shu, L. Application of unsupervised fuzzy clustering algorithm in image recognition. Autom. Technol. Appl. 2020, 39, 121–124+159. [Google Scholar]
  21. Newman, M.; Girvan, M. Finding and evaluating community structure in networks. Phys. Rev. E 2004, 69, 026113. [Google Scholar] [CrossRef] [PubMed]
  22. Blondel, V.D.; Guillaume, J.L.; Lambiotte, R.; Lefebvre, E. Fast unfolding of communities in large networks. J. Stat. Mech. Theory Exp. 2008, 2008, P10008. [Google Scholar] [CrossRef]
  23. Newman, M.E.J. Fast algorithm for detecting community structure in networks. Phys. Rev. E 2004, 69, 066133. [Google Scholar] [CrossRef] [PubMed]
  24. Zhou, T.; Xu, W.; Wang, N.; Shao, W. Multi-objective siting and sizing of distributed generation planning based on improved particle swarm optimization algorithm. Comput. Sci. 2015, 42, 16–18, 31. [Google Scholar]
  25. Chai, Y.; Guo, L.; Wang, C. Network partition and voltage coordination control for distribution networks with high penetration of distributed PV units. IEEE Trans. Power Syst. 2018, 33, 3396–3407. [Google Scholar] [CrossRef]
  26. Newman, M.E.J. Modularity and community structure in networks. Proc. Natl. Acad. Sci. USA 2006, 103, 8577–8582. [Google Scholar] [CrossRef] [PubMed]
  27. Cotilla-Sanchez, E.; Hines, P.D.H.; Barrows, C.; Patel, M. Multi-attribute partitioning of power networks based on electrical distance. IEEE Trans. Power Syst. 2013, 28, 4979–4987. [Google Scholar] [CrossRef]
  28. Wang, J.; Zhang, Y.; Wang, C.; Sun, J.; Jin, Z.; Xu, F.; Du, X. Power system reactive power/voltage assessment based on sensitivity analysis and optimal power flow. Power Syst. Technol. 2005, 29, 65–69. [Google Scholar]
  29. Holland, J. Adaptation in Natural and Artificial Systems: An Introductory Analysis with Application to Biology, Control, and Artificial Intelligence; Control & Artificial Intelligence; MIT Press: Cambridge, MA, USA, 1992. [Google Scholar]
  30. Srinivas, M.; Patnaik, L.M. Adaptive probabilities of crossover and mutation in genetic algorithms. IEEE Trans. Syst. Man Cybern. 1994, 24, 656–667. [Google Scholar] [CrossRef]
  31. Kashem, M.A.; Ganapathy, V.; Jasmon, G.B.; Buhari, M.I. A novel method for loss minimization in distribution networks. In Proceedings of the International Conference on Electric Utility Deregulation and Restructuring and Power Technologies, London, UK, 4–7 April 2000; pp. 251–256. [Google Scholar]
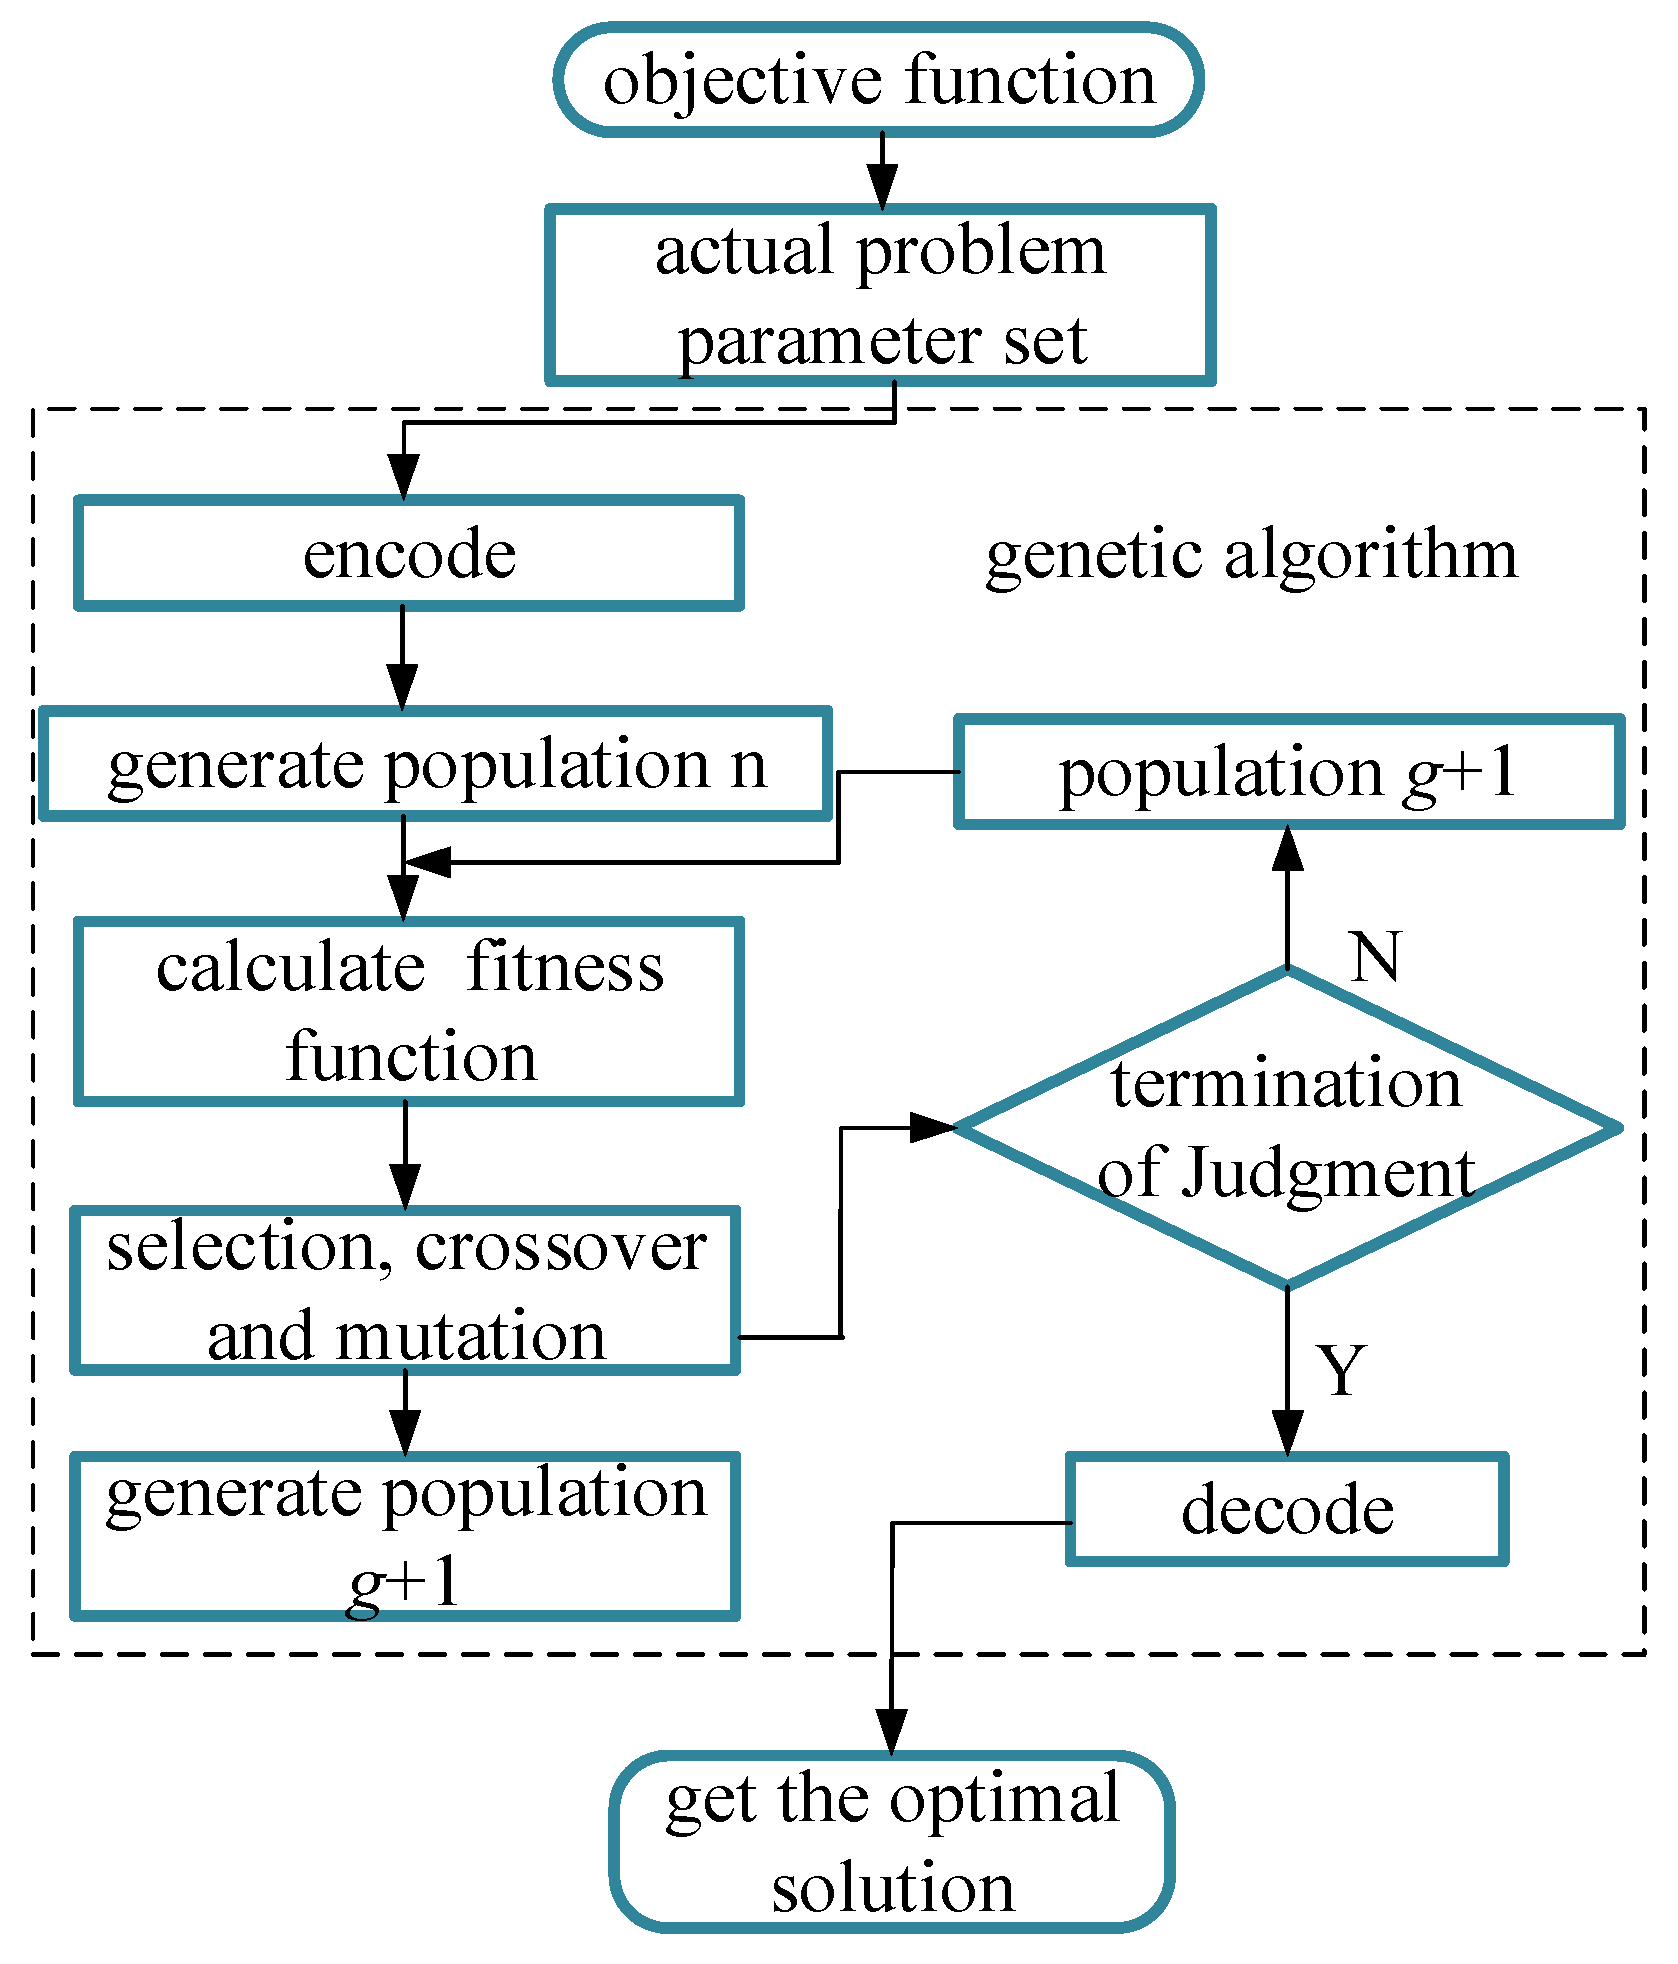
Figure 1. Framework of GA.
Energies 17 02893 g001
Figure 2. Encoding process based on improved GA.
Energies 17 02893 g002
Figure 3. Initialization process based on improved GA.
Energies 17 02893 g003
Figure 4. An 18-node photovoltaic simulation module.
Energies 17 02893 g004
Figure 5. Distributed PV power generation network topology.
Energies 17 02893 g005
Figure 6. Characteristic curve of photovoltaic module array.
Energies 17 02893 g006
Figure 7. Single PV array power output curve.
Energies 17 02893 g007
Figure 8. Output of active power from 11 PV nodes.
Energies 17 02893 g008
Figure 9. Initial net power of each load node.
Energies 17 02893 g009
Figure 10. Cluster performance with weight variation. (a) Modularity Index Characteristics Curve. (b) Active Power Balance Index Characteristics Curve.
Energies 17 02893 g010
Figure 11. Cluster division result schematic diagram.
Energies 17 02893 g011
Figure 12. Adaptation of fitness with iteration count.
Energies 17 02893 g012
Table 1. MGA programming flowchart.
1 Input—Load data from PV nodes, including PV output
—Obtain the matrix using Equations (7) and (8)
—Calculate the matrix Aij using Equation (15)
—Calculate the edge weight matrix Bij based on the electrical distance using Equation (6)
—Set the uniform crossover probability ρ = 0.5
2 MGA—Initialize the number of individuals N and calculate the fitness
Repeat
   —Perform crossover, mutation, and selection operation using Equations (16)–(26);
   —Calculate the modularity and active balance metrics using Equations (1), (10), (14), respectively;
   —Update the maximum values of F1 and F2;
   —Calculate the optimal fitness and save matrix Aij.
Until the stop conditions that g > gmax or |F(f1(g), f2(g)) − F(f1(gk), f2(grk))| ≤ ξ (kgmax)
3 Output—Obtain the final matrix Aij, and obtain the optimal fitness, modularity and cluster partitioning
Table 2. IEEE 33-bus system node voltage limits.
Node TypeLower Voltage Limit (p.u)Upper Voltage Limit (p.u)Node Number
Balancing node (1 node)0.91.11
PQ node0.91.12–33
Table 3. The performance with different weights for cluster division.
Numberλ1λ2f1f2F
10.30.70.7560.7600.7588
20.40.60.7940.7400.7616
30.50.50.8470.7360.7915
40.60.40.8560.7280.8048
50.70.30.8590.6610.7996
Table 4. Comparison of results from different partitioning algorithms.
AlgorithmTimeModularityNumber of Clusters
Louvain 1.00 s0.78667
FN 0.024486 s0.67938
FCM 0.345 s0.61526
K-means 1.206 s——5
Our1.046 s0.85603
Table 5. Partitioning results under different performance indicators.
IndicatorsCluster NumberNode φ P φ P /n Δ φ P σm
Dual Performance Indicators12, 3, 23, 24, 25, 19, 20, 21, 220.59650.59830.00180.7480
24, 5, 6, 7, 8, 26, 27, 28, 29, 30, 31, 32, 330.62680.0285
39, 10, 11, 12, 13, 14, 15, 16, 17, 180.57150.027
Single Modularity Indicator12, 19, 20, 21, 220.54150.59240.05090.7555
23, 23, 24, 250.58660.0058
34, 5, 6, 7, 8, 26, 27, 280.61020.0178
429, 30, 31, 32, 330.54780.0446
59, 10, 11, 12, 13, 14, 15, 16, 17, 180.67510.0827
Disclaimer/Publisher’s Note: The statements, opinions and data contained in all publications are solely those of the individual author(s) and contributor(s) and not of MDPI and/or the editor(s). MDPI and/or the editor(s) disclaim responsibility for any injury to people or property resulting from any ideas, methods, instructions or products referred to in the content.