1. Introduction
The insulated pull rod is a crucial insulating component in gas-insulated, metal-eclosed switchgears (GISs) characterized by its slender, elongated structure and frequent involvement in disconnection scenarios [
1,
2,
3,
4,
5]. In operational conditions, it is subjected to significant mechanical stress and impact vibrations, necessitating superior electrical insulation and mechanical strength [
2,
6,
7,
8,
9]. The resin-impregnated fiberglass (RIF) process is instrumental in achieving these properties [
1,
10,
11,
12]. However, inadequacies in the design of the process or its parameters can lead to micro-defects, such as white spots, burrs, and poor surface infiltration, compromising the rod’s integrity [
2,
13,
14]. The presence of these micro-defects can distort the electric field, initiating micro-discharges and potentially leading to breakdown incidents. While various methods, including X-ray, non-destructive microwave, and ultrasonic tests, have been proposed for defect detection in insulation rods, comprehensive studies on the micro-discharge phenomena induced by these defects remain scarce [
2,
13,
14].
To advance our understanding of micro-discharge phenomena triggered by micro-defects in insulated pull rods, and given the experimental challenges in direct observation, we propose a comprehensive framework. This framework encompasses three main phases: initially, sections of the insulated pull rod harboring micro-defects are segmented via water jet cutting, followed by the examination of their surface microstructures through white light interferometry for physical characterization. Subsequently, we derive a correlation curve for charged particle density concerning the electric field within SF6 and air environments using a two-dimensional axisymmetric model of positive corona discharge from a needle to a plate electrode. The final stage involves the formulation of a micro-discharge model predicated on the observed microstructural characteristics and the derived correlation curves. Investigating micro-discharge attributes resulting from insulation rod micro-defects not only facilitates a theoretical comprehension of insulation failures but also lays the groundwork for developing theoretical models for the online monitoring of discharge signals associated with insulation pull rod defects.
2. Characterization of the Surface Defects on Insulated Pull Rods
The efficacy of the resin-impregnated fiberglass (RIF) technique is pivotal to ensuring the integrity of insulated pull rods [
10,
11,
12]. The comprehensive process entails several critical steps: Initially, fiberglass fabric is rolled into a cylindrical form and placed within a sealed mold. Subsequently, under a controlled vacuum applied at the top of the mold, liquid epoxy resin is simultaneously injected at a predetermined rate from a feeder at the bottom. The process concludes with the resin’s thorough impregnation and subsequent curing phase. A misalignment in the synchronization between the vacuum and resin injection rates can introduce air into the interface between the flowing resin and the mold’s interior, leading to areas of poor surface infiltration. This defect may manifest on either the inner or outer surfaces of the insulated pull rod, compromising its performance.
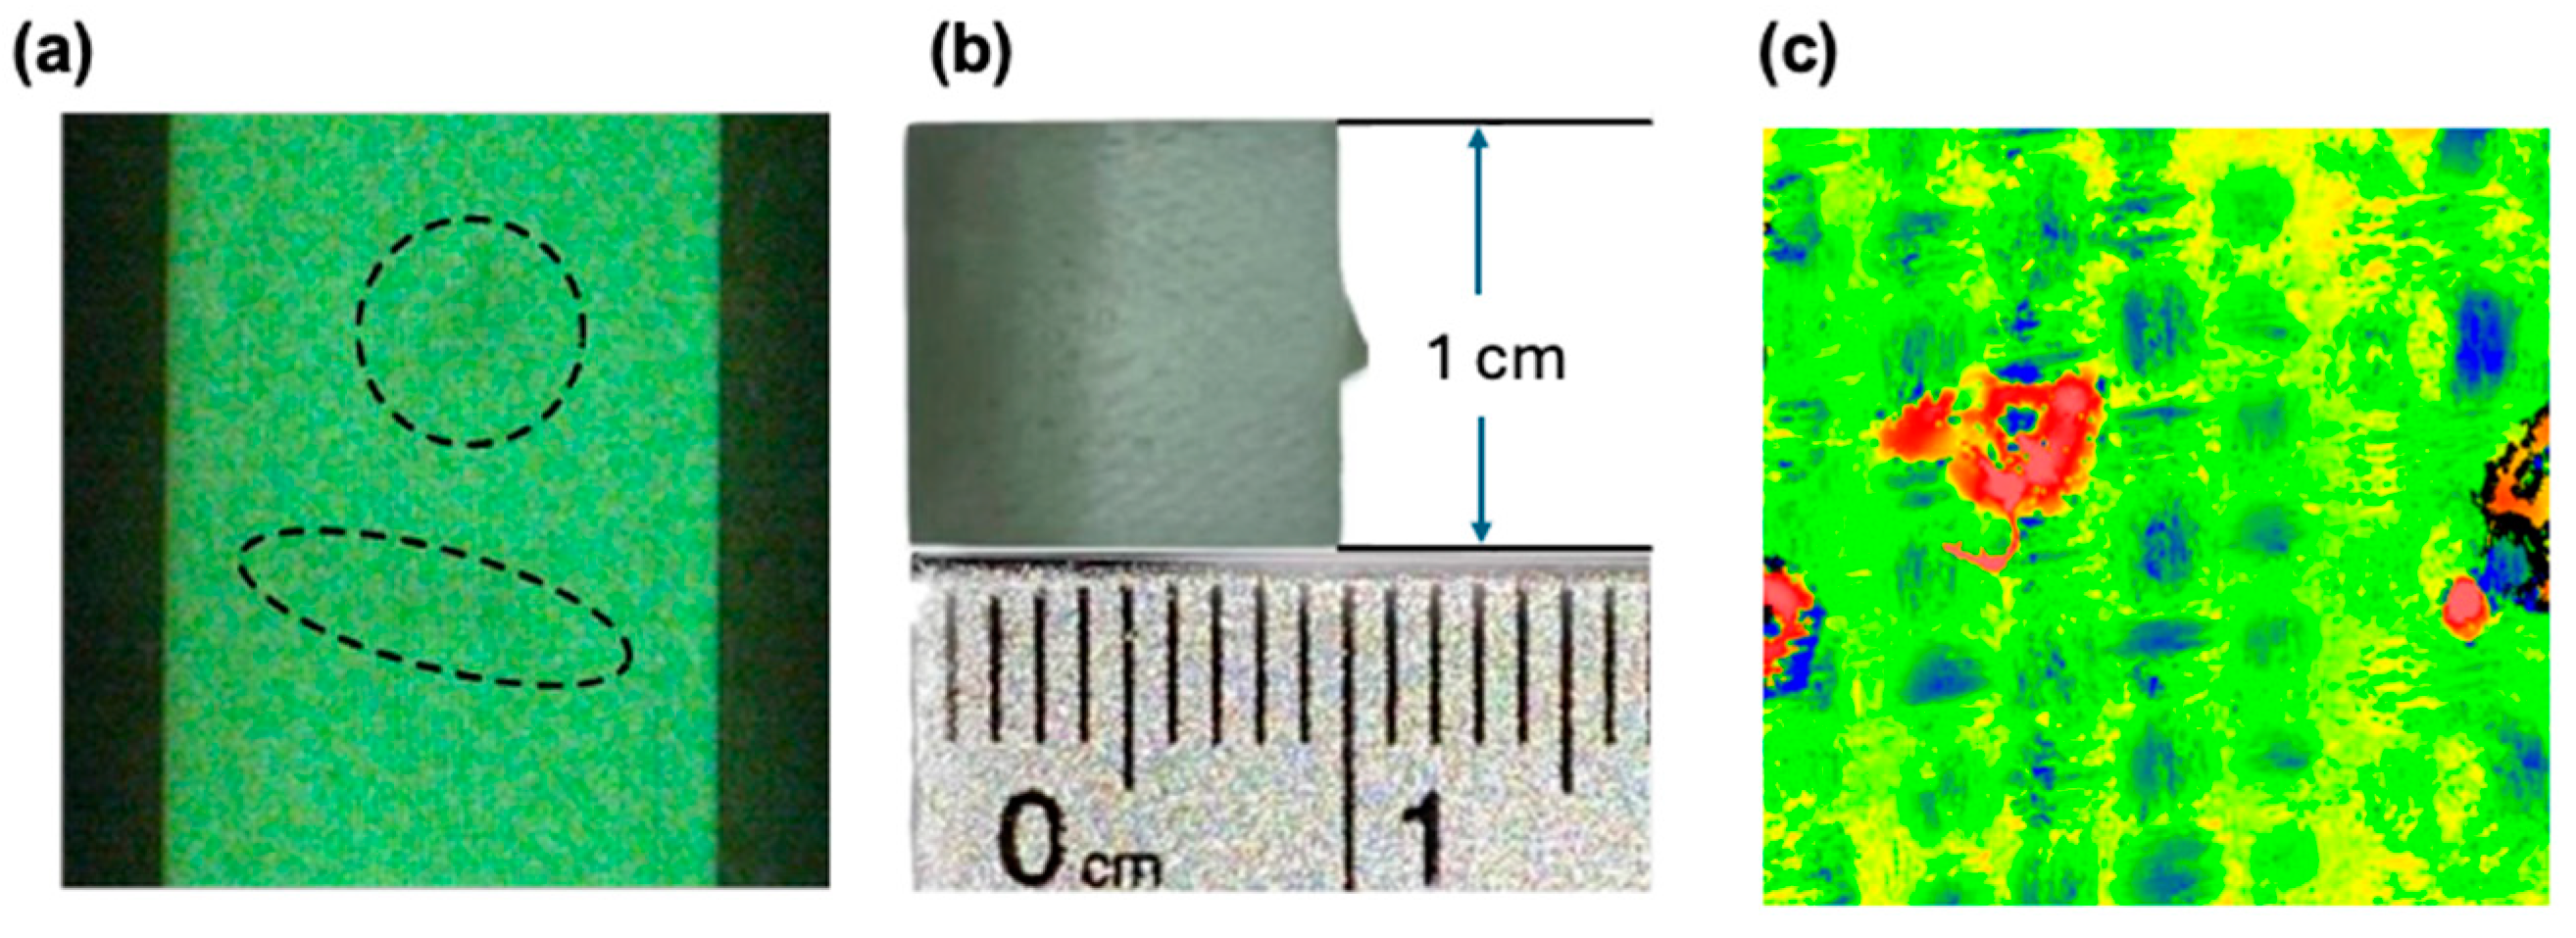
The predominant method for inspecting the quality of insulated pull rods is artificial visual inspection. This method, however, faces significant limitations in accurately distinguishing between inner poor infiltration defects and white spot defects. As shown in
Figure 1a, both defect types manifest as irregular, gray shadows in optical transmission imaging, differing markedly from the appearance of unaffected areas. Consequently, these defects are collectively categorized as white spot defects due to their visual similarity. Notably, a distinguishing factor is the generally higher grayscale intensity observed in the light transmission images of inner poor infiltration defects compared to white spot defects. Additionally, areas of poor outer surface infiltration are identifiable by a distinct rough texture upon tactile examination.
With the cooperation of the factory, we identified that the minor defects in the rods mainly include five categories: internal microcracks, internal bubbles, internal impurities, surface scratches, and surface glitches. Surface scratches primarily result from damage caused by sharp tools during transportation and assembly. Glitches mainly arise from residues of the demolding material on the rod’s surface during the demolding process. The main difference between the two is that scratches are more often inward depressions, while burrs protrude outward. Our study is mainly focused on surface glitch defects.
To elucidate the nature of poor infiltration defects and facilitate accurate three-dimensional reconstruction, a 10 mm × 10 mm × 2 mm square sample from the defective area of an insulated rod was extracted using water jet cutting. This preparation enabled the differentiation of internal surface infiltration defects from white spot defects.
Figure 1b showcases a section of the sample with poor surface infiltration, characterized by a macroscopically rough surface texture. Notably, these internal defects, sealed within the rod during assembly, are exposed to air under operational conditions, whereas external defects are in contact with SF
6 gas.
Microscopic examination through white light interferometry revealed that these defects consist of densely packed protrusions (
Figure 1c). In the image, the red areas represent the burrs on the surface, while the surrounding green areas indicate the smooth parts of the sample. Additionally, there are some interlaced blue sections aside from the green parts. This is because the sample is a mixture of epoxy resin and glass fibers, which possess a certain level of translucency. Therefore, during white light interferometry, some light passes through the sample, causing interference. The blue areas in the image reflect the internal glass fiber framework. However, since these areas are largely opaque, this does not affect the results of the white light interferometry. The resulting surface roughness metrics are as follows: S
a (arithmetic mean surface roughness) = 6.592 μm; S
q (root mean square surface roughness) = 10.005 μm; and S
Z (peak-to-valley height) = 159.921 μm. These measurements provide a quantitative basis for the textural characterization of poor infiltration defects.
3. Analysis of Defects under Operational Conditions
Extensive literature highlights that a set of three continuity equations, representing electrons, positive ions (SF
6+/O
2+), and negative ions (SF
6−/O
2−), integrated with Poisson’s equation, can be used to effectively model and elucidate the dynamics of positive corona discharge [
15,
16,
17]. This study considers four charged species: electrons, positive ions, negative ions, and photoelectrons. Equations (1)–(5) delineate our mathematical framework, incorporating the drift–diffusion of these species while accounting for their generation, drift, and dissipation. The source terms within these equations include crucial processes such as ionization, electron attachment, recombination, and photoelectron absorption. Poisson’s equation facilitates the computation of electric field distribution. Additionally, the Helmholtz equation is employed to depict the light absorption curve, approximated as a sum of series, providing a fit to the empirical data.
where
t (s) is time;
ne,
nn,
np,
μe,
μn,
μp,
De,
Dn,
Dp are the different densities (m
−3), mobilities (m
2V
−1s
−1), and diffusion coefficients (m
2s
−1) of electrons, positive ions, and negative ions; and
α (m
−1) and
η (m
−1) are the ionization and attachment coefficients, respectively.
kep (m
3s
−1) and
knp (m
3s
−1) represent the recombination coefficient of positive ions with electrons and the recombination of positive ions with negative ions.
V,
e, and
ε0 denote the applied voltage (V), the electron charge (C), and the vacuum permittivity (F·m
−1), respectively.
(V·m
−1) represents the electric field intensity vector.
Aj (cm
−2Torr
−2) and
λj (cm
−1Torr
−1) represent the fitting parameter, and the photoionization term in equation
j is represented as
Sph (mol·m
−3s
−1).
PSF6 (Torr) represents the pressure of SF
6,
Iph (mol·m
−3s
−1) represents the photoionization radiation coefficient.
Morrow has presented a detailed collection of reliable data on the basic transport properties of SF
6 and the approximate analytical interpolation of the coefficients [
18,
19].
Table 1 and
Table 2 show the parameters used in the simulation under air and SF
6.
This study employs a 2D axisymmetric needle-to-plate electrode model to investigate positive corona discharge phenomena in SF6 and air environments. Both gases are simulated under specific conditions: SF6 at a pressure of 0.4 MPa and air at 0.1 MPa, filling the gap between the needle and plate electrodes, with the corresponding temperature being room temperature (300 K). The geometric configuration for both gas settings is identical, featuring a needle tip curvature of 0.1 mm and a 100 mm gap between the needle tip and the plate electrode. A positive voltage ranging from 1 to 10 kV is applied to catalyze the positive corona discharge in both gases.
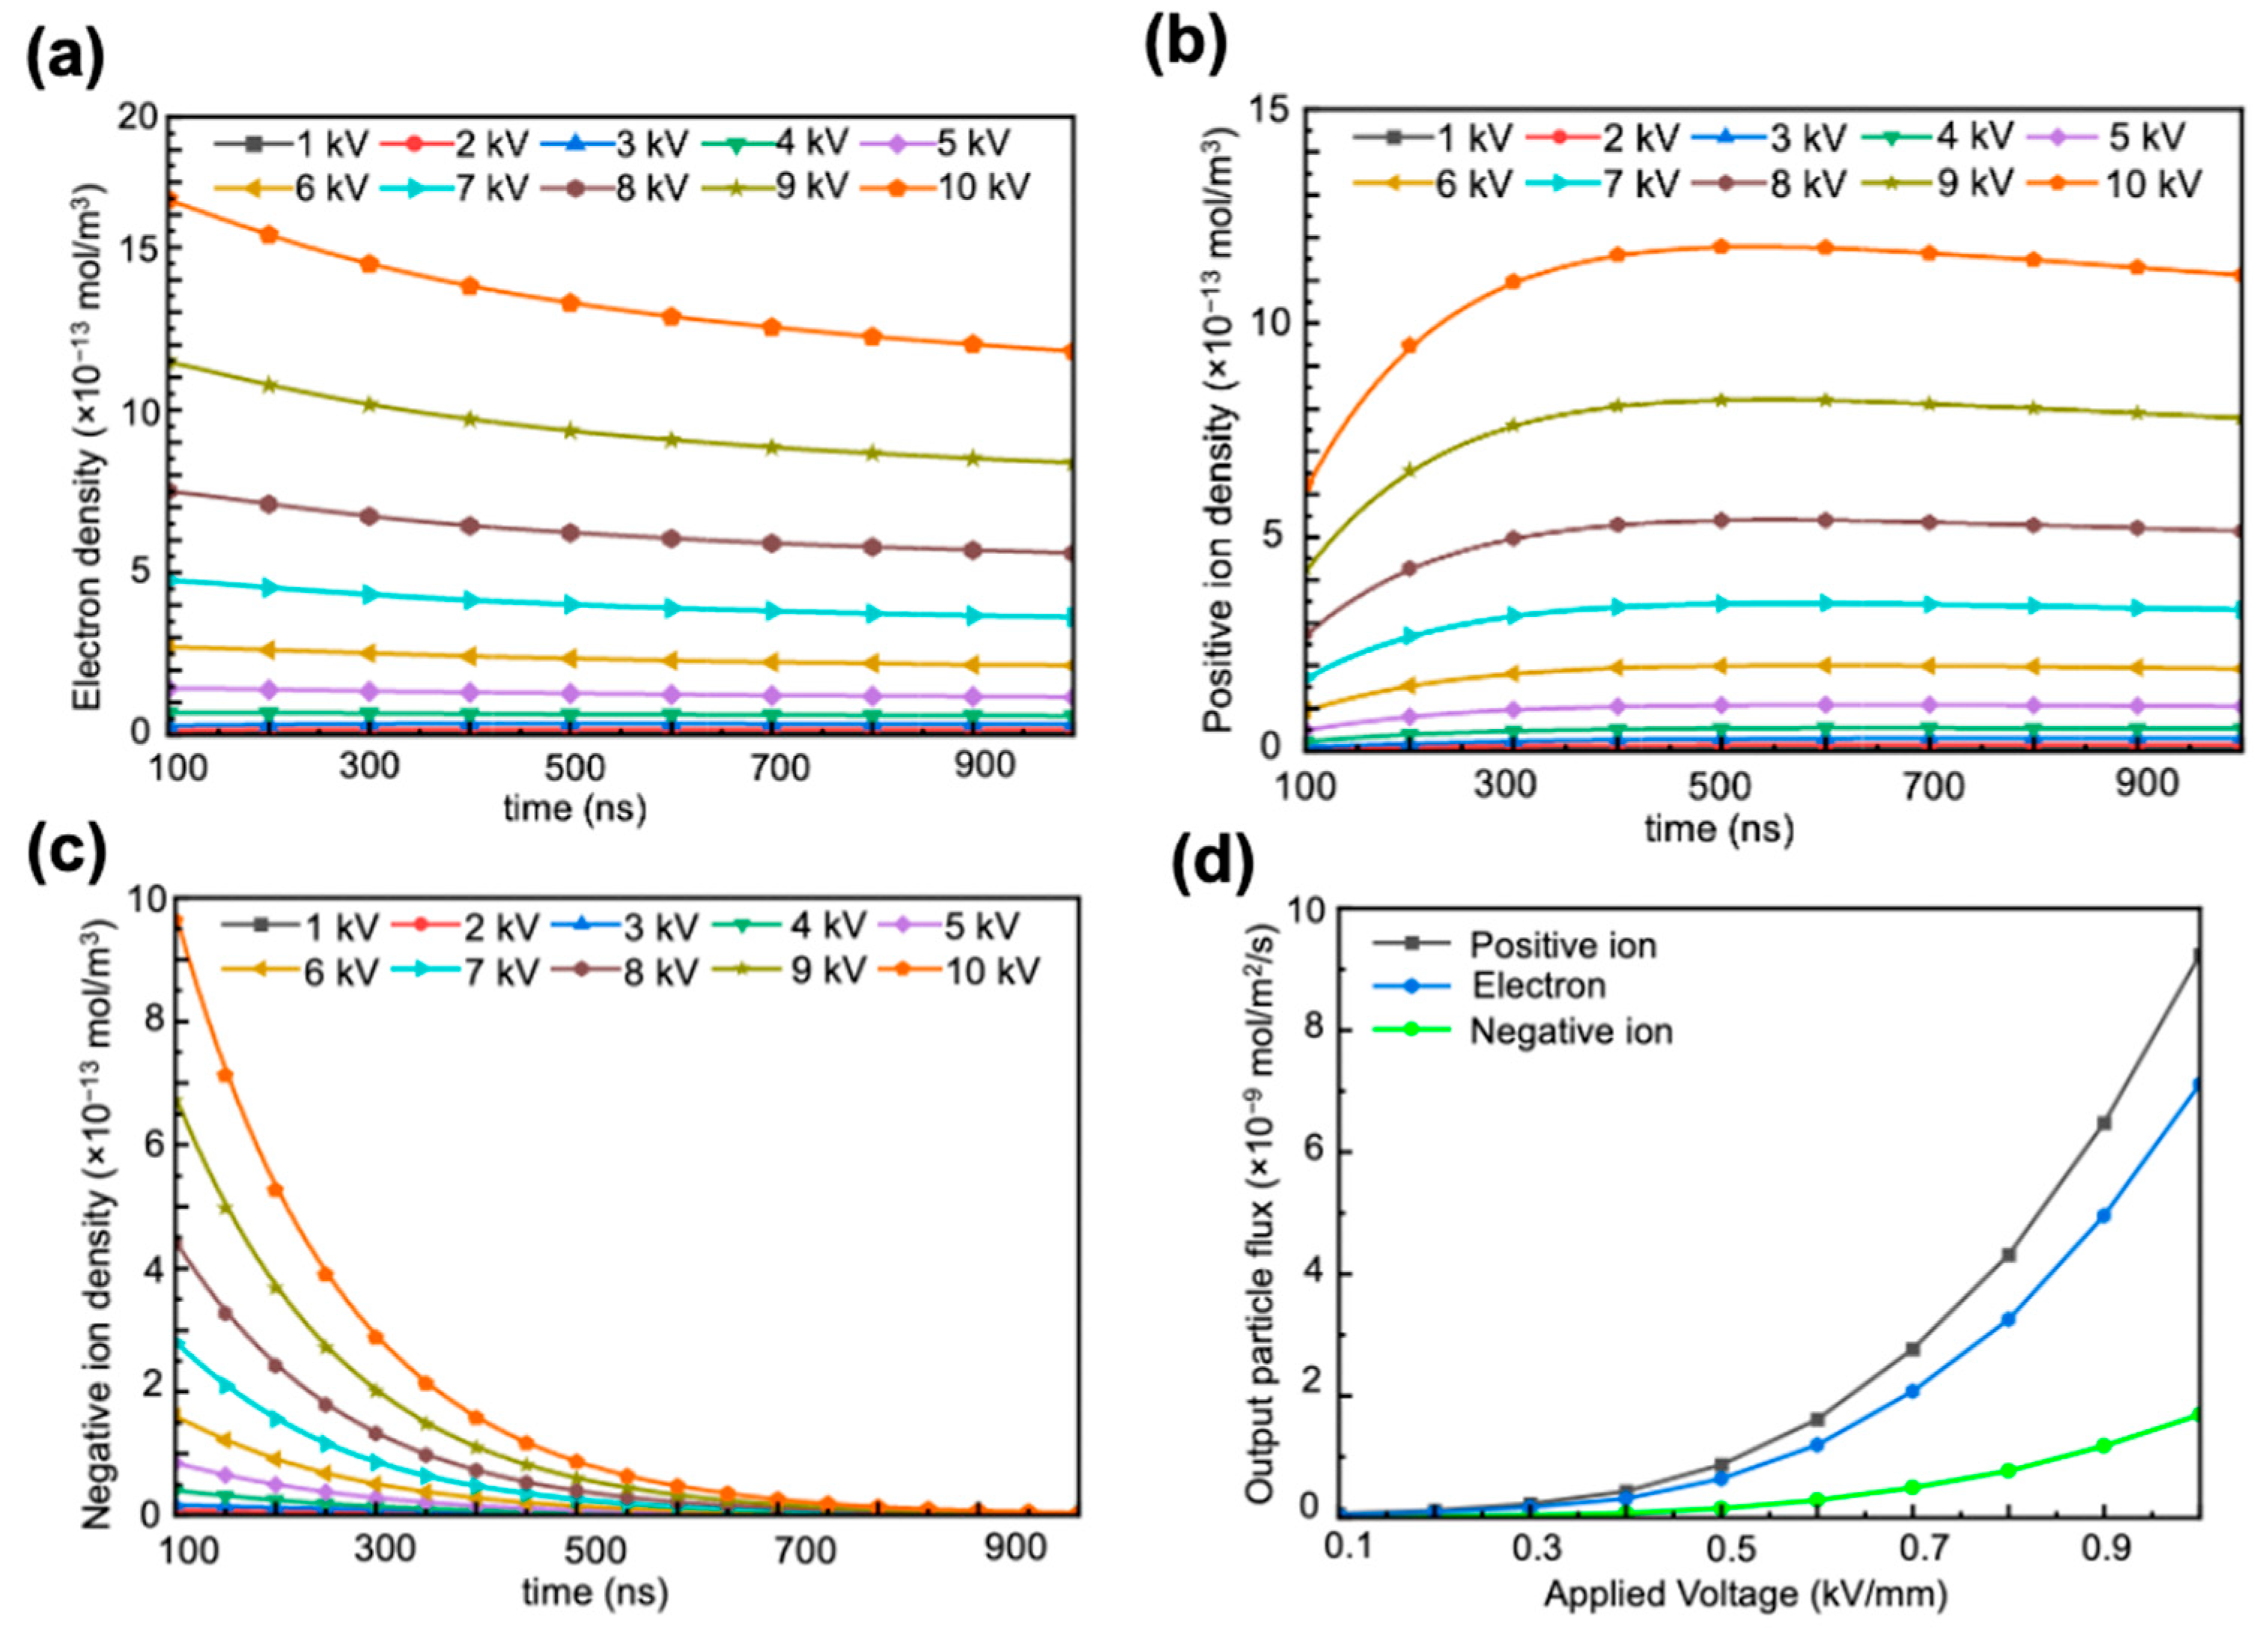
The study quantitatively captures the dynamics of positive corona discharge by plotting the variation in the total numbers of SF
6 electrons, negative ions, and positive ions across a discharge cycle spanning 100 ns to 1000 ns, illustrated in
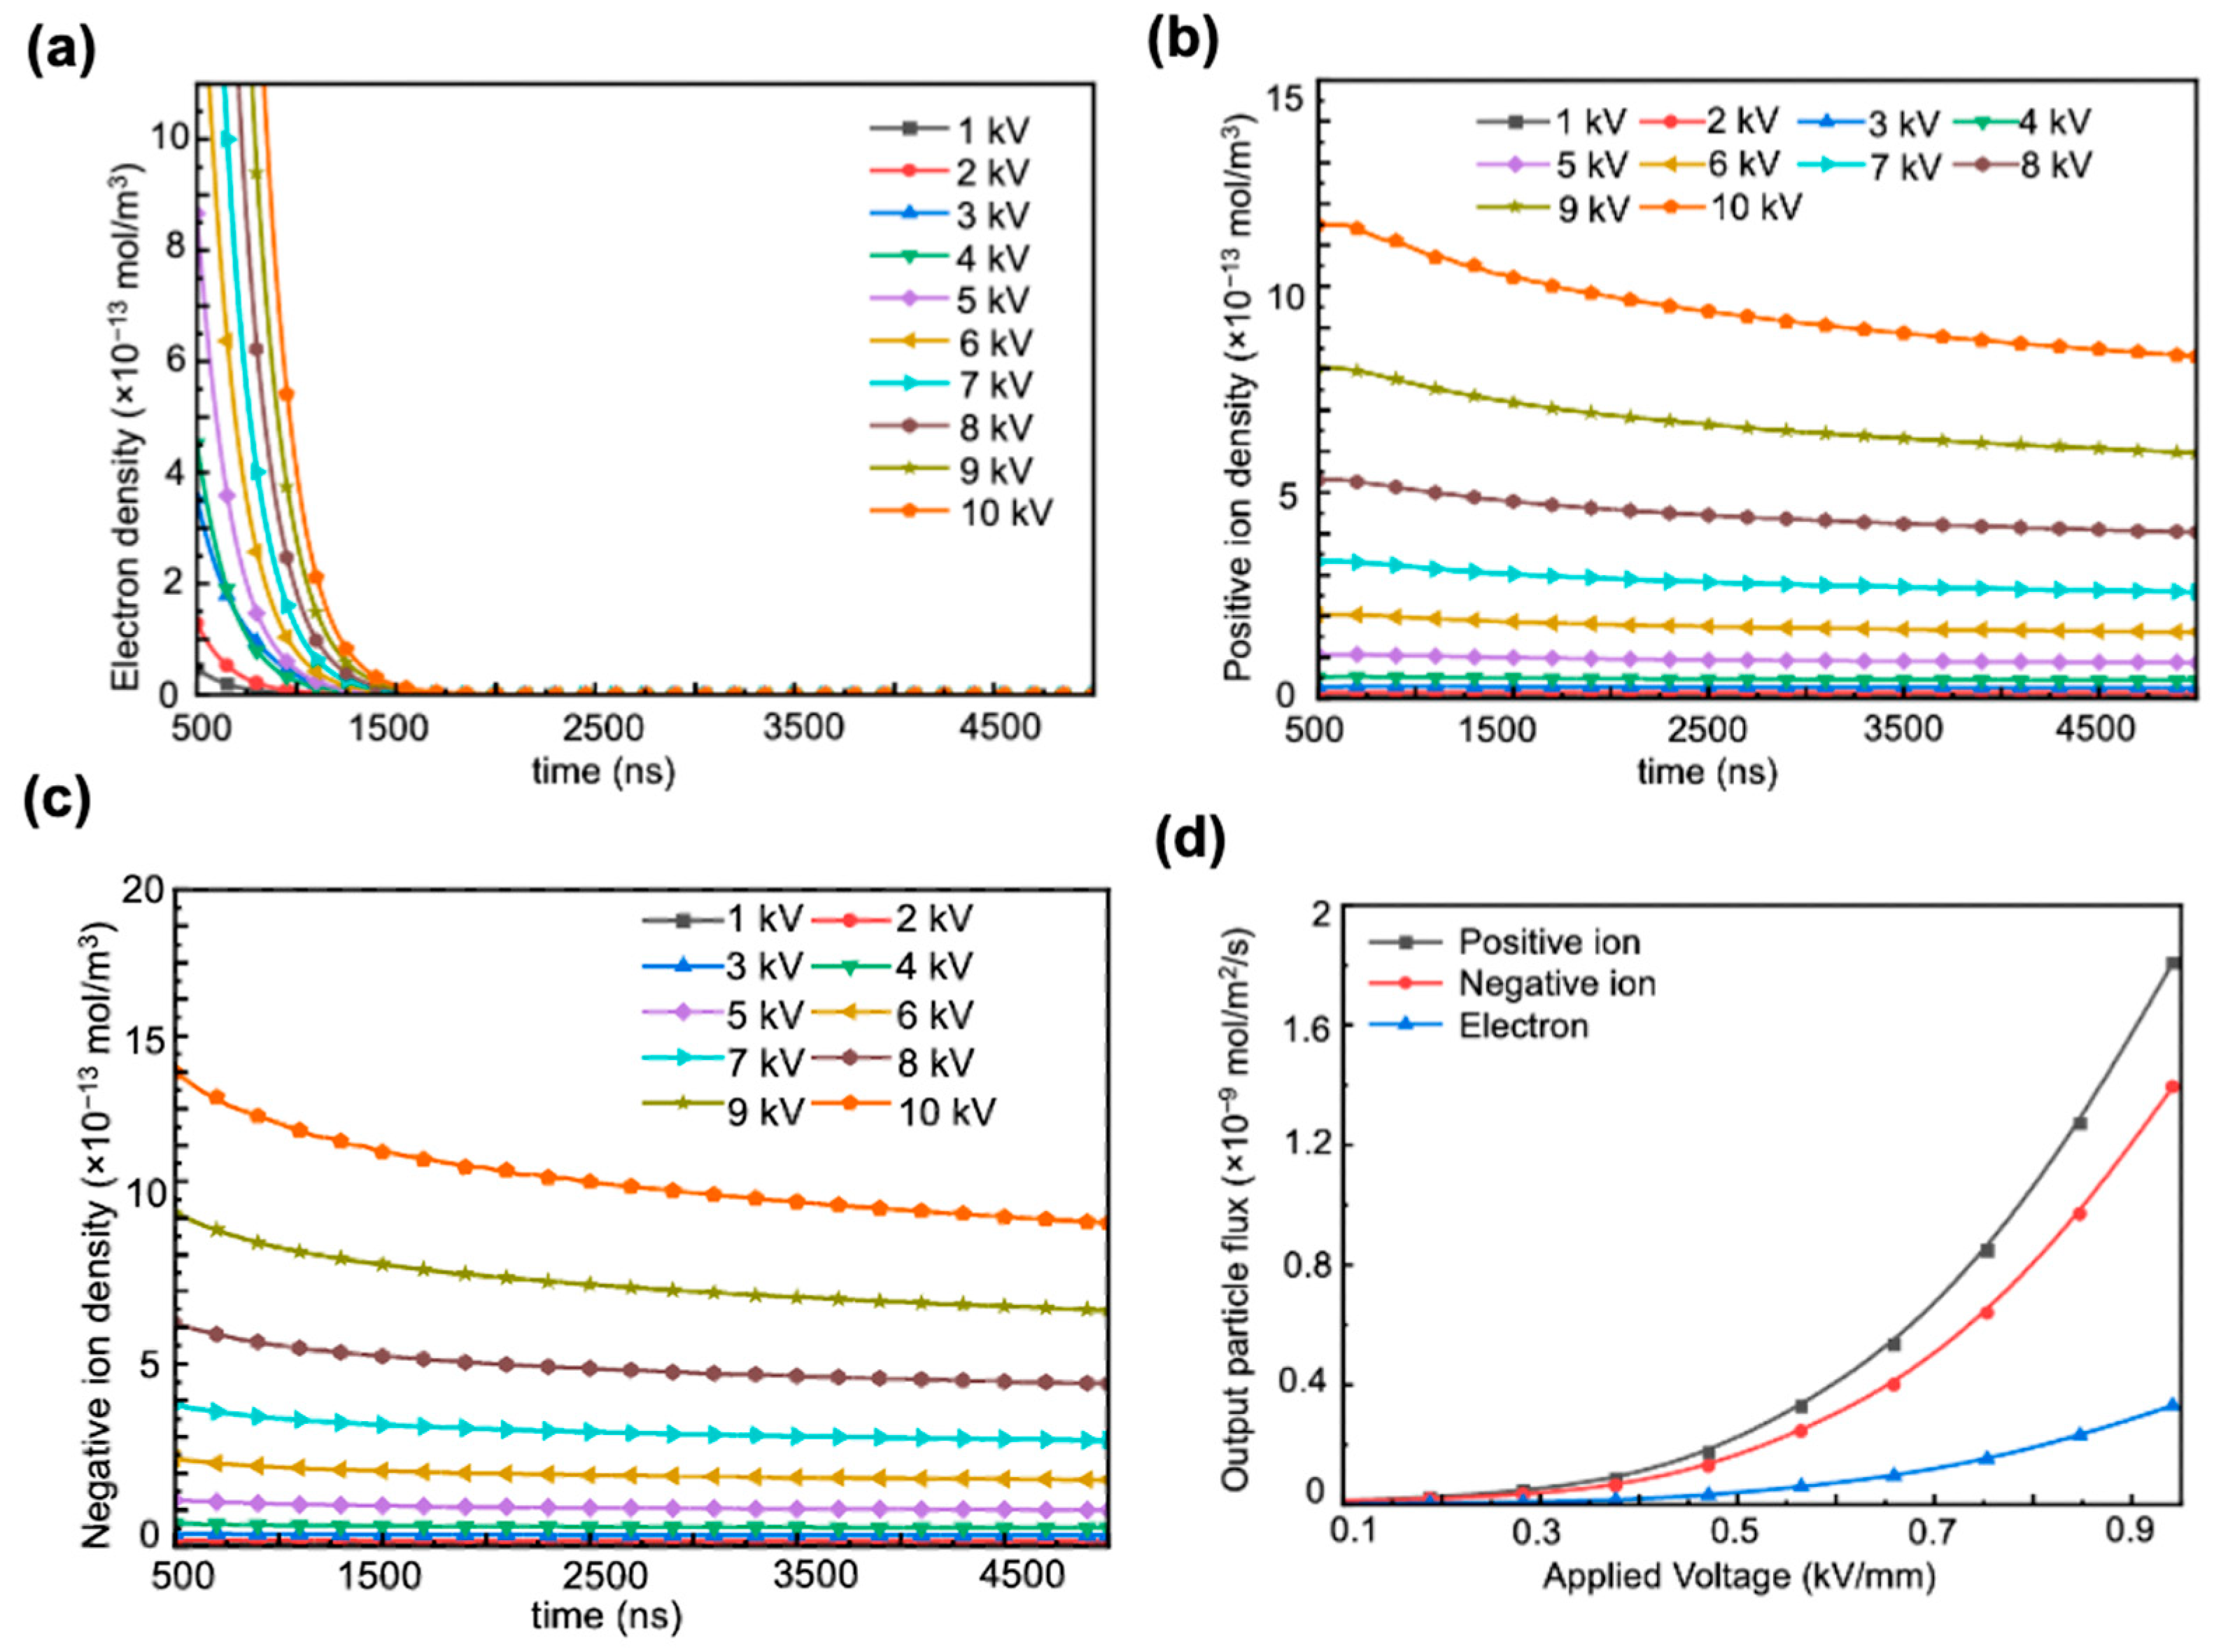
Figure 2. Similarly, for air, the total counts of electrons, negative ions, and positive ions over a discharge cycle ranging from 500 ns to 5000 ns are documented, as shown in
Figure 3. The data points reflect the results of the simulation. The lines connecting these data points are fitting curves based on quadratic interpolation of the data points. These are used to predict missing data values. It can be observed that the positive corona discharge intensity of SF
6 and air gradually increases with the voltage applied to the needle electrode.
As the discharge progresses to 100 ns for SF6 and 500 ns for air, the rate of change in the total particle count of both gases stabilizes, eventually reaching a steady concentration. This stability allows for the calculation of particle density by dividing the steady-state total particle count by the volume of the integral domain of each gas environment. The flux of particles generated near the glitch defect is then calculated for the next step analysis. Here, our statistical method involves using the needle tip as the center to define a circle with a radius of 2 cm as the statistical area. The electric field strength within this area is considered the true electric field strength. We measure the electron density, positive ion density, and negative ion density within this area over a time interval of 0–5000 ns as the particle yield.
4. Micro-Discharge Analysis in Air and SF6 Environments under Operational Conditions
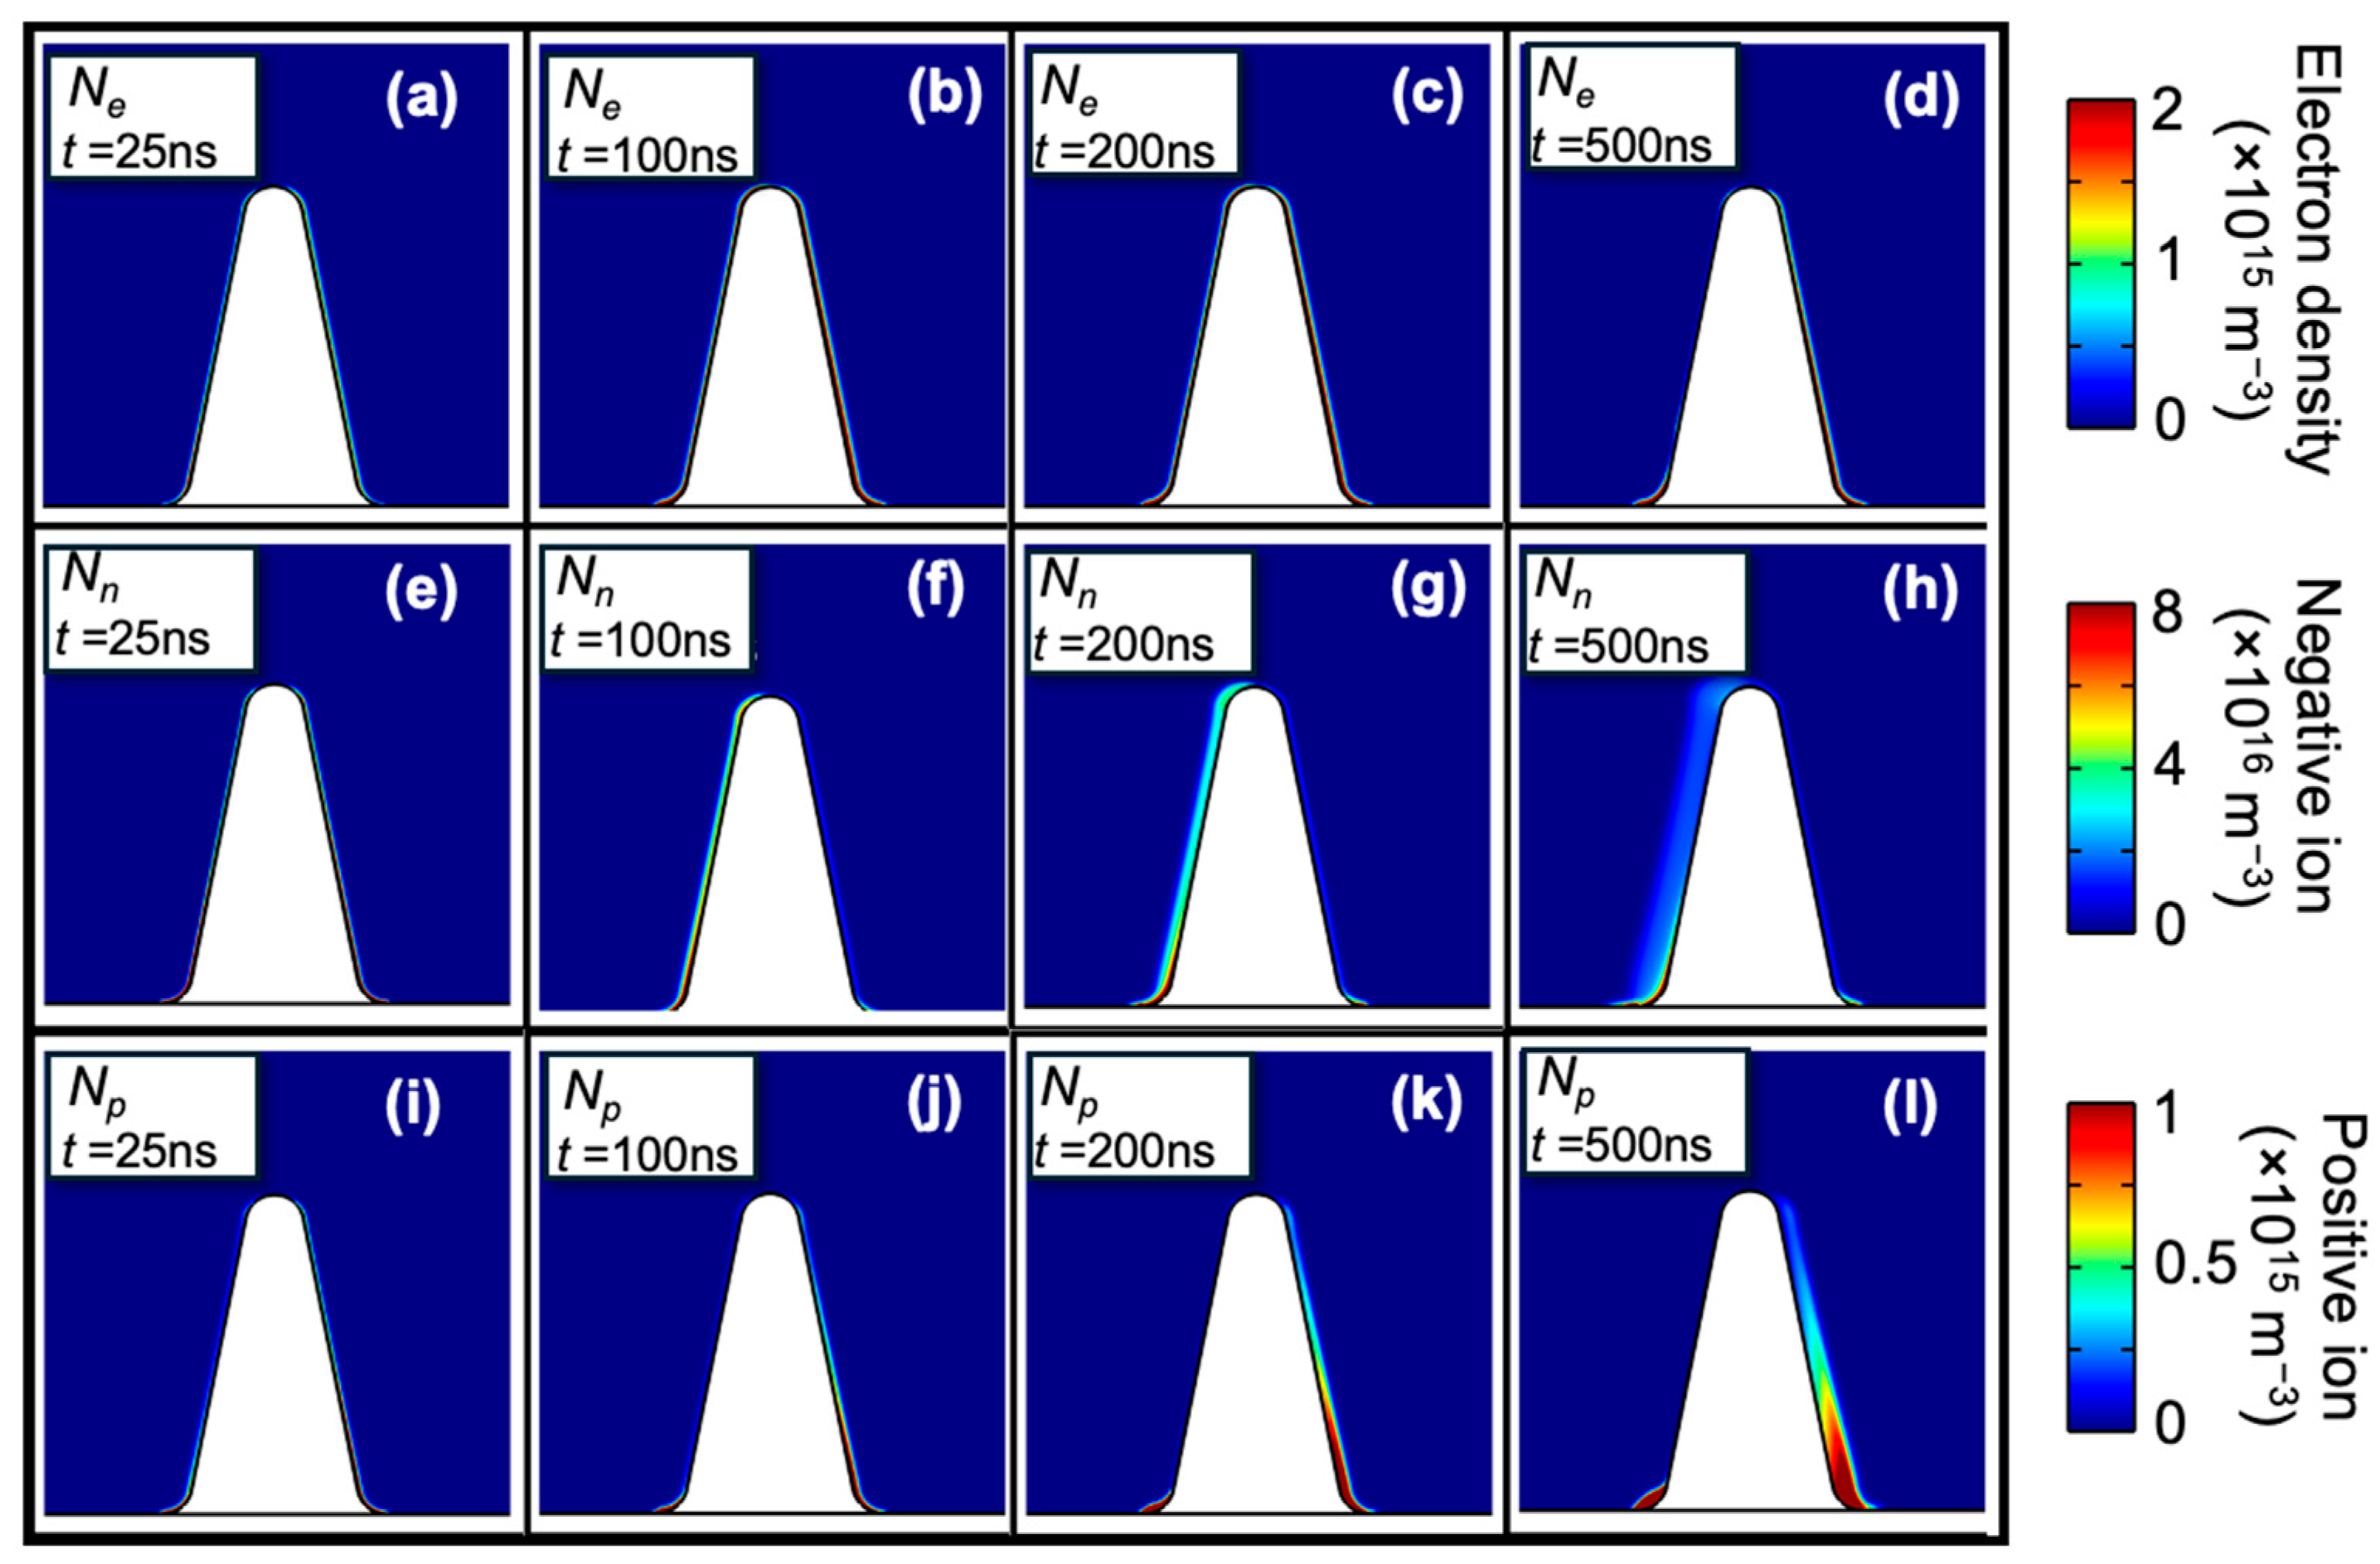
We employed the charge generation rates near the detected defects to simulate the pulling rod under operational conditions. The simulation structure is depicted in
Figure 4. Initially, the discharge process within SF
6 was simulated. To further investigate the dynamics and distribution of charged particles during the micro-discharge development process, an analysis was conducted at four critical time points:
t = 25 ns,
t = 100 ns,
t = 200 ns, and
t = 500 ns.
In the initial stage (up to 100 ns), the charge distribution concentrated near the glitch defect, allowing only a few electrons to gain enough kinetic energy to initiate ionization and attachment reactions with neutral molecules. Electrons, positive ions, and negative ions were distributed evenly around the defect, as depicted in
Figure 5a,e,i.
As the micro-discharge developed, electrons predominantly migrated to the left side of the defect, counter to the electric field’s direction, indicating the progression into later stages. SF6’s strong electronegativity plays a crucial role here, significantly enhancing electron adsorption and influencing electron density distribution throughout the micro-discharge process. Electron density peaks were observed at the defect’s left corner and right wall, creating a distinct electron cloud layer. Despite moving against the initial electric field, electrons accumulate at these points. Some electrons lose their kinetic energy upon colliding with the defect’s right wall, adhering to the surface and increasing electron density in this area.
Conversely, the left wall of the defect, where electron movement originates, witnesses interactions between electrons and neutral particles, producing additional positive ions and electrons. This leads to a high concentration of electron density at the left corner. However, the tendency of electrons to combine with neutral particles to form negative ions results in a lower electron density on this side.
Here, we did not consider the impact of moisture in the gas environment on the discharge at defect locations. However, in actual operation, the moisture in the gas environment can affect the defects in two main ways: the presence of moisture can influence discharge parameters such as the discharge ionization coefficient, affecting the actual discharge process; furthermore, the rod’s surface can absorb moisture, increasing its surface conductivity, thereby facilitating easier migration of the charges produced by discharges across the surface.
During the SF6 micro-discharge process, the density distribution of negative ions illustrates that SF- is predominantly formed by electron adsorption in SF6. Initially, electrons near the defect are captured, generating negative ions that subsequently move opposite to the electric field’s direction, diffusing away from the left wall of the defect. This pattern suggests that negative ions are consistently produced and dispersed outward from the defect throughout the micro-discharge.
In the case of positive ions in SF6, they are primarily created when SF6 molecules collide with electrons, resulting in their detachment. Throughout the micro-discharge, there is a noticeable concentration of positive ions along both the left and right walls of the defect. These ions show a tendency to diffuse slightly outward, aligning with the electric field’s direction. Unlike electrons and negative ions, however, their diffusion is less extensive.
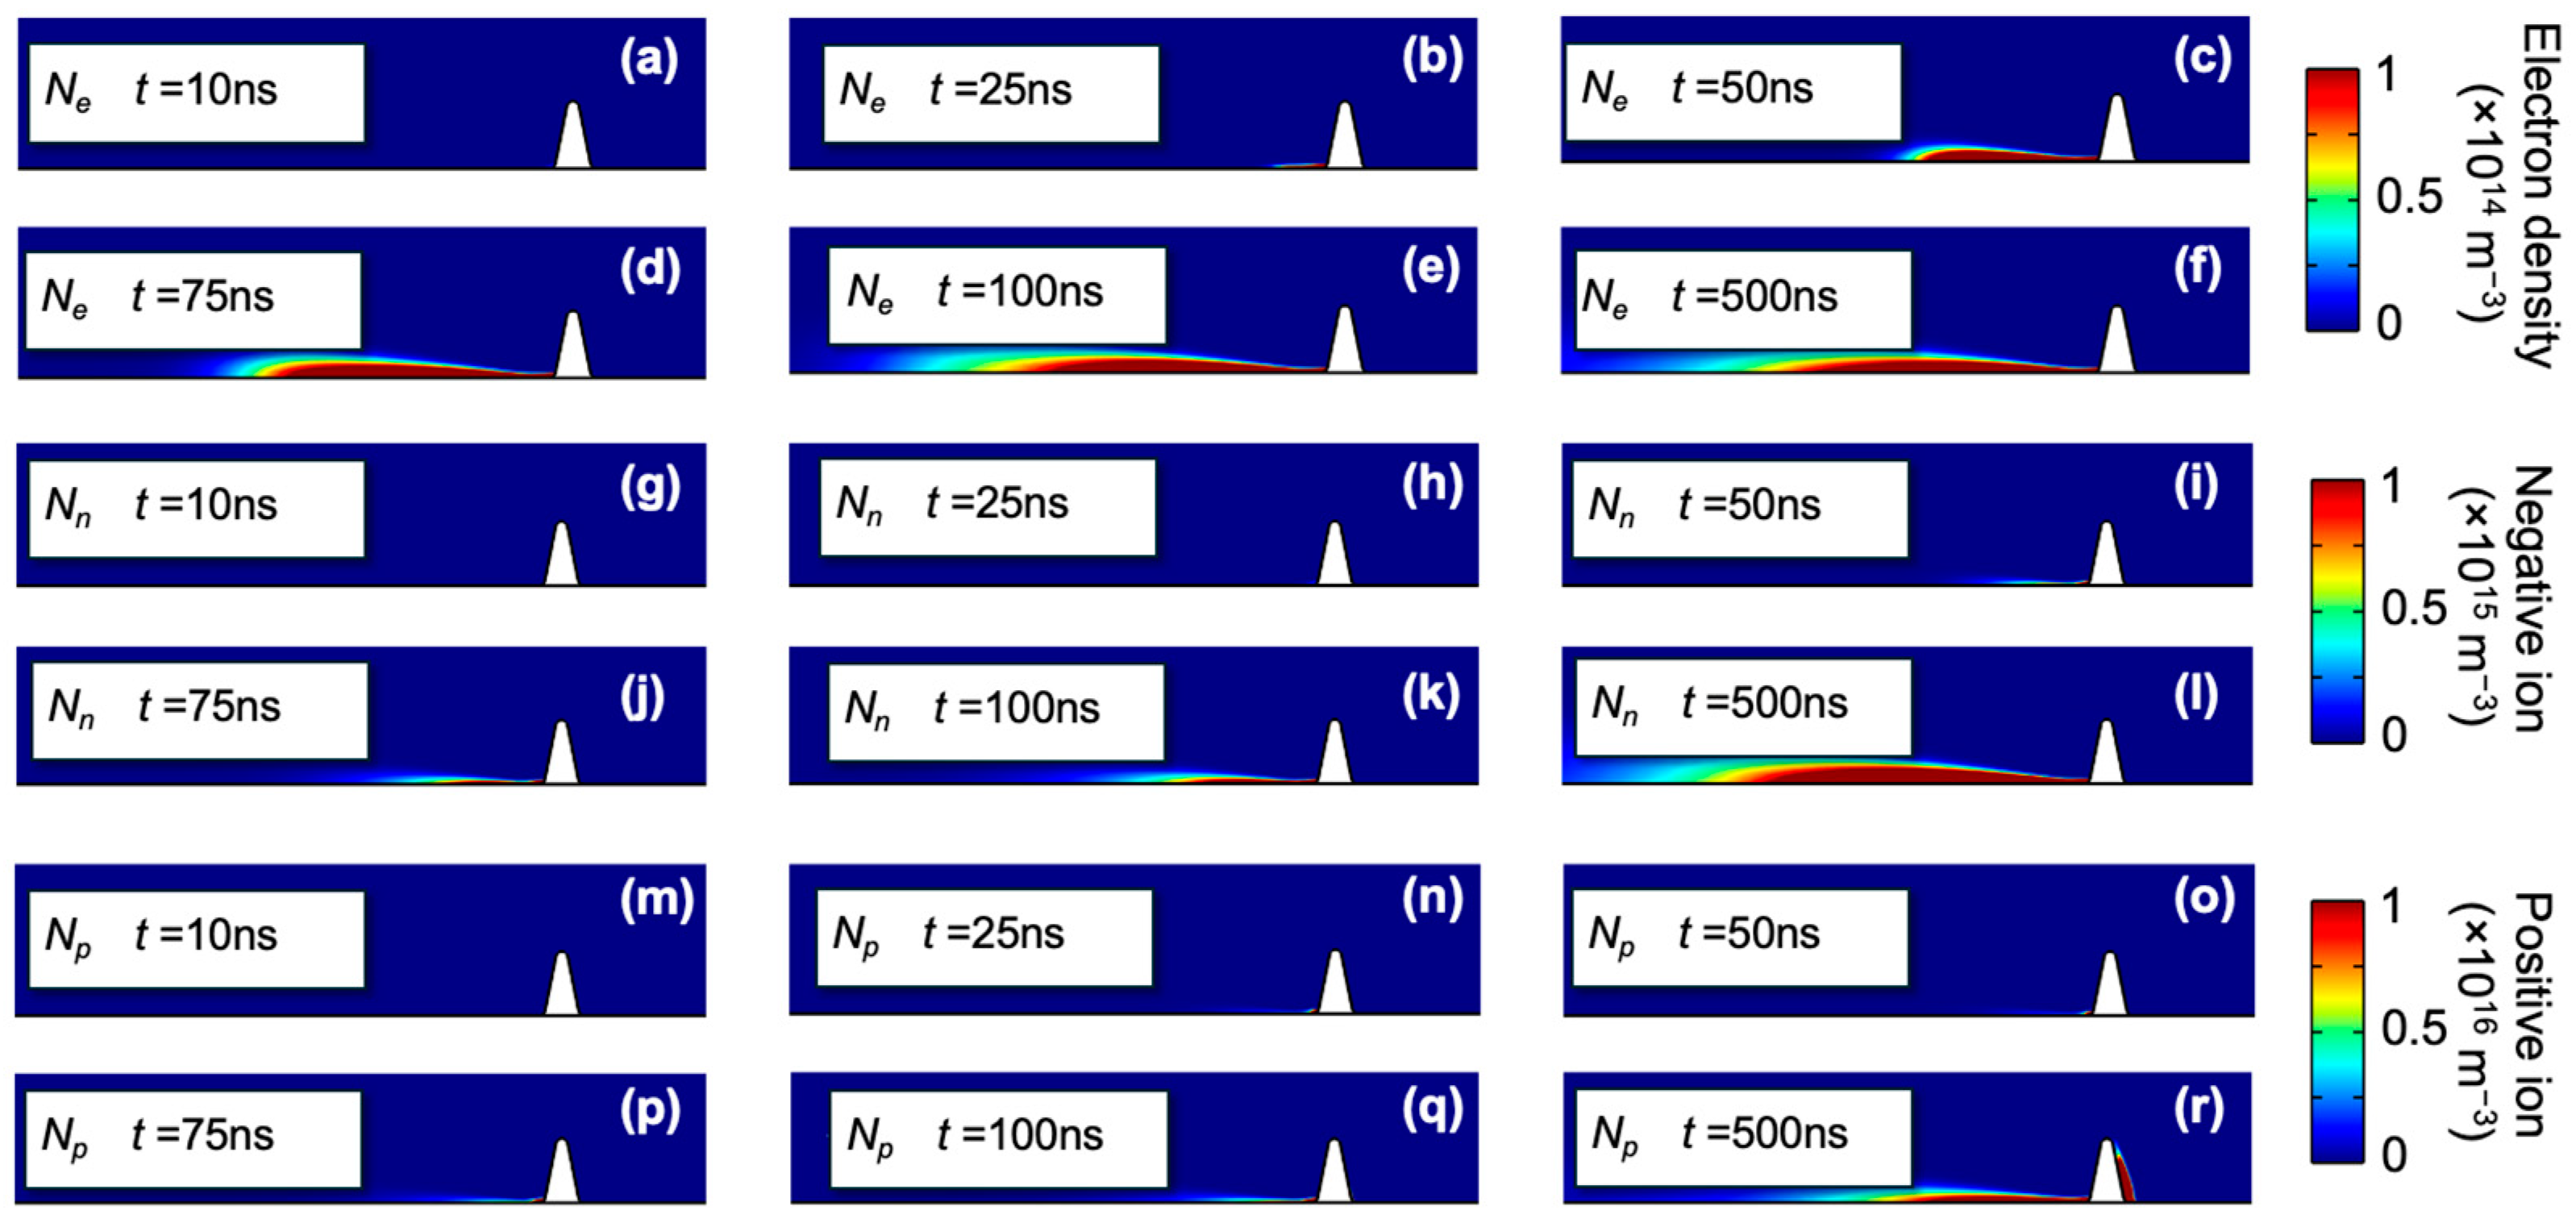
In an air environment, the intensity of micro-discharge around poorly insulated defects is higher than in SF
6, due to air’s lower electronegativity. The evolution of micro-discharge is depicted at six critical times:
t = 10 ns,
t = 25 ns,
t = 50 ns,
t = 75 ns,
t = 100 ns, and
t = 500 ns, with simulation results illustrated in
Figure 6.
Initially, electron accumulation at the corner of the defect’s left wall forms a thin cloud layer. Within 25 ns, there is significant electron buildup on the surface of the epoxy resin. Driven by the electric field, these electrons ionize neutral particles, leading to the generation of additional electrons and positive ions. By 50 ns, a charge cluster pattern emerges, which maintains a consistent electron cloud shape up to 500 ns. By the end of the period, there is a slight diffusion of low-density electrons observed at 500 ns.
In an air environment, negative ions are primarily produced through the adsorption of electrons onto N2 molecules. Initially, these negative ions accumulate around the defect and migrate against the electric field, showing slower movement compared to electrons, which leads to their initial retention. By 50 ns, there is a significant accumulation of negative ions, which begins to dissipate outward by 500 ns.
The evolution of positive ions during the micro-discharge process is influenced by two main factors. Firstly, there is an accumulation of charge-like ions generated by minor ionization near the defect, distributed to the right of the defect, opposite the electric field. Secondly, new positive charges are produced by the collision ionization of surface electrons as they propagate on the left side of the defect, consistently accumulating on the surface of the insulating rod and forming a distinct charge pattern.
This study on micro-discharge phenomena caused by poor insulation defects in different environments of SF6 and air has enhanced the understanding of the insulating performance of gas-insulated switchgear equipment. This highlights how the insulating characteristics of SF6 and air directly influence the intensity and properties of micro-discharges triggered by such defects. Specifically, SF6 exhibits superior insulating capabilities compared to air, effectively reducing the extent of micro-discharges under identical operational conditions. The contrasting operational environments of the inner and outer walls of the insulating rod further illustrate this point: the outer wall is exposed to SF6 gas at a higher pressure of 4 atm, while the inner wall is surrounded by air at a lower pressure of 1 atm. This difference in gas type and pressure not only underscores the superior insulating properties of SF6 over air but also amplifies the variation in discharge intensity between defects located on the inner and outer surfaces.
Additionally, the study of micro-discharge phenomena also reveals how insulation defects behave under different pressure and electric field conditions. This is particularly important in transformers and other high-voltage equipment, where environmental conditions significantly affect micro-discharges. As pressure increases, the insulating properties of SF6 improve, reducing both the frequency and intensity of micro-discharges. This effect has been confirmed experimentally; when the pressure of SF6 gas is increased from 1 to 4 atmospheres, micro-discharges from the same defect are noticeably weaker.
In researching micro-discharges, technologies like high-speed cameras and electron microscopes allow for a detailed observation and analysis of the dynamic processes and factors influencing micro-discharges. These precise observation methods enable researchers to accurately track the movements of electrons and ions, leading to a better understanding of how micro-discharges develop and their specific impacts on insulation performance.
This deep understanding of micro-discharge behavior provides crucial information for improving and optimizing the design of gas-insulated switchgears. By comparing how micro-discharges occur in different mediums like SF6 and air, engineers can design safer and more efficient systems to meet the complex demands of electrical power systems. Such research not only advances high-voltage insulation technology but also supports the stability and safety of electrical power systems.
