Abstract
Reducing fuel consumption to decrease CO2 emissions has become a key development factor in the automotive industry. An effective way to decrease fuel consumption is to reduce the influence of various sources of energy loss. One way to increase engine efficiency is to use low-viscosity engine oils to reduce friction losses in the engine’s tribological systems. The aim of the article was to analyze the relationship between the type of engine oil and fuel consumption in a group of 12 passenger cars. This was a homogenous group of identical cars, equipped with the same engine, operated under very similar conditions. Three groups of engine oils (Revline, Total, Orlen) were tested in vehicles and stressed with comparable workloads. The experiment was conducted over two years (two stages of research). The collected results were presented using graphs and compared using statistical tests, split into two stages of research, with four seasonal temperature groups. The study provides a detailed description of fuel consumption differences taking into account variations in ambient temperature. The analyses were focused on finding answers to two research questions: does the type of engine oil affect the variation in combustion levels, and what is the variability of fuel consumption in different seasons due to the ambient temperature variability? Briefly, in both stages of the study, vehicles using Revline oil attained the highest average fuel consumption throughout the study period. Vehicles using Total oil showed similar results to those using Revline oil, with the difference in fuel consumption not as noticeable during warmer months. Conversely, vehicles using Orlen oil demonstrated the lowest fuel consumption values during colder months, but higher levels during warmer months.
1. Introduction
Reducing fuel consumption to decrease CO2 emissions has become a key development factor in the automotive industry. Globally, the transport sector accounts for approximately one-quarter of total greenhouse gas (GHG) emissions from fossil fuels, with approximately three-quarters of this coming from road transport []. In European Union (EU) countries, the share of road transport in total CO2 emissions is approximately 17.5%, of which approximately 70% comes from passenger cars. Hence, actions are taken to reduce CO2 emissions and fuel consumption in passenger cars []. These efforts are related to both fuel modifications using alternative fuels [] and engine modifications [].
Fuel consumption is one of the most important criteria for assessing the performance of a passenger vehicle. The fuel consumption of vehicles is assessed primarily through driving tests with specific driving cycles, e.g., NEDC []. The second method is to rely on a physical model built on the principle of vehicle dynamics []. Another way is to use the on-board diagnostic system (OBD), which is used to monitor the engine condition []. Thanks to the rapid development of OBD technology, instantaneous fuel consumption can now be determined based on data about the air supply to the engine. However, most often, vehicle drivers rely on the method of actual measurement of fuel consumption based on the manual registration of distance travelled and the amount of fuel poured into the vehicle. It should be noted that typically there is a 10–15% underestimation between the official certified fuel consumption and the actual fuel consumption calculated based on the fuel consumed [,,]. This difference can be explained by two main factors []: vehicle movement variability during real driving that cannot be reflected in the test and non-representative test scenarios different from the real driving mode.
It should also be underscored that, in fact, a vehicle’s fuel consumption is influenced by many factors, which can be divided into external, internal, and driver-related factors []. External factors include driving conditions, road conditions, ambient temperature, and weather. Road conditions such as changes in altitude, road inclination, variable road surfaces, and traffic conditions will have different impacts on fuel consumption, either reducing or increasing its value. The ambient temperature affects many factors related to fuel consumption, especially those related to starting a cold engine, and may also affect external resistance acting on the vehicle [] or the condition of tires. Factors such as rain or snow will also affect fuel consumption. They influence the vehicle’s grip and rolling resistance, as well as the driving style. Internal factors are factors related to the technical condition of the vehicle, the condition of the tires, the fuel used, etc. The vehicle’s condition is characterized by regular maintenance and natural wear and tear. The condition of filters [], suspension [], wheel alignment [], and lubricants used [] will have varying degree of effects on fuel consumption. The type, size, and pressure of tires will affect rolling resistance, thus significantly impacting fuel consumption []. Also, the type of fuel used will impact consumption, due to differences related to the seasonality of the fuel and the use of biocomponents. Driver-related factors include driving style, acceleration/braking patterns, high-speed driving, type of travel, excessive use of air conditioning, etc. [,]. It has been shown that driving style can change fuel consumption by up to 10% [,].
An effective way to decrease fuel consumption is to reduce the influence of various sources of energy loss []. Even the newest combustion engines convert only part of the fuel’s chemical energy into useful energy (38%) []; the remaining energy is lost, among others, through heat dissipation through the cooling system (16–35%) or exhaust gases (23–37% depending on the engine type) [,,]. Of the obtained usable energy, almost one-third is lost to overcome frictional resistance in the engine system. Considering individual engine systems, these losses can be divided into losses in the piston-rings-cylinder assembly 45%, 30% in the bearings, 15% in the timing system, and 10% for pumping losses [,]. Identifying key elements where energy is lost allows for the introduction of new advanced technologies in engine design and its operation (e.g., reducing engine friction by means of surface texturing and coating [,], modifying the engine oil composition [], downsizing [,], improving the efficiency of the engine’s thermodynamic cycle []).
Analyzing the presented sources of the energy losses, it can be seen that one way to increase engine efficiency is to use low-viscosity engine oils to reduce friction losses in the engine’s tribological systems. Tormos et al. [] conducted a study on the fuel consumption of a fleet of city vehicles. Their research revealed that vehicles using SAE 5W30 oils had lower fuel consumption compared to those using SAE10W40 oils. This difference of 3.7% was statistically significant and demonstrated the benefits of using low-viscosity oils.
Taking the above into account, the study focused on analyzing the relationship between the type of engine oil used in a vehicle and the vehicle’s fuel consumption. The analyses focused on finding answers to two research questions: (1) does the type of engine oil influence the variability of fuel consumption levels? (2) What is the variability of fuel consumption in particular seasons (variability of ambient temperature)?
2. Materials and Methods
2.1. Research Material
The test vehicle fleet was comprised of vehicles selected from the certified driver examination center’s car fleet. Consequently, the vehicles operated mainly in urban conditions, traversing relatively short distances between successive vehicle start-ups. Thus, the operating conditions of the oil can be considered demanding. Within the tested fleet, diversity was observed, including examination of vehicles only from category A (motorcycles), where the examiner is the sole driver, and examination by examiners with qualifications limited to a specific category of vehicles (without rotation between them and no variation in route or examination site preferences). However, test vehicles as a whole are far more homogenous than randomly selected group of vehicles from the population of vehicles, which in turn increases the power of study to detect potential impact of investigated factors. Additionally, it is worth emphasizing that it was not possible to avoid road collisions for the examined vehicles, as well as mechanical issues requiring extended servicing periods. Continuous vehicle records were maintained by the Examination Center for each car, and all incidents were meticulously documented.
The focus of the study was on petrol-powered drivetrains. Among the selected vehicles, 12 were equipped with 1.2-L engines, devoid of turbocharging and featuring spark ignition with direct fuel injection. All were equipped with LPG (liquefied petroleum gas). Detailed characteristics of these engines are presented in Table 1, which constitutes an integral part of this article.

Table 1.
The general specification of the selected car.
The selected oils for the study met the minimum requirements of the engine manufacturer. One oil was recommended by the manufacturer’s service (Total), while the remaining oils were chosen based on their qualitative and viscosity classifications. Both Orlen (Płock, Poland) and Revline (Jasło, Poland) oils met the engine manufacturer’s requirements.
The main characteristics of each type of engine oil are presented in Table 2.

Table 2.
Oil manufacturer datasheet.
In the first stage of the research, each oil was randomly applied in a group of four vehicles. However, in the second stage of the study, a change was introduced so that none of the vehicles operated on the same oil again. Figure 1 illustrates which vehicles were using the tested oils.

Figure 1.
Allocation of tested oils to specific vehicles.
In Table 3, details regarding the number of kilometers driven by each car are presented, divided into stage 1 and stage 2. Additionally, the odometer reading at the start of the experiment is provided to document the similarity of the studied cars in terms of the overall mileage that elapsed since they were manufactured.

Table 3.
The number of kilometers travelled by each car.
2.2. Research Methodology
The cars were consistently refueled at the same petrol station, with each refueling being recorded (invoiced). The vehicles were primarily operated on LPG, while petrol (Pb) was used during engine startups and when LPG was unavailable (Table 4). When calculating the average fuel consumption for each car, the consumed Pb was converted to LPG using a conversion factor of 1.2. All average values reported in the study pertain to LPG (while also incorporating the consumed Pb).

Table 4.
Stage 1 and Stage 2 fuel consumption of Liquified Petroleum Gas and Petrol.
The collected results were presented using scatter plots split into two stages of research, with four seasonal temperature divisions marked on them. Values deemed outliers were excluded based on information regarding anomalies in vehicle usage provided by the source. Separately for the two stages of the study, as well as for the combined average for both stages, average fuel consumption values were calculated for all cars in the oil groups. The polynomial interpolation method was utilized, and seasonal temperature divisions were indicated. Another method utilized for presenting the results and differences in fuel consumption between oil groups are heatmaps. These heatmaps apply a scoring/ranking system based on monthly fuel consumption during the experiment, where lower fuel consumption corresponds to fewer points and, conversely, higher fuel consumption corresponds to more points.
Parametric ANOVA and non-parametric Kruskal–Wallis tests were used to test for the presence of statistically significant differences between predefined groups. Rejection of the ‘no differences’ hypothesis was followed by the post hoc pairwise tests with appropriate control of the overall false positives rate. Test statistics values, degrees of freedom, and p-values were provided. Additionally, results were visualized using box plots with jittered raw data overlaid on top of them.
3. Results
Figure 2 presents the average fuel consumption levels recorded in individual months during the first stage of the study. The graph illustrates that the average fuel consumption (LPG) ranges from 8.5 L/100 km to 13.5 L/100 km. Nonetheless, several data points notably deviate from the rest of the observed data, as indicated by encircled markers. Exclusions primarily pertained to cars no. 3 and no. 7. Additionally, individual outliers were disregarded for cars no. 1, no. 2, no. 4, and no. 9. These exclusions aimed at preserving the quality of experimental results, motivated by random occurrences such as collisions, breakdowns, or non-standard vehicle usage during specific periods have been marked with black circles around data points. Analyzing the average fuel consumption across different months underscores a significant correlation with the monthly average temperatures, as annotated on Figure 2 (provided in the description of the X-axis). This observation has substantive justification, as in months with higher average temperatures, vehicles are typically operated with the air conditioning system engaged, resulting in increased power consumption by the air conditioning unit and consequently higher average fuel consumption.
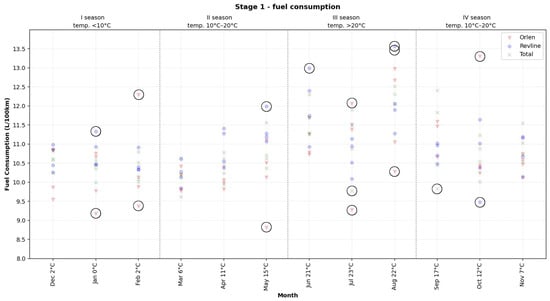
Figure 2.
Stage 1—fuel consumption.
The presented data indicate that vehicles with different types of oils exhibited tendencies toward lower or higher average fuel consumption levels, depending on the oil type. Consequently, it was decided to examine, within each month, the distribution of the studied vehicles in terms of their average fuel consumption levels. A ranking method was applied, utilizing a heat map for this purpose. Figure 3 presents the results for each oil. Rank 1 signifies that the examined oil had the lowest average fuel consumption in a given month (green color), while Rank 12 denotes that the examined oil had the highest average fuel consumption in a given month (red color), with intermediate colors indicating values between the extremes of the scale.

Figure 3.
The Highest and Lowest Average Fuel Consumption Levels—Ranking—Stage 1. X—car breakdown.
The applied ranking method enabled the calculation of total points for vehicles fueled with a particular oil. For vehicles using the Revline oil, a total of 357 points was obtained, indicating that vehicles with this oil exhibited the highest average fuel consumption. Vehicles fueled with Orlen oil achieved a total of 248 points, signifying that it was these vehicles that had the lowest average fuel consumption.
In the next step, the average fuel consumption levels were calculated for each oil group. The results were presented in Figure 4.
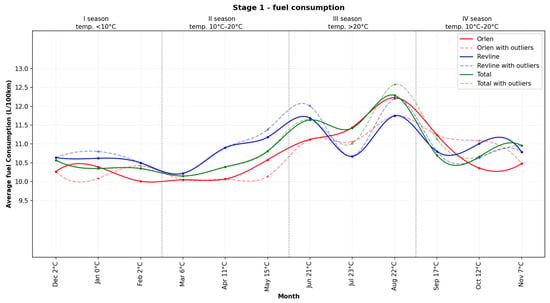
Figure 4.
Stage 1—average fuel consumption.
Figure 4 contains six curves, as a division was introduced within the examined vehicle groups into two variants. The solid line represents the average results of all vehicles with the studied oil in each month, excluding the data circled in Figure 2. Meanwhile, the dashed line presents the average fuel consumption results without the indicated exclusions. An important observation to highlight is as follows: vehicles using Revline oil exhibited higher average fuel consumption levels during the months of December to June and October to November, while lower levels were observed in July and August, when the average monthly ambient temperatures exceed 22 °C. Conversely, vehicles using Orlen oil showed the lowest average fuel consumption levels in seasons I, II, and IV, whereas in season III, they exhibited levels comparable to vehicles using Total oil and noticeably higher than those using Revline oil.
These observations pertain to averages calculated based on the exclusion of outlier observations. Considering the averages for all examined oils (without exclusions) yielded similar conclusions for seasons I, II, and IV, while a significant differentiation is observed for season III.
The results from the second stage of the study are presented in Figure 5.

Figure 5.
Stage 2—fuel consumption.
As with the first stage of the study, outlier results were excluded. Exclusions in the second stage primarily affected cars no. 2, no. 7, and no. 12. Individual results were also excluded for cars no. 5 and no. 9. Exclusions were primarily due to mechanical issues with the cars in specific months or collisions. The occurrence of these events were sourced from the continuous vehicle records maintained by the Examination Center for each car and marked using black circles around data points. The observed deviations provided substantive grounds to infer that the nature of the operation of these vehicles significantly differed from the others.
The second stage of the experiment serves as confirmation of the observations made in stage I. Clear tendencies of vehicles with the tested oils towards lower or higher fuel consumption are distinctly observable. Figure 6 presents the results for vehicles using the specified tested oil. Analogously to the first stage, Rank 1 signifies that the tested oil had the lowest average fuel consumption in a given month, while Rank 12 denotes that the tested oil had the highest average fuel consumption in a given month. In the heat map, the red color indicates the highest fuel consumption, while the green color represents the lowest. The heat map employs a 12-color scale, where red indicates the highest fuel consumption and green represents the lowest. An “X” mark on a gray field signifies the absence of data for the given month for the specific vehicle.
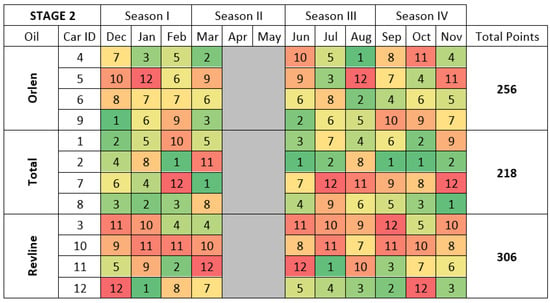
Figure 6.
The Highest and Lowest Average Fuel Consumption Levels—Ranking—Stage 2. X—car breakdown.
The applied ranking method facilitated the computation of total points for the examined oil groups. For vehicles using Revline oil, a total of 306 points was obtained, indicating the highest average fuel consumption. Vehicles using Orlen oils scored 256 points—unlike the first stage, this did not represent the lowest fuel consumption. This is attributed to the SARS-CoV-2 epidemic, which excluded cars from operation in the months of April and May from the study, during which time vehicles using this oil achieved their lowest results. Vehicles utilizing Total oils in the second stage of the experiment garnered 218 points, exhibiting the lowest average fuel consumption.
Subsequently, the average fuel consumption levels were calculated for each vehicle group in the second stage. The results are depicted in Figure 7.
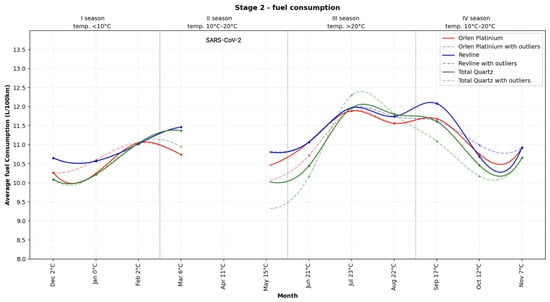
Figure 7.
Stage 2—average fuel consumption.
Figure 7 comprises six curves. The solid line represents the average results of all vehicles in each month, excluding the data circled in Figure 5. Meanwhile, the dashed line presents the average fuel consumption results without the specified exclusions. Vehicles using Total oils typically exhibited the lowest fuel consumption among all examined groups, while vehicles using Orlen oils showed slightly higher fuel consumption. Similar to the first stage, vehicles using Revline oils recorded the highest average fuel consumption.
The next step involved calculating the average fuel consumption levels for vehicles using each respective oil for both stages of the study. The labels are consistent with those used in the previous charts. The results are presented in Figure 8.
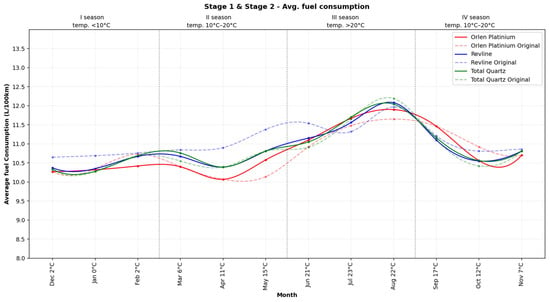
Figure 8.
Stages 1 and 2—average fuel consumption.
Analysis of Figure 8 allows for the formulation of four conclusions regarding the average fuel consumption levels and differences between the oils used. First, vehicles using Orlen oils exhibited the lowest fuel consumption values during cold months (seasons I and II, as well as the last month of season IV), while showing higher consumption during warmer months (seasons III and IV). Second, vehicles using Revline oils recorded the highest average fuel consumption throughout the entire study period. Third, vehicles using Total oils achieved results comparable to those using Revline oils, although the difference in fuel consumption for Revline oil was not as pronounced during warmer months (with temperatures exceeding 15 °C). Last, the fourth conclusion highlights the significant impact of operating temperature on fuel consumption in the examined vehicles. Warmer months necessitate the use of air conditioning, resulting in an automatic increase in average fuel consumption for all examined groups by approximately 1.5 L/100 km compared to months with lower temperatures.
Statistical Analysis
In the next step, statistical analyses were conducted to confirm statistical significance in two aspects: between oil groups and between seasons (four temperature seasons).
When considering all data (from both stages) there are no statistically significant differences in the average fuel consumption between oil types as both parametric ANOVA and non-parametric Kruskal–Wallis tests returned p-values above 0.05. Same conclusions can be reached when analyzing both stages separately (Figure 9, Figure 10 and Figure 11).
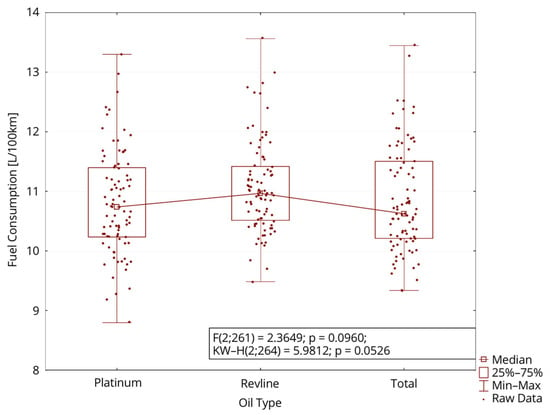
Figure 9.
Box Plot—average fuel consumption—variability among the tested oils in both Stages.
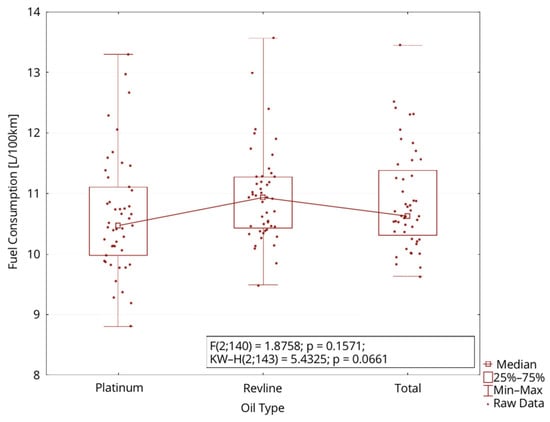
Figure 10.
Box Plot—average fuel consumption—variability among the tested oils in Stage 1.
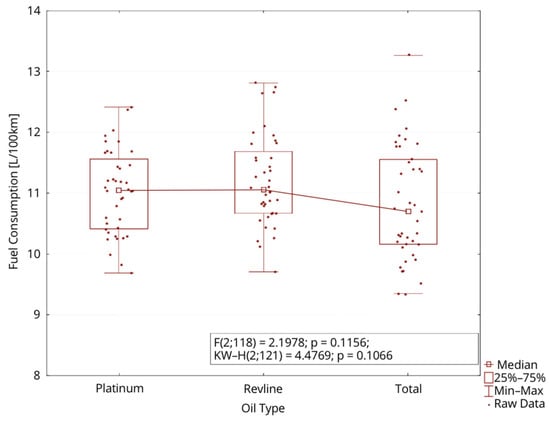
Figure 11.
Box Plot—average fuel consumption—variability among the tested oils in Stage 2.
When considering all data (from both stages), there are statistically significant differences in the average fuel consumption between seasons as both parametric ANOVA and non-parametric Kruskal–Wallis tests returned p-values below 0.05. Same conclusions can be reached when analyzing both stages separately (Figure 12, Figure 13 and Figure 14). In particular, when the ANOVA was followed by the post hoc pairwise Tukey tests, it was found that statistically significant differences are present between Season 1 vs. Season 3, Season 1 vs. Season 4, Season 2 vs. Season 3, Season 3 vs. Season 4 (all data case), Season 1 vs. Season 3, Season 2 vs. Season 3, Season 3 vs. Season 4 (Stage 1 data), Season 1 vs. Season 3, and Season 3 vs. Season 4 (Stage 2 data).
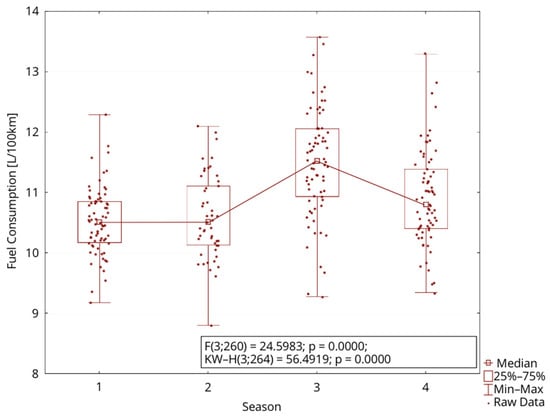
Figure 12.
Box Plot—average fuel consumption—seasonal variability for both stages combined.
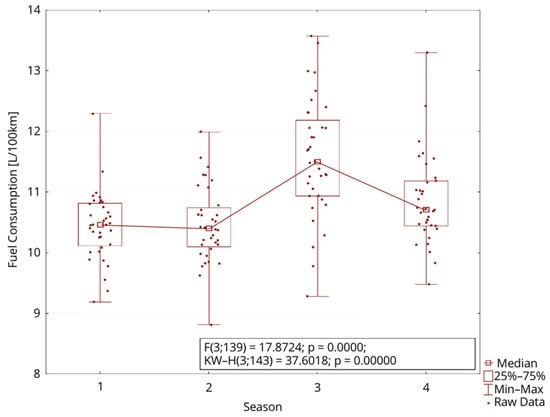
Figure 13.
Box Plot—average fuel consumption—seasonal variability for Stage 1.
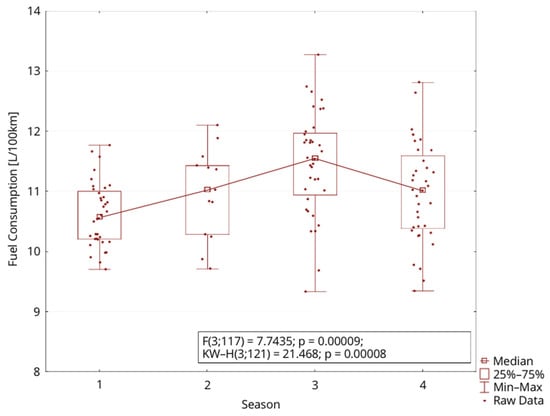
Figure 14.
Box Plot—average fuel consumption—seasonal variability for Stage 2.
4. Conclusions
The article presents a comprehensive analysis of average fuel consumption levels in a group of twelve vehicles. A notable strength of this experiment was the analysis of identical vehicles belonging to a single institution. Another strength was the nature of vehicle usage, solely for conducting state driving license exams. However, the COVID-19 pandemic introduced challenges to the study, as the examination center operated in a limited capacity, resulting in significantly lower total mileage covered by each vehicle in the second phase compared to the first phase of the study. The research was conducted in two stages, allowing for the examination of each oil type in different vehicles, aiming to determine variations in fuel consumption levels based on different engine oils used.
A distinguishing feature of the experiment was the analysis of fuel consumption levels based on seasons (variations in ambient temperatures). The analysis revealed that:
In the first stage of the study, significant variations in average fuel consumption levels were observed among the oils examined. Vehicles using Revline oil exhibited the highest average fuel consumption, while those using Orlen oil showed the lowest. Vehicles using Total oil fell in between. Additionally, it was observed that vehicles using Revline oil showed higher average fuel consumption during the months of December to June and October to November, while experiencing lower consumption during July and August, when the average monthly ambient temperatures exceeded 22 °C. Conversely, vehicles using Orlen oil demonstrated the lowest average fuel consumption in seasons I, II, and IV, but higher levels comparable to those using Total oil in season III.
The second stage of the experiment confirmed the observations made in the first stage. Clear trends of vehicles using the examined oils towards either lower or higher fuel consumption were evident. Revline oil-utilizing vehicles exhibited the highest average fuel consumption, while Orlen oil-utilizing vehicles positioned in the middle of the scale. Vehicles using Total oil in the second stage of the experiment showed the lowest average fuel consumption.
Summarizing both stages of the study, vehicles using Revline oil attained the highest average fuel consumption throughout the study period. Vehicles using Total oil showed similar results to those using Revline oil, with the difference in fuel consumption not as noticeable during warmer months, when temperatures exceeded 15 °C. Conversely, vehicles using Orlen oil demonstrated the lowest fuel consumption values during colder months (seasons I, II, and the final month of season IV), but higher levels during warmer months (seasons III and IV).
Significant impacts on fuel consumption in the studied vehicles were noted due to the operating temperatures of the vehicles. Warmer months necessitated the use of air conditioning, leading to an automatic increase in average fuel consumption for all examined groups by approximately 1.5 L/100 km compared to months with lower temperatures. The obtained results are reflected in the literature. On one hand, as indicated by Surcel [], a temperature increase of 20 °C results in an 18% difference in average fuel consumption and a 6% difference with a 9 °C change. Conversely, studies by Mogro and Huertas [] have shown that the use of air conditioning in passenger cars operated in urban conditions leads to an increase in fuel consumption by 0.9 L/h. Regarding consumption in L/100 km, it was dependent on vehicle speed and amounted to 8.2 L/100 km at low speeds (<50 km/h) and 10.3 L/100 km at higher speeds. Simultaneously, it has been demonstrated that air conditioning improves engine energy efficiency due to increased engine load at idle. Furthermore, research conducted according to the cycle by Fontaras et al. [] has shown increased fuel consumption by 1.25 L/100 km when air conditioning is engaged.
The conducted statistical analysis indicated variations in average fuel consumption levels based on seasons, as both parametric ANOVA and non-parametric Kruskal–Wallis tests returned p-values below 0.05.
Limitations
Only three engine oils were examined, which were in the same or very similar quality classes. The selection of oils was guided by the recommendations of the engine manufacturer. Opting for greater diversity in oils could have resulted in more distinct outcomes. The results are representative of small-capacity engines powered by LPG fuel and are intended to show general trends.
Supplementary Materials
The following supporting information can be downloaded at: https://www.mdpi.com/article/10.3390/en17112458/s1, Table S1: Vehicle’s average fuel consumption in details.
Author Contributions
Conceptualization, A.W. and M.W.; methodology, A.W., M.W. and K.F.; software, M.W. and K.F.; validation, A.W., M.W., K.F. and G.Z.; formal analysis, A.W., M.W., K.F. and G.Z.; investigation, A.W., M.W., K.F. and G.Z.; resources, A.W. and G.Z.; data curation, A.W., M.W., K.F. and G.Z.; writing—original draft preparation, A.W., M.W., K.F. and G.Z.; writing—review and editing, A.W., M.W., K.F. and G.Z.; visualization, A.W., M.W., K.F. and G.Z.; supervision, A.W.; project administration, A.W.; funding acquisition A.W. All authors have read and agreed to the published version of the manuscript.
Funding
The publication/article present the result of the Project no 095/ZJB/2023/DOS financed from the subsidy granted to the Krakow University of Economics.
Data Availability Statement
The original contributions presented in the study are included in the article/Supplementary Material, further inquiries can be directed to the corresponding author.
Acknowledgments
The authors wish to thank the Directors and the Manage Staff of the Voivodship Training Centre for Drivers in Krosno (Ryszard Siepietowski, Bogusław Kolarczyk, the Administration and Technical Department—Wacław Dusza, Antoni Cholewiak) for making this study possible by providing 12 Kia Rio cars that belong to the Training Centre’s fleet.
Conflicts of Interest
The authors declare no conflicts of interest.
References
- Zheng, J.; Yu, R.; Liu, Y.; Zou, Y.; Zhao, D. The Technological Progress of the Fuel Consumption Rate for Passenger Vehicles in China: 2009–2016. Energies 2019, 12, 2384. [Google Scholar] [CrossRef]
- European Commission; Joint Research Centre; Tsiakmakis, S.; Zacharof, N.; Fontaras, G.; Ciuffo, B.; Marotta, A.; Anagnostopoulos, K.; Pavlovic, J. Review of in Use Factors Affecting the Fuel Consumption and CO2 Emissions of Passenger Cars; Tsiakmakis, S., Ciuffo, B., Marotta, A., Anagnostopoulos, K., Pavlovic, J., Eds.; Publications Office: Luxembourg, 2016. [Google Scholar]
- Dzieniszewski, G.; Kuboń, M.; Pristavka, M.; Findura, P. Operating Parameters and Environmental Indicators of Diesel Engines Fed with Crop-Based Fuels. Agric. Eng. 2021, 25, 13–28. [Google Scholar] [CrossRef]
- Caban, J.; Vrabel, J.; Górnicka, D.; Nowak, R.; Jankiewicz, M.; Matijošius, J.; Palka, M. Overview of Energy Harvesting Technologies Used in Road Vehicles. Energies 2023, 16, 3787. [Google Scholar] [CrossRef]
- Tsokolis, D.; Tsiakmakis, S.; Dimaratos, A.; Fontaras, G.; Pistikopoulos, P.; Ciuffo, B.; Samaras, Z. Fuel Consumption and CO2 Emissions of Passenger Cars over the New Worldwide Harmonized Test Protocol. Appl. Energy 2016, 179, 1152–1165. [Google Scholar] [CrossRef]
- Zhao, D.; Li, H.; Hou, J.; Gong, P.; Zhong, Y.; He, W.; Fu, Z. A Review of the Data-Driven Prediction Method of Vehicle Fuel Consumption. Energies 2023, 16, 5258. [Google Scholar] [CrossRef]
- Zheng, X.; Lu, S.; Yang, L.; Yan, M.; Xu, G.; Wu, X.; Fu, L.; Wu, Y. Real-World Fuel Consumption of Light-Duty Passenger Vehicles Using on-Board Diagnostic (OBD) Systems. Front. Environ. Sci. Eng. 2020, 14, 33. [Google Scholar] [CrossRef]
- Mock, P.; German, J.; Bandivadekar, A.; Riemersma, I. Discrepancies between Type-Approval and “Real-World” Fuel-Consumption and CO. Available online: http://www.theicct.org/sites/default/files/publications/ICCT_EU_fuelconsumption2_workingpaper_2012.pdf (accessed on 18 March 2024).
- van Gijlswijk, R.; Paalvast, M.; Ligterink, N.E.; Smokers, R. Real-World Fuel Consumption of Passenger Cars and Light Commercial Vehicles; TNO Report; TNO: The Hague, The Netherlands, 2020; p. R11664. [Google Scholar]
- Pavlovic, J.; Fontaras, G.; Broekaert, S.; Ciuffo, B.; Ktistakis, M.A.; Grigoratos, T. How Accurately Can We Measure Vehicle Fuel Consumption in Real World Operation? Transp. Res. Part Transp. Environ. 2021, 90, 102666. [Google Scholar] [CrossRef]
- Delogu, M.; Del Pero, F.; Pierini, M. Lightweight Design Solutions in the Automotive Field: Environmental Modelling Based on Fuel Reduction Value Applied to Diesel Turbocharged Vehicles. Sustainability 2016, 8, 1167. [Google Scholar] [CrossRef]
- Lim, J.; Lee, Y.; Kim, K.; Lee, J. Experimental Analysis of Calculation of Fuel Consumption Rate by On-Road Mileage in a 2.0 L Gasoline-Fueled Passenger Vehicle. Appl. Sci. 2018, 8, 2390. [Google Scholar] [CrossRef]
- Fontaras, G.; Dilara, P. The Evolution of European Passenger Car Characteristics 2000–2010 and Its Effects on Real-World CO2 Emissions and CO2 Reduction Policy. Spec. Sect. Fuel Poverty Comes Age Commem. 21 Years Res. Policy 2012, 49, 719–730. [Google Scholar] [CrossRef]
- Thomas, J.; West, B.; Huff, S. Effect of Air Filter Condition on Diesel Vehicle Fuel Economy; SAE International: Warrendale, PA, USA, 2013. [Google Scholar]
- Soliman, A.M.A.; Kaldas, M.M.S.; Abdallah, S.A. Influence of Road Roughness on the Ride and Rolling Resistance for Passenger Car; SAE International: Warrendale, PA, USA, 2013. [Google Scholar]
- Thomas, J.; Huff, S.; West, B. Fuel Economy and Emissions Effects of Low Tire Pressure, Open Windows, Roof Top and Hitch-Mounted Cargo, and Trailer. SAE Int. J. Passeng. Cars—Mech. Syst. 2014, 7, 862–872. [Google Scholar] [CrossRef]
- Taylor, R.I. Fuel-Lubricant Interactions: Critical Review of Recent Work. Lubricants 2021, 9, 92. [Google Scholar] [CrossRef]
- Synák, F.; Kalašová, A. Assessing the Impact of the Change in the Tire Pressure on the Rolling Resistance and Fuel Consumption. Adv. Sci. Technol. Res. J. 2020, 14, 100–106. [Google Scholar] [CrossRef] [PubMed]
- Brundell-Freij, K.; Ericsson, E. Influence of Street Characteristics, Driver Category and Car Performance on Urban Driving Patterns. Transp. Res. Part Transp. Environ. 2005, 10, 213–229. [Google Scholar] [CrossRef]
- Loman, M.; Šarkan, B.; Skrúcaný, T. Comparison of Fuel Consumption of a Passenger Car Depending on the Driving Style of the Driver. Transp. Res. Procedia 2021, 55, 458–465. [Google Scholar] [CrossRef]
- Li, S.E.; Peng, H. Strategies to Minimize the Fuel Consumption of Passenger Cars during Car-Following Scenarios. Proc. Inst. Mech. Eng. Part J. Automob. Eng. 2012, 226, 419–429. [Google Scholar] [CrossRef]
- Romero, C.A.; Correa, P.; Ariza Echeverri, E.A.; Vergara, D. Strategies for Reducing Automobile Fuel Consumption. Appl. Sci. 2024, 14, 910. [Google Scholar] [CrossRef]
- Holmberg, K.; Andersson, P.; Erdemir, A. Global Energy Consumption Due to Friction in Passenger Cars. Tribol. Int. 2012, 47, 221–234. [Google Scholar] [CrossRef]
- Holmberg, K.; Erdemir, A. The Impact of Tribology on Energy Use and CO2 Emission Globally and in Combustion Engine and Electric Cars. Tribol. Int. 2019, 135, 389–396. [Google Scholar] [CrossRef]
- Abedin, M.J.; Masjuki, H.H.; Kalam, M.A.; Sanjid, A.; Rahman, S.M.A.; Masum, B.M. Energy Balance of Internal Combustion Engines Using Alternative Fuels. Renew. Sustain. Energy Rev. 2013, 26, 20–33. [Google Scholar] [CrossRef]
- Tormos, B.; Ramírez, L.; Johansson, J.; Björling, M.; Larsson, R. Fuel Consumption and Friction Benefits of Low Viscosity Engine Oils for Heavy Duty Applications. Tribol. Int. 2017, 110, 23–34. [Google Scholar] [CrossRef]
- Kaltakkıran, G.; Akif Ceviz, M.; Bakirci, K. Instantaneous Energy Balance and Performance Analysis during Warm up Period of a Spark Ignition Engine under Several Thermal Energy Management Strategies. Energy Convers. Manag. 2022, 269, 116102. [Google Scholar] [CrossRef]
- Gangopadhyay, A. Power Cylinder Friction Reduction Through Coatings, Surface Finish and Design; Ford Motor Company: Detroit, MI, USA, 2021. [Google Scholar]
- Dahham, R.Y.; Wei, H.; Pan, J. Improving Thermal Efficiency of Internal Combustion Engines: Recent Progress and Remaining Challenges. Energies 2022, 15, 6222. [Google Scholar] [CrossRef]
- Shi, G.; Yu, X.; Meng, H.; Zhao, F.; Wang, J.; Jiao, J.; Jiang, H. Effect of Surface Modification on Friction Characteristics of Sliding Bearings: A Review. Tribol. Int. 2023, 177, 107937. [Google Scholar] [CrossRef]
- Klier, T.; Linn, J. The Effect of Vehicle Fuel Economy Standards on Technology Adoption. J. Public Econ. 2016, 133, 41–63. [Google Scholar] [CrossRef]
- Balaji, M.; Sarfas, M.; Vishaal, G.S.B.; Madhusudhan, G.V.; Gupta, S.; Kanchan, S. Scope for Improving the Efficiency and Environmental Impact of Internal Combustion Engines Using Engine Downsizing Approach: A Comprehensive Case Study. IOP Conf. Ser. Mater. Sci. Eng. 2021, 1116, 012070. [Google Scholar] [CrossRef]
- Silva, L.S.; Silva, J.A.; Henríquez, J.R.; de Lira Junior, J.C. Numerical Analysis of Effects of Engine Downsizing and Turbocharging on the Parameters of Performance and Emissions of an Internal Combustion Engine. Arab. J. Sci. Eng. 2023, 48, 2795–2805. [Google Scholar] [CrossRef]
- Surcel, M.-D. Evaluation of the Effect of Ambient Conditions on the Fuel Consumption of Commercial Vehicles; SAE Technical Paper 2022-01–0528; SAE International: Warrendale, PA, USA, 2022. [Google Scholar] [CrossRef]
- Mogro, A.E.; Huertas, J.I. Assessment of the Effect of Using Air Conditioning on the Vehicle’s Real Fuel Consumption. Int. J. Interact. Des. Manuf. 2021, 15, 271–285. [Google Scholar] [CrossRef]
- Fontaras, G.; Zacharof, N.-G.; Ciuffo, B. Fuel Consumption and CO2 Emissions from Passenger Cars in Europe—Laboratory versus Real-World Emissions. Prog. Energy Combust. Sci. 2017, 60, 97–131. [Google Scholar] [CrossRef]
Disclaimer/Publisher’s Note: The statements, opinions and data contained in all publications are solely those of the individual author(s) and contributor(s) and not of MDPI and/or the editor(s). MDPI and/or the editor(s) disclaim responsibility for any injury to people or property resulting from any ideas, methods, instructions or products referred to in the content. |
© 2024 by the authors. Licensee MDPI, Basel, Switzerland. This article is an open access article distributed under the terms and conditions of the Creative Commons Attribution (CC BY) license (https://creativecommons.org/licenses/by/4.0/).