Abstract
Energy markets are crucial for integrating Distributed Energy Resources (DER) into modern power grids. However, this integration presents challenges due to the inherent variability and decentralized nature of DERs, as well as poorly adapted regulatory environments. This paper proposes a medium-term decision-making approach based on a comprehensive suite of computational tools for integrating DERs into Colombian energy markets. The proposed framework consists of modular tools that are aligned with the operation of a Commercial Virtual Power Plant (CVPP). The tools aim to optimize participation in bilateral contracts and short-term energy markets. They use forecasting, uncertainty management, and decision-making modules to create an optimal portfolio of DER assets. The suite’s effectiveness and applicability are demonstrated and analyzed through its implementation with heterogeneous DER assets across various operational scenarios.
1. Introduction
1.1. Background and Motivation
The energy landscape is undergoing constant evolution, transitioning toward more sustainable, decentralized, and digitized power systems [1,2]. This transformation is driven by several interrelated factors that are fundamentally changing the way energy is produced, distributed, and consumed [3,4,5]. One of the main drivers of this transformation is the growing adoption of distributed energy resources (DER) [6]. DER includes various energy generation, storage, and management technologies located at or near the points of consumption, such as distributed generation (DG), energy storage systems (ESS), and demand response (DR). These resources can reduce greenhouse gas emissions and improve resilience and reliability in response to changes in power system supply and demand [7].
However, integrating DERs effectively presents significant challenges due to the inherent variability of certain energy sources, such as solar, which heavily depend on weather and climate conditions [8]. This variability can cause fluctuations in energy production, making it difficult to maintain a balance between supply and demand in the power grids [9]. Furthermore, the decentralization of power generation presents challenges in terms of system coordination and control [10]. Unlike conventional power plants, which are centrally managed, DERs can be geographically dispersed and operate independently [11,12]. This can make it difficult to optimize and properly operate power systems.
In this way, energy markets play a crucial role in integrating DERs into contemporary power grids [13]. These markets were originally designed for large-scale centralized generation and unidirectional power distribution, but are now adapting to accommodate the increasing diversity and decentralization of energy supply and demand [14]. This includes DER owners, end-consumers, energy communities, and load aggregators, among other players. However, the current structure and design of energy markets may not fully accommodate the growing presence of DERs, making their participation infeasible [15]. This is due to the significant difference in energy capacity between DERs and large power plants, which severely limits the competitiveness of the former in different market structures, particularly in the wholesale market. Furthermore, the uncertainty surrounding the availability of DERs, and electricity prices, present additional challenges [16]. Therefore, the aggregation and effective coordination of DERs is essential to contribute to this integration [17].
Within this framework, various paradigms have been proposed to facilitate coordinated, dependable, and cost-effective decision-making, as well as the seamless integration of diverse small-scale Distributed Energy Resources (DERs) into power grids. Two paradigms stand out: microgrids and virtual power plants (VPPs). These concepts have been extensively discussed in prior literature [18,19,20,21]. VPPs, in particular, play a pivotal role in this transition due to their reliance on the inclusion of Information and Communication Technologies (ICT) into power systems, as seen in smart grids. VPPs can aggregate DER assets through metering infrastructures, managing them as a single power entity. This allows them to participate in conventional market mechanisms such as bilateral contracting day-ahead markets (e.g., pool, reserve, among others), thus enabling a way to integrate these resources [22].
It is worth noting that VPPs can aggregate and manage DER from both commercial and technical perspectives. Commercially, they are referred to as Commercial Virtual Power Plants (CVPPs), which utilize economic metrics from integrated DER assets to develop collective market participation strategies with the aim of maximizing overall profits. In contrast, the Technical Virtual Power Plant (TVPP) approach aims to ensure the safe and efficient operation of the VPP by considering technical constraints of the integrated DER assets, such as generation limits, dispatch expectations (even from a CVPP), and grid constraints, such as power flow restrictions. However, developing a TVPP requires more comprehensive data and greater accountability in management [23,24]. This may make them less viable in countries with more restrictive regulatory frameworks. Therefore, CVPPs in energy markets, have become the initial framework in the integration of DERs into current power systems [25].
1.2. Literature Review and Research Gap
Several studies have investigated the potential of data-driven DER asset aggregation and decision-making to facilitate participation in different energy market structures under conditions of uncertainty. In this context, the concept of virtual power plants (VPPs) has gained significant attention as a mechanism to aggregate and coordinate the operation of DER. This section summarizes some of the most recent and important work on this topic, moving from a general to a particular perspective.
VPP-based tools have been utilized in various studies to aggregate distributed energy resources (DERs) for multiple purposes. For example, the authors in [26,27] developed VPP models to optimize the scheduling of diverse DERs, considering grid management constraints and consumer comfort. In contrast, references [28,29,30,31,32] highlighted different studies on VPPs for providing capacity and ancillary services, selling energy to wholesale markets, engaging in new business models, and improving system economics and reliability on any scale. In [33,34,35] optimization approaches are proposed through VPP, allowing participation in the energy and ancillary services markets, alleviating local grid constraints, and providing reactive power support. Likewise, the authors in [36,37] presented VPP-based architectures for demand-side management, allowing prosumers to independently provide flexible power profiles and optimize asset scheduling considering such aspects as carbon markets and control techniques. Moreover, [38,39,40] present blockchain-based energy management platforms for different VPP modalities, which enable energy transactions between residential users with DERs, providing a deeper managing perspective.
According to [41], many articles in recent years have studied VPPs as an alternative to integrate DERs into power systems through different energy market approaches. For instance, the authors in [42,43] explore the bidding strategy of a VPP in a day-ahead market, developing a robust optimization model considering uncertainties to maximize VPP profit. Applied to a small VPP with PV and BESS, the model aims to enhance decision-making for DER aggregation. In contrast, in [44], the authors introduce an optimal bidding strategy for a virtual power plant (VPP) with different DER assets participating in different market approaches, such as pool (day-ahead) and futures markets, by addressing challenges such as failures in distributed generation units. This work demonstrated the ability of the VPP to mitigate losses due to failures while exploiting arbitrage opportunities.
Moreover, In [45], a methodology for a CVPP to optimize its coalition of diverse DERs assets through weekly contracting, futures-market engagement, and pool participation is discussed. In [46], a more comprehensive methodology that considers competition between VPPs is presented. The model allows VPPs to participate in energy markets, sign contracts, and manage market risks. In [47,48,49,50], different stochastic scheduling models for virtual power plants, integrating various energy resources and uncertainty modeling in load, weather, power, and market prices signals under various conditions are presented.
As described above, there are many uncertain parameters in VPP-based tools due to the involvement of multiple types of DERs and participation in various energy market structures, each with different dynamics and time horizons. Therefore, different approaches have been widely used to manage these uncertainties to make informed decisions with VPP-based approaches. For instance, the authors in [51,52,53,54], use robust optimization for this purpose. In contrast, in [47,55,56,57,58,59], VPP models with scenario generation and reduction approaches to handle uncertainties are developed. In [60,61,62,63], Monte Carlo simulations were used as a method of dealing with uncertainty in the construction of the VPP-based frameworks. The authors of [64,65,66,67] used Information Gap Decision Theory (IGDT) as an alternative method to scenario building for uncertainty handling. Other developments, such as those presented in [68,69,70,71], have opted for hybrid or cross-cutting approaches to uncertainty management to mitigate the negative aspects of other methods. This is evidence of the broad interest in the topic.
To use many of the uncertainty-handling methods for decision-making frameworks mentioned above, certain information related to these variables is required (e.g., predicted data, descriptive statistics, among others). However, despite the extensive research conducted in this field, there is a notable gap regarding the integration of time series prediction techniques to obtain these uncertainty parameters [72,73]. While time series prediction models have been widely used for forecasting purposes, their potential for directly estimating uncertainty measures has not been fully explored or leveraged in decision-making workflows [74,75]. This represents a good opportunity that has not yet been fully exploited, as time series prediction offers several advantages over traditional approaches.
First, time series models can capture complex temporal patterns and dependencies, thereby enabling more accurate forecasts and the quantification of uncertainty, particularly in the case of variables that exhibit seasonality, trends, or time-varying features [76,77]. Second, these models can generate probabilistic forecasts, providing not only point estimates but also confidence intervals or probability distributions, which can be directly integrated into uncertainty-handling methods. Moreover, time series prediction models can be continuously updated and refined as new data becomes available, ensuring that the uncertainty parameters remain relevant and reflective of the most recent conditions [78]. This adaptability is crucial in dynamic environments where underlying processes may evolve over time [79].
On the other hand, few recent studies have investigated the impact of mandatory participation policies for some types of DERs in energy market structures. In other words, these studies analyze some tools from a commercial perspective and, in some cases, an associated risks perspective, but they have not examined operational scenarios that may arise from stricter regulatory contexts during transition processes.
While most of the work presented in this review has focused on the voluntary participation of DER assets in energy markets and the optimization of their operation, there is a research gap regarding the impacts and challenges that may arise from stricter policies regulating mandatory participation of certain types of DERs as part of strategies for the transition to more sustainable energy systems.
This is pertinent, as mandatory participation policies may generate different operational scenarios, with implications for DER management, market interaction, and associated business models. Consequently, it is imperative to investigate these scenarios, which can serve as energy policy sandboxes, facilitating the development of a regulatory context more conducive to the integration of DERs and their stakeholders in these zones.
1.3. Contributions and Study Layout
To fill the research gaps discussed above, a set of computational tools for short- and medium-term data-driven decision-making is developed, exploring the uncertainty aspects. The tools include forecasting, uncertainty modeling, and profit maximization, and are designed to facilitate the integration of different DER assets into power systems with participation in various energy market modalities. The main contributions of this paper are summarized below:
- Development of a suite of computational tools encompassing forecasting, uncertainty management, and decision-making capabilities that will be used in a framework for optimal bidding of different types of DER assets (PV, ESS, and DR). These tools will be based on a commercial VPP and will be used for participation in short and medium-term energy market modalities, such as day-ahead markets and bilateral contracting. This suite considers the assumed risk profile in uncertainty management through elements such as stochastic programming [80] and the conditional value-at-risk (CVaR) [81] method.
- A hybrid method for time series forecasting, scenario generation, and reduction has been established. This method is based on the Time2Vec Transformer Encoder, Monte Carlo simulations, and the Fast-Forward reduction methods. It is designed to manage uncertainties in variables such as electricity prices and PV power production.
- Investigation of the effect of mandatory participation policies and risk profiles on optimal bidding decisions for profit maximization with DER assets, specifically ESS. The study proposes a planning support tool in the form of an energy policy sandbox for testing under uncertain regulatory conditions.
The paper is structured as follows: Section 2 provides a detailed description of the computational tools and their interactions for decision-making regarding the selection of the DER assets to participate in energy markets. This includes short-term trading in the day-ahead market and medium-term trading through bilateral contracting. Section 3 presents a case study with three scenarios to test the results of these tools and evidence risk management and regulatory conditions assessment. Finally, in Section 4, conclusions are drawn and future avenues for research are proposed. A glossary of abbreviations, parameters, and variables can be found at the end of the document.
2. Framework of the Decision-Making Tool Suite
The framework outlined in this study is presented in Figure 1, which comprises a set of tools that operate in a modular approach to address forecasting, risk management, and decision-making. The tools are developed to align with the operation of a VPP acting as a commercial DER aggregator. The VPP aims to engage in medium-term bilateral contracts, while simultaneously determining its participation (i.e., offering/bidding) in short-term markets, such as pool-type day-ahead energy markets. This strategy is designed to create an optimal portfolio that includes different types of DERs, maximizing benefits for all parties involved.
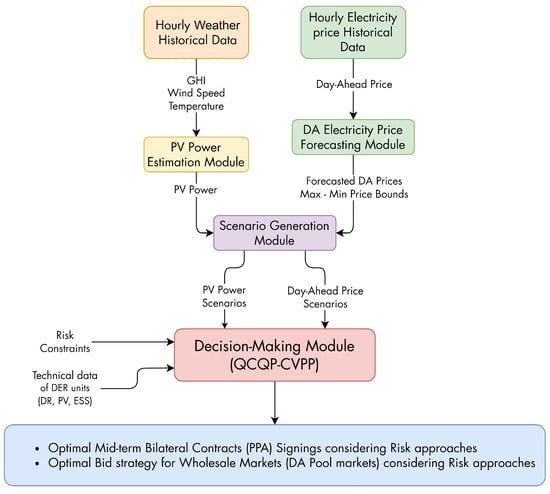
Figure 1.
Schematic modeling of the proposed decision-making tool based on the CVPP optimal stochastic bidding strategy problem.
This portfolio may encompass any scale PV assets, energy storage systems, and demand response schemes, which do not necessarily need to be geographically proximate. However, it is assumed that the owners of these DERs possess metering infrastructures that provide necessary information for the operation of this module.
Despite the geographical disparity among various DER assets, their management and aggregation are centralized through this tool. As shown in Figure 2, bidirectional data flows are expected from different DER owners and the primary grid, including offers for future and current energy capacity (continuous lines), market gains, and pricing (dotted lines). It is important to note that this tool is presented from the perspective of the VPP, rather than that of the DER owners. Other standpoints will be addressed in future developments.
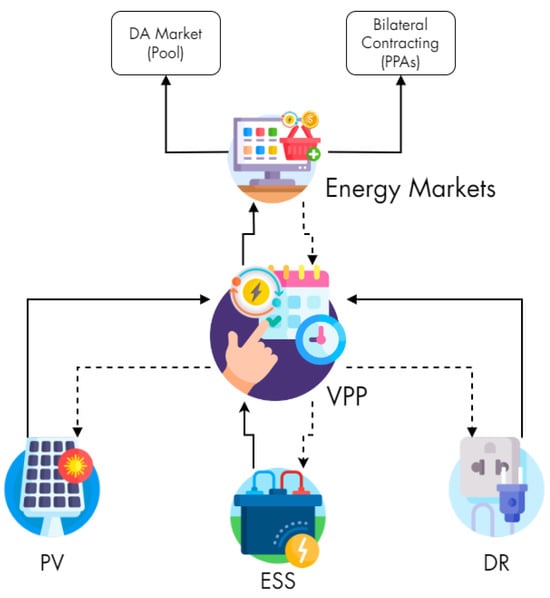
Figure 2.
DER asset selection scheme for participation in different market modalities through CVPP.
The following sections provide a detailed breakdown of the different components and modules considered during the creation of this tool suite. Each section explores specific elements and their roles in the overall development, offering an informative overview of the multifaceted approach used to craft these tools.
2.1. Scenario-Based Uncertainty Representation
To handle variables with uncertainty, this suite of tools utilizes two distinct approaches. For day-ahead market prices, the Time2Vec Transformer Encoder (T2V-TE) forecasting model is used. It is based on transformer encoders and enhanced with capabilities to capture short and long-term temporal dependencies, such as Time2Vec [82] introduced in [76]. It provides an interval probabilistic forecast in the first stage. However, any multi-step forecasting model such as those presented in [83] can be used for this task. In the second stage, Montecarlo simulations were used to construct multiple scenarios based on a normal probability density function (PDF) for each hour, guided by the forecast values, as well as upper and lower bounds provided by T2V-TE. The scenarios based on normal PDFs in this case are supported by the exploratory data analysis that feeds the forecasting model, as well as previous studies such as [84] The for each hour t is presented in Equation (1), where and are the mean value and the standard deviation of the electricity price .
Conversely, To create a tool that is adaptable to various facilities and geographical locations, a Montecarlo simulation environment was developed. The tool aims to encompass as many operational conditions of PV power as possible while accounting for linked uncertainties. The PDF of these data was derived from modeling PV AC power based on meteorological features (specifically, temperature, wind speed, and GHI from a specialized database) [85], as shown in Equation (2), where is the rated power of PV facility, and are reference temperature (25 °C) and hourly solar cell temperature, respectively. and are the reference (1000 W/m2) and the irradiation for hour t. is the maximum temperature coefficient of the solar cell (commonly −0.5%/°C). Moreover, is the efficiency of the DC/AC inverter, and represent the percentage of power lost from various sources, such as wiring, degradation, and dust, among others, in PVs. This value is typically around 15%.
In this case, PDF modeling assumes both temperature () and irradiation () follow normal probability density functions, as shown in Equation (3). This approach is also supported by the previous studies [84,86]. Notice that each PDF of these variables is modeled independently.
Additionally, due to the modular design of this suite, prior to the production scenario of a generation component, it allows easy integration of another point or probabilistic PV power forecasting models to further support and enhance this module with greater accuracy. For instance, the forecasting models presented in [87,88], among others could be introduced. Nonetheless, the setting up of these forecasting models will be a product of future development. Finally, it is important to mention that, according to the schematic model of the tool presented in Figure 1, the scenario generation module processes both variables (i.e., electricity price and PV power) independently.
To reduce computational costs, both cases incorporate a scenario reduction stage called Fast-Forward [89]. The heuristic approach employed in this stage identifies and eliminates scenarios that are unlikely or insignificant, and that have minimal or no impact on the final result. In this instance, the Kantorovich distance has been employed as the criterion for this reduction, as outlined in [90].
2.2. Optimal Bidding Decision-Making Module
The decision-making module focuses on determining the optimal offering strategy of a VPP acting as a DER aggregation market agent, modeled through a quadratically constrained quadratic optimization problem (QCQP). The model applies stochastic programming with a one-week time horizon, with the purpose of maximizing total profits. The VPP aims to secure mid-term bilateral contracts with different DER owners, such as PPA (capacity payment), for energy procurement while also deciding its involvement in the day-ahead market (i.e., pool). This allows for the formation of an optimal and diversified portfolio of available DERs (i.e., aggregation). Various types of these resources have been considered, including small and medium-scale PV units (PV), ESS, and DR schemes.
The module also incorporates several uncertainty parameters, including high volatility of day-ahead market prices and PV power production. These uncertainties may increase the standard deviation of the VPP benefit function. Therefore, the model uses a risk management methodology such as CVaR to strike a balance between the expected benefit of the VPP and the related risk as discussed below.
The objective function presented in Equation (4) consists of two parts [91]. The first part aims to maximize the expected profit of the VPP, while the second part includes the CVaR formulation to represent the risk-aversion profile of the VPP operator. The expected profit of the VPP includes the profit obtained from bilateral contracts (e.g., PPAs), the profit obtained from the day-ahead market under hourly resolution t, and the cost of capacity rental contracts acquired from various DER owners over the medium-term determined by the time horizon H. The weighting coefficient of the function, , is a key element, as it represents the risk profile of the tool operator. As the value of approaches 1, the approach becomes more conservative and less risky. Additionally, if is zero, the risk profile becomes risk-neutral with higher risks. The following constraints define the variables used in this function.
The objective function is subject to the following constraints: Bilateral contracting usually involves a period before execution. Therefore, within a medium-term planning horizon, the VPP can determine the number of bilateral contracts and the volume that should be finalized before making short-term decisions related to negotiations in the day-ahead market. Equations (5) and (6) determine the economic quantity of the contract (in kWh), as a percentage of the demand that the VPP is able to meet, [46]. Likewise, Equation (7) establishes that this quantity cannot exceed the capacity of the VPP (i.e., DER capacity aggregation).
After determining the quantity to be met through bilateral contracts, the VPP manager must then determine their purchases and sales in the day-ahead market. Equation (8) expresses the equivalent power of the VPP for energy trading in a specific hour and scenario (day-ahead price and PV power), . It is composed of the different types of aggregated DERs (i.e., PV—, DR—, and ESS— assets) that are selected (represented by , , and , respectively) for energy generation in both market structures.
Equation (9) ensures that the energy produced by DERs contracted within the VPP, minus the energy committed in the bilateral contracting, should align with the day-ahead market energy transactions for each time t and scenario s, . To prevent infeasibility in certain operational scenarios, represents the amount of PV power production that can be curtailed at time t and scenario s. This is due to the possibility of certain scenarios s presenting a significantly higher power production than necessary, as presented in Equation (10).
The maximum contribution of contracted demand response for each time period t and scenario s, as depicted in Equation (11), is solely assumed as a load reduction, which can be on a residential or aggregate scale. However, it is assumed that the necessary ICT infrastructure is in place to send the data to this tool.
According to [92,93,94], Equations (12)–(18) describe a mathematical model for the correct and coherent operation of the different energy storage systems (ESS) for each time t and scenario s, based on technical information provided by ESS owners, such as depth of discharge , the ESS charging/discharging power and efficiency , and the state of charge . It is important to note that for the numerical cases in this paper, the charging and discharging efficiencies for each ESS are similar. In terms of decision-making, and correspond to binary variables that include/exclude these assets from market participation.
Finally, Equations (19)–(21) are commonly used in CVaR-based risk modeling [71,95]. The variable , which represents the confidence level, appears in the second term of the objective function. In this context, denotes the Value-at-Risk (VaR) considering the risk profile , while is a non-negative auxiliary variable. It is equal to the difference between the VaR and the CVPP profit () for any scenario s, and is zero unless the associated benefit is less than the VaR [96].
This formulation of the model considers the conditional value-at-risk measure at a confidence level (-CVaR) to be the expected value of returns less than the -quantile of the return distribution. A confidence level of = 0.98 has been considered in this instance (i.e., 2% of the most extreme values, or -CVaR = 0.02), to minimize the risk of losses, provide greater robustness to adverse events and conditions, and result in greater stability in the returns obtained over time, which is important for participation in these market structures considering aspects such as economies of scale, market behavior, among others.
3. Results and Discussion
To demonstrate the capability of the toolkit described in the previous section, we present case studies that address different operational scenarios considering the effect of changes in risk-aversion/neutrality profile and the inclusion of the mandatory DER asset participation policies. All of these are based on the economic data from the Colombian electricity market considering its policy contexts.
The case studies illustrate the decision-making strategies of this tool under uncertainty, specifically the risk proposed for a commercial VPP under the QCQP approach. The objective is to identify a medium-term portfolio of the DERs available for signing bilateral contracts and their participation in the wholesale market in the short-term (i.e., day-ahead or pool). The goal is to promote a DER widespread integration from this aspect.
All modules in this tool were developed using Python 3.10 on a Windows® PC with an Intel® Core i5+ 10300H at 2.5 GHz processor and 16 GB of RAM. Depending on the function of each module, additional libraries were used. Operational scenario generation was implemented using the Statsmodels library [97]. The forecasting model was implemented using Keras and TensorFlow libraries [98]. Adam [99] training optimization algorithm is applied, which is one of the most commonly used solvers for deep learning applications. The formulation of the proposed QCQP model was achieved using the Pyomo library [100,101] with MOSEK solver [102,103].
3.1. Input Data
The required input data for this tool can be divided into two parts: data related to forecasting uncertain variables, and data linked to the QCQP optimization problem. The most important elements in each case are described below.
3.1.1. Variables with Uncertainty
In this case, the uncertainty variables include PV power production at different locations and capacities using meteorological features from specialized databases such as NSRDB [104,105], along with subsequent modeling based on the physical conditions of each unit [85,106,107]. Additionally, hourly signals of electricity prices in the Colombian day-ahead wholesale market from the grid operator in [108] are included.
Table 1 and Figure 3 display the performance of the electricity price probabilistic forecasting model outlined in Section 2.1, along with the various scenarios generated using the module described here for a one-week horizon. Error indicators, including point-wise (MAE, RMSE, MAPE) and probabilistic (PICP) approaches, were used to evaluate the performance of the forecasting model. The various operational scenarios are represented based on the Monte Carlo simulation process.

Table 1.
Evaluation of electricity price forecasting module using performance metrics.

Figure 3.
Day-ahead market electricity price scenarios considered for this study (168 h): Multiple multi-colored lines representing different hourly day-ahead electricity price scenarios over a week.
The performance results presented in Table 1 show that the model accurately predicts the time features of the uncertain variable. This accuracy is even higher for price scenarios since the forecast intervals used to construct scenarios are very reliable (over 90% according to PICP). This can be observed in the trend of the electricity price signals, where the variability of the prices, and therefore of the scenarios, is higher for the peak hours (hours 19 and 20 of each day considered).
Table 2 shows the technical-economic characteristics of each PV unit located as described in Figure 4. To accurately represent and manage the operational uncertainty of these DER assets during the considered time horizon, as described in detail in Section 2.1, Figure 5 shows the different power generation operative scenarios of each proposed PV unit, where each colored line represents one of them.

Table 2.
Features of PV units considered for contracting/Day-Ahead bidding.
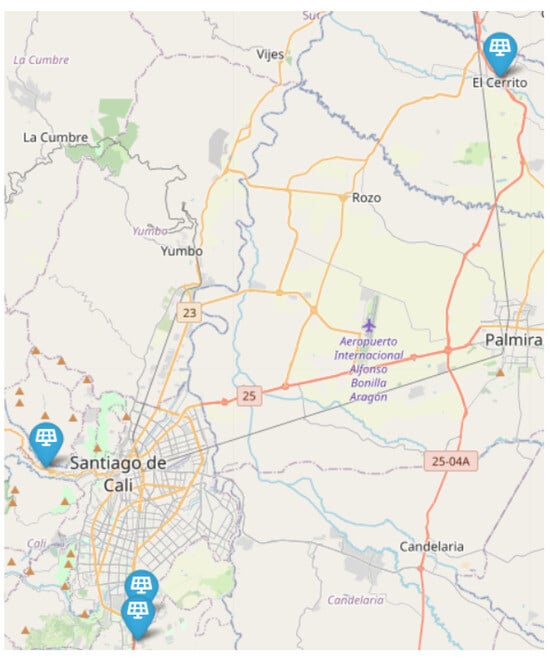
Figure 4.
Geographic location of each PV unit considered for this study: blue pins mark unit positions.
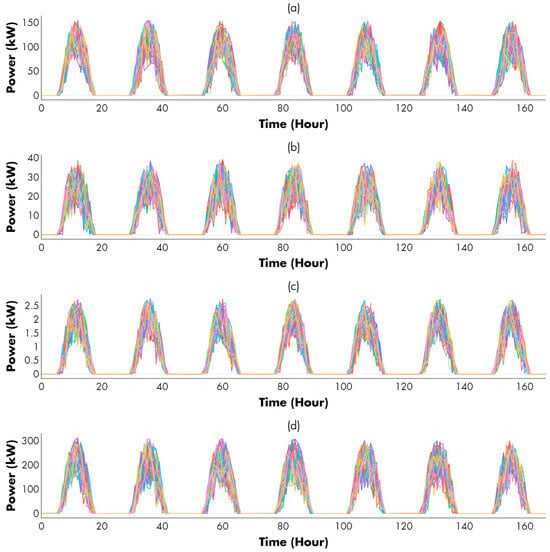
Figure 5.
Power generation scenarios of the PV units considered for this study: Multiple multi-colored lines representing different hourly power output scenarios over a week for PV1 (a), PV2 (b), PV3 (c) and PV4 (d) units.
The outlined features demonstrate that the considered PV generation units can span diverse scales (residential, institutional, among others) and need not be geographically proximate (up to 40 km between in this case), as depicted in Figure 4 generated using the Python Folium API version 0.16.0. [109], employed in the development of this tool. This illustrates that neither the size nor the distance between these installations pose a limitation for this decision-making tool, provided the described ICT is in place.
In addition, it is assumed that the power that PV owners can commit (Firm Energy) to bilateral contracts is low (about 15–25% on average) as shown in Table 2, considering the high level of uncertainty associated with this variable. Likewise, it is assumed that each PV owner is free to bid the price for the available capacity of their unit. However, the decision module has no binding obligation to them, unless market conditions require it in order to hit profit maximization with high reliability.
Therefore, as illustrated by the various operational scenarios generated and depicted in Figure 5, diverse operational conditions, associated with weather variables, have been taken into account. These conditions either constrain or enhance energy production in each of these units. Such consideration reflects a proficient handling of the uncertainty associated with this variable, thereby influencing the decision-making process facilitated by this tool. It is important to note that it is assumed that all scenarios, including 50 scenarios (obtained using scenario reduction techniques such as FastForward [90]) to balance the computational burden and model formulation, have the same probability of occurrence for both variables with uncertainty.
3.1.2. Decision-Making Inputs
The deterministic parameters required as input for the decision-making module, include the technical-economic characteristics of ESS units and demand response schemes. Additionally, essential data for mid-term bilateral contracts are needed, such as contract prices and the maximum energy quantity to be committed by the CVPP in these agreements. Further details on each aspect will be provided below.
The energy storage facilities considered for this model are detailed in Table 3. It is important to note that the proposed model assumes the CVPP manager will lease the capacity of the ESS units for medium-term bilateral contracts and participation in day-ahead markets. Therefore, given this context and acknowledging the reduced lifespan, this type of DER will likely have the highest bid costs among the resources to be offered. This is due to the interest of the owners in recovering their investment. As mentioned above, the initial declared energy of each ESS unit will be measured before signing bilateral contracts with the VPP. The time horizon is one week.

Table 3.
Techno-economic energy storage systems feature as candidates for bilateral contracting and DA bidding.
Similarly, The technical-economic features of the demand response schemes that were used as inputs for the decision-making tool during its testing phase for this study are presented in Table 4. These DR schemes state the prices per kilowatt-hour and the corresponding maximum load reductions weekly. It is worth noting that these offer prices are usually the lowest among all types of DERs presented, as they do not incur any additional meaningful investment. Furthermore, it is relevant to note that, as with the PV units, DR schemes of various scales (even at aggregated levels) can also be considered.

Table 4.
Features of DR scheme units considered for contracting/DA bidding.
Additionally, this study considers a scenario wherein the decision-making tool needs to establish a portfolio of the DERs for optimal participation in supplying a weekly bilateral contracting. To achieve this, the tool requires the prices and maximum capacities to commit, which, in this case, are 1.5 MW at a fixed price of 285 $COP/kWh. This price corresponds to the electricity contract price signal delivered by the market operator [110], and the energy commitment quantity is directly linked to the production limits of the DER candidates for the CVPP and the minimum capacity set according to the regulatory framework in which it is applied. In this case, it aligns with the one presented in [111].
3.2. Simulation Results
This section presents the results obtained from the decision-making tool for medium- (weekly PPAs) and short-term (day-ahead) horizons. The following cases are considered to corroborate the effectiveness (i.e., evidence of compliance with obligations related to bilateral contracts with customers and DER owners considering price and production uncertainties) of the proposed tool under different operative scenarios:
- Case 1: Risk-neutral DERs participation in bilateral contracts and day-ahead markets.
- Case 2: Risk profile incidence on DERs participation in bilateral contracts and day-ahead markets.
- Case 3: Incidence of mandatory participation of certain types of DER (ESS) in the CVPP for bilateral contracts and day-ahead markets.
3.2.1. Case 1
Considering the price signal, the PV power data, and the technical-economic features of the various DERs presented in the previous subsection, we address the decision-making problem presented in Equations (4)–(21) to accurately determine which DER assets should be chosen for the VPP in the different market modalities under consideration. In this analysis, we assume that the CVPP manager is risk-neutral, thus disregarding the financial risk associated with the uncertainty of electricity prices and power production of the PV units; hence, .
The decision-making tool provides a significant benefit by leveraging the difference between the revenue generated from selling energy to customers in the proposed market modalities and the cost associated with renting the capacity of the committed DERs. Based on the simulation results, all DR and PV assets (i.e., DR1 to DR4, and PV1 to PV4) were selected to sign bilateral contracts and participate in the day-ahead market. The cost of leasing the capacity of the mentioned DER during the following week was 29.66 million COP. In the medium-term perspective, the tool highlights the formalization of a weekly bilateral contracting covering a total of 1096.1 kWh, representing 73.07% of the capacity that can be committed by the CVPP. This outcome signifies that the revenue derived from energy sales through contracts amounts to $52.48 million COP, surpassing the income generated from leasing the selected DER assets (i.e., 76.9% higher).
Figure 6 illustrates the total energy exchanged by the CVPP with the day-ahead market throughout the entire week in compliance with the contractually agreed-upon conditions in the medium-term horizon, considering all the uncertainty scenarios outlined above using hourly boxplots. This exchange can occur through either selling (positive values) or buying (negative values), depending on the established conditions.
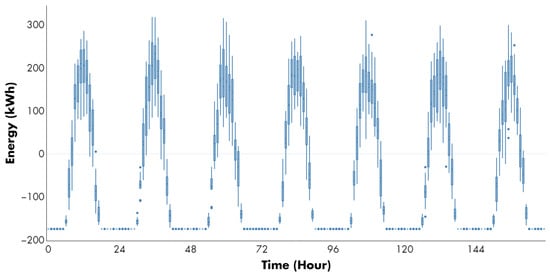
Figure 6.
Energy trading made by the decision-making tool in the day-ahead market under risk-neutral profile (Case 1: ). Blue dots represent outlier values of traded energy in kWh for each hour of the analyzed period.
Upon closer examination, it is clear that the tool has selected PV units as the primary source of energy for trading in this market, as shown by their characteristic curves. When solar resources are limited or unavailable, the CVPP prefers to purchase energy to meet its medium- and short-term commitments. Conversely, during the remaining hours, the CVPP finds it advantageous to sell surplus energy from these units, particularly between 9 and 14 h on average each day. This statement also implies that through the use of CVPP, a significant portion of the contracted capacity in PPAs with DR assets is assured. Under these conditions, the use of ESS is entirely set aside due to its lack of profitability considering the income-rental cost ratio in relation to other assets. Similarly, as depicted in Figure 7, the tool models the behavior of the CVPP as if it were a conventional generation unit dispatchable from the perspective of other market agents. However, in reality, it represents an aggregation of multiple and different types of DERs. This representation aligns with the regulatory frameworks in early transition phases, such as the one addressed in this study, as they become more mature. To summarize, setting the parameter to zero assumes that the CVPP manager is entirely risk-neutral. Therefore, the objective is to maximize the expected weekly profit in both markets, without considering worst-case scenarios that could result in significant economic losses. In other words, under this assumption, the expected profit for the CVPP during the considered time horizon after the bilateral contract and a day-ahead market participation, and rental capacity payment is 20.20 million COP.
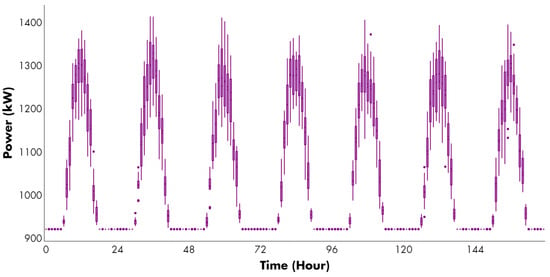
Figure 7.
Available power generation under a risk-neutral profile (Case 1: ). Purple dots represent outlier values of power generation in kW for each hour of the analyzed period.
3.2.2. Case 2
In this case, we reevaluate the previously proposed decision-making tool for various values of risk profiles (), ranging from 0.0 (risk-neutral profile, as in Case 1) to 1.0 (risk-averse profile). The objective is to discern the suitability of different DER assets for participation in both markets under varying risk approaches. Additionally, considering the uncertainty associated with electricity prices and PV power generation, the objective is to determine the optimal amount of energy subject to early trading through bilateral contracting and the remaining energy exchange in the day ahead market as the risk-aversion profile is higher. This approach aims to mitigate financial risks linked to profit volatility.
Initially, as the risk profile () increases, the tool shows less inclination to engage in bilateral contracts, as shown in Figure 8. In the highest risk scenario, the tool recommends subscribing to bilateral contracts for 1029.5 kWh, which is 66 kWh less than in Case 1, incorporating only the DR1 to DR4 demand response schemes and the PV4 photovoltaic unit as the DER assets for participation in both market modalities. This marks a substantial reduction in capacity rental costs (25.65 million COP, 6.64% lower than in Case 1), contributing to the mitigation of associated risks.
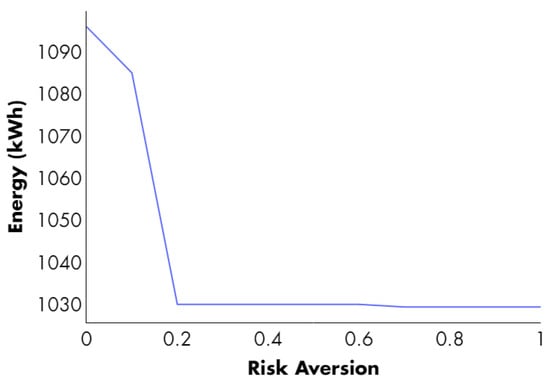
Figure 8.
Influence of the risk profile on the decision-making process for signing bilateral contracts with DER assets (Case 2).
The response of the tool reflects its adaptability to the fluctuating conditions of bidding and resource availability, aiming for optimal decision-making that maximizes profitability. The hourly wholesale market price, derived from historical data from the Colombian electricity market, does not reach a sufficient level to encourage the aggregation of additional DER assets in the tool through the CVPP under these specific circumstances. This underscores the tool’s dynamic adaptation to prevailing market conditions and underscores its commitment to strategic decision-making to maximize profits.
Figure 9 displays the hourly energy trading in the day-ahead market under the maximum risk-aversion profile, ( = 1) for the specified time horizon and operative scenarios. Similarly to Case 1, the tool can function as both producer and consumer through the CVPP, taking advantage of different energy prices or meeting commitments, as indicated by the positive/negative values. This remains true even in unfavorable circumstances, as demonstrated by the outliers (instances where there are significant energy purchases due to lack of energy resources, represented by loose dots in this figure).
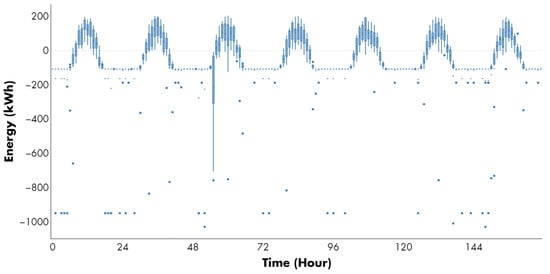
Figure 9.
Energy trading made by the decision-making tool in the day-ahead market under a risk-averse profile (Case 2: ). Blue dots represent outlier values of traded energy in kWh for each hour of the analyzed period.
It is important to note that the total generation in the CVPP falls below the amount agreed in the bilateral contracts for certain time intervals each day within the proposed time horizon (hours 1 to 8 and 17 to 24 of each day) due to default risks associated with energy production and price uncertainty. To meet its needs and cover the generation shortfall linked to the commitments made, the tool must purchase energy in the day-ahead market. During the remaining hours, the tool aims to sell any surplus energy, typically generated by the PV units. This behavior is similar to that presented in the risk-neutral case, but the energy amounts are smaller (i.e., resulting in a decrease in participation in the day-ahead market, particularly in energy purchases: 42 kWh lower on average).
Figure 10 shows the program outcome for the DERs selected under the specified conditions of maximum risk aversion. Similarly to Case 1, the tool behaves like a conventional power generation in the market, largely supported by the DR schemes contracted in this case, even when subjected to these stringent risk-aversion conditions. This supports the claim about the adaptability of the decision-making tool to various market participation regulatory contexts. Future work in this regard is oriented to consider uncertainty in RD schemes to strengthen the decisions made by this tool.
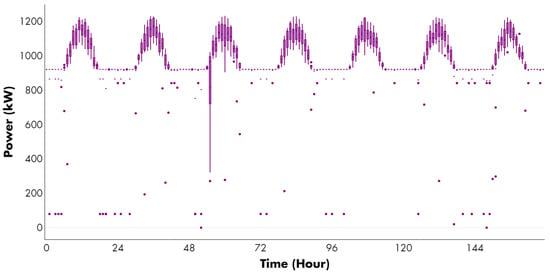
Figure 10.
Available power generation under risk-averse profile. (Case 2: ). Purple dots represent outlier values of power generation in kW for each hour of the analyzed period.
In summary, incorporating increasing risk profiles leads to more conservative solutions compared to the risk-neutral approach of Case 1. This, in turn, leads to a diminishing market share (from PV1, PV2, and PV3 units) across the considered time horizon, consequently resulting in reduced profits. Table 5 compares the expected revenues of the tool against its CVaR risk measure, exploring different values of the risk-aversion profile . Notably, a smaller generates a solution with higher expected gains but also heightened risk. Conversely, opting for a larger value produces a solution with lower expected profit and diminished risk (19.93 million COP).

Table 5.
Expected decision-making tool revenues versus CVaR.
Upon closer examination of the aforementioned table considering changes in the risk-aversion profile, the conditional value-at-risk stops growing when the profile reaches 0.3 and remains stable until reaching 0.9. Finally, when risk aversion is maximum, it slightly increases again. This indicates that a point has been reached where the most extreme losses have ceased to have a significant impact on the CVaR. This can be explained by the fact that, in this case, the increase in losses is related to the variables that present uncertainty across different operational scenarios, namely PV power and hourly electricity prices. However, a large portion of the available energy from the CVPP comes from DER that were not modeled with uncertainty, such as demand response schemes. Therefore, a moderate risk-aversion profile with small participation of PV units or low prices for buying and high prices for selling energy does not represent significant drawbacks in maximizing profits.
This also implies that in maximum risk-aversion and neutrality profiles, these stability effects are not as effective, represented in decisions to include or exclude DER assets, or to buy and sell energy in these scenarios.
3.2.3. Case 3
Considering the information presented in the previous cases, we revisit the decision-making problem presented in Equations (4)–(21) to determine which DER assets should be selected by the decision-making tool in the various market structures under consideration. In this case, we will assume, as in case 2, that the risk profile has an impact on the tool, in addition to the mandatory participation of some DERs. Specifically, at least one ESS unit must participate, and its impact on the profit results must be considered. To account for this case, we have added the constraint presented in Equation (22) to the decision-making model. It should be noted that the selection of this ESS was motivated by its substantial influence on the computed benefits, as shown by the selected DER assets, in which ESS does not appear at all.
As shown in Case 2, we modified the risk-aversion profile to analyze the effect of incorporating mandatory ESS participation on the market participation obtained with the decision-making tool. As illustrated in Figure 11, the energy committed to bilateral contracts increased slightly across all risk profiles, from 1096.1 kWh to 1129.4 kWh (2.22% higher) in the risk-neutral profile, and from 1029 kWh to 1036.1 kWh (1.01% higher) in the maximum risk-averse profile. However, the increase in risk did not significantly affect the willingness to sign bilateral risk-based contracts in this case. Similarly to case 2, the amount contracted decreased as the risk profile increased. However, for moderate and high-moderate cases of risk (), most bilateral contracts were still maintained. This demonstrates the usefulness of the ESS in this market modality.
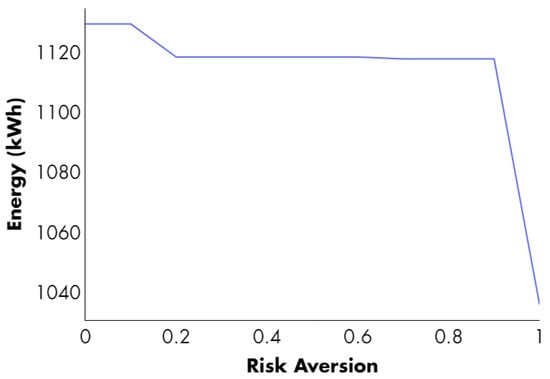
Figure 11.
Incidence of the risk profile on the decision-making process for signing bilateral contracts with DER assets considering mandatory ESS market participation (Case 3).
This is evident in the selected DER assets for each case, where no further modifications are made other than the selection of the ESS in each case. Specifically, DR1 to DR4, PV1 to PV4, and ESS1 when , and DR1 to DR4, PV4, and ESS2 when . However, by incorporating more expensive DER assets per kWh as ESS1 and ESS2, the capacity leasing costs are higher compared to the previous cases (6.21 million COP more expensive in the neutral-risk profile, and 1.53 million COP more expensive for the maximum risk-aversion profile). This reflects a significant reduction in profits over the time horizon considered as risk aversion increased, which in this case is 18.93 million COP when the risk is neutral (6.71% lower than Case 1), and 19.56 million COP at the maximum level of risk aversion (1.01% lower than Case 2). This profit reduction is also a result of the increased need to buy energy resources in the market structures such as day-ahead to offset capacity rental costs.
This is demonstrated in Figure 12 and Figure 13, which display the energy transactions performed by the decision-making tool in the day-ahead market, using both risk-neutral and risk-averse approaches, respectively. The observed behavior over the considered horizon in both figures is very similar to that presented in the buying/selling decisions of the tool in the day-ahead market for cases 1 and 2, respectively. However, it is worth noting that DER assets ESS1 and ESS2 actively participate in buying and selling energy in the market when and = 1.0, respectively, during hours with low or no solar resources. In fact, arbitrage processes (i.e., activities where energy is purchased at a lower price and sold at a higher price to make profits [35]) can be observed in this sense. However, the reduction in market share and thus higher purchasing needs as the risk profile increases remains unchanged.
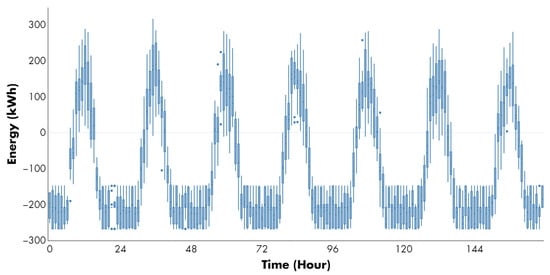
Figure 12.
Energy trading made by the decision-making tool in the day-ahead market under ESS mandatory participation and risk-neutral profile (Case 3: ). Blue dots represent outlier values of traded energy in kWh for each hour of the analyzed period.
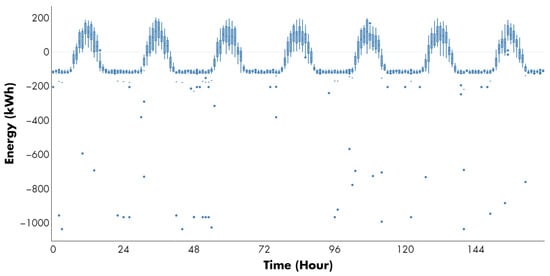
Figure 13.
Energy trading made by the decision-making tool in the day-ahead market under ESS mandatory participation and risk-averse profile (Case 3: ). Blue dots represent outlier values of traded energy in kWh for each hour of the analyzed period.
This fact extends to the power generation of the DER assets available in the CVPP, both for risk-neutral and maximum risk-aversion profiles, as shown in Figure 14 and Figure 15, respectively. This implies that the market commitments of ESS1 and ESS2 in their respective risk profiles are leveraged mostly on the buy/sell (charging/discharging) behavior in the day-ahead market. This is due to the favorable variability of electricity prices presented in different scenarios, which offsets capacity rental costs and generates additional revenues.
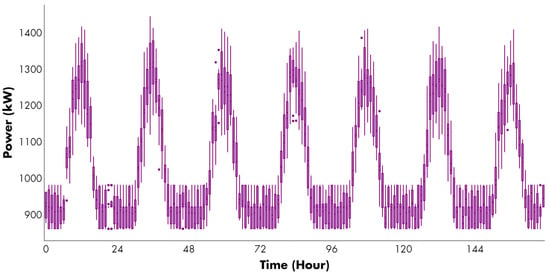
Figure 14.
Available power generation under ESS mandatory participation and risk-neutral profile (Case 3: ). Purple dots represent outlier values of power generation in kW for each hour of the analyzed period.
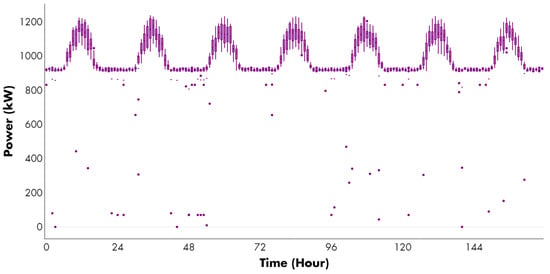
Figure 15.
Available power generation under ESS mandatory participation and risk-averse profile (Case 3: ). Purple dots represent outlier values of power generation in kW for each hour of the analyzed period.
On the other hand, it can be seen that the behavior of the decision-making tool in relation to the power availability through the CVPP aligns with that exhibited by a conventional power generation utility, consistent with all cases proposed. Consequently, incorporating mandatory participation constraints for specific types of DER assets does not pose any hindrance to the optimal operation of the tool. In fact, it could emerge as a robust planning alternative.
Regarding the specific results of this case, the CVPP obtained most of its energy through demand response schemes during the studied time horizon. These schemes were demonstrated to be cost-effective and reliable assets in the presented cases. In addition, the PV units contributed significantly to the available power generation, particularly in the day-ahead market due to their inherent features. For these units, the decrease in available power generation as the risk profile increases reflects a more conservative position. The maximum curtailment was around 200 kW. It is worth noting that the mandatory participation policy did not drastically affect the results of this particular case, which generates some broad similarities with the behaviors obtained in cases 1 and 2.
4. Conclusions
This paper describes the development of a set of computational tools designed for the integration of different types of DERs for decision-making in market participation. The goal was to enable the efficient participation of these resources in different short and medium-term energy market structures such as day-ahead and bilateral contracting, respectively. This process involves the interaction of various tool modules, such as forecasting, to provide price signals and PV production forecasts through deep learning models. Additionally, uncertainty modeling is employed using probability distribution functions, which are then fed into a decision-making module employing stochastic programming. This module is formulated as a QCQP problem based on the operation of a CVPP, which can be efficiently solved using high-performance solvers.
The computational tools were tested in three different scenarios to assess their behavior under varying operating and risk conditions. In Case 1, a risk-neutral model was used to solve the problem using data from each module. This helped to determine which DER assets would be more profitable for the considered market approaches. The results of Case 1 confirm that the toolkit can represent DERs as a conventional generation unit, allowing it to participate in both traditional market modalities and align better with transitions toward market modalities focused on widespread DER usage. Furthermore, the decision-making module showed significant activity in energy exchange within the day-ahead market, despite substantial fluctuations in the PV generation and electricity prices. The decision-making module already had over 70% of available capacity committed to bilateral contracts.
In Case 2, the toolkit considered the effect of the shift in risk profile (from risk-neutral to risk-averse) on the selection of the DER assets that participate in market approaches and their returns. This is based on the findings of the previous case. As the risk profile becomes more conservative, the decision-making module decreases its involvement with the day-ahead market. The module excludes less profitable assets and avoids participating in bilateral contracts where the gains do not offset the costs of leasing the assets (about 4.5% of the available capacity). Even so, its objective is to maximize the profit. Also, in this case, the toolkit acts as a conventional generation unit, as demonstrated in Case 1, highlighting its robustness in these types of scenarios. It should be noted that none of the ESS units were selected due to the high leasing and investment costs related to this type of asset.
In Case 3, the effect of including mandatory participation conditions for a specific type of DER asset (in this case, ESS assets, which were not selected in Cases 1 and 2) in the decision-making module was studied, considering the data, outcomes, and conditions of the previous cases. The results of this case showed that as the risk profile becomes more conservative , the behaviors observed in case 2 remain consistent. This includes less interaction with the day-ahead market, fewer DER assets being considered for bilateral contracts (nonetheless, this occurs with a higher risk profile than in case 2), and lower profits. However, during hours of low PV production, the behavior of the selected ESS assets becomes more apparent. There is evidence of the arbitrage processes at these hours. In the scenarios considered, there are greater purchases of energy during the off-peak hours (hours 1 to 6 and 18 to 24) for the sale of surpluses during peak hours. This is accomplished in search of the highest possible profit, even when considering the change of ESS to lower capacity (ESS2 to ESS1) with a more conservative risk profile. The trend observed in cases 1 and 2 is also maintained in this case in terms of the behavior of the tool compared to conventional generation units. This makes additional options viable when considering participation in energy markets through DER in other operational or planning scenarios as a regulatory sandbox as proposed in this research.
This article also highlights the use of both forecasting models in the case of electricity prices, as well as the use of climatological variables and the modeling of photovoltaic production for the generation of the different operational scenarios taken into account through Monte Carlo simulations. The results of the cases presented demonstrate that these approaches can be reliable for this task, presenting both realistic favorable and adverse scenarios that fed the decision-making module and the development of the cases presented.
Although the models and techniques employed in the forecasting and uncertainty modeling modules have an excellent capability to perform their respective tasks, including decision-making under uncertainty, they require a significant amount of computational resources. As a result, other techniques and approaches to decision-making under uncertainty, such as Information Gap Decision Theory (IGDT), can be taken into account. These alternative methods could potentially offer more computationally efficient solutions, especially in scenarios with a large number of uncertain variables or complex decision spaces.
In addition, other existing market modalities, such as futures markets, can be considered in this model. The incorporation of futures markets would allow for hedging strategies and risk management approaches, thereby enabling more comprehensive decision-making processes for DER aggregators and energy market participants. Furthermore, other types of DERs, such as electric vehicles and biomass-based generation, can be integrated into the proposed framework. The integration of electric vehicles would introduce novel dimensions of flexibility and uncertainty, necessitating adaptations in the forecasting, optimization, and decision-making modules. Similarly, the incorporation of biomass-based generation would necessitate the modeling of biomass supply chains, resource availability, and associated uncertainties.
These settings will be the subject of future research. By addressing these aspects, the proposed framework can be further enhanced, enabling more robust, efficient, and comprehensive decision-making processes for the aggregation of DERs and their participation in energy markets under uncertainty.
Author Contributions
Conceptualization, R.M.-C. and S.C.-L.; methodology, S.C.-L. and R.M.-C.; software, S.C.-L.; validation, S.C.-L., R.M.-C. and D.C.; formal analysis, S.C.-L. and R.M.-C.; investigation, S.C.-L. and R.M.-C.; data curation, S.C.-L.; writing—original draft preparation, S.C.-L. and R.M.-C.; writing—review and editing, S.C.-L., R.M.-C., D.C. and G.J.A.; visualization, S.C.-L. and G.J.A.; supervision, R.M.-C.; funding acquisition, D.C. All authors have read and agreed to the published version of the manuscript.
Funding
This research received no external funding.
Data Availability Statement
The original contributions presented in the study are included in the article, further inquiries can be directed to the corresponding authors.
Acknowledgments
The authors would like to thank the support provided by Universidad Icesi and Universidad Autónoma de Occidente in Cali, Colombia, as well as the Faculty of Engineering at Universidad de la Sabana in Bogotá, Colombia.
Conflicts of Interest
The authors declare no conflicts of interest.
Abbreviations
The following abbreviations are used in this manuscript:
| BC | Bilateral Contracting |
| CVPP | Commercial Virtual Power Plant |
| DR | Demand Response |
| DER | Distributed Energy Resources |
| ESS | Energy Storage System |
| ICT | Information and Communication Technologies |
| PV | Photovoltaic units |
| QCQP | Quadratically Constrained Quadratic Programming |
| PPA | Power Purchase Agreement |
| VPP | Virtual Power Plant |
| Sets | |
| H | Set of time periods (time horizon) |
| Set of electricity price and PV production scenarios | |
| Set of PV candidates for bilateral contract signing/day-ahead market agreement | |
| Set of ESS candidates for bilateral contract signing/day-ahead market agreement | |
| Set of DR scheme candidates for bilateral signing/day-ahead market agreement | |
| Indexes | |
| t | Index of time periods (hours) ranging from 1 to H |
| j | Index of PV units ranging from 1 to |
| e | Index of ESS units ranging from 1 to |
| d | Index of DR schemes ranging from 1 to |
| s | Index of electricity price and PV production scenarios ranging from 1 to |
| Constants | |
| Sale price of bilateral contract ($ COP/kWh) | |
| Maximum amount that can be sold in bilateral contracting (kWh) | |
| CVaR Confidence level | |
| Weighting factor to balance expected profit and CVaR (risk profile). | |
| Parameters | |
| Probability of occurrence of operating scenario s | |
| Pool market price in period t and scenario s ($ COP/kWh) | |
| Power production of PV unit j in time t and scenario s (kW) | |
| Capacity offer price declared by the owner of PV unit j ($ COP/kWh) | |
| Capacity offer price declared by the owner of ESS unit e ($ COP/kWh) | |
| Capacity offer price declared by the provider of DR scheme d ($ COP/kWh) | |
| Capacity of PV unit j during a medium-term period declared by its owner (kW) | |
| Capacity of ESS unit e declared by its owner (kW) | |
| Upper limit of curtailing power of DR scheme d declared by its provider (kW) | |
| Depth of discharge window width of ESS unit e declared by its owner | |
| Maximum charging rate of ESS unit e declared by its owner (kW) | |
| Maximum discharging rate of ESS unit e declared by its owner(kW) | |
| Initial energy of ESS unit e declared by its owner for all scenarios (kWh) | |
| Charging/discharging efficiency of ESS unit e | |
| Discharge contribution factor (over 24 h) of ESS unit e | |
| Variables | |
| VPP available power of for the period t and operative scenario s (kW) | |
| Percentage of max power of the VPP that is willing to be supplied via PPAs | |
| Fraction of the maximum power that can be contracted by the CVPP via PPAs (kW) | |
| Binary variable set to 1 if PV unit j is contracted. | |
| Binary variable set to 1 if ESS unit e is contracted | |
| Binary variable set to 1 if DR scheme d is contracted | |
| Binary variable set to 1 if ESS unit e is charged/discharged in time t and scenario s | |
| Power charged to ESS unit e for time t and scenario s (kW) | |
| Power discharged to ESS unit e for time t and scenario s (kW) | |
| Power of ESS unit e in period t and scenario s (kW) | |
| Power curtailed by demand response d for time t and scenario s (kW) | |
| Amount of VPP power curtailed for period t and scenario s (kW). | |
| Power sold (+)/purchased (−) in the pool market for period t and scenario s (kW). | |
| Energy level of ESS unit e in time t and scenario s (kWh) | |
| Value-at-Risk (VaR) | |
References
- Asif, M. Introduction to the Four-Dimensional Energy Transition. In The 4Ds of Energy Transition: Decarbonization, Decentralization, Decreasing Use and Digitalization; King Fahd University of Petroleum and Minerals: Dhahran, Saudi Arabia, 2022; pp. 1–10. [Google Scholar]
- Rajendran, K.; Ezhil Prabhu, M. Energy Transition Landscape: Landscape Approach for Pollution-Generating Large-Scale Industries. In Handbook of Research on Issues, Challenges, and Opportunities in Sustainable Architecture; IGI Global: Hershey, PA, USA, 2022; pp. 248–282. [Google Scholar]
- Bellizio, F.; Xu, W.; Qiu, D.; Ye, Y.; Papadaskalopoulos, D.; Cremer, J.L.; Teng, F.; Strbac, G. Transition to Digitalized Paradigms for Security Control and Decentralized Electricity Market. Proc. IEEE 2022, 111, 744–761. [Google Scholar] [CrossRef]
- Borowski, P.F. Digital Transformation and Prosumers Activities in the Energy Sector. In Intelligent Systems in Digital Transformation: Theory and Applications; Springer: Berlin/Heidelberg, Germany, 2022; pp. 129–150. [Google Scholar]
- Çelık, D.; Meral, M.E.; Waseem, M. A new area towards to digitalization of energy systems: Enables, challenges and solutions. In Proceedings of the 2022 14th International Conference on Electronics, Computers and Artificial Intelligence (ECAI), Ploiesti, Romania, 30 June–1 July 2022; IEEE: Piscataway, NJ, USA, 2022; pp. 1–6. [Google Scholar]
- Hargroves, K.; James, B.; Lane, J.; Newman, P. The Role of Distributed Energy Resources and Associated Business Models in the Decentralised Energy Transition: A Review. Energies 2023, 16, 4231. [Google Scholar] [CrossRef]
- Christakou, K. A unified control strategy for active distribution networks via demand response and distributed energy storage systems. Sustain. Energy Grids Netw. 2016, 6, 1–6. [Google Scholar] [CrossRef]
- Ghasemi, A.; Shojaeighadikolaei, A.; Hashemi, M. Combating Uncertainties in Wind and Distributed PV Energy Sources Using Integrated Reinforcement Learning and Time-Series Forecasting. arXiv 2023, arXiv:2302.14094. [Google Scholar]
- Valova, R.; Brown, G. Distributed Energy Resource Interconnection: An Overview of Challenges and Opportunities in the United States. Sol. Compass 2022, 2, 100021. [Google Scholar] [CrossRef]
- Asif, M. Decentralization in Energy Sector. In The 4Ds of Energy Transition: Decarbonization, Decentralization, Decreasing Use and Digitalization; King Fahd University of Petroleum and Minerals: Dhahran, Saudi Arabia, 2022; pp. 287–297. [Google Scholar]
- Soshinskaya, M.; Crijns-Graus, W.H.; Guerrero, J.M.; Vasquez, J.C. Microgrids: Experiences, barriers and success factors. Renew. Sustain. Energy Rev. 2014, 40, 659–672. [Google Scholar] [CrossRef]
- Asmus, P. Microgrids, virtual power plants and our distributed energy future. Electr. J. 2010, 23, 72–82. [Google Scholar] [CrossRef]
- Merino, J.; Gómez, I.; Fraile-Ardanuy, J.; Santos, M.; Cortés, A.; Jimeno, J.; Madina, C. Fostering DER integration in the electricity markets. In Distributed Energy Resources in Local Integrated Energy Systems; Elsevier: Amsterdam, The Netherlands, 2021; pp. 175–205. [Google Scholar]
- Zahraoui, Y.; Korõtko, T.; Rosin, A.; Agabus, H. Market Mechanisms and Trading in Microgrid Local Electricity Markets: A Comprehensive Review. Energies 2023, 16, 2145. [Google Scholar] [CrossRef]
- Dinther, C.v.; Flath, C.M.; Gaerttner, J.; Huber, J.; Mengelkamp, E.; Schuller, A.; Staudt, P.; Weidlich, A. Engineering energy markets: The past, the present, and the future. In Market Engineering: Insights from Two Decades of Research on Markets and Information; Springer: Berlin/Heidelberg, Germany, 2021; pp. 113–134. [Google Scholar]
- González, D.M.L.; Rendon, J.G. Opportunities and challenges of mainstreaming distributed energy resources towards the transition to more efficient and resilient energy markets. Renew. Sustain. Energy Rev. 2022, 157, 112018. [Google Scholar] [CrossRef]
- Guzman, C.P.; Bañol Arias, N.; Franco, J.F.; Rider, M.J.; Romero, R. Enhanced coordination strategy for an aggregator of distributed energy resources participating in the day-ahead reserve market. Energies 2020, 13, 1965. [Google Scholar] [CrossRef]
- Pudjianto, D.; Ramsay, C.; Strbac, G. Virtual power plant and system integration of distributed energy resources. IET Renew. Power Gener. 2007, 1, 10–16. [Google Scholar] [CrossRef]
- Ekanayake, J.B.; Jenkins, N.; Liyanage, K.M.; Wu, J.; Yokoyama, A. Smart Grid: Technology and Applications; John Wiley & Sons: Hoboken, NJ, USA, 2012. [Google Scholar]
- Nosratabadi, S.M.; Hooshmand, R.A.; Gholipour, E. A comprehensive review on microgrid and virtual power plant concepts employed for distributed energy resources scheduling in power systems. Renew. Sustain. Energy Rev. 2017, 67, 341–363. [Google Scholar] [CrossRef]
- Khajeh, H.; Akbari Foroud, A.; Firoozi, H. Robust bidding strategies and scheduling of a price-maker microgrid aggregator participating in a pool-based electricity market. IET Gener. Transm. Distrib. 2019, 13, 468–477. [Google Scholar] [CrossRef]
- Dabbagh, S.R.; Sheikh-El-Eslami, M.K. Risk assessment of virtual power plants offering in energy and reserve markets. IEEE Trans. Power Syst. 2015, 31, 3572–3582. [Google Scholar] [CrossRef]
- Zhang, G.; Jiang, C.; Wang, X. Comprehensive review on structure and operation of virtual power plant in electrical system. IET Gener. Transm. Distrib. 2019, 13, 145–156. [Google Scholar] [CrossRef]
- Naval, N.; Yusta, J.M. Virtual power plant models and electricity markets-A review. Renew. Sustain. Energy Rev. 2021, 149, 111393. [Google Scholar] [CrossRef]
- Gómez San Román, T. Integration of DERs on Power Systems: Challenges and Opportunities; SSRN: Barcelona, Spain, 2017. [Google Scholar]
- Gough, M.; Santos, S.F.; Lotfi, M.; Javadi, M.S.; Osório, G.J.; Ashraf, P.; Castro, R.; Catalão, J.P. Operation of a technical virtual power plant considering diverse distributed energy resources. IEEE Trans. Ind. Appl. 2022, 58, 2547–2558. [Google Scholar] [CrossRef]
- Essakiappan, S.; Shoubaki, E.; Koerner, M.; Rees, J.F.; Enslin, J. Dispatchable Virtual Power Plants with forecasting and decentralized control, for high levels of distributed energy resources grid penetration. In Proceedings of the 2017 IEEE 8th International Symposium on Power Electronics for Distributed Generation Systems (PEDG), Florianópolis, Brazil, 17–20 April 2017; IEEE: Piscataway, NJ, USA, 2017; pp. 1–8. [Google Scholar]
- Wang, X.; Liu, Z.; Zhang, H.; Zhao, Y.; Shi, J.; Ding, H. A review on virtual power plant concept, application and challenges. In Proceedings of the 2019 IEEE Innovative Smart Grid Technologies-Asia (ISGT Asia), Chengdu, China, 21–24 May 2019; pp. 4328–4333. [Google Scholar]
- Pal, P.; Parvathy, A.; Devabalaji, K. A broad review on optimal operation of Virtual power plant. In Proceedings of the 2019 2nd International Conference on Power and Embedded Drive Control (ICPEDC), Chennai, India, 21–23 August 2019; IEEE: Piscataway, NJ, USA, 2019; pp. 400–405. [Google Scholar]
- Hadayeghparast, S.; Farsangi, A.S.; Shayanfar, H. Day-ahead stochastic multi-objective economic/emission operational scheduling of a large scale virtual power plant. Energy 2019, 172, 630–646. [Google Scholar] [CrossRef]
- Cheng, L.; Zhou, X.; Yun, Q.; Tian, L.; Wang, X.; Liu, Z. A review on virtual power plants interactive resource characteristics and scheduling optimization. In Proceedings of the 2019 IEEE 3rd Conference on Energy Internet and Energy System Integration (EI2), Changsha, China, 8–10 November 2019; IEEE: Piscataway, NJ, USA, 2019; pp. 514–519. [Google Scholar]
- Lehmbruck, L.; Kretz, J.; Aengenvoort, J.; Sioshansi, F. Aggregation of front-and behind-the-meter: The evolving VPP business model. In Behind and Beyond the Meter; Elsevier: Amsterdam, The Netherlands, 2020; pp. 211–232. [Google Scholar]
- Naughton, J.; Wang, H.; Riaz, S.; Cantoni, M.; Mancarella, P. Optimization of multi-energy virtual power plants for providing multiple market and local network services. Electr. Power Syst. Res. 2020, 189, 106775. [Google Scholar] [CrossRef]
- Dehghanniri, M.F.; Golkar, M.A.; Olanlari, F.G. Power exchanging of a VPP with its neighboring VPPs and participating in Day-ahead and spinning reserve markets. In Proceedings of the 2022 30th International Conference on Electrical Engineering (ICEE), Tehran, Iran, 17–19 May 2022; IEEE: Piscataway, NJ, USA, 2022; pp. 336–340. [Google Scholar]
- Nezamabadi, H.; Setayesh Nazar, M. Arbitrage strategy of virtual power plants in energy, spinning reserve and reactive power markets. IET Gener. Transm. Distrib. 2016, 10, 750–763. [Google Scholar] [CrossRef]
- Liu, J.; Hu, H.; Yu, S.S.; Trinh, H. Virtual Power Plant with Renewable Energy Sources and Energy Storage Systems for Sustainable Power Grid-Formation, Control Techniques and Demand Response. Energies 2023, 16, 3705. [Google Scholar] [CrossRef]
- Hua, H.; Chen, X.; Gan, L.; Sun, J.; Dong, N.; Liu, D.; Qin, Z.; Li, K.; Hu, S. Demand-side Joint Electricity and Carbon Trading Mechanism. IEEE Trans. Ind. Cyber-Phys. Syst. 2023, 2, 14–25. [Google Scholar] [CrossRef]
- Yang, Q.; Wang, H.; Wang, T.; Zhang, S.; Wu, X.; Wang, H. Blockchain-based decentralized energy management platform for residential distributed energy resources in a virtual power plant. Appl. Energy 2021, 294, 117026. [Google Scholar] [CrossRef]
- Cioara, T.; Antal, M.; Mihailescu, V.T.; Antal, C.D.; Anghel, I.M.; Mitrea, D. Blockchain-based decentralized virtual power plants of small prosumers. IEEE Access 2021, 9, 29490–29504. [Google Scholar] [CrossRef]
- Gough, M.; Santos, S.F.; Almeida, A.; Lotfi, M.; Javadi, M.S.; Fitiwi, D.Z.; Osório, G.J.; Castro, R.; Catalão, J.P. Blockchain-based transactive energy framework for connected virtual power plants. IEEE Trans. Ind. Appl. 2021, 58, 986–995. [Google Scholar] [CrossRef]
- Sarmiento-Vintimilla, J.C.; Torres, E.; Larruskain, D.M.; Pérez-Molina, M.J. Applications, operational architectures and development of virtual power plants as a strategy to facilitate the integration of distributed energy resources. Energies 2022, 15, 775. [Google Scholar] [CrossRef]
- Nguyen-Duc, H.; Nguyen-Hong, N. A study on the bidding strategy of the Virtual Power Plant in energy and reserve market. Energy Rep. 2020, 6, 622–626. [Google Scholar] [CrossRef]
- Wang, H.; Cheng, Y.; Liu, C.; Gao, H.; Liu, J. Robust Optimization Day-ahead Trading Strategy for Virtual Power Plant in Energy Market. In Proceedings of the 2023 Panda Forum on Power and Energy (PandaFPE), Chengdu, China, 27–30 April 2023; IEEE: Piscataway, NJ, USA, 2023; pp. 2346–2350. [Google Scholar]
- Ghasemi-Olanlari, F.; Moradi-Sepahvand, M.; Amraee, T. Two-stage risk-constrained stochastic optimal bidding strategy of virtual power plant considering distributed generation outage. IET Gener. Transm. Distrib. 2023, 17, 1884–1901. [Google Scholar] [CrossRef]
- Shabanzadeh, M.; Sheikh-El-Eslami, M.K.; Haghifam, M.R. A medium-term coalition-forming model of heterogeneous DERs for a commercial virtual power plant. Appl. Energy 2016, 169, 663–681. [Google Scholar] [CrossRef]
- Jafari, M.; Foroud, A.A. A medium/long-term auction-based coalition-forming model for a virtual power plant based on stochastic programming. Int. J. Electr. Power Energy Syst. 2020, 118, 105784. [Google Scholar] [CrossRef]
- Khorasany, M.; Raoofat, M. Bidding strategy for participation of virtual power plant in energy market considering uncertainty of generation and market price. In Proceedings of the 2017 Smart Grid Conference (SGC), Tehran, Iran, 20–21 December 2017; IEEE: Piscataway, NJ, USA, 2017; pp. 1–6. [Google Scholar]
- Rahimi, M.; Ardakani, F.J.; Ardakani, A.J. Optimal stochastic scheduling of electrical and thermal renewable and non-renewable resources in virtual power plant. Int. J. Electr. Power Energy Syst. 2021, 127, 106658. [Google Scholar] [CrossRef]
- Oladimeji, O.; Ortega, Á.; Sigrist, L.; Rouco, L.; Sánchez-Martín, P.; Lobato, E. Optimal Participation of Heterogeneous, RES-Based Virtual Power Plants in Energy Markets. Energies 2022, 15, 3207. [Google Scholar] [CrossRef]
- Jordehi, A.R. A stochastic model for participation of virtual power plants in futures markets, pool markets and contracts with withdrawal penalty. J. Energy Storage 2022, 50, 104334. [Google Scholar] [CrossRef]
- Tan, Z.; Fan, W.; Li, H.; De, G.; Ma, J.; Yang, S.; Ju, L.; Tan, Q. Dispatching optimization model of gas-electricity virtual power plant considering uncertainty based on robust stochastic optimization theory. J. Clean. Prod. 2020, 247, 119106. [Google Scholar] [CrossRef]
- Shabanzadeh, M.; Sheikh-El-Eslami, M.K.; Haghifam, M.R. The design of a risk-hedging tool for virtual power plants via robust optimization approach. Appl. Energy 2015, 155, 766–777. [Google Scholar] [CrossRef]
- Zhang, Y.; Liu, F.; Wang, Z.; Su, Y.; Wang, W.; Feng, S. Robust scheduling of virtual power plant under exogenous and endogenous uncertainties. IEEE Trans. Power Syst. 2021, 37, 1311–1325. [Google Scholar] [CrossRef]
- Naughton, J.; Wang, H.; Cantoni, M.; Mancarella, P. Co-optimizing virtual power plant services under uncertainty: A robust scheduling and receding horizon dispatch approach. IEEE Trans. Power Syst. 2021, 36, 3960–3972. [Google Scholar] [CrossRef]
- Rabiee, A.; Sadeghi, M.; Aghaeic, J.; Heidari, A. Optimal operation of microgrids through simultaneous scheduling of electrical vehicles and responsive loads considering wind and PV units uncertainties. Renew. Sustain. Energy Rev. 2016, 57, 721–739. [Google Scholar] [CrossRef]
- Amini, M.; Almassalkhi, M. Trading off robustness and performance in receding horizon control with uncertain energy resources. In Proceedings of the 2018 Power Systems Computation Conference (PSCC), Dublin, Ireland, 11–15 June 2018; IEEE: Piscataway, NJ, USA, 2018; pp. 1–7. [Google Scholar]
- Nguyen, H.T.; Le, L.B.; Wang, Z. A bidding strategy for virtual power plants with the intraday demand response exchange market using the stochastic programming. IEEE Trans. Ind. Appl. 2018, 54, 3044–3055. [Google Scholar] [CrossRef]
- Wang, J.; Dai, H.; Yang, M.; Liu, H. Optimal dispatching of virtual power plant considering the uncertainty of PV. In Proceedings of the 2019 IEEE Sustainable Power and Energy Conference (iSPEC), Beijing, China, 21–23 November 2019; IEEE: Piscataway, NJ, USA, 2019; pp. 1381–1385. [Google Scholar]
- Zuluaga, J.; Murillo-Sanchez, C.E.; Moreno-Chuquen, R.; Chamorro, H.R.; Sood, V.K. Day-ahead unit commitment for hydro-thermal coordination with high participation of wind power. IET Energy Syst. Integr. 2023, 5, 119–127. [Google Scholar] [CrossRef]
- Sheidaei, F.; Ahmarinejad, A. Multi-stage stochastic framework for energy management of virtual power plants considering electric vehicles and demand response programs. Int. J. Electr. Power Energy Syst. 2020, 120, 106047. [Google Scholar] [CrossRef]
- Ullah, Z.; Arshad.; Hassanin, H. Modeling, optimization, and analysis of a virtual power plant demand response mechanism for the internal electricity market considering the uncertainty of renewable energy sources. Energies 2022, 15, 5296. [Google Scholar] [CrossRef]
- Falabretti, D.; Gulotta, F.; Siface, D. Scheduling and operation of RES-based virtual power plants with e-mobility: A novel integrated stochastic model. Int. J. Electr. Power Energy Syst. 2023, 144, 108604. [Google Scholar] [CrossRef]
- Ying, L.; Ma, F.; Cui, X.; Shusheng, T. Research on Bidding Strategy of Virtual Power Plant Considering Risk Preference. In Proceedings of the 2023 3rd Power System and Green Energy Conference (PSGEC), Shanghai, China, 24–26 August 2023; IEEE: Piscataway, NJ, USA, 2023; pp. 311–317. [Google Scholar]
- Alahyari, A.; Ehsan, M.; Moghimi, M. Managing distributed energy resources (DERs) through virtual power plant technology (VPP): A stochastic information-gap decision theory (IGDT) approach. Iran. J. Sci. Technol. Trans. Electr. Eng. 2020, 44, 279–291. [Google Scholar] [CrossRef]
- Kim, H.J.; Kang, H.J.; Kim, M.K. Data-driven bidding strategy for DER aggregator based on gated recurrent unit–enhanced learning particle swarm optimization. IEEE Access 2021, 9, 66420–66435. [Google Scholar] [CrossRef]
- Yan, X.; Gao, C.; Song, M.; Chen, T.; Ding, J.; Guo, M.; Wang, X.; Abbes, D. An IGDT-based day-ahead co-optimization of energy and reserve in a VPP considering multiple uncertainties. IEEE Trans. Ind. Appl. 2022, 58, 4037–4049. [Google Scholar] [CrossRef]
- Shafiekhani, M.; Ahmadi, A.; Homaee, O.; Shafie-khah, M.; Catalao, J.P. Optimal bidding strategy of a renewable-based virtual power plant including wind and solar units and dispatchable loads. Energy 2022, 239, 122379. [Google Scholar] [CrossRef]
- Fang, F.; Yu, S.; Xin, X. Data-driven-based stochastic robust optimization for a virtual power plant with multiple uncertainties. IEEE Trans. Power Syst. 2021, 37, 456–466. [Google Scholar] [CrossRef]
- Zhu, J.; Duan, P.; Liu, M.; Xia, Y.; Guo, Y.; Mo, X. Bi-Level real-time economic dispatch of VPP considering uncertainty. IEEE Access 2019, 7, 15282–15291. [Google Scholar] [CrossRef]
- Liu, Y.; Li, M.; Lian, H.; Tang, X.; Liu, C.; Jiang, C. Optimal dispatch of virtual power plant using interval and deterministic combined optimization. Int. J. Electr. Power Energy Syst. 2018, 102, 235–244. [Google Scholar] [CrossRef]
- Ju, L.; Tan, Q.; Lu, Y.; Tan, Z.; Zhang, Y.; Tan, Q. A CVaR-robust-based multi-objective optimization model and three-stage solution algorithm for a virtual power plant considering uncertainties and carbon emission allowances. Int. J. Electr. Power Energy Syst. 2019, 107, 628–643. [Google Scholar] [CrossRef]
- Wu, M.; Xu, J.; Zeng, L.; Li, C.; Liu, Y.; Yi, Y.; Wen, M.; Jiang, Z. Two-stage robust optimization model for park integrated energy system based on dynamic programming. Appl. Energy 2022, 308, 118249. [Google Scholar] [CrossRef]
- Abbasi, M.; Asadi, A.; BenElghali, S.; Zerrougui, M. Short-Term Forecasting of Uncertain Parameters for Virtual Power Plants. In Proceedings of the 2021 IEEE 26th International Workshop on Computer Aided Modeling and Design of Communication Links and Networks (CAMAD), Virtual, 25–27 October 2021; IEEE: Piscataway, NJ, USA, 2021; pp. 1–6. [Google Scholar]
- Jasinski, M.; Najafi, A.; Homaee, O.; Kermani, M.; Tsaousoglou, G.; Leonowicz, Z.; Novak, T. Operation and planning of energy hubs under uncertainty—a review of mathematical optimization approaches. IEEE Access 2023, 11, 7208–7228. [Google Scholar] [CrossRef]
- Dogan, A.; Cidem Dogan, D. A review on machine learning models in forecasting of virtual power plant uncertainties. Arch. Comput. Methods Eng. 2023, 30, 2081–2103. [Google Scholar] [CrossRef]
- Cantillo-Luna, S.; Moreno-Chuquen, R.; Lopez-Sotelo, J.; Celeita, D. An Intra-Day Electricity Price Forecasting Based on a Probabilistic Transformer Neural Network Architecture. Energies 2023, 16, 6767. [Google Scholar] [CrossRef]
- Ye, J.; Zhao, B.; Liu, D.; Wei, Q.; Wang, Y. TADNet: Temporal Attention Decomposition Networks for Probabilistic Energy Forecasting. IEEE Trans. Power Syst. 2024. [Google Scholar] [CrossRef]
- Xu, C.; Sun, Y.; Du, A.; Gao, D.c. Quantile regression based probabilistic forecasting of renewable energy generation and building electrical load: A state of the art review. J. Build. Eng. 2023, 79, 107772. [Google Scholar] [CrossRef]
- Doelle, O.; Klinkenberg, N.; Amthor, A.; Ament, C. Probabilistic intraday PV power forecast using ensembles of deep Gaussian mixture density networks. Energies 2023, 16, 646. [Google Scholar] [CrossRef]
- Birge, J.R.; Louveaux, F. Introduction to Stochastic Programming; Springer Science & Business Media: Berlin/Heidelberg, Germany, 2011. [Google Scholar]
- Rockafellar, R.T.; Uryasev, S. Optimization of conditional value-at-risk. J. Risk 2000, 2, 21–42. [Google Scholar] [CrossRef]
- Kazemi, S.M.; Goel, R.; Eghbali, S.; Ramanan, J.; Sahota, J.; Thakur, S.; Wu, S.; Smyth, C.; Poupart, P.; Brubaker, M. Time2vec: Learning a vector representation of time. arXiv 2019, arXiv:1907.05321. [Google Scholar]
- Cantillo-Luna, S.; Moreno-Chuquen, R.; Lopez-Sotelo, J. Intra-day Electricity Price Forecasting Based on a Time2Vec-LSTM Model. In Proceedings of the IEEE Colombian Conference on Applications of Computational Intelligence, Cali, Colombia, 27–29 July 2022; Springer: Berlin/Heidelberg, Germany, 2023; pp. 107–121. [Google Scholar]
- Zobaa, A.F.; Aleem, S.A. Uncertainties in Modern Power Systems; Academic Press: Cambridge, MA, USA, 2020. [Google Scholar] [CrossRef]
- Narvaez, G.; Giraldo, L.F.; Bressan, M.; Guillen, C.A.; Pabón, M.A.; Díaz, N.; Porras, M.F.; Medina, B.H.; Jiménez, F.; Jiménez-Estévez, G.; et al. An interactive tool for visualization and prediction of solar radiation and photovoltaic generation in Colombia. Big Earth Data 2023, 7, 904–929. [Google Scholar] [CrossRef]
- Hemmati, M.; Mohammadi-Ivatloo, B.; Soroudi, A. Uncertainty management in decision-making in power system operation. In Decision Making Applications in Modern Power Systems; Elsevier: Amsterdam, The Netherlands, 2020; pp. 41–62. [Google Scholar]
- Cantillo-Luna, S.; Moreno-Chuquen, R.; Celeita, D.; Anders, G. Deep and Machine Learning Models to Forecast Photovoltaic Power Generation. Energies 2023, 16, 4097. [Google Scholar] [CrossRef]
- Rodriguez-Leguizamon, C.K.; López-Sotelo, J.A.; Cantillo-Luna, S.; López-Castrillón, Y.U. PV Power Generation Forecasting Based on XGBoost and LSTM Models. In Proceedings of the 2023 IEEE Workshop on Power Electronics and Power Quality Applications (PEPQA), Cali, Colombia, 5–6 October 2023; IEEE: Piscataway, NJ, USA, 2023; pp. 1–6. [Google Scholar]
- Heitsch, H.; Römisch, W. Scenario reduction algorithms in stochastic programming. Comput. Optim. Appl. 2003, 24, 187–206. [Google Scholar] [CrossRef]
- Li, Q.; Gao, D.W. Fast scenario reduction for power systems by deep learning. arXiv 2019, arXiv:1908.11486. [Google Scholar]
- Shabanzadeh, M.; Sheikh-El-Eslami, M.K.; Haghifam, M.R. Decision making tool for virtual power plants considering midterm bilateral contracts. In Proceedings of the Iranian Regulation CIRED Conference and Exhibition on Electricity Distribution, Lyon, France, 15–18 June 2015; pp. 1–6. [Google Scholar]
- Zakariazadeh, A.; Jadid, S.; Siano, P. Smart microgrid energy and reserve scheduling with demand response using stochastic optimization. Int. J. Electr. Power Energy Syst. 2014, 63, 523–533. [Google Scholar] [CrossRef]
- Ayón, X.; Moreno, M.Á.; Usaola, J. Aggregators’ optimal bidding strategy in sequential day-ahead and intraday electricity spot markets. Energies 2017, 10, 450. [Google Scholar] [CrossRef]
- Cantillo, S.; Moreno, R. Power system operation considering detailed modelling of energy storage systems. Int. J. Electr. Comput. Eng. 2021, 11, 182. [Google Scholar] [CrossRef]
- Conejo, A.J.; Garcia-Bertrand, R.; Carrion, M.; Caballero, Á.; de Andres, A. Optimal involvement in futures markets of a power producer. IEEE Trans. Power Syst. 2008, 23, 703–711. [Google Scholar] [CrossRef]
- Nguyen, D.T.; Le, L.B. Risk-constrained profit maximization for microgrid aggregators with demand response. IEEE Trans. Smart Grid 2014, 6, 135–146. [Google Scholar] [CrossRef]
- Seabold, S.; Perktold, J. Statsmodels: Econometric and statistical modeling with python. In Proceedings of the 9th Python in Science Conference, Austin, TX, USA, 28–30 June 2010. [Google Scholar]
- Chollet, F.; Nguyen, L.; Baihan, L.; Chu, J.; Feng, Y.; Finzi, D.; Watson, J.; Laszlo, S.; Crosse, M.; Honke, G.; et al. Keras. 2015. Available online: https://github.com/fchollet/keras (accessed on 3 March 2024).
- Kingma, D.P.; Ba, J. Adam: A method for stochastic optimization. arXiv 2014, arXiv:1412.6980. [Google Scholar]
- Bynum, M.L.; Hackebeil, G.A.; Hart, W.E.; Laird, C.D.; Nicholson, B.L.; Siirola, J.D.; Watson, J.P.; Woodruff, D.L. Pyomo-Optimization Modeling in Python; Springer: Berlin/Heidelberg, Germany, 2021; Volume 67. [Google Scholar]
- Hart, W.E.; Watson, J.P.; Woodruff, D.L. Pyomo: Modeling and solving mathematical programs in Python. Math. Program. Comput. 2011, 3, 219–260. [Google Scholar] [CrossRef]
- Czyzyk, J.; Mesnier, M.P.; Moré, J.J. The NEOS Server. IEEE J. Comput. Sci. Eng. 1998, 5, 68–75. [Google Scholar] [CrossRef]
- MOSEK ApS. The MOSEK Optimization Toolbox for Python Manual. Version 10.1. 2022. Available online: https://docs.mosek.com/latest/pythonfusion/index.html (accessed on 8 March 2024).
- Sengupta, M.; Xie, Y.; Lopez, A.; Habte, A.; Maclaurin, G.; Shelby, J. The National Solar Radiation Data Base (NSRDB). Renew. Sustain. Energy Rev. 2018, 89, 51–60. [Google Scholar] [CrossRef]
- National Renewable Energy Laboratory (NREL). National Solar Radiation Database. Available online: https://registry.opendata.aws/nrel-pds-nsrdb (accessed on 14 December 2023).
- Luque, A.; Hegedus, S. Handbook of Photovoltaic Science and Engineering; John Wiley & Sons: Hoboken, NJ, USA, 2011. [Google Scholar]
- Molina, A.; Martínez, F. Modelo de Generación Fotovoltaica; Explorador Solar: Santiago, Chile, 2017; p. 13. [Google Scholar]
- XM Colombia. Portal de Variables del Mercado Eléctrico Colombiano SINERGOX. Available online: https://sinergox.xm.com.co/trpr/Paginas/Historicos/Historicos.aspx (accessed on 14 December 2023).
- Journois, M.; Story, R.; Gardiner, J.; Rump, H.; Bird, A.; Lima, A.; Cano, J.; Leonel, J.; Sampson, T.; Baker, J.; et al. Python-Visualization/Folium: v0.15.0; Zenodo: Geneve, Switzerland, 2022. [Google Scholar]
- XM. Sistema de Información para el Mercado de Energía Mayorista (SIMEM). Available online: https://www.simem.co (accessed on 10 December 2023).
- Comisión de Regulación de Energía y Gas (CREG). Resolución 096 de 2019. Available online: https://gestornormativo.creg.gov.co/gestor/entorno/docs/resolucion_creg_0096_2019.htm#INICIO (accessed on 27 December 2023).
Disclaimer/Publisher’s Note: The statements, opinions and data contained in all publications are solely those of the individual author(s) and contributor(s) and not of MDPI and/or the editor(s). MDPI and/or the editor(s) disclaim responsibility for any injury to people or property resulting from any ideas, methods, instructions or products referred to in the content. |
© 2024 by the authors. Licensee MDPI, Basel, Switzerland. This article is an open access article distributed under the terms and conditions of the Creative Commons Attribution (CC BY) license (https://creativecommons.org/licenses/by/4.0/).