1. Introduction
Unlike coastal nuclear power plants that use seawater as a cooling method, inland nuclear power systems are designed with ambient air and circulate fresh water as the cooling media. Currently, cooling systems are mainly classified into the following two categories: natural draft dry cooling system (NDDC) and natural draft wet cooling system (NDWC). NDDCs are widely used in water-scarce areas [
1]. The heat exchange between air and water is achieved through the tower’s heat exchanger. Since air and water do not come into direct contact, NDDC has almost no loss of circulating water. However, studies have shown [
2] that the cooling capacity of NDDC towers sharply decreases when the environmental temperature is too high or when there is a crosswind. According to Du Preez and Kroger’s [
3] full-scale performance test results [
4], the performance of horizontally arranged natural draft dry cooling systems is inhibited under the influence of environmental wind. Su [
5] and Wang [
6] studied the impact of environmental wind on the outlet of vertically arranged natural draft dry cooling systems using computational fluid dynamics (CFDs) [
7], and the results showed that environmental wind had a “covering” effect on the tower’s outlet, hindering the discharge of hot air. Wang [
8] used a heat exchanger model based on the ε-NTU method and input the heat exchanger efficiency–wind speed curve. By monitoring the outlet water temperature of the heat exchange unit, the performance variation in the heat exchange system in winter was obtained. In addition, when the environmental temperature was too high or there was a high demand for cooling performance [
9], a spray cooling method for NDDC was proposed [
10]. However, this method is hindered in low-temperature, high-humidity climates. The poor cooling performance and economic efficiency of NDDC limit its use in hot and humid regions.
NDWCs are widely used in regions with abundant water resources due to their simple structure [
11], low cost, stable operation, and excellent cooling performance. In NDWC, water and air come into direct contact, and heat exchange occurs through the evaporation and cooling of water. The heat dissipation includes both heat and mass transfer, involving sensible and latent heat. Therefore, when the air temperature is high, the heat exchange capacity of NDWC is higher than that of NDDC [
12]. However, there is a significant loss of circulating water through evaporation during operation [
13], limiting the application of NDWC in water-scarce areas.
To date, a substantial number of researchers have conducted theoretical studies and simulation calculations on the key heat and mass transfer technologies of NDWC. Evaporation and convective heat transfer occur simultaneously at the air–water interface, and this heat and mass transfer system was initially described by Merkel [
14]. However, Merkel made certain assumptions to simplify the calculations. Poppe et al. [
15] considered strict differential equations for the enthalpy and humidity ratio of humid air with respect to water temperature, improving the Merkel model. The results indicated that the Poppe model’s calculations were closer to the experimental results. In 2005, Kloppers [
16] extensively discussed the heat and mass transfer equations of NDWC, derived the control equations for the Merkel model, e-NTU model, and Poppe model, and used enthalpy–moisture curves to analyze the differences between the three models in the analysis and solution of cooling towers. Williamson [
17] employed a two-dimensional axisymmetric numerical model to study the effects of changes in water spray density and fill thickness on the performance of cooling towers under uniform distribution. Al-Waked [
18] pointed out, through a three-dimensional numerical model [
19], that in real-world conditions, cooling towers were affected by crosswinds, disrupting the flow field inside the tower, deviating from the axisymmetric distribution under design conditions, resulting in a decline in cooling tower performance [
20].
To achieve a balance between energy and water consumption in arid regions for nuclear power units, a scheme based on a combined dry–wet cycle hybrid cooling system is proposed. The aim is to address the cooling performance decline of NDDC in hot weather while simultaneously resolving the issue of excessive water consumption in NDWC [
21].
To achieve adequate cooling performance with acceptable water consumption, an air-cooled heat exchange device can be added above the conventional wet cooling tower fill to construct a natural draft hybrid cooling system (NDHC). Currently, in addition to the theoretical research and numerical simulations of hybrid systems, there are few experimental studies and engineering application cases. Most research is focused on optimizing the operation and integration methods of hybrid systems. Huang [
22] conducted theoretical research on the heat and mass transfer processes that occur when circulating water comes into direct contact with air in hybrid technology. It was observed that the introduction of a spray system inside NDDC could result in the obstruction of airflow, potentially leading to inferior performance compared to traditional dry cooling systems. Large droplet diameters and low spray water flow rates could deteriorate the heat exchange performance of the hybrid cooling method, even resulting in poorer heat exchange performance than traditional NDDC. Chen [
23] performed a characteristic analysis of hybrid cooling towers based on the ε-NTU method, examining the applicability of hybrid systems in various meteorological environments. Wei [
24] proposed an iterative algorithm to predict the performance of hybrid systems. This algorithm was applied in conjunction with the real operational parameters of a coal-fired power plant, considering the trade-off between water consumption and coal consumption. This study involved a comprehensive comparison and analysis of the performance and economic evaluations of the following three cooling systems: NDDC, NDWC, and NDHC.
The cooling system is coupled with the thermal cycle of the power unit, and changes in the performance of the cooling system further affect the efficiency of the thermal cycle. While most studies focus on the comparative analysis of the heat transfer performance of different cooling systems, few explore the relationship between water consumption and the net profit of power plants. Therefore, both the simulation model of the cooling system itself and the evaluation method for the entire power generation unit need improvement.
This study is based on the flow patterns and distribution characteristics of various physical quantities in the internal dry cooling section, wet cooling section, and hybrid section of Natural Draft Hybrid Cooling Towers (NDHCs). Different structural NDHC numerical simulation models, namely the Separate Natural Draft Hybrid Cooling System (SNDHC) and Combined Natural Draft Hybrid Cooling System (CNDHC) were established and compared with traditional natural draft wet cooling (NDWC) and natural draft dry cooling (NDDC) systems. Using the simulation route based on the pressure uniformity assumption for the cooling system, coupled with meteorological data from typical years at different plant locations in North and South China, this study simulated the operational conditions of different cooling systems under various meteorological parameters. The analysis focused on the applicability of different cooling systems to the environment. Subsequently, referring to the heat balance diagrams of the AP1000 units at a nuclear power plant in China under different operating conditions, a thermal–hydraulic model of the nuclear power plant was established, coupling the cooling system and considering water consumption and power generation benefits. This allowed for a comparative analysis of the economic performance of the cooling systems. The findings of this research provide guidance and references for the selection of cooling systems for nuclear power plants. The study underscores the significant reference value of NDHC for high efficiency and economic operation. Finally, it provides theoretical support for the site selection of hybrid systems.
2. Mathematical Models
2.1. NDDC
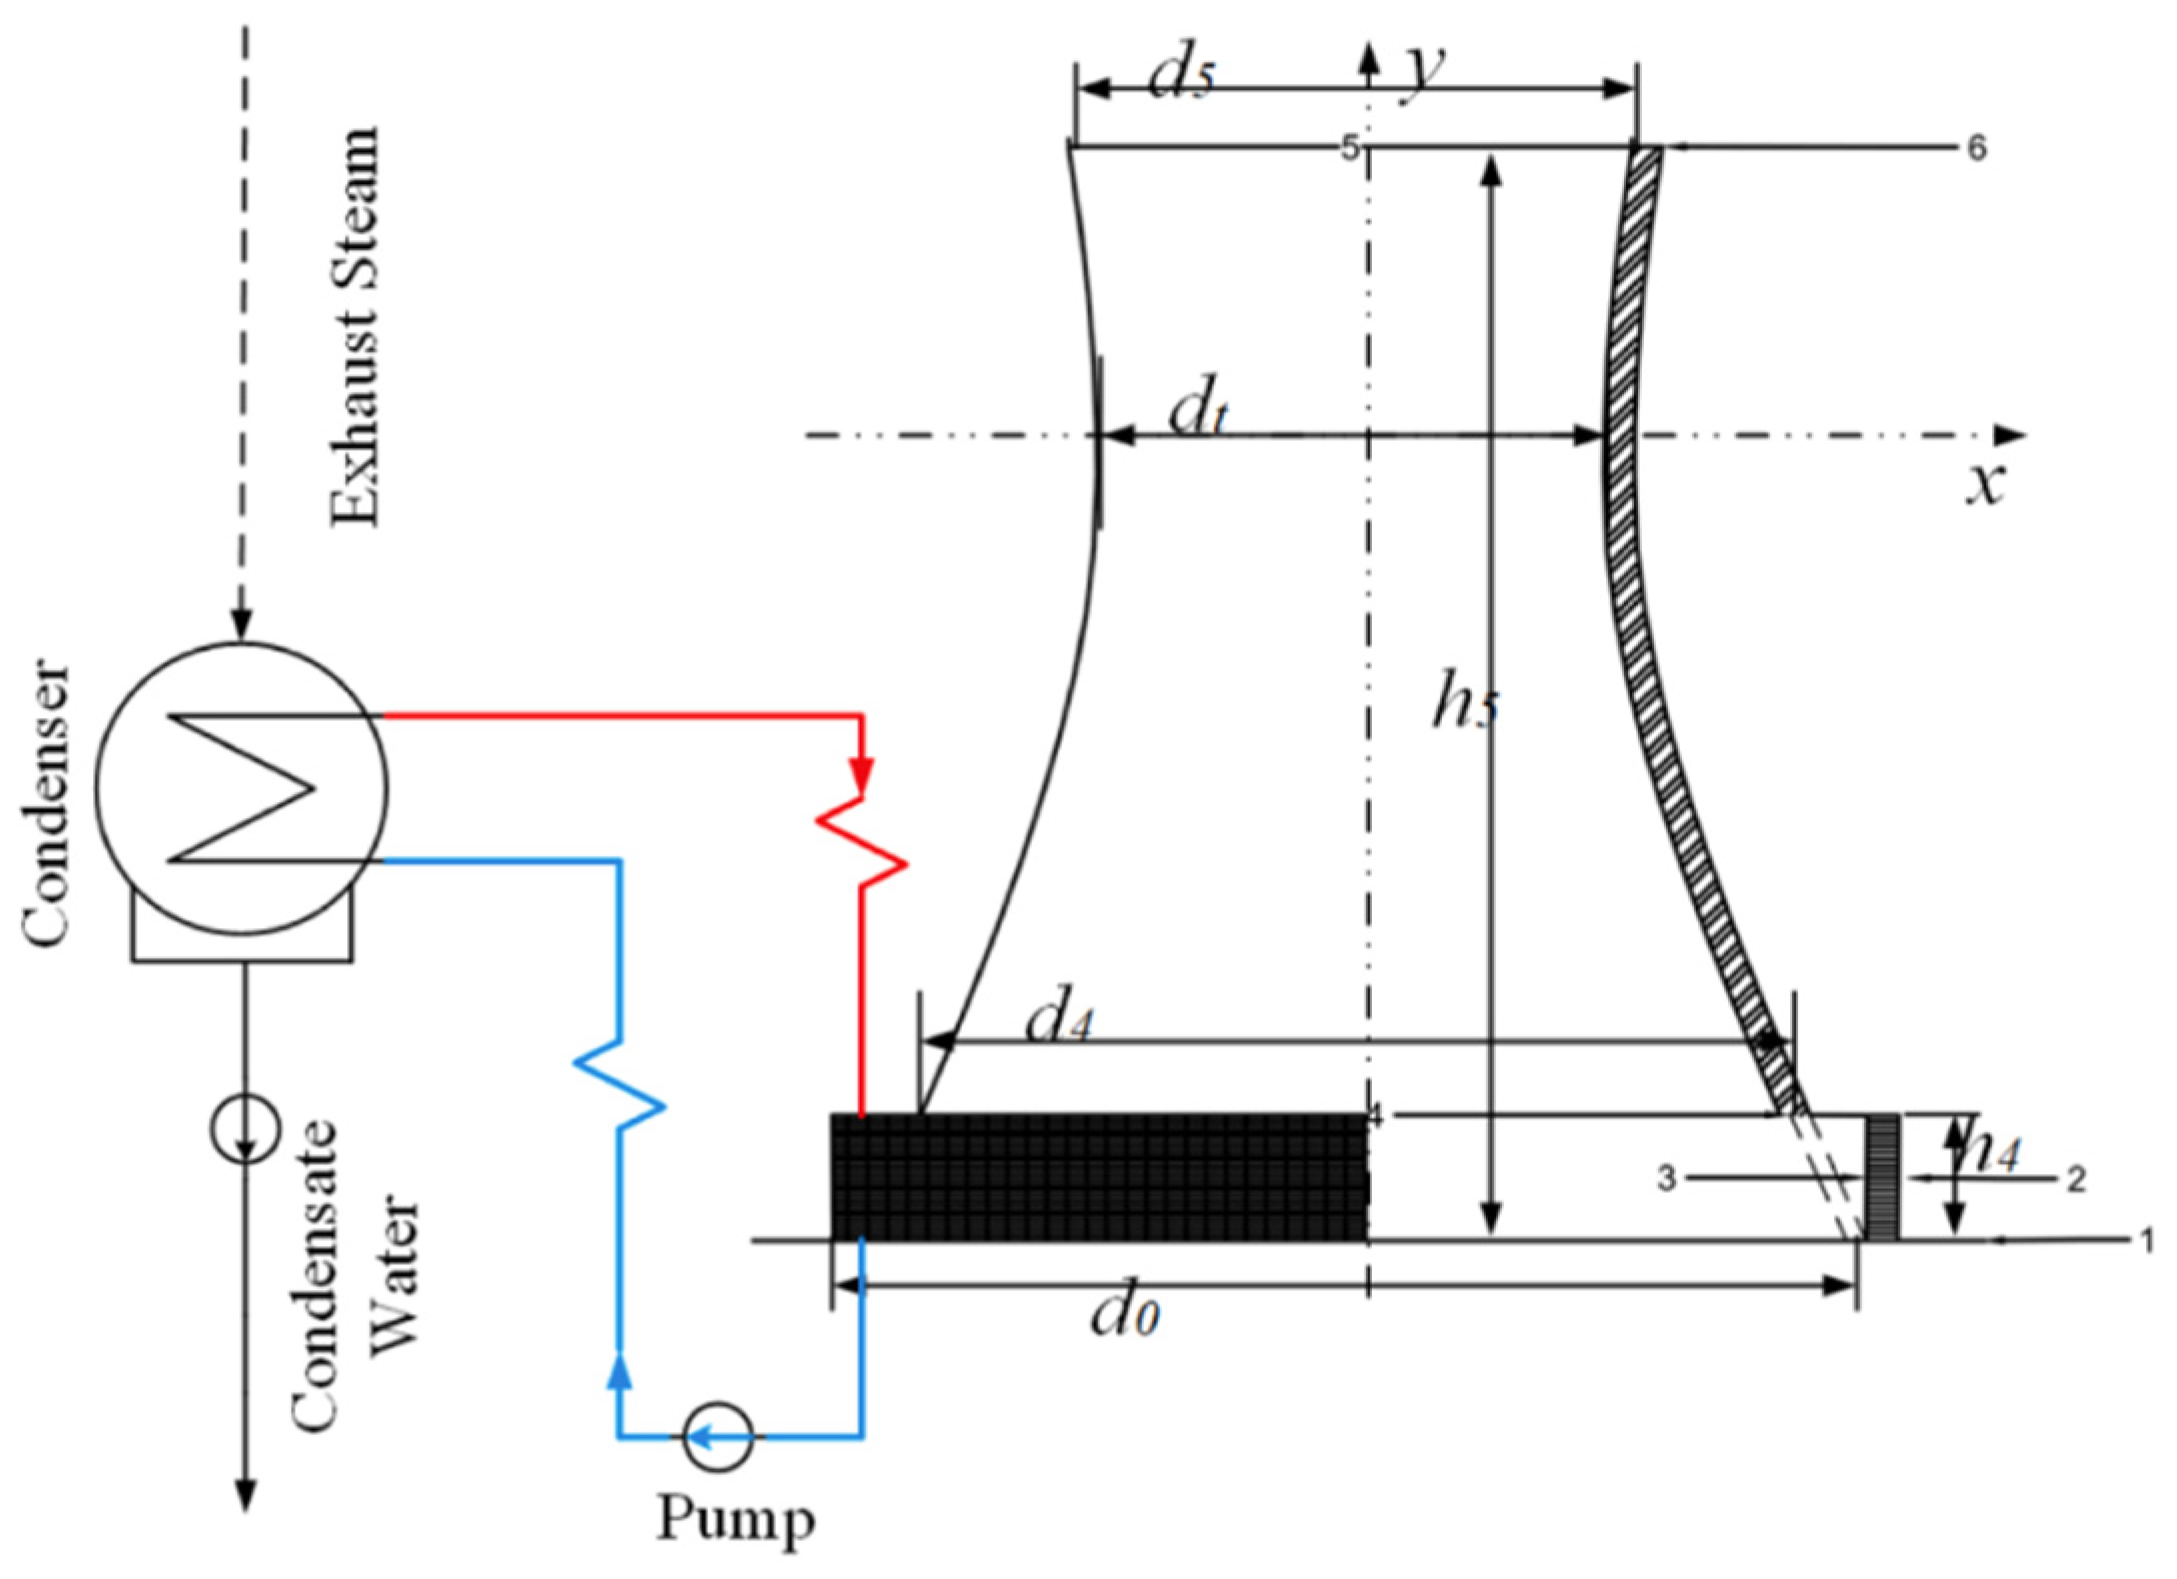
The structural diagram of the natural draft dry cooling tower is shown in
Figure 1. Air passes sequentially through positions 1 to 6, with the red and blue lines representing hot water and cold water, respectively. The density difference in the air, caused by heat exchange, propels the airflow from positions 1 to 3 into the tower. The heat exchanger surrounds the tower base, facilitating extensive heat exchange between air and water. Air carries away the heat from the water and is ultimately discharged into the atmosphere through positions 5 to 6 [
25]. The circulating water, cooled in the process, is pumped by the circulating water pump to perform work as it enters the condenser.
The heat exchanger structure of the indirect air-cooling system is vertically placed at the bottom of the cooling tower, forming a cooling triangle. Two cooling columns are fixed on two sides of a triangular steel frame with an angle of approximately 50°, while the third side serves as the air passage. Air flows on the outside of the tube bundle, while the cooling water flows inside the tube bundle for cooling. The bottom of the cooling tower is equipped with louvers to regulate the airflow.
During the operation of a natural draft dry cooling system, there is a corresponding balance between the air extraction force and the resistance inside the tower.
In a natural ventilation dry cooling system, heat dissipation primarily occurs through non-contact heat exchange between the air and water. This process involves the following three heat exchange modes:
Convective heat exchange between circulating water and the inner walls of the heat exchanger tubes.
Heat conduction from the inner walls to the outer walls.
Convective heat exchange between the outer walls of the heat exchanger tubes, fins, and other extended surfaces, and the surrounding air.
The heat exchanger tubes in NDDC are primarily composed of aluminum, which has excellent thermal conductivity. Therefore, the second part of the heat exchange, related to heat conduction, can be negligibly small. The convective heat exchange performance of the first and third parts is mainly associated with the structural design of the heat exchanger.
For the one-dimensional calculation model, this study adopted the classical logarithmic mean temperature difference method for computation. In the context of the first part of heat exchange, the classical Gnielinski formula [
26] can be employed to calculate the heat transfer coefficient on the waterside.
where
f is the friction factor [
27]
The heat transfer coefficient on the waterside can be obtained from the finned tube bundle structure.
The heat transfer coefficient on the air side can be obtained as follows:
The total heat transfer coefficient of the heat exchanger can be calculated from the heat transfer coefficients of the water and air sides [
28].
By correcting the heat transfer temperature difference of the counterflow heat exchanger, corresponding to the inlet and outlet temperatures of the same cold and hot fluids, one can calculate the heat exchange of the NDDC heat exchanger.
The air moving from the outlet of the dry section to the outlet of NDDC undergoes an approximately adiabatic process. The pressure difference along the height is computed by the following formula:
The expression for the loss coefficient of a cylindrical outlet is given by the following:
where
.
2.2. NDWC
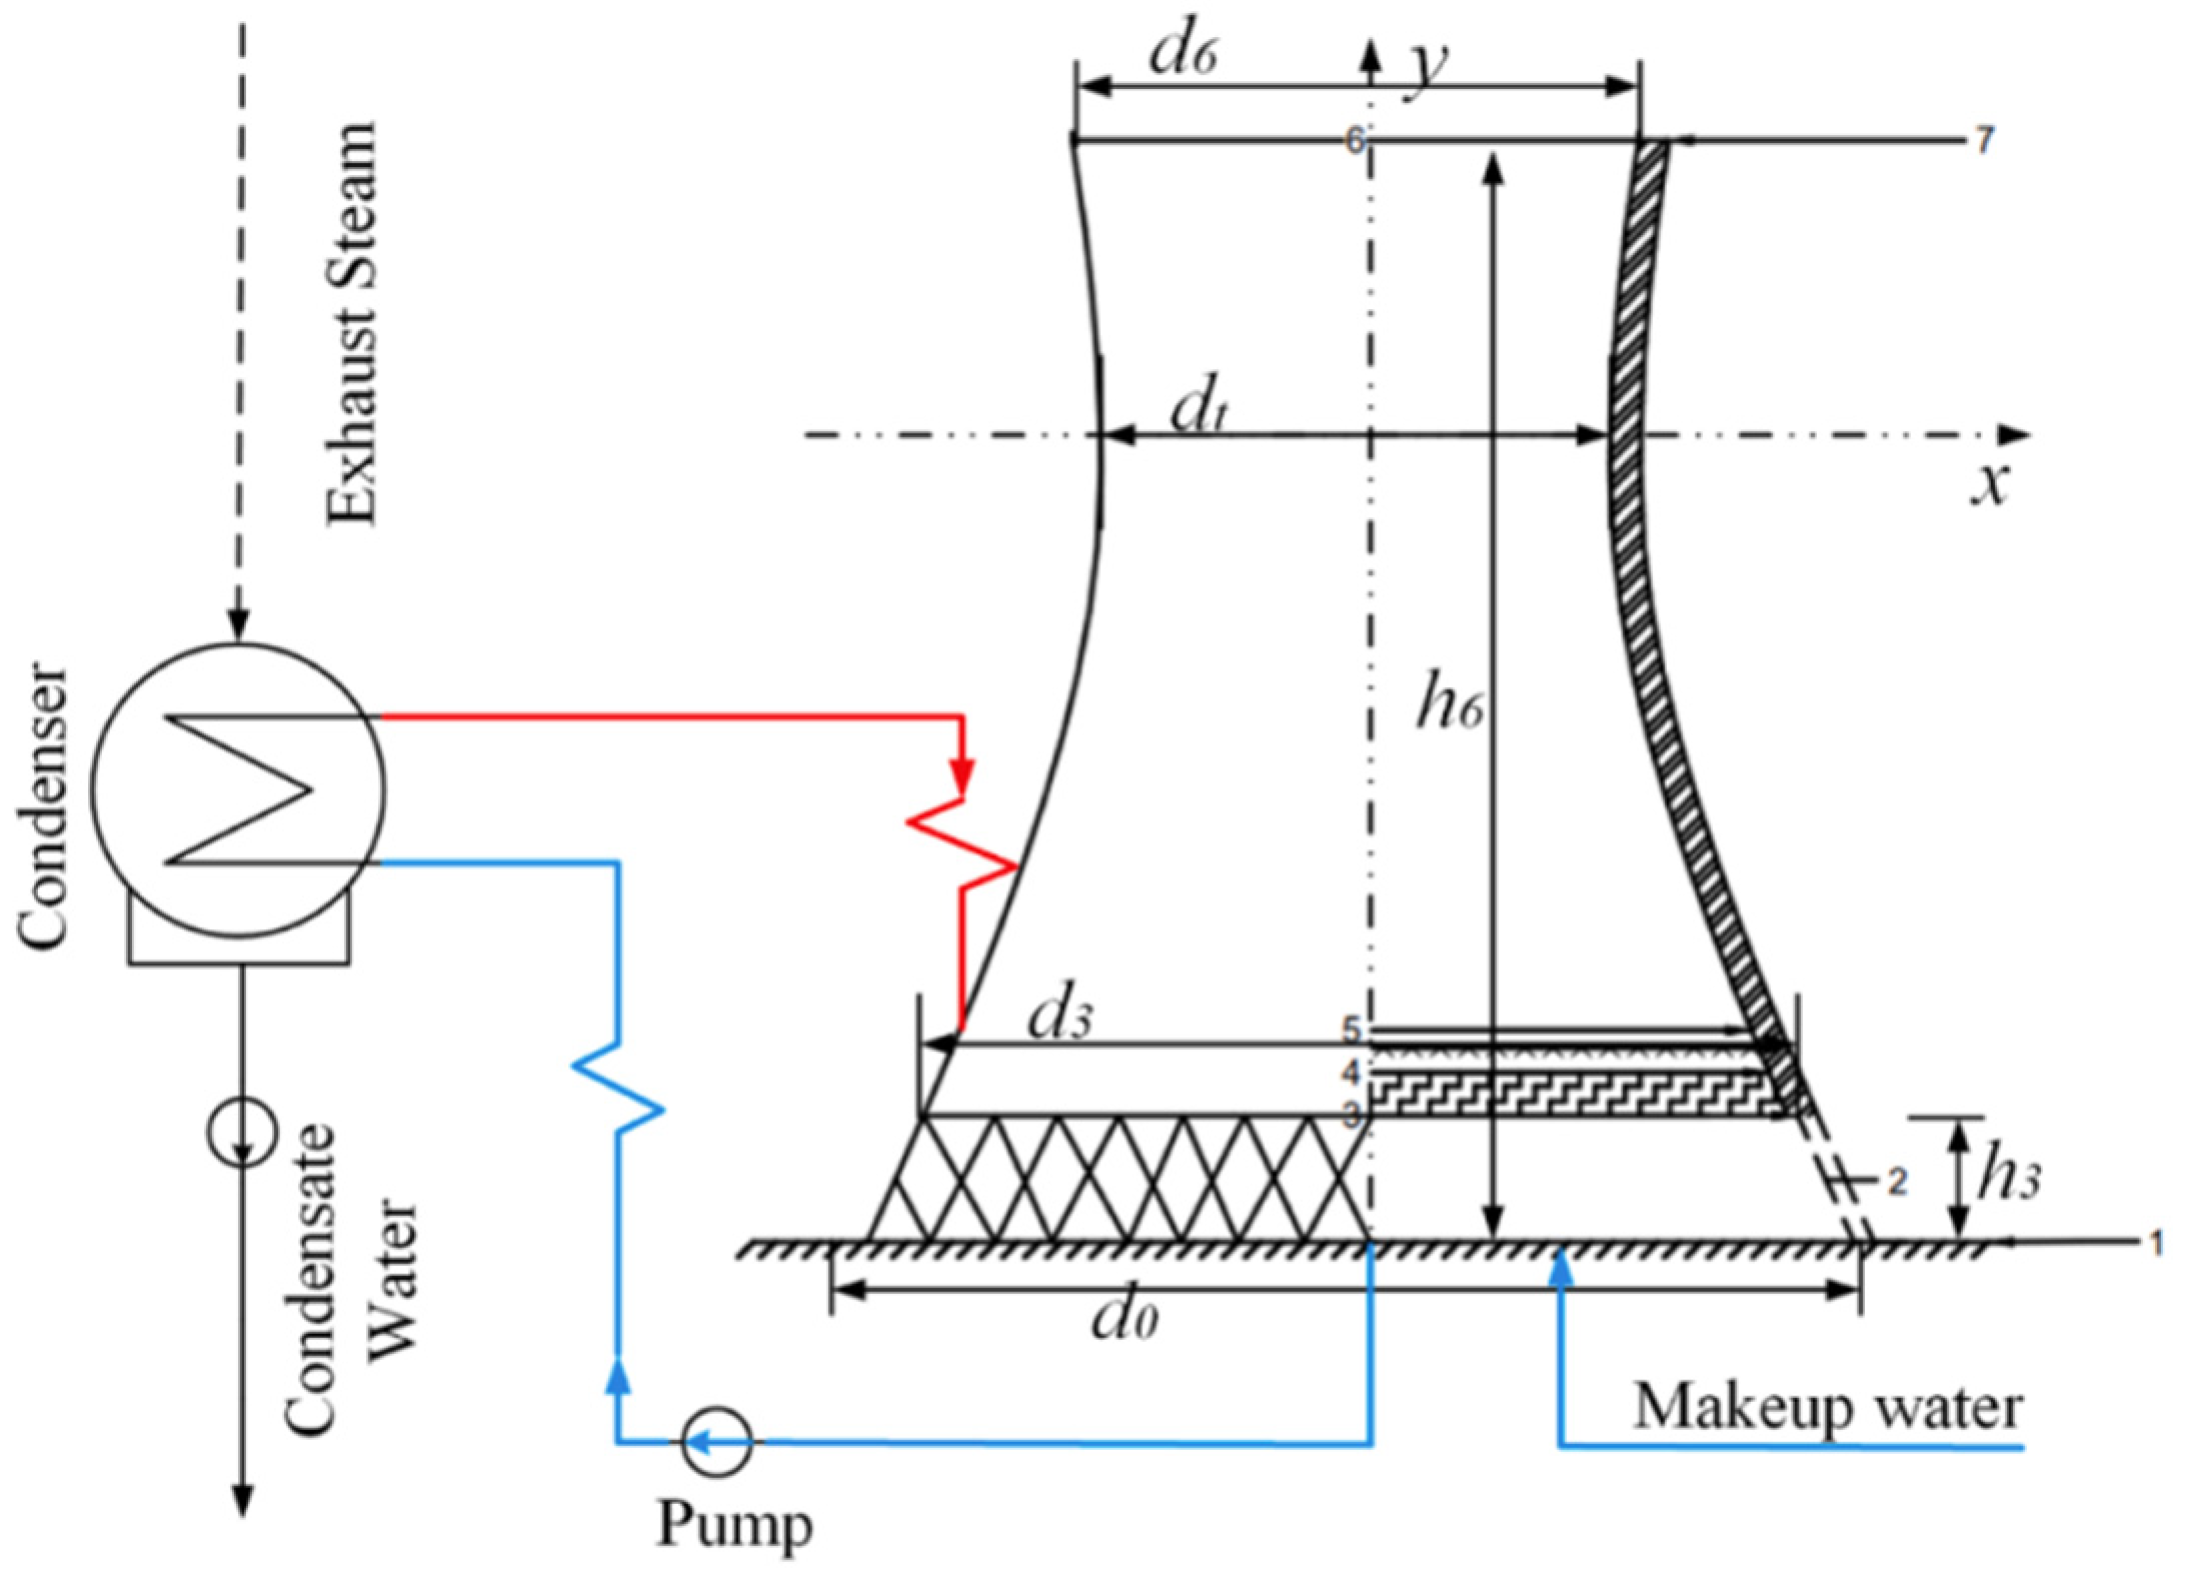
The airflow in the NDWC is also driven by the density difference between the front and back of the fill, as shown in
Figure 2.
In NDWC, the circulating water is transported to the spray zone by the circulating water pump. The water is sprayed out from the nozzle, forming a diffused circular shape. The water then adheres to the fill and comes into direct contact with the air. Heat exchange occurs through the evaporation cooling of the water, and it finally drips down into the reservoir below.
For NDWC, it is necessary to consider the density variations in ambient air due to the absorption of water vapor.
Unlike natural draft dry cooling systems, the process of moist air rising to the exit after passing through the fill in the tower is a typical pseudo-adiabatic process [
29], and its temperature change can be expressed as follows:
Similarly, in the operation of NDWC, the air draft and resistance terms within the tower remain balanced; that is,
The heat and mass transfer in the wet section of NDWC can be divided into three regions: the spray zone, the fill zone, and the rain zone. The heat and mass transfer in the rain zone is derived based on the Sherwood number of individual droplets [
30]
where
Sh is the Sherwood number.
The heat exchange in the spray zone and fill zone can be calculated using Kröger’s experimental relationships [
31]
The Merkel number can be obtained by experiments as follows:
The Merkel number of the fill can be calculated by the Chebyshev four-point integration method [
32].
The energy balance is calculated as follows:
In contrast to NDDC, the ascent of humid air within the tower is considered a pseudo-adiabatic process.
where
ξTa5 is the lapse rate and
FrD is similar with NDDC.
2.3. NDHC
The NDHC is based on the parameters of the NDWC, with the addition of air-cooled tower fins for ultimate auxiliary cooling.
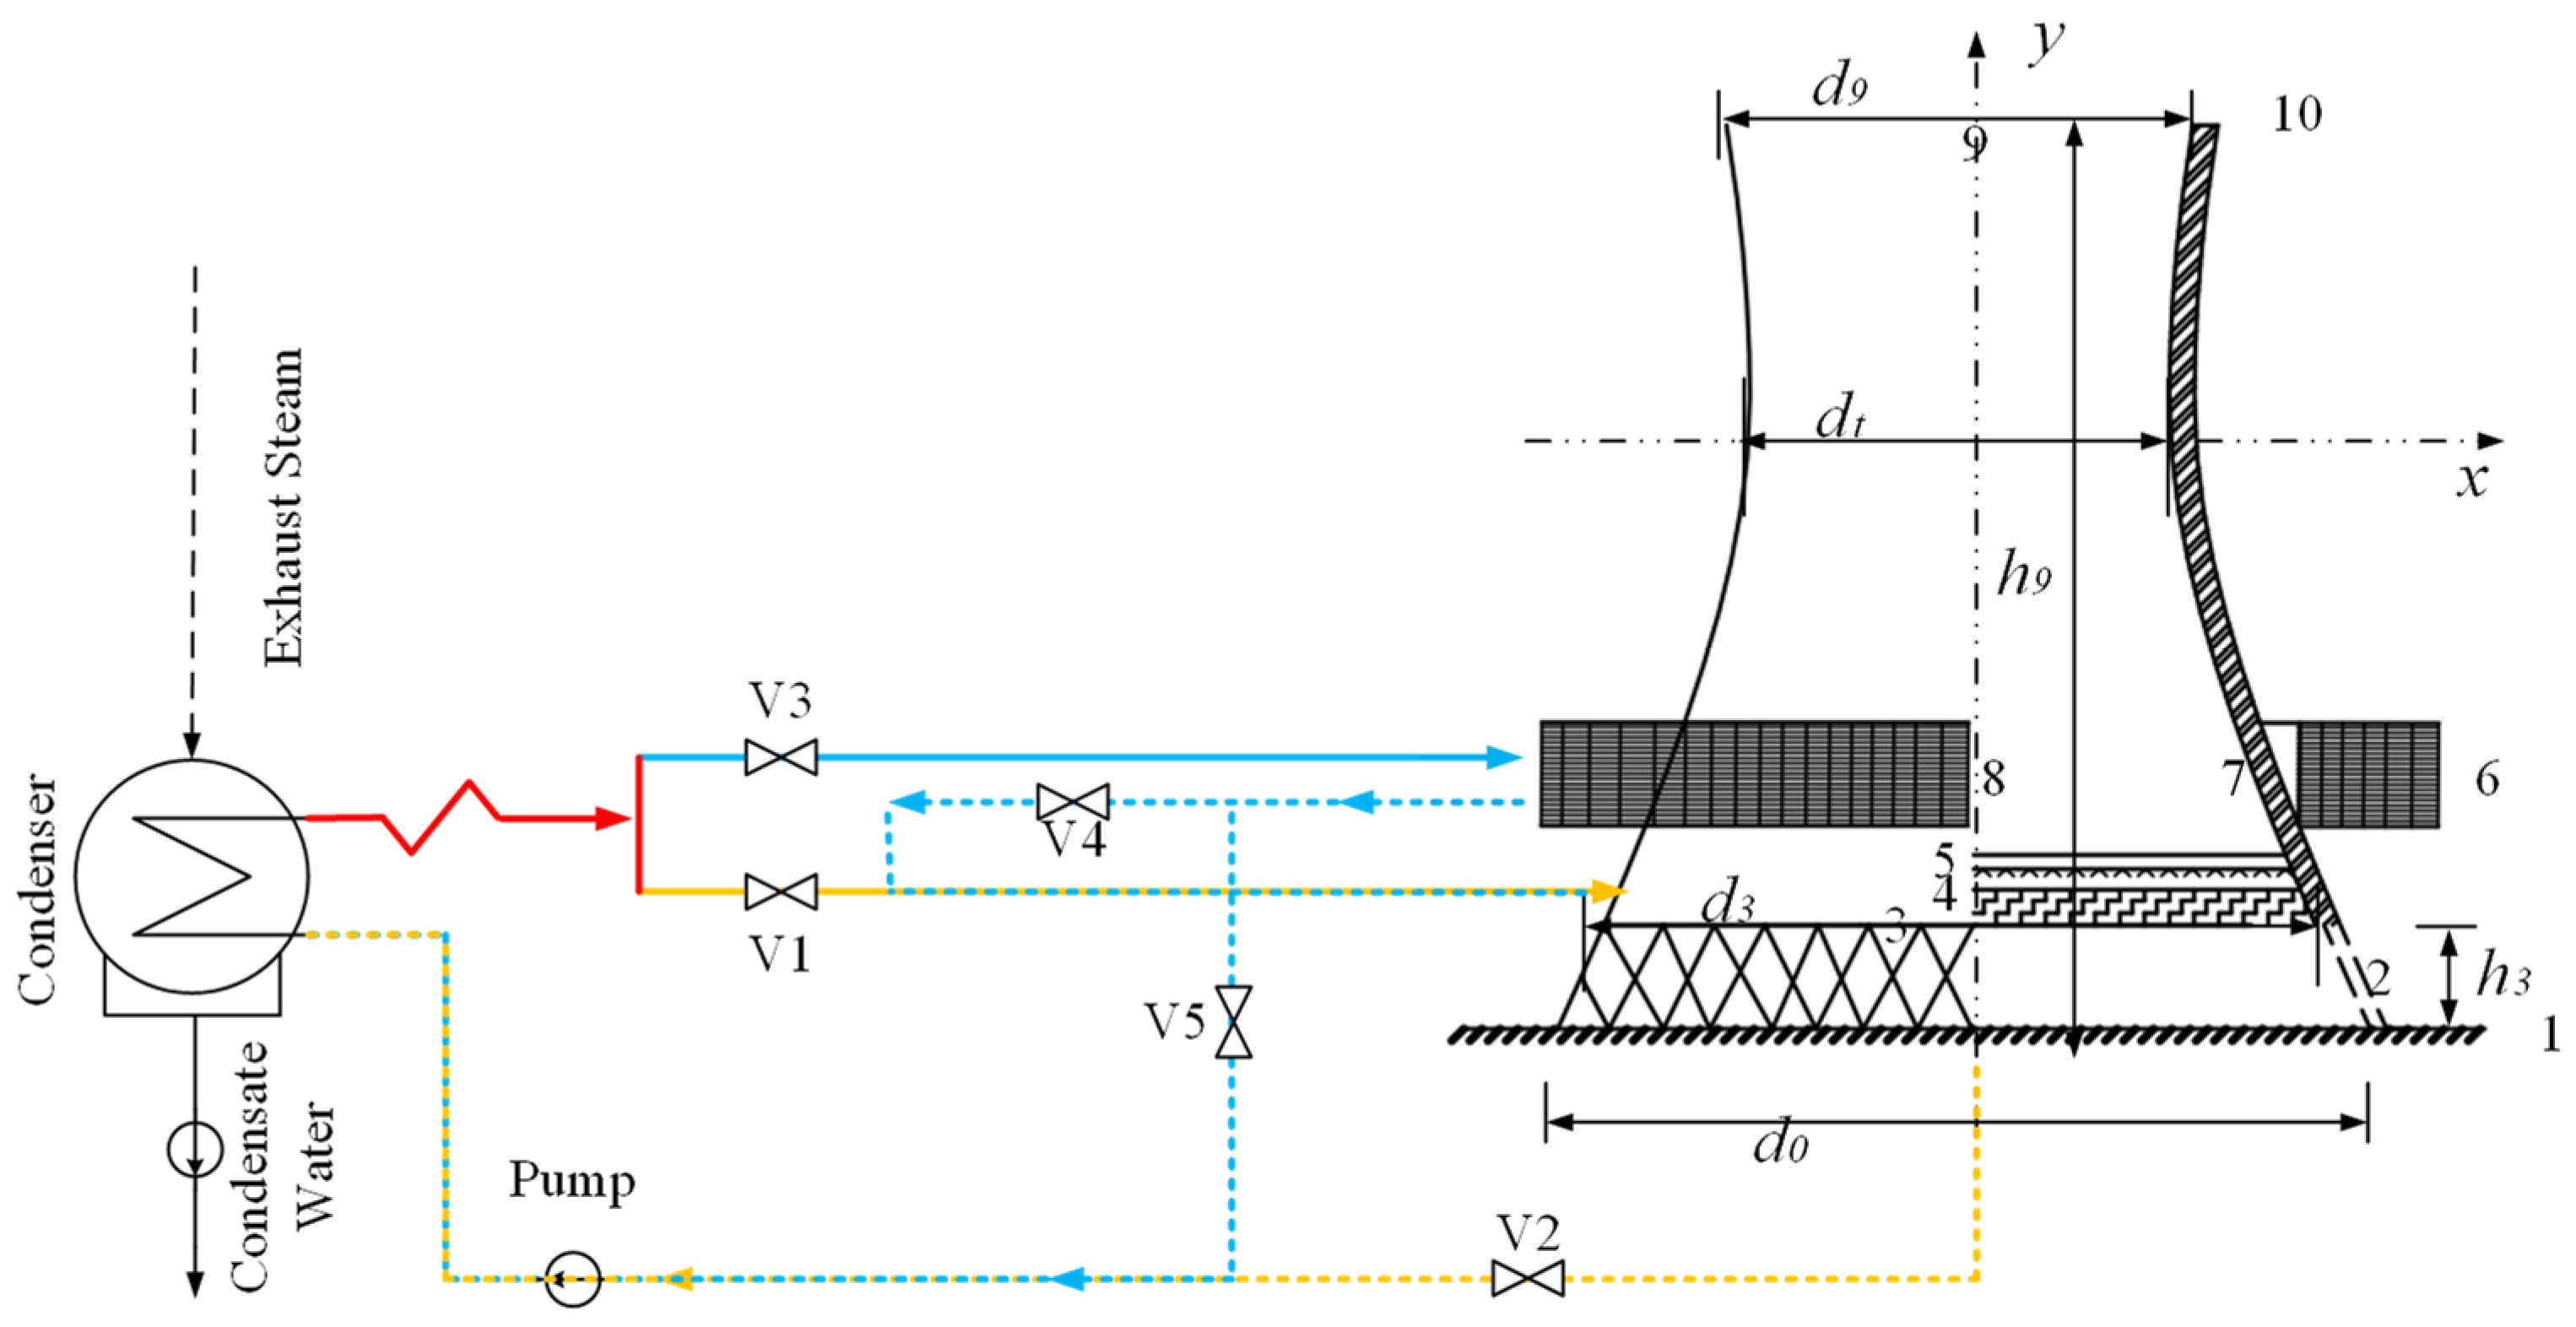
The proposed physical model of the NDHC is shown in
Figure 3. The fill, a common component in the wet cooling section, is horizontally positioned above the tower support at the inlet height. The space above the fill and below the nozzles forms the spray zone. The heat exchanger, a typical component in the dry cooling section, is arranged vertically, surrounding the tower at elevation 6. Due to the density disparity between the interior and exterior of the tower, air enters the tower simultaneously through the inlet at elevation 3 and the opening of the heat exchanger bundle at elevation 6, following a parallel-like trajectory. The air traverses through the fill, and the heat exchanger progresses along paths 2-3-4-5 and 6-7, converges at position 8, and proceeds outward to the environment at position 9. The water circulation on the waterside adopts a sequential arrangement, with circulating water passing through the heat exchanger, the spray zone, and the fill zone in sequence. Upon reaching the reservoir, it flows through valve V2, propelled by the circulation water pump, toward the condenser. By adjusting the valves, the flow direction of the circulating water can be modified, achieving the flexibility of changing between series and parallel operating modes. However, for the purposes of this study, only the series operating mode on the waterside was considered.
The calculations for the dry cooling section and wet cooling section are the same as the equations for standalone cooling towers discussed in previous sections. When air flows into the mixing section from two different regions, it can be considered based on mass-based averages.
The process from the mixing section to the system outlet can be described as follows [
16]:
2.4. Power-Generating Unit
Figure 4 illustrates the thermal power system diagram of an AP1000 unit with a rated power of 1250 MW at a nuclear power plant in China. The thermal power system comprises a steam generator, steam-water separation system, steam reheat system, turbine generator power system, high-pressure feedwater heating system, deaerator system, low-pressure feedwater heating system, condenser, and circulating water pump system, among others.
The energy balance within the condenser can be expressed as follows:
The heat exchange performance within the condenser can be calculated using the empirical formulas provided by the Heat Exchange Institute (HEI) [
33]
where
K0,
KW,
FM, and
FC are correction factors.
The Flugel formula can be utilized to calculate the extraction pressures of each stage in the steam turbine under different back pressures [
34],
where
M and
P represent the mass flow rate and steam pressure of each stage, respectively.
The enthalpy value of extraction steam from the last stage of the steam turbine can be calculated based on the preceding stage. By fitting the efficiencies of individual stages under various operating conditions using a data-driven approach and storing the resulting models of stage efficiency as a function of stage flow in a database, one can predict the stage efficiency for any operating condition.
By considering the heat exchange balance and mass conservation within each heater, the mass flow rate of extraction steam can be calculated as follows:
where
Mes,
Mfw, and
Md represent the mass flow rates of extraction steam, feedwater, and the drain, respectively.
τ is the enthalpy rise of feedwater, while
γ and
q denote the heat output of drain and extraction steam, respectively.
The main flow of steam entering the high-pressure turbine of the steam turbine was successively reduced by the extraction steam flow from each stage, yielding the exhaust steam flow.
The power output of the unit can be determined based on the thermodynamic parameters of steam and the mass flow rate of extraction steam as follows:
Here, Δhc and Δhes represent the actual enthalpy drops of the exhaust steam and extraction steam, respectively. ηm and ηg, treated as constants, represent the mechanical efficiency of the generator and the electrical efficiency of power generation, respectively.
When the absolute value of the relative error between Pe and the design power load is less than 0.01%, it is considered that the values of the main steam mass flow rate and other operating parameters are relatively reasonable. Otherwise, the value of Mms can be adjusted to repeat the calculations in Formulas (27)–(31) until the absolute value of the relative difference decreases to below 0.01%.
2.5. Cost Estimation
2.5.1. NDDC
The investment cost of a natural draft dry cooling system mainly consists of construction costs, operational costs, and maintenance costs. The construction costs are further divided into tower structure investment costs, heat exchanger investment costs, and circulation system investment costs. This section provides a simplified economic cost analysis, discussing the components and calculation methods of various costs [
35]. The cost weighting factors used for subsequent cost calculations are uniformly presented in
Table 1.
Heat exchanger bundle cost
Total finned tube cost per unit tube length,
Cft, CNY/m;
where
Wft is the finned tube cost weighting factor;
Ct is tube cost per unit tube length, ¥/m;
Cf is the cost of fins per unit tube length, CNY/m; and
Csc is the surface coating cost per unit tube length, CNY/m.
Heat exchanger bundle header and frame cost,
Ch, CNY/bundle;
where
Wh is the header and frame cost weighting factor;
Lt represents the length of the finned tube, m; and
ntb represents the number of heat exchanger tube bundles.
Total finned tube cost per unit tube length,
Che, CNY/bundle;
where
Whe is the heat exchanger bundle cost weighting factor (installation);
Cba is the bundle assembly cost, CNY/bundle.
Natural draft cooling tower shell
Cost of land, excavation, and foundation,
C1, ¥;
where
C1u is the land, excavation, and foundation unit cost, CNY/m
2;
Ab is the tower base area, m
2.
Cost of the tower shell,
Cct, CNY;
where
Cctc is the cost of the reinforced concrete used in the shell, CNY/m
3;
Vts is the volume of reinforced concrete in the tower shell, m
3. Subscript 5 represents the tower outlet, 3 represents the inlet, and
t represents the throat.
Cost of the heat exchanger bundle platform,
Chepl, CNY;
where
Cplu is the platform unit cost, CNY/m
2;
Ahepl is the heat exchanger platform area, m
2.
Cost of the tower supports,
Cts, CNY;
where
Ctus is the tower support unit cost, CNY/m
3;
nts is the number of tower supports;
dts is the diameter of tower support, m; and
Lts is the length of tower support, m.
Total construction cost,
Cc, CNY;
where
Wc is the structural maintenance cost weighting factor.
Circulation system costs
Total pump system cost,
Cpst, CNY;
where
Wps is the pump system cost weighting factor;
Cpump is pump capital cost, CNY;
Cem is electric motor cost, CNY; and
Cws is the electric wiring and switching cost, CNT.
Piping and valves cost,
Cpv, CNY;
where
Wpv is the piping and valves cost weighting factor;
nb is the number of bundles.
Operation cost estimation
Pump operating cost,
Cp0, CNY;
where
Ceav is the levelized electricity cost, CNY/kWh;
Pe is the input power to the pumps, kW; and
τ is the number of operating hours, h.
Fixed charges,
CFCR, ¥;
where
Ccapital is the total capital cost, CNY;
FCR is the levelized fixed charge rate.
Maintenance costs
The maintenance cost of the cooling system includes the heat exchanger, tower shell, pump system, and pipelines. The maintenance cost of different structures is equal to the construction cost of the structure multiplied by the maintenance cost weighting factor as follows:
Total costs
The total annual cost of the cooling system is
The cost of power generation (attributed to the cooling system) is
2.5.2. NDWC
In the overall cost of tower construction, compared to air-cooled towers, NDWCs can reduce heat exchanger costs but increase filling material costs [
36], as shown below
where the calculation method involves multiplying the volume of the fill material by the unit volume price.
In comparison to NDDC, the operational costs of NDWC also include the expenses related to the evaporative loss of circulating water, calculated as follows:
where the calculation method involves multiplying the quantity of evaporated water by the local industrial water price.
In terms of maintenance costs, NDWCs lack the maintenance costs associated with heat exchangers but have additional maintenance costs related to filling materials.
3. Model Validation and Basic Data
In this chapter, commercial software MATLAB 2021a is utilized to develop the numerical models for the secondary and tertiary circuits of nuclear power plants. The cooling systems involved included NDDC, NDWC, and NDHC. To verify the accuracy of the models, design parameters from domestic engineering examples were referenced, and the simulation results were compared with actual operating data. For the NDHC, which lacks engineering precedents, the structural parameters were designed based on a similar back pressure to ensure that the condenser and turbine sides operated under similar conditions. This consistency helps to ensure that differences in performance in the comparative study are solely due to the type of cooling tower, allowing for a more accurate assessment of the performance differences among the various cooling towers, such as water consumption, environmental adaptability, and economic efficiency. In practical engineering applications, back pressure is an important design parameter for nuclear power plants. By adopting a consistent back pressure design, the research results have a better reference value for practical engineering applications.
3.1. NDWC
The NDWC references the Phase I Engineering Report of a 1250 MW nuclear power project in a certain location in southern China. The structural parameters are listed in
Table 2. The designed back pressure for the power plant unit is 6.9 kPa.
The obtained heat transfer and outlet water temperature of NDWC through numerical simulations are shown in
Table 3. As the model is based on the assumption of uniform inlet and outlet pressures, the heat transfer capacity may be slightly higher than the design value. However, this error is within an acceptable range for engineering purposes.
3.2. SNDDC
The structural data of the NDDC is referenced from an indirect air-cooled tower at a 1000 MW coal-fired power plant in Xinjiang, China. Its designed back pressure is 10 kPa, and the specific parameters are provided in
Table 4.
Table 5 compares the simulated and design values of the heat transfer and outlet water temperature. After calculation, the error between the two is 0.88%, which is within an acceptable range. This indicates the reliability of the numerical simulation, supporting the subsequent application of the indirect air-cooled unit model from thermal power plants for the calculation and analysis of nuclear power air-cooled towers.
Currently, there are no completed 1000 MW nuclear power indirect air-cooled units in China, and actual data are lacking. Therefore, only simulated air-cooled tower design parameters with a design back pressure close to the target are available for reference. By consulting the literature, characteristic data of AP1000 air-cooled turbines with varying back pressures were obtained [
37]. Interpolating these data for a back pressure of 10 kPa, the simulated heat exchange capacity of a 1000 MW nuclear power indirect air-cooled tower was calculated to be 2408 MW. Through simulation, it was found that a single tower of the NDDC type used in thermal power plants would struggle to achieve such high heat exchange capacity. To achieve a heat exchange capacity of 2408 MW, the tower body parameters, heat exchanger parameters, and circulating water flow rate were increased. The calculated results indicated a tower height of 292 m and a circulating water flow rate of 170,000 t/h. Meanwhile, research showed that the largest cooling tower in the world was located at the Shengli Power Plant of the China National Energy Group. It has a tower height of 225 m. By comparison, the enlarged parameters of the million-level nuclear power indirect air-cooled tower already exceed those of the currently largest cooling tower in the world. In summary, the proposal to establish a single tower is not reliable, and future considerations should focus on the feasibility of a one-unit, two-tower scheme.
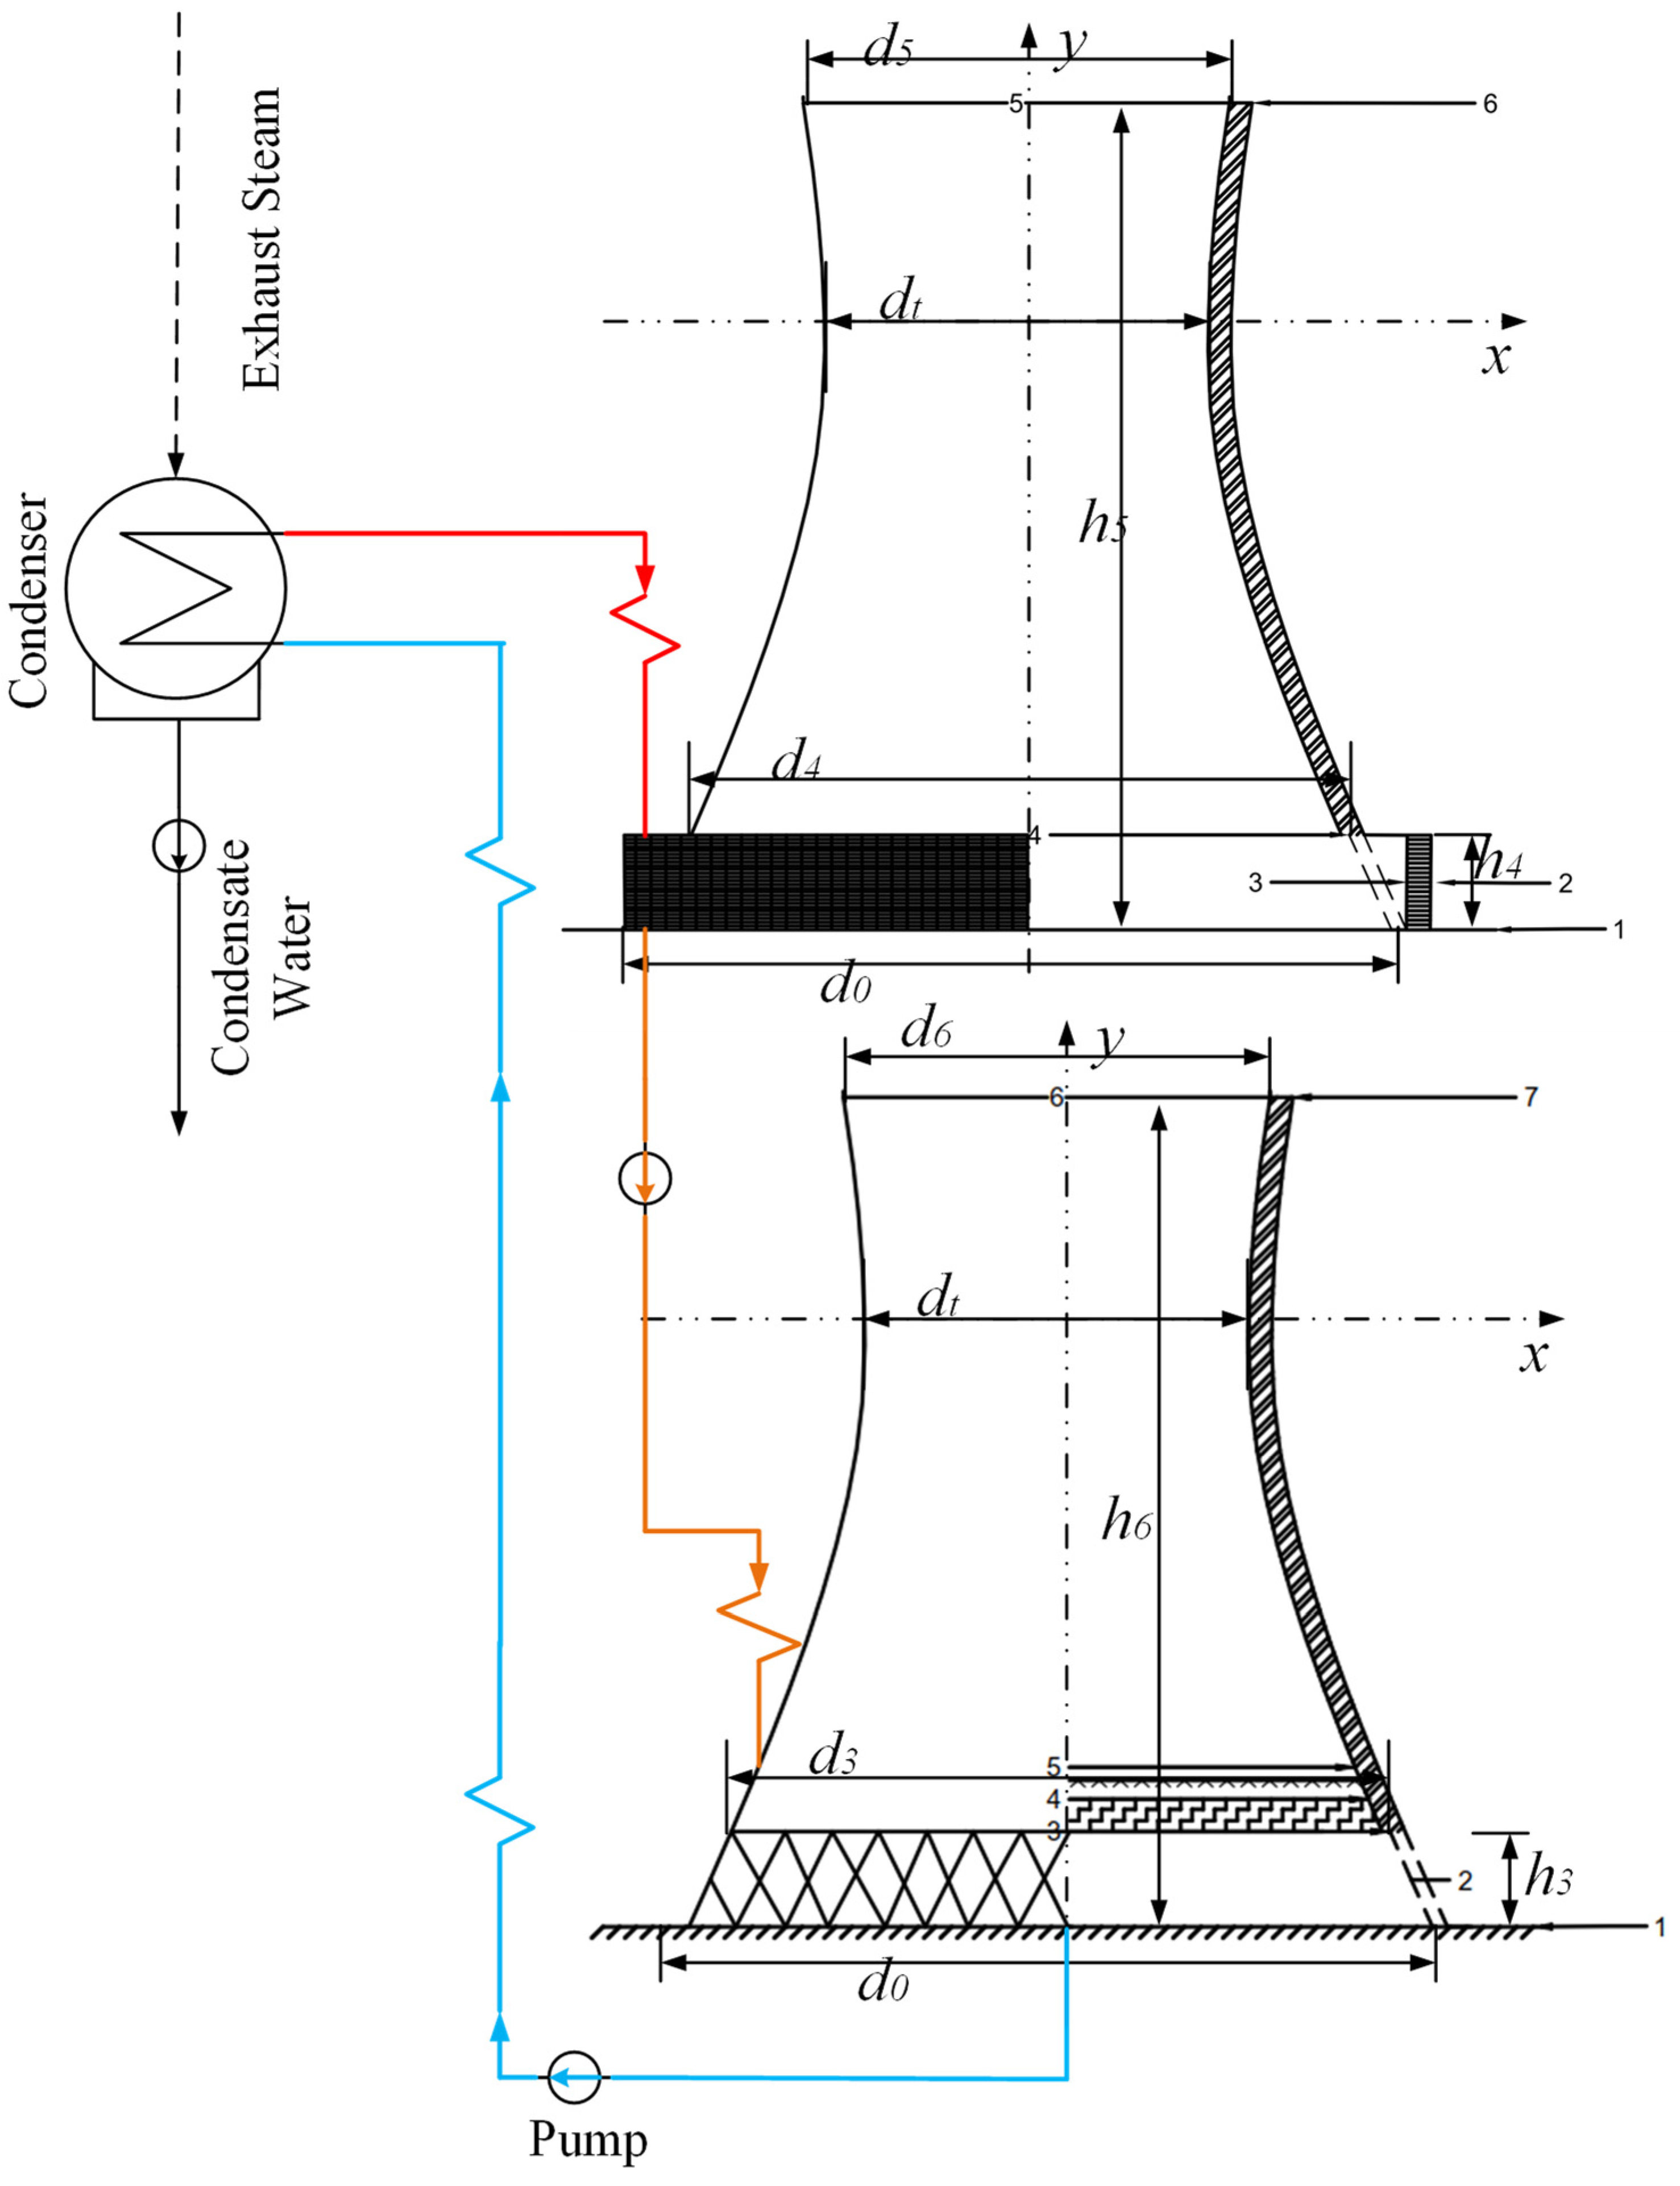
SNDDC arranges two NDDCs in series, with circulating water flowing successively through both NDDCs from the outlet of the condenser before finally returning to the condenser by the work of a circulating water pump, as shown in
Figure 5. SNDDC ensures that the design back pressure is the same as that of the 1000 MW nuclear power indirect air-cooled tower, which is 10 kPa. For the convenience of design and calculation, the parameters of the two serial NDDCs are selected to be consistent with specific design parameters, as shown in
Table 6.
3.3. CNDHC
CNDHC is based on the parameters of NDWC. It is positioned at a certain height above the wet cooling section, featuring vertically arranged heat exchangers encircling the tower.
The selection criteria for CNDHC are based on the same design of back pressure as NDWC. This means that under identical meteorological parameters, the total circulating water flow rate, inlet water temperature, and the outlet water temperature of the two tower types are kept consistent to ensure a uniform back pressure (6.9 kPa). Adjustments are made to the structural parameters of NDWC and NDDC, specifically to the tower body and heat exchanger parameters. The final results are presented in
Table 7.
3.4. SNDHC
Figure 6 below is a schematic diagram of SNDHC. The circulating cooling water from the outlet of the condenser enters the heat exchanger of NDDC first, undergoing heat exchange through the work of the circulating water pump. It then enters the filling area of NDWC for cooling before returning to the condenser [
38]. It is important to note that the outlet temperature of the circulating water in NDDC is equal to the inlet temperature of NDWC [
39], and the outlet flow rate of the circulating water from NDDC is equal to the inlet flow rate of NDWC [
40].
The structural parameters of SNDHC can be adjusted to ensure a back pressure of 6.9 kPa, with the structural parameters shown in
Table 8.
3.5. Basic Data on the Plant Location
In China, the climate in the northern regions is mostly cold and dry, while the southern regions experience predominantly hot and humid conditions. To ensure representative site selection, one location from both northern and southern China was chosen. Guangdong Province, specifically Lianjiang City, was selected to represent the southern climate, while Shanxi Province, Jincheng City, Yangcheng County, was chosen to represent the northern climate.
A comparative study was conducted using the actual meteorological conditions in Yangcheng County, Jincheng City, Shanxi Province, and Lianjiang City, Guangdong Province. The monthly average meteorological parameters and the monthly operating hours of the power plants for Yangcheng County and Lianjiang City in 2018 are shown in
Table 9 and
Table 10.
For the purpose of economic analysis, the water and electricity prices for the two locations were found, as shown in
Table 11.
4. Case Study with Discussion
This chapter explores the impact of various meteorological parameters on the performance of different cooling systems and analyzes the adaptability of these systems to the environment. The four cooling systems under discussion are NDWC (natural draft wet cooling systems), NDDC (natural draft dry cooling systems), CNDHC (Combined Natural Draft Hybrid Cooling Systems), and SNDHC (Separate Natural Draft Hybrid Cooling Systems). The operating parameters are uniformly set with a circulating water mass flow rate of 165,000 t/h and an inlet water temperature of 40 °C.
4.1. Sensitive Analysis under Different Ambient Conditions
Among numerous meteorological parameters, cooling towers are relatively sensitive to dry-bulb temperature and relative humidity. To investigate the sensitivity of different tower types to dry-bulb temperature and relative humidity and to encompass meteorological conditions in most regions of both northern and southern China, a range of dry-bulb temperatures from 5 °C to 35 °C, at intervals of 5 °C and relative humidity ranging from 20% to 80%, at intervals of 20%, were selected. Simulations were conducted to obtain the outlet water temperature and evaporation rate for different tower types, as presented in
Table 12, where Ta is the dry-bulb temperature, RH is relative humidity, T
out is the outlet water temperature, and m
evap is evaporation.
In a cross-sectional comparison of data under identical meteorological parameters, circulating water flow rate, and inlet water temperature, it was observed that the SNDDC consistently exhibited the highest outlet water temperature, indicating its inferior heat exchange performance.
For the NDWC, it was noted that this type of tower consistently achieved the best cooling performance when the dry-bulb temperature exceeded 25 °C. However, when the dry-bulb temperature was below 25 °C, the CNDHC exhibited a superior cooling capacity among the four tower types.
For the SNDHC, a horizontal comparison revealed its excellent adaptability to changes in meteorological parameters. Although this type of cooling tower did not achieve the lowest outlet water temperature among the four types, the calculations indicate that the average outlet water temperature for the SNDHC was the lowest at 295.93 °C. In comparison, the average outlet water temperatures for the CNDHC and the NDWC were close, at 296.04 °C and 296.05 °C, respectively. Clearly, for a site with significant variations in meteorological conditions, the SNDHC exhibited optimal heat exchange performance.
In a vertical comparison of each column of data, due to the absence of direct contact between the air and water during the internal heat exchange process in the SNDDC, changes in humidity in the environment did not affect the heat and mass transfer in SNDDC. For the other three tower types, it was observed that as the relative humidity increased, the heat exchange performance of the cooling towers significantly decreased. This phenomenon is attributed to the fact that all three tower types have a filled part, and the heat exchange of circulating water in the filling primarily depends on the evaporative cooling process, which is weakened by higher relative humidity.
As the dry-bulb temperature increases, the heat exchange capacity of all four tower types decreases. This is because the cooling principle of cooling towers relies on the heat exchange between circulating water and ambient air to achieve a reduction in water temperature. When the temperature difference between the air and circulating water decreases, the heat exchange performance correspondingly deteriorates.
In terms of evaporation, it is observed that the evaporation rate of NDWC is consistently the highest under any meteorological condition. This is attributed to the fact that, compared to the other two tower types, NDWCs only have the wet section in their heat exchange structure, while SNDHC and CNDHC also provide a dry section heat exchanger for additional heat exchange. When comparing these two hybrid tower types, it was found that the evaporation rate of CNDHC is always superior to that of SNDHC. The advantage becomes more pronounced with higher dry-bulb temperatures. At a dry-bulb temperature of 35 °C and a relative humidity of 20%, the maximum difference in evaporation rates between the two is 246.1 kg/s.
In a vertical comparison of evaporation rates for each column, it was observed that higher relative humidity and higher dry-bulb temperatures correspond to lower evaporation rates. This is because an increase in relative humidity weakens the evaporative cooling process, while an increase in dry-bulb temperature reduces the ventilation rate inside the tower.
The regression curve obtained for the non-standardized outlet water temperature is given as follows, reflecting the multivariate linear relationship. This regression curve provides insights into the impact of unit changes in meteorological parameters on the outlet water temperature and evaporation rate. The results indicate that in the linear regression curve for NDWC, the coefficient for relative humidity is the largest at 0.06343. This suggests that changes in relative humidity have the greatest impact on the cooling performance of NDWC when measured in unit increments. However, changes in dry-bulb temperature have the smallest impact on the outlet water temperature of NDWC. The CNDHC outlet water temperature was found to be most influenced by changes in dry-bulb temperature but less susceptible to changes in relative humidity. SNDHC fell between the two, indicating the best adaptability to environmental changes. This result aligns with the earlier analysis.
The non-standardized multivariate linear regression curve for the evaporation rate is presented below. The results indicate that the evaporation rate of NDWC is most susceptible to unit changes in dry-bulb temperature and relative humidity. The coefficient for dry-bulb temperature (Ta) is notably high at 17.86, surpassing the dry-bulb temperature coefficient for NDHC by a considerable margin. This suggests that NDHC is effective at achieving water conservation goals.
The non-standardized regression curves mentioned above provide insights into the adaptability of different cooling systems to fluctuations in environmental parameters. To assess the sensitivity of different cooling systems to environmental parameters, it is necessary to dimensionless the data and obtain standardized multivariate linear regression curves. The calculated results are as follows.
Analyzing the sensitivity of different cooling systems to environmental variables, the results indicate that, compared to NDWC, NDHC exhibits lower sensitivity to relative humidity but higher sensitivity to dry-bulb temperature in terms of cooling performance. In contrast to NDWC, NDHC shows lower sensitivity of evaporation rates to dry-bulb temperature but higher sensitivity to relative humidity.
4.2. Thermal Performance of Cooling Systems
The simulated heat exchange capacities of different cooling systems in Yangcheng and Lianjiang are illustrated in
Figure 7, where hollow symbols represent Lianjiang, while solid symbols represent Yangcheng. The image on the right is an enlarged view of the black dashed box in the left image. It can be observed that, regardless of the geographical location (north or south), SNDDC consistently exhibits the lowest heat exchange capacity among the four tower types. For the other three tower types, which are designed with the same back pressure, the differences in heat exchange capacity are not pronounced. However, upon closer inspection, it is evident that during colder months, CNDHC has the highest heat exchange capacity, while NDWC has the lowest. As temperatures rise, the heat exchange capacity of NDWC gradually surpasses that of the hybrid systems, aligning with the conclusions drawn in the sensitivity analysis section.
To compare the heat exchange performance of the dry and wet sections in hybrid systems, the heat exchange capacity of the dry and wet sections of hybrid systems under the climatic conditions in Yangcheng is shown in
Figure 8. In this context, CNDDC consists of two NDDC units connected in series; hence, the heat exchange capacity of the two dry sections is presented. It was observed that in the hybrid systems, the efficiency of the dry section is relatively low because the dry section primarily transfers sensible heat, with the majority of the heat exchange occurring in the wet section. However, under relatively colder climatic conditions, the gap in heat exchange between the dry and wet sections of hybrid towers gradually diminishes. In January and December, the heat exchange in the dry section of CNDHC even surpasses that of the wet section.
When the reference temperature is 263.15 K, the enthalpy values of saturated moist air vary with air temperature [
25], as shown in
Figure 9. The curves of sensible heat and latent heat intersect, indicating that, at relatively low temperatures, the sensible heat of pure dry cooling exceeds the latent heat of pure wet cooling. When the ambient temperature is low, the corresponding saturated moist air state parameters have a limited capacity to absorb water vapor, and the low evaporation rate on the circulating waterside results in saturation. At this point, the higher ventilation rate of the natural draft dry cooling system allowed it to surpass the heat exchange capacity of NDWC under conditions of lower dry-bulb temperatures. Generally, such meteorological conditions are uncommon in Australia and Africa, where natural draft dry cooling systems are more commonly adopted and, thus, are infrequently reported.
4.3. Comparative Analysis of Back Pressure
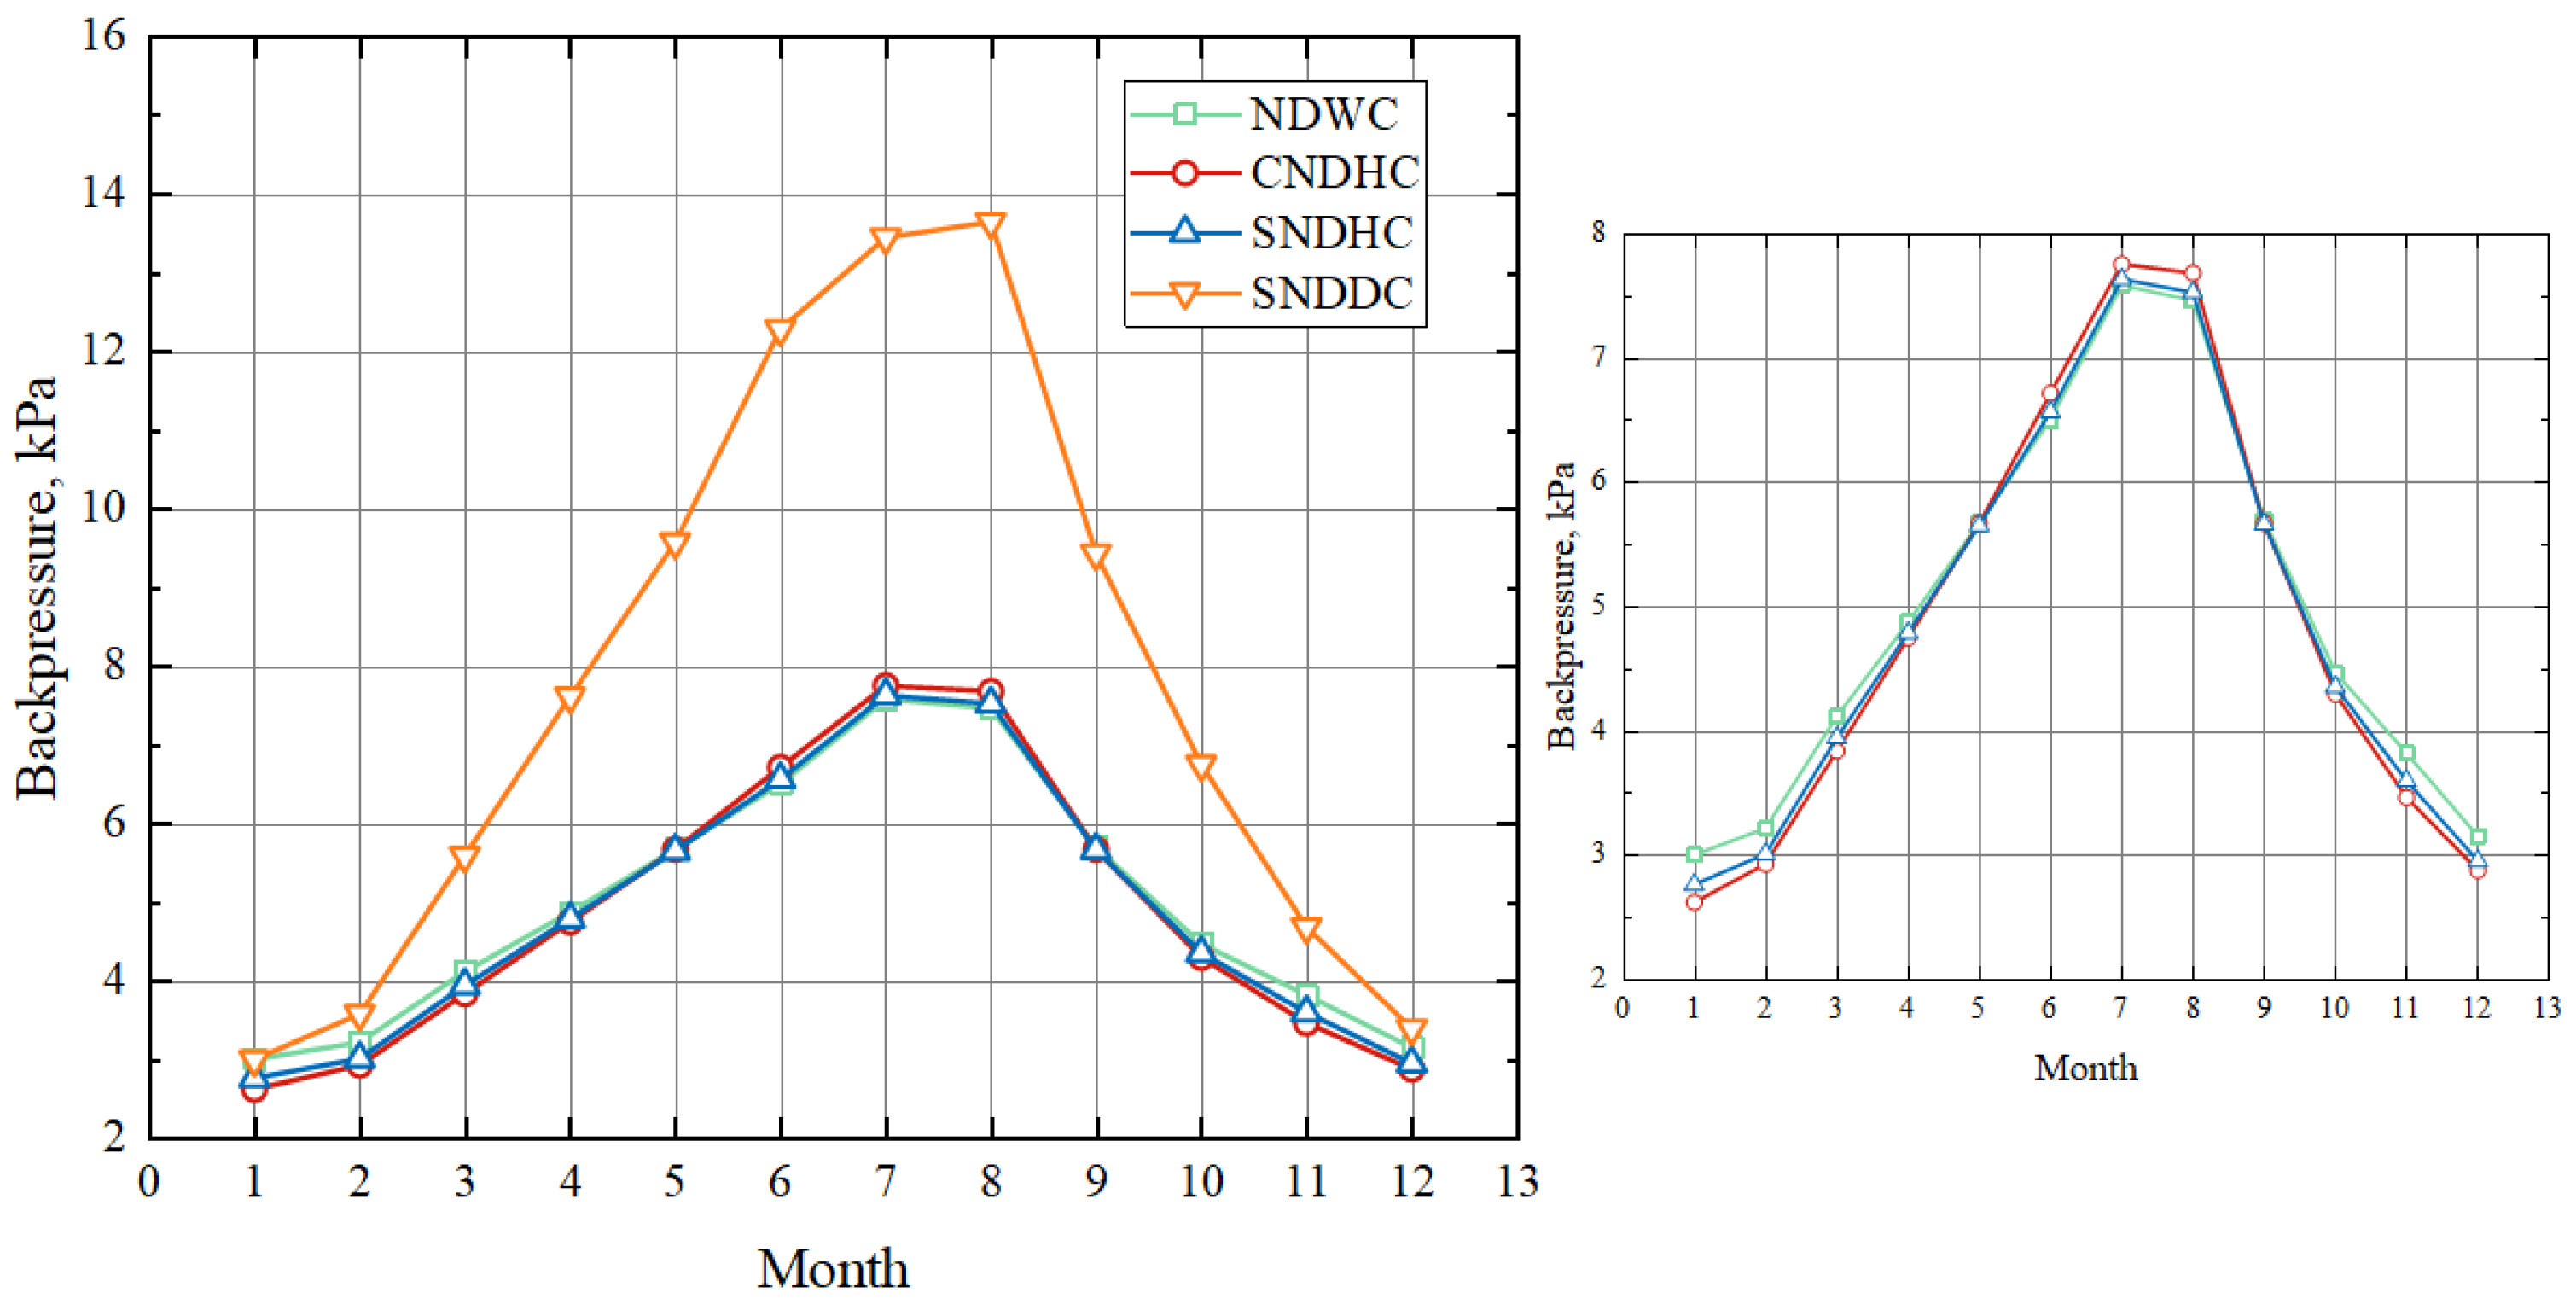
Based on the established coupled model of the nuclear power plant’s secondary circuit and the cooling tower, the monthly variation in back pressure for the power plant was calculated, as illustrated in
Figure 10. The image on the right is an enlarged view of certain curves from the image on the left. As analyzed in
Section 4.2 earlier, under sufficiently cold meteorological conditions, the heat exchange capacity of air cooling could even surpass that of wet cooling, as seen in the meteorological parameters for Yangcheng in January. When the dry-bulb temperature was −4 degrees Celsius, the back pressure of SNDDC was already lower than that of NDWC.
The right chart depicts the image with the SNDDC curve omitted. It can be observed that approximately in May and September, under the environmental conditions of Yangcheng, the three curves intersect. When the temperature is below these two months, NDWC exhibits the highest back pressure, and CNDHC has the lowest back pressure. Moreover, the difference in back pressure between the two increases as the temperature decreases, reaching 0.25 kPa in January. When the temperature exceeds that of May and September, the back pressure of the hybrid system gradually surpasses that of NDWC. The maximum difference in back pressure occurs in August, reaching only 0.06 kPa.
The following
Figure 11 illustrates the variation in back pressure for different tower types in Lianjiang. The image on the right is an enlarged view of certain curves from the image on the left. The right chart presents the image with SNDDC excluded, showing a similar relative size relationship in back pressure, as observed in Yangcheng. For low temperatures, the hybrid system is more favorable, while the NDWC is more advantageous in high temperatures. The maximum back pressure difference between the CNDHC and NDWC in the summer occurs in June, amounting to 0.09 kPa. Thus, the advantage of the CNDHC is evident in low-temperature climates, with the potential for a back pressure reduction of 0.25 kPa compared to NDWC. Even in the summer climate of the southern region, the back pressure difference is within the range of 0.09 kPa, further emphasizing the cooling potential of the hybrid system.
It can be observed that, whether in Yangcheng or Lianjiang, the unit back pressure is high in summer and low in winter. When the cooling system is coupled with the nuclear power unit, the cooling system’s inlet water temperature decreases with the ambient temperature. A higher heat exchange performance ensures lower system back pressure and higher power generation. The increase in power generation allows the nuclear power unit to produce more electricity in the same period, generating higher revenue. However, the operating cost of the unit is also an important factor to consider when calculating economic feasibility. The subsequent analysis involves a comparative analysis of the operating costs of the cooling systems.
4.4. Water Consuming
NDDCs are more popular in the northern regions due to their excellent water-saving performance. Among the operating costs of cooling towers, the cost of makeup water is significant. Excellent water-saving performances can significantly reduce later operational expenses. In this section, we conduct a comparative analysis of the water-saving performance of the four tower types in plant locations in both northern and southern regions.
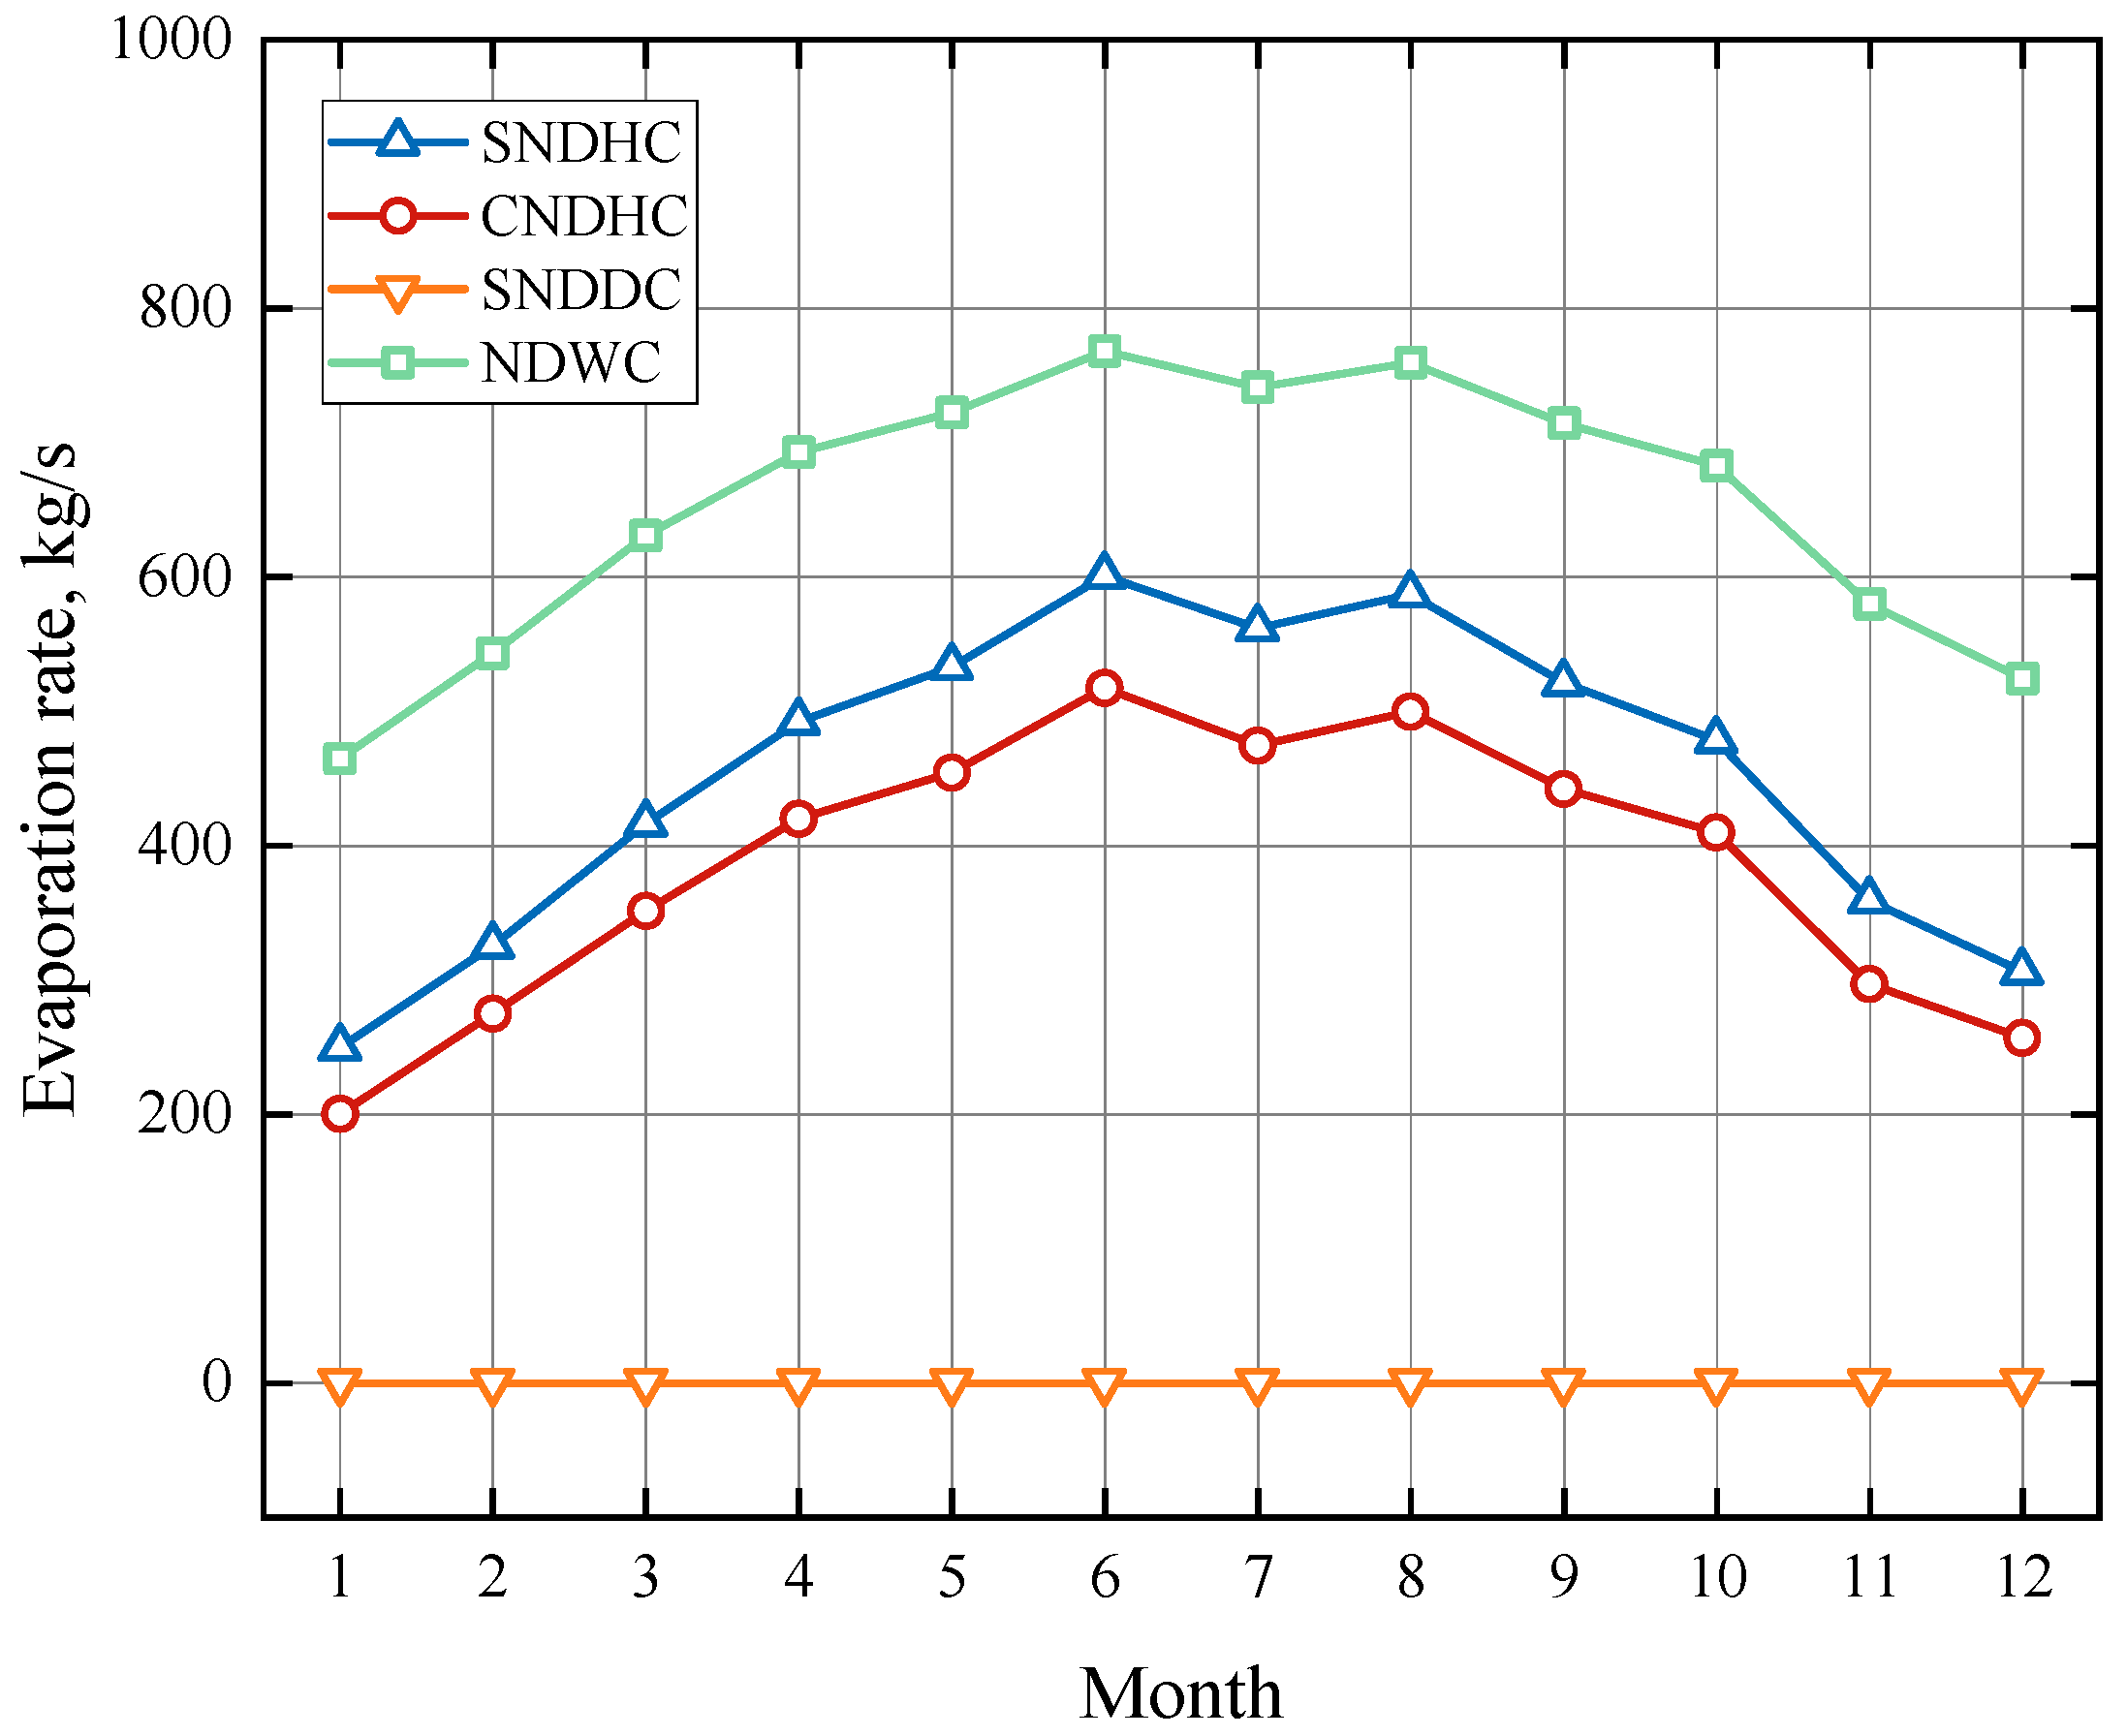
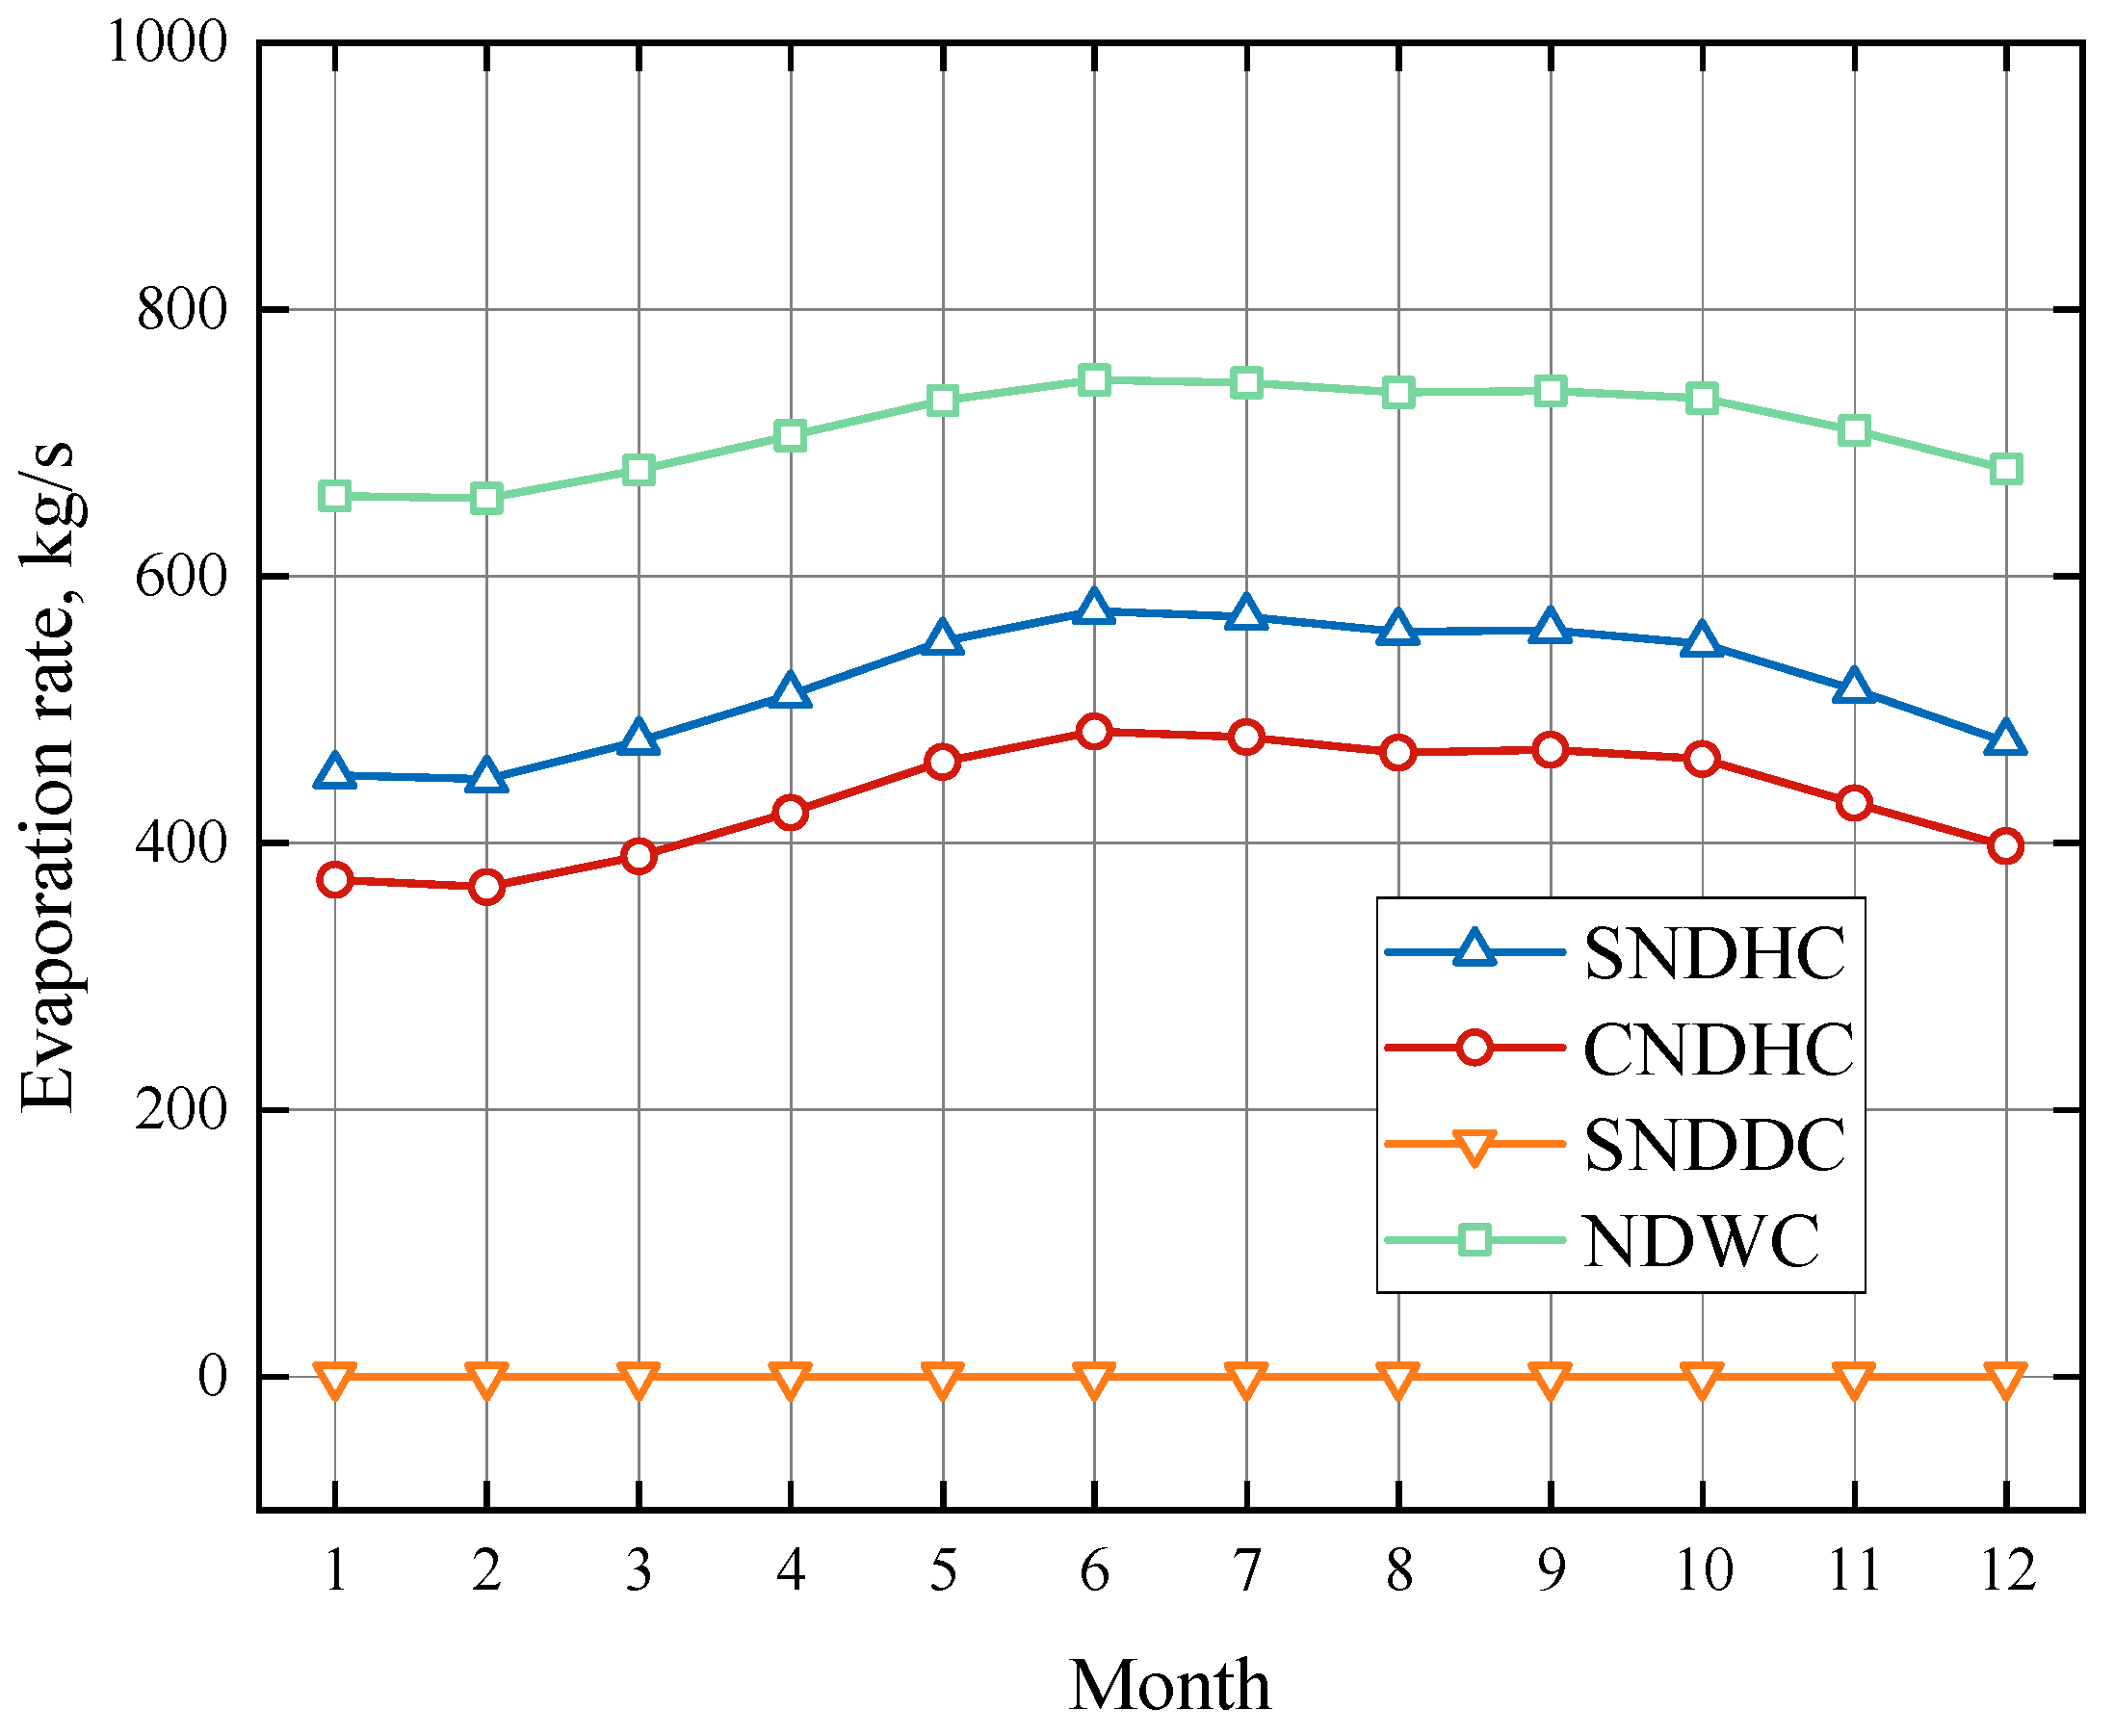
The following
Figure 12 and
Figure 13 depict the variation in evaporation for the cooling systems in Yangcheng and Lianjiang, respectively. The order of evaporation from high to low is NDWC, SNDHC, CNDHC, and SNDDC. In the climate of Yangcheng, the average monthly cycle water evaporation rate of SNDHC is 200 kg/s lower than that of NDWC, and the evaporation rate of CNDHC is 270 kg/s lower than that of NDWC. In the climate conditions of Lianjiang, the average monthly cycle water evaporation rate of SNDHC is 190 kg/s lower than that of NDWC, and CNDHC is 276 kg/s lower than NDWC. In Yangcheng, the evaporation sharply decreases from June to July, which is attributed to the increase in relative humidity from 56.7% to 75.6%.
The NDWC exhibits the highest evaporation volume as it relies primarily on the evaporative cooling of the fill, while the hybrid cooling system incorporates both wet and dry sections to achieve water saving. SNDDC has minimal water evaporation losses due to the air-cooling heat exchanger. Excluding SNDDC, CNDHC has the lowest evaporation volume. The subsequent optimization of the operational mode by adjusting the flow rates to the dry and wet sections could further reduce operating costs and increase net profit.
It is worth mentioning that the conclusion in the earlier
Section 4.1 was that the evaporation of the cooling system can decrease in hot and humid climates. This is in direct contrast to the conclusion in this section. The reason for this discrepancy is that, when coupled with the power generation unit, more water is required for heat exchange in hot summers to ensure that the unit can achieve a lower back pressure.
4.5. Operation Cost
The total operating costs mainly include the costs of pump operation and the cost of circulating water evaporation losses.
Figure 14 depicts the variation in operating costs for different cooling systems in Yangcheng. The order from high to low is NDWC, SNDHC, CNDHC, and SNDDC. SNDHC has an average monthly operating cost of CNY 48 million lower than NDWC, and CNDHC has a cost of CNY 66 million lower than NDWC.
Due to the small tower parameters and fewer pump units, NDWC has the minimum pump operation cost, but it also has the highest rate of circulating water evaporation, and evidently, the low cost of pump operation cannot compensate for the losses caused by circulating water evaporation. SNDDC incurs no consumption of circulating water, resulting in the lowest operating cost.
It is worth noting that in the summer, the operating cost gap between the NDWC and hybrid system narrows while it widens during cold weather. The difference reaches its maximum in January, and the sudden drop in operating costs in December is due to the lowest monthly operating hours.
Due to the humid climate conditions in Lianjiang, compared to Yangcheng, the evaporative losses of circulating water for various cooling systems decreased. Coupled with the lower industrial water prices in the southern region, the difference in circulating water consumption costs among different cooling systems decreased. As a result, the proportion of circulating water consumption costs in the total operating costs decreased, while the proportion of pump operation costs increased. At this point, the operating costs of NDWC were lower than those of NDHC, as shown in
Figure 15. Clearly, in the humid climate of the southern region and with lower industrial water prices, water-saving cooling systems struggle to demonstrate their advantages.
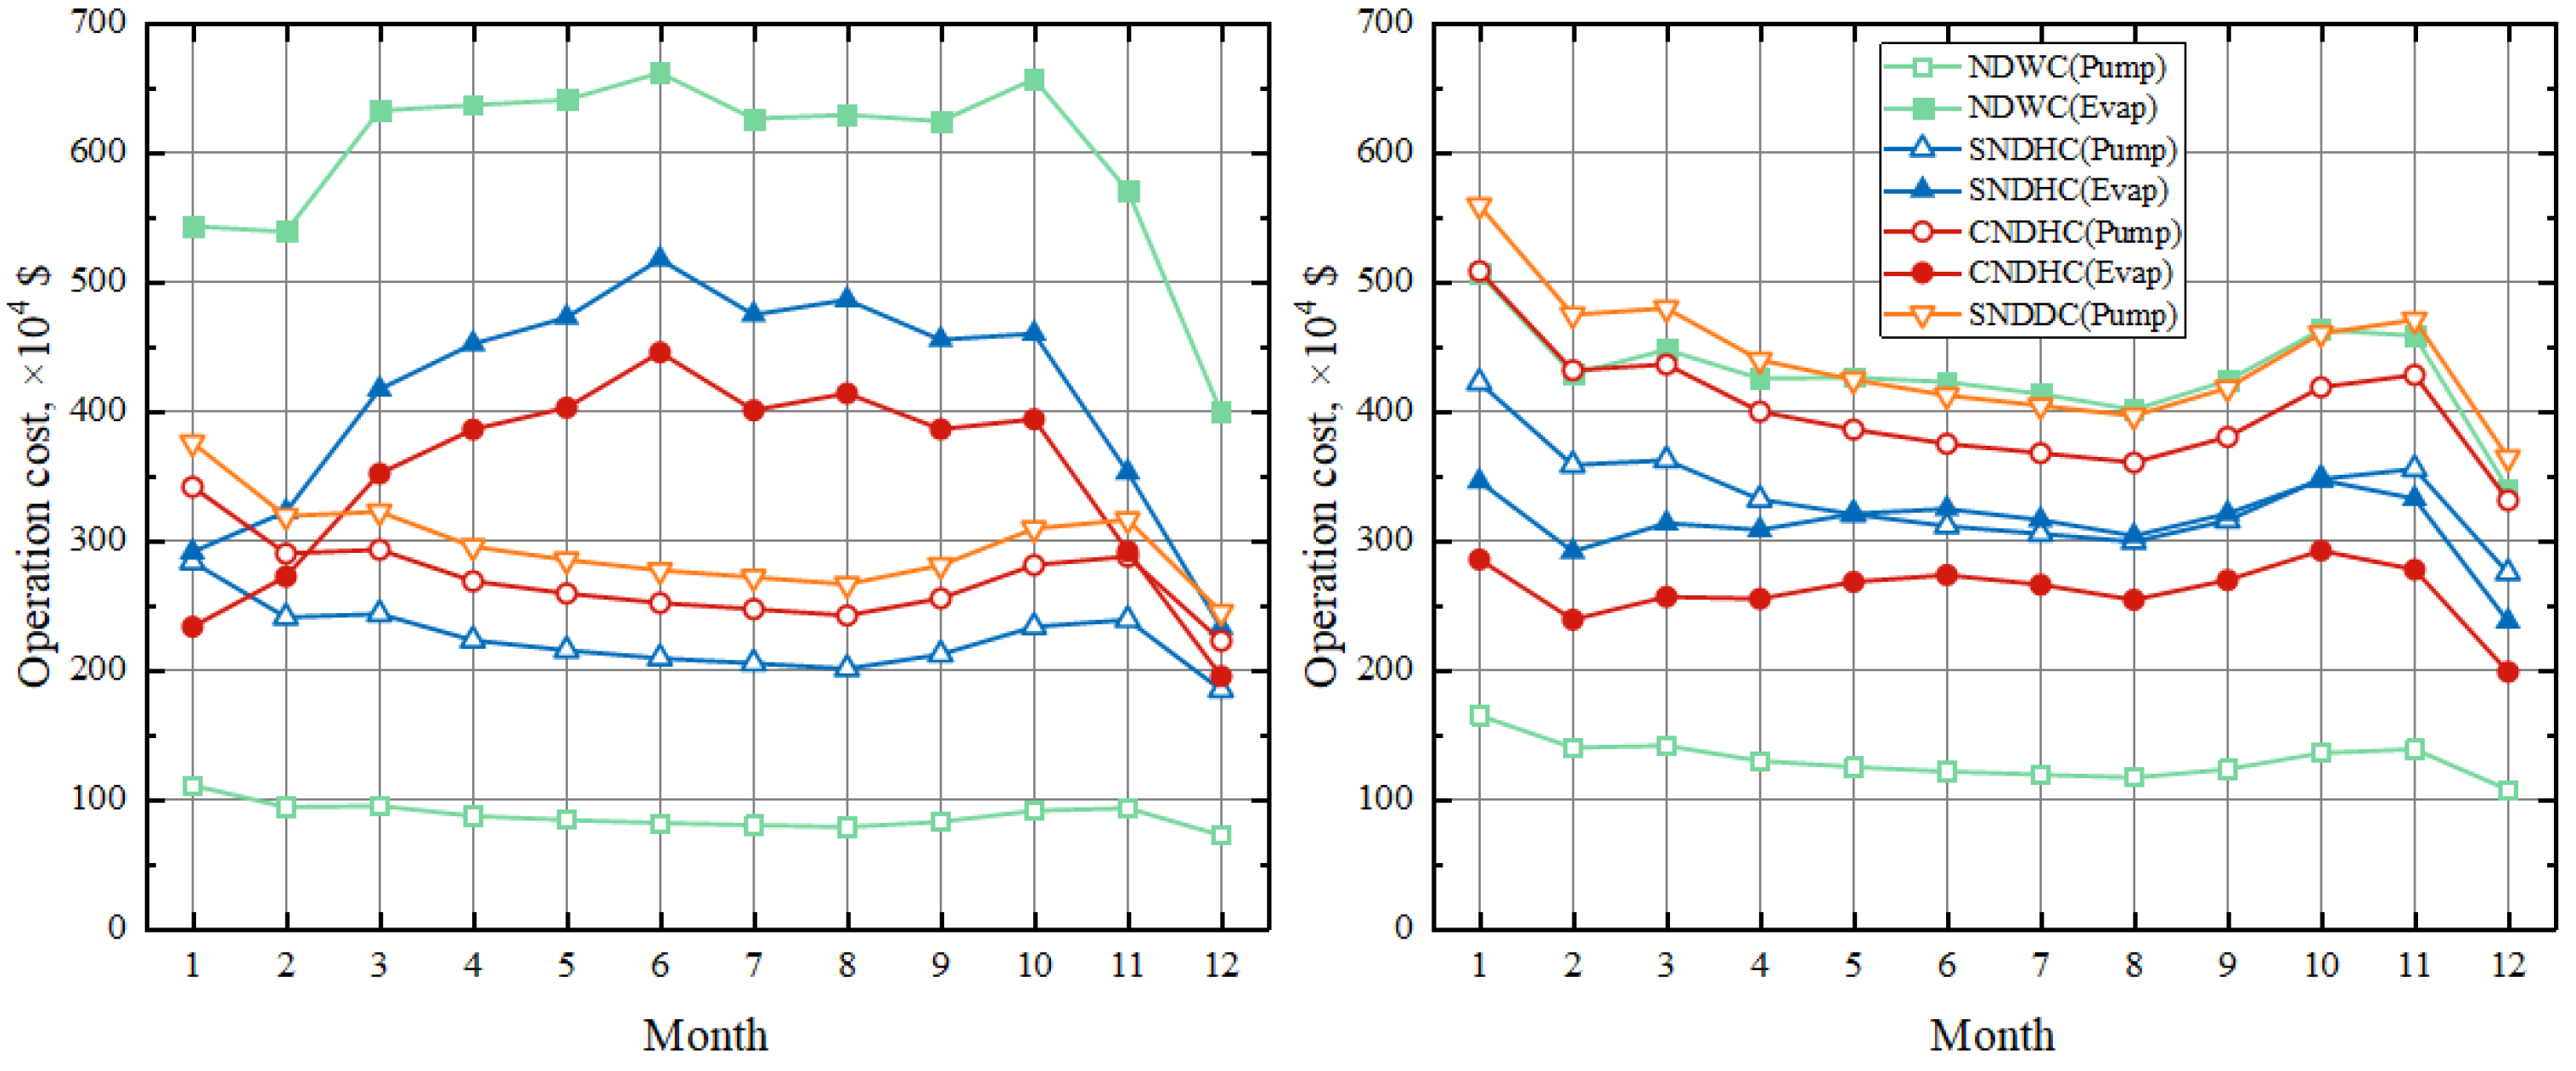
To further explore optimization directions, the total operating costs are broken down into pump operation costs and makeup water costs, as shown in
Figure 16. The left chart represents the Yangcheng plant, while the right chart represents the Lianjiang plant. It can be observed that compared to NDWC, NDHC has lower makeup water costs but higher pump operation costs. In the climate of Yangcheng, NDHC has a higher proportion of makeup water costs, and only in colder months are makeup water costs lower than pump operation costs. In the climate conditions of Lianjiang, it was found that the pump operation costs of the CNDHC exceeded makeup water costs. For the SNDHC, in colder months, pump operation costs are higher, while in hot summers, makeup water costs are higher. SNDDC has the highest pump operation costs due to it having the largest number of pumps.
This indicates that the proportion of pump operation costs cannot be ignored. Subsequent optimization can be achieved by adjusting the ratio of circulating water entering the dry and wet sections to reduce the pump operation consumption and evaporative losses of circulating water. This is expected to expand the applicability of hybrid systems further.
4.6. Net Benefit
The formula for calculating the net profit is as follows:
where
E represents the total revenue, CNY;
W represents the power generation capacity, kW;
t represents the operating time, h;
Ceav represents the on-grid electricity price, CNY/kWh;
Ctot represents the annual average cost, CNY/annum;
Profit represents the total net profit, CNY; and
Profit_h represents the hourly net profit, CNY/hour.
The annual average cost of different cooling systems includes the following three components: tower construction annual amortization, operating cost, and maintenance cost.
Table 13 presents the tower construction annual amortization for each cooling system. NDWC has the lowest cost due to its single and small tower design, followed by CNDHC. SNDHC and SNDDC, due to their double-tower design, occupy a larger space, resulting in higher tower construction costs, which are higher than that of single-tower systems.
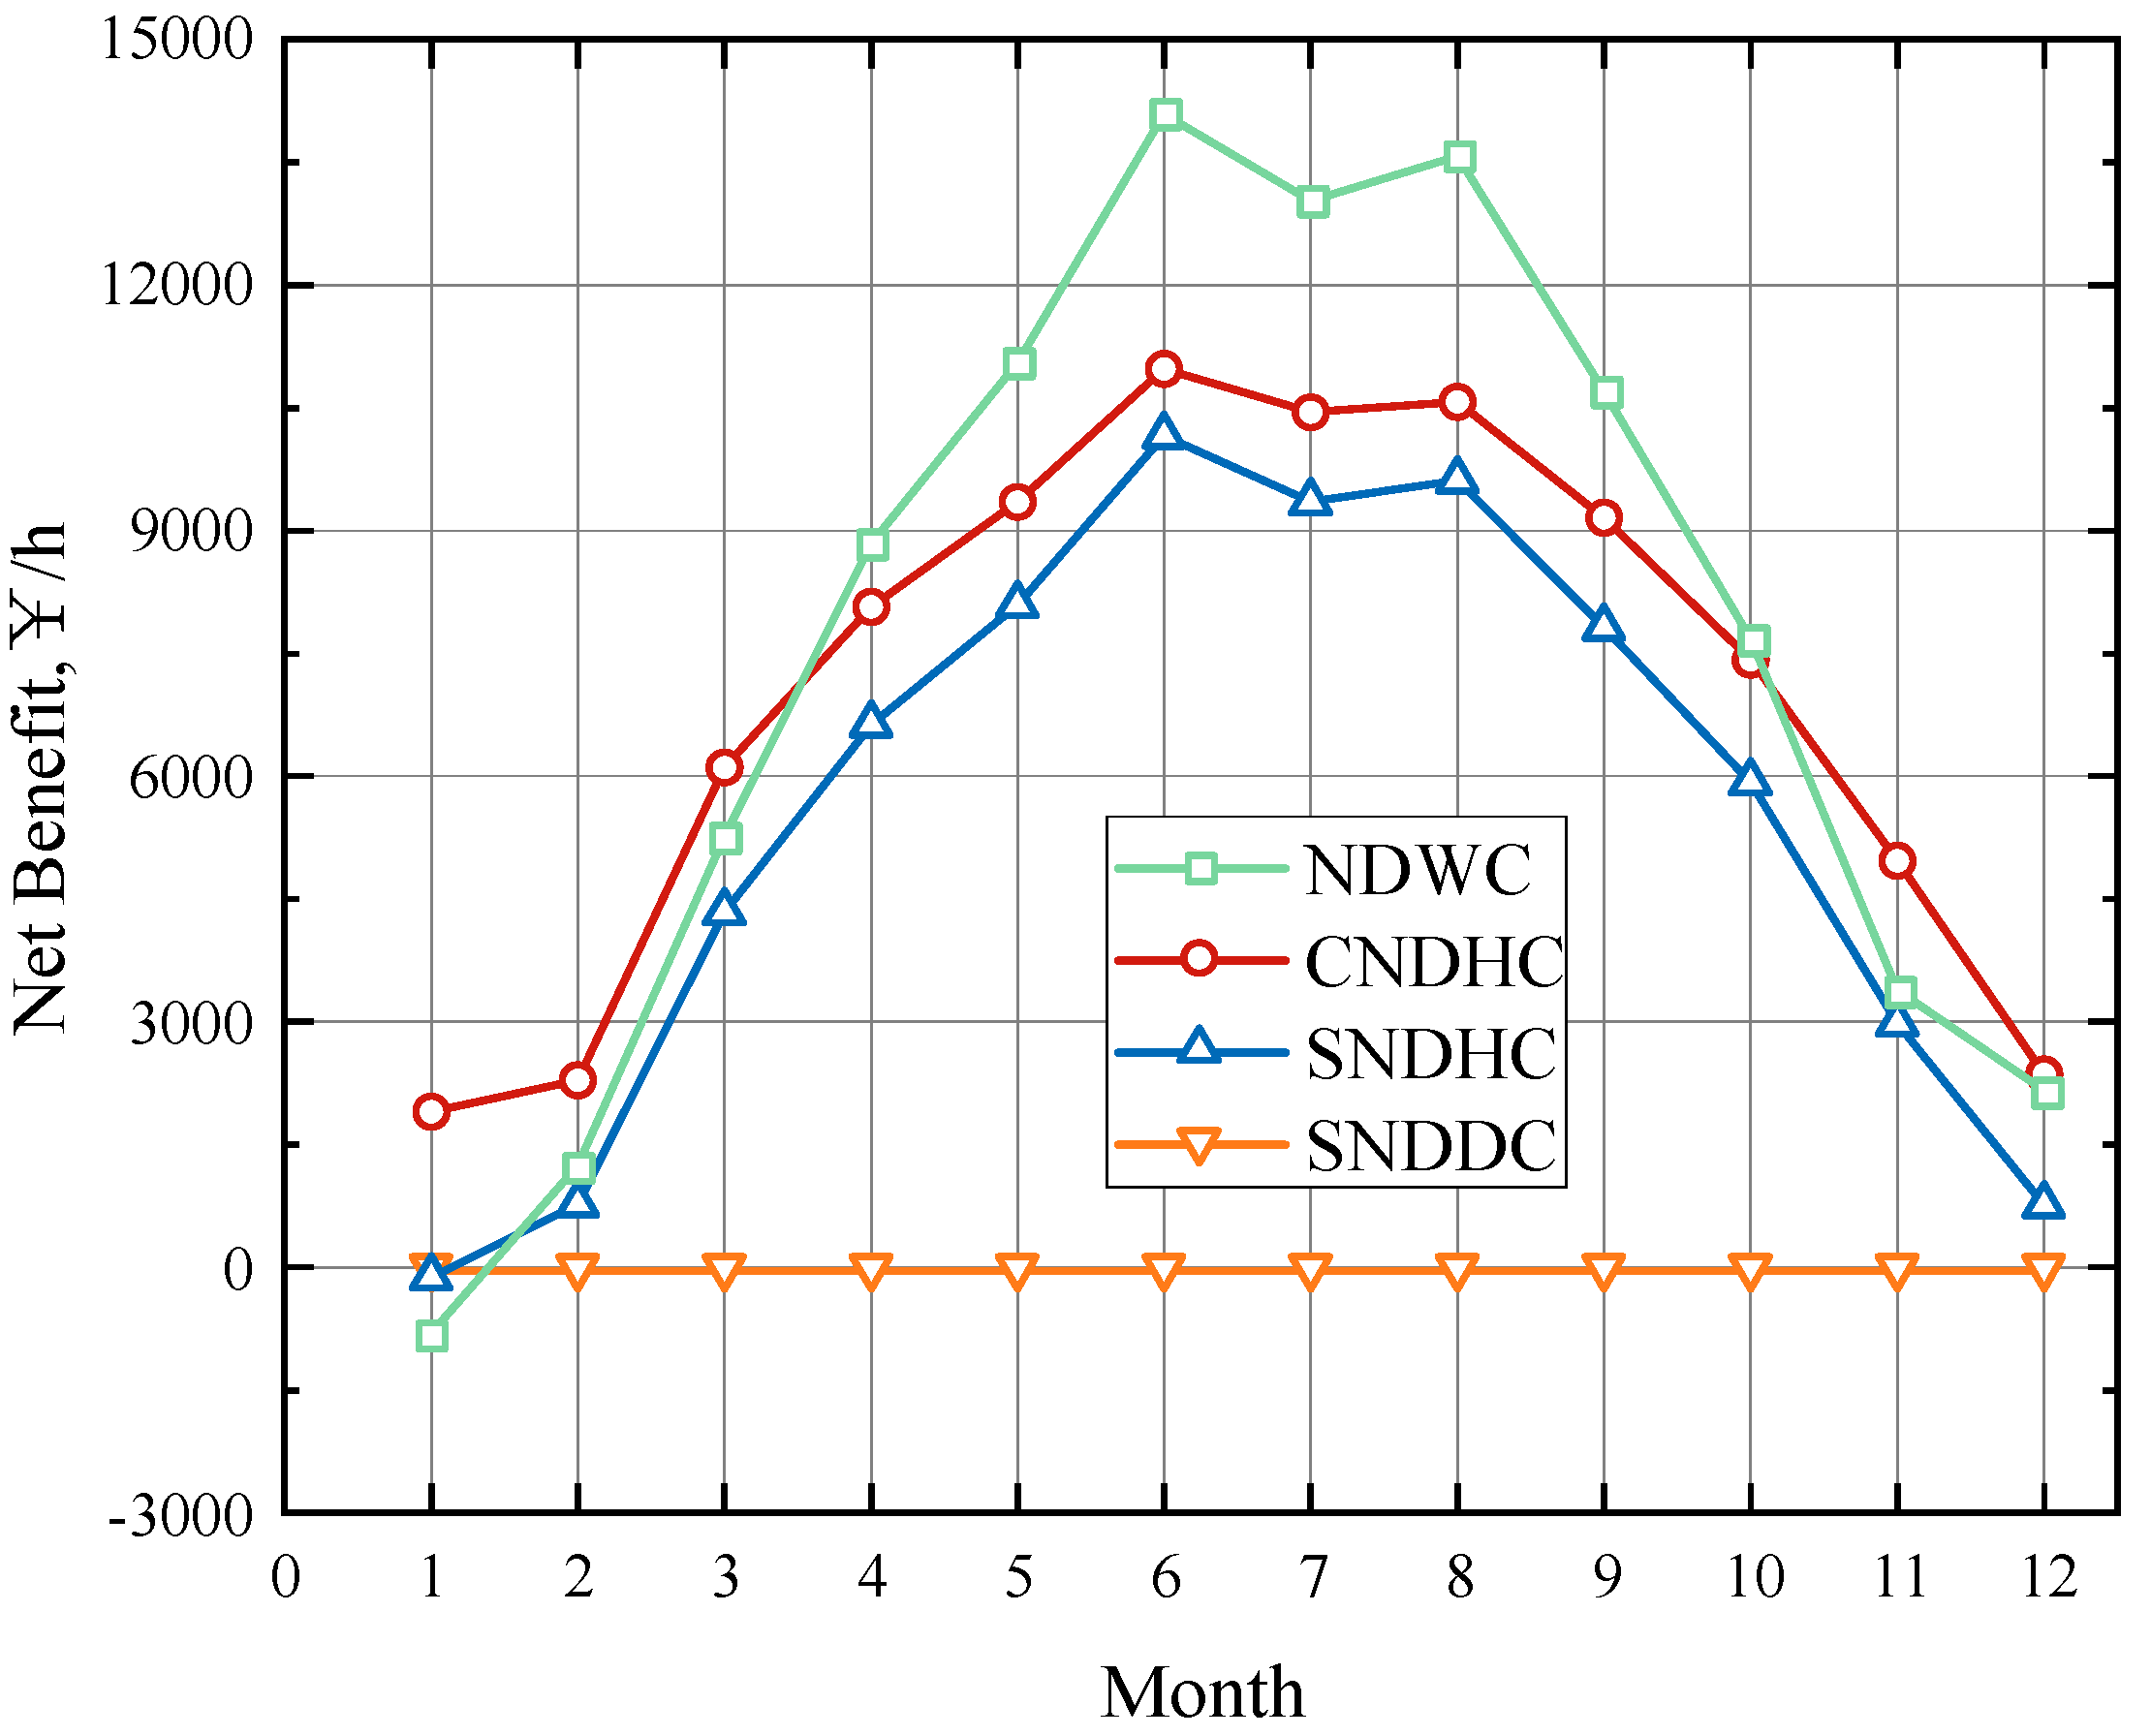
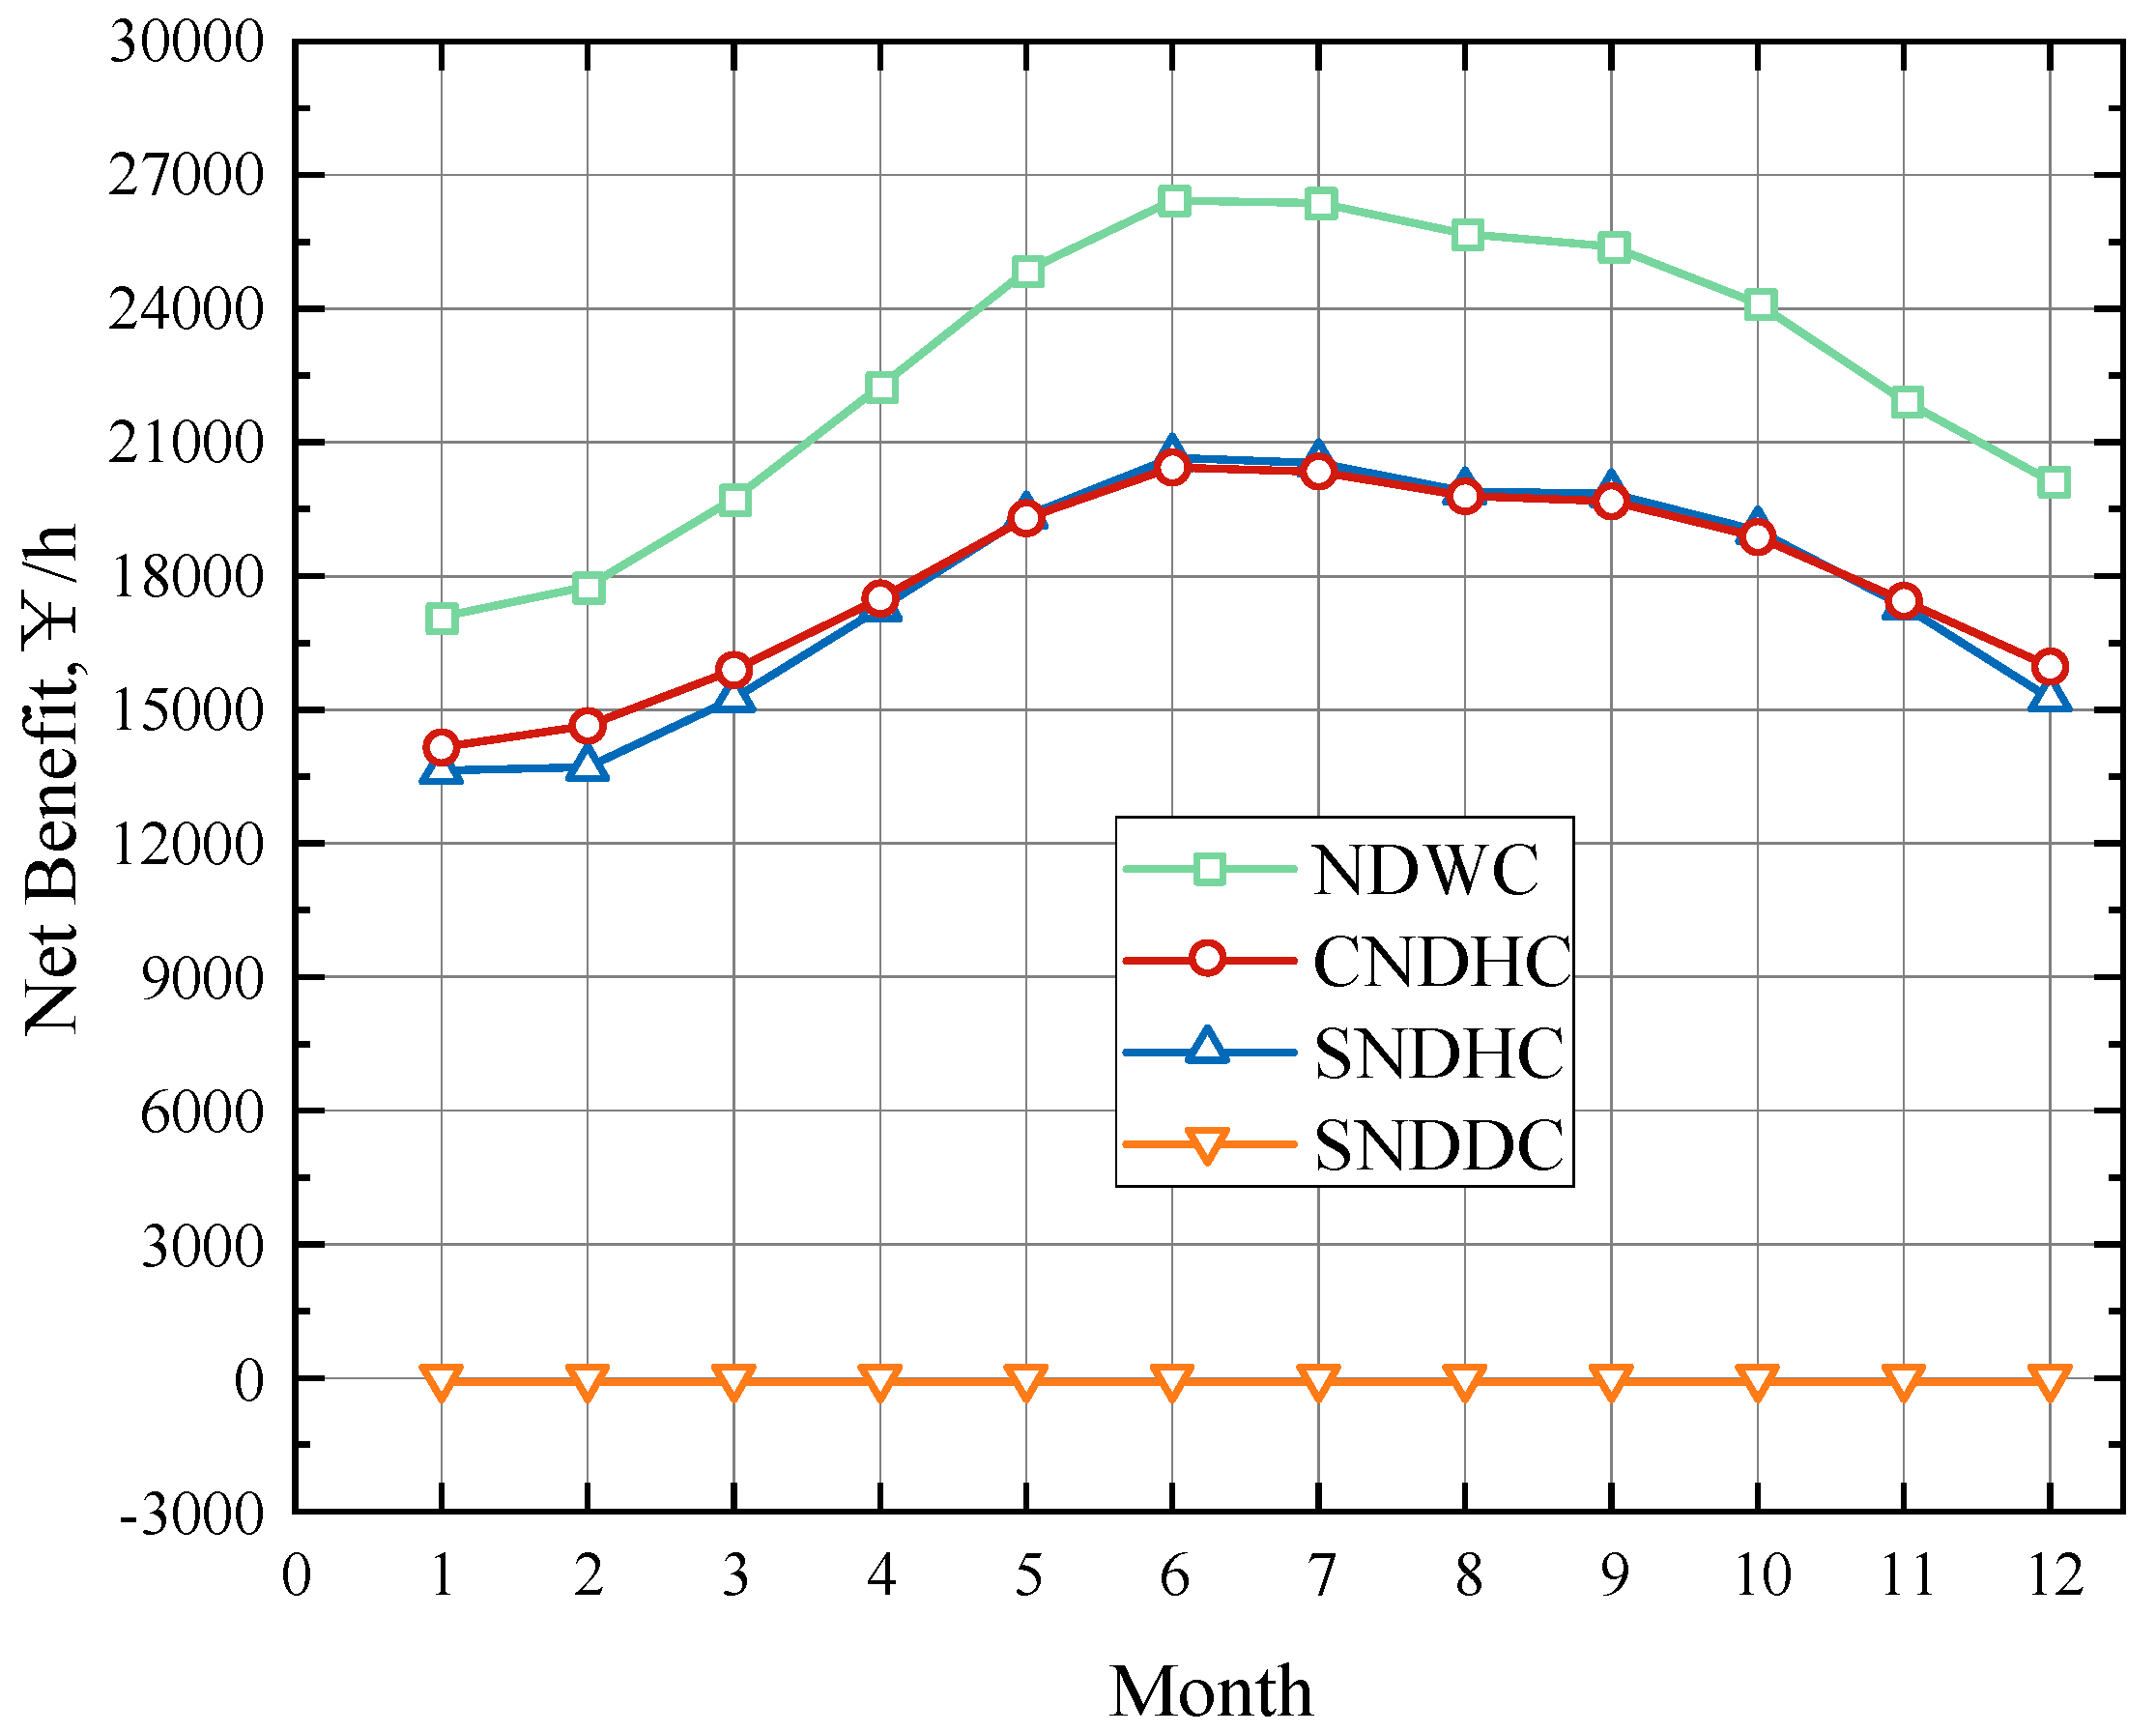
Choosing SNDDC as the baseline with zero net profit, the chart in
Figure 17 illustrates the monthly variation in net profit for different cooling systems in Yangcheng. From this graph, it can be observed that the higher the temperature, the more pronounced the advantage in net profit for NDWC, reaching the maximum difference with CNDHC in June. As mentioned earlier, NDWC, lacking a dry section for heat exchange, relies solely on the evaporative cooling of circulating water in the fill, resulting in the maximum evaporative loss and, subsequently, the highest operating cost. However, as the temperature rises, the gap in operating costs between NDWC and the hybrid system narrows. The non-standardized multiple linear regression curve on evaporative loss in
Section 4.1 indicates that the coefficient of Ta for NDWC is as high as 17.86, surpassing the dry-bulb temperature coefficients of 8.56 for CNDHC and 2.99 for SNDHC. Therefore, with increasing temperatures, the advantage of the combined system in operating costs diminishes. Furthermore, coupling the nuclear power generation system with the wet-cooling tower in June, when the power output of the CNDHC power generation system is at its highest and that of the NDWC system is at its lowest throughout the year, leads to the peak net profit for NDWC in June, with the maximum difference from the combined system’s net profit.
When the temperature decreases, the profits of the hybrid cooling system and SNDDC gradually surpass NDWC. This is because, in colder months, NDWC has the highest back pressure, lowest power output, and the highest operating costs, resulting in the lowest net profit for the wet-cooling tower in January. The slopes of the curves also indicate that the net profit of NDWC is most sensitive to environmental changes. The hybrid system shows better adaptability to environmental variations, and CNDHC outperforms SNDHC. Calculating the total annual net profit for 2018, it was found that CNDHC is only CNY 48,000 lower than NDWC, which is negligible in the context of the project.
Although SNDDC has the lowest operating costs, its highest tower construction cost and back pressure result in the worst economic performance.
The chart in
Figure 18 illustrates the monthly net profits of different cooling systems in Lianjiang. In the humid climate of the south, lower operating costs keep NDWC’s net profit consistently at the highest. The two-hybrid cooling systems, with similar power generation and operating costs, have a small difference in net profit. SNDDC, due to its less apparent water-saving advantage in a humid climate, exhibits a significant gap in net profit compared to other cooling systems.
