Article

Spray Characterization of Direct Hydrogen Injection as a Green Fuel with Lower Emissions

CMT—Clean Mobility & Thermofluids, Universitat Politècnica de València, Cami de Vera s/n, 46022 Valencia, Spain
*
Author to whom correspondence should be addressed.
Energies 2024, 17(10), 2405; https://doi.org/10.3390/en17102405
Submission received: 25 April 2024 / Revised: 11 May 2024 / Accepted: 12 May 2024 / Published: 16 May 2024
(This article belongs to the Section A5: Hydrogen Energy)

Abstract

:
A viable green energy source for heavy industries and transportation is hydrogen. The internal combustion engine (ICE), when powered by hydrogen, offers an economical and adaptable way to quickly decarbonize the transportation industry. In general, two techniques are used to inject hydrogen into the ICE combustion chamber: port injection and direct injection. The present work examined direct injection technology, highlighting the need to understand and manage hydrogen mixing within an ICE’s combustion chamber. Before combusting hydrogen, it is critical to study its propagation and mixture behavior just immediately before burning. For this purpose, the DI-CHG.2 direct injector model by BorgWarner was used. This injector operated at 35 barG and 20 barG as maximum and minimum upstream pressures, respectively; a 5.8 g/s flow rate; and a maximum tip nozzle temperature of 250 °C. Experiments were performed using a high-pressure and high-temperature visualization vessel available at our facility. The combustion mixture prior to burning (spray) was visually controlled by the single-pass high-speed Schlieren technique. Images were used to study the spray penetration (S) and spray volume (V). Several parameters were considered to perform the experiments, such as the injection pressure (Pinj), chamber temperature (Tch), and the injection energizing time (Tinj). With pressure ratio and injection time being the parameters commonly used in jet characterization, the addition of temperature formed a more comprehensive group of parameters that should generally aid in the characterization of this type of gas jets as well as the understanding of the combined effect of the rate of injection on the overall outcome. It was observed that the increase in injection pressure (Pinj) increased the spray penetration depth and its calculated volume, as well as the amount of mass injected inside the chamber according to the ROI results; furthermore, it was also observed that with a pressure difference of 20 bar (the minimum required for the proper functioning of the injector used), cyclic variability increased. The variation in temperature inside the chamber had less of an impact on the spray shape and its penetration; instead, it determined the velocity at which the spray reached its maximum length. In addition, the injection energizing time had no effect on the spray penetration.

1. Introduction

In transportation, the two primary energy conversion technologies used in hydrogen powertrains are the internal combustion engine (ICE) and the fuel cell (FC) [1]. In comparison to FC technology, hydrogen ICE technology offers several benefits such as increased resistance to fuel contaminants, ease of switching between fuels, lower use of rare materials, and a simpler shift from traditional vehicles [2]. Despite the global domination of internal combustion engines (ICEs) in transportation, they are considered one of the main sources of greenhouse gas and air pollutant emissions [3]. To comply with the increasingly stringent European regulations on air quality and CO2 emissions [4,5], innovative solutions are required to improve the efficiency of ICEs and enable cleanliness and reduction of harmful emissions produced [6]. One of the most promising alternatives for low emissions solutions is the use of hydrogen as fuel [7]. Hydrogen exhibits several advantages when compared to liquid gasoline and diesel: it has a high calorific value and a fast flame speed and does not generate carbon emissions during combustion [8]. Recent studies have analyzed the advantages of using hydrogen in spark-ignition internal combustion engines (ICEs) not only as the sole fuel but also as a complementary fuel to traditional ones, like compressed natural gas. This is achieved by blending fuels in different proportions with the aim of improving the combustion properties and reducing emissions [9,10]. One notable application of hydrogen that has gained considerable traction is its use as a fuel in compression ignition engines [11]. In these engines, the reduction in NOx emissions is often the primary objective due to the excess air with which they operate and the formation of soot. Consequently, through the use of a dual-fuel injection system comprising diesel and hydrogen, it is possible to mitigate the emissions of soot to a significant extent due to the zero carbon content of hydrogen and its flammability range. Nevertheless, NOx emissions, which are favored by the increase in temperature in the combustion chamber, still necessitate more rigorous control measures to reduce them. Hydrogen can be introduced into ICEs by two main methods: port injection or direct injection. Port injection consists of introducing hydrogen into the intake manifold, which is mixed with air before entering the cylinder [12]. Direct injection consists of introducing hydrogen directly into the cylinder during the compression stroke by means of a specific injector [13]. Direct injection has advantages over port injection, such as higher thermal efficiency, volumetric efficiency, and compression ratio [14,15,16,17,18], as well as eliminating the possibility of backfire and knocking [19].
For the design and optimization of hydrogen direct injection systems, it is essential to study the behavior of the hydrogen jet in the cylinder as well as the influence of the operating parameters and boundary conditions [20]. For this purpose, suitable visualization techniques are required to obtain information on the shape, penetration, angle, density, and velocity of the jet. One of the most widely used optical techniques for the visualization of nonreactive jets is the Schlieren technique, which is based on the refraction of light by the density gradients of the fluid. This technique allows the observation of the changes in the pressure, temperature, and shock waves in a transparent medium such as an air or a nitrogen atmosphere [21].
However, the visualization of the hydrogen jet is not enough to characterize the injection process: it is also necessary to measure the injection mass flow rate, that is, the mass amount of hydrogen injected per unit of time. The measurement of the hydrogen injection rate presents difficulties due to the low density and high compressibility of this gas, which makes the use of conventional methods, such as those based on the Coriolis principle difficult [22,23]. Therefore, other alternative methods have been developed, such as those based on the measurement of the dynamic pressure increase in a fuel-filled measuring channel into which the nozzle injects directly.
The objective of this study was to characterize a direct hydrogen injector and examine the gaseous spray that forms in the cylinder. For this purpose, the Schlieren technique was used to visualize the hydrogen jet under different pressures, temperatures, and flow velocities. In addition, a method based on the measurement of the pressure in a combustion chamber was used to determine the hydrogen injection rate. The results obtained allow the analysis of the influence of the operating parameters and environmental conditions on the formation of the air–hydrogen mixture and of the performance of the injector.

2. Tools and Methodology

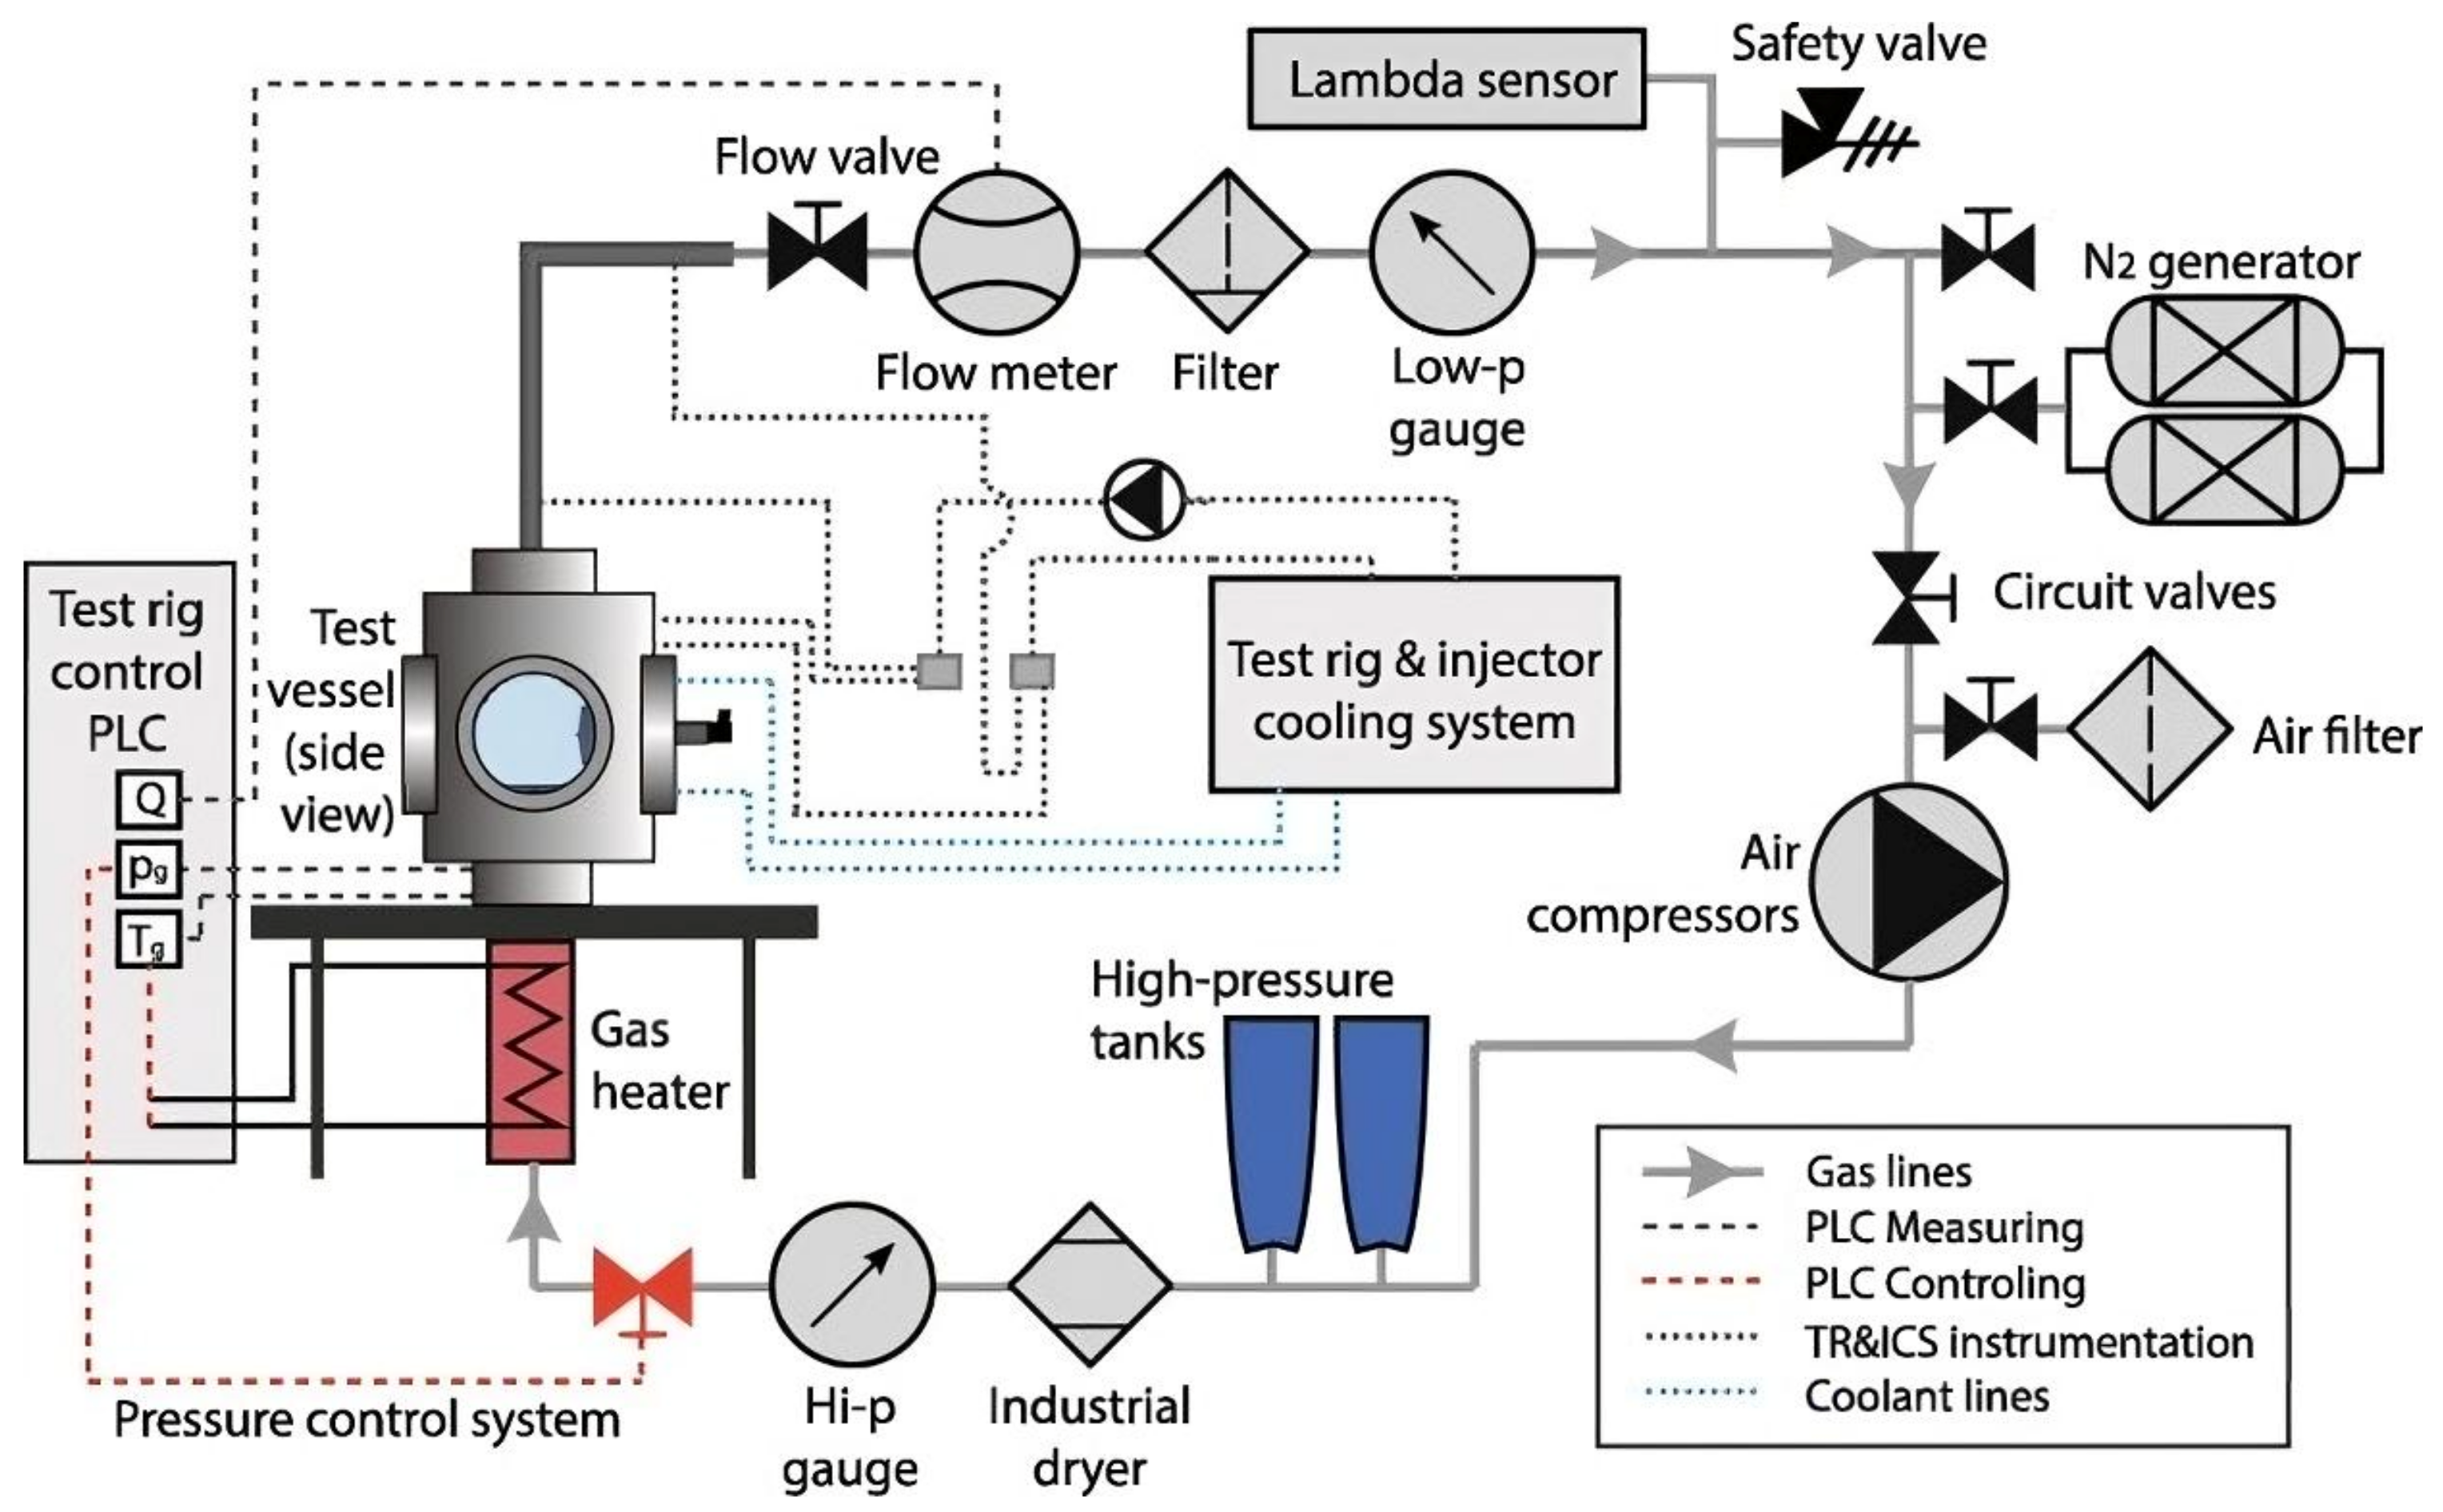
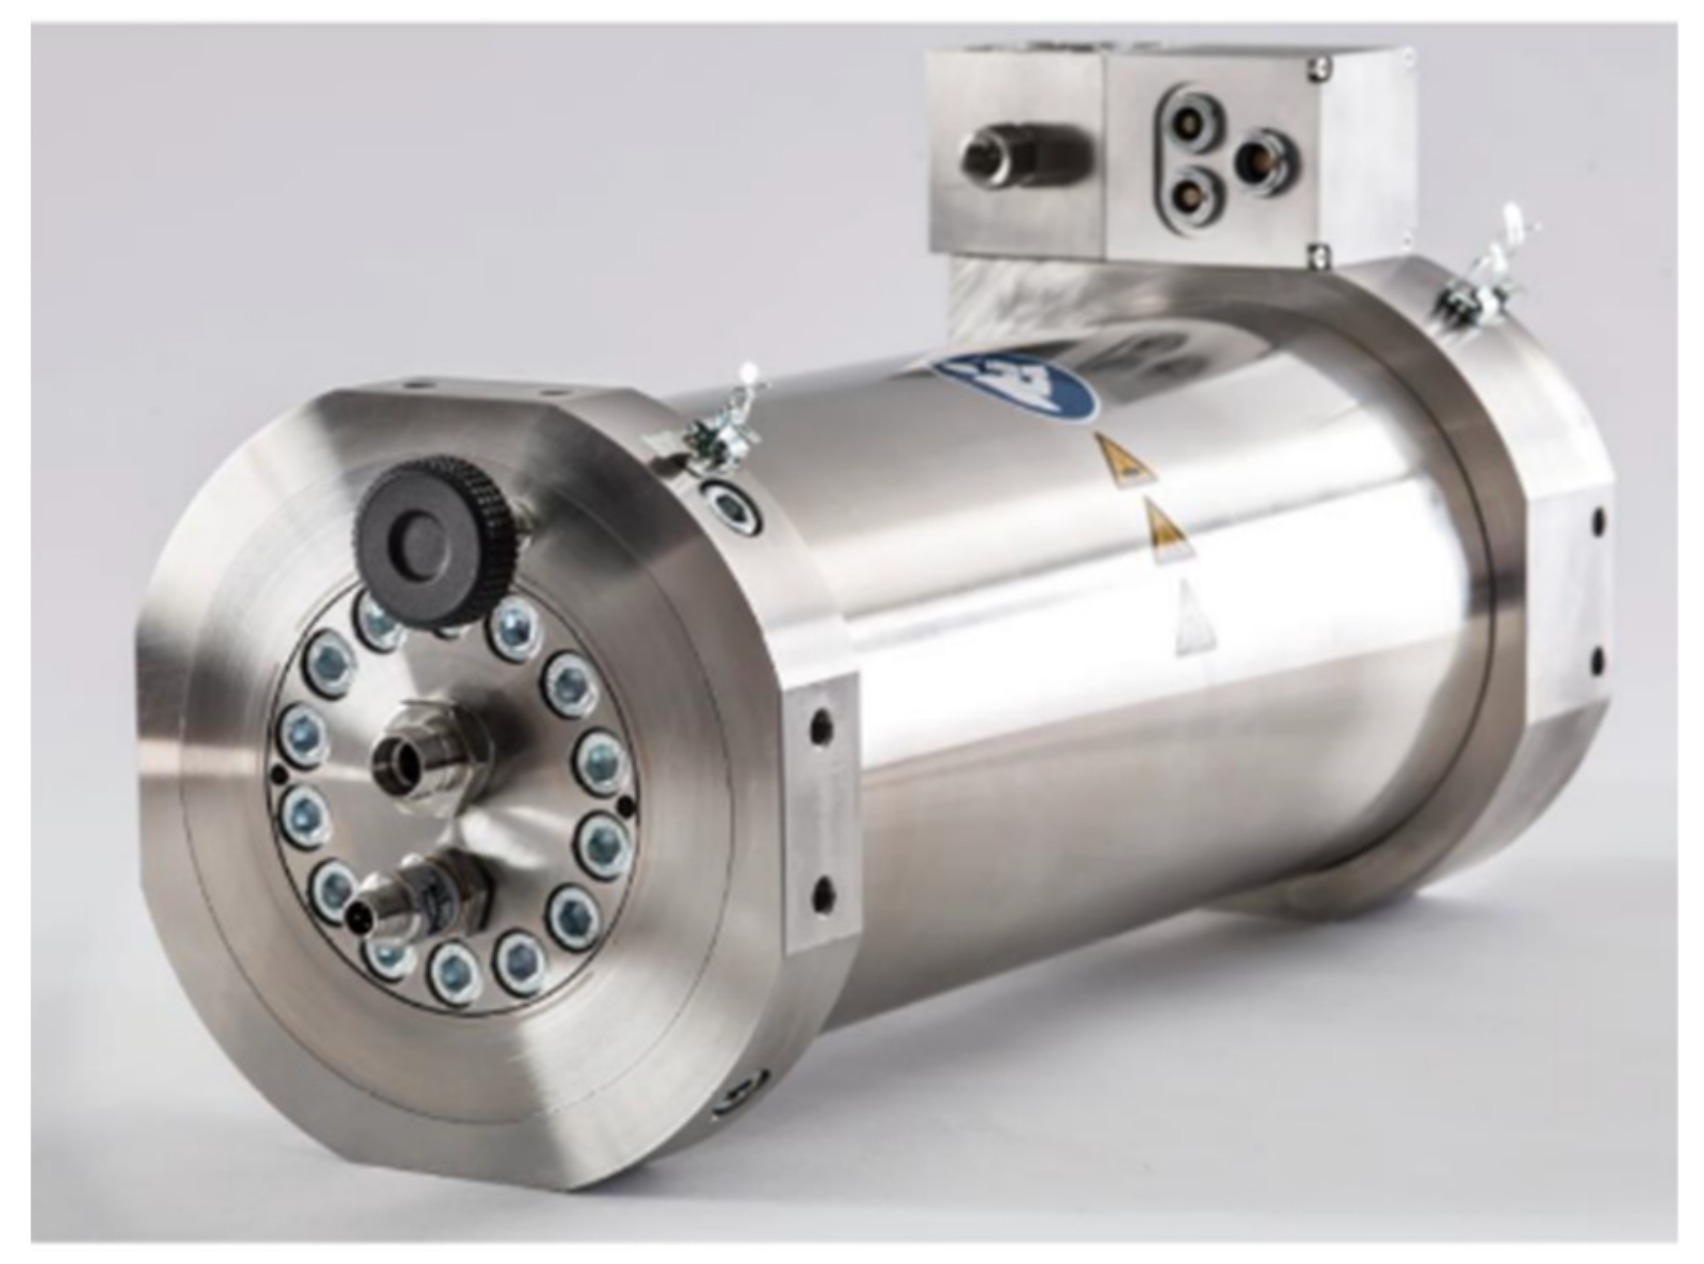
2.1. Experimental Facilities

This study was carried out using a constant-pressure, continuous-flow, and accessible optical test apparatus enabling the visualization of sprays under conditions similar to those in an ICE chamber. This high-pressure, high-temperature (HPHT) vessel had three optical ports, each with a diameter of 128 mm, positioned orthogonally. The injector was fixed horizontally on the side without any window, with a continuous flow of ethylene glycol in direct contact with the injector body to maintain steady control of the injected fuel temperature. This control was achieved by the cooling system described in detail in [24]. Designed with a two-layer configuration, the vessel minimized thermal losses and enhanced temperature homogeneity within the inner wall. The main purpose of the second layer was to serve a structural role, and then an insulation material filled the gap between the layers.
Operating with a controlled mixture of dry air and nitrogen (N2), the facility enabled in-chamber oxygen concentrations ranging from 0% (for high-temperature nonreactive research, such as this part of the investigation) to 20.9%. Continuous monitoring of the gas chemical composition within the chamber was conducted using a lambda sensor [25]. As illustrated in Figure 1, the pressurized gas was first stored in tanks after coming from a compressor and then introduced into the test vessel via a 30 kW electric heater system. As the gas exited the vessel, it was cooled and filtered before being returned to the compressor or vented to the atmosphere. Employing a closed loop control algorithm, the control system regulated the in-chamber pressure as well as the output of the heating system. This facility, a part of which operated under conditions up to 1000 K and 150 bar, was also capable of providing nearly quiescent and steady thermodynamic conditions. This feature enabled continuous and recurrent observations across a broad spectrum of conditions.
A direct hydrogen BorgWarner injector (Auburn Hills, MI, USA) was used for this study, specifically, the DI-CHG6.2 model. This injector was conceived to work with the low pressure of an engine cycle with a maximum upstream pressure of 35 barG and a minimum upstream pressure of 20 barG. The maximum hydrogen flow rate that this injector allowed was 5.8 g/s; in terms of thermodynamics, this injector could work with a nozzle tip temperature of up to 250 °C.
The injection setup consisted of a 7 µm pore size particle filter (Swagelok brand, based in Cleverland, OH, USA) assembled before the injector; downstream of this, a pressure regulator valve was installed; finally, the hydrogen tank, which was pressurized to 200 bars, was placed to feed the injection system. The injector was maintained at 90 °C using a custom-made stainless-steel injector holder through which a flow of ethylene glycol was passed to maintain constant and controlled temperature in direct contact with the injector throughout the test period in order to comply with the Engine Combustion Network (ECN) standards [26]. The injector was inserted into the test rig by this holder and connected to the pressure line described above.
A first attempt to measure the rate of injection (ROI) of hydrogen injection systems was conducted in this research. The flow rate meter chosen for this research calculated the injection rate via the dynamic pressure increase in a fuel-filled measuring channel into which the nozzle injected directly based on the Bosch long-tube method. A high-speed transducer captured the rate of pressure increase within the test cell, which was then translated to the ROI. A multifuel device was used for this experimental campaign, specifically the IAV Cross Type H-140-155 from SONPLAS company, Straubing, Germany, shown in Figure 2. This device could measure both liquid and gaseous fuels. In this research, the device was calibrated for gaseous hydrogen injection using the calibration curves provided by the manufacturer.

2.2. Test Matrix

The test matrix conditions were determined by the working limits of the BorgWarner injector and the minimum backpressure allowed by the high-pressure and -temperature vessel facility. A wide range of different conditions could be applied, including a variety of chamber temperatures and densities, as well as injection pressures. All experimental conditions are shown in Table 1. To ensure an acceptable statistical accuracy of the reported averaged result, each data point underwent 10 cycles of repetition. Finally, an e-fuel, which consisted of industrial hydrogen with a purity of 99.9%, was used to perform this experimental campaign, and its properties are shown in Table 2. The physical properties of the hydrogen were taken from [17].

2.3. Methodology

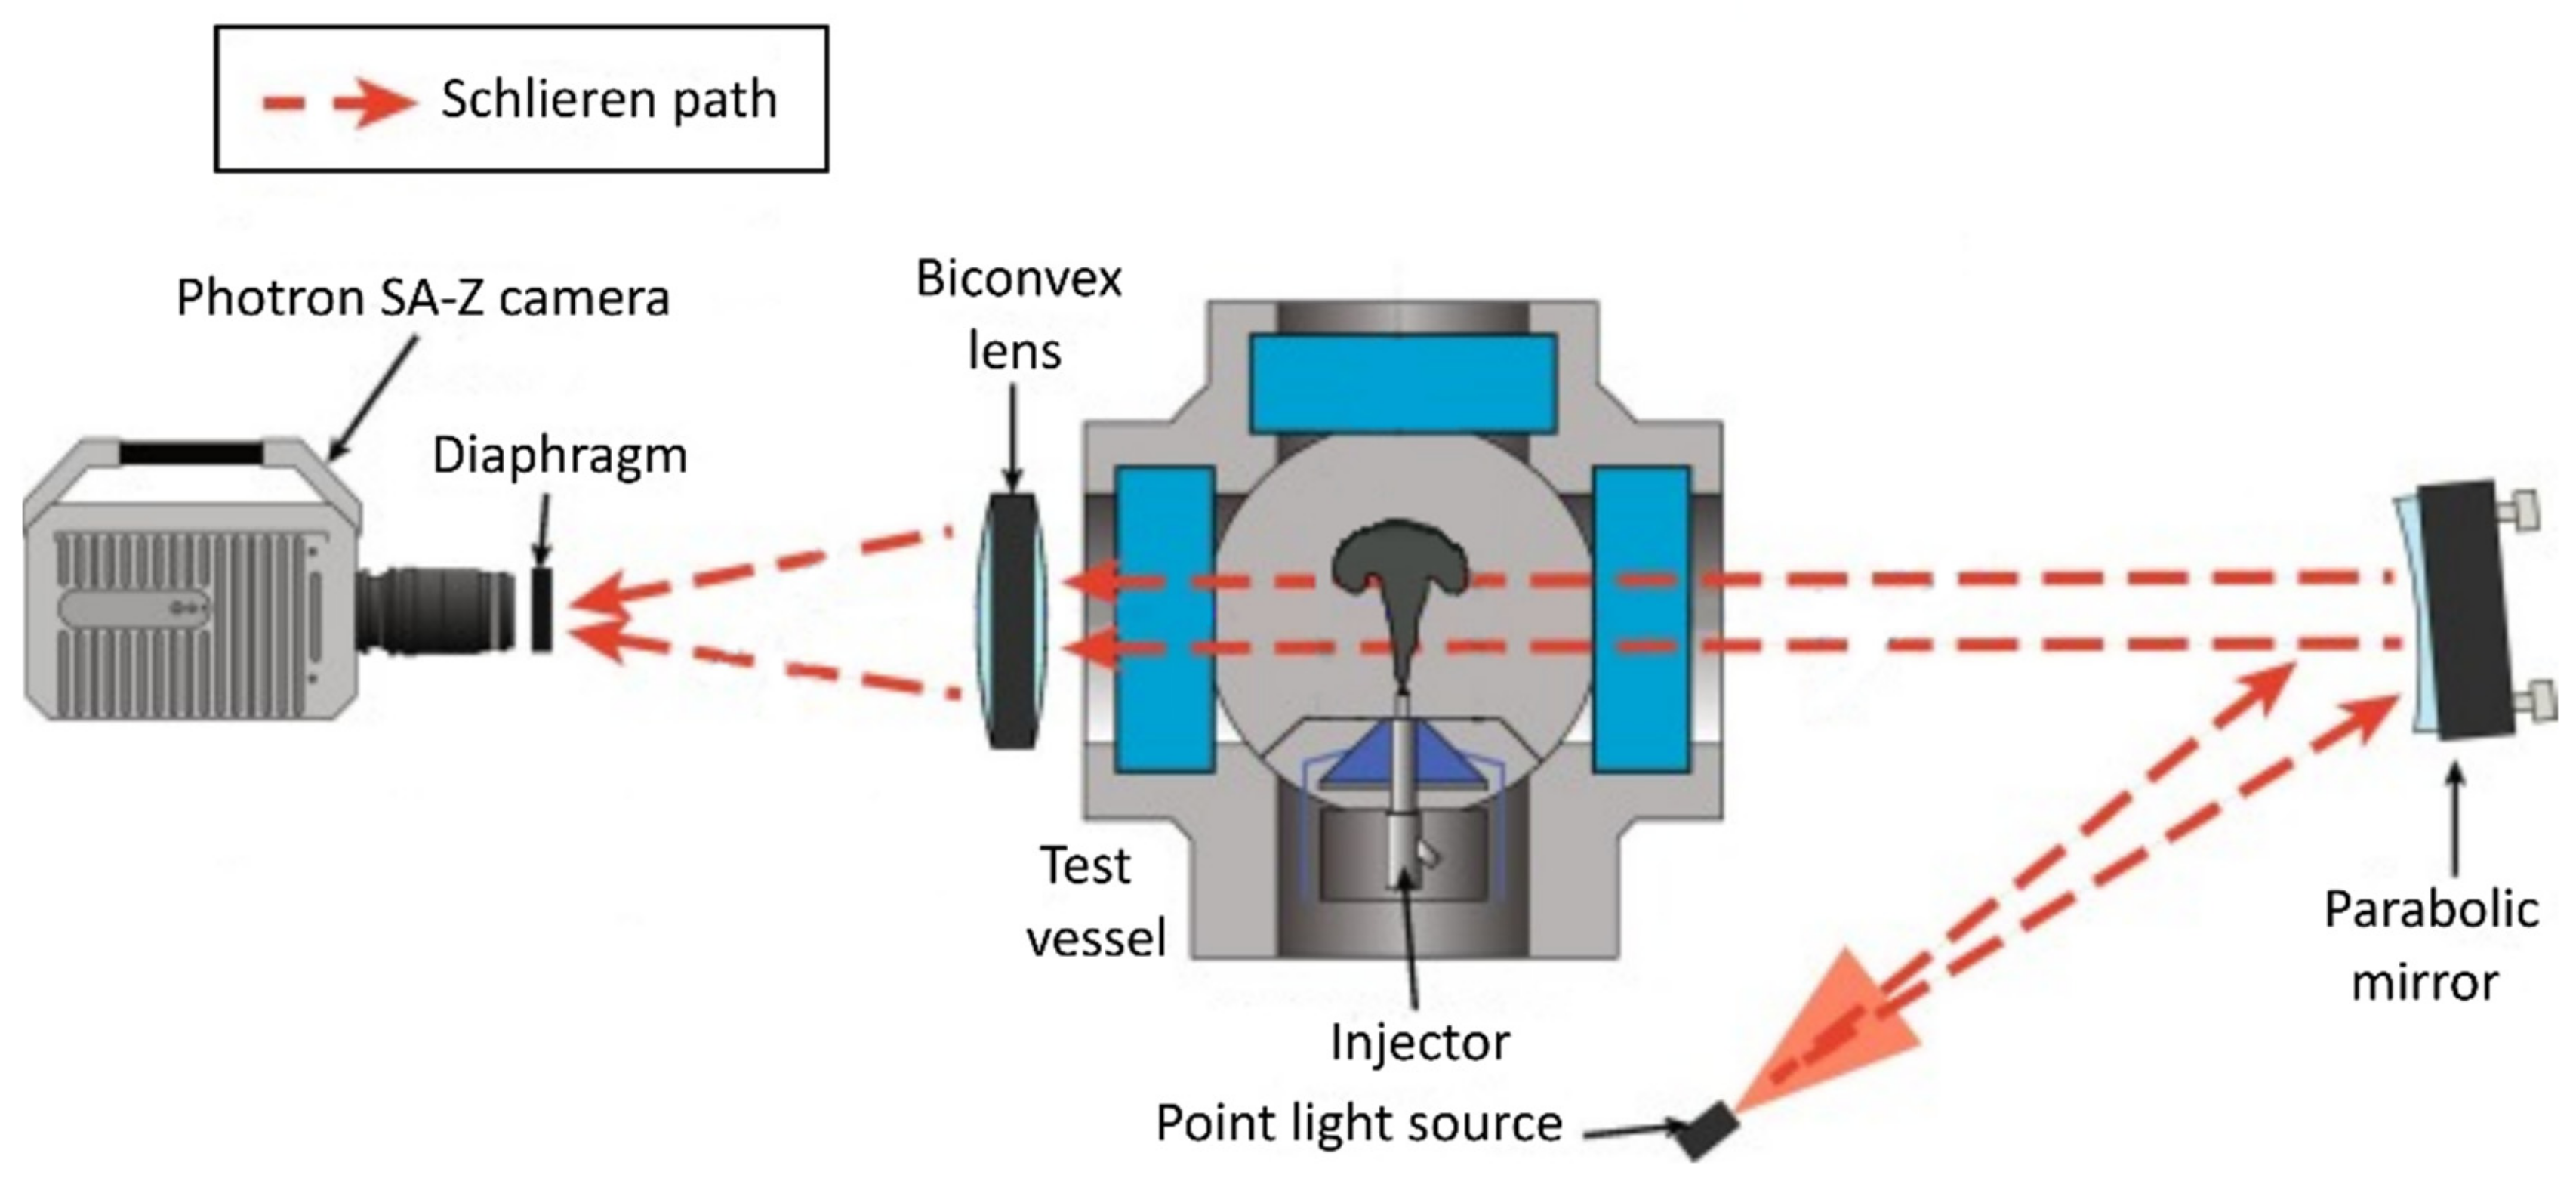
2.3.1. Single-Pass Schlieren Imaging

The Schlieren imaging technique was employed to capture the vapor phase of the spray. This method, which is sensitive to the rate of change in density in the spatial dimension, proves valuable in visualizing gaseous phenomena. The approach relies on directing parallel beams through a designated zone to observe their deflection. In our case, the method was used to discern the borders between the atomized fuel vapor and the surrounding gases inside the chamber. This distinction was facilitated by the diverse refraction indices linked to density variations [27].
In Figure 3, red dashed arrows delineate the path of the Schlieren light through the chamber and the optical materials utilized in this context. A continuous Xe-Arc lamp is linked to an optical fiber, culminating in a pinpoint light source at the bottom of the schematic. These beams passed through a parabolic mirror, which function to collimate and redirect the light toward the chamber. Inside the vessel, density gradients cause the parallel beams to deviate differently. Subsequently, a biconvex lens collects the rays, converging them toward a high-speed camera. A diaphragm in front of the camera lens prevents the entry of deviated rays. More detailed information about the optical setup can be found in Table 3.

2.3.2. Image Processing

An internally developed algorithm, widely utilized [25], was applied to process the spray images. Irrespective of the optical technique used, the overall processing methodology remains consistent. Prior to the commencement of the primary processing, an adjustment process is initiated to specify the image type, allowing the adaptation of the strategy to the unique characteristics of each image set.
The background of the image is preprocessed for subtraction, aiming to standardize its luminosity to a zero-reference level. For Schlieren imaging, the calculation of a novel background (which is dynamic in nature) is essential for each image. The computation of this Schlieren background involves a combination of two approaches: utilizing a threshold grounded on the pixel intensity levels within the image and discerning pixel fluctuations by scrutinizing the pixel-wise standard deviation across three consecutive images. Subsequently, the obtained images undergo filtering via morphological operations to mitigate background irregularities. Ultimately, filtered images resulting from the processing methodology are combined through a weighted average to generate a definitive average image of the spray. Figure 4 compiles various samples of images acquired for the vapor phase of the sprays employing the above-described visualization method and the spray boundaries identified through the previously described processing methodology.

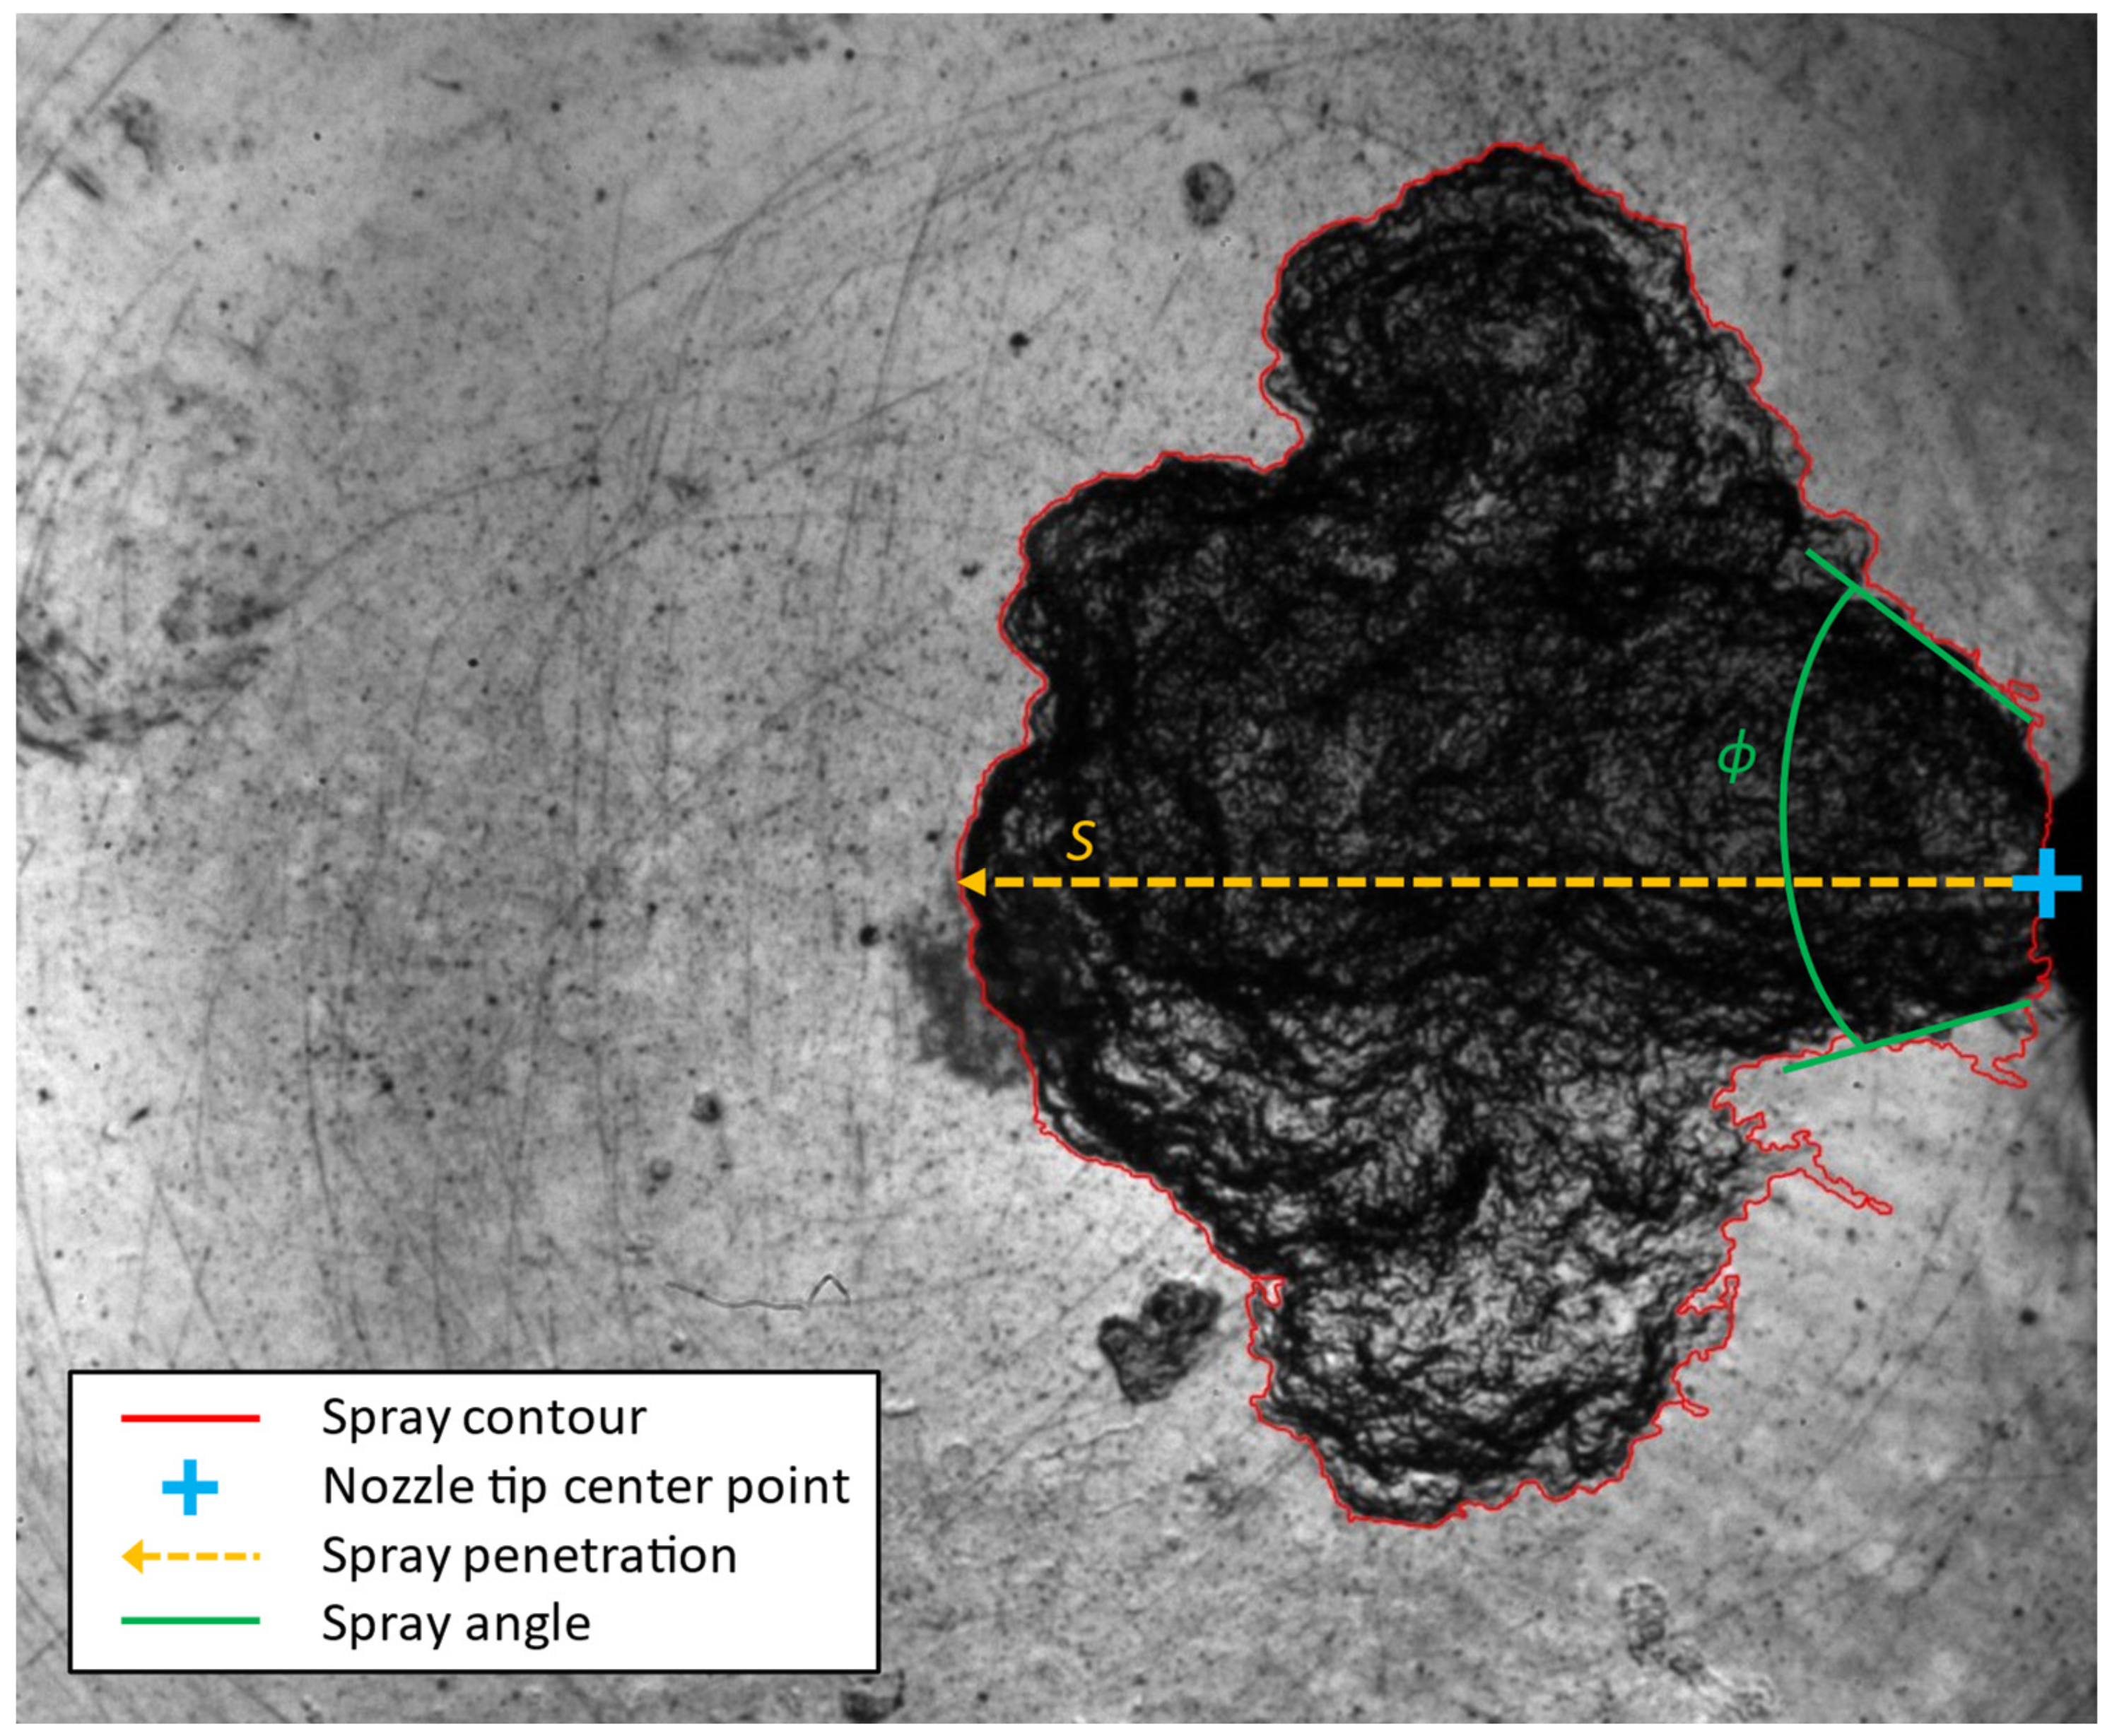
2.3.3. Contour Analysis

As mentioned in the previous approach, the contour was obtained using the images obtained with the Schlieren imaging technique during the experimental campaign, as can be seen in Figure 4. From the contour detection, the following metrics were calculated:
Spray penetration (S): This is the distance between the nozzle tip and the furthest point of the spray contour.
Spray volume (V): The spray volume is calculated from the contour acquisition, assuming a conical spray method, which is based on the simplification of the spray with a truncated cone model formed by the spray angle, the spray outlet diameter of the injector, and the maximum diameter of the cone determined by the zone of the greatest expansion of the spray jet.
Spray angle (ϕ): The spray angle is calculated using two linear fits of the spray boundary, as can be seen in Figure 5. The fits are defined by using a data range of the measured free-jet penetration, in this case, between 10% and 50% of the jet penetration. The definition of this parameter is based on previous work by Naber and Siebers [28], in which the spray angle is defined by the equation shown below:
θ 2 = tan 1 A p S / 2 S 2 2
where A p S / 2 is the area covered by the spray at an axial distance up to x = S / 2 , and S is the spray penetration.

2.3.4. Injection Rate Analysis

A high-speed acquisition system was employed to capture the rate of injection (ROI) signal. For each test condition, 50 cycles (or shots) were recorded. Subsequently, the raw data were averaged and adjusted to accommodate the cumulative signal phenomenon, as outlined in reference [29]. The resulting curve was integrated over the injection event to determine the total mass per injection, as described by Cavicchi et al. [23]. Figure 6 shows an example of the averaged data previously recorded with the flow rate meter, where the stabilized rate of injection was calculated as an average value in a defined range of time, usually close to the end of injector energization, as can be seen in [30], which is represented as a dashed red line.

3. Results and Discussion

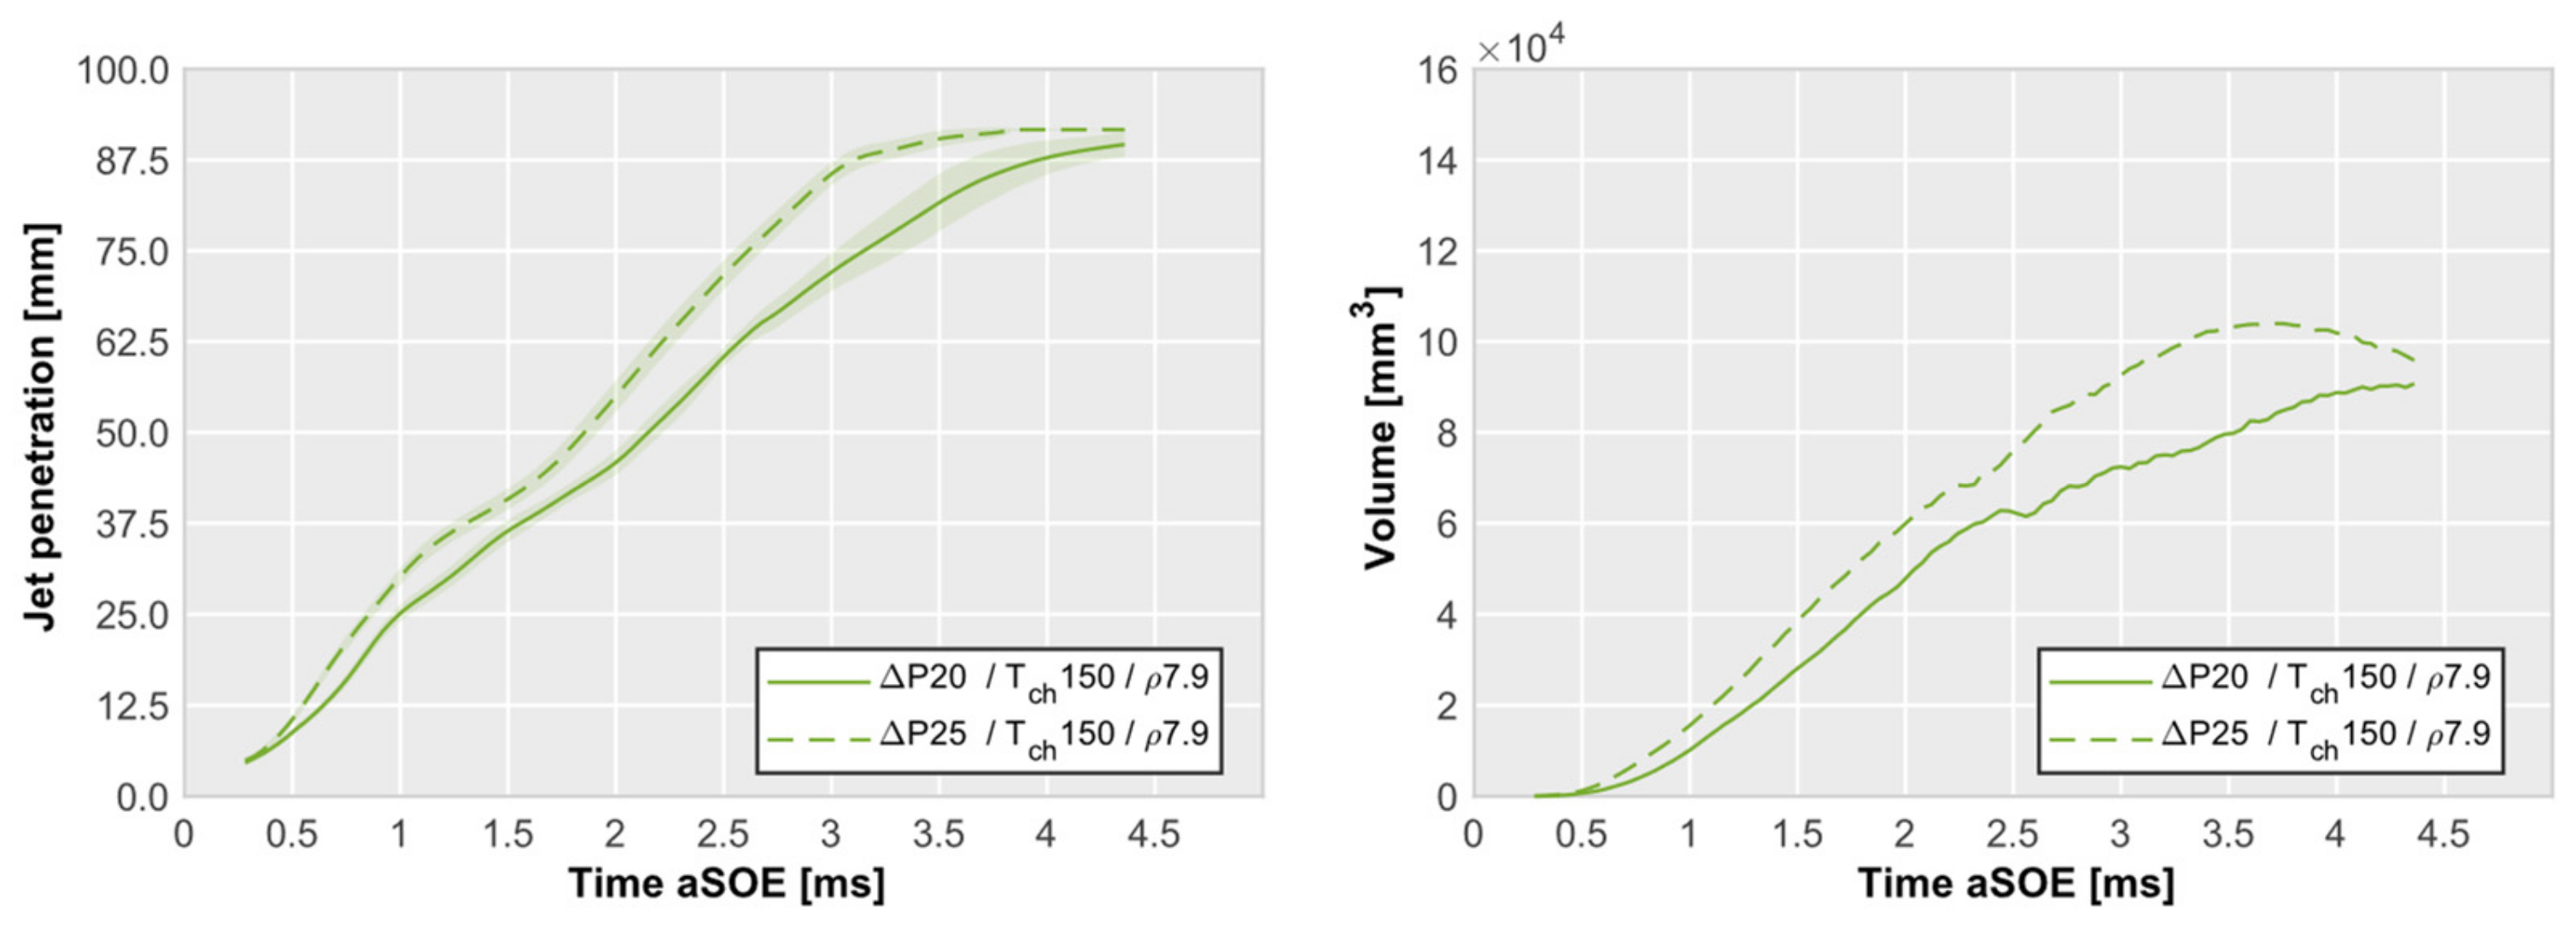
3.1. Effects of Injection Pressure

In the following figures (Figure 7, Figure 8, Figure 9 and Figure 10), the hydrogen penetration and calculated volume for different injection pressures are shown. The abscissa axis represents the time magnitude, whose beginning is just after starting to energize the injector (aSOE); this magnitude is represented in milliseconds and applies to the rest of the figures in this subsection. The ordinate axis shows the recorded jet penetration in millimeters (left side of the figure) and the calculated volume in cubic millimeters (right side of the figure). In addition, the standard deviation is represented in the shaded area. For the comparison of the pressure difference between the injection and chamber pressures, the injection energizing time (Tinj) was fixed at 2500 µs. These values are shown in Figure 7 for a chamber temperature of 15 °C.
If jet penetration is observed, a clear difference can be appreciated, although it is not excessive; with a greater pressure difference (dashed line), a higher jet penetration was obtained, as described by Yeganeh [21]. Therefore, more area of the image was covered, so a major calculated volume was obtained. Even if we had a higher jet volume, it did not necessarily mean that we had a higher amount of mass injected because of the fuel properties, so this was checked later in the analysis of the ROI. The influence of a marginal temperature elevation within the chamber is observable in Figure 8.
Despite this slight temperature increase, the jet penetration pattern remained unaltered across various injection pressures. Notably, there was an early saturation of the maximum jet penetration, as clearly depicted in Figure 9.
Furthermore, an analysis of Figure 9 and Figure 10 reveals that higher values of ∆P result in an augmented jet volume. It is noteworthy that with increasing ∆P, the saturation of the maximum calculated volume occurs earlier compared to instances with lower ∆P values. These findings underscore the intricate relationship between temperature, injection pressure, and jet characteristics within the experimental chamber. In accordance with the observations made, a recent study by Yeganeh et al. [31] reached similar conclusions regarding the relationship between pressure ratios, spray penetration, and cross-sectional area. However, it is important to note that the relationships between the injection and chamber pressures studied are different due to the characteristics of the injector used in this study.

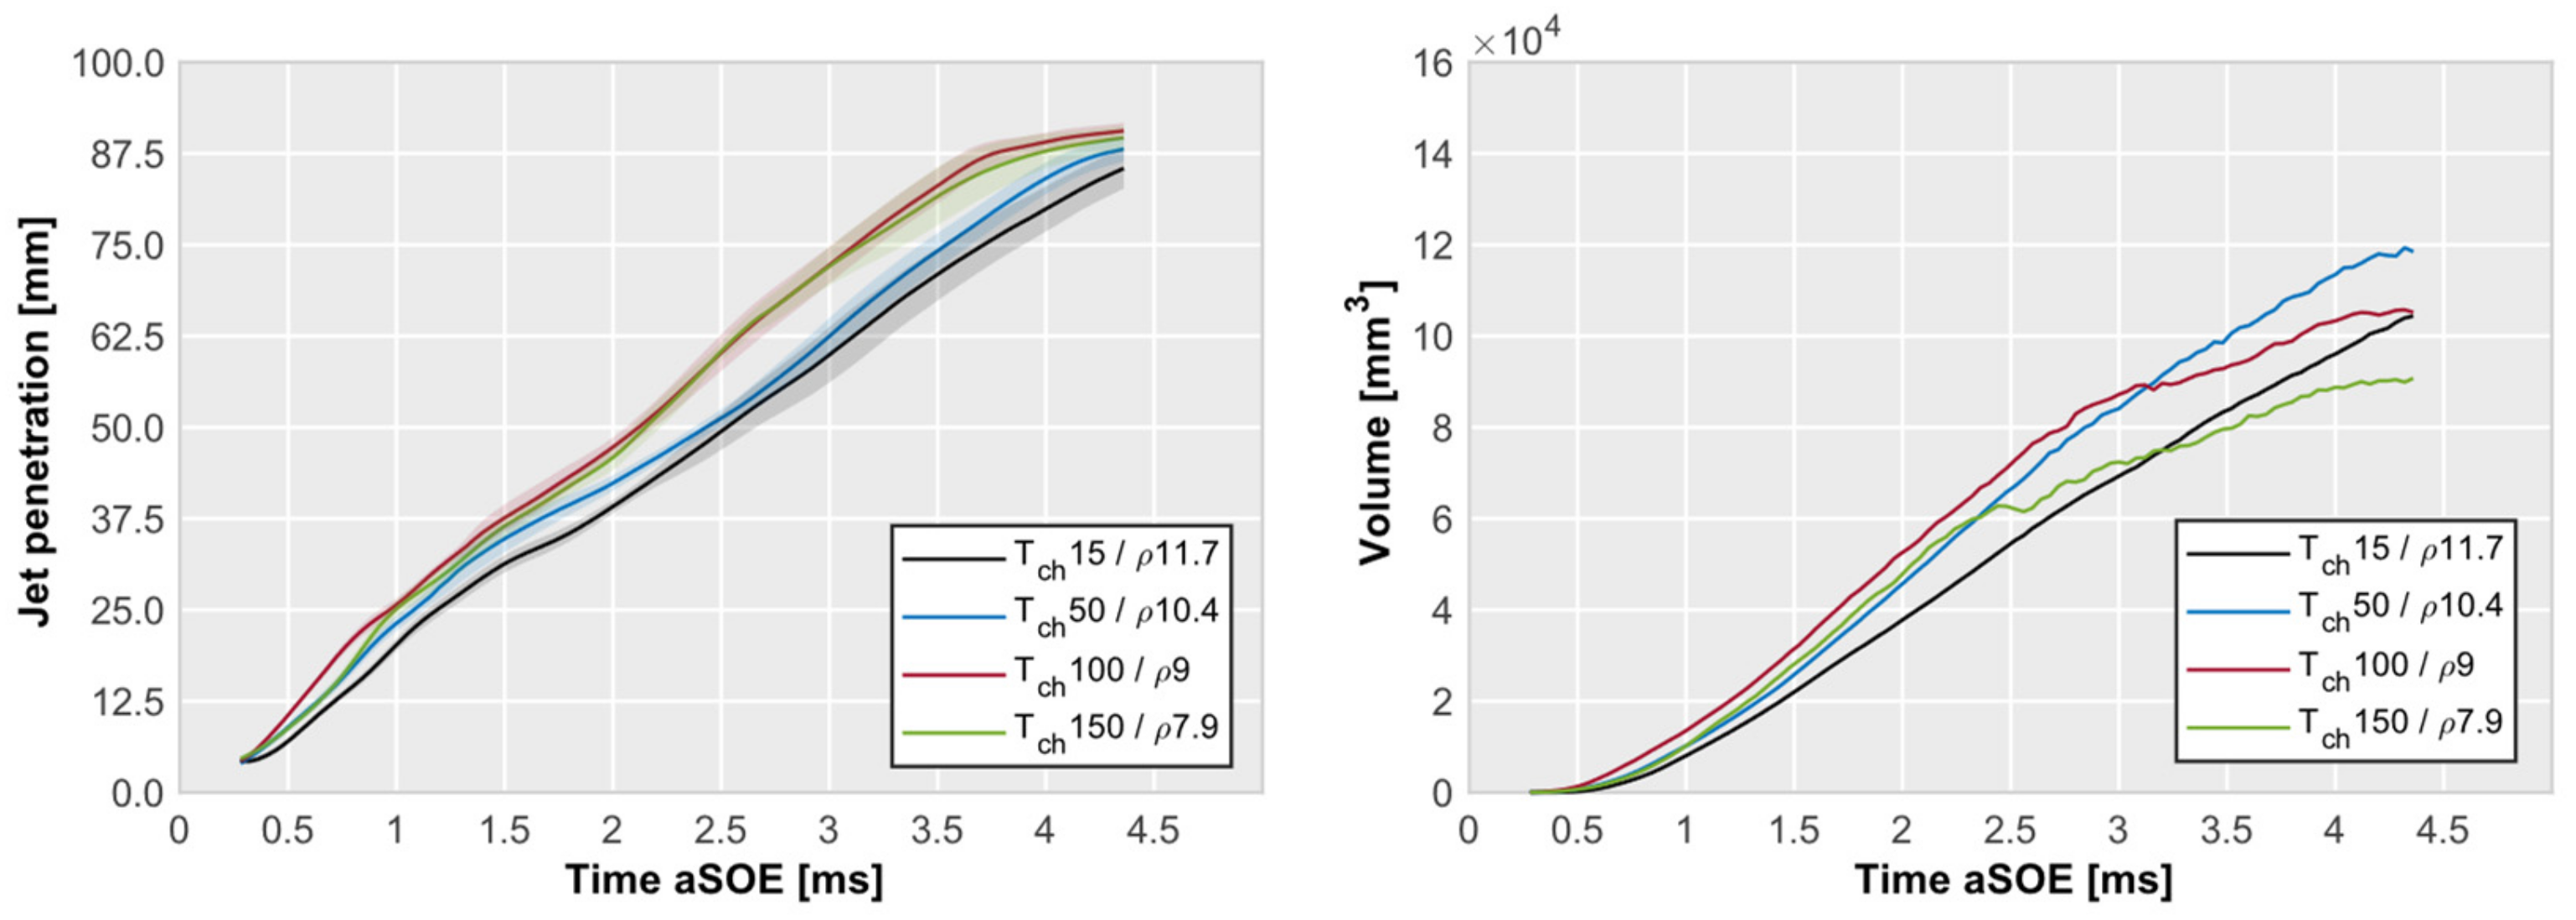
3.2. Effects of Chamber Temperature

Although the previous analysis focused on the effect of the injection pressure on the jet morphology, it could be deduced that these parameters did not only condition this morphology, suggesting that there were other parameters that influenced the final result. One of these important parameters analyzed in this study was the chamber temperature. As described in the previous figures, the x axis represents the time elapsed since the injector was energized (aSOE), measured in milliseconds. This unit applies to all figures in this subsection. The y axis displays the recorded jet penetration in millimeters (left side of the figure) and the calculated volume in cubic millimeters (right side of the figure). In our first approach, Figure 11 shows that the temperature increase in the chamber had a slight effect on the jet penetration, resulting in a higher penetration of about 10 mm during the injection phase.
However, this reasoning may not be entirely accurate as, according to the research of M. Lazzaro [32], the penetration of the vapor phase shows a correlation with the density of the medium rather than its temperature. As can be observed in the previously mentioned Figure 11, this trend aligns with the results of this study, leading to greater penetration at lower medium densities, as there is less opposition to fluid displacement. Regarding the calculated volume (shown on the right side in Figure 11), it is evident that as the chamber temperature increased, so did the volume and penetration, as seen in the cases of 15 and 50 °C. However, when the penetration was similar and the temperature was higher, as in the cases of 100 and 150 °C, the trend reversed, and the volume decreased. This phenomenon may be explained by the fact that the density gradient observed with the Schlieren optical technique decreases with an increase in chamber temperature. Furthermore, the lack of observation of this effect at all temperatures may have been due to the preheating temperature of the fuel at 90 °C and the first two operating points being at a temperature below this.

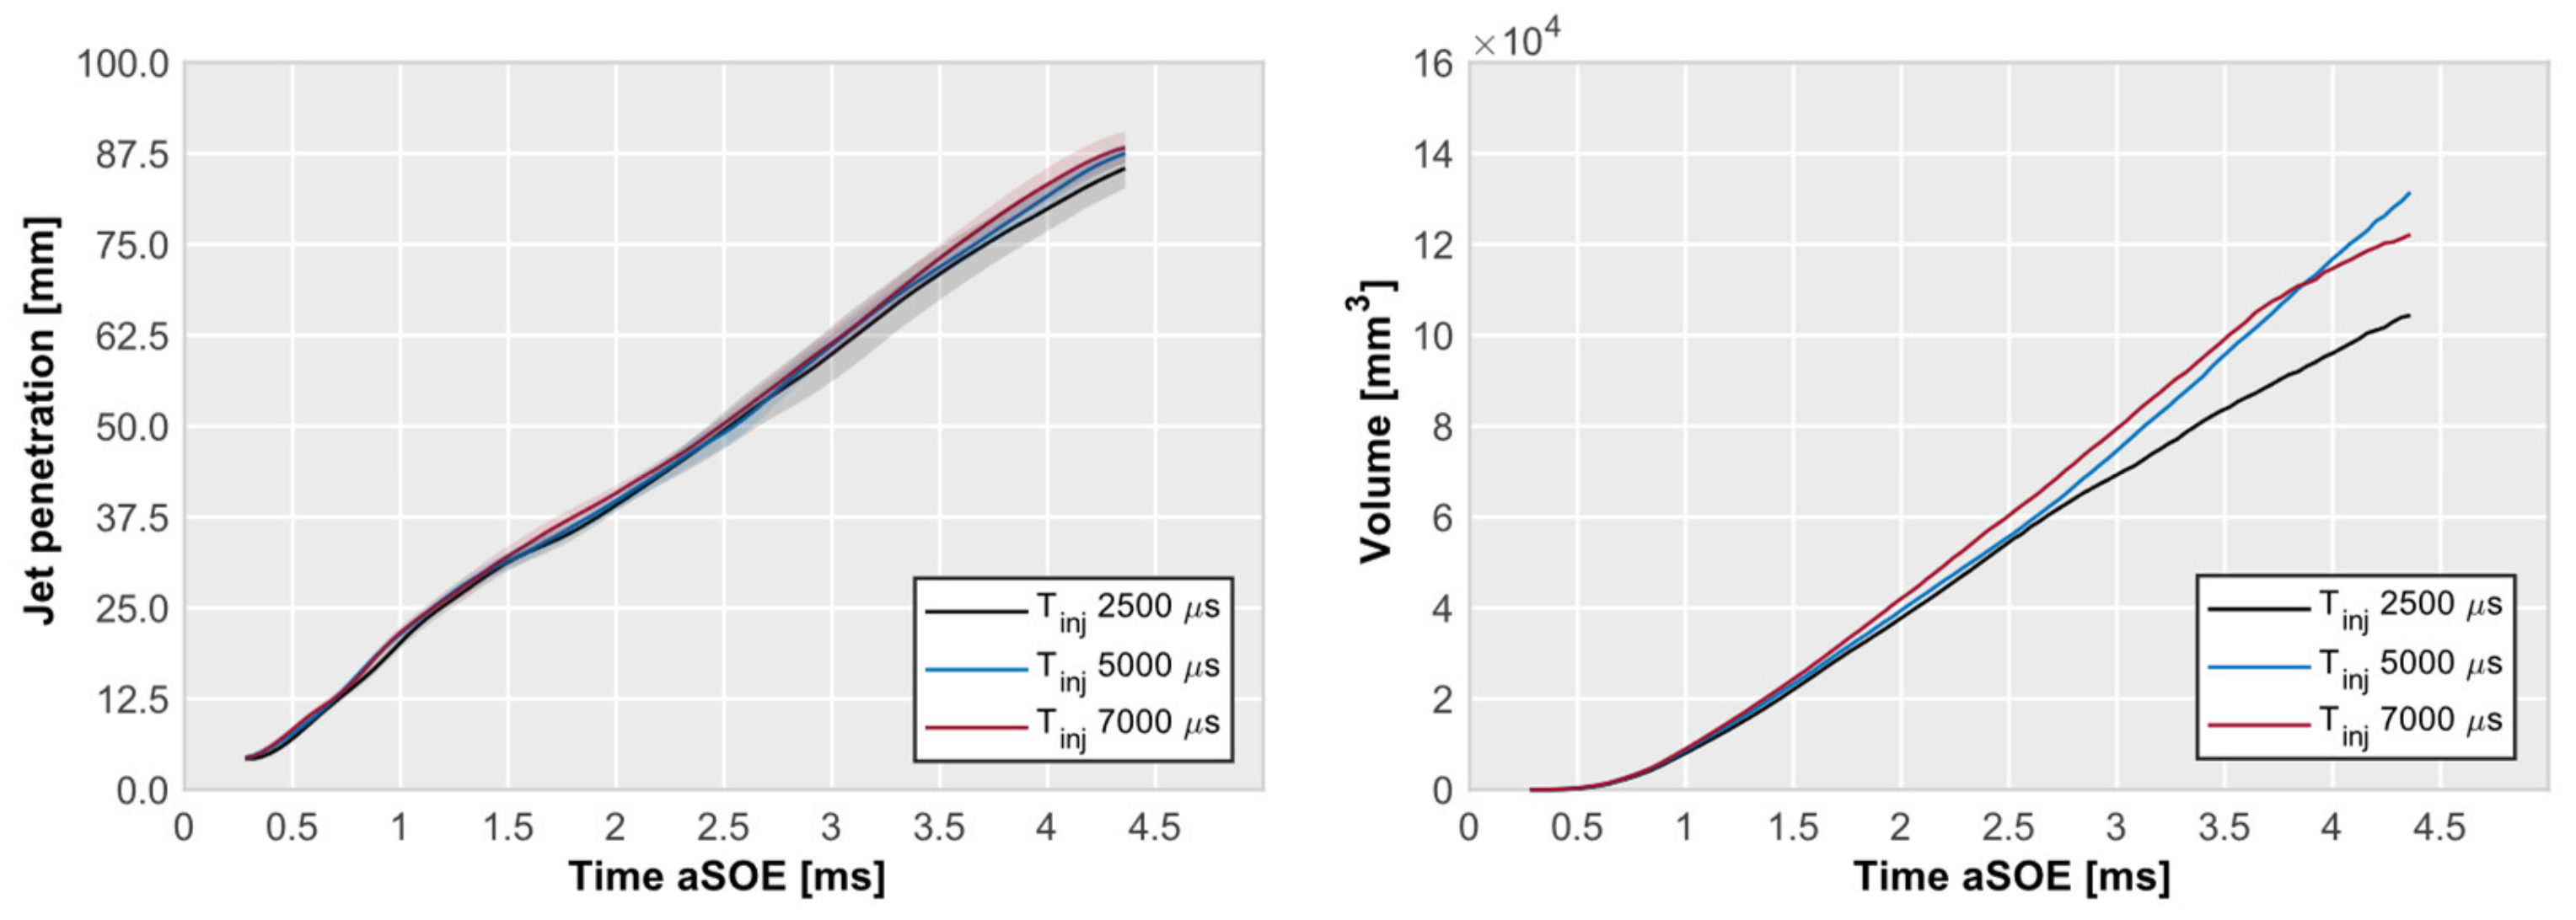
3.3. Effects of Injection Timing

One of the parameters believed to influence the morphology of the jet is the injection energizing time (Tinj). The results are presented in the same manner and order as in the previous sections. As can be observed in Figure 12, the jet penetration was hardly affected by the applied Tinj; a similar phenomenon was observed in a recent study conducted by Yeganeh et al. [31], in which the injection duration using a low-pressure direct-injection hydrogen injector had a negligible effect on the spray properties. When examining the calculated volume, a difference could be inferred between a short injection energizing time, such as 2500 µs, and the rest. Nevertheless, when the injection energizing time exceeded the threshold of 5000 µs, the volume stabilized; this phenomenon could be attributed to the fact that with a short injection, in the final moments of the recorded film, the part of the jet closest to the injector tip had a reduced the gradient due to the high diffusivity of hydrogen, resulting in a smaller detected jet area. However, when injected over a more extended period and when the farthest part of the jet reached its maximum extension, there was still injected gas mass in the vicinity of the injector tip, leading to a larger detected area.

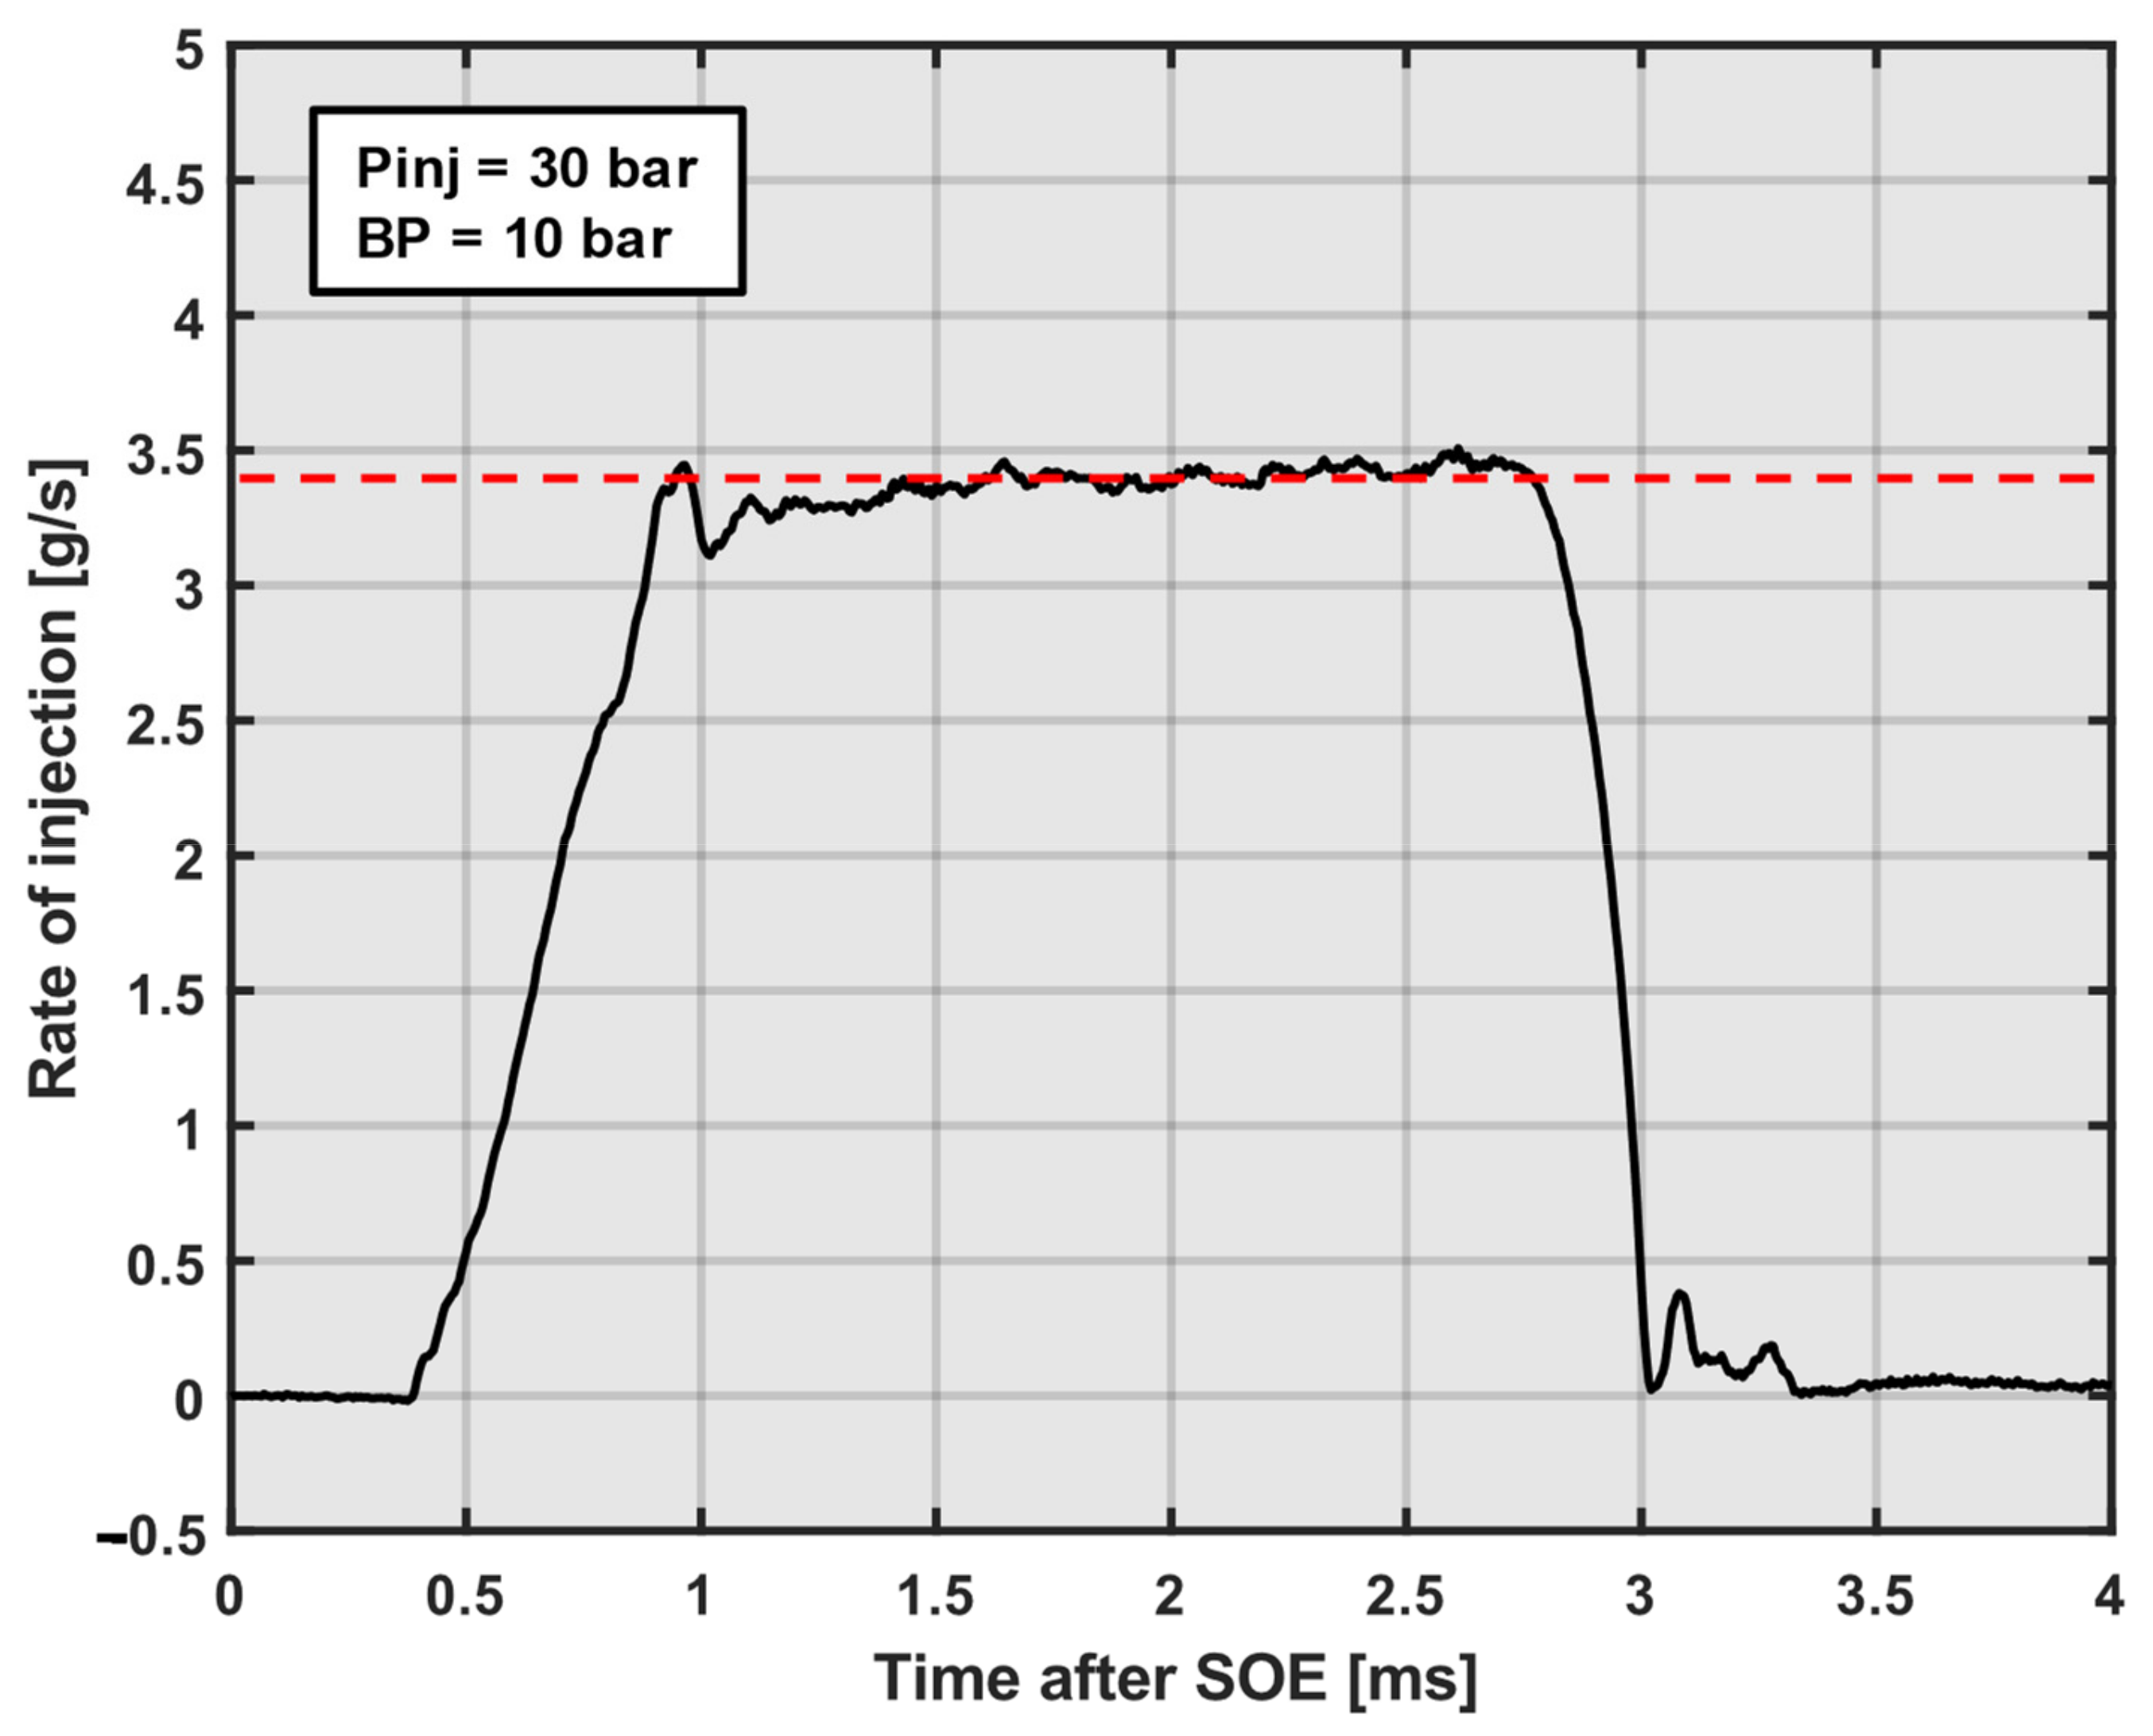
3.4. Mass Flow Rate Measurement

To complete this initial study of direct hydrogen injection, the injection rate was measured to provide a more precise characterization of the injector. Due to the unavailability of a device for adjusting the temperature of the injecting medium, the data were recorded at an approximate ambient temperature of 25 °C. This study measured two different injection pressures (Pinj), 30 and 35 bar, due to the operating limitations of the injector mentioned earlier. Figure 13 shows that when a given injection energizing time and a back pressure of 10 bar were set, the injection rate (ROI) increased with injection pressure, as expected in other studies like that of Payri et al. [29]. As mentioned above, one of the parameters also obtained with the ROI measurement was the amount of hydrogen mass injected into the chamber. With a ∆P of 20 bar, the amount of mass injected was 7.18 mg, with a standard deviation of 0.38 mg. When a higher ∆P was applied, in this case 25 bar given the injector working limitations, the mass injected increased to 8.74 mg, with a standard deviation of 0.11 mg, calculated from 50 cycles. A lower injection pressure resulted in a deviation of 5.29% in the injected mass, in comparison to a deviation of 1.26% under conditions of higher injection pressure. This discrepancy may be attributed to the development of the test with the minimum ∆P required for the operation of the injector and to possible cyclic variations, which may have contributed to the observed increase in the deviation.

4. Conclusions

In this study, the evolution of a H2 jet was investigated by means of an optically accessible constant volume chamber under conditions that simulated the operation of the implemented direct gas injection injector in a SI engine. In addition, an experimental campaign was carried out with the same injector to measure the rate of injection and the mass injected and to study the effects of different injection pressures. A novel injector holder was fabricated, featuring an integrated cooling sleeve intricately linked to a thermoregulatory system responsible for maintaining a circuit infused with ethylene glycol. A wide range of temperatures was analyzed for two different injection pressures and three different injection energizing times. The principal findings are presented below in summary form:
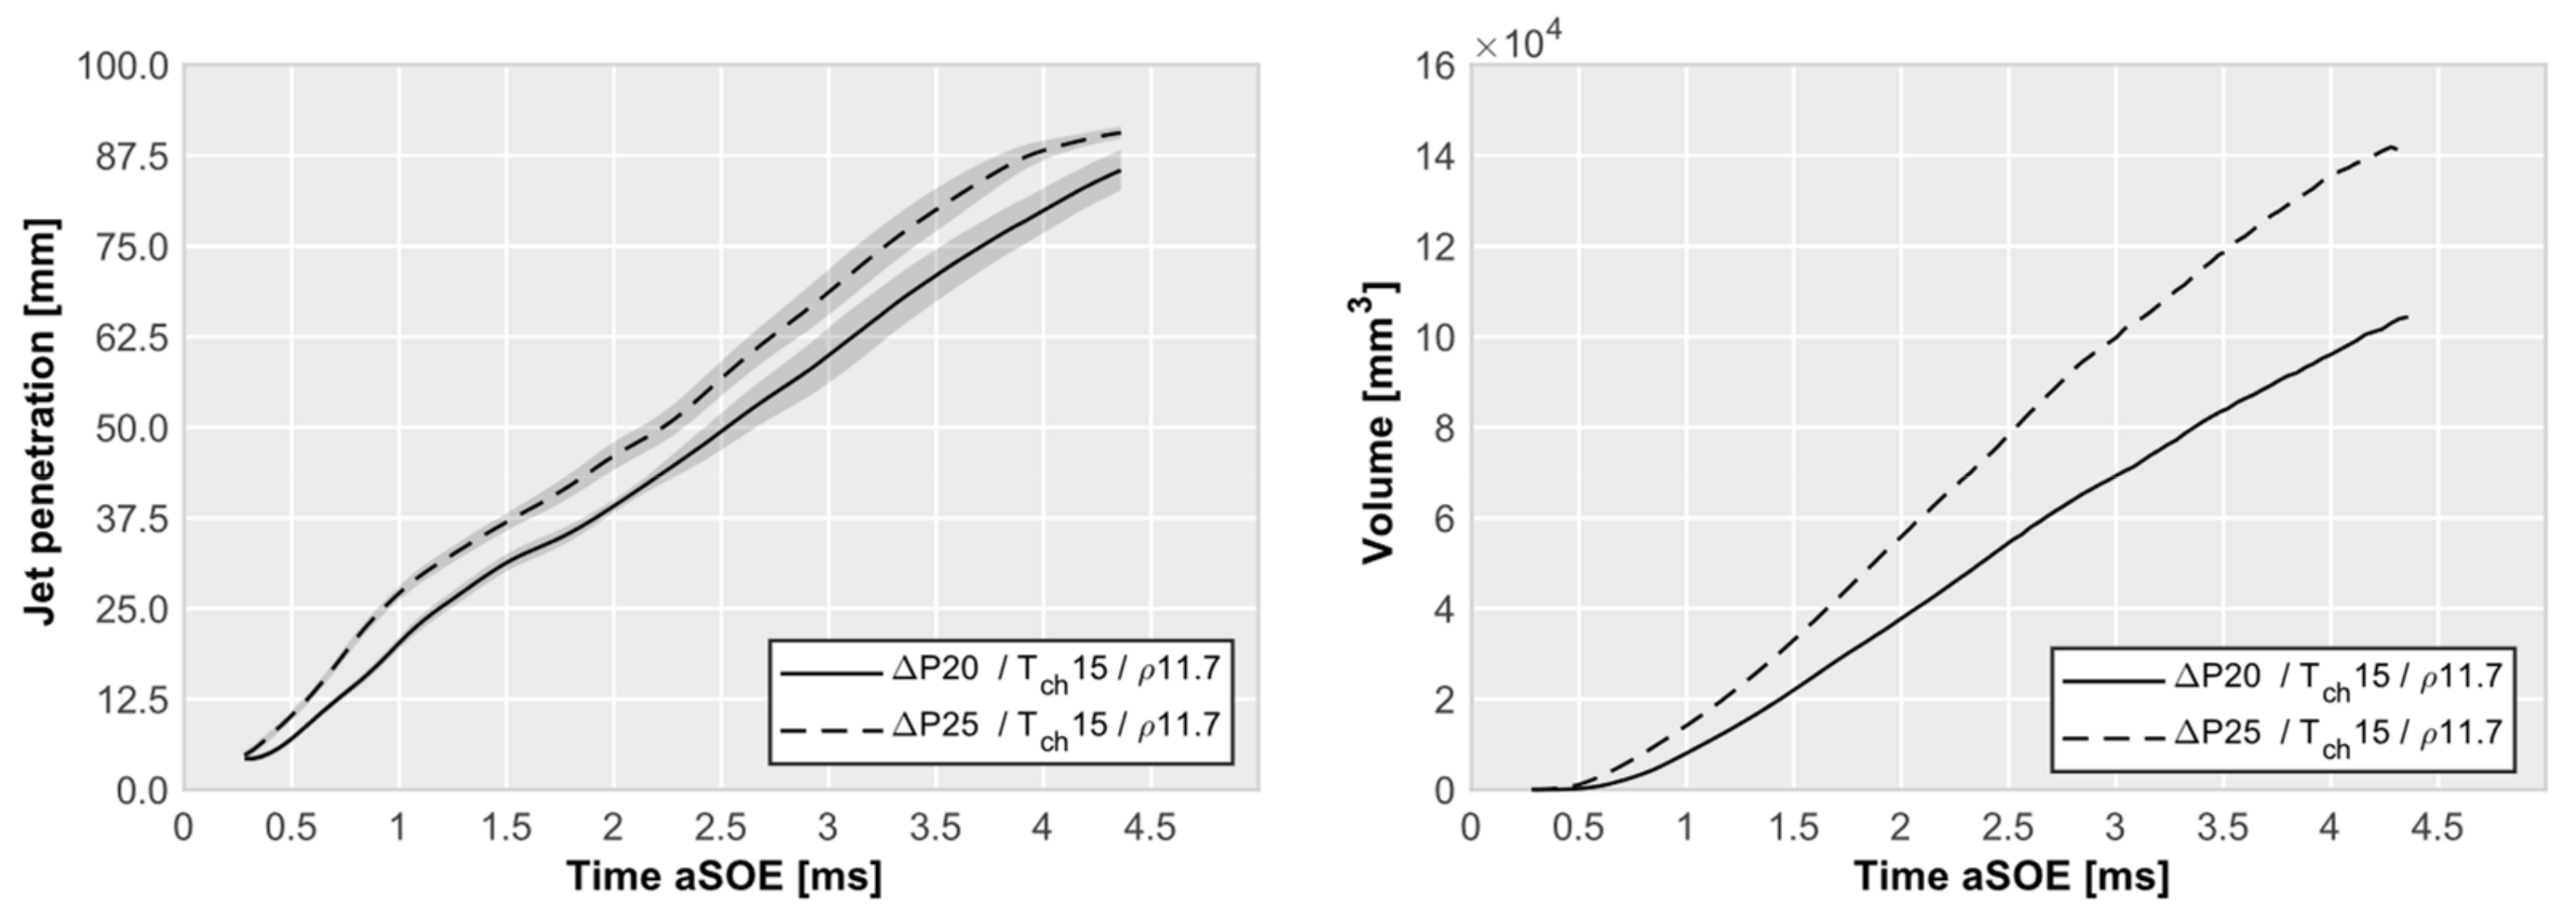
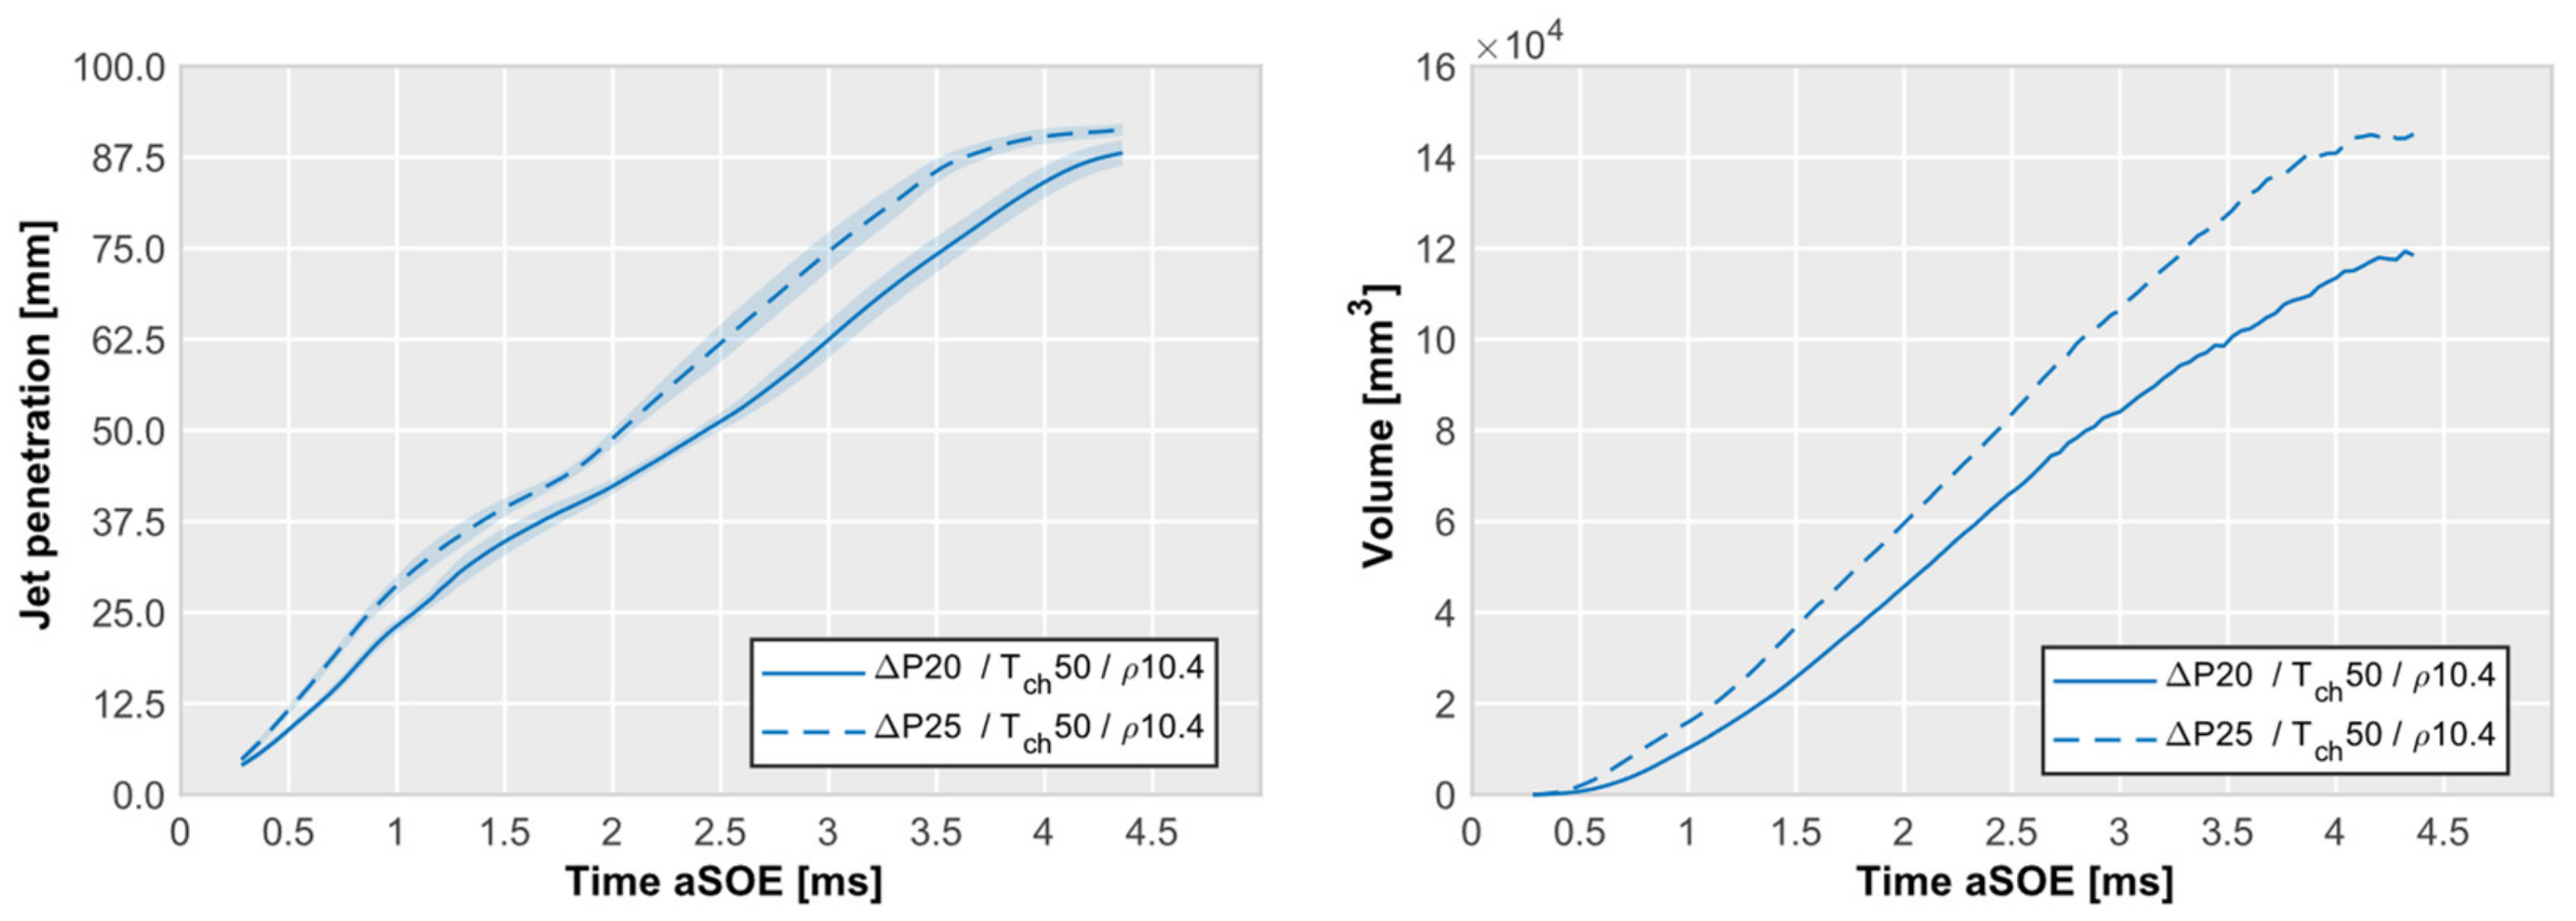
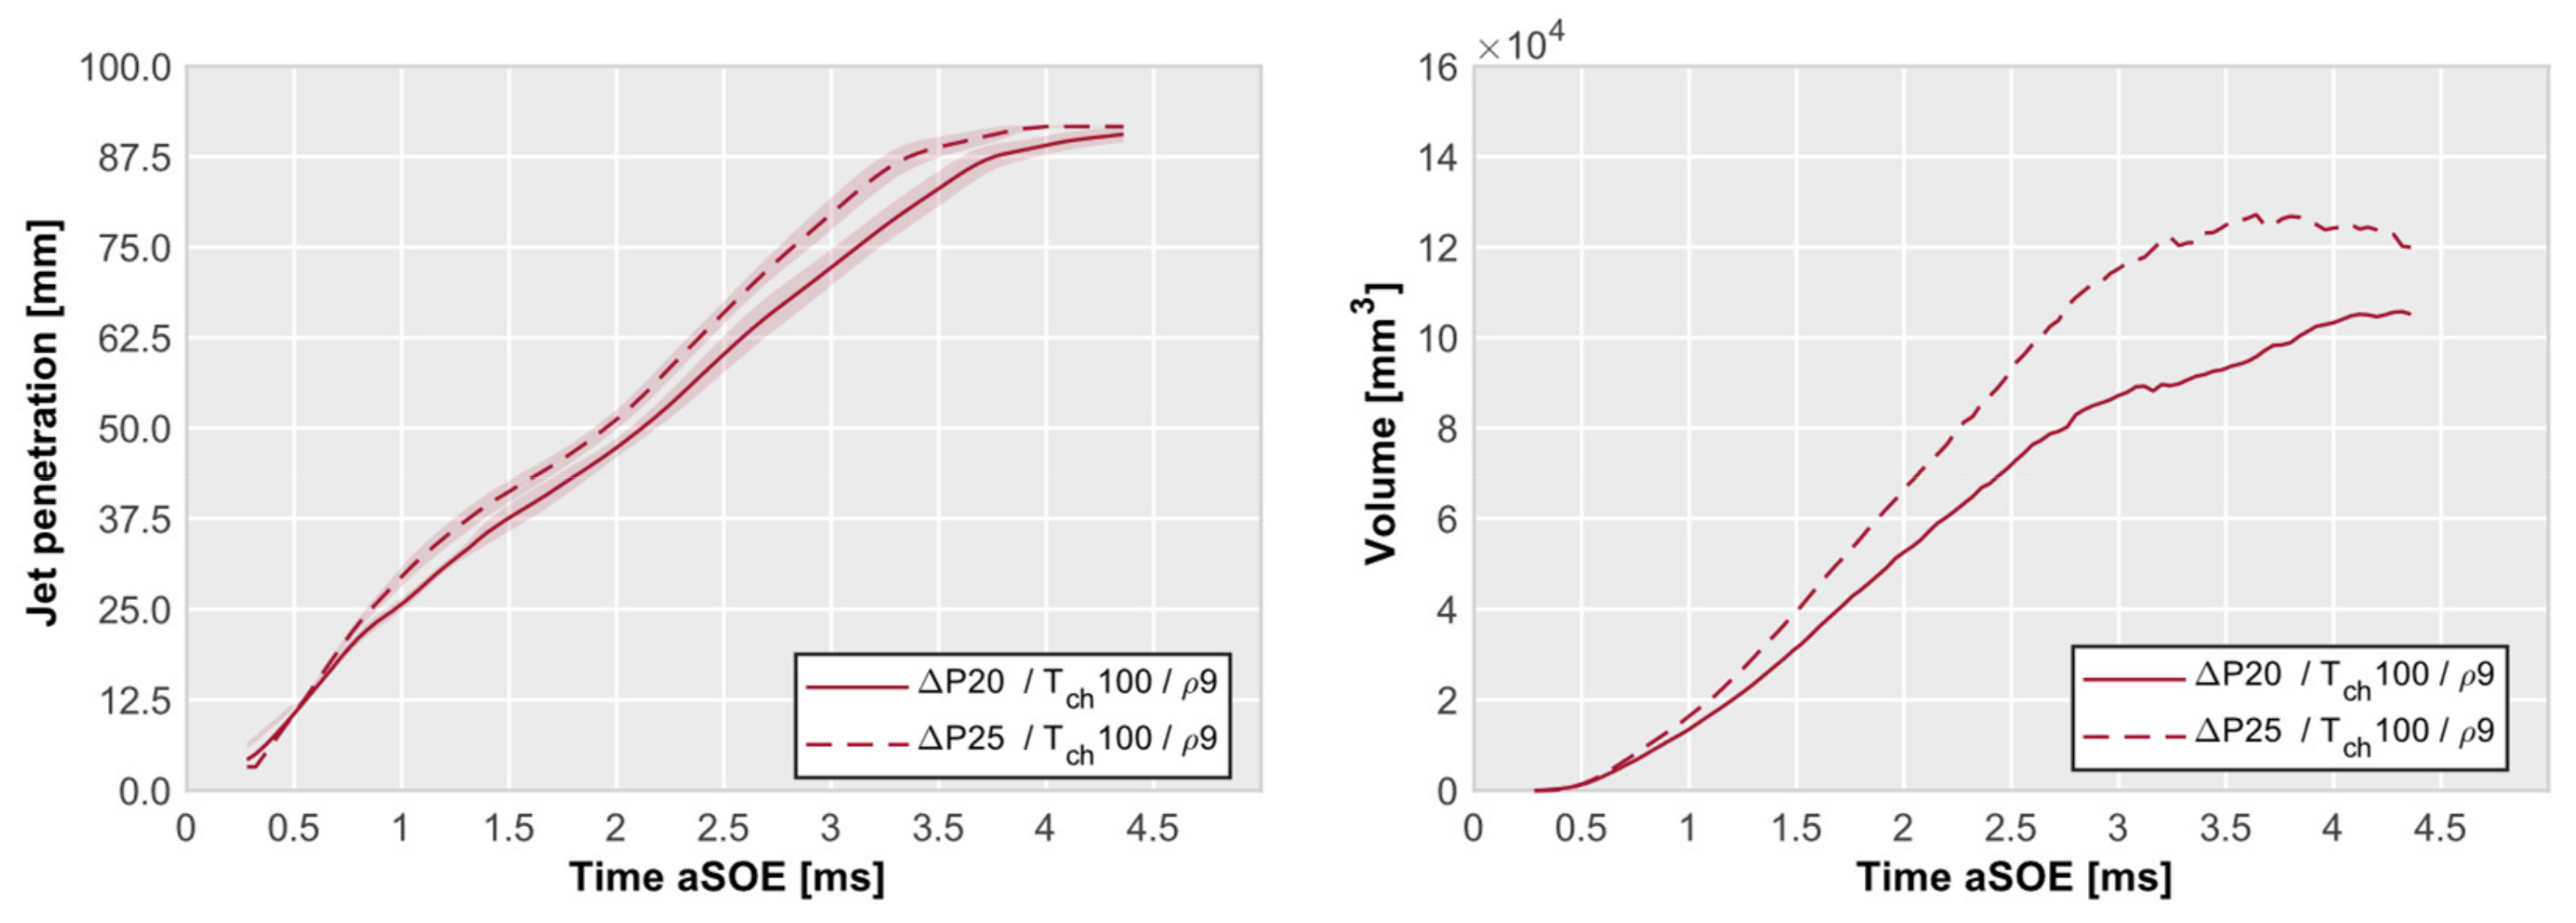
  • As observed in other recent studies regarding the influence of the pressure ratio on jet spray penetration and cross-sectional area, this research replicated the results, showing that an increase in the pressure ratio leads to greater spray penetration and a larger cross-sectional area of the jet. Regarding the temperature variation, it did not appear to affect jet penetration.
  • With regard to the relationship between the injected volume and temperature, our study of temperature alone did not appear to be decisive, as there was no discernible relationship between the increase in temperature and the reduction in the density corresponding to a larger injected volume. While it cannot be guaranteed, one hypothesis is that this could be due to the optical configuration of the images obtained through the Schlieren technique, based on the premise that higher temperatures in the chamber result in a decreased density gradient, potentially leading to a reduced detection of the jet contour in the later stages of processed image with a fixed threshold for every temperature operating point. This phenomenon would be interesting to study in more depth with a different injector, which would allow for a wider range of applicable temperatures; thus, an experimental campaign should be conducted with iso-settings over a broad temperature range.
  • Regarding the effect of the injection energizing time on jet penetration, in this study, no discernible influence was observed for the three different injection timings used (2500, 5000, 7000 µs).
  • The results obtained for the ROI corroborated those of the analysis of Schlieren image processing regarding the increased volume obtained with a higher pressure ratio, leading to a greater injected mass. This finding aligns with observations from other studies within the same research context.
It is worth mentioning that the approach used for calculating the jet volume could be considered somewhat simplistic. For this reason, to validate this study, a three-dimensional computational fluid dynamics (CFD) model of the jets studied in this research is currently under development. In this research, a preliminary characterization was conducted on a direct hydrogen injector, examining its injection rate and the effects of applying different injection pressures. The conclusion drawn is that the behavior is similar to that of other types of liquid-injected fuels with direct injectors analyzed in other studies, in terms of the relationship with the jet penetration.

Author Contributions

Conceptualization, R.N. and K.I.N.; Methodology, O.B.-F.; Validation, O.B.-F.; Formal analysis, K.I.N.; Investigation, O.B.-F.; Writing—original draft, O.B.-F.; Writing—review & editing, R.P., R.N. and K.I.N.; Supervision, R.P. and R.N.; Project administration, R.P. and R.N.; Funding acquisition, R.P. All authors have read and agreed to the published version of the manuscript.

Funding

This work was supported by the Spanish Ministerio de Ciencia e Innovación through grant number TED2021-129719B-C22: Utilizacion de Micromixers para Combustion Estable de Hidrogeno en Aviacion de Cero Emisiones. Estudio Experimental funded by MCIN/AEI/10.13039/501100011033 and by the European Union “NextGenerationEU/PRTR”.

Data Availability Statement

The original contributions presented in the study are included in the article, further inquiries can be directed to the corresponding author.

Acknowledgments

The authors would like to express their gratitude to Omar Huerta Cornejo, our laboratory technician, for his assistance with this experimental investigation.

Conflicts of Interest

The authors declare no conflict of interest.

Nomenclature

ICEInternal combustion engine
FCFuel cell
HPHTHigh-pressure high-temperature
ECNEngine combustion network
ROIRate of Injection
TchChamber temperature
PinjInjection pressure
PchChamber pressure, also mentioned as BP (backpressure)
TinjInjector energizing time
aSOEAfter start of energizing
∆PPressure difference between chamber pressure and injection pressure
ρDensity
CFDComputational fluid dynamics
CO2Carbon dioxide
H2Hydrogen

References

  1. Yip, H.L.; Srna, A.; Yuen, A.C.Y.; Kook, S.; Taylor, R.A.; Yeoh, G.H.; Medwell, P.R.; Chan, Q.N. A Review of Hydrogen Direct Injection for Internal Combustion Engines: Towards Carbon-Free Combustion. Appl. Sci. 2019, 9, 4842. [Google Scholar] [CrossRef]
  2. Verhelst, S. Recent progress in the use of hydrogen as a fuel for internal combustion engines. Int. J. Hydrogen Energy 2014, 39, 1071–1085. [Google Scholar] [CrossRef]
  3. Martins, J.; Brito, F.P. Alternative Fuels for Internal Combustion Engines. Energies 2020, 13, 4086. [Google Scholar] [CrossRef]
  4. European Commission. Technical Studies for the Development of Euro 7-ET0922457ENN; European Commission: Brussels, Belgium, 2022. [Google Scholar] [CrossRef]
  5. European Commission. Technical Studies for the Development of Euro 7-ET0522275ENN; European Commission: Brussels, Belgium, 2022. [Google Scholar] [CrossRef]
  6. Trombley, G.; Toulson, E. A fuel-focused review of pre-chamber initiated combustion. Energy Convers. Manag. 2023, 298, 117765. [Google Scholar] [CrossRef]
  7. Zhou, A.; Li, X.-S.; Ren, X.-D.; Li, X.; Gu, C.-W. Evaluation of the performance and economy for a hybrid energy storage system using hydrogen and compressed carbon dioxide as the energy carrier. Energy Convers. Manag. 2022, 264, 115700. [Google Scholar] [CrossRef]
  8. Batra, P. Alternative Energy Technologies: The Unconventional Dependable; SAE Technical Papers; SAE International: Warrendale, PA, USA, 2015; Volume 2015. [Google Scholar] [CrossRef]
  9. Yan, F.; Xu, L.; Wang, Y. Application of hydrogen enriched natural gas in spark ignition IC engines: From fundamental fuel properties to engine performances and emissions. Renew. Sustain. Energy Rev. 2018, 82, 1457–1488. [Google Scholar] [CrossRef]
  10. Sun, X.; Liu, H.; Duan, X.; Guo, H.; Li, Y.; Qiao, J.; Liu, Q.; Liu, J. Effect of hydrogen enrichment on the flame propagation, emissions formation and energy balance of the natural gas spark ignition engine. Fuel 2022, 307, 121843. [Google Scholar] [CrossRef]
  11. Rueda-Vázquez, J.M.; Serrano, J.; Pinzi, S.; Jiménez-Espadafor, F.J.; Dorado, M.P. A Review of the Use of Hydrogen in Compression Ignition Engines with Dual-Fuel Technology and Techniques for Reducing NOx Emissions. Sustainability 2024, 16, 3462. [Google Scholar] [CrossRef]
  12. Rahman, M.M.; Mohammed, M.K.; Bakar, R.A. Effects of Air Fuel Ratio on the Performance of Hydrogen Fuel Port Injection Engine. Available online: https://www.researchgate.net/publication/261170801_Effects_of_Air_Fuel_Ratio_on_the_Performance_of_Hydrogen_Fuel_Port_Injection_Engine#:~:text=It%20is%20shown%20that%20decreases,speed%20and%20air%2Dfuel%20ratio (accessed on 12 February 2024).
  13. Antunes, J.G.; Mikalsen, R.; Roskilly, A. An experimental study of a direct injection compression ignition hydrogen engine. Int. J. Hydrogen Energy 2009, 34, 6516–6522. [Google Scholar] [CrossRef]
  14. Naganuma, K.; Honda, T.; Yamane, K.; Takagi, Y.; Kawamura, A.; Yanai, T.; Sato, Y. Efficiency and Emissions-Optimized Operating Strategy of a High-pressure Direct Injection Hydrogen Engine for Heavy-duty Trucks. SAE Int. J. Engines 2010, 2, 132–140. [Google Scholar] [CrossRef]
  15. Tsujimura, T.; Suzuki, Y. Development of a large-sized direct injection hydrogen engine for a stationary power generator. Int. J. Hydrogen Energy 2019, 44, 11355–11369. [Google Scholar] [CrossRef]
  16. Takagi, Y.; Oikawa, M.; Sato, R.; Kojiya, Y.; Mihara, Y. Near-zero emissions with high thermal efficiency realized by optimizing jet plume location relative to combustion chamber wall, jet geometry and injection timing in a direct-injection hydrogen engine. Int. J. Hydrogen Energy 2019, 44, 9456–9465. [Google Scholar] [CrossRef]
  17. Wimmer, A.; Wallner, T.; Ringler, J.; Gerbig, F. H2-Direct Injection—A Highly Promising Combustion Concept; SAE International: Warrendale, PA, USA, 2005. [Google Scholar]
  18. Wallner, T.; Lohsebusch, H.; Gurski, S.; Duoba, M.; Thiel, W.; Martin, D.; Korn, T. Fuel economy and emissions evaluation of BMW Hydrogen 7 Mono-Fuel demonstration vehicles. Int. J. Hydrogen Energy 2008, 33, 7607–7618. [Google Scholar] [CrossRef]
  19. Luo, Q.-H.; Sun, B.-G. Inducing factors and frequency of combustion knock in hydrogen internal combustion engines. Int. J. Hydrogen Energy 2016, 41, 16296–16305. [Google Scholar] [CrossRef]
  20. Lee, S.; Hwang, J.; Bae, C. Understanding hydrogen jet dynamics for direct injection hydrogen engines. Int. J. Engine Res. 2023, 24, 4433–4444. [Google Scholar] [CrossRef]
  21. Yeganeh, M.; Cheng, Q.; Dharamsi, A.; Karimkashi, S.; Kuusela-Opas, J.; Kaario, O.; Larmi, M. Visualization and comparison of methane and hydrogen jet dynamics using schlieren imaging. Fuel 2023, 331, 125762. [Google Scholar] [CrossRef]
  22. Bower, G.R.; Foster, D.E. A Comparison of the Bosch and Zuech Rate of Injection Meters; SAE International: Warrendale, PA, USA, 1991. [Google Scholar]
  23. Cavicchi, A.; Postrioti, L.; Berni, F.; Fontanesi, S.; Di Gioia, R. Evaluation of hole-specific injection rate based on momentum flux measurement in GDI systems. Fuel 2020, 263, 116657. [Google Scholar] [CrossRef]
  24. Gimeno, J.; Martí-Aldaraví, P.; Carreres, M.; Peraza, J.E. Effect of the nozzle holder on injected fuel temperature for experimental test rigs and its influence on diesel sprays. Int. J. Engine Res. 2018, 19, 374–389. [Google Scholar] [CrossRef]
  25. Gimeno, J.; Bracho, G.; Martí-Aldaraví, P.; Peraza, J.E. Experimental study of the injection conditions influence over n-dodecane and diesel sprays with two ECN single-hole nozzles. Part I: Inert atmosphere. Energy Convers. Manag. 2016, 126, 1146–1156. [Google Scholar] [CrossRef]
  26. Peraza, J.E.; Payri, R.; Gimeno, J.; Carvallo, C. Analysis of spray/wall impingement using an ECN single-hole injector and a controlled-temperature wall under realistic engine conditions. Appl. Therm. Eng. 2022, 208, 118167. [Google Scholar] [CrossRef]
  27. Payri, R.; Gimeno, J.; Peraza, J.E.; Bazyn, T. Spray/wall interaction analysis on an ECN single-hole injector at diesel-like conditions through Schlieren visualization. In Proceedings of the ILASS-Europe 2017, Valencia, Spain, 6–8 September 2017. [Google Scholar]
  28. Naber, J.D.; Siebers, D.L. Effects of Gas Density and Vaporization on Penetration and Dispersion of Diesel Sprays. J. Engines 1996, 105, 82–111. [Google Scholar]
  29. Payri, R.; Gimeno, J.; Mata, C.; Viera, A. Rate of injection measurements of a direct-acting piezoelectric injector for different operating temperatures. Energy Convers. Manag. 2018, 154, 387–393. [Google Scholar] [CrossRef]
  30. Payri, R.; Bracho, G.; Marti-Aldaravi, P.; Viera, A. Near field visualization of diesel spray for different nozzle inclination angles in non-vaporizing conditions. At. Sprays 2017, 27, 251–267. [Google Scholar] [CrossRef]
  31. Yeganeh, M.; Akram, M.S.; Cheng, Q.; Karimkashi, S.; Kaario, O.; Larmi, M. Experimental study of hydrogen jet dynamics: Investigating free momentum and impingement phenomena. Int. J. Hydrogen Energy 2024, 68, 1423–1437. [Google Scholar] [CrossRef]
  32. Lazzaro, M. High-Speed Imaging of a Vaporizing GDI Spray: A Comparison between Schlieren, Shadowgraph, DBI and Scattering; SAE Technical Papers; SAE International: Warrendale, PA, USA, 2020; Volume 2020. [Google Scholar] [CrossRef]
Figure 1. View of the high-pressure and high-temperature visualization vessel.
Energies 17 02405 g001
Figure 2. Hydraulic unit of the low rate meter device, model IAV Cross Type H-140-155 (SONPLAS).
Energies 17 02405 g002
Figure 3. Scheme of optical setup used to visualize the vapor phase. Schlieren beams path are illustrated in red.
Energies 17 02405 g003
Figure 4. Samples of spray images observed via the Schlieren imaging technique at different timings.
Energies 17 02405 g004
Figure 5. Macroscopic parameters calculated from the spray images using the Schlieren imaging technique.
Energies 17 02405 g005
Figure 6. Example of the averaged ROI data.
Energies 17 02405 g006
Figure 7. Jet penetration and calculated volume for two different Pinj = 30 and 35 bar; Tch = 15 °C; Backpressure = 10 bar; Tinj = 2500 µs.
Energies 17 02405 g007
Figure 8. Jet penetration and calculated volume for Pinj = 30 and 35 bar; Tch = 50 °C; Backpressure = 10 bar; Tinj = 2500 µs.
Energies 17 02405 g008
Figure 9. Jet penetration and calculated volume for Pinj = 30 and 35 bar; Tch = 100 °C; Backpressure = 10 bar; Tinj = 2500 µs.
Energies 17 02405 g009
Figure 10. Jet penetration and calculated volume for Pinj = 30 and 35 bar; Tch = 150 °C; Backpressure = 10 bar; Tinj = 2500 µs.
Energies 17 02405 g010
Figure 11. Jet penetration and calculated volume for Pinj = 30 bar; Tch = 15, 50, 100, and 150 °C; Backpressure = 10 bar; Tinj = 2500 µs.
Energies 17 02405 g011
Figure 12. Jet penetration and calculated volume for Pinj = 30 bar; Tch = 15 °C; Backpressure = 10 bar; Tinj = 2500, 5000 and 7000 µs.
Energies 17 02405 g012
Figure 13. ROI results with the following parameters: Tinj = 2500 µs; Backpressure = 10 bar; Tch = 25 °C; Pinj = 30 and 35 bar.
Energies 17 02405 g013
Table 1. Test matrix performed in high-pressure and -temperature vessel.
Tch [°C]Pinj [bar]BP [bar]
153010
153510
153515
503010
503510
503515
1003010
1003510
1003515
1503010
1503510
1503515
Note: This test plan matrix was performed for three different energizing timings: 2500, 5000, 7000 µs.
Table 2. Physical properties of hydrogen.
ParameterValueUnit
Density0.089 a
71 b,c
kg/m3
Stoichiometric air demand34.3kgair/kgfuel
Lower heating value120MJ/kgKst
Mixture
Calorific value e
3.2
4.53
MJ/m3
Boiling temperature c−253°C
Ignition limits d4–76
0.2–10
Vol-%
λ
Minimum ignition energy c,d,e0.02mJ
Self-ignition temperature585°C
Diffusion coefficient a,d8.5 × 10−6m2/s
Quenching distance c,d,f0.64mm
Laminar flame speed d,e200cm/s
Carbon content0Mass-%
a At 1013 bar and 0 °C. b At −253 °C. c At 1013 bar. d In air. e λ = 1 f at 20 °C.
Table 3. Details of the optical setup for Schlieren imaging technique.
ParameterValue
CameraPhotron SA-Z (Tokyo, Japan)
Lens diameter100 mm
Diaphragm gap diameter4 mm
Frame rate25 kfps
Shutter time2.5 µs
Frames per trigger300
Repetitions10
Px/mm ratio11.45
Disclaimer/Publisher’s Note: The statements, opinions and data contained in all publications are solely those of the individual author(s) and contributor(s) and not of MDPI and/or the editor(s). MDPI and/or the editor(s) disclaim responsibility for any injury to people or property resulting from any ideas, methods, instructions or products referred to in the content.

