1. Introduction
In recent years, the automotive industry has undergone a significant transformation, and we are witnessing a notable shift towards electric propulsion systems aimed at curbing greenhouse gas (GHG) emissions and combating climate change. With transportation heavily relying on internal combustion engines (ICEs) in vehicles, which are responsible for approximately 14% of global GHG emissions [
1], efforts are underway to address carbon emissions by transitioning towards alternative sustainable power sources. Electric vehicles (EVs) have emerged as a promising solution by offering a cleaner and more sustainable mode of transportation compared to traditional internal combustion engine vehicles.
Simultaneously, the aerospace sector is experiencing a paradigm shift towards more electrified technologies to minimize emissions, fuel consumption, and operational expenses. The aviation industry is a significant contributor to global greenhouse gas emissions and is responsible for 2.5% to 3.5% of total emissions, with 90% attributed to commercial aircraft operations [
2]. Consequently, the aviation sector has initiated a technological transition towards electrification known as “More Electric Aircraft” (MEA). By substituting electrical energy for mechanical, pneumatic, and hydraulic power sources, this electrified approach has demonstrated potential fuel savings of up to 9% [
3,
4].
Hybrid and turboelectric propulsion architectures for aircraft have been studied to facilitate a transition towards more electric propulsion systems, potentially leading to the development of all-electric aircraft. This evolution mirrors the transition from hybrid electric vehicles (HEVs) to fully electric vehicles (EVs), with HEVs serving as pioneers in the shift from traditional fuel-based vehicles to EVs. However, the aerospace industry demands electrical systems with higher power levels, energy densities, and power densities compared to the automotive industry. Moreover, every component onboard an aircraft must operate with maximum reliability under diverse conditions [
3].
Within the realm of EV and MEA technologies, permanent magnet synchronous motors (PMSMs) have garnered attention for their remarkable torque density, power density, and efficiency. High-speed PMSMs, renowned for their efficient operation at elevated rotational speeds, have become integral components in modern EV powertrains and MEA applications. PMSMs’ ability to deliver high power output at elevated speeds enhances EVs’ acceleration and performance, thus improving the overall driving experience for consumers. However, addressing mechanical strength issues in the rotors of high-speed interior PM (IPM) motors during the initial design phase is crucial [
5].
One significant challenge of high-speed motor drives involves raising the motor’s fundamental frequency. While this enhances the motor’s power density, it also poses limitations, such as increased iron losses [
6,
7]. The impact of frequency on iron losses and calculation methods are presented in [
8,
9,
10]. Additionally, raising the fundamental frequency reduces the inverter’s frequency modulation index, affecting the current waveform in the motor phases and leading to increased total harmonic distortion (THD), resulting in additional losses and torque ripples. Addressing these challenges involves increasing the inverter’s switching frequency to improve current THD. However, there are limits to increasing the switching frequency depending on the power electronic devices used.
Furthermore, the compact design and lightweight construction of high-speed PMSMs contribute to the overall efficiency and range of electric vehicles by minimizing energy losses and maximizing power delivery [
11,
12,
13]. Advancements in motor control algorithms and power electronics have further optimized the performance of high-speed PMSMs, facilitating their seamless integration into next-generation electric propulsion systems [
14,
15].
The effects of high switching frequencies on the performance of power electronics converters have been extensively studied in various papers across different applications. In [
16,
17], the nonlinearities in SiC-based three-phase inverters and IGBT-based inverters are studied and compared by considering factors such as dead time, switching delay time, switching frequency, and output parasitic capacitance. The authors of [
18] investigated the impact of dead time on SiC-BJT and SiC-MOSFET on converter losses in a high-frequency resonant converter. Additionally, ref. [
19] presents an analysis of parasitic elements, their categorization, and their effects on the operation of a high-frequency DC-DC buck converter for EV applications. Their results indicate that parasitic elements can affect the power loop, gate loop, and overall efficiency of the converter.
This paper aims to explore the design and modeling of a high-speed PM motor drive to identify the optimum frequency for maximum efficiency. To do this, two identical PMSM motors are mechanically coupled together. One motor operates as a motor, drawing power from a DC source via a three-phase inverter, while the other acts as a generator, supplying a resistive load to act as a mechanical load for the first motor. To investigate the effects of high frequencies, including both switching and fundamental frequencies, on the entire system—comprising the inverter and motor—we utilize three inverters, each constructed with different components (IGBT, Fast IGBT, and SiC-MOSFET).
In the subsequent section, we investigate the impact of frequency variation on the inverters, followed by an examination of machine design and the influence of the frequency on machine performance. Additionally, our study assesses the effects of high-frequency current on motor losses (both mechanical and electrical) through comprehensive modeling and experimentation. Subsequently, the designed motor undergoes testing using the inverters at various fundamental and switching frequencies to validate theoretical and simulation findings. Finally, we analyze the implications of frequency variation on the combined operation of the drive and motor.
The remainder of this paper is structured as follows:
Section 2 presents the effect of frequency variation on the drive of a PMSM.
Section 3 provides a detailed discussion of the design and modeling of the studied PMSM. Modeling PMSM losses across frequency variations is discussed in
Section 4.
Section 5 explores the influence of high frequencies on PMSM drives based on the simulation and experimental results. Finally,
Section 6 summarizes the findings and offers concluding remarks.
3. Studied PMSM Motor Design and Modeling
Exploring high-speed aspects in powertrains entails a multifaceted approach considering mechanical stress, vibration, thermal effects, and electrical/magnetic characteristics. However, this paper delves specifically into the ramifications of escalating the fundamental frequency of electrical quantities without venturing into extremely high-speed realms, thus circumventing intricate mechanical concerns for now. Our aim is to achieve frequencies surpassing 1 kHz while upholding mechanical speeds within the range of a few thousand revolutions per minute. To realize this objective, we opt to amplify the number of pole pairs in the machine and target fundamental frequencies of 2 kHz and speeds of 6000 rpm, with a power target of approximately 6 kW for the laboratory-scale bench.
Expanding the number of pole pairs confers several advantages, including downsizing the dimensions of the back iron (yoke) in both the stator and rotor armatures, thereby shedding weight from the machine and enhancing torque density. Furthermore, leveraging fractional-slot windings, such as the 48 coils–40 poles configuration considered here, bolsters torque density by curtailing end-windings.
Table 1 provides the main specifications of the machine.
Analytical pre-design, based on standard rules, furnishes the initial machine parameters. Distinctive design features such as small teeth between coils to enhance heat transfer between the coils and ambiance, segmented and resin-embedded magnets, and a specialized shaft assembly design are employed. Finite element analysis aids with pinpointing critical parameters, ensuring stable performance even at high switching frequencies and speeds.
To address AC losses, the coils are crafted with multiple strands in series, reducing the wire diameter relative to skin depth. Careful slot arrangement regulates inter-turn voltage, curbing EMI challenges. These strategies bolster efficiency and streamline dynamic control, which are crucial for high-speed applications.
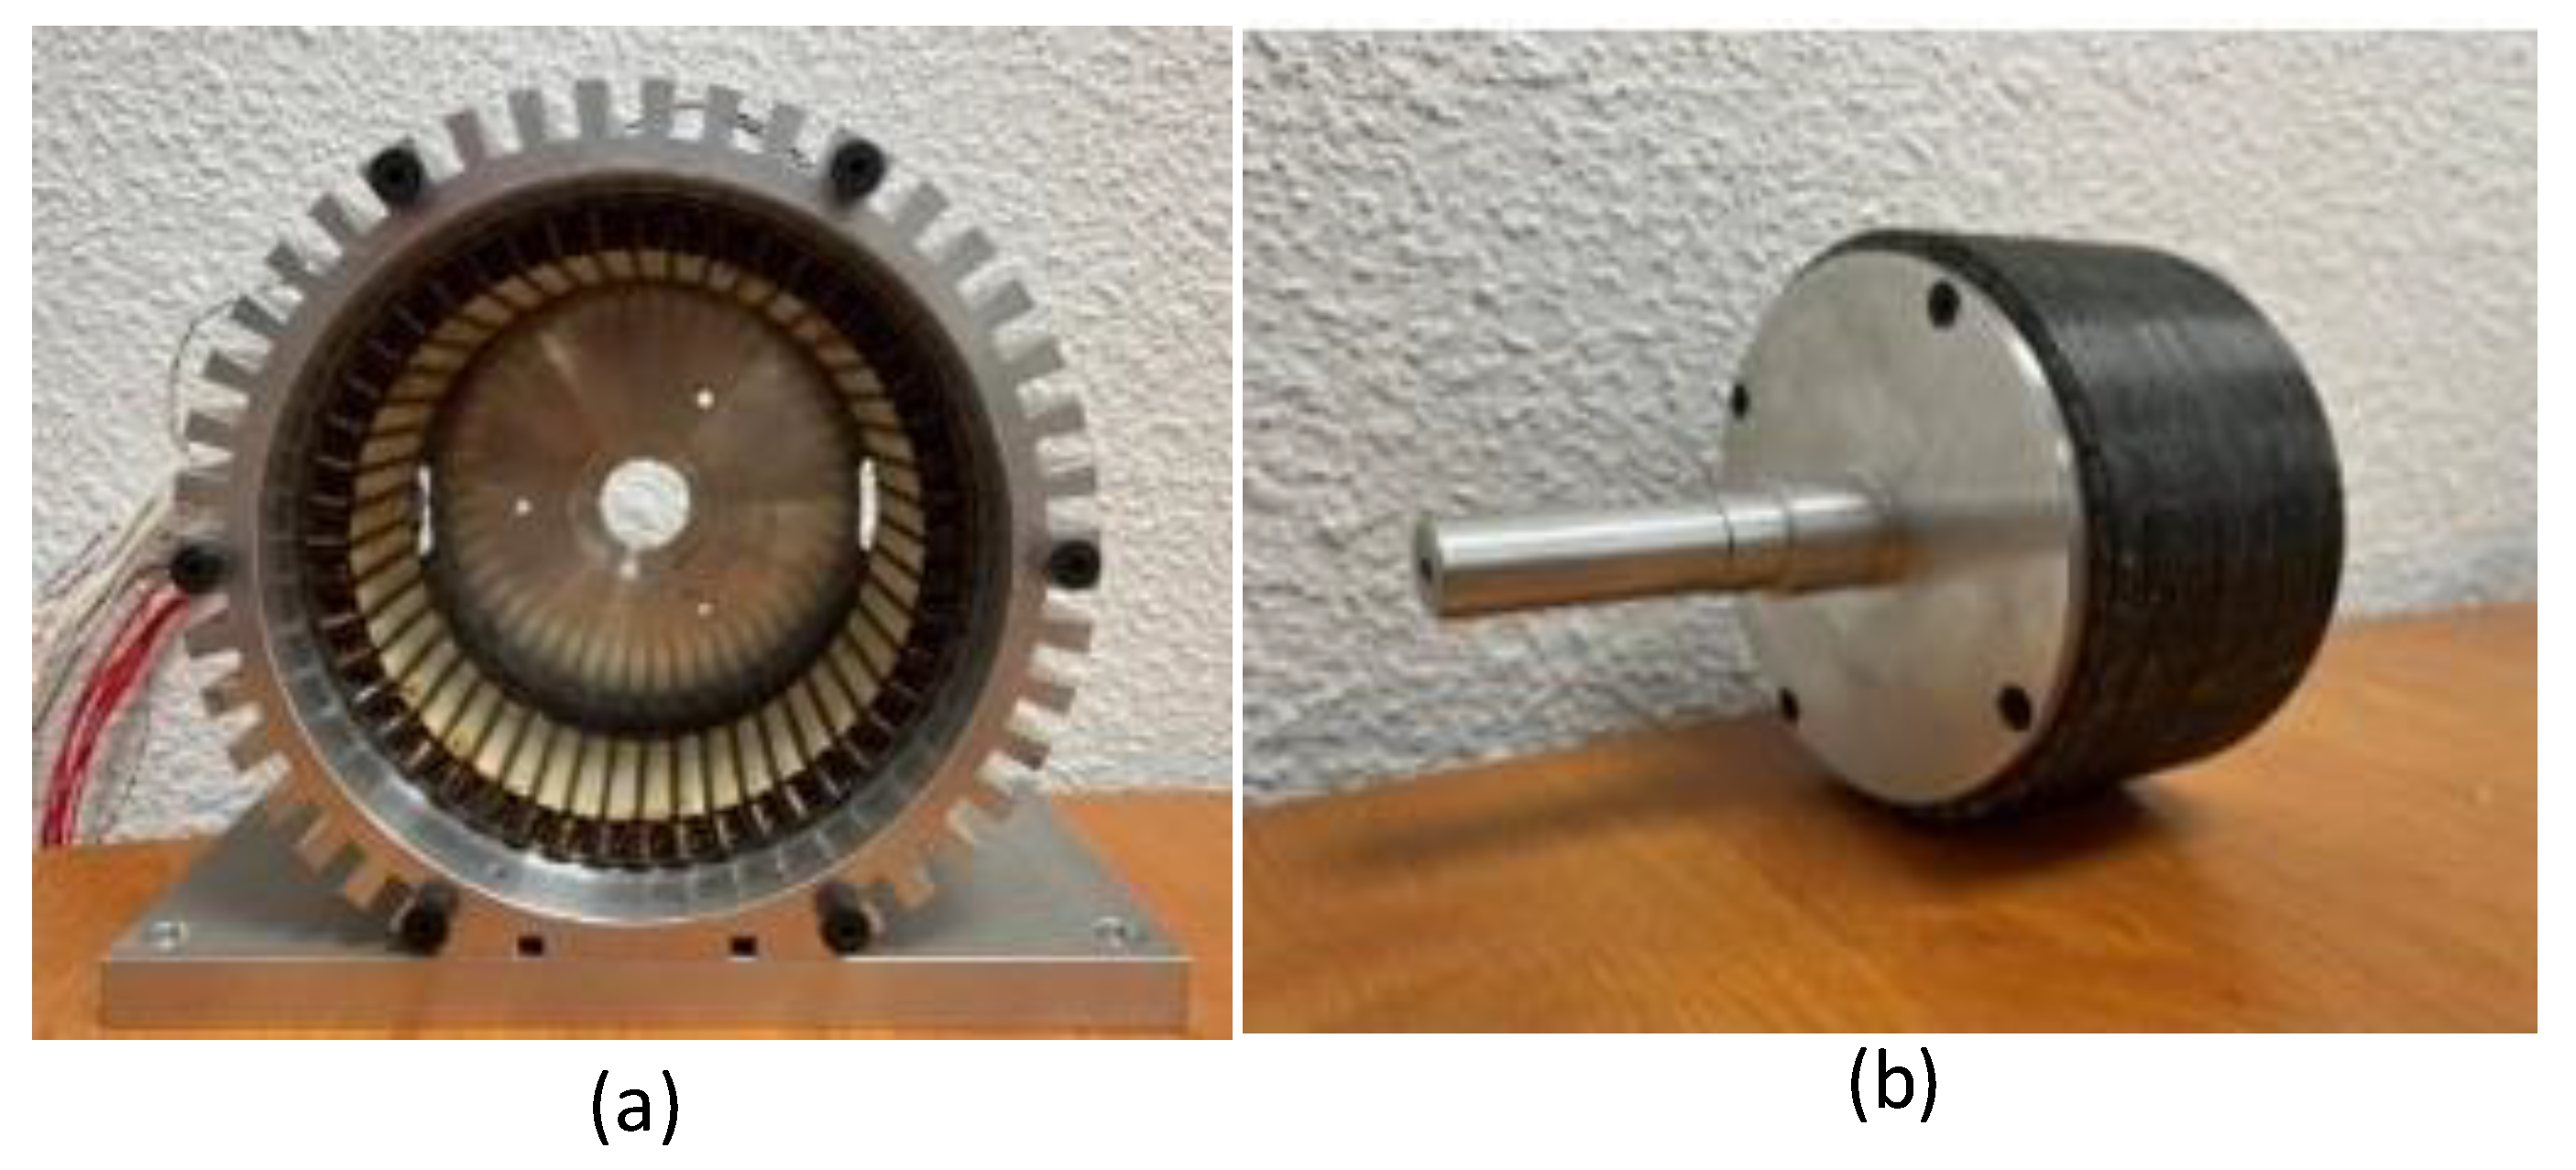
Figure 5 provides separate views of the stator and rotor prior to assembly.
With a high number of rotor poles and the resulting hollow structure, the machine exhibits a low moment of inertia, yielding a pronounced mechanical dynamic response. Precision in shaft assembly poses a key challenge and necessitates specialized mechanical design, as illustrated in the following figure, and emphasizes the need for meticulous centering of the two half-shafts.
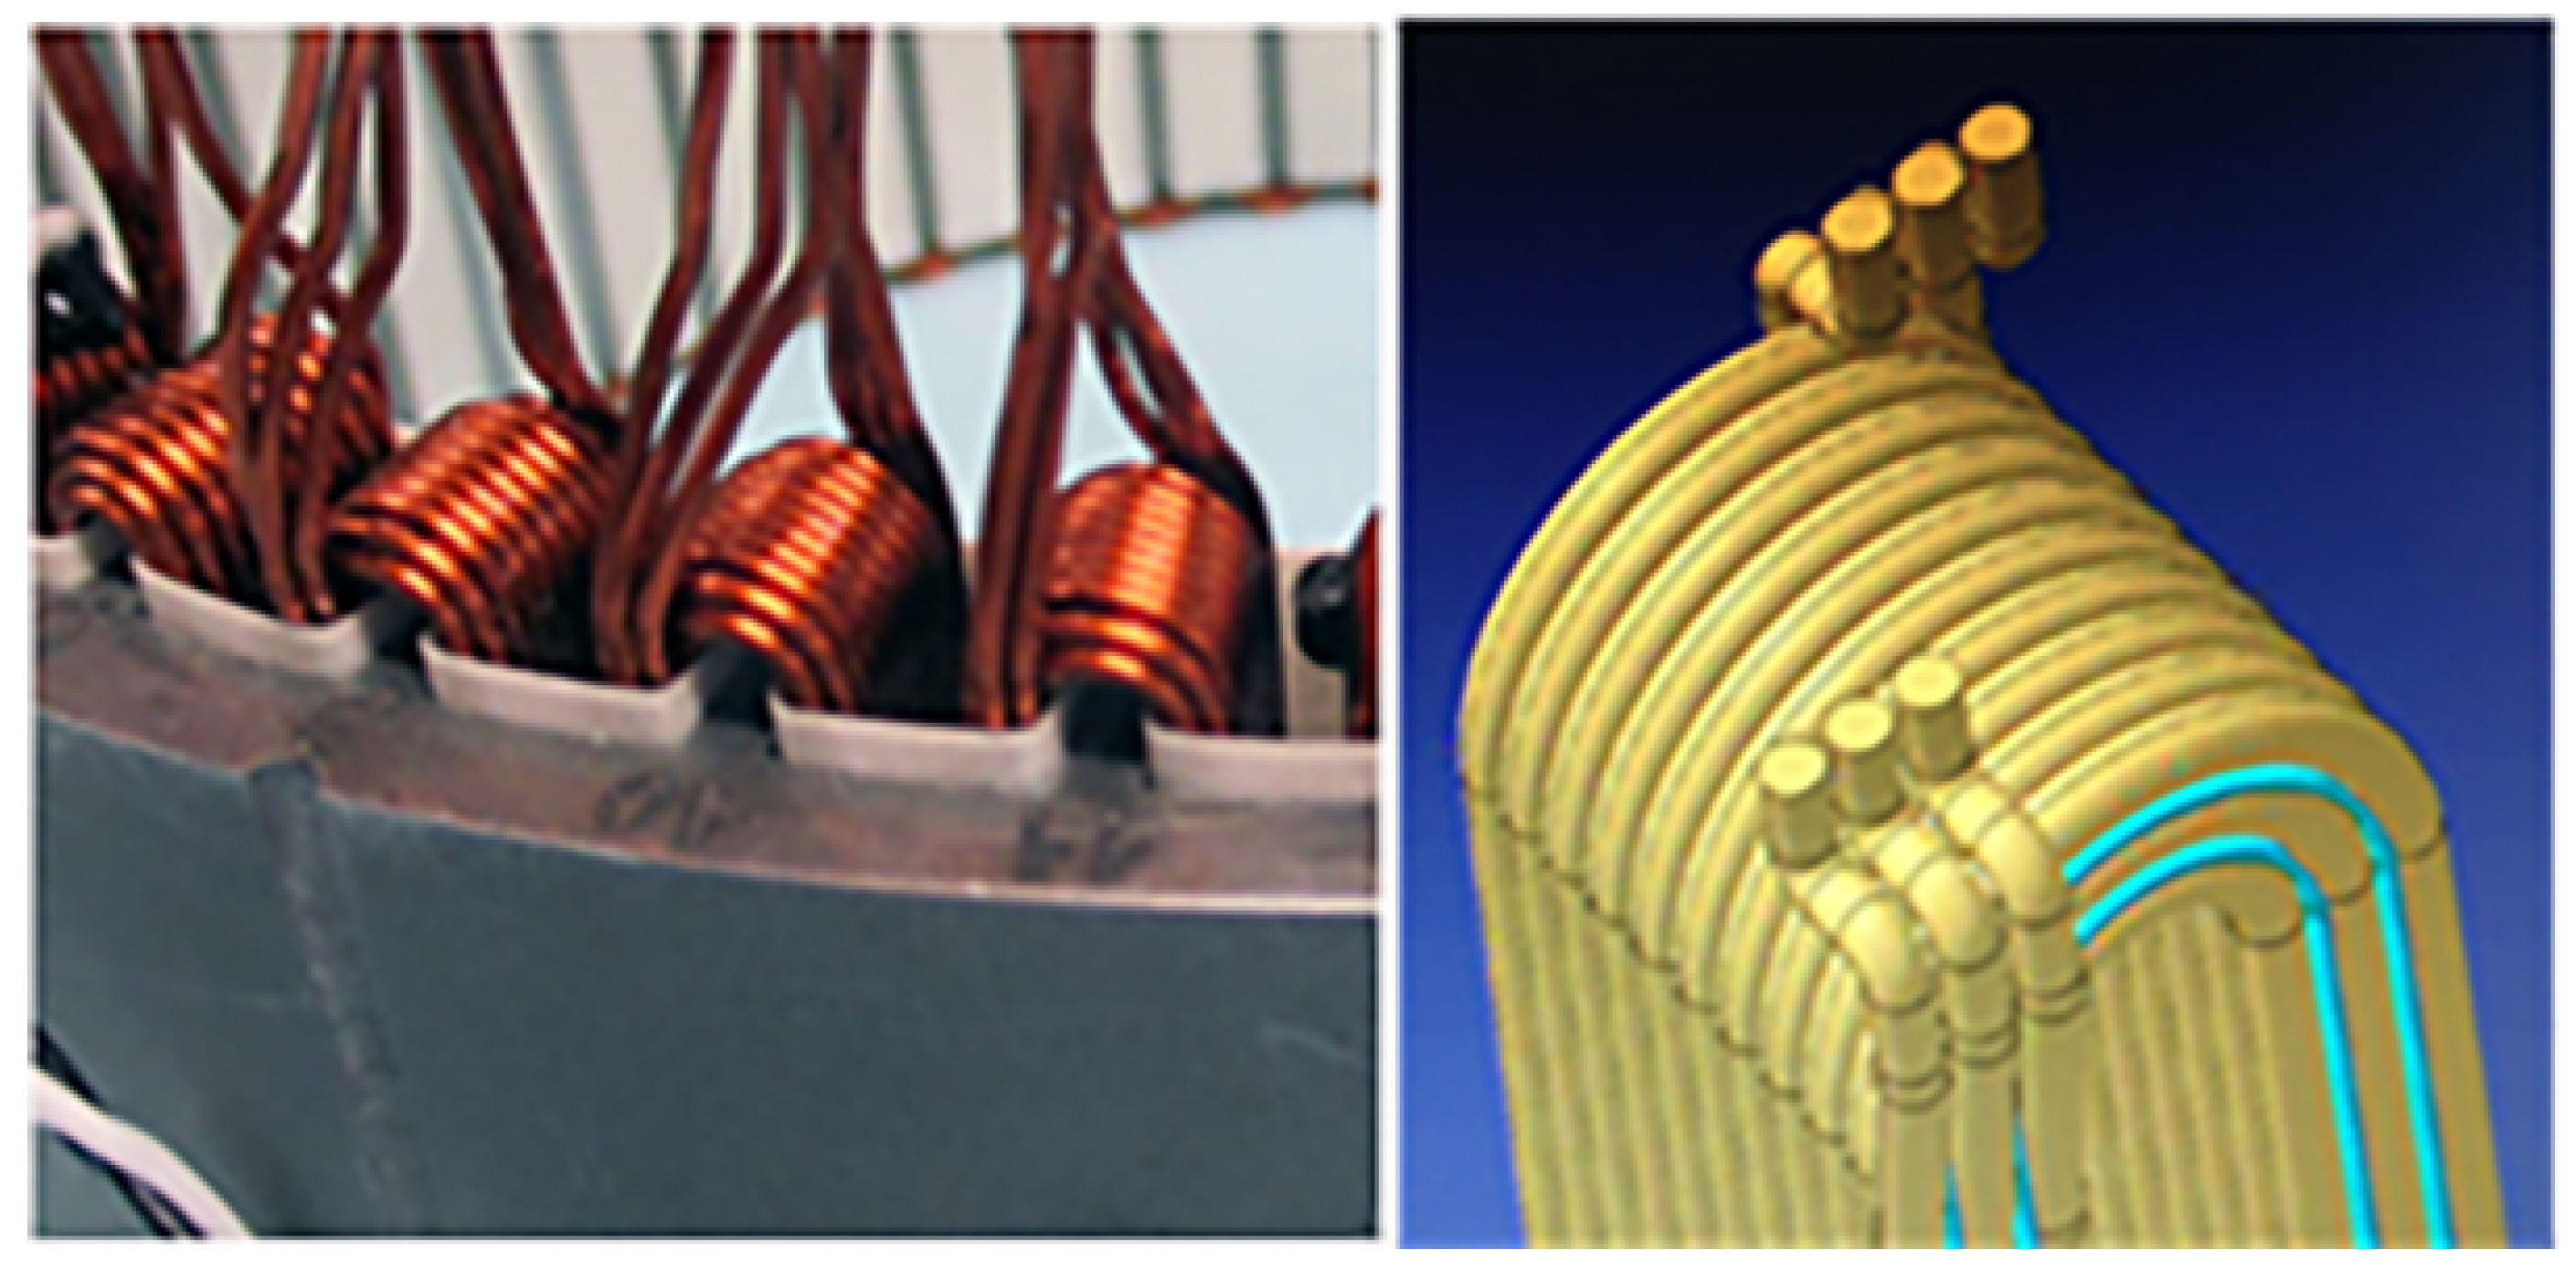
To counter AC losses from the skin effect in the stator winding, the coils employ multiple series strands with smaller cross-sections. This design ensures that the wire diameter remains significantly smaller than the skin depth. Furthermore, orderly wire arrangement within slots regulates the inter-turn voltage, reducing high
and mitigating capacitive behavior of the stator winding, thus alleviating EMI challenges associated with high switching frequencies.
Figure 6 illustrates the stator winding.
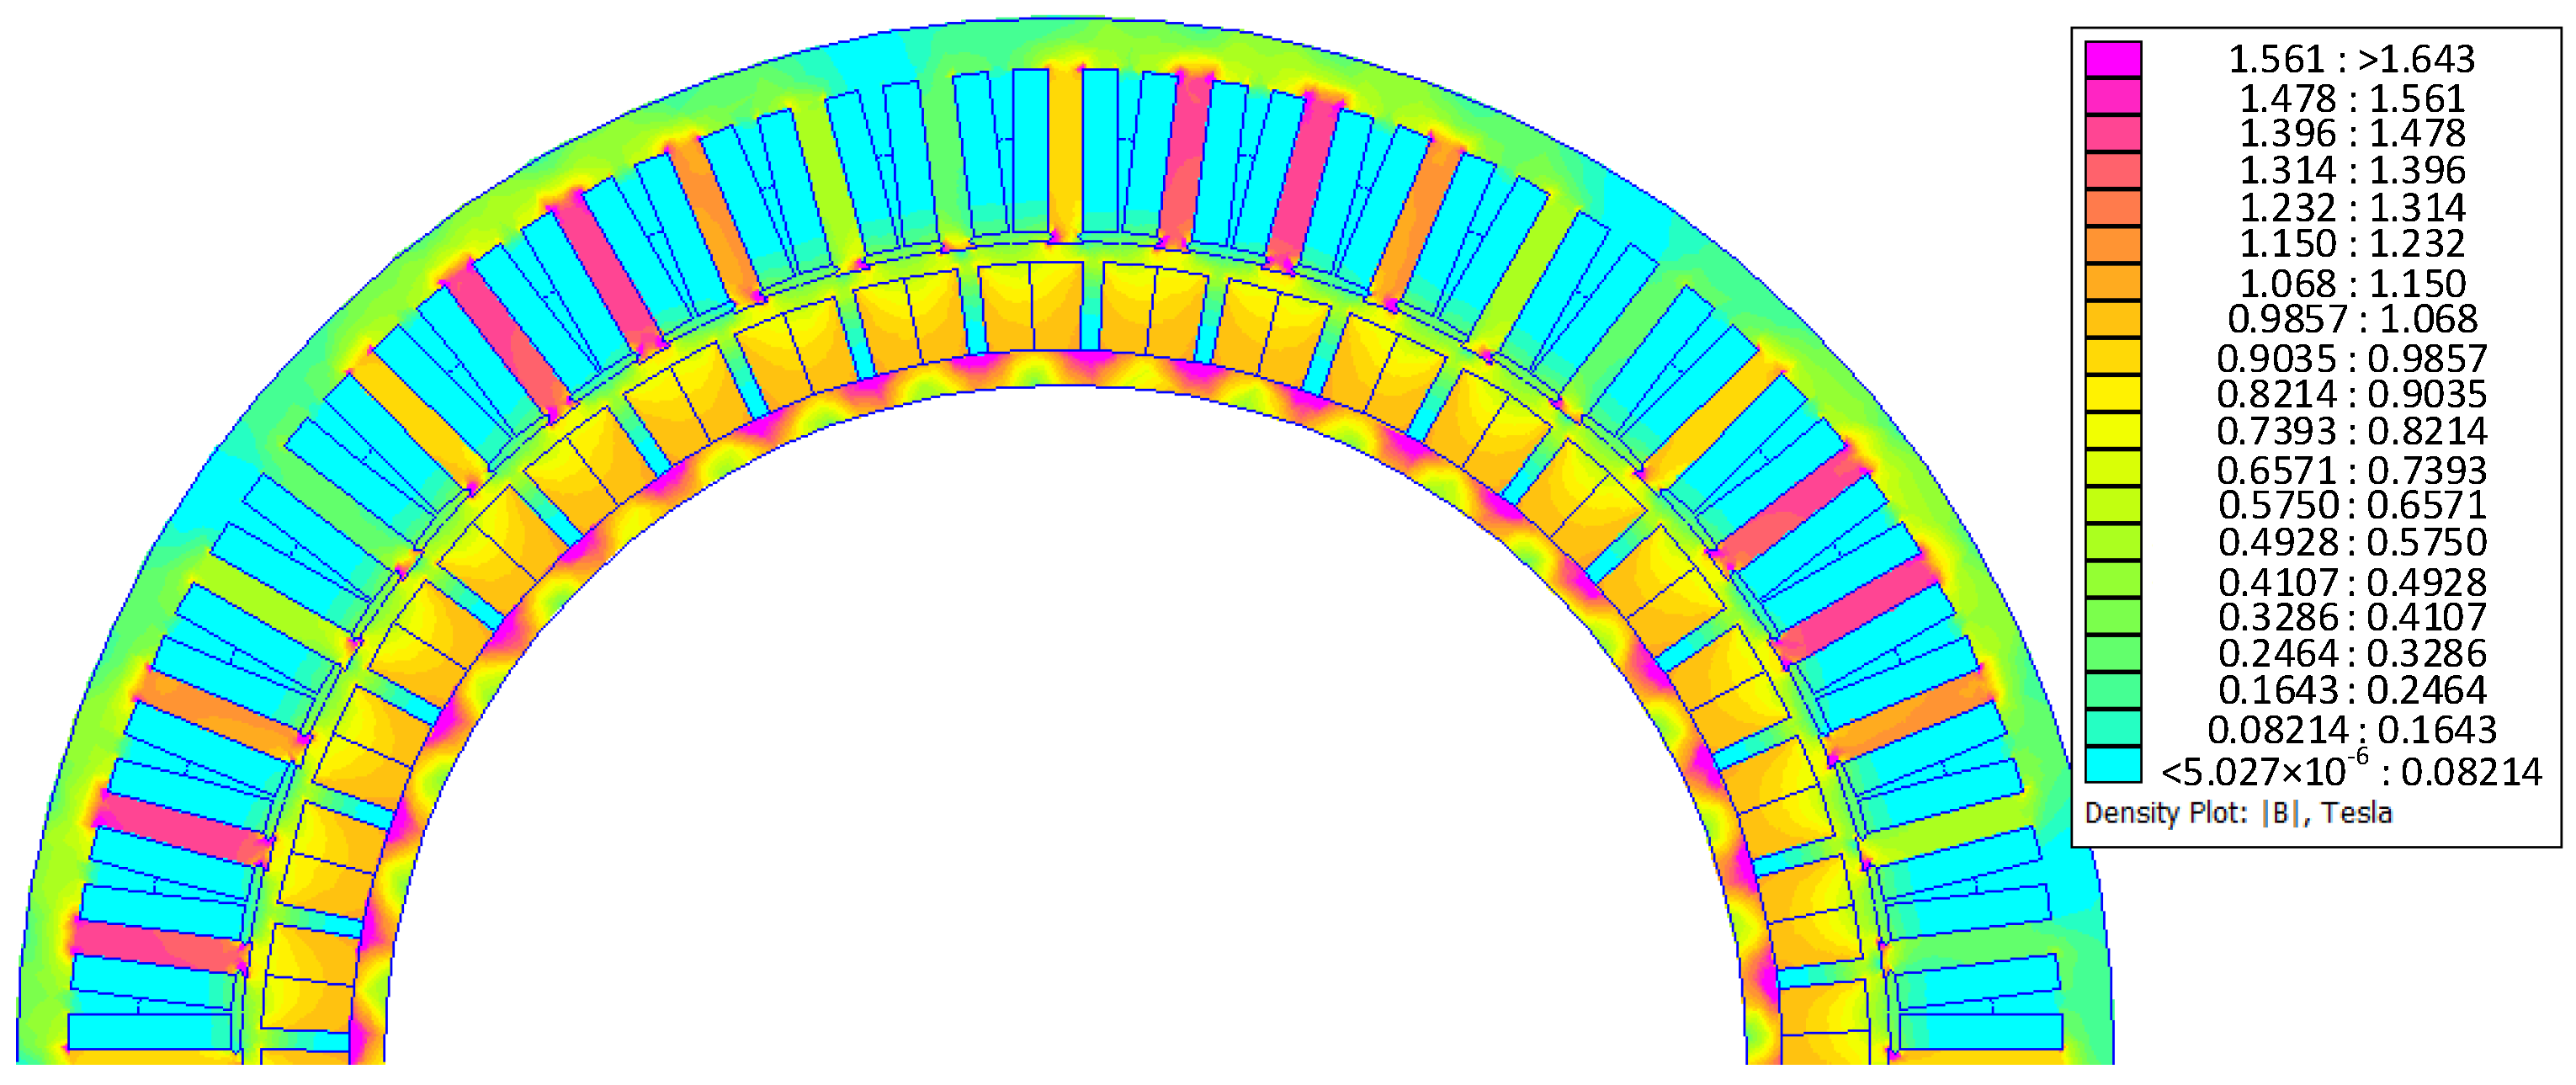
In the motor design process, the consistent dimensions obtained from the analytical pre-sizing process serve as the foundation. Initially, a simplified 2D analytical model with an equivalent current-sheet is employed to represent the stator armature winding currents. This analytical model is then integrated with the MATLAB 2022b Optimization Toolbox to derive the primary dimensions of the machine, including the pole-pair number, the outer radius of the rotor, the magnet thickness, the air-gap length, and the axial length of the machine, in accordance with the specifications. Subsequently, finite element method (FEM) simulations using FEMM 4.2 software are utilized to account for slotting effects and magnetic saturation of the iron parts, while the adjustment of other dimensions of the machine (such as stator teeth, stator, and rotor back-iron thicknesses) is carried out to optimize performance. As an example,
Figure 7 shows the flux density distribution at no-load obtained with FEMM software.
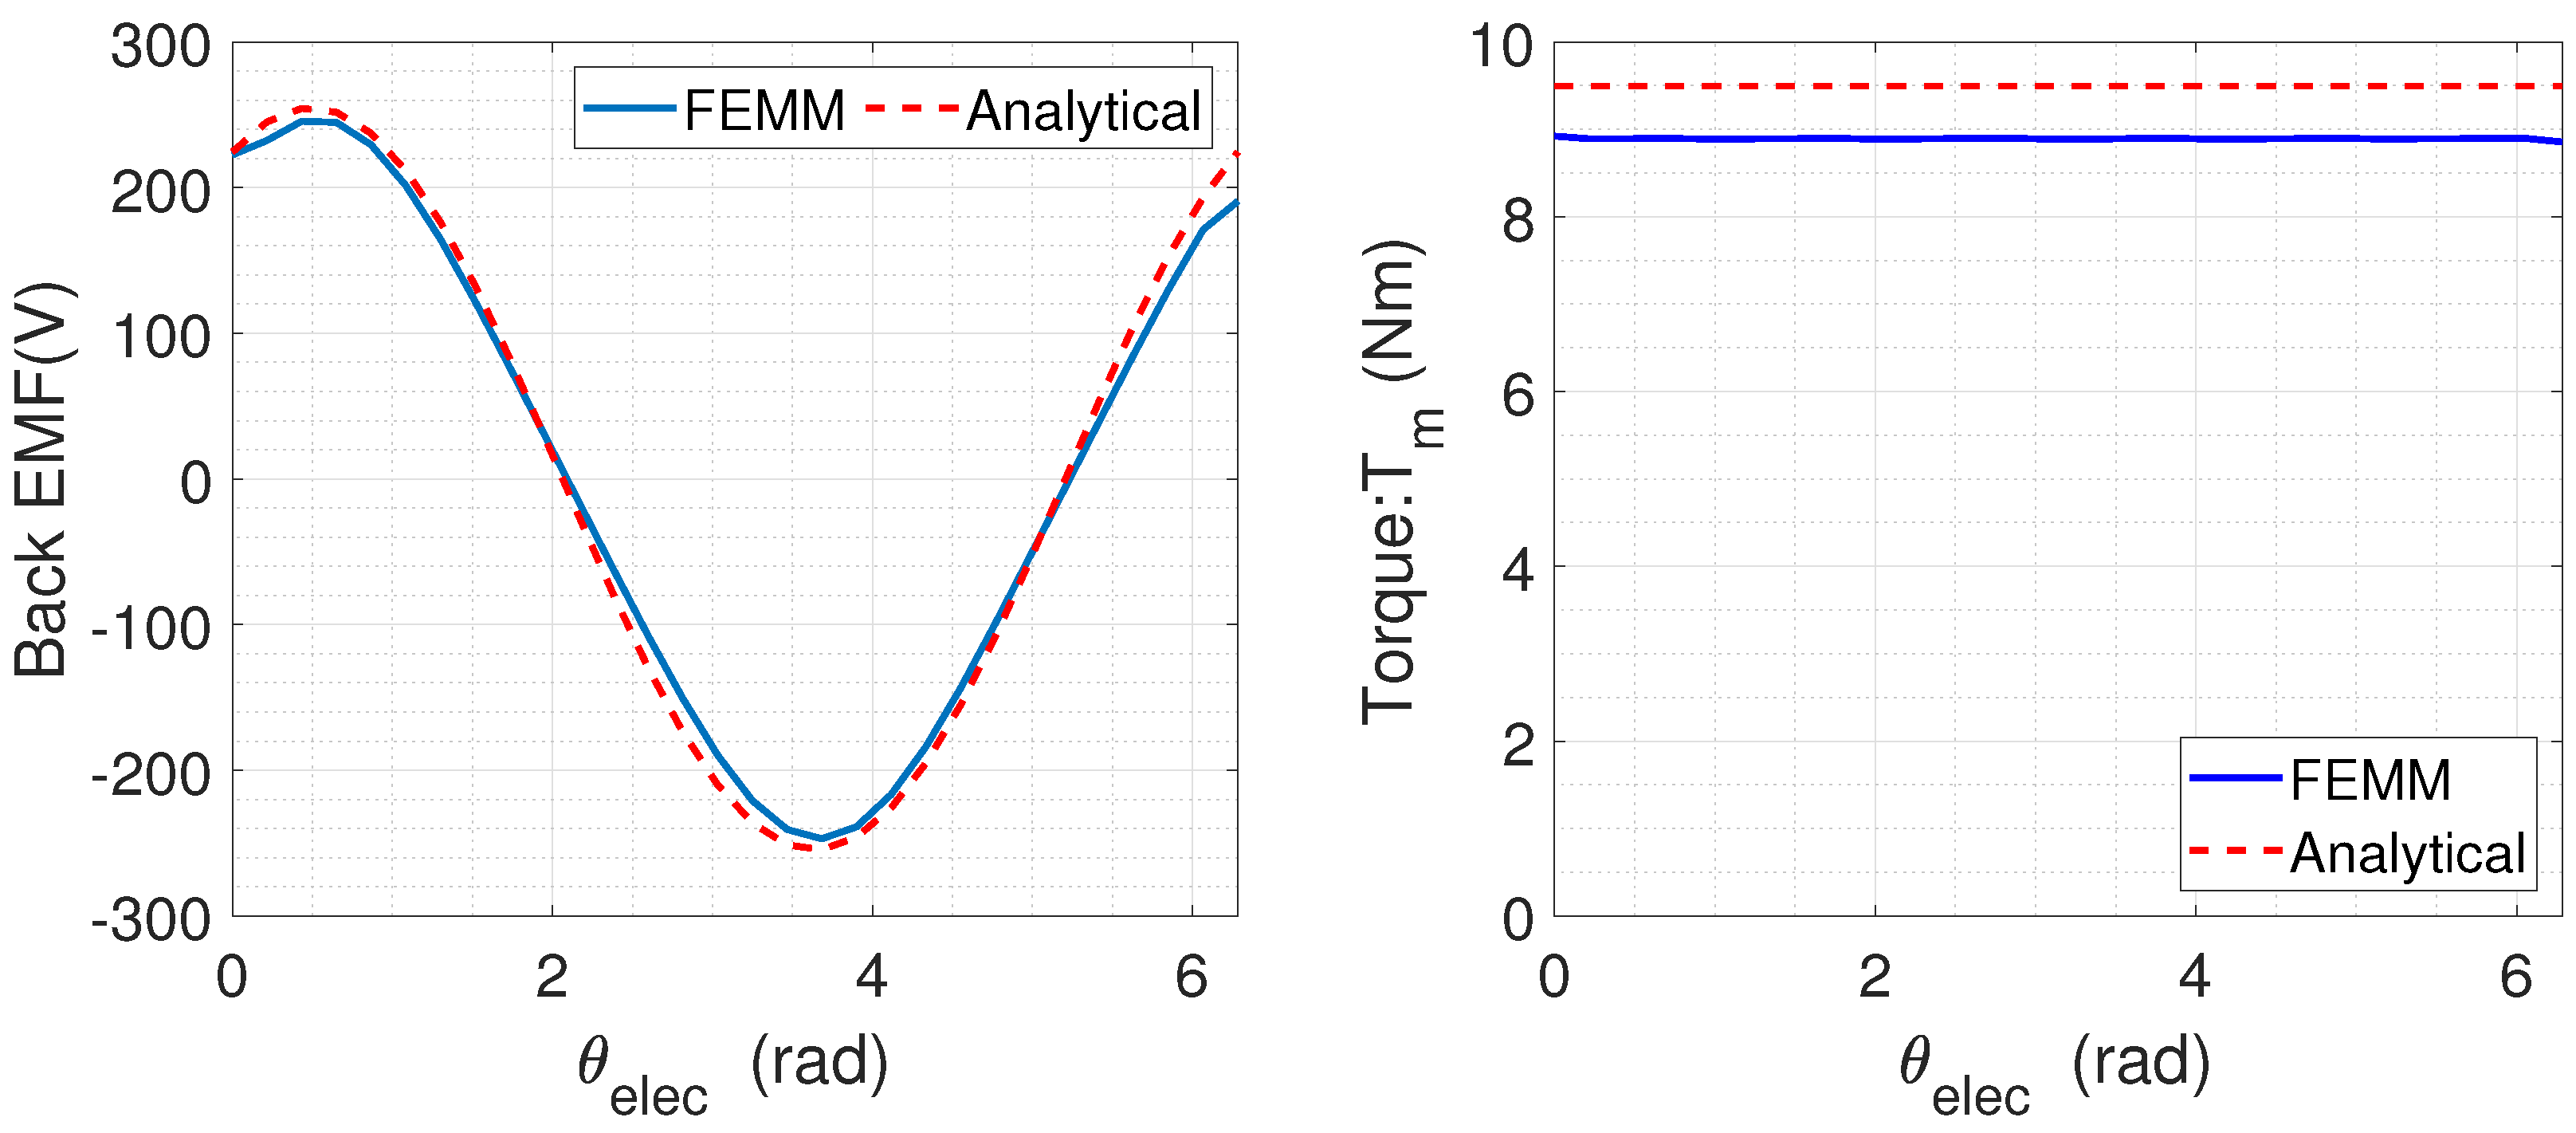
Figure 8 depicts the shape of the back-electromotive forces (EMFs) under no-load conditions at a speed of 5000 rpm along with the waveform of the electromagnetic torque. The torque waveform corresponds to when the currents are in phase with the EMFs, which is achieved through vector control in maximum torque per ampere (MTPA) mode (
,
A), representing 75% of the rated power.
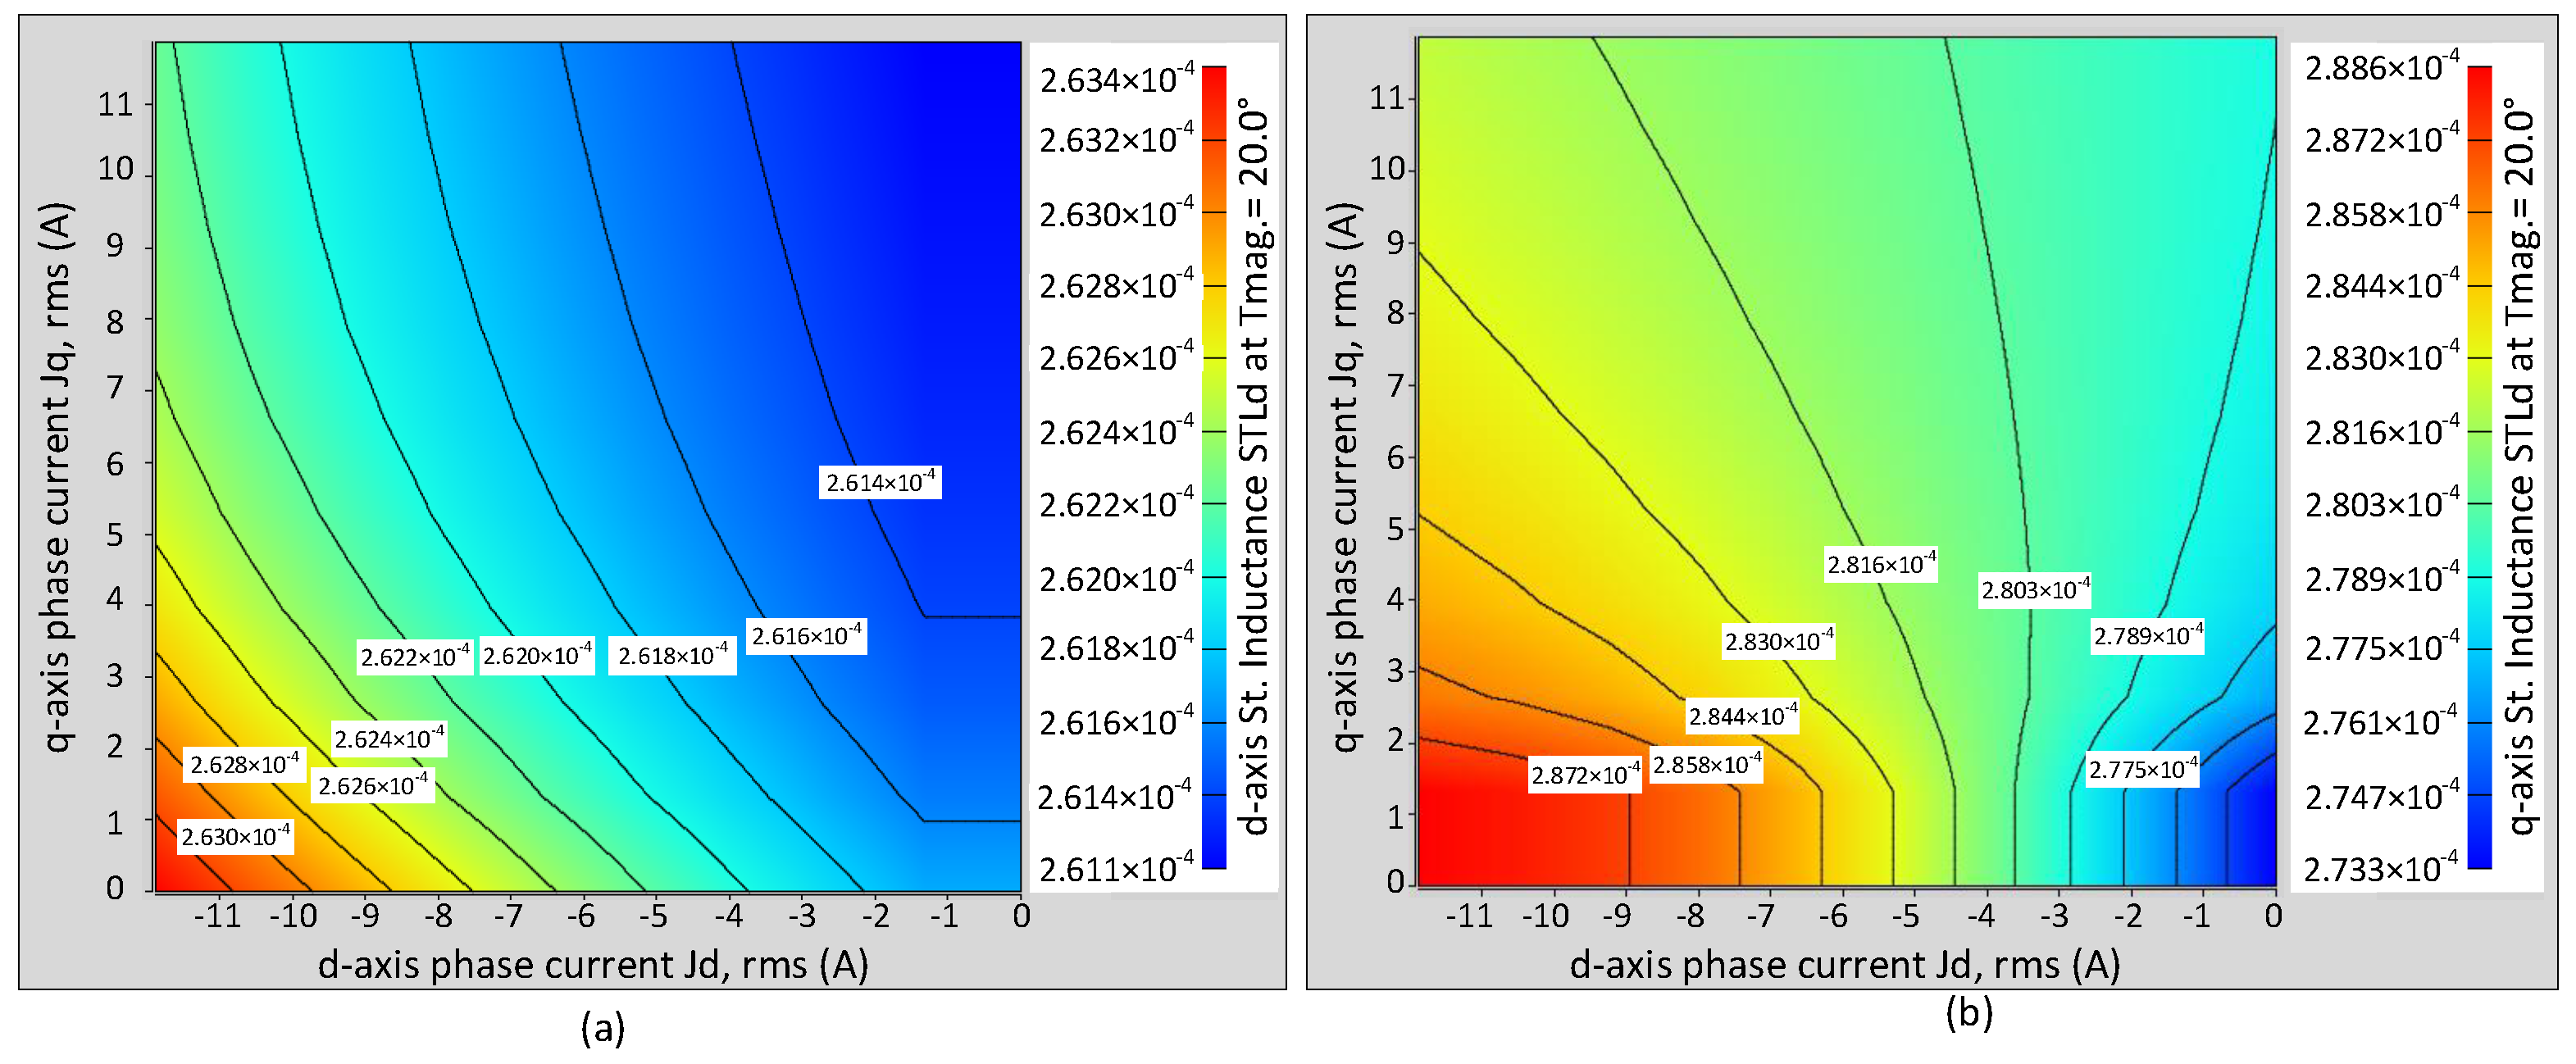
Finite element analysis (FEA) facilitates the identification of crucial machine parameters: particularly, the inductances
and
. These inductances are observed to be nearly identical and demonstrate minimal sensitivity to variations in stator currents (
and
mH), as shown in
Figure 9. This slight difference is mainly due to a higher saturation level in the d-axis due to the auxiliary flux with the rotor magnet. The design objective for this machine prioritized maintaining constant parameters relative to stator currents with the aim of simplifying control implementation and reducing the CPU time required for regulation loops. This emphasis on swift control execution proves essential, especially when dealing with very high switching frequencies (up to 100 kHz) at the highest speeds.
5. Simulation and Experimental Results
In this section, we delve into the modeling and experimental implementation of a high-frequency permanent magnet synchronous motor (PMSM) powered by an inverter. The objective is to investigate the impact of frequency (both switching and fundamental) on the inverter’s performance. To achieve this, three distinct inverters are designed, built, and tested; each is constructed with different components: IGBT, Fast IGBT, and SiC-MOSFET, with detailed parameters outlined in
Table 3. The drivers that are used for the IGBTs and the SiC-MOSFET are SKHI23/12R and CGD15FB45P1, respectively.
The system is powered by a Lambda-TDK
, 6000 W DC source and is managed through a dSPACE MicroLabBox DS1202. Typically, the MicroLabBox is programmed using the ControlDesk 2022-B software from dSPACE, which is constrained to generate higher switching frequencies. To circumvent this limitation, dSPACE offers the Real-Time Library (RTLib): a C runtime library functioning as a sublayer of RTI. This allows users to directly code in C language and utilize RTLib functions to access the DSP board hardware, granting full control over program execution on the DSP board. In this paper, we employ this approach to implement essential components of field-oriented control to incorporate high-frequency PWM and sampling rates ranging from 100 to 200 kHz to efficiently drive motors and power electronics. For further details, refer to [
22].
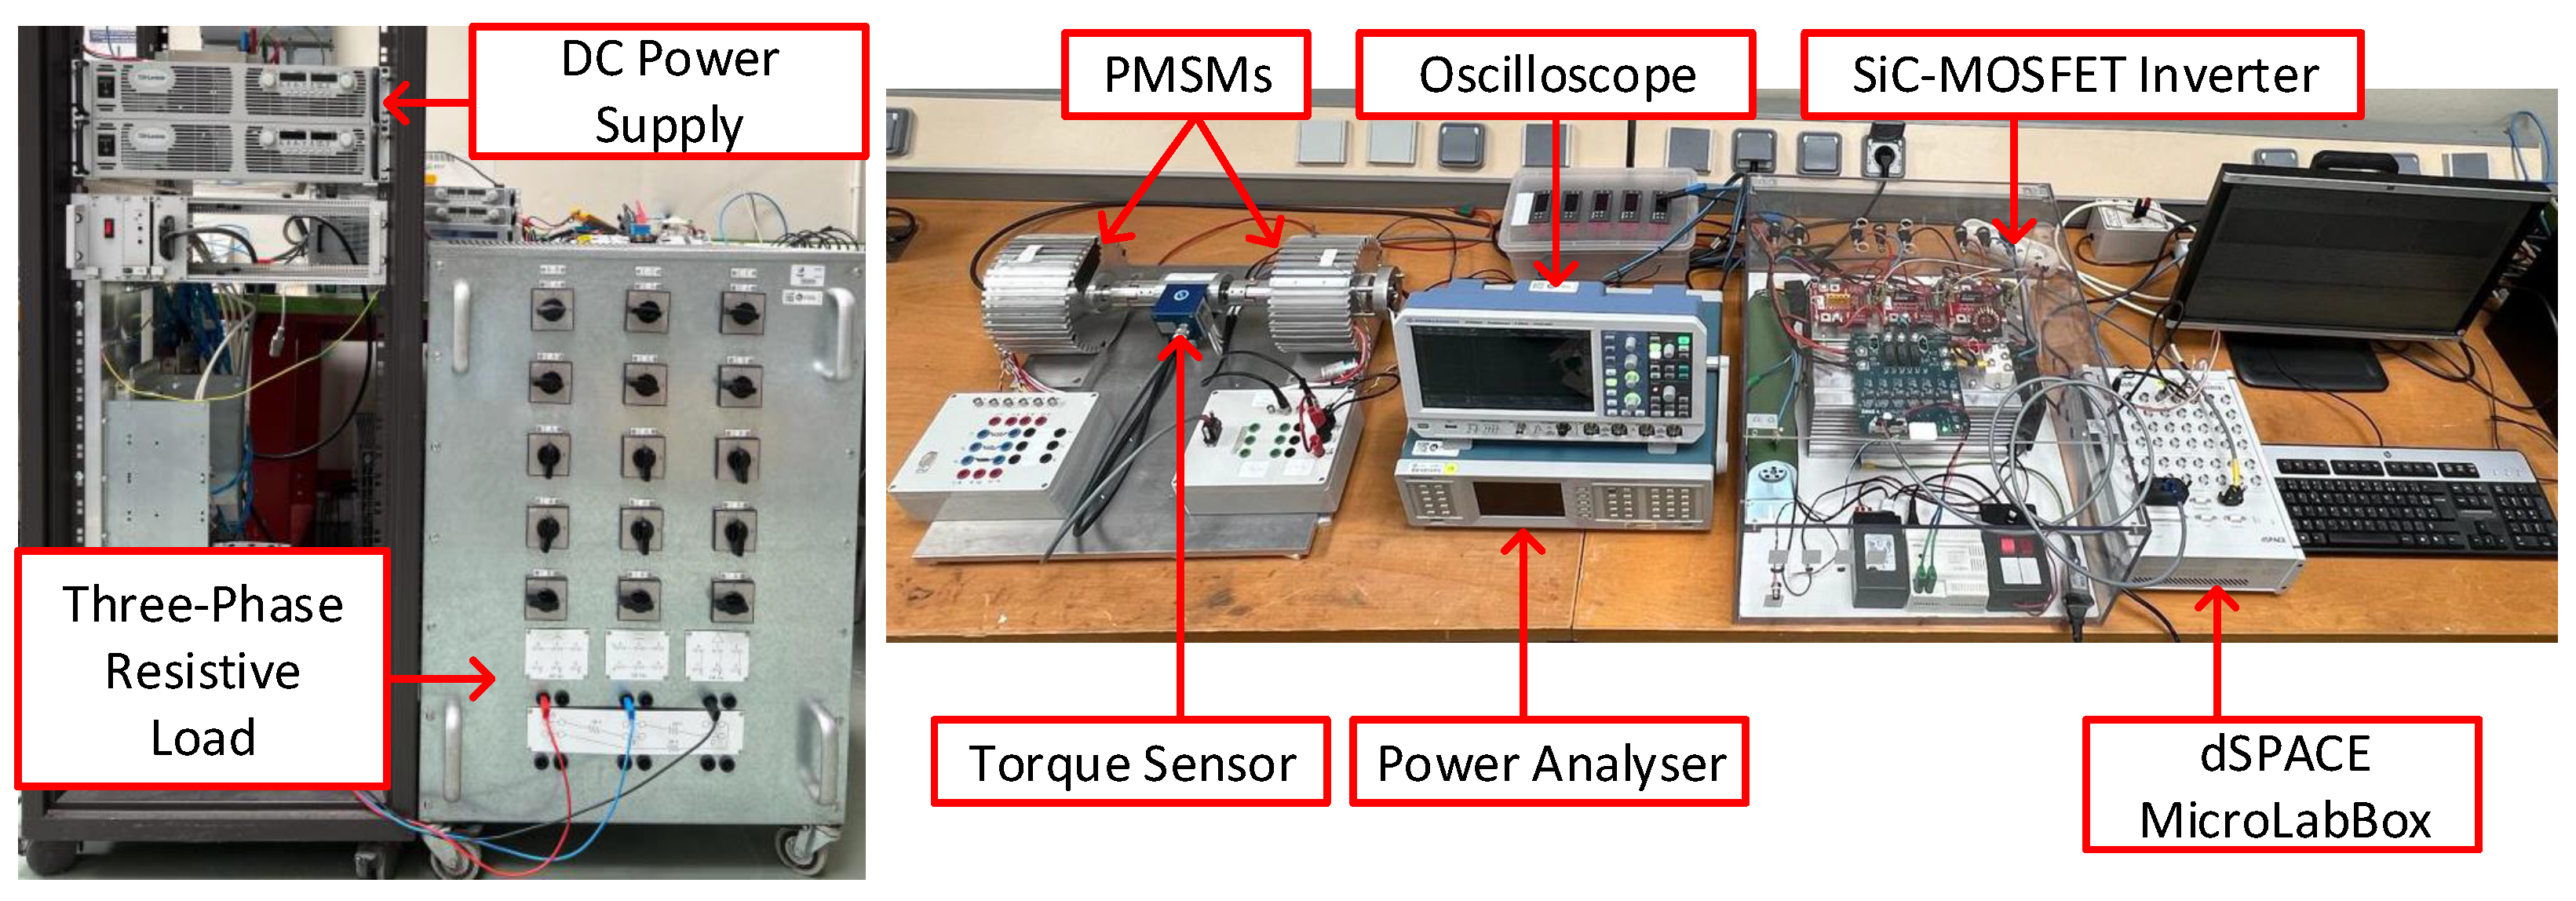
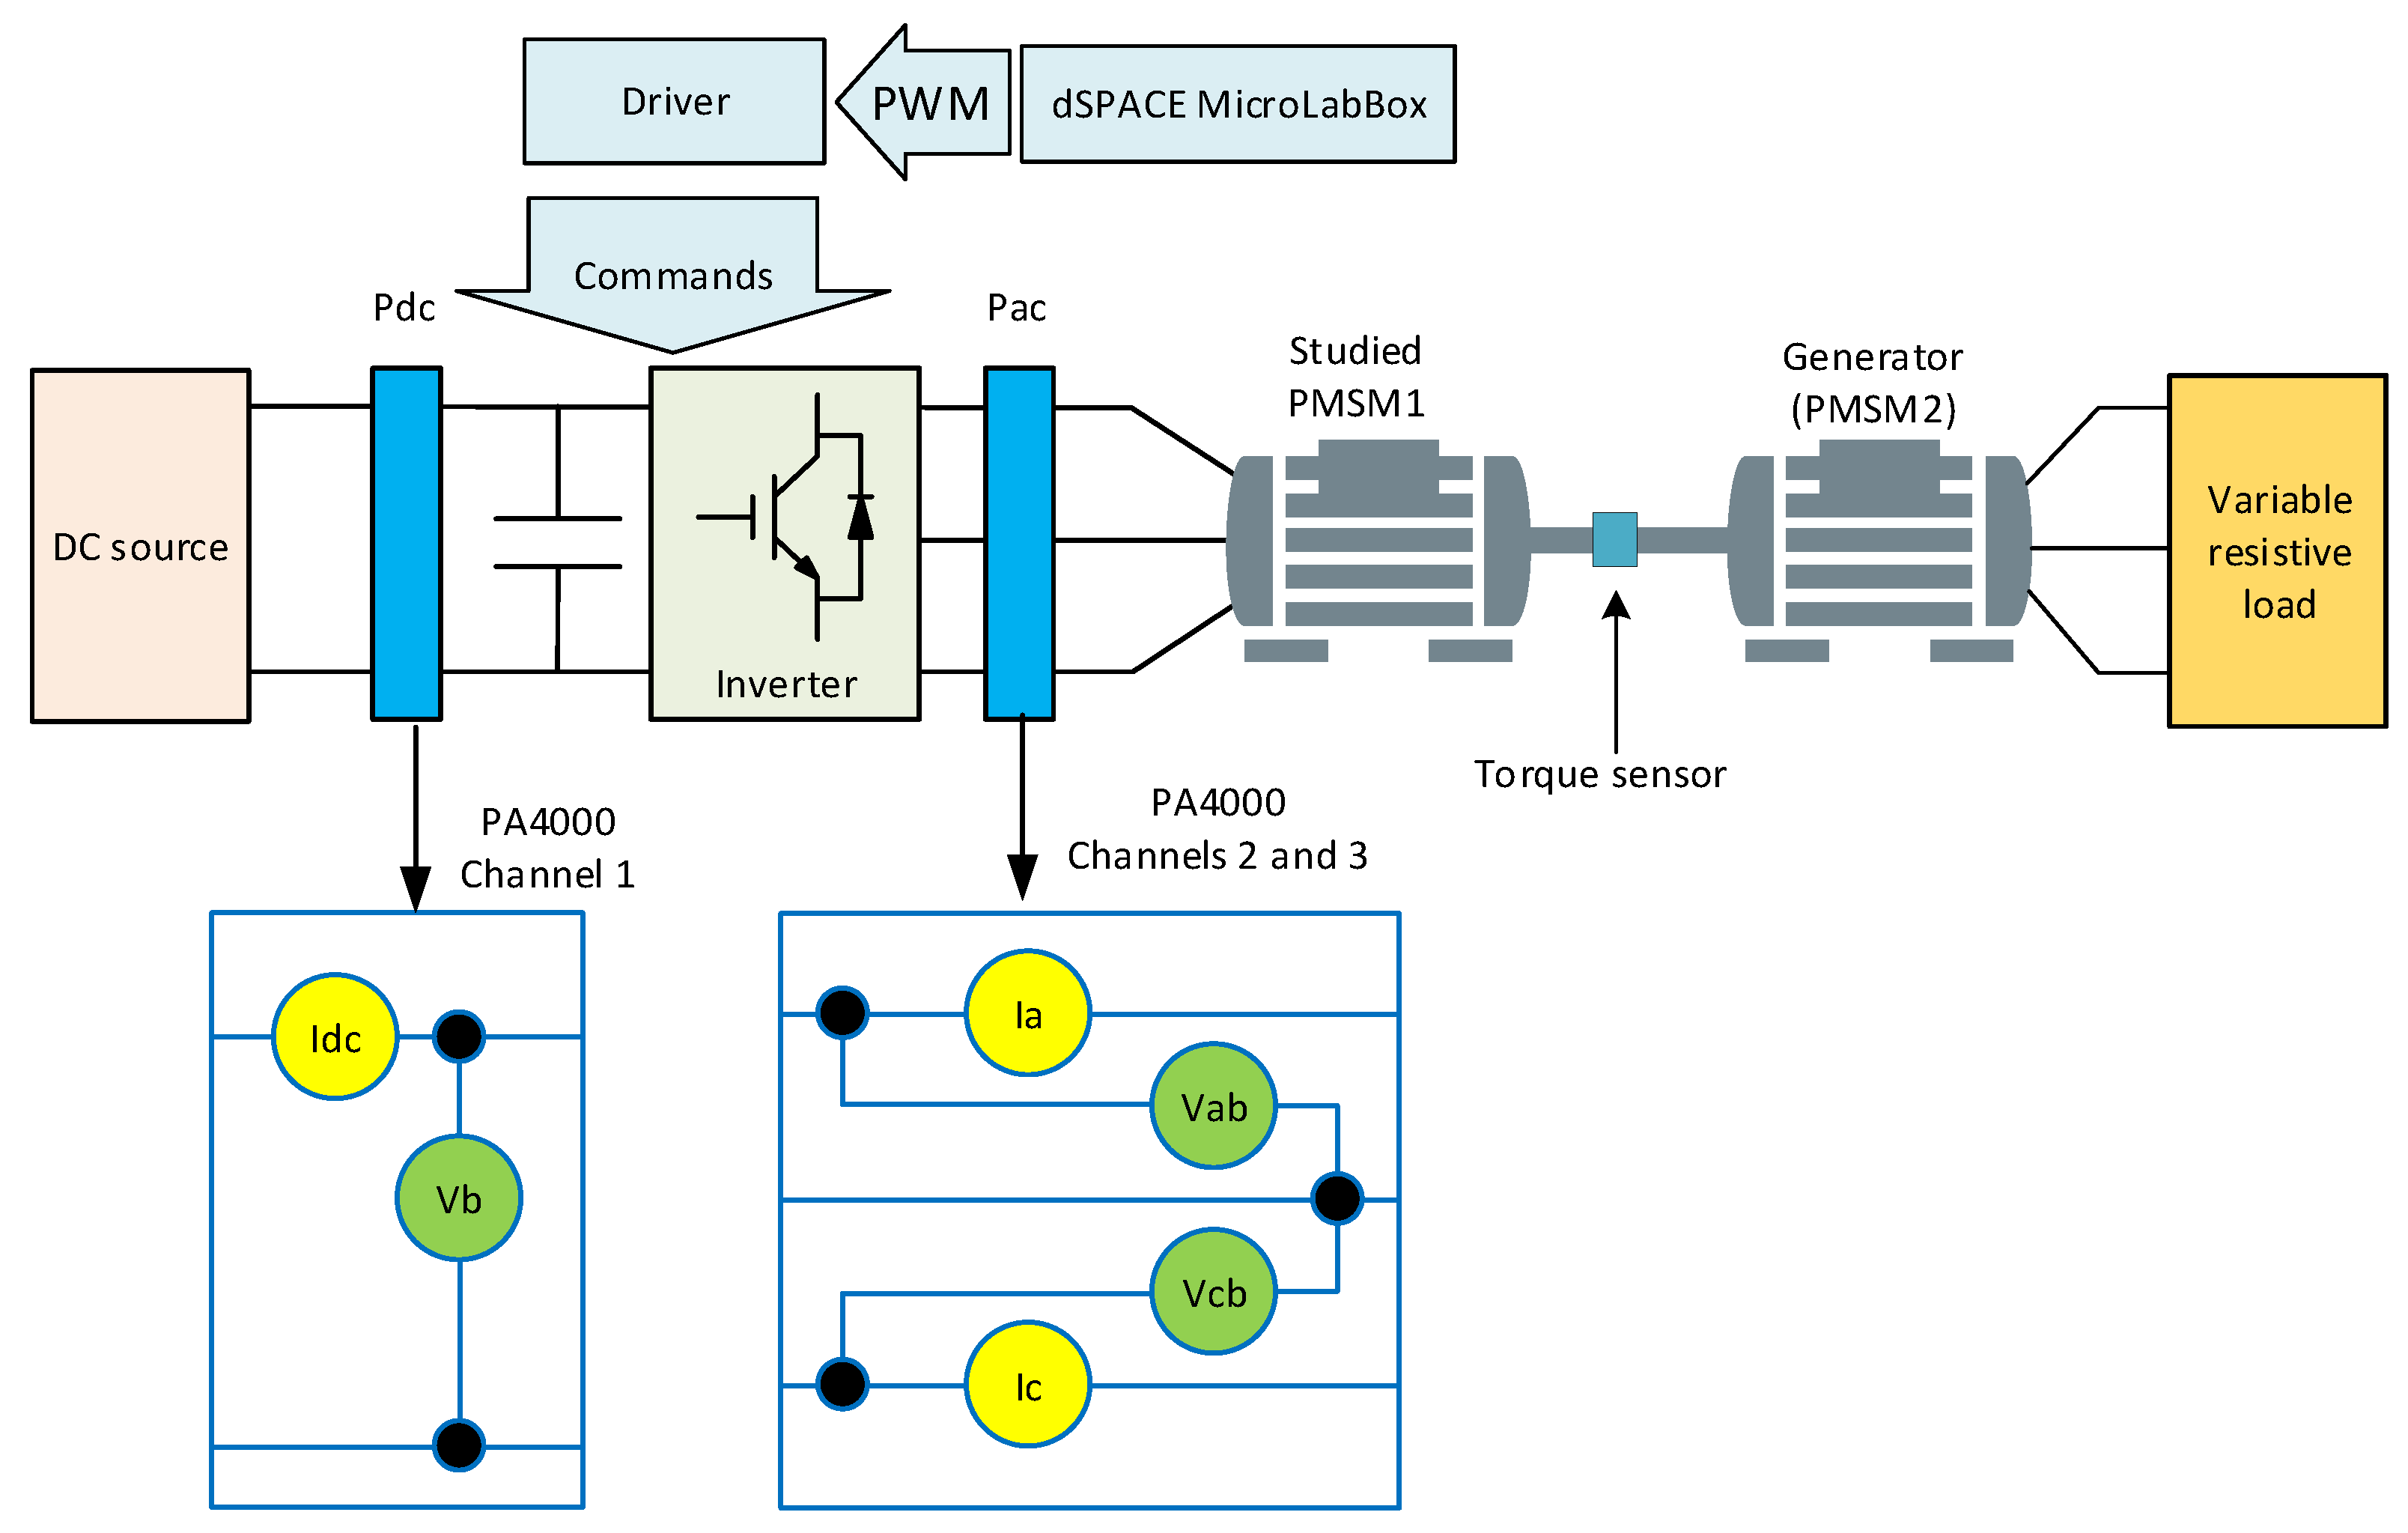
Regarding the motor setup, we utilize two identical permanent magnet machines. One operates in motor mode, while the other acts as a generator connected to a three-phase resistive load, thereby serving as a load for the system under test. Positioned between the two permanent magnet machines is a torque meter, designated as , which accurately measures the torque exerted on the shaft. Additionally, the electrical power consumption of both the machine and inverter is meticulously monitored using a power analyzer: specifically, the Tektronix PA4000 model (Tektronix, Beaverton, OR, USA).
The experimental setup used to validate the drive of the PMSM at high frequencies is illustrated in
Figure 15.
5.1. Inverter Losses and Efficiency Measurement
In this section, the results from the measurements of the losses and efficiency of each inverter are compared with those obtained from the analytical model shown in Equation (
42), with the increase in switching frequency taken into account. The tests were conducted according to the diagram shown in
Figure 16. The characteristics and parameters of the IGBTs, such as their resistances and dissipated energy, depend on temperature. For example, the resistance of the IGBT,
, increases from
to
as the temperature
rises from
C to
C. Therefore, to improve the accuracy of the analytical model, the temperature at the power switch (
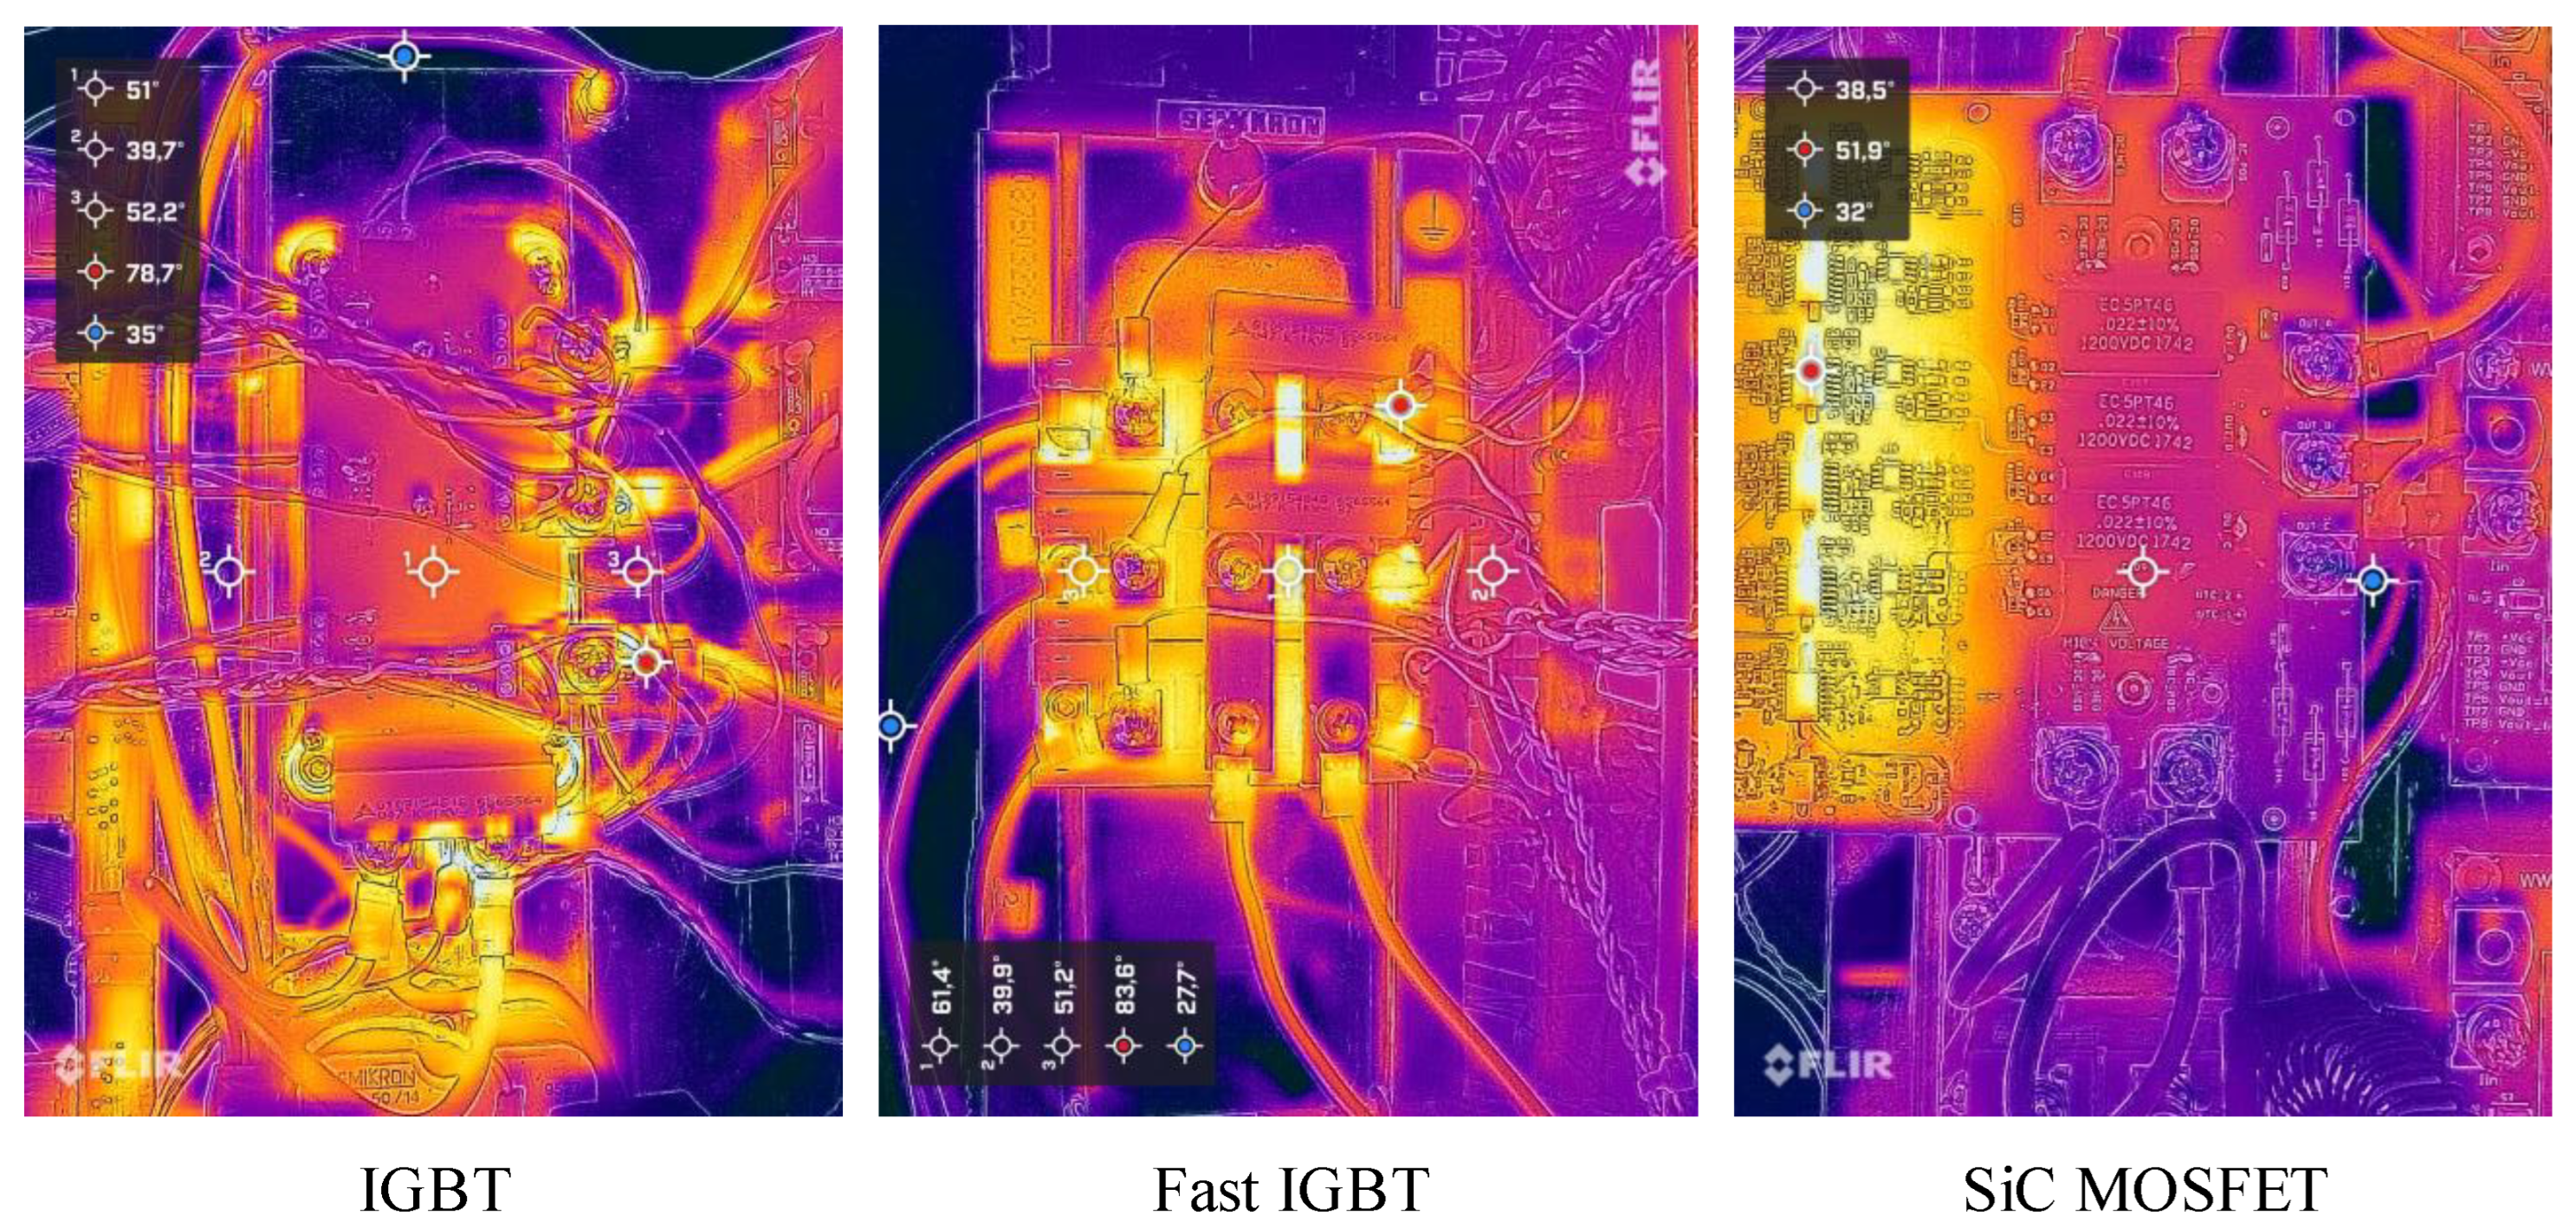
) is measured using a thermal camera (FLIR ONE
® Pro LT (Täby, Sweden)) to determine the switching losses, as indicated in Equation (
15). An example of the measured temperature for each inverter is illustrated in
Figure 17.
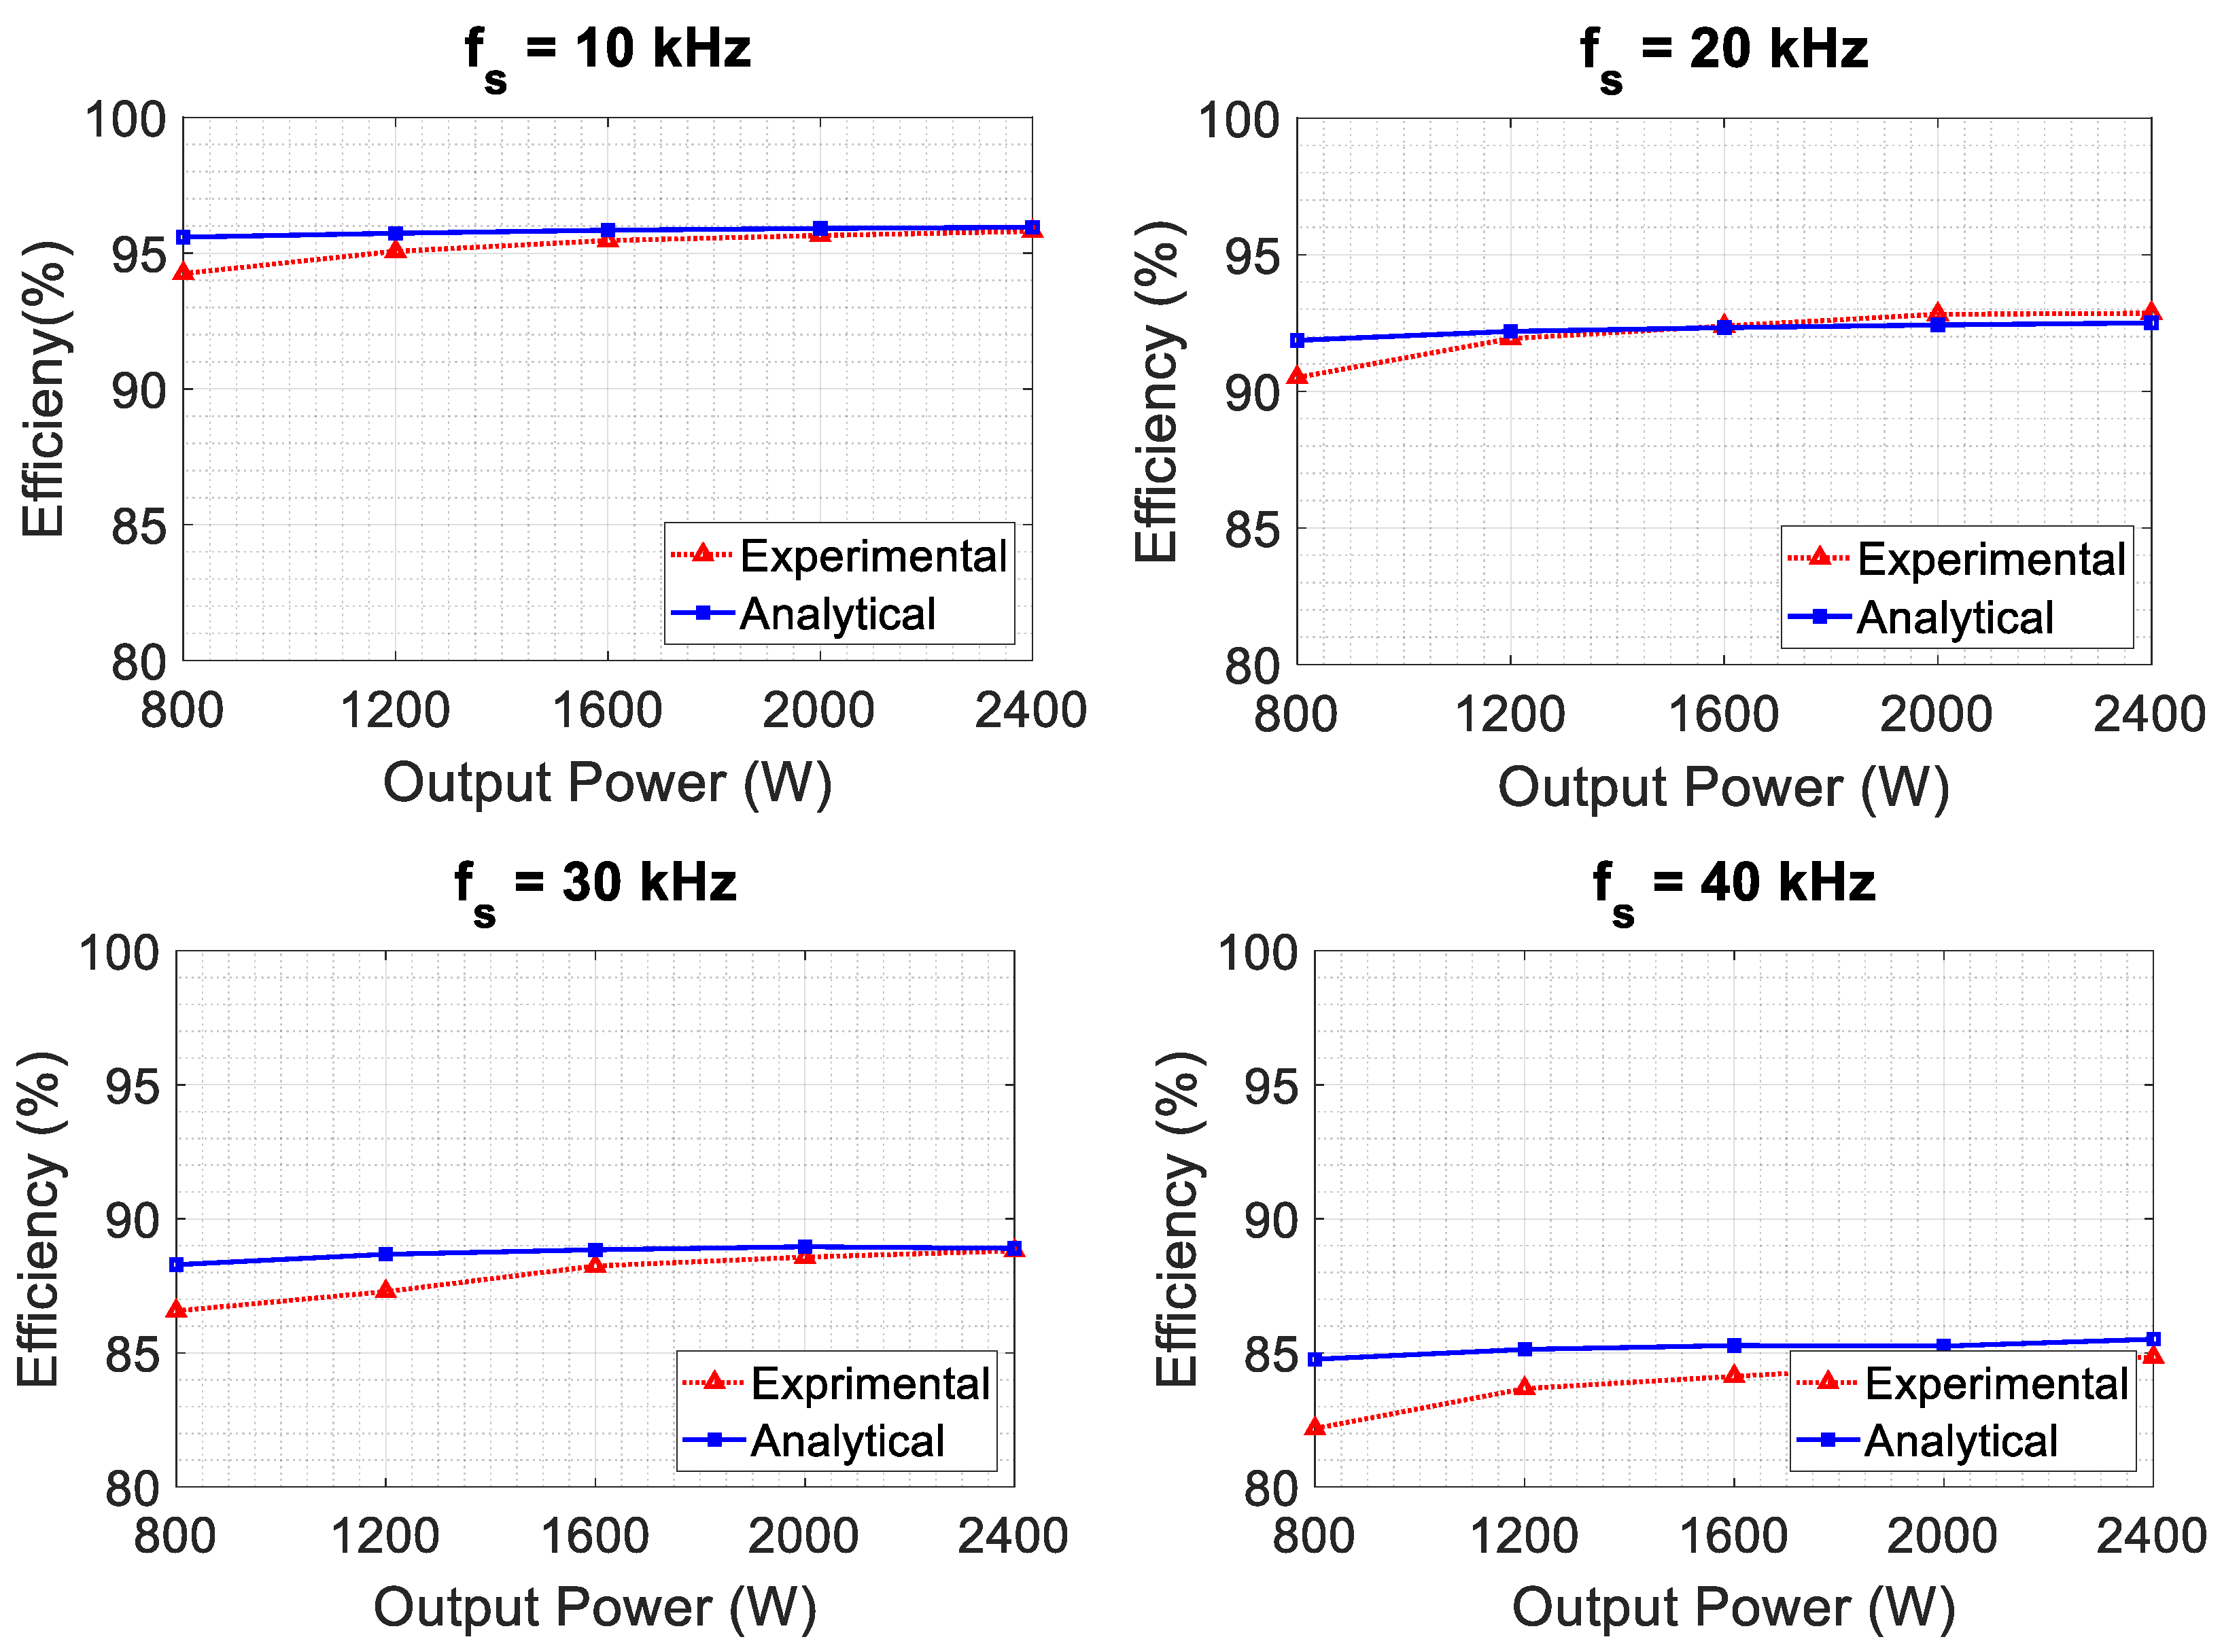
Figure 18,
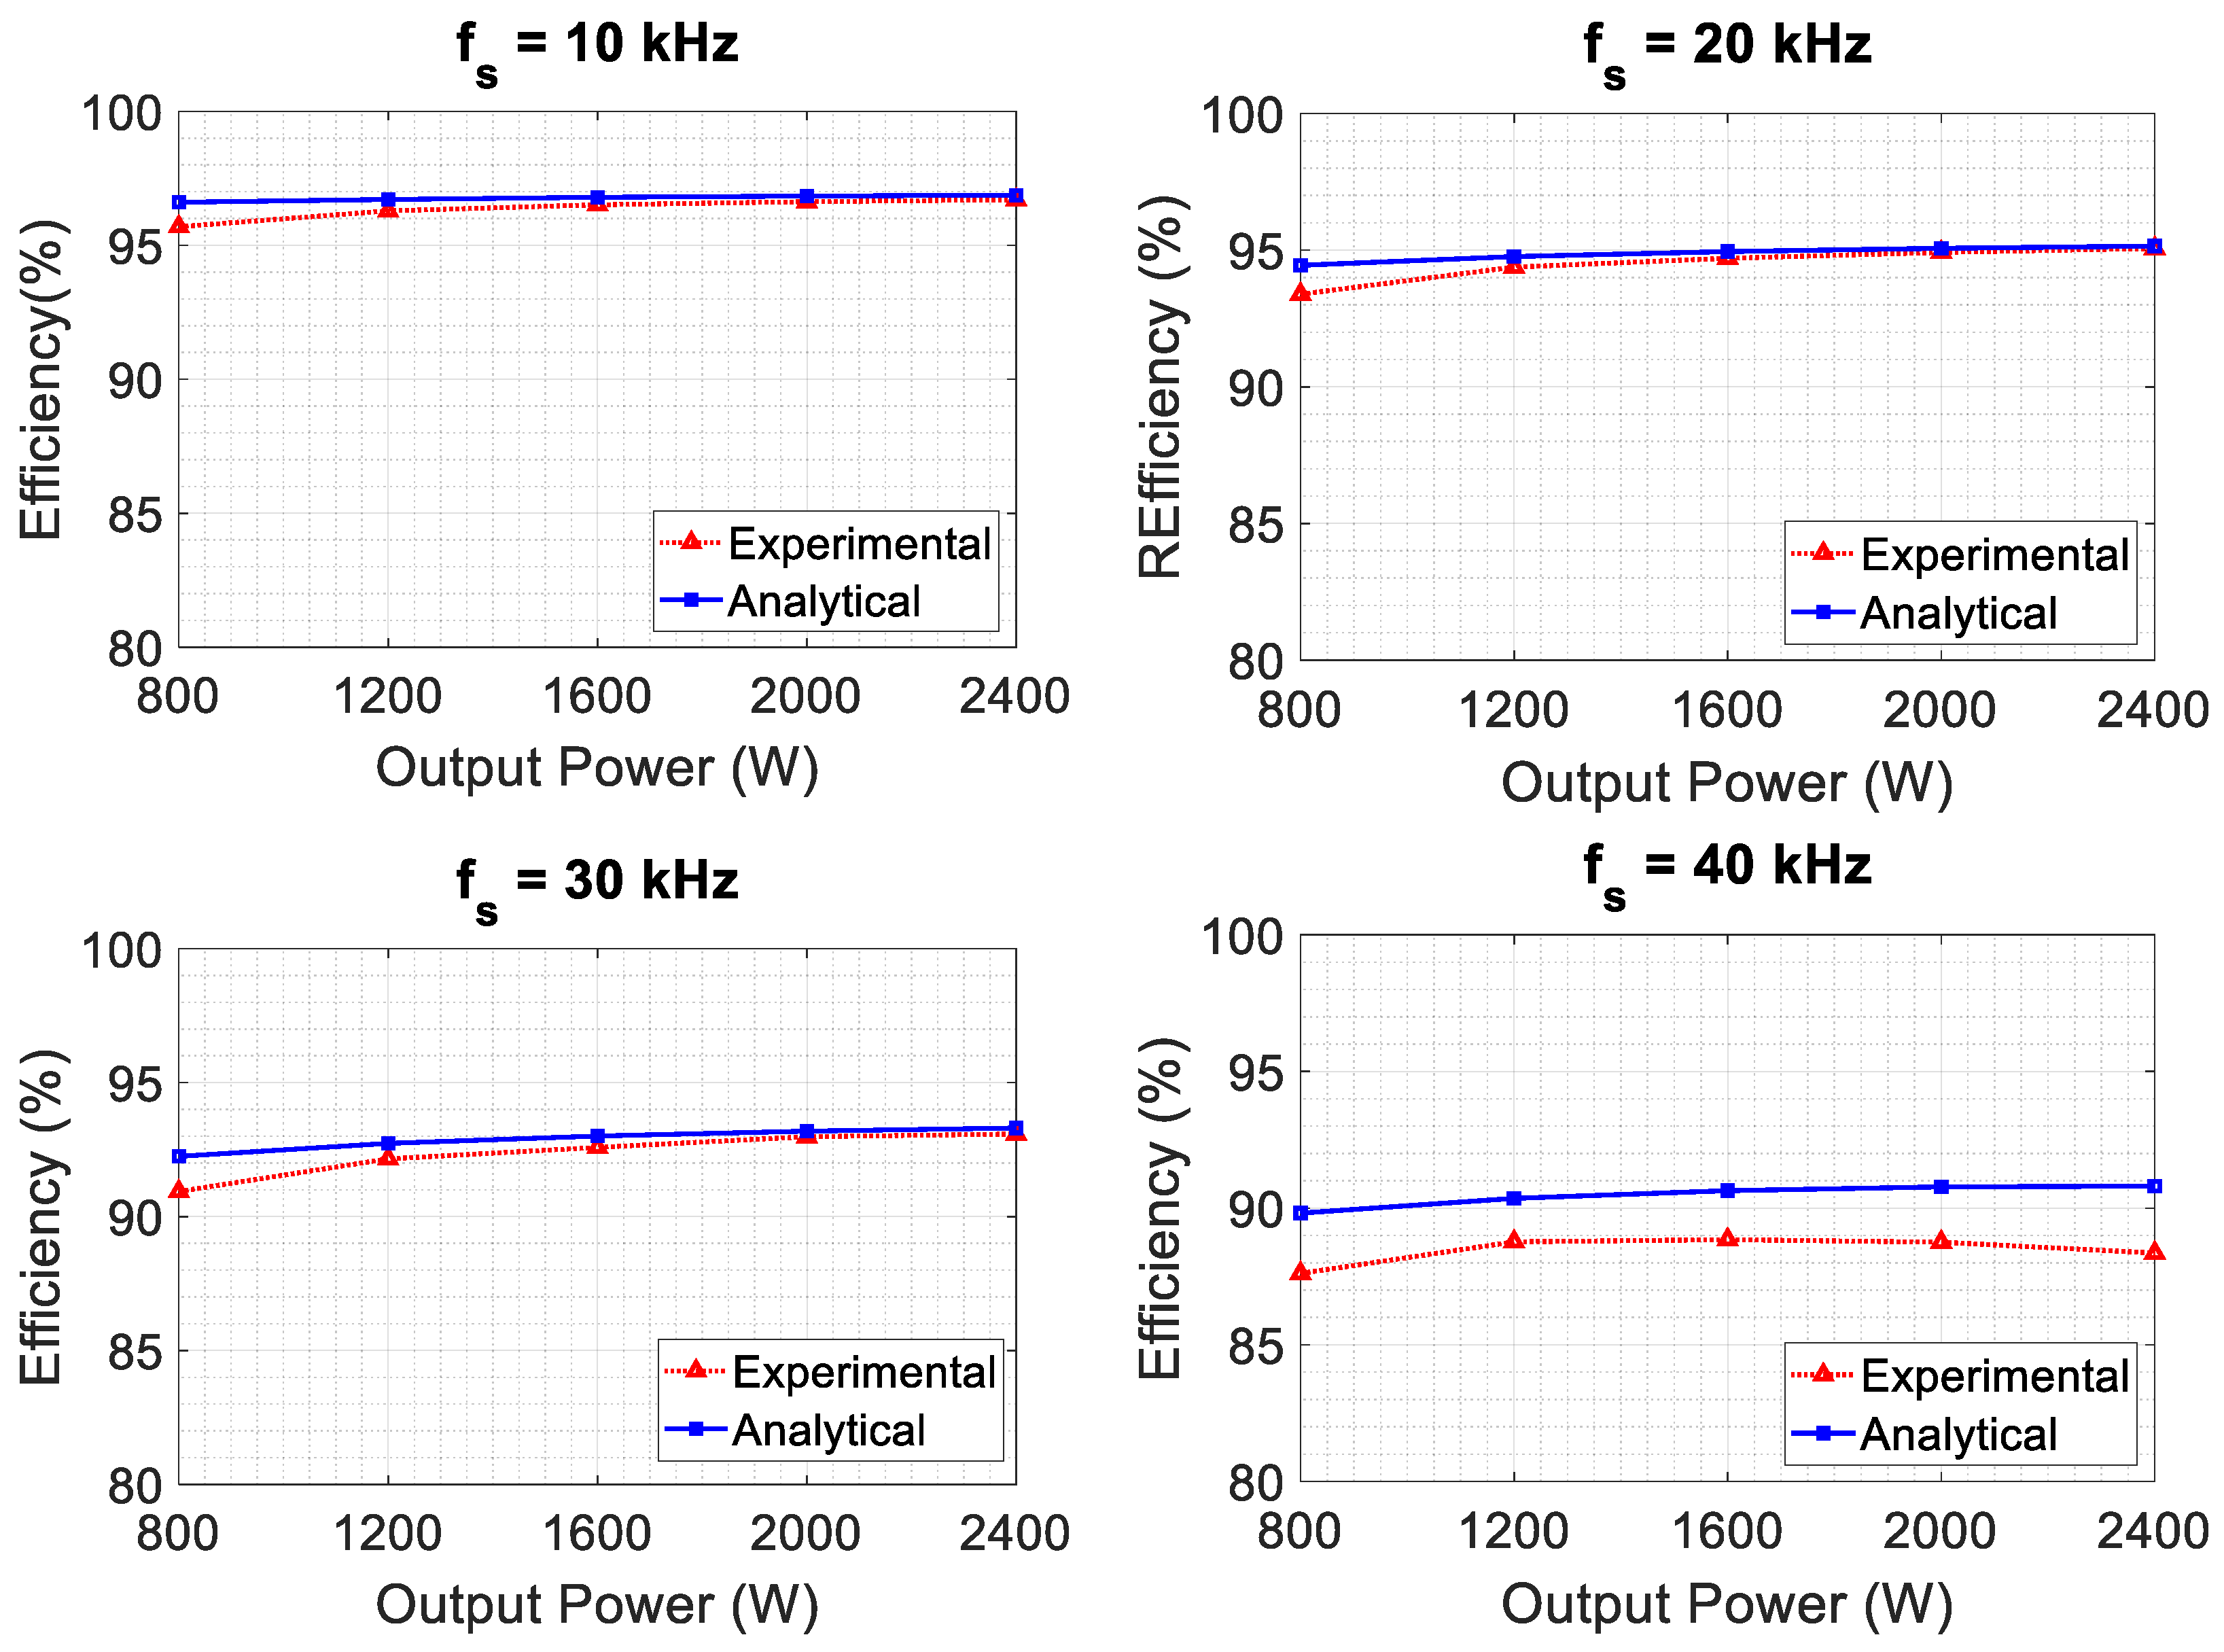
Figure 19 and
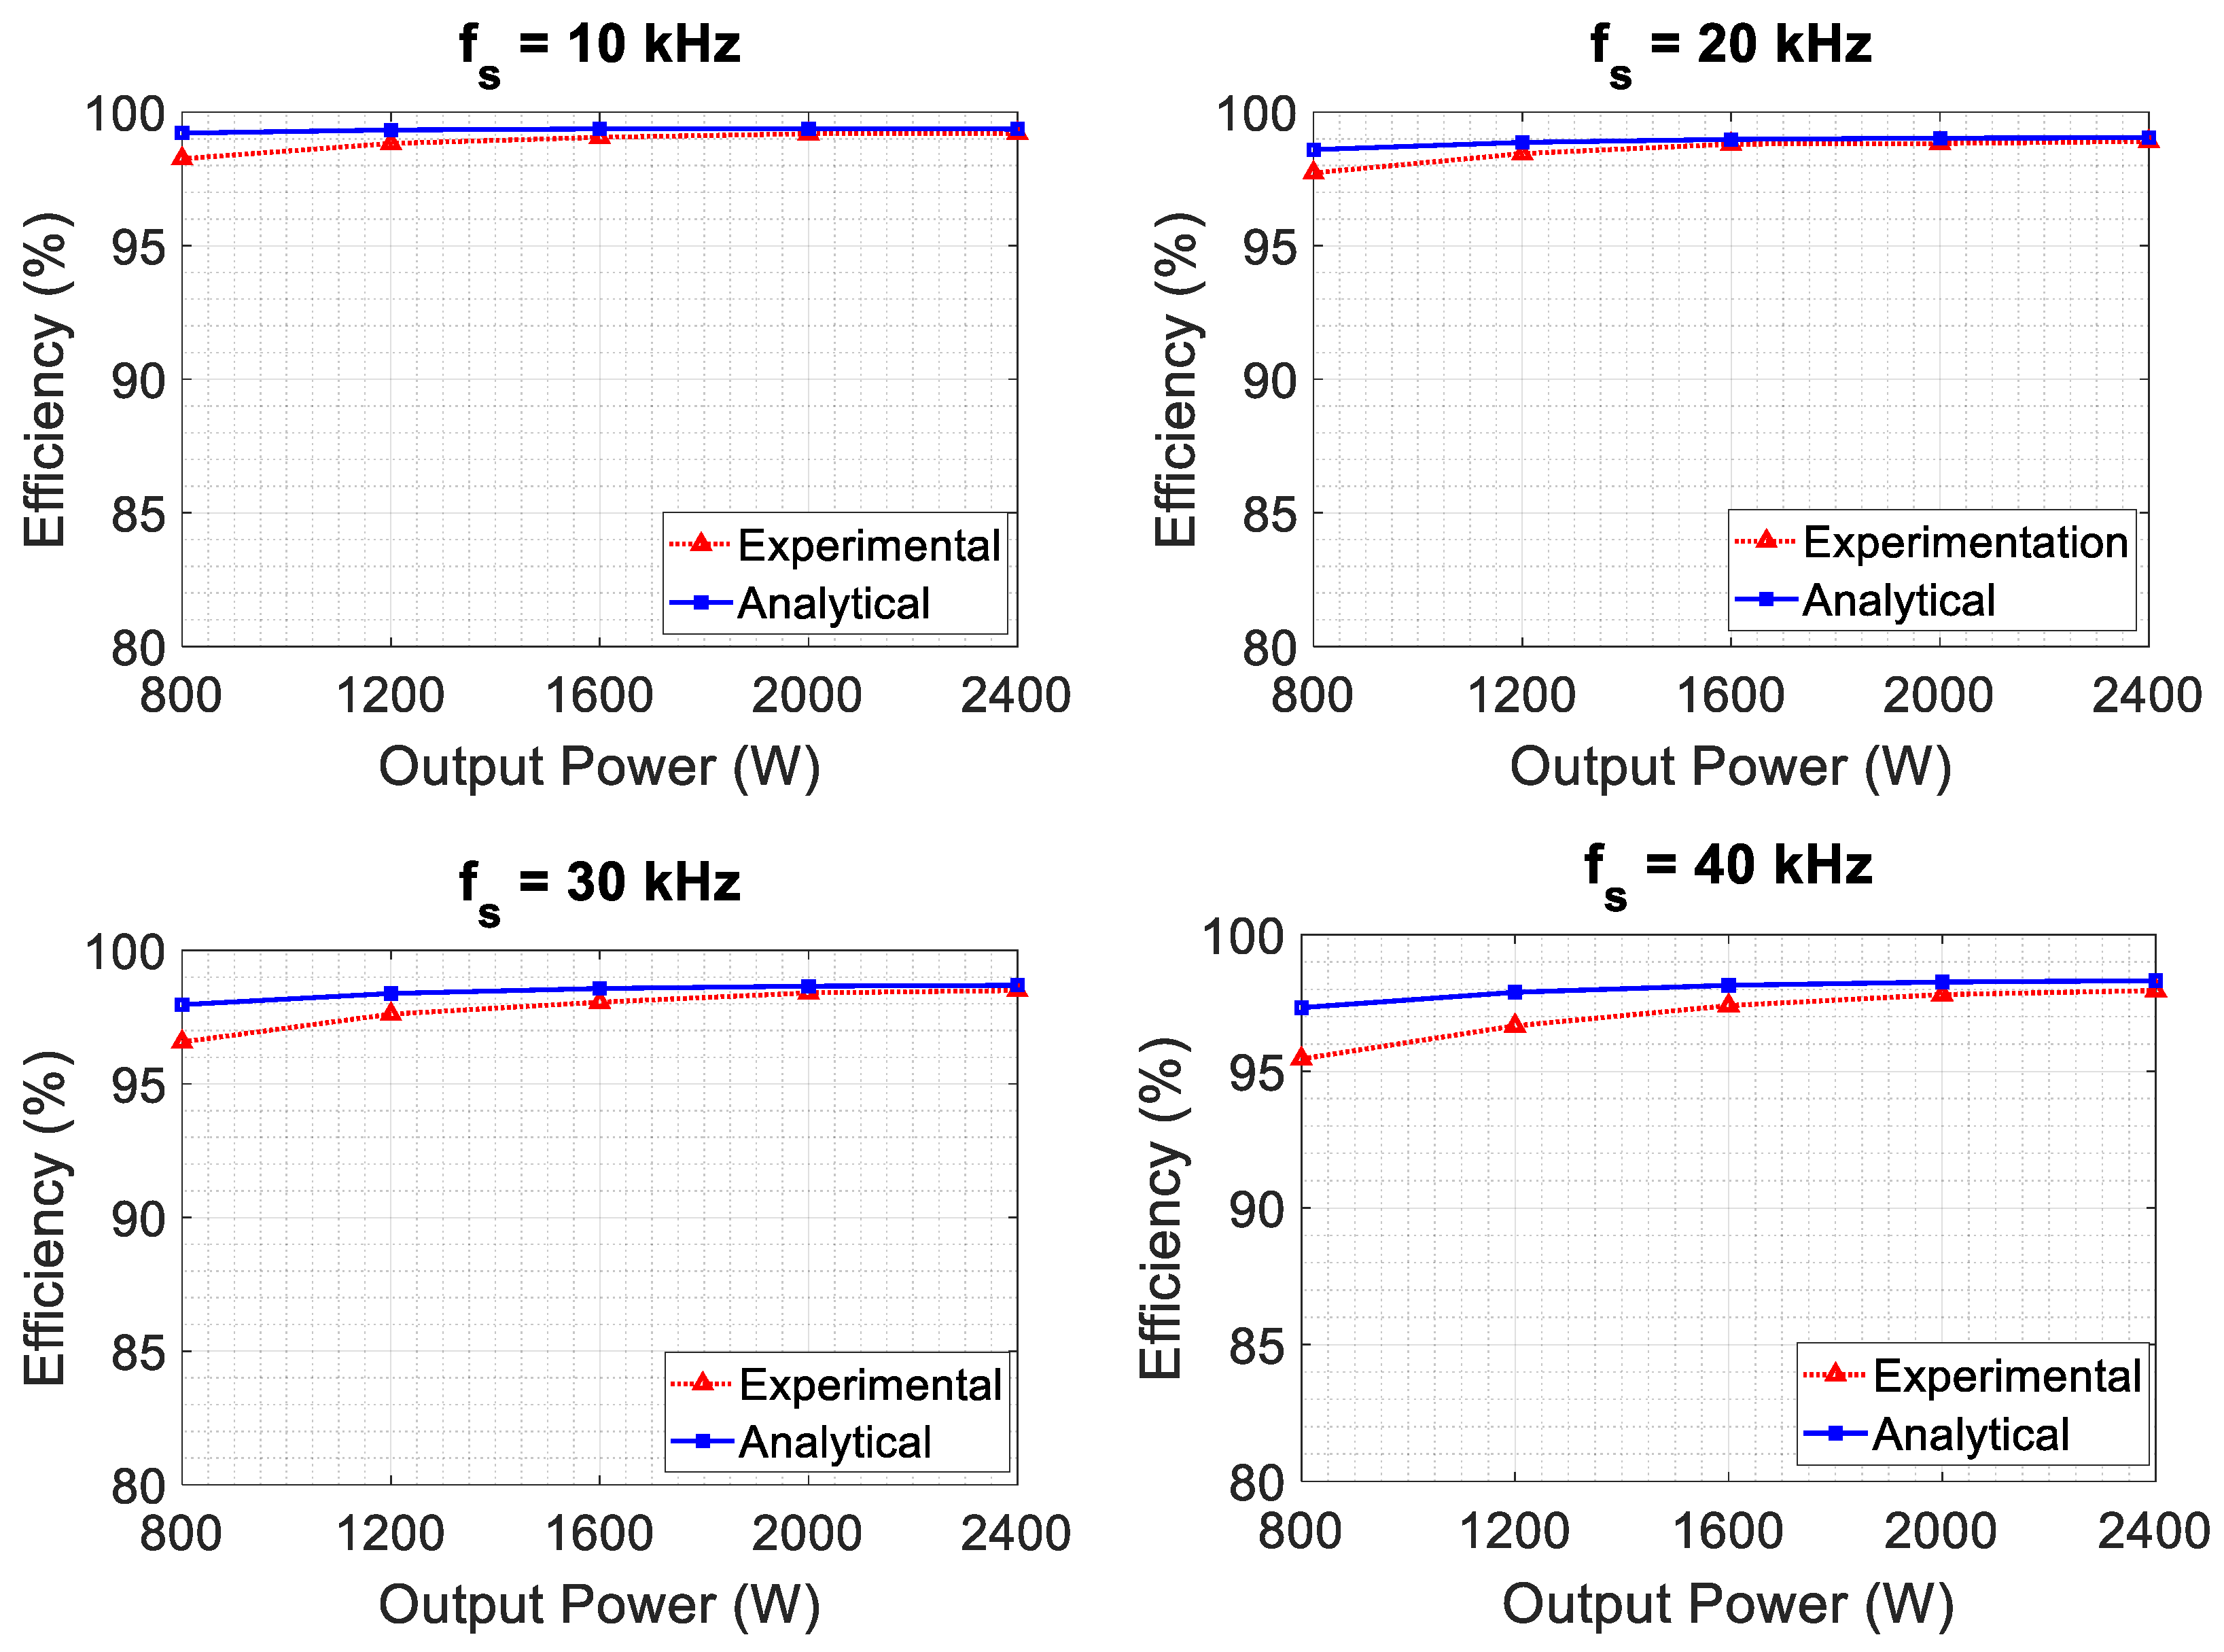
Figure 20 show a comparison of the efficiencies calculated by the analytical model and the measurements for the three inverters. It is observed that the losses are proportional to the power and that the efficiency of the inverter improves as the output power increases. For the IGBT inverter, a notable impact of the increase in PWM frequency on efficiency is observed, with efficiency dropping from 95.8% at full load and 10 kHz to less than 85% at 40 kHz for the same load.
In
Figure 19, it is evident that the model is less accurate at 40 kHz. Overall, and logically, given the superior performance of the components, the efficiency of the Fast IGBT inverter remains higher than that of the IGBT inverter.
Figure 20 illustrates the efficiency of the SiC-MOSFET inverter. Here, we observe that the efficiency obtained by the analytical model closely matches the measurements compared to the cases of the IGBT and Fast IGBT inverters. It is noteworthy that measurements become more challenging when losses are significantly lower. However, measurement errors are minimized thanks to the proper utilization of the PA4000 equipment (Beaverton, OR, USA).
5.2. Effect of Increasing Speed (Fundamental Frequency) on Current Distortion
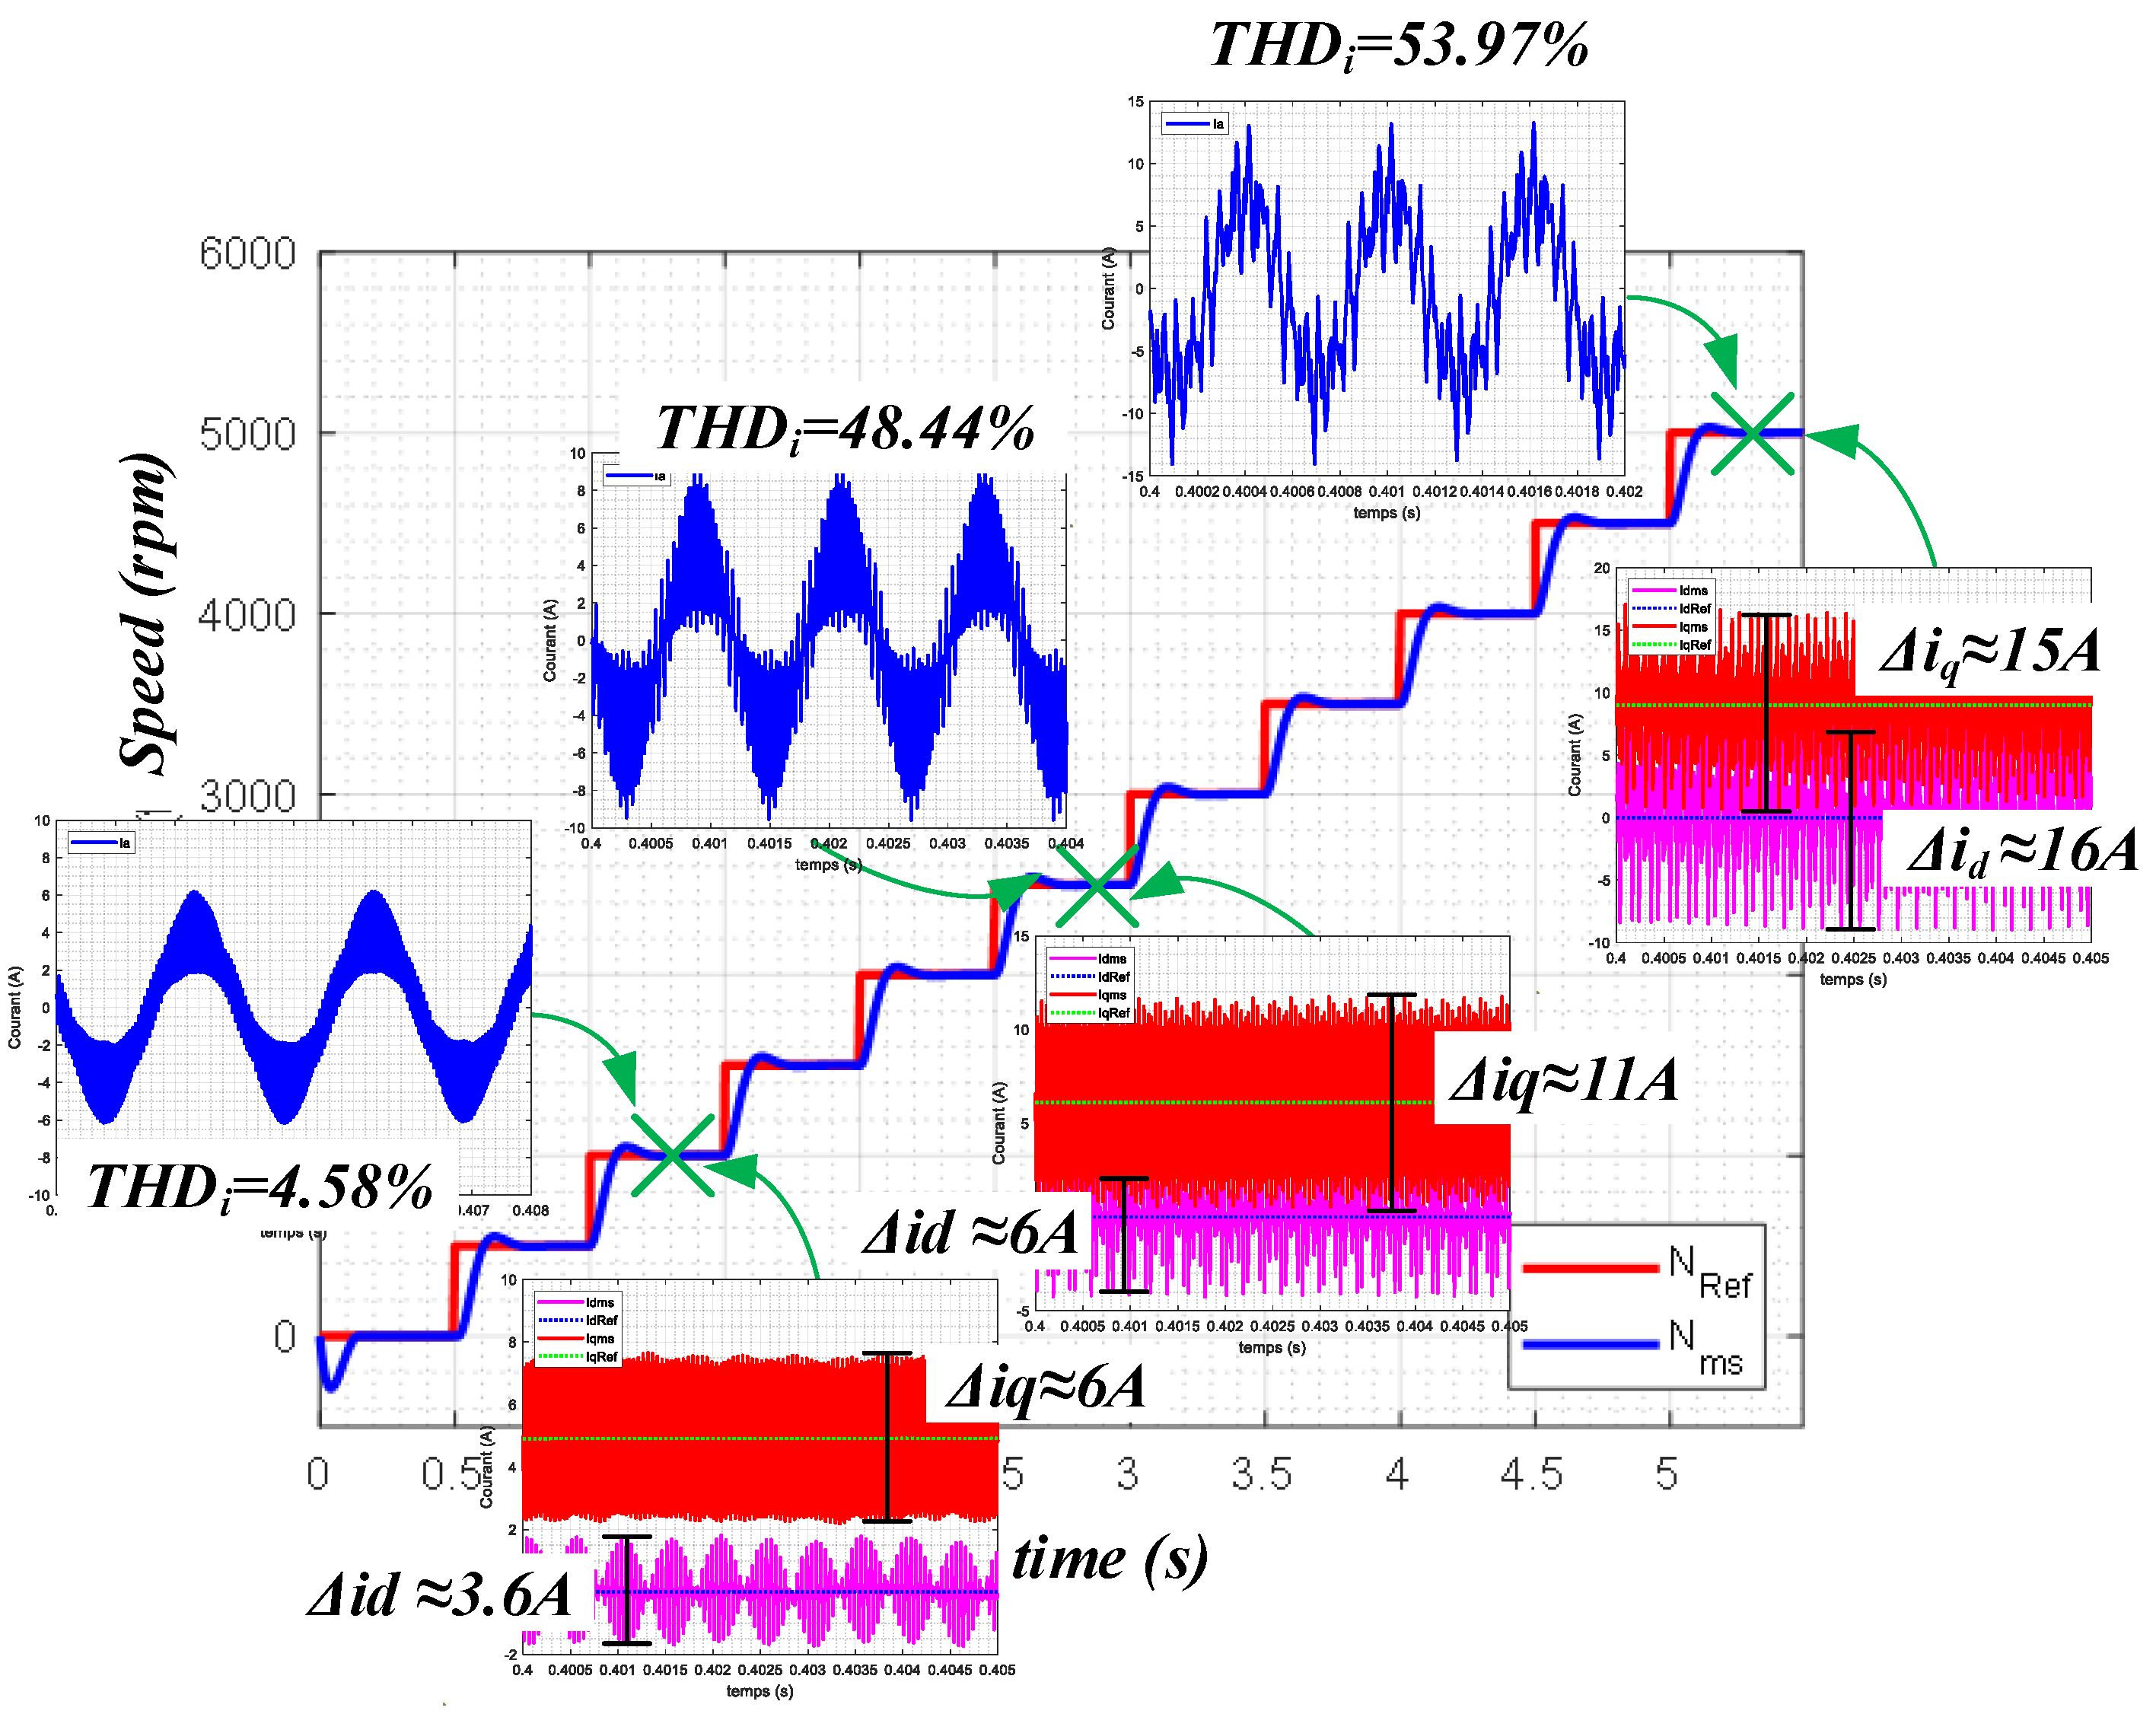
For this series of experimental tests, the PMSM is controlled by field-oriented control (FOC), where the current and speed are regulated by PI controllers. An increase in rotor speed results in ripple in the dq-axis currents (
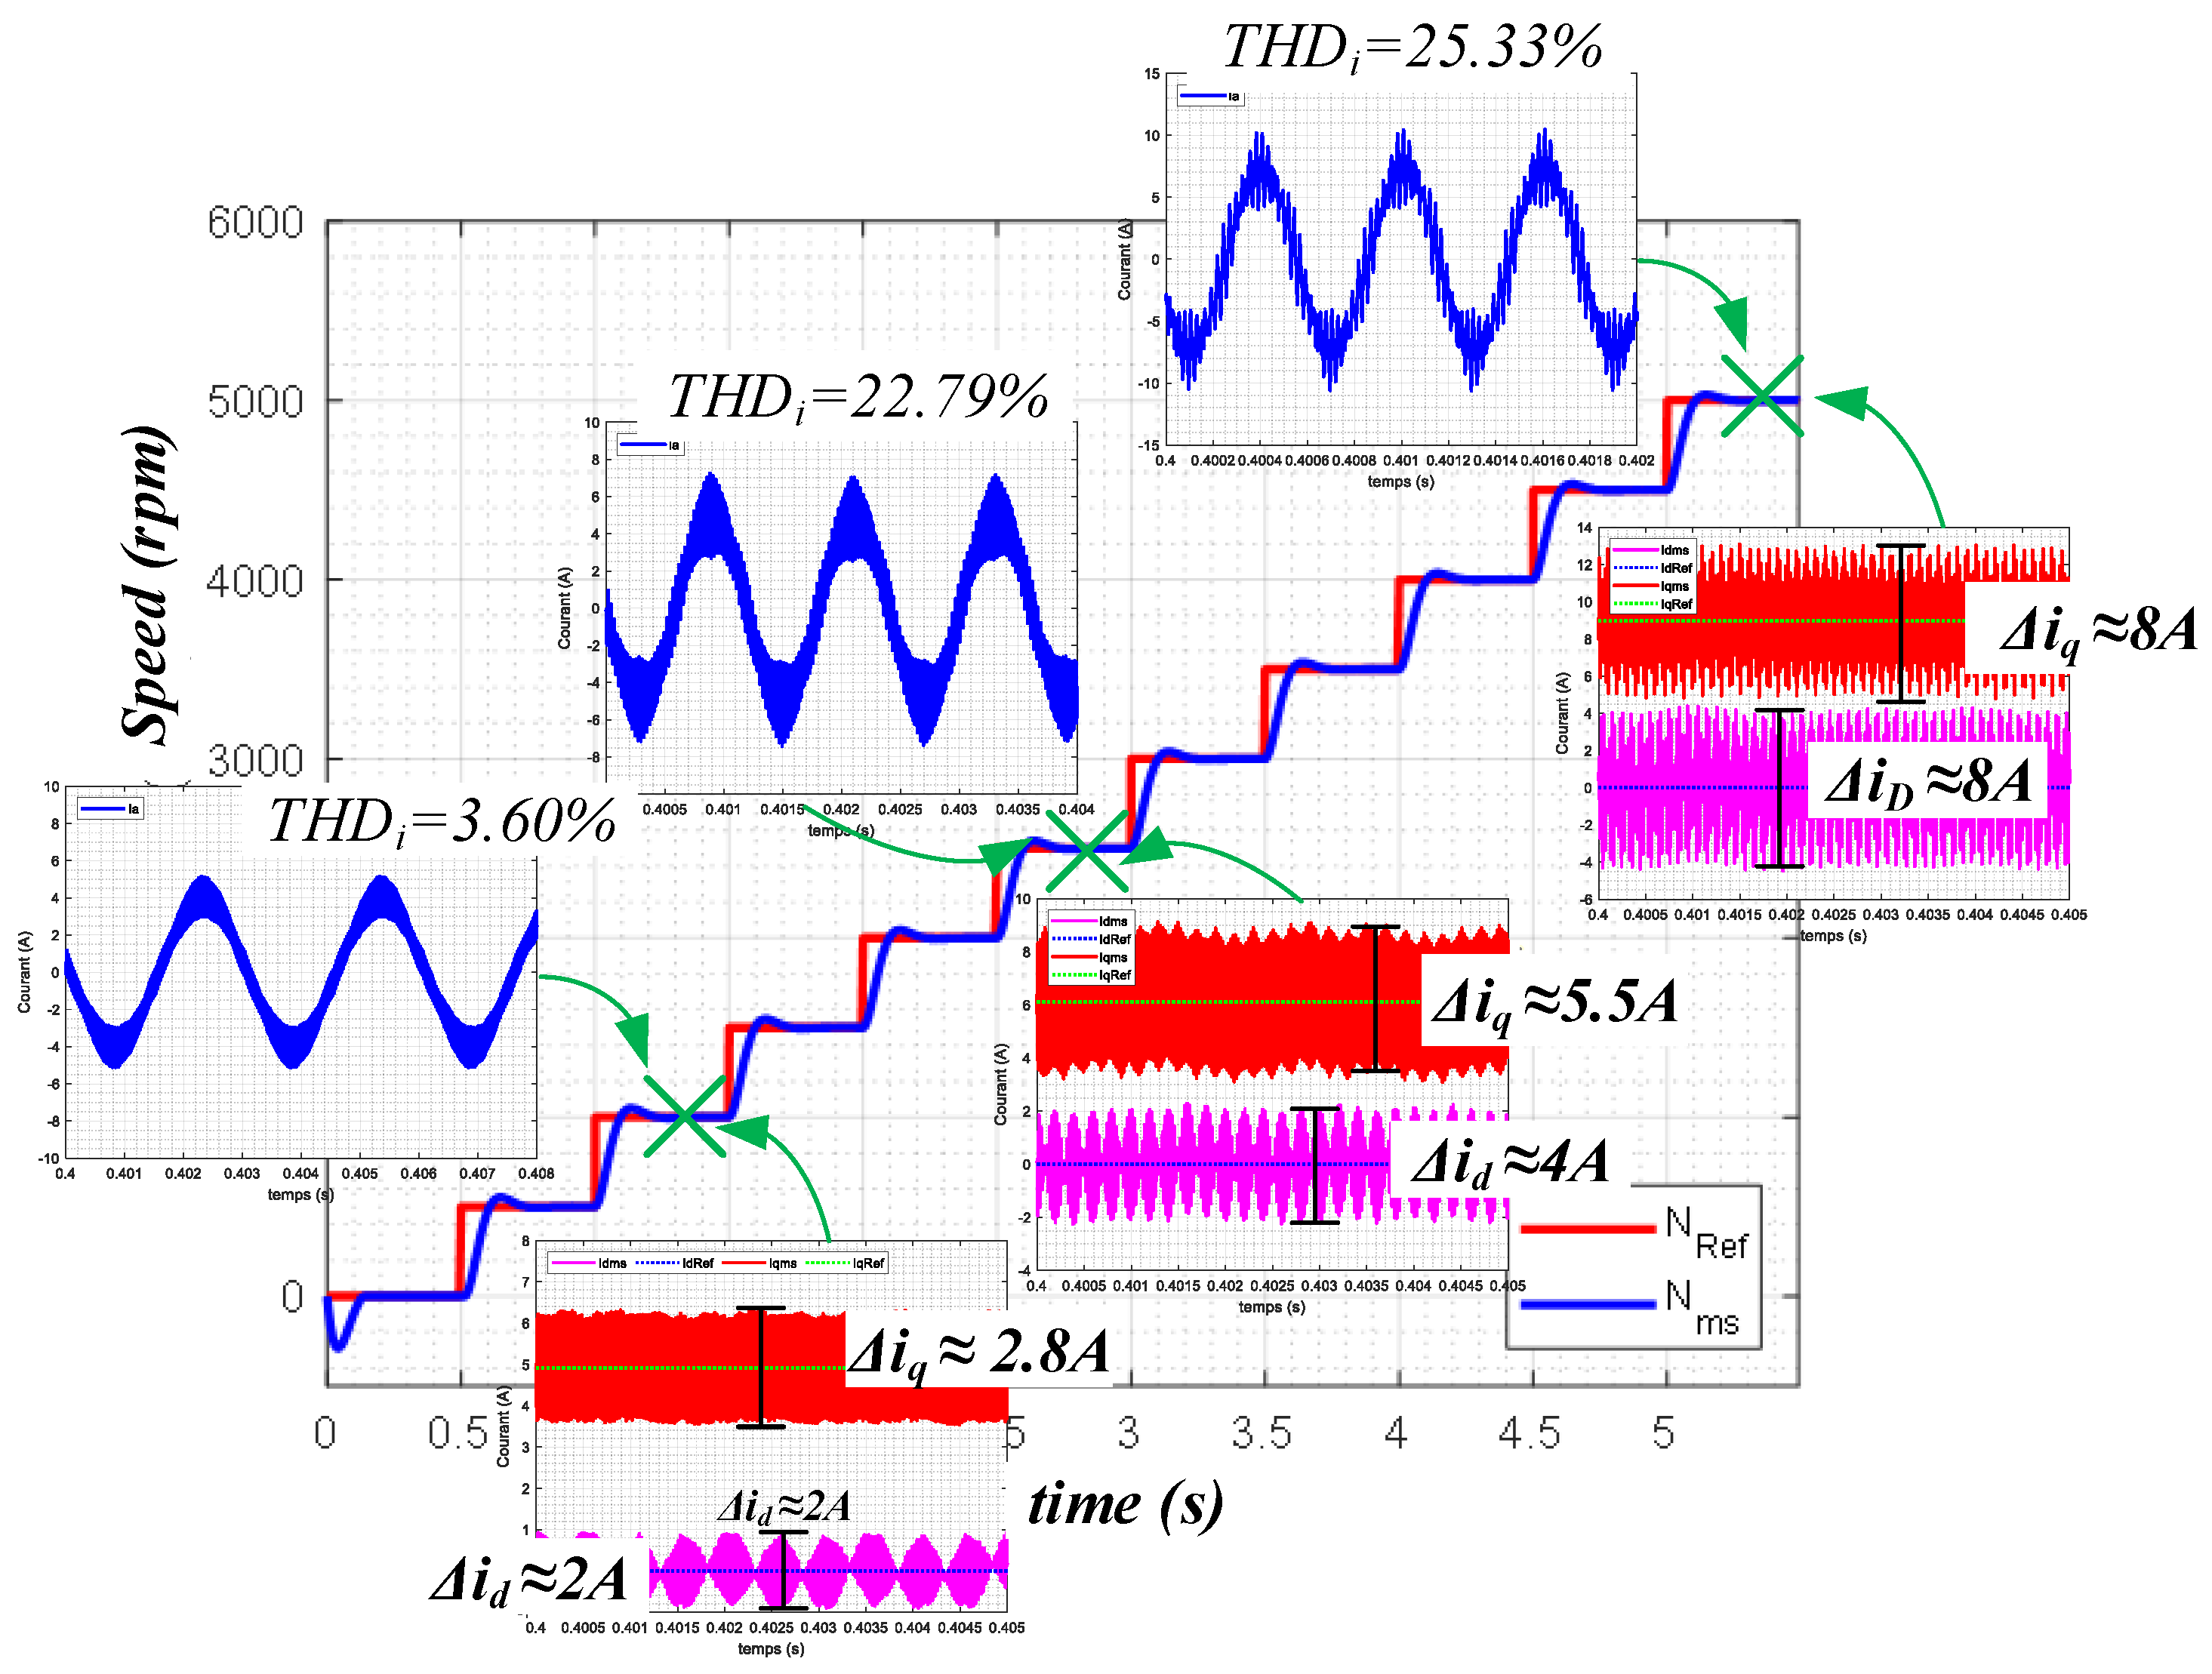
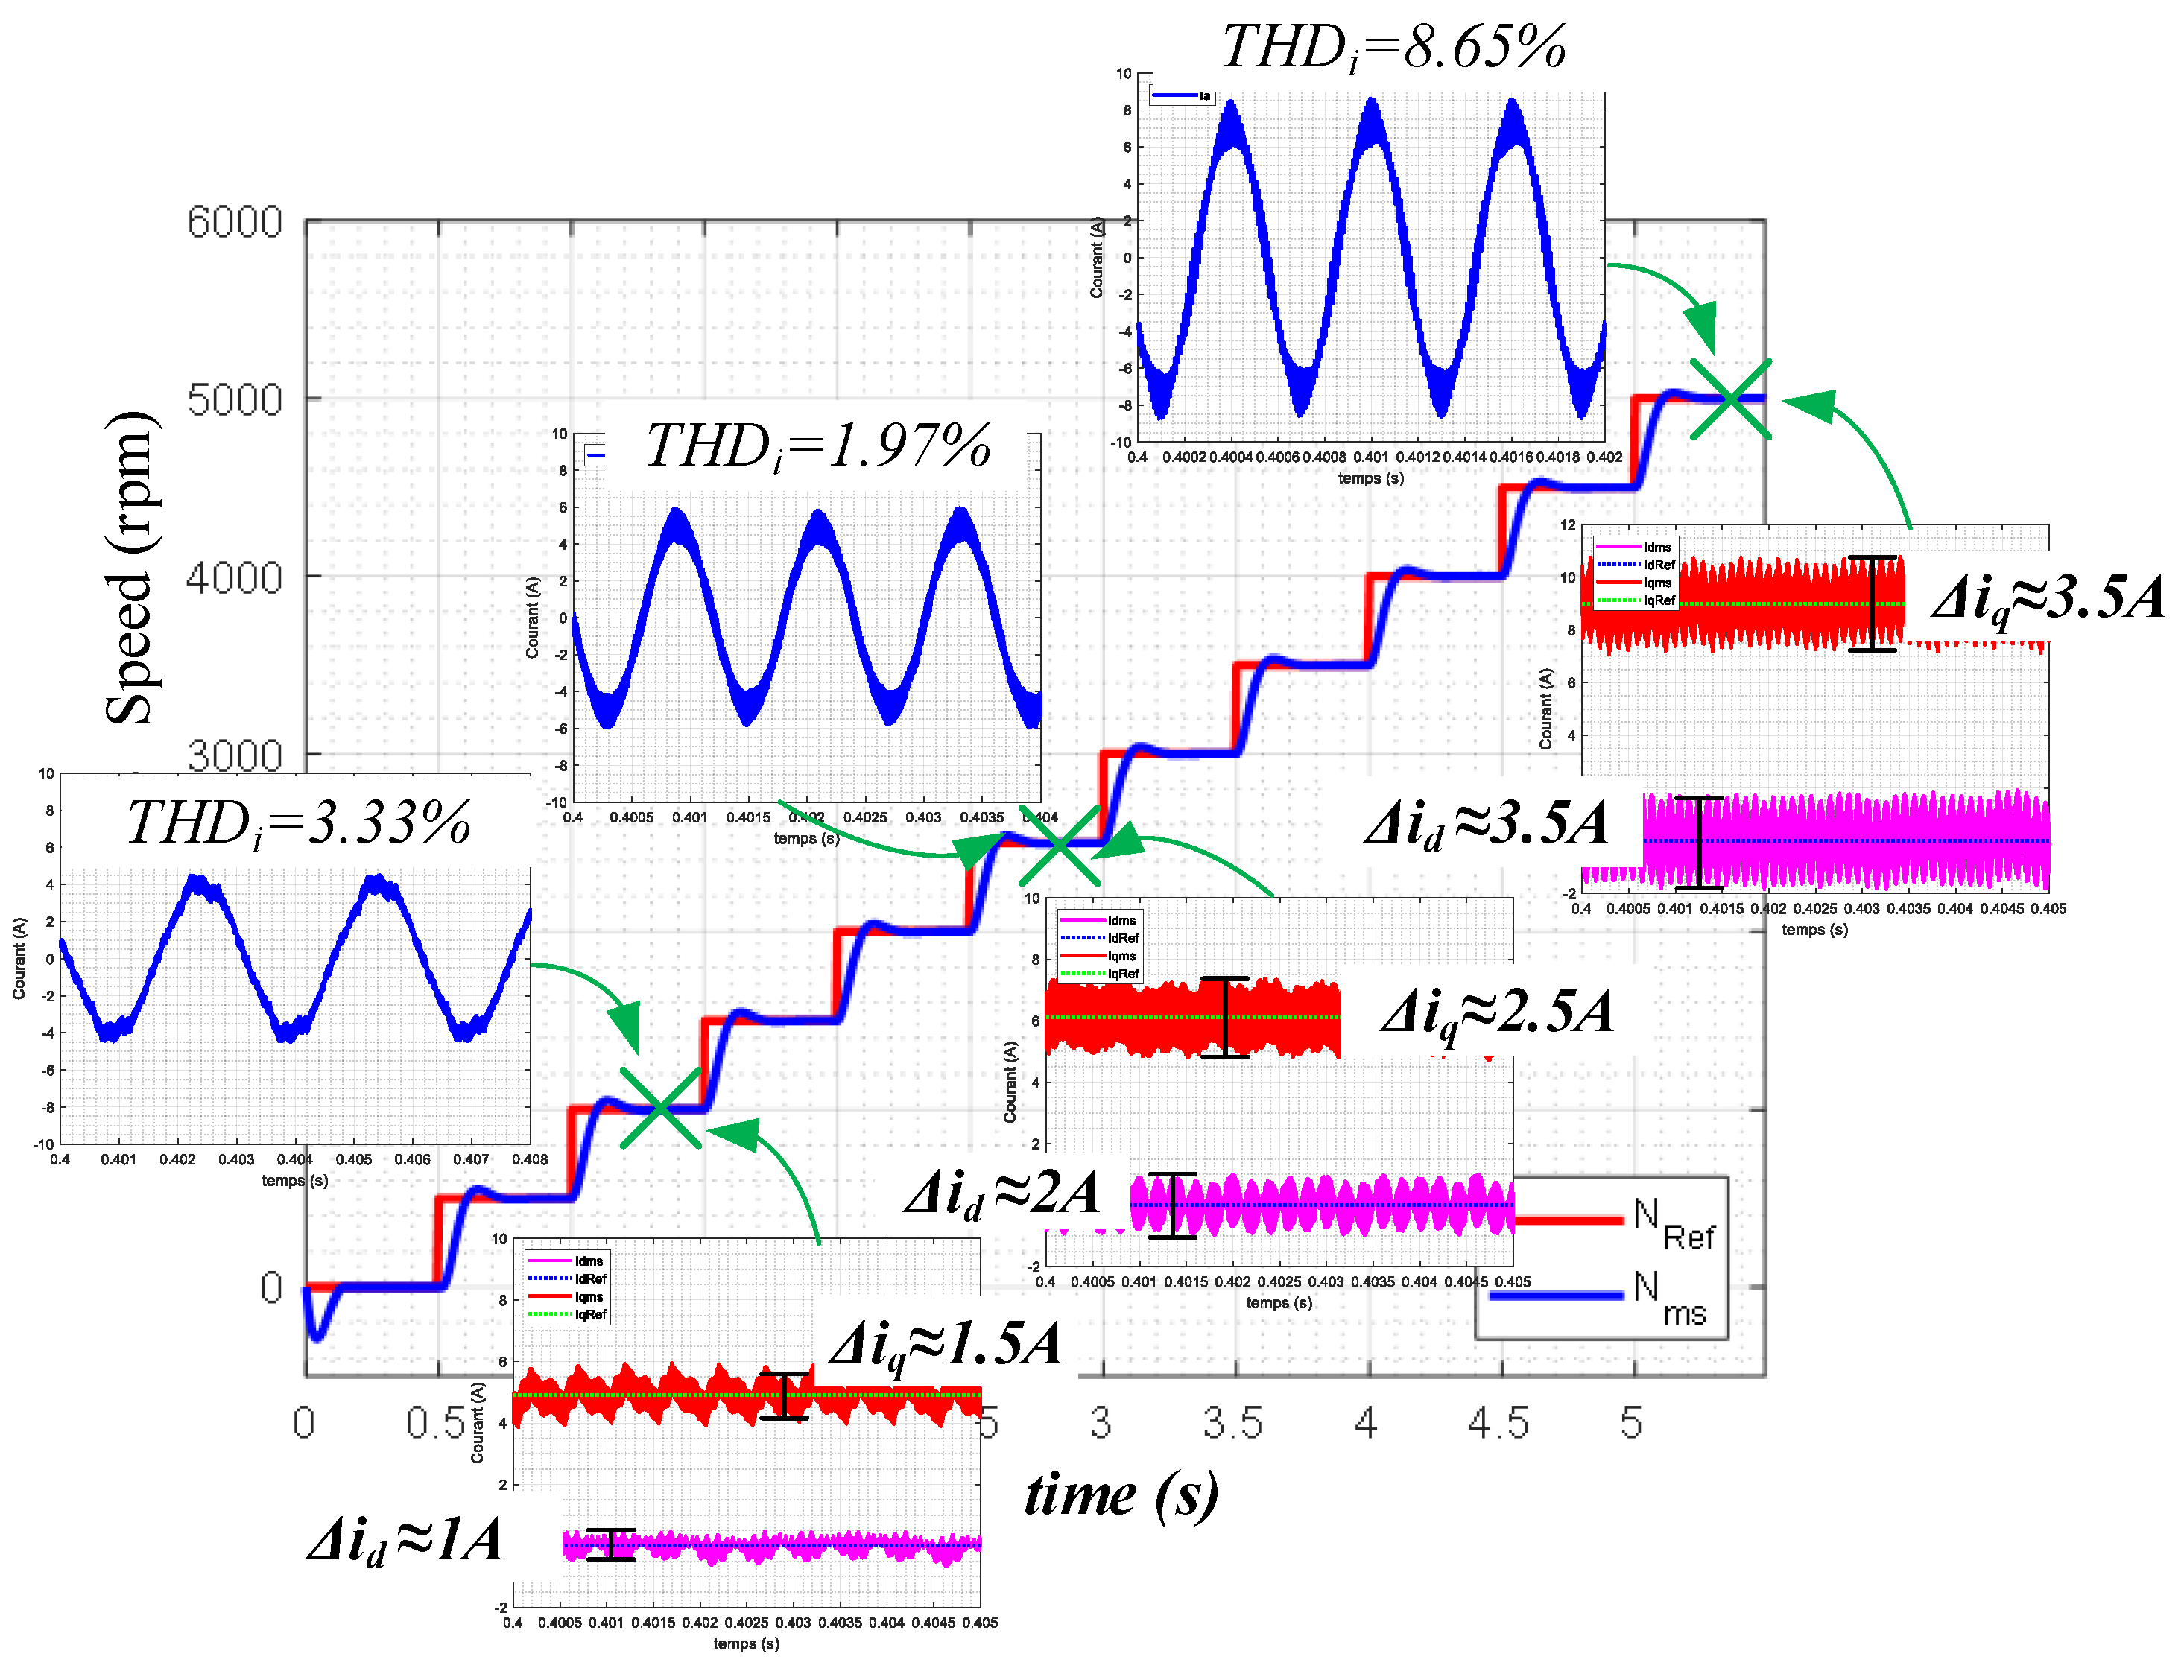
) and in the motor phase current. Here, we provide an example for three speeds: 1000, 2500, and 5000 rpm. In addition to speed, we analyze the effect of PWM frequency on current distortion (harmonic distortion and ripple) by selecting three values: 20, 40, and 100 kHz. The simulation results are presented in
Figure 21,
Figure 22 and
Figure 23.
As depicted in
Figure 21 for a switching frequency of 20 kHz, an increase in rotor speed corresponds to an increase in the electrical frequency of the motor phase current. The higher the electrical frequency, the lower the value of
(
), leading to an increase in the harmonic distortion rate of the currents (
). This result is clearly observed at a motor speed of 5000 rpm (
Hz,
,
). The dq-axis currents (
) at 5000 rpm exhibit very high ripple rates (
A and
A). As mentioned in the previous section, increasing the switching frequency allows for a higher modulation index
to reduce
.
The simulation results for a switching frequency of 40 kHz are presented in
Figure 22. The
and current ripple in the dq-axis (
) at a switching frequency of 40 kHz are lower than those obtained at a switching frequency of 20 kHz. At this switching frequency, some IGBT devices may still operate, but at significantly lower efficiencies. For this reason, SiC-MOSFET devices are used instead of IGBTs in high-frequency switching applications.
Figure 23 shows that at a switching frequency of 100 kHz, both
and current ripple in the dq-axis (
) are significantly reduced. A comparison of the motor phase current
at different switching frequencies and variable speeds is shown in
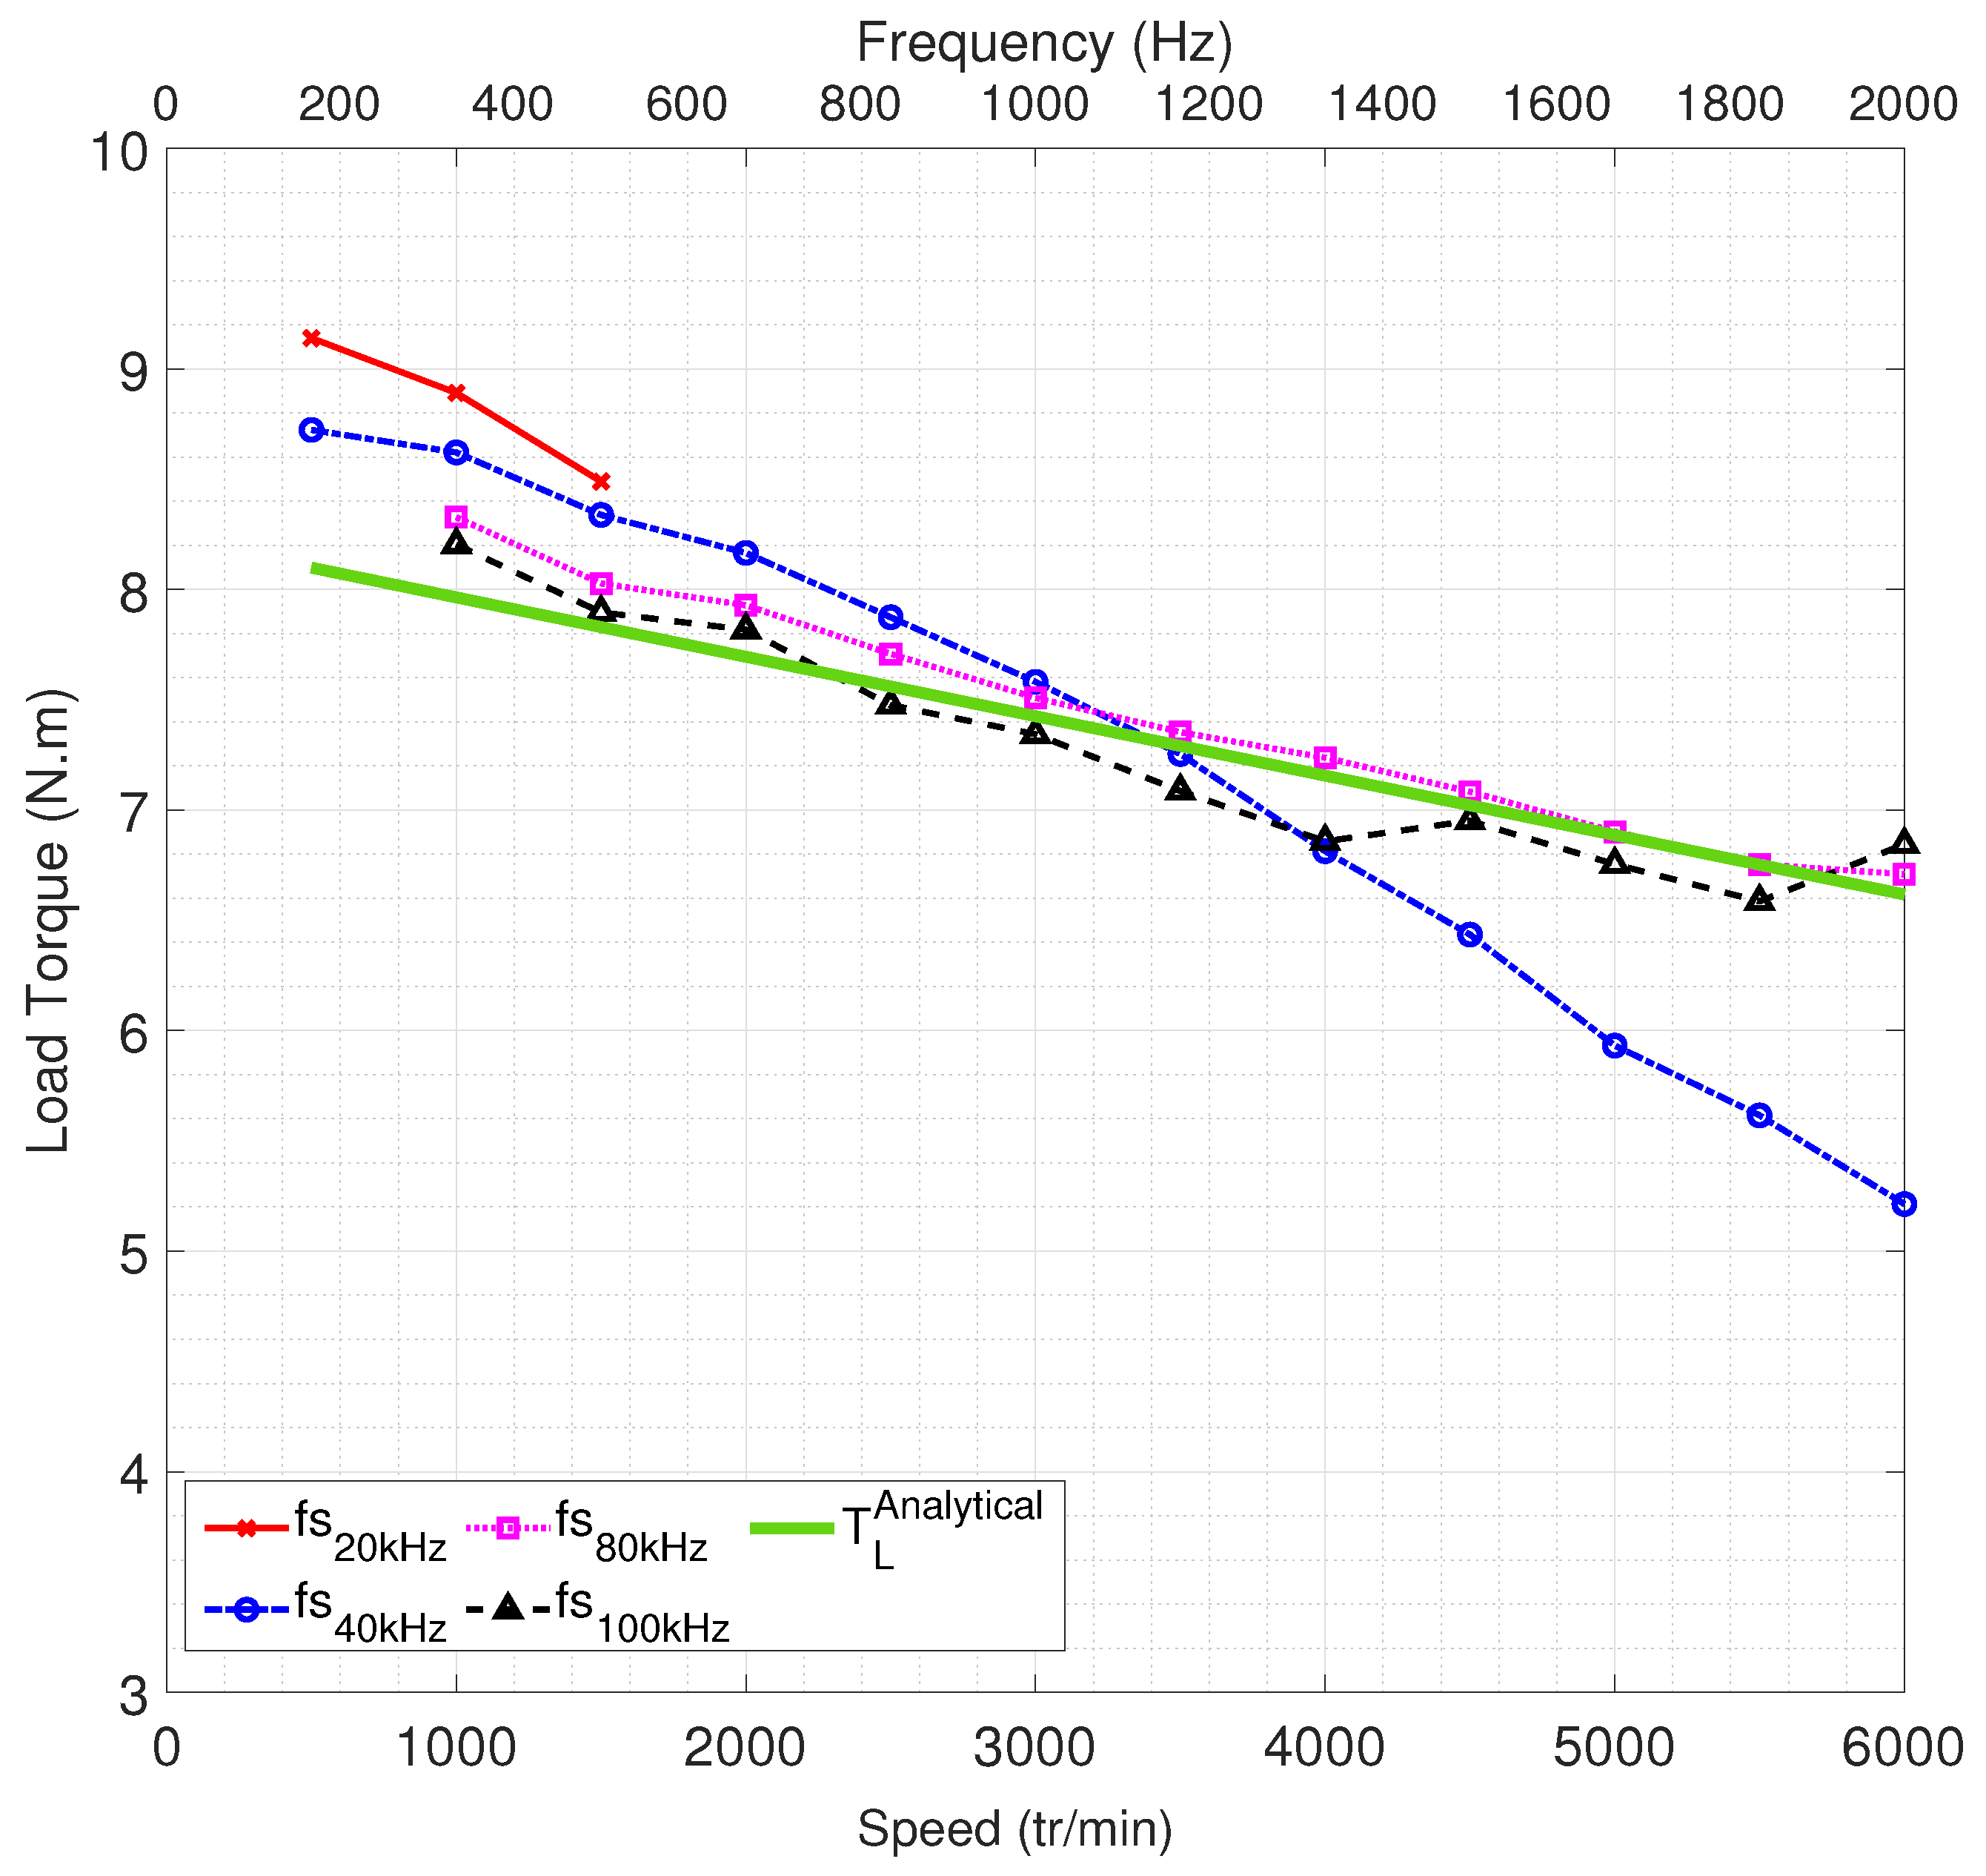
Figure 24. In this test, the motor operates at its rated current (
A), with speeds ranging from 500 RPM to 6000 RPM. Load torque (
) is determined as the difference between the electromagnetic torque (
) and the friction torque (
):
Experimental and simulated load torques with
A are shown in
Figure 24. The load torque decreases linearly with increasing motor speed. Experiments at switching frequencies of 20 kHz, 40 kHz, 80 kHz, and 100 kHz reveal the influence of frequency on electromechanical conversion.
At low speeds, low-frequency switching yields high shaft torque. The torque sharply decreases at 40 kHz beyond 4000 RPM, but it remains consistent at 80 kHz and 100 kHz due to improved . The maximum error, , occurs at 6000 RPM for 40 kHz. Limitation to 20 kHz results in rapid torque reduction at 2000 RPM due to the ripple in the current, which could exceed the rated current of the PMSM.
5.3. PMSM Losses and Efficiency Measurement
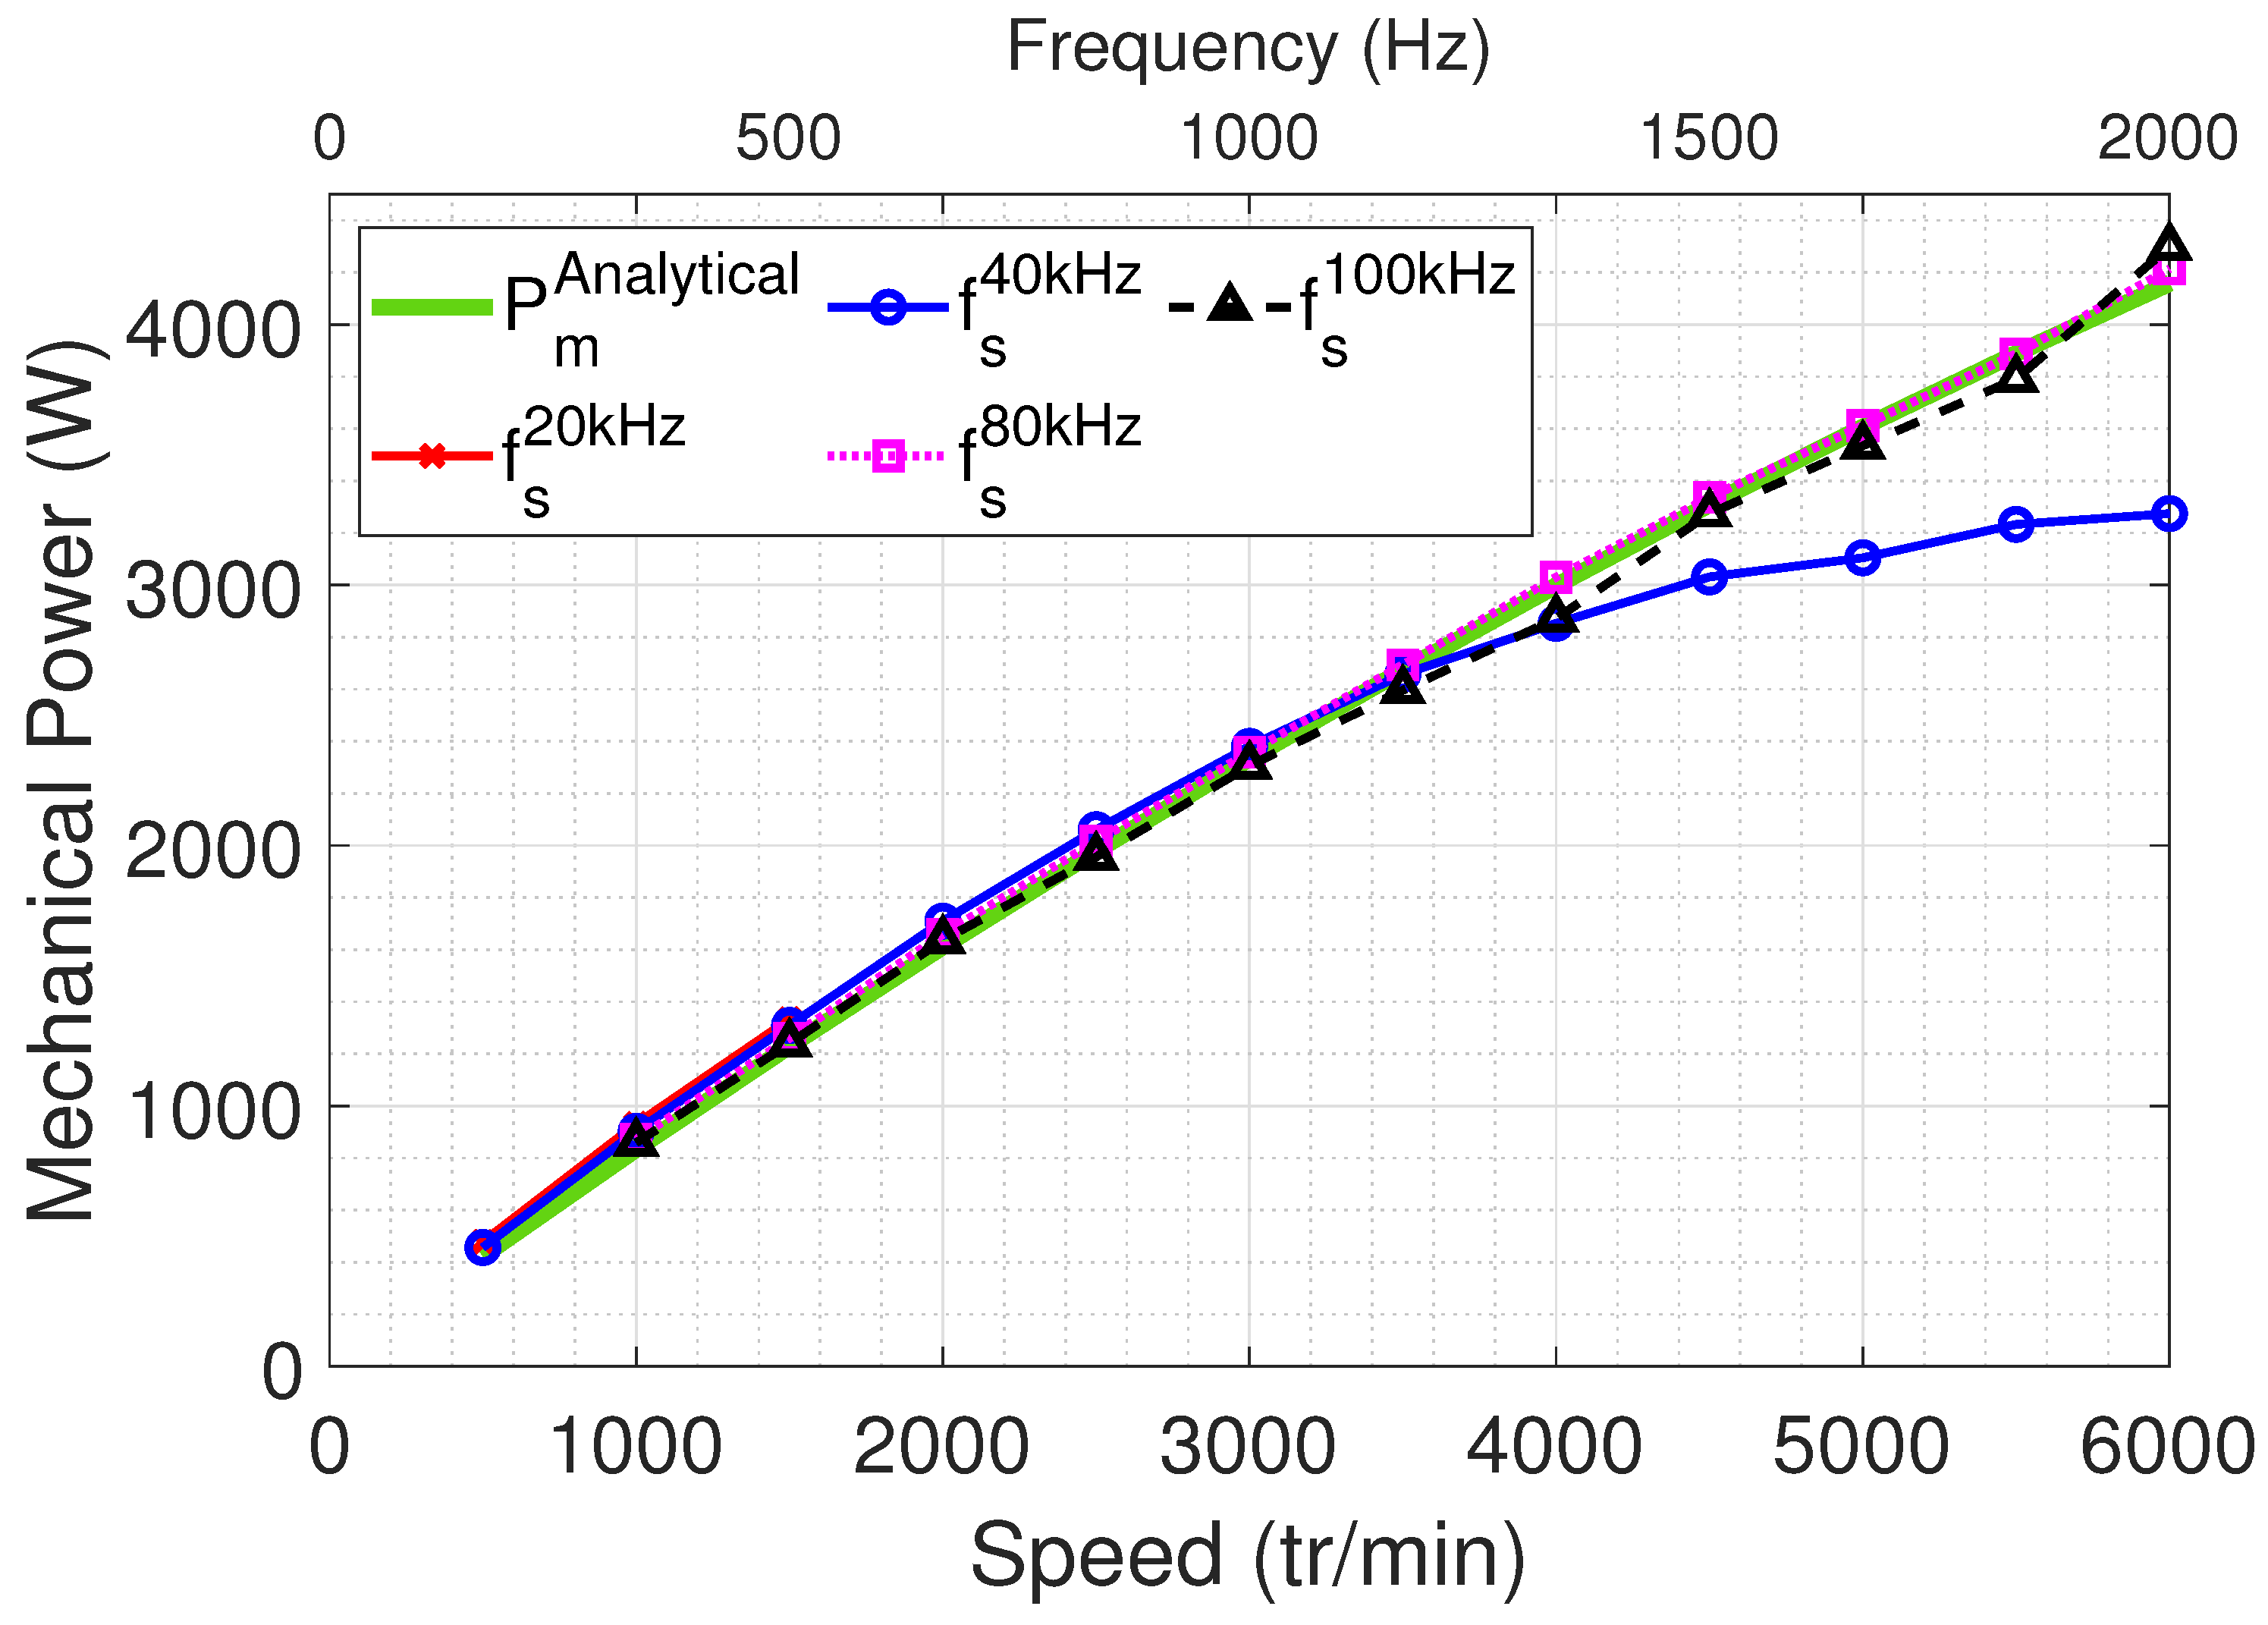
Figure 25 compares the experimentally measured mechanical power to the analytical values. As expected, an increase in speed leads to a rise in mechanical power. Experimental results generally align with simulation except at a 40 kHz PWM frequency, where power starts decreasing above 4000 RPM due to reduced torque (
Figure 24). At 20 kHz PWM, tests are capped at 1500 RPM, corresponding to a fundamental frequency of 750 Hz.
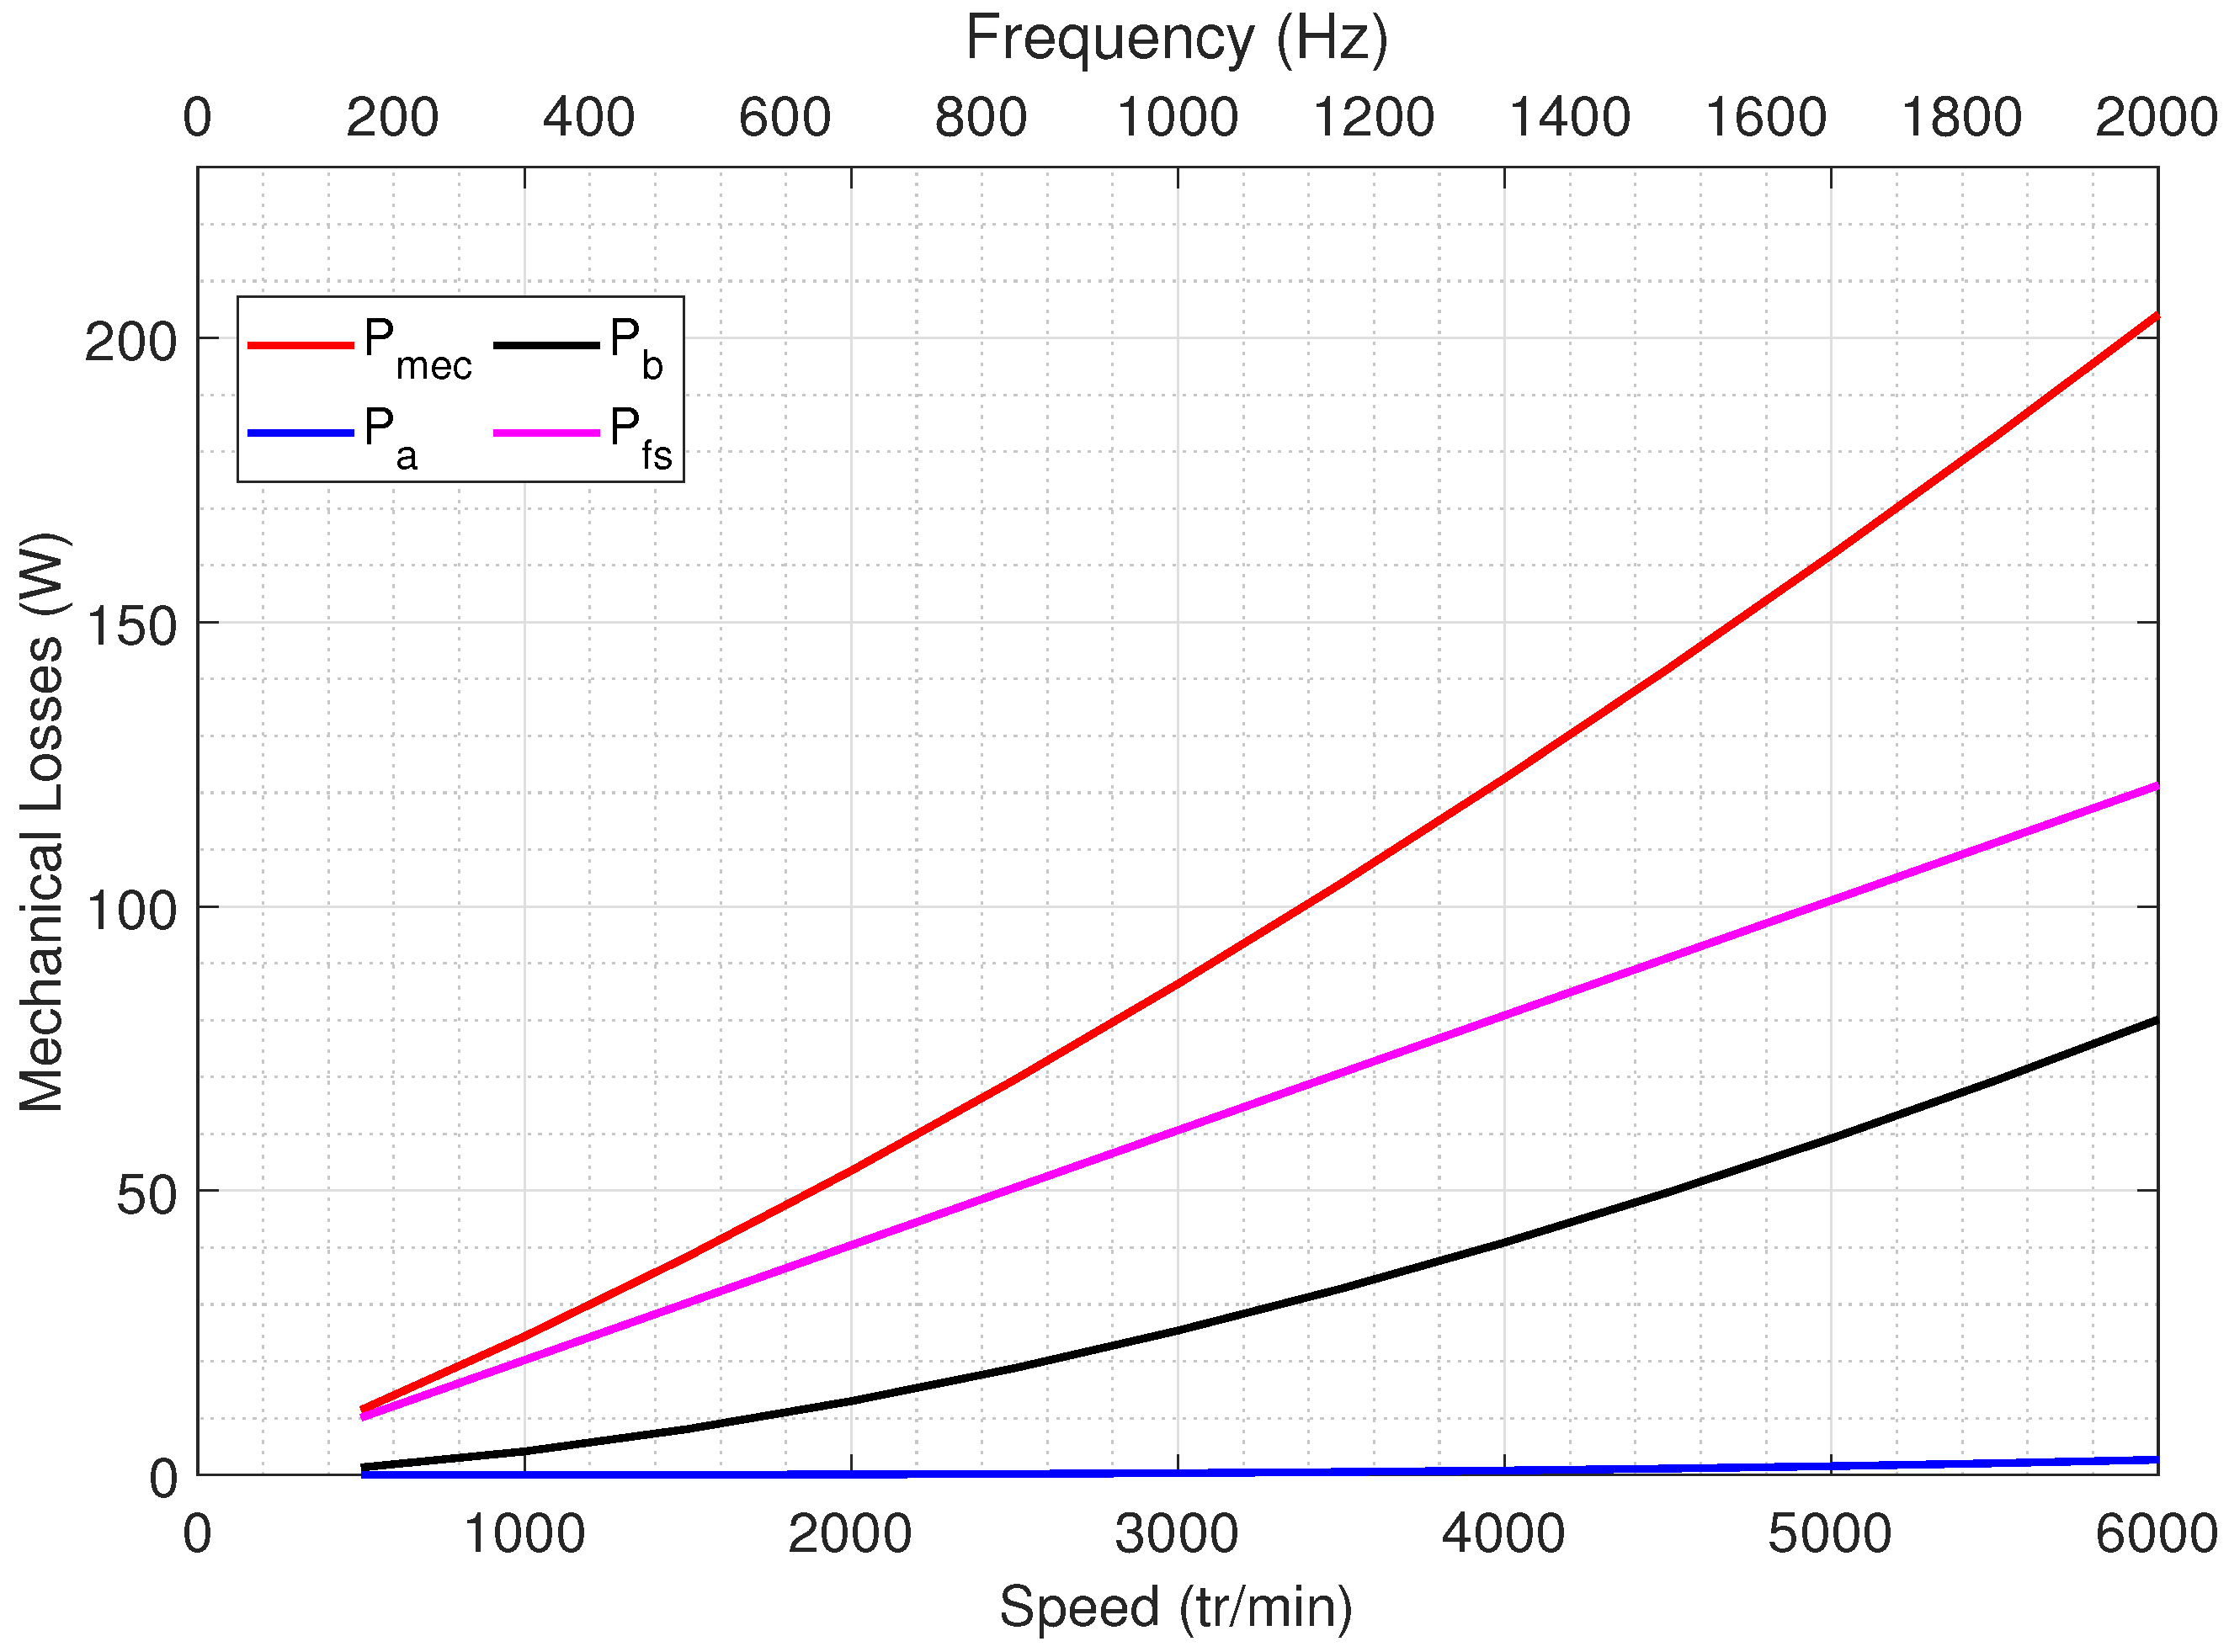
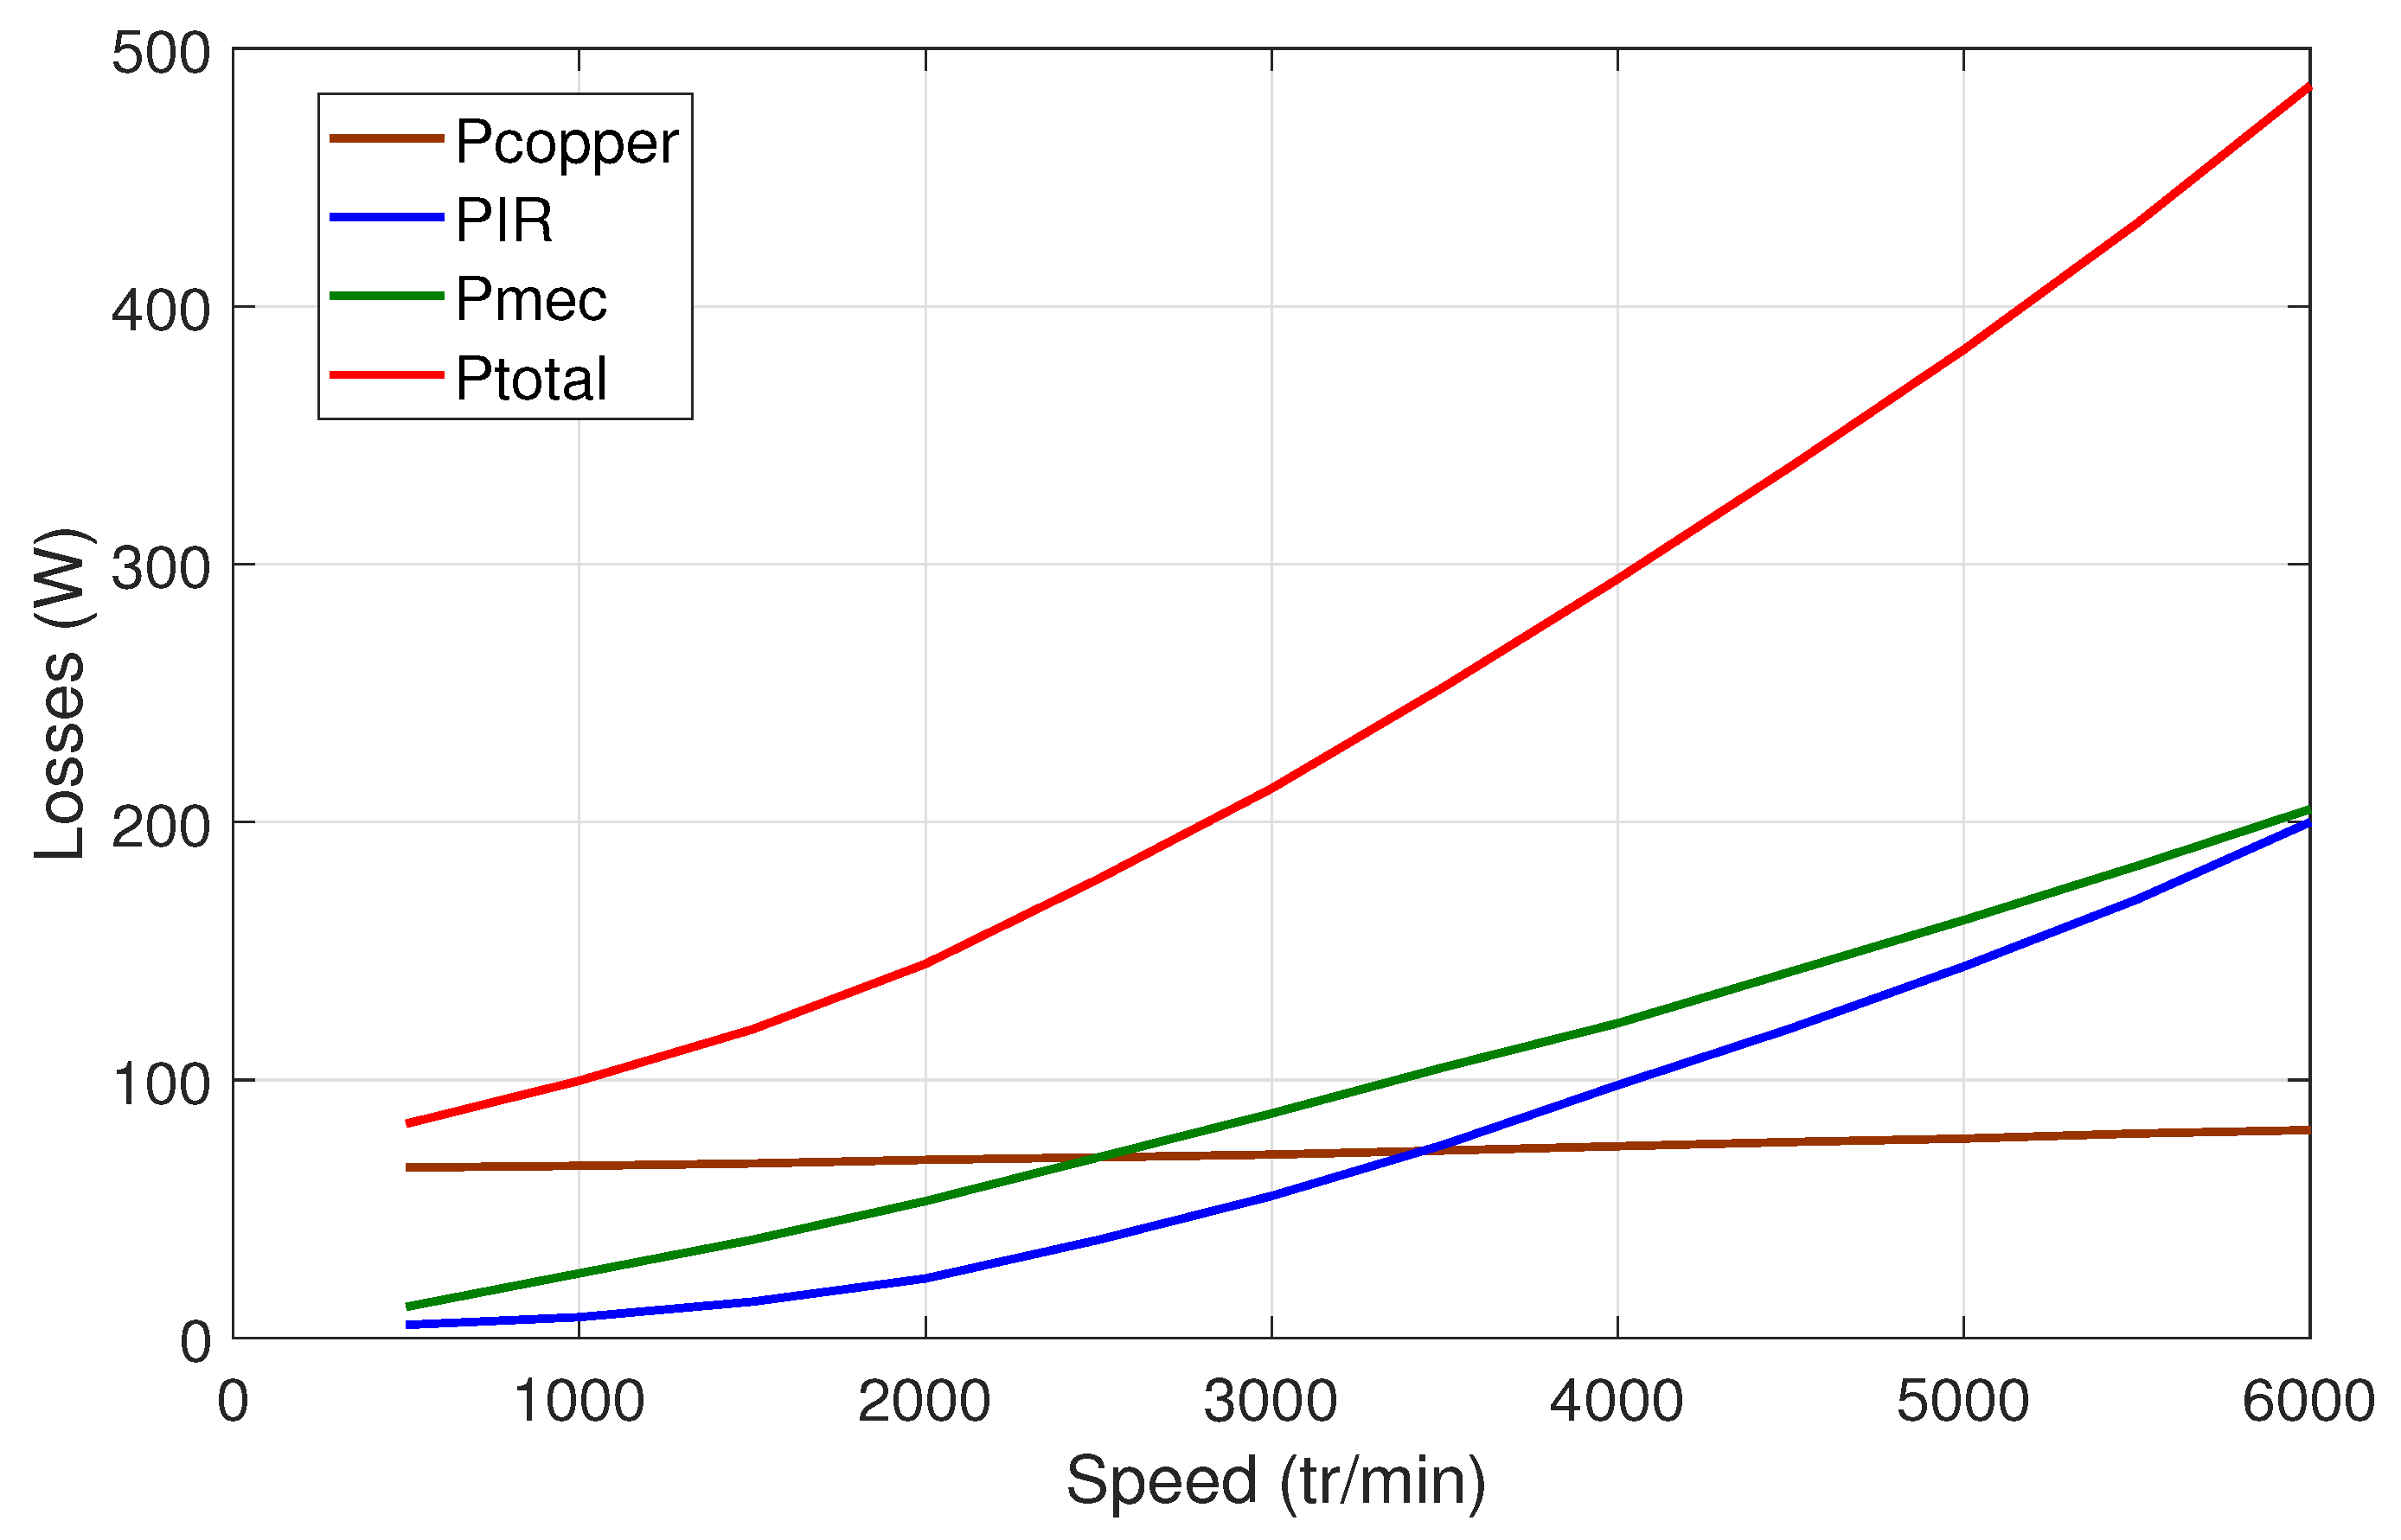
Mechanical and iron losses are evaluated by subtracting mechanical output power (torque and speed sensors) from input power (PA4000 power analyzer), adjusted for statoric resistive losses:
The graph in
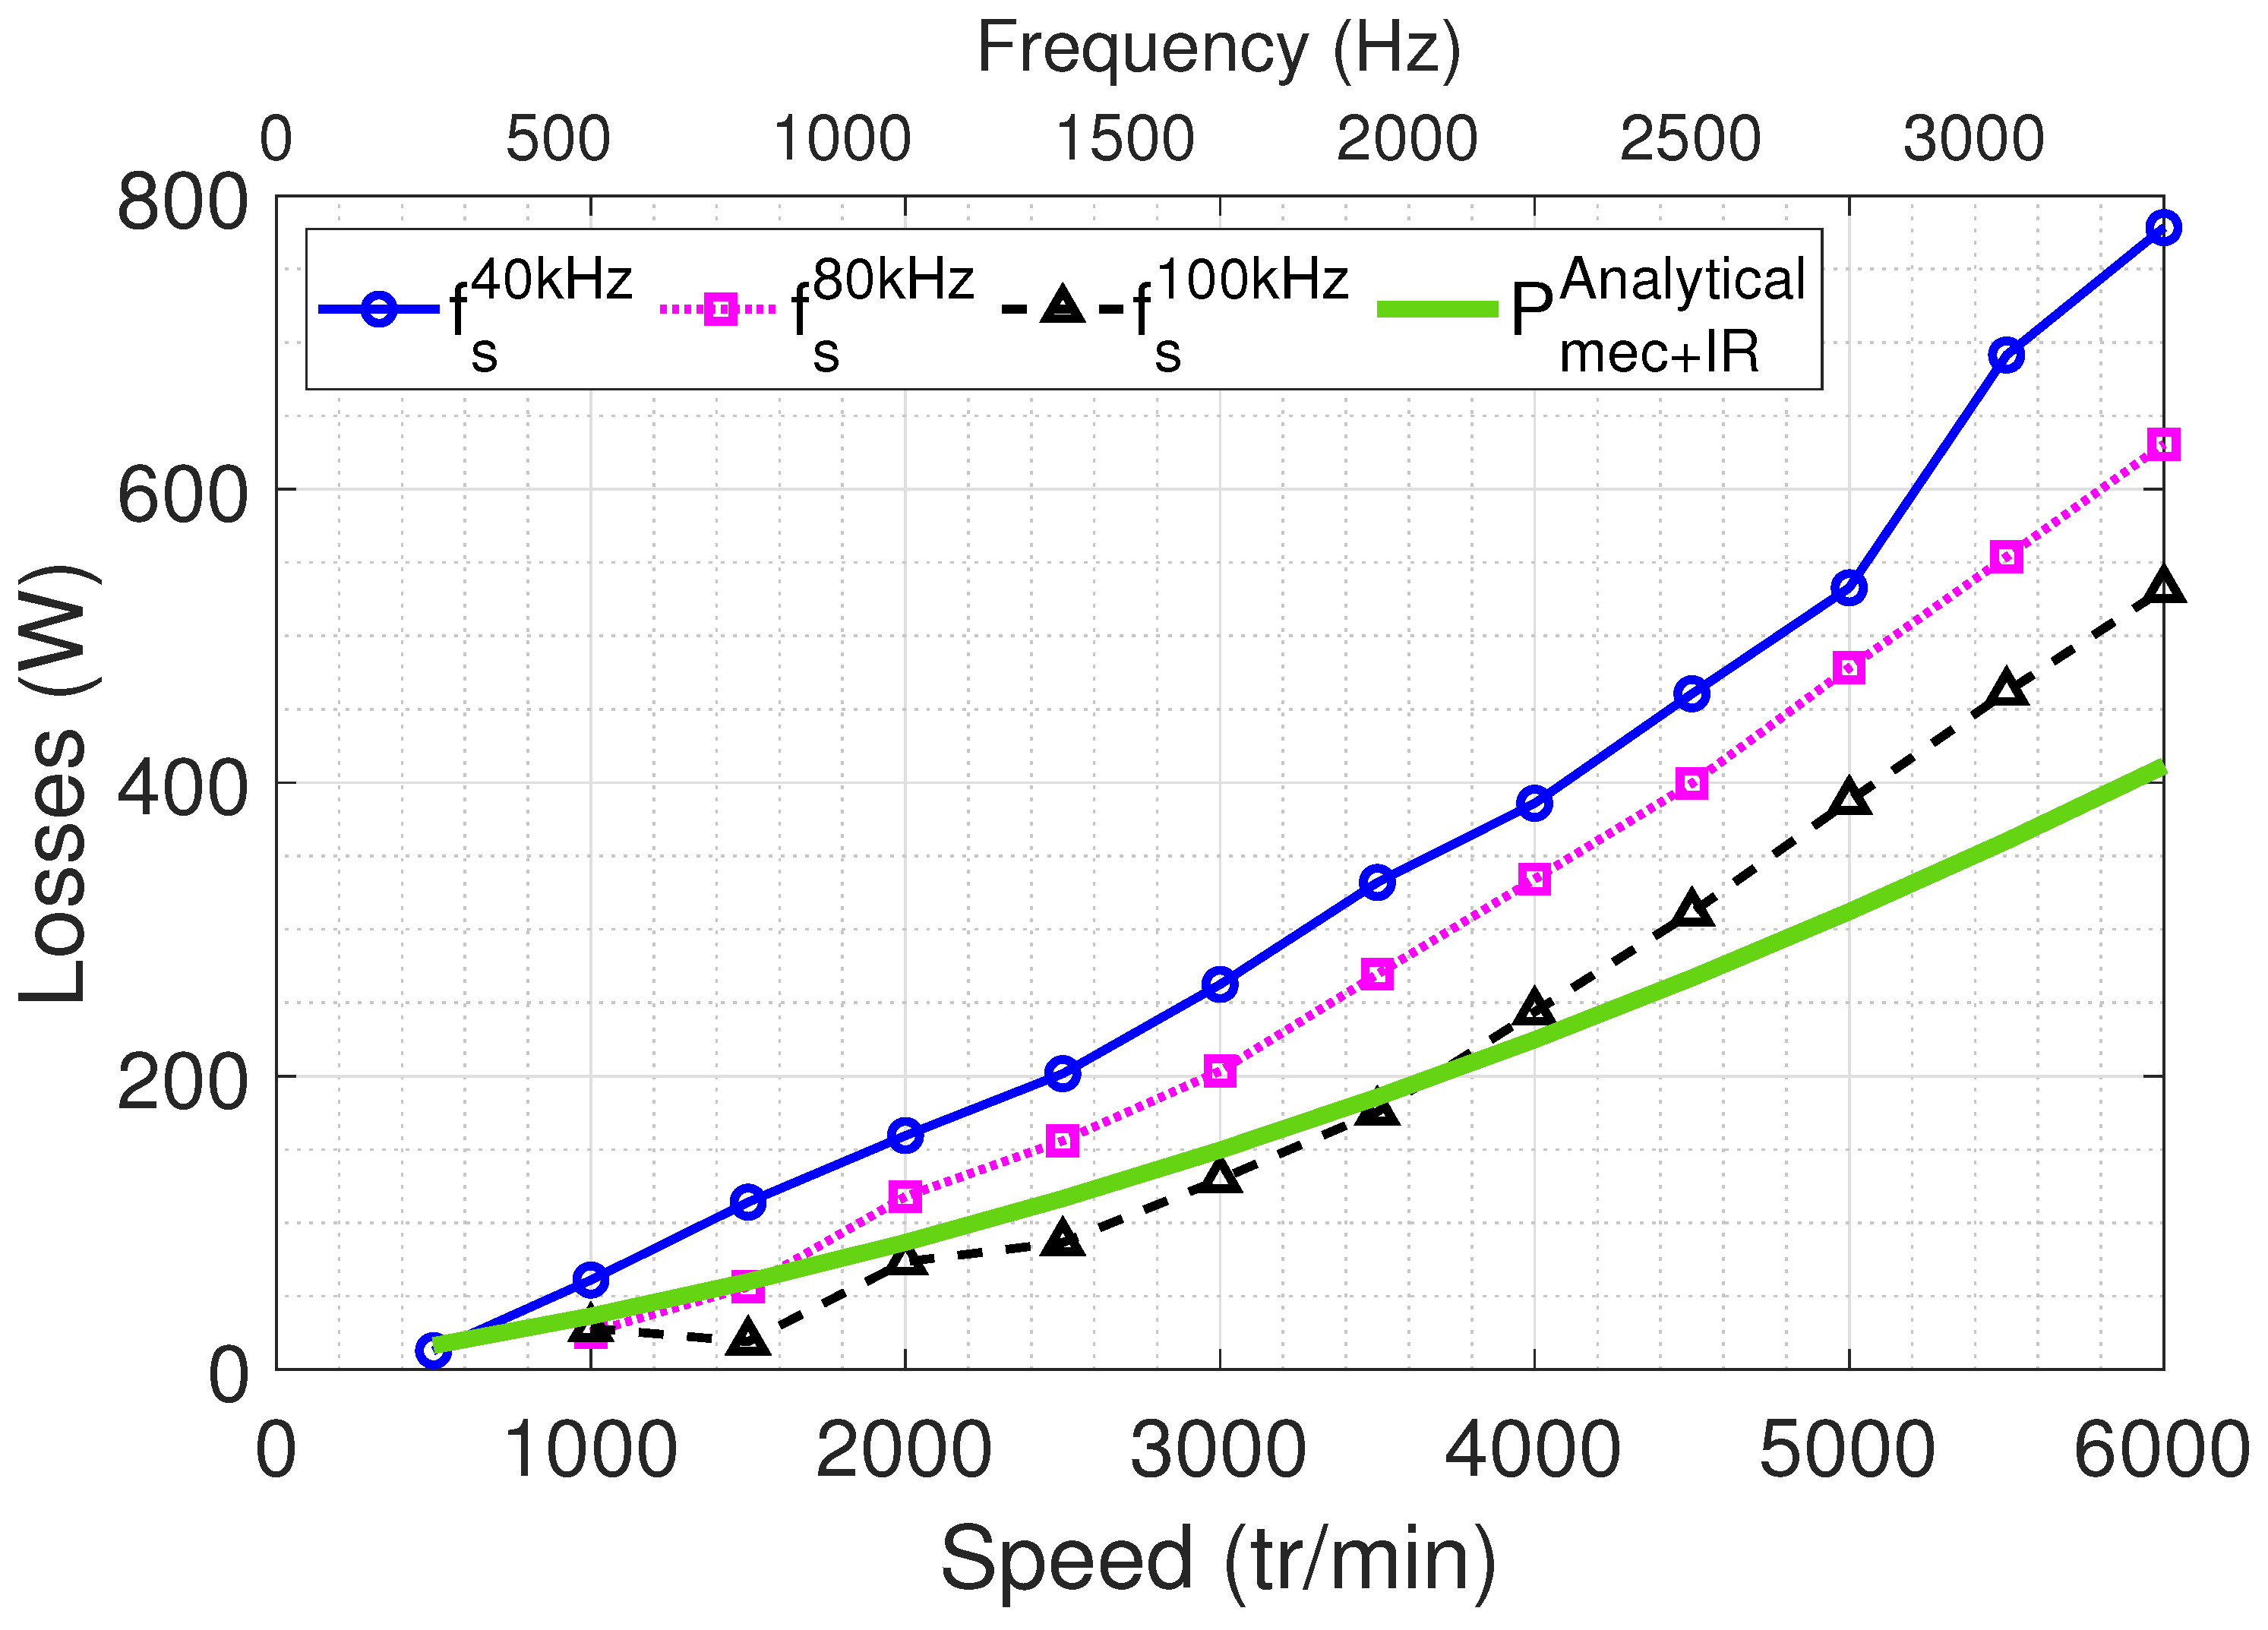
Figure 26 compares the model’s predictions (shown in green) for motor losses, including both iron and mechanical losses, with actual test data obtained at different PWM frequencies:
kHz (blue circle),
kHz (purple square), and
kHz (black triangle). The tests only provide the total losses, so iron and mechanical losses cannot be separated. As observed in
Figure 26, when the PWM frequency is increased, iron losses decrease due to the reduction in current ripple. The lowest losses occur at
kHz because the current waveforms become almost smooth and without ripples.
The main causes of core losses are the magnetic field from the permanent magnets along with the effect of the stator currents. When the switching frequency is raised, the quality of the current improves by reducing unwanted components, which, in turn, reduces core losses. While losses in the magnets also decrease, they are not directly measured in this study. Instead, they are combined with core losses in the tests, which might explain why higher overall losses are observed in the experimental results shown in
Figure 26.
Moreover, losses in the stator winding, which depend on the current and resistance that increase with frequency, need to be considered when calculating efficiency. Motor efficiency can be determined using Equation (
42).
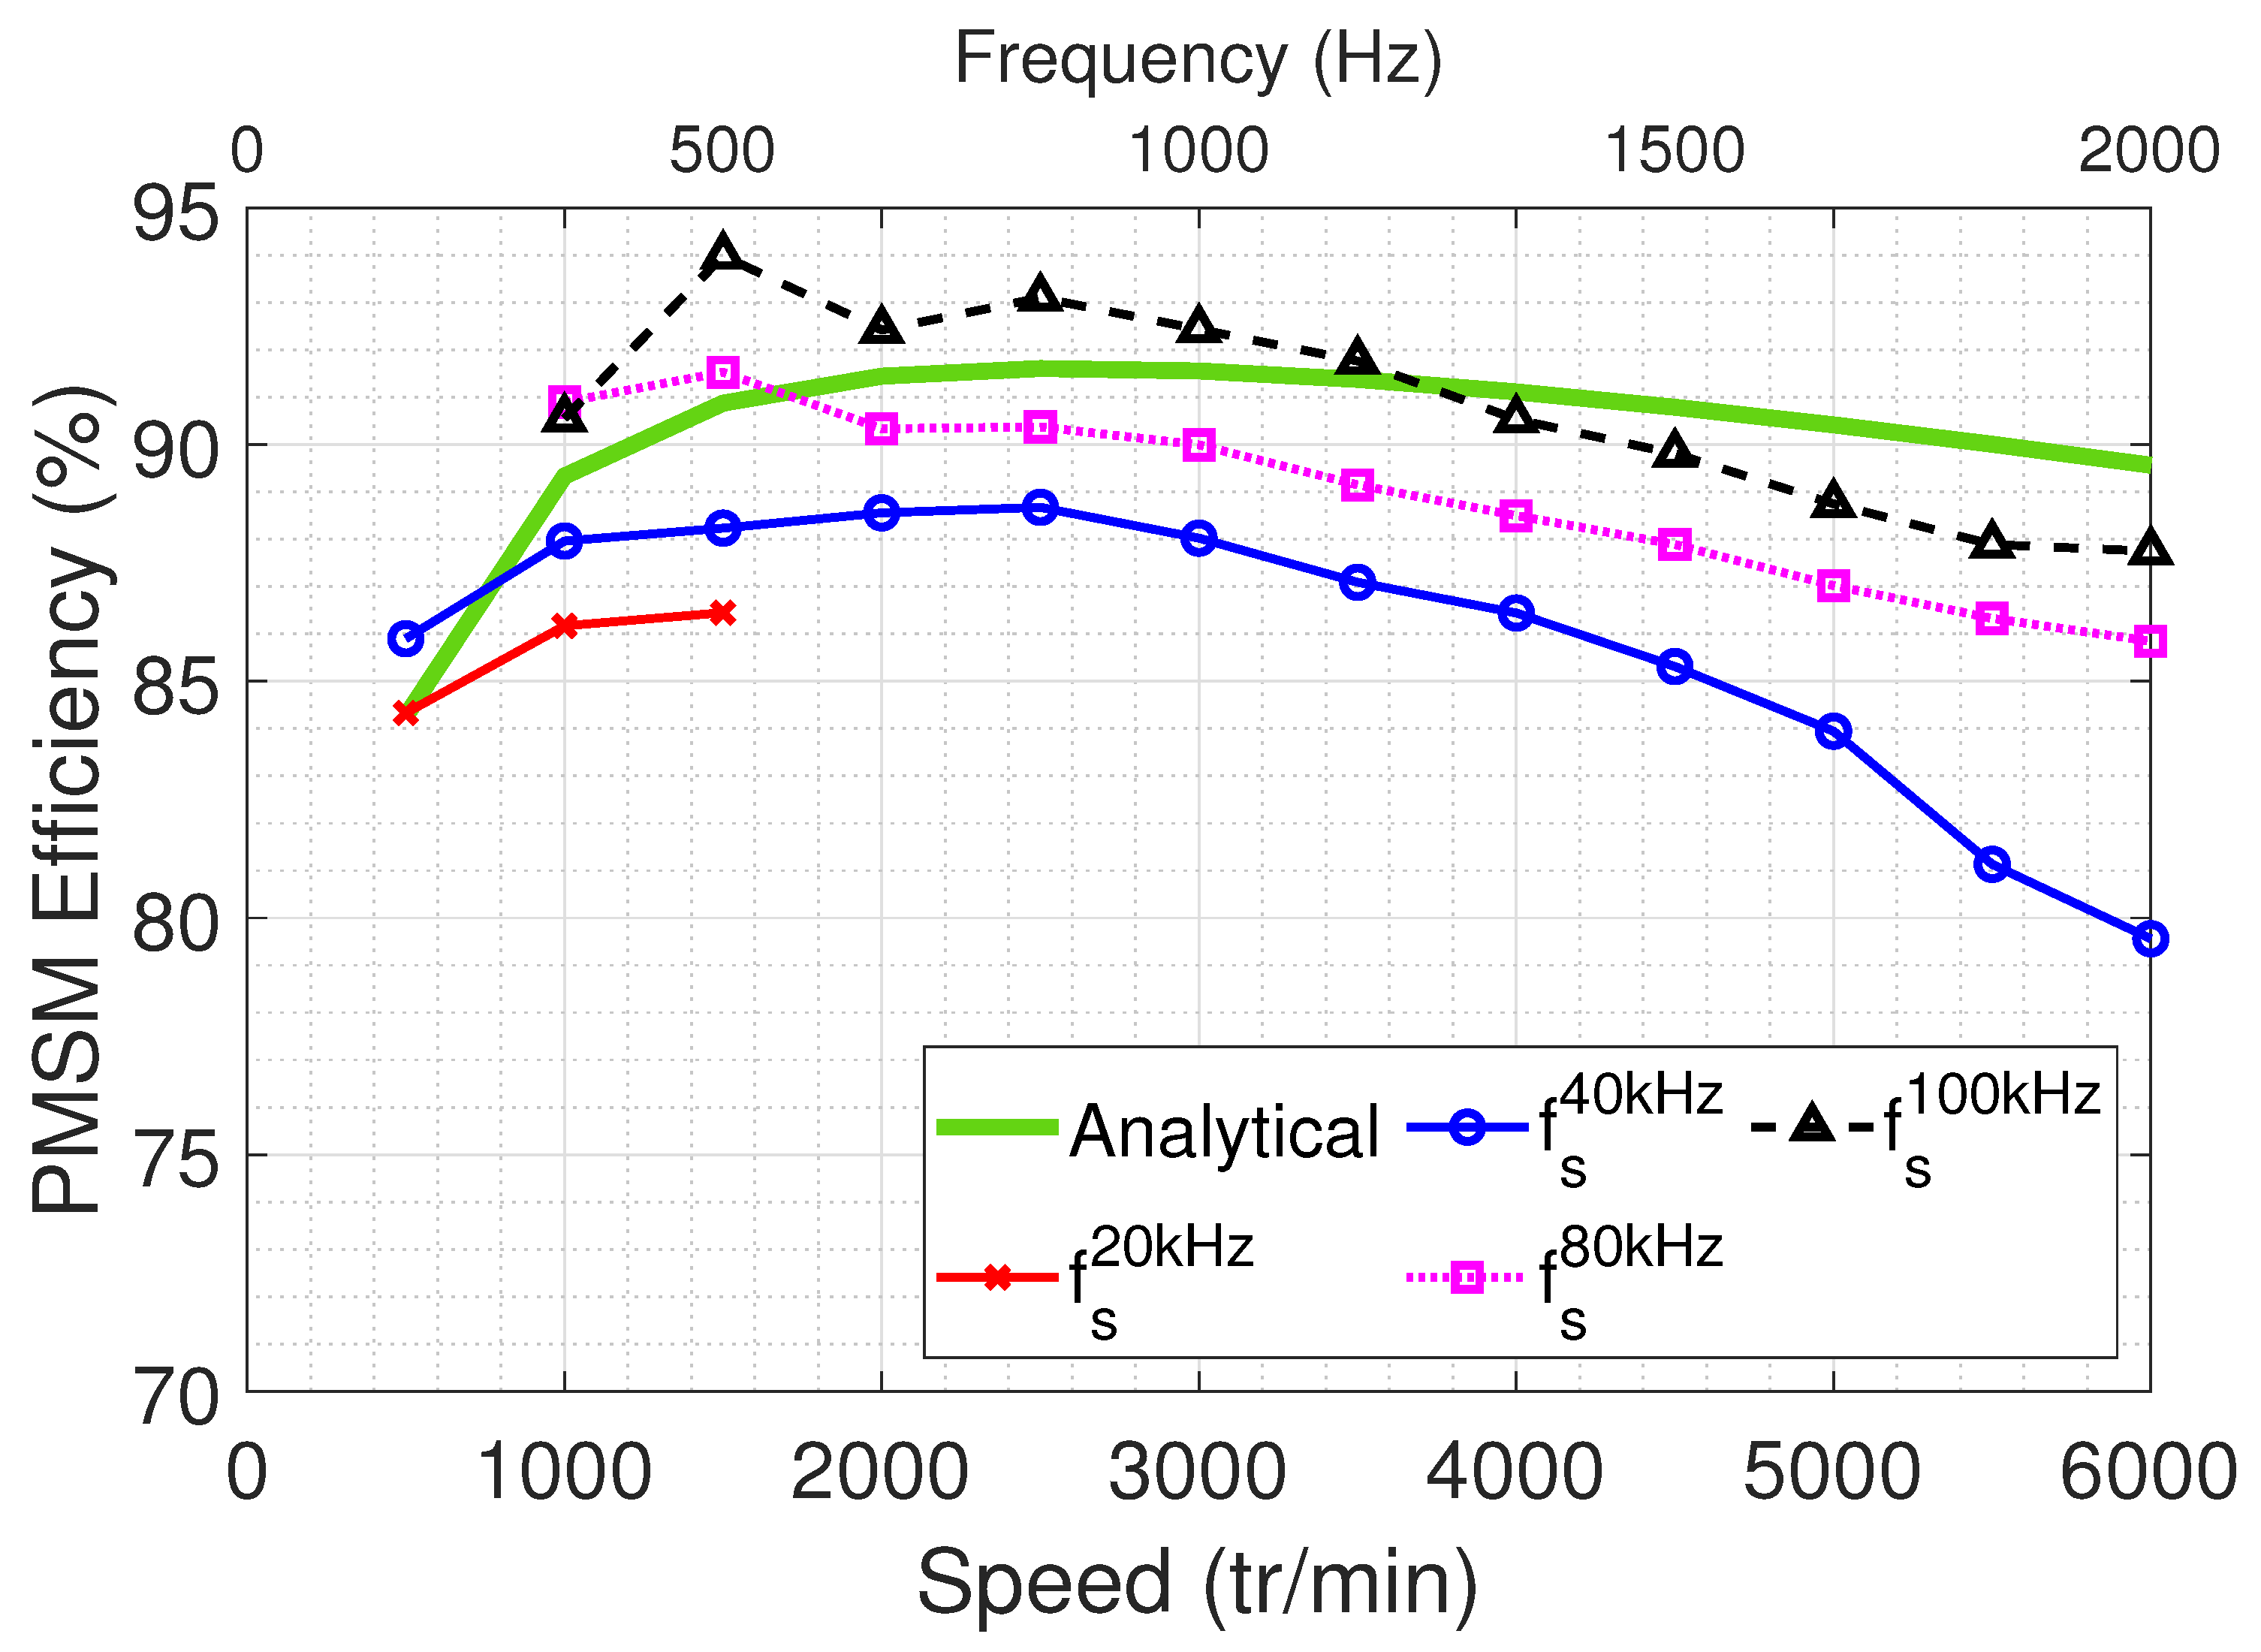
The results of these calculations and their comparison with experimental data are shown in
Figure 27. At a switching frequency of 100 kHz, mechanical power is higher and losses are lower compared to other frequencies, which is consistent with previous findings. Consequently, the efficiency at 100 kHz is higher, and it gradually decreases with lower switching frequencies. Motor efficiency remains above
across the speed range: reaching over
between 1000 and 4000 rpm (see
Figure 27).
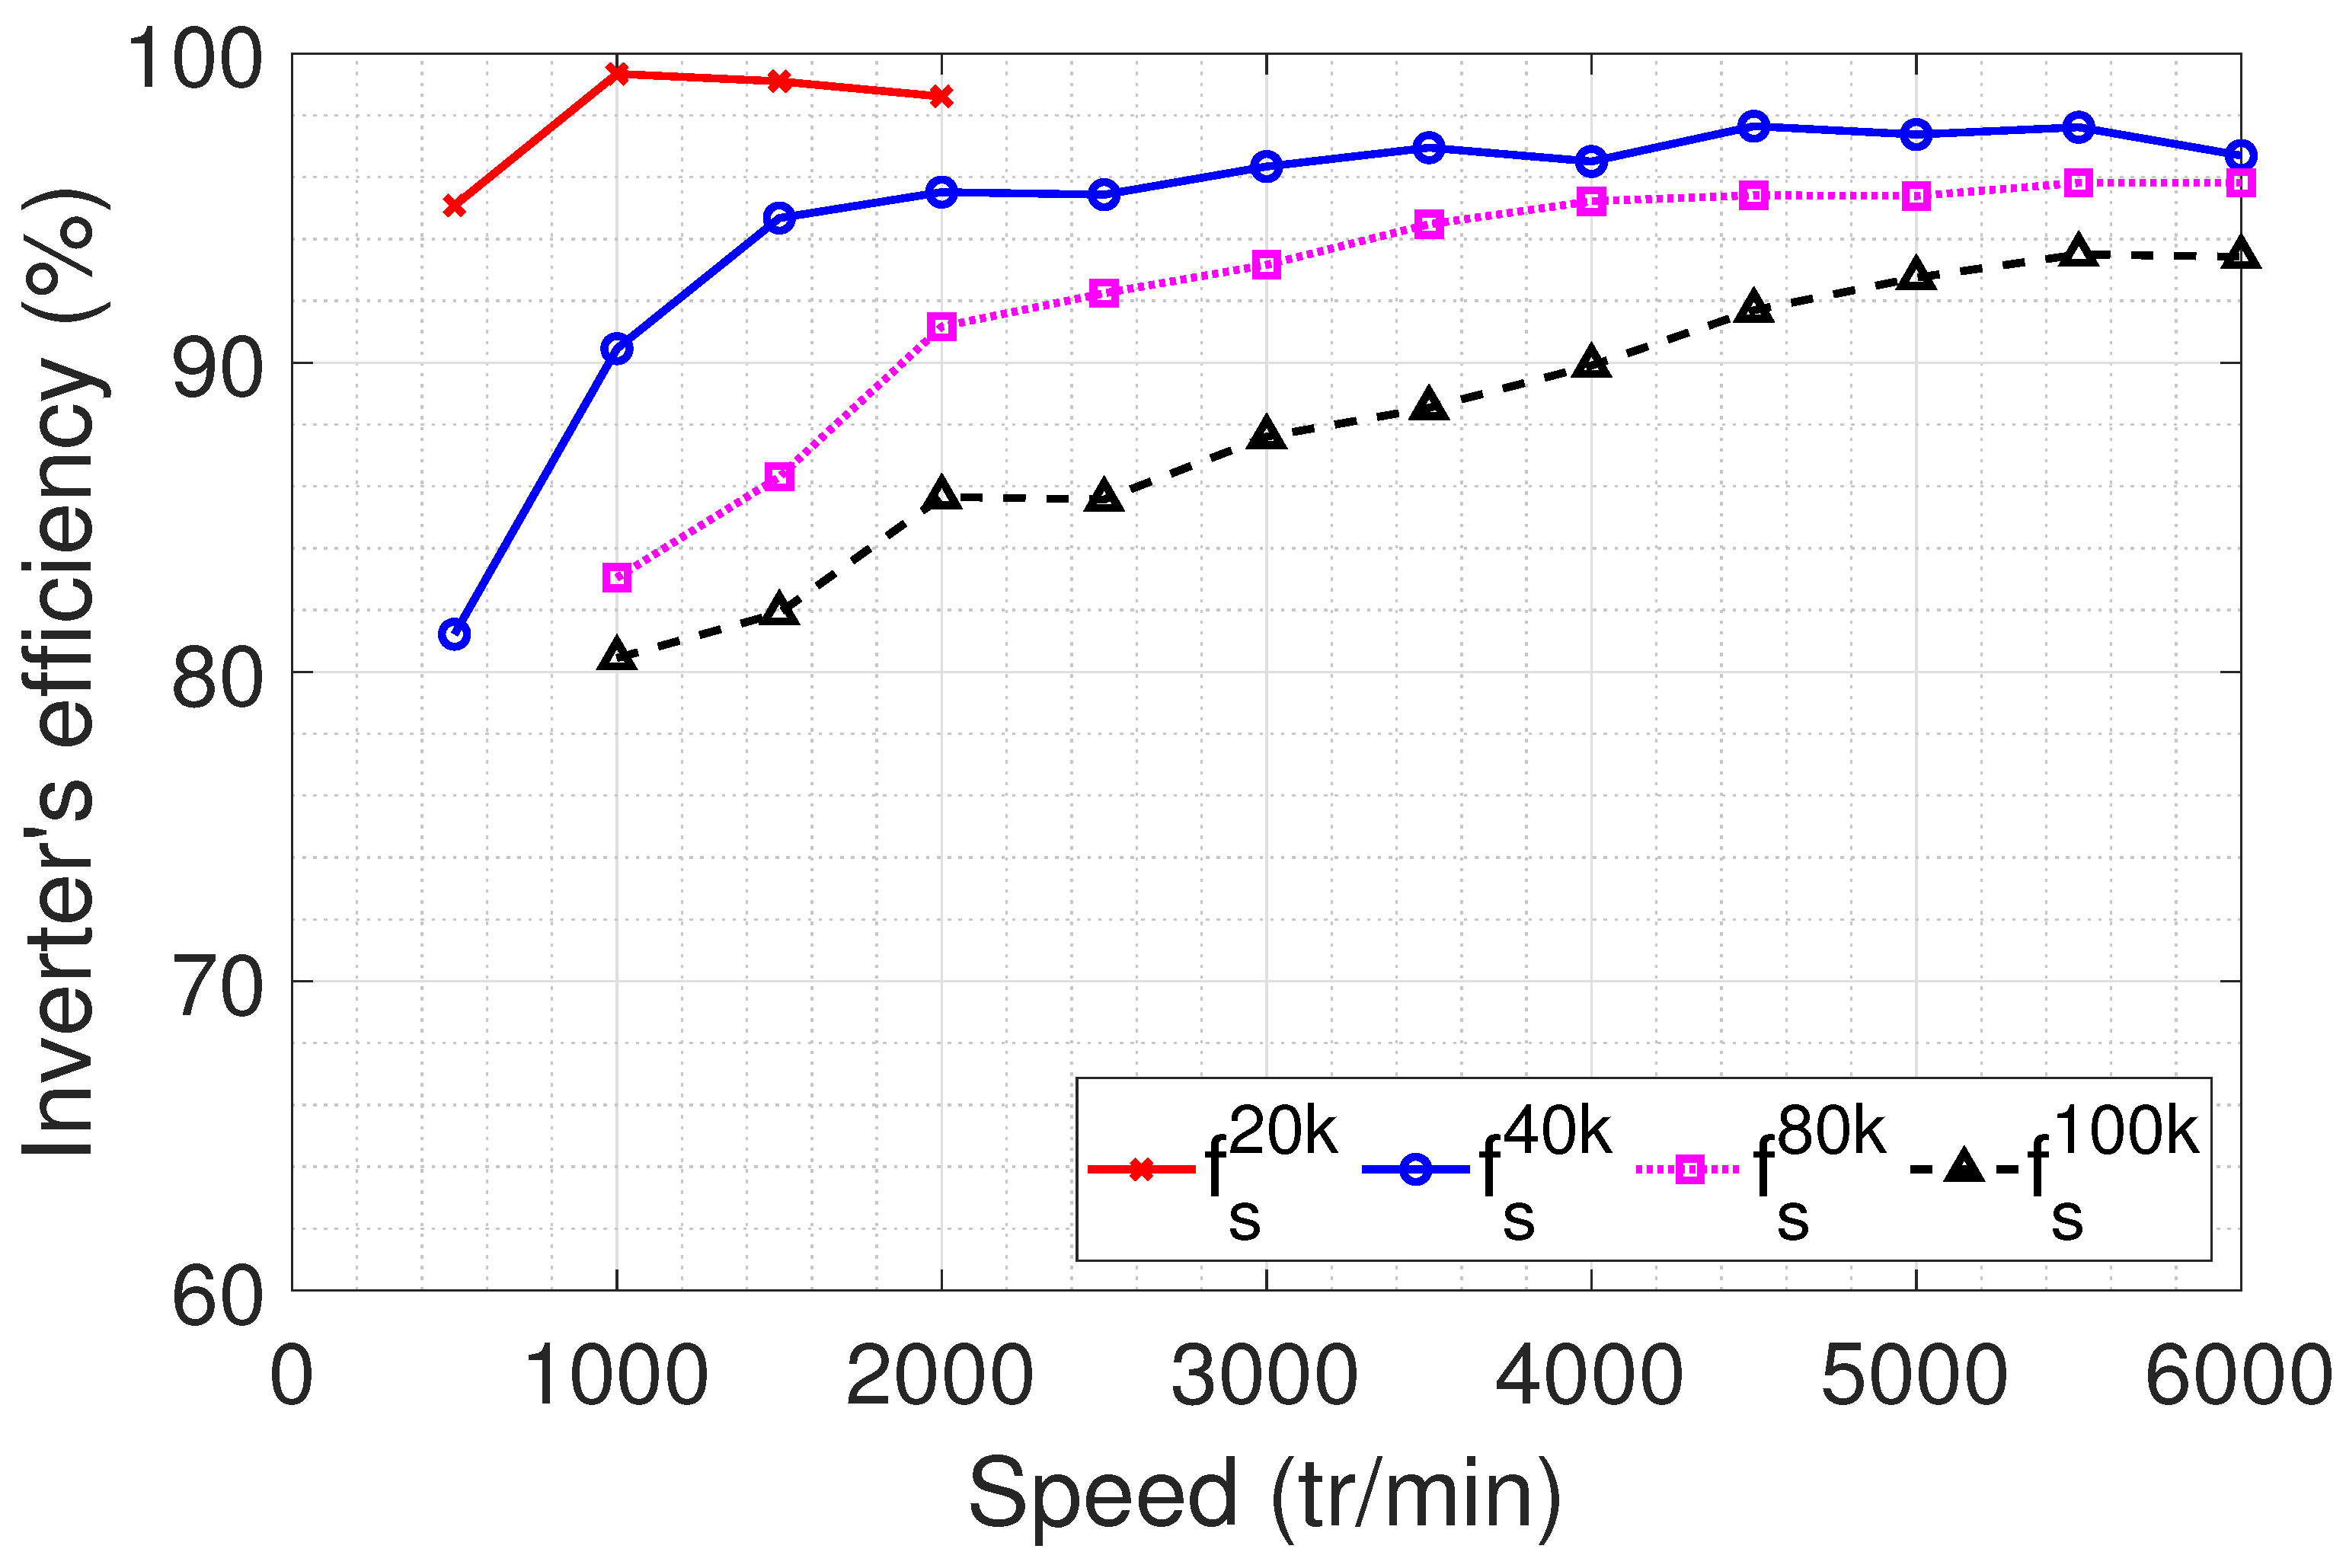
Although increasing the switching frequency has beneficial effects on electrical machines, such as maintaining relatively constant torque, reducing losses, and increasing efficiency, it adversely affects converter efficiency.
Figure 28 presents the experimental results conducted for inverter efficiency at different frequencies. These curves were derived from power measurements at the input and output of the inverter (SiC-MOSFET) during load tests (
Figure 16). This finding implies the existence of an optimal switching frequency to maximize the efficiency of the conversion chain (inverter + motor), which may not necessarily be the highest frequency.
5.4. Overall Efficiency for PMSM and Inverter
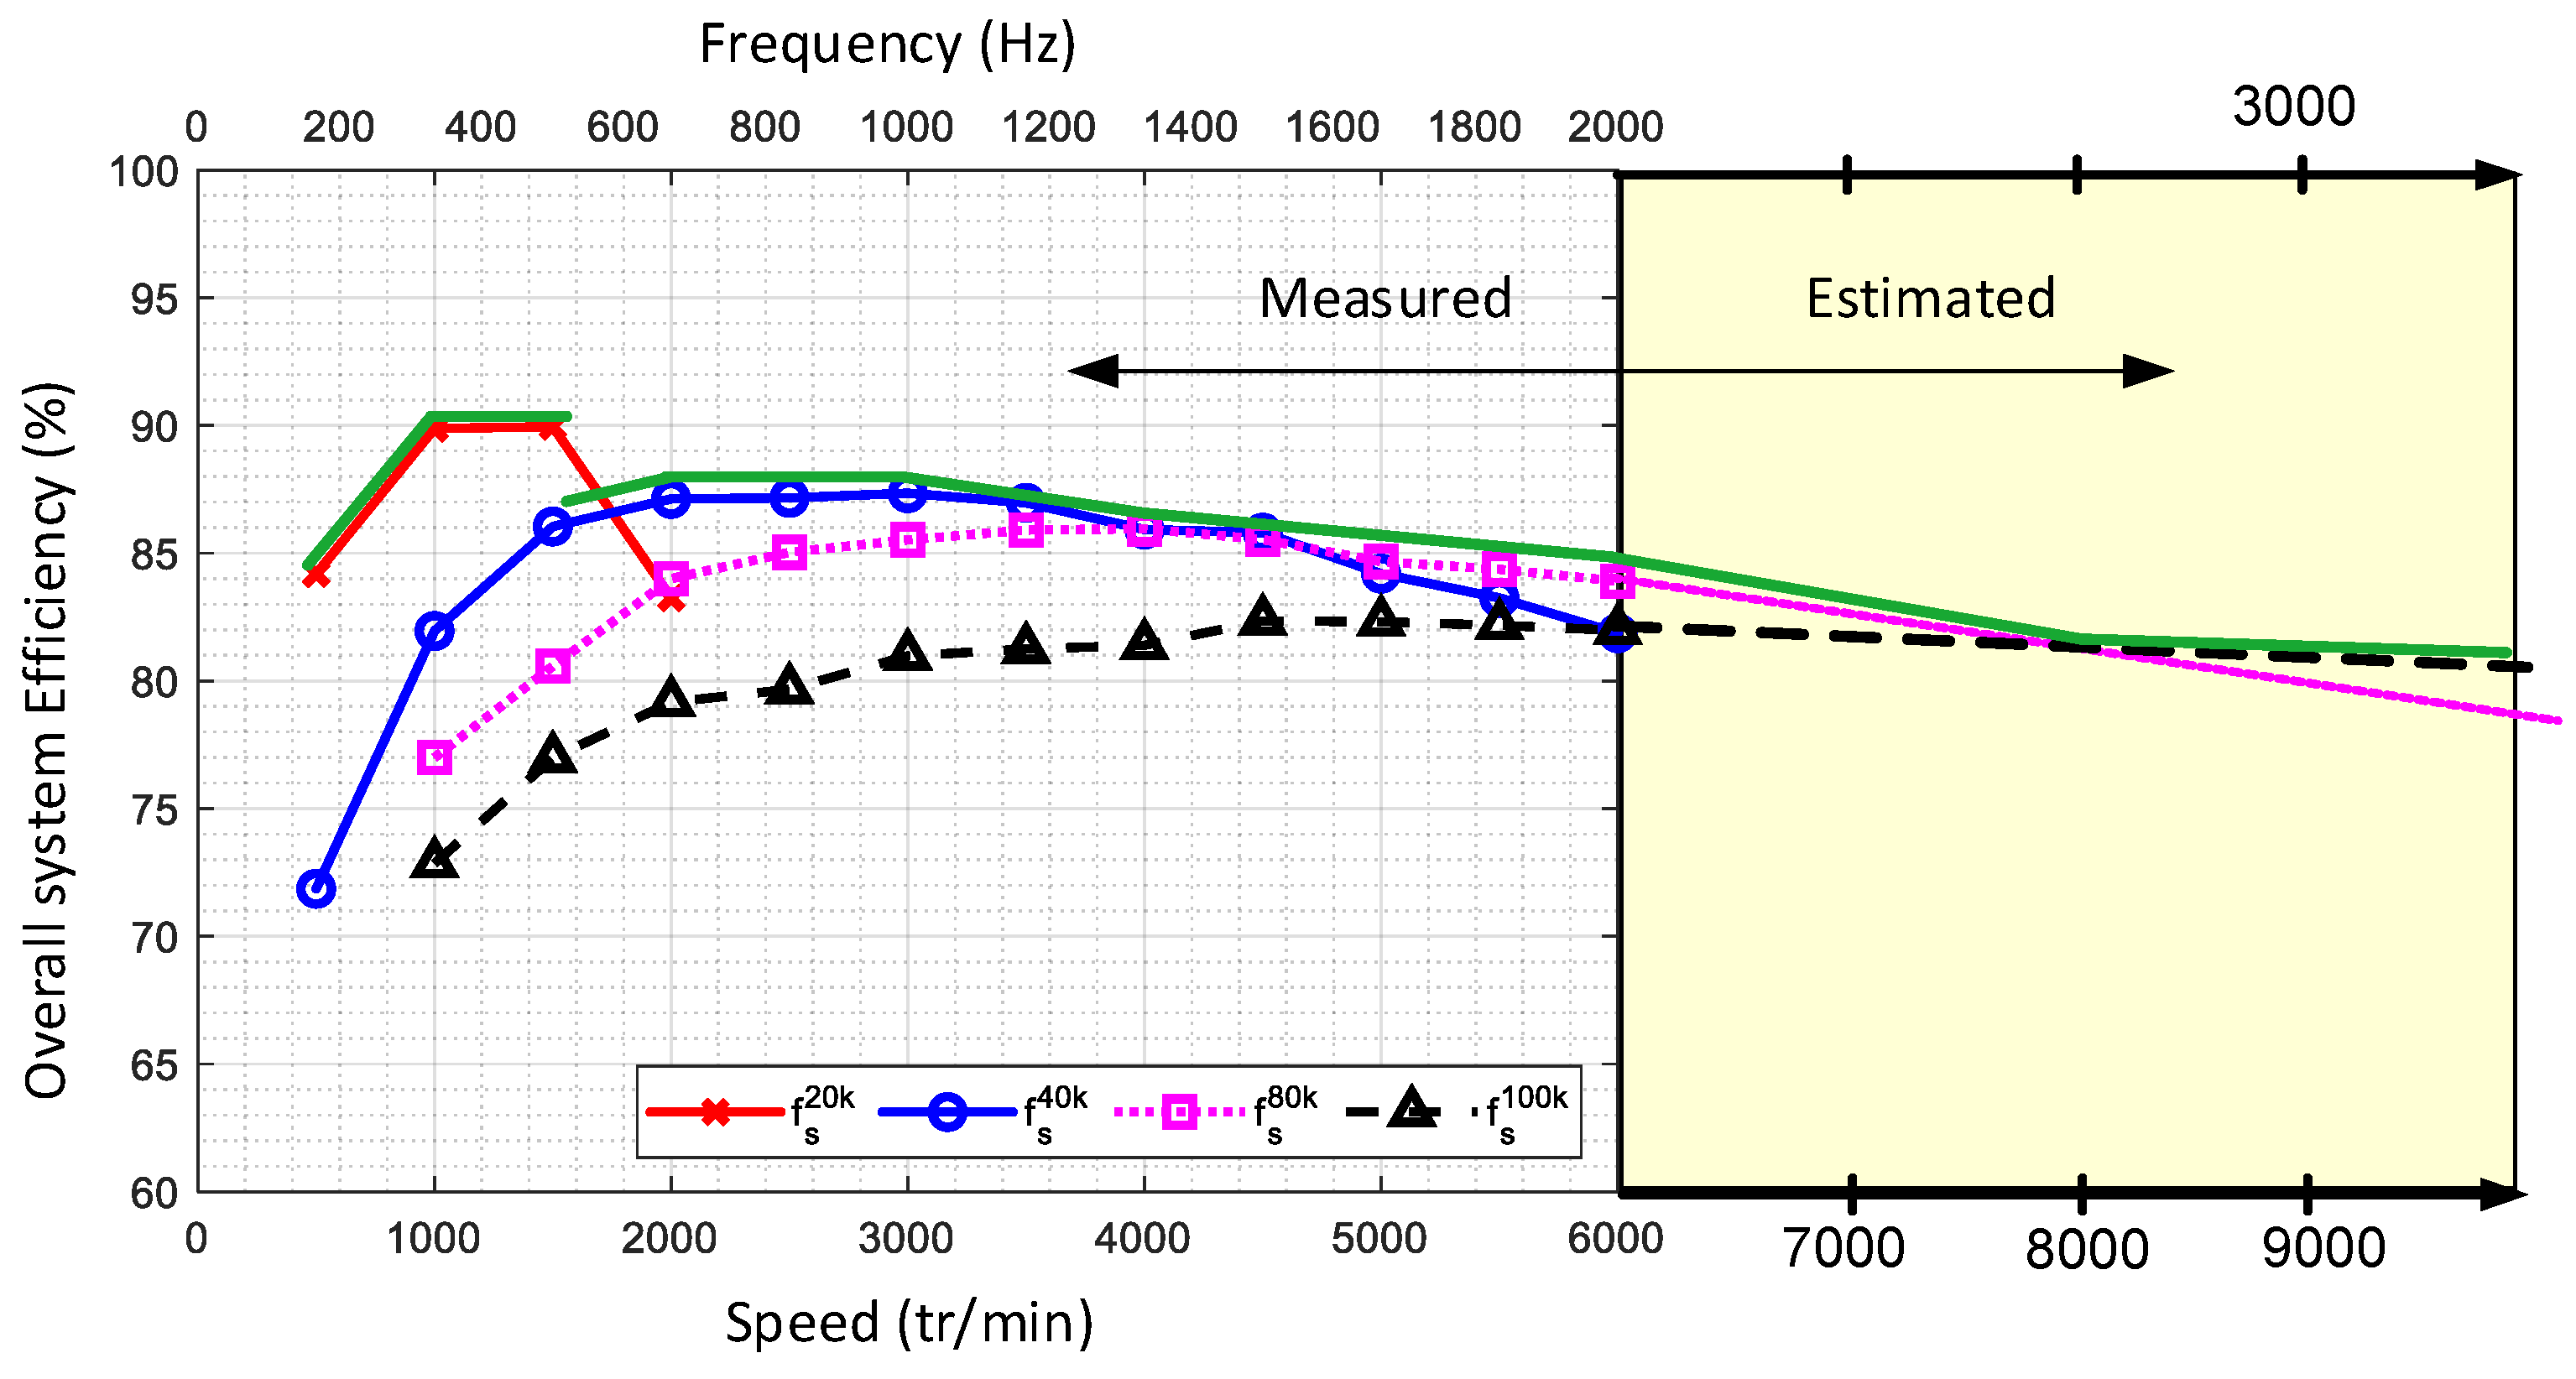
Figure 29 illustrates the measurement results of the overall efficiency of the electromechanical conversion chain (inverter + motor) as a function of speed at full load. Measurements were conducted for four different PWM frequency values. The figure reveals that at low rotational speeds (below 1500 rpm), a PWM frequency of 20 kHz yields the highest efficiency. Between 1500 rpm and 4000 rpm, the optimal efficiency is achieved with a PWM frequency of 40 kHz. For speeds exceeding 4000 rpm, selecting a switching frequency of 80 kHz is preferable. Through curve interpolation, it becomes apparent that at very high rotational speeds (measurements were limited to 6000 rpm due to the DC bus voltage constraint), the efficiency curve decreases for a PWM frequency of 80 kHz, whereas it increases for a PWM frequency of 100 kHz. Thus, a PWM frequency of 100 kHz appears necessary to optimize efficiency. These findings underscore the importance of adjusting the PWM frequency according to the rotation speed to enhance the overall efficiency of the conversion chain.
