Abstract
This study systematically investigates the formation of NOx in the thermal decomposition of N2O, focusing on the impact of Kelvin–Helmholtz (K-H) instability in combustion environments. Using premixed CH4 co-flow flames and an electric furnace as distinct heat sources, we explored NOx emission dynamics under varying conditions, including reaction temperature, residence time, and N2O dilution rates (XN2O). Our findings demonstrate that diluting N2O around a premixed flame increases flame length and decreases flame propagation velocity, inducing K-H instability. This instability was quantitatively characterized using Richardson and Strouhal numbers, highlighting N2O’s role in augmenting oxygen supply within the flame and significantly altering flame dynamics. The study reveals that higher XN2O consistently led to increased NO formation independently of nozzle exit velocity (ujet) or co-flow rate, emphasizing the influence of N2O concentration on NO production. In scenarios without K-H instability, particularly at lower ujet, an exponential rise in NO2 formation rates was observed, due to the reduced residence time of N2O near the flame surface, limiting pyrolysis effectiveness. Conversely, at higher ujet where K-H instability occurs, the formation rate of NO2 drastically decreased. This suggests that K-H instability is crucial in optimizing N2O decomposition for minimal NOx production.
1. Introduction
Since the establishment of the United Nations Framework Convention on Climate Change (UNFCCC) in 1992, the world has united to confront the escalating issue of global warming. The International Conference on Parallel Processing (ICPP) recently advocated for a substantial reduction in global greenhouse gas emissions, targeting a minimum 45% decrease by 2030 relative to 2010 levels. This initiative aims to cap the global average temperature increase to 1.5 degrees Celsius by the year 2100. In response, leading global entities, including the European Union (EU), the United States, China, and Japan, have established their own specific emissions reduction goals. In line with these efforts, South Korea declared its 2030 National Greenhouse Gas Reduction Target in October 2020, seeking to achieve a 37% reduction from “business as usual” (BAU) trajectories [1].
Greenhouse gases refer to specific gases that absorb or reflect infrared radiation emanating from the Earth’s surface into space, thereby raising the Earth’s surface temperature. According to the Kyoto Protocol, major anthropogenic greenhouse gases such as carbon dioxide (CO2), methane (CH4), nitrous oxide (N2O), hydrofluorocarbons (HFCs), perfluorocarbons (PFCs), and sulfur hexafluoride (SF6) are subject to regulation [2]. Among these, N2O ranks third in emission volume following CO2 and CH4 and possesses a global warming potential 310 times greater than that of CO2 [3,4,5,6]. N2O, the most chemically stable of these gases, has an atmospheric life span of approximately 150 years, enabling it to reach the stratosphere with minimal degradation. In the stratosphere, N2O undergoes photodissociation or reacts with atomic oxygen (O), forming nitric oxide (NO), which subsequently participates in a catalytic cycle of ozone (O3) depletion [7,8]. The reaction pathway is as follows:
N2O + O → 2NO,
NO + O3 → NO2 + O2,
NO2 + O → NO + O2.
In addressing the challenge of reducing N2O emissions, thermal decomposition emerges as a particularly promising approach among various technologies [9,10,11,12,13,14,15]. This process is governed by a series of critical chemical reactions, crucial for understanding the N2O thermal decomposition mechanism:
N2O (+M) ⇌ N2 + O (+M),
N2O + O ⇌ N2 + O2,
N2O + O ⇌ 2NO,
NO2 + O ⇌ NO + O2,
NO + O + M ⇌ NO2 + M,
NO2 + O ⇌ NO + O2.
In these equations, “M” signifies a third body that aids in the decomposition process. The predominance of reactions (4) and (5) at elevated temperatures plays a significant role in effectively diminishing N2O concentrations. However, a crucial aspect of this mechanism is the potential formation of NOx, as delineated by reactions (6) to (9). This underlines the importance of maintaining controlled environmental conditions to suppress NOx generation during the N2O decomposition. Addressing these complexities is essential for the effective reduction of N2O, especially given the intricate interplay of variables in the reaction environment.
Recent studies have underscored the profound influence of temperature on the decomposition efficiency of nitrous oxide (N2O). For instance, research indicates that a rise in temperature from 820 °C to 880 °C leads to a significant reduction in N2O emissions [16]. In the realm of oxy-combustion, an increased oxygen concentration has been identified as a crucial factor in enhancing the breakdown of N2O [17]. The core reaction in N2O decomposition is a third-body reaction, where gases like N2, O2, CO2, and H2O act as catalysts, accelerating the process [18]. This reaction has shown increased efficiency under diverse atmospheric conditions, especially in CO2 and N2 environments [19,20]. These findings highlight the critical role of atmospheric composition in optimizing N2O decomposition, particularly at higher temperatures. However, there remains a notable gap in the literature regarding the quantitative analysis of NOx production from the N2O thermal decomposition process, particularly concerning reactions (6) to (9). This gap signifies a pressing need for further research to understand and quantify NOx emissions arising from N2O decomposition under various conditions.
Meanwhile, thermal decomposition processes are primarily categorized by their heat sources: electric furnaces [9,10,11], plasma [12,13], and combustion [14,15]. Although using an electric furnace as the heat source offers operational simplicity and lower technical demands, it incurs higher maintenance costs. On the other hand, plasma-based decomposition, while maintaining a lower overall temperature of the fluid medium, can generate localized reaction temperatures as high as 10,000 °C, leading to a significant production of thermal NOx [21]. However, combustion as a heat source is distinguished in terms of processing efficiency, power requirements, operability, and maintenance costs, especially in sectors other than NOx emissions, thus positioning it as the most effective technology for N2O reduction. Recent research [10,22,23] underscores the impact of the mixture’s residence time and reaction temperature on the emission characteristics of N2O and NOx, highlighting the necessity for detailed analytical data on nitrogen oxide reaction processes in the practical implementation of high-temperature thermal decomposition technology.
In the case of using combustion as a heat source, the intrinsic combustion instability [24,25,26,27,28,29,30,31] of flames presents challenges for stable thermal energy supply. This is particularly problematic when considering the decomposition of N2O, as such instabilities negatively impact the efficiency and stability of the reaction. Among these, Kelvin–Helmholtz (K-H) instability, commonly found in jet flames, induces significant changes in the combustion field due to its large amplitude. This type of instability originates from convective disturbances at the laminar flame front and is known to generate oscillating frequencies between 10 Hz and 20 Hz, influenced by varying burner sizes, flow rates, and fuel compositions [26,27,28,29]. Research by Chen et al. [30] employed the Mie scattering technique to elucidate the vortex structures surrounding flickering diffusion flames. Their analysis suggests that buoyancy within hot combustion gases amplifies axial flow velocities, which in turn leads to the formation of shear layers between the flame and surrounding air, complicating consistent control over the N2O decomposition reaction. To overcome these issues, development of controllable burner technologies and flame stabilization mechanisms is necessary.
When using an electric furnace as the heat source, unlike combustion reactions, there are limitations for commercial applications due to its higher maintenance costs and inability to handle large volumes of gas. However, an electric furnace offers advantages such as ensuring uniform temperature of reactants and precise residence times. It also allows experiments across various temperature ranges, which is why it was commonly adopted as experimental equipment in prior research [32] that utilized thermal decomposition. Therefore, an electric furnace can be considered a highly useful tool for validating reaction mechanisms derived from N2O thermal decomposition processes that employ combustion as the heat source.
In this study, we aim to focus on combustion as a heat source among various N2O treatment technologies utilizing thermal decomposition, with a particular interest in the relationship between the decomposition rate of N2O and NOx emissions in the presence or absence of combustion instability. Specifically, our primary objective is to establish a correlation between the emissions of NO and NO2 within combustion zones where K-H instability occurs. Additionally, to support our hypothesis regarding NOx emissions under conditions of K-H instability, we plan to conduct parallel analyses using an electric furnace as an alternative heat source, examining the trends of NO and NO2 emissions in relation to reaction temperature. This approach is expected to provide empirical evidence supporting the connection between K-H instability and NOx emissions.
2. Experimental Methodology and Conditions
In our study of N2O thermal decomposition, we have employed two distinct heat sources: premixed CH4 Co-Flow Flames and an electric furnace.
Premixed CH4 Co-Flow Flames: As depicted in Figure 1, our experimental setup is designed to explore the thermal decomposition characteristics of N2O using a premixed flame. The co-flow burner employed in our experiment has internal and external diameters measuring 1 cm and 3 cm, respectively. The internal nozzle, extending to a length of 71 cm, is constructed of stainless steel to ensure a stable premixed gas flow. The co-flow tube, fashioned from acrylic, allows for internal observation. The central internal nozzle, acting as the primary heat source, facilitates high-temperature decomposition of N2O, injected through the co-axial tube, establishing flame attachment.

Figure 1.
Schematic diagram of the experimental setup: premixed CH4 co-flow flames.
The premixed gas mixture, detailed in Table 1, comprises 10% CH4, 19% O2, and the balance of 71% CO2 as a diluent. We set Φ = 1, aiming to prevent any additional reaction of unburned oxygen with N2O in the downstream flame, which could potentially result in NOx formation. To assess the N2O reduction effect in relation to flame size, we varied the nozzle exit velocity (ujet) at 55, 55, and 60 cm/s. The co-axial flow, incorporating CO2 as the primary gas, diluted N2O to concentrations of 0, 20%, 25%, and 30%. Additionally, to evaluate residence time efficiency, co-flow rates were established at 0.84, 0.88, and 0.92 L/min.

Table 1.
Tested gas composition.
For gas supply control, a mass flow controller, calibrated by a gas calibrator, was utilized. Combustion gases emitted from the downstream flame were analyzed for concentrations of NO, NO2, O2, and CO2 using a gas analyzer (ECOM, MK 6000+). Here, the gas analyzer was installed 30 cm downstream from the nozzle. The contribution to NOx emissions, as measured by the gas analyzer, was attributed exclusively to the N2O injected via the co-axial flow, as all gases supplied to the reactor were devoid of nitrogen. Flame imagery was captured at 30 fps using a digital camcorder (Sony, HDR-PJ675).
Electric furnace: In addition to experiments using combustion reactions as the heat source, our study also adopted an electric furnace as a means of thermal decomposition of N2O. This approach was taken to introduce an electric furnace that ensures uniform reaction temperatures and precise residence times of reactants, thereby revalidating inferences about NOx emission characteristics derived from the N2O decomposition process in combustion reactions.
Figure 2 shows the setup, featuring an 850 mm-long, 10 mm-inner diameter alumina tube within the electric furnace. Internal coils, positioned at 100 mm intervals around the tube, create a 200 mm high-temperature pyrolysis zone from the center towards both inlet and outlet. This setup allows precise temperature control using internal coils and adjustable gas flow for reaction time calculations. Additionally, to suppress heat loss from the pyrolysis zone to the outside, the tube is wrapped with ceramic fiber. The length of this insulation section is 350 mm, which is greater than the 200 mm high-temperature pyrolysis zone. Five reaction temperatures (1100 K to 1500 K) and three residence times (1, 2, and 4 s) were selected. The rationale behind these choices is discussed in Section 3.4.1.
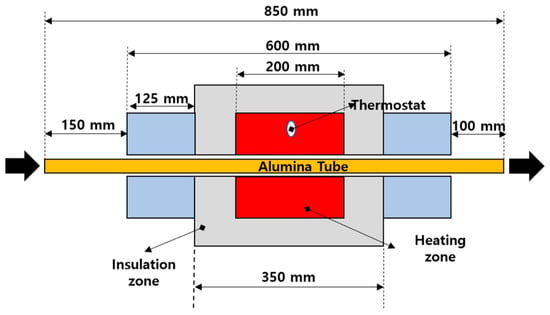
Figure 2.
Schematic diagram of the experimental setup: electric furnace.
The experimental gas mixture simulated ambient conditions: N2 (71.1%), O2 (18.9%), and N2O (100,000 ppm). Gases entered the reactor via a mass flow controller (MFC) and effluent gas was analyzed using combustion gas analysis systems: a TESTO 350 MARITIME and Fourier-transform infrared gas analyzer (I1801-E, Midac, Redford, MI, USA) at the Eco-friendly Shipbuilding Core Research Support Center. The nitrogen oxides’ measurable range is NO2 up to ~500 ppm and NO up to ~3000 ppm. Expecting effluent gas NOx concentrations to exceed this range, we cooled and diluted it using Argon (Ar) in a dilution tube equipped with ceramic beads and mesh for uniform gas flow. Silica gel removed moisture, ensuring dry measurement conditions.
Each residence time’s gas flow rate was calculated using Equation (10):
where Q is the flow rate, D the alumina tube’s inner diameter, L its length, and t the residence time. Charles’s law was applied to maintain constant residence time across different reaction temperatures:
where Q1 is the input flow rate, T1 the input temperature, Q2 the flow rate at each residence time, and T2 the reaction temperature.
3. Results and Discussion
3.1. Effects of Nozzle Exit Velocity: Premixed CH4 Co-Flow Flames
Figure 3a depicts flame images as a function of ujet with varying N2O dilution rates (XN2O) injected into the co-flow, and the flame images were captured using a digital camera. The co-flow rate used in Figure 3a was fixed at 0.88 L/min. As evident from the figure, an increase in XN2O and ujet results in the elongation of the flame length.

Figure 3.
(a) Captured flame images and (b) flame propagation velocity in Bunsen premixed flame with varied nozzle exit velocities, ujet, under a constant value of Qco = 0.88 L/min.
In the context of premixed flames, the location of the flame front is typically determined by the point at which the flame propagation velocity (Sf) aligns with ujet [33]. For the methane premixed gas utilized in our experiment, the theoretical laminar burning velocity (SL) is approximately 4 cm/s. To form an attached flame, ujet needs to be maintained above this threshold. Practically, as the premixed gas is ejected from the nozzle, its velocity diminishes due to momentum loss. Consequently, the flame is positioned at the point where the flame propagation velocity and the flow velocity reach equilibrium, resulting in the formation of a triangular combustion reaction zone. If ujet falls below the flame propagation velocity, flashback can occur, a phenomenon characteristic of premixed flame propagation dynamics.
Figure 3b illustrates the flame propagation velocity as a function of ujet and XN2O. Consistent with premixed flame behavior, we observe that longer flame lengths correspond to slower flame propagation velocities. The methodology for calculating flame propagation velocity is illustrated in the top right of Figure 3b, with the corresponding equation provided as follows:
Sf = ujet × sin α
Even when maintaining consistent nozzle exit velocities in premixed flames, an increase in the XN2O leads to longer flame lengths and slower flame propagation velocities, as shown in Figure 3b. This behavior is attributed to the impact of N2O reduction, which facilitates the generation of additional oxygen atoms.
In premixed flames, typically, there is only a singular premixed flame branch, in contrast to diffusion flames, which exhibit a triple-flame structure (comprising rich premixed, lean premixed, and diffusion flames) [26,27]. However, in scenarios where the external environment contains oxidizers, the diffusion flame’s tail region can manifest downstream of the premixed flame [34]. This occurs due to the diffusion-driven mass transfer process near the combustion reaction zone. Consequently, with the supply of N2O into the co-flow, additional oxygen atoms are produced through Equations (4) and (5). As a result, the local equivalence ratio near the flame tip drops below unity. This delay in the flame propagation velocity extends the flame length [34].
Figure 4 illustrates the variation in NO and NO2 formation rates with respect to ujet, and the co-flow rate is 0.88 L/min. The formation rates of NO and NO2 were derived through the following equations.
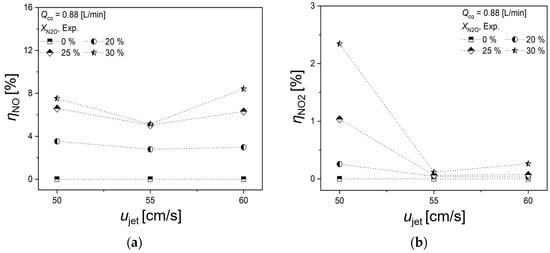
Figure 4.
Effects of ujet on (a) NO and (b) NO2 formation rate.
Equations (13) and (14) represent the conversion ratios of NO and NO2 according to the N2O injection rate, where “in” and “out” denote the combustion chamber inlet and outlet, respectively.
Upon analyzing Figure 4a, it is noted that the rate of NO generation remains largely unchanged across various ujet, with its dependence primarily on XN2O. Particularly for XN2O = 25% and 30%, there is an insignificant variation in the NO formation rates. In contrast, the NO2 formation rate exhibits a distinct behavior: at ujet = 55 and 60 cm/s, the NO2 production is minimal, whereas at ujet = 50 cm/s, the NO2 formation rate escalates in correlation with XN2O. However, when comparing the NO and NO2 formation rates, it is apparent that the production of NO is substantially higher.
The relatively lower NO2 formation rate, compared to NO, is attributed to the rapid formation of thermal NOx in high-temperature fluid media, typically above 1300 °C [10,21]. The produced NOx predominantly consists of NO, as NO2 tends to decompose into NO and O2 at temperatures above 650 °C, as illustrated by the reaction:
2NO2 → 2NO + O2
Therefore, when N2O, injected into the co-flow, interacts with the high-temperature flame surface, it decomposes into nitrogen molecules and oxygen atoms. If these decomposed species linger in the high-temperature environment, they further break down into NO and nitrogen atoms, thereby augmenting NO production. As shown in Figure 4, an increase in N2O injection rate leads to a higher concentration of N2O interacting with the high-temperature flame surface, which, in turn, escalates the NO generation rate.
Moreover, it is observed that at XN2O = 25% and 30%, the N2O reduction due to heat release from the premixed flame reaches a saturation point. Consequently, this indicates the presence of a threshold in XN2O, beyond which the NO conversion rate reaches saturation, leading to minimal differences in NO formation rates at these higher dilution levels.
3.2. Effects of Co-Flow Rate: Premixed CH4 Co-Flow Flames
Figure 5a,b illustrate the variation in NO and NO2 formation rates in the N2O reduction process, particularly at ujet = 55 cm/s, and its dependence on the co-flow rate. Figure 5a shows that the NO formation rate increases consistently with XN2O, regardless of the co-flow rate. Significantly, it is observed that at XN2O exceeding 25%, the NO formation rate attains a saturation point, resulting in consistent formation rates at these elevated dilution levels.

Figure 5.
Effects of Qco on (a) NO and (b) NO2 formation rates at ujet = 55 cm/s, and (c) NO2 formation rate at ujet = 50 cm/s.
Similarly, Figure 5b demonstrates that the NO2 formation rate also increases with XN2O, irrespective of the co-flow rate. Contrasting with the general trend, the highest NO2 generation is observed at XN2O = 30% and Qco = 0.88 L/min. However, given that the NO2 formation rate remains below 0.15% consistently, this increase may not be statistically significant. Finally, Figure 5c specifically examines the scenario at ujet = 50 cm/s, which exhibited the highest NO2 formation rate. Here, the NO2 formation rate remains below 1% for all conditions, except at XN2O = 30%, where it shows an increasing trend with the rise in co-flow rate. A more detailed analysis of the NO2 formation rate, as inferred from Figure 5c, will be discussed in the subsequent sections.
In summary, from the experimental findings discussed in Section 3.1 and Section 3.2, it is evident that the NO formation rate increases with the XN2O, regardless ujet or Qco. However, for NO2 generation, except in the case of ujet = 50 cm/s, the production of NO2 is generally minimal.
3.3. Correlation between NOx Formation Rate and K-H Instability: Premixed CH4 Co-Flow Flames
Figure 6 presents the conversion of NO and NO2 emission quantities to ppm for all conducted experimental cases to provide a relative comparison in the N2O reduction process. The figure exhibits two distinct trends. Firstly, at nozzle exit velocities of 55 and 60 cm/s, the NO2 emission quantity is negligible, irrespective of the NO emission quantity. On the other hand, at ujet = 50 cm/s, it is observed that the NO2 emission quantity proportionally increases in a square root function with the increase in NO emission quantity.
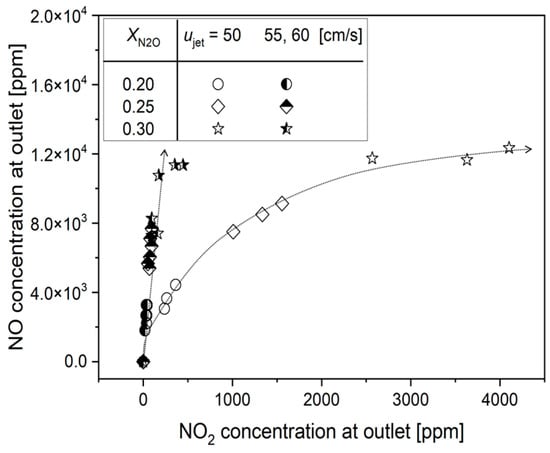
Figure 6.
Relative comparison of NO and NO2 emissions in N2O reduction process. The dashed line represents the variation in NOx emission trends according to ujet.
For a detailed understanding of the NO2 formation mechanism at ujet = 50 cm/s, flame dynamic behaviors were observed by recording with a digital camcorder. The observation revealed that, unlike at ujet = 55 and 60 cm/s, consistent oscillations near the flame tip were observed at ujet = 50 cm/s. Figure 7 presents the fast Fourier transform (FFT) analysis results for flame flickering at ujet = 60 cm/s. With a derived oscillation frequency of 12.65 Hz at ujet = 55 cm/s, Qco = 0.88 L/min and XN2O = 0.25%, it is attributed to the influence of K-H instability due to flame flickering.
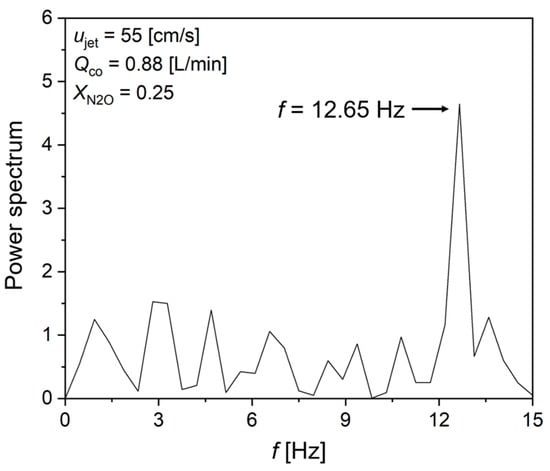
Figure 7.
FFT result of K-H instability at ujet = 55 cm/s, Qco = 0.88 L/min and XN2O = 0.25%.
K-H instability is known for convectional flow instability resulting from density differences between burned and the surrounding gases [24,25,26,27]. The combustion field is particularly prone to K-H instability as the density of burned gas in flames is typically six to seven times smaller than that of the unburned gas. According to previous studies on K-H instability, the characteristic oscillation frequency is in the range of 10–15 Hz [26,27]. Therefore, in the N2O reduction process, the presence of K-H instability within the flame leads to instability in the co-flow field supplying N2O to the flame surface. The high-temperature heat released from the flame causes accumulation near the nozzle due to recirculation, suppressing the NO2 formation rate, which corresponds to relatively lower-temperature oxidation reaction.
Furthermore, according to previous research [9,35] on the influence of residence time in high-temperature flow fields, an increase in residence time in the mixing chamber within a high-temperature flow field is reported to decrease the optimal temperature for N2O reduction. In this study, when K-H instability occurs in the chosen flame as the heat source, a flow structure resembling a vortex is formed near the flame surface. This formation increases the residence time of the surrounding N2O, and the vortex-shaped flow enhances convective heat transfer from the flame to the surrounding medium. Consequently, the NO2 generation rate corresponding to the relatively lower-temperature reactions naturally decreases. Therefore, selecting ujet that induces K-H instability to form a recirculation structure in the surrounding medium is considered effective not only for N2O reduction efficiency but also for reducing NO2 generation.
Most previous studies [26,27,31,36,37] on K-H instability have focused on characterizing it using the Richardson number (Ri), which represents the ratio of buoyancy to shear flow, and the Strouhal number (St), which describes the characteristics of oscillating flow field. While the constants of the relational equation vary depending on the gas composition, mixing conditions, and the structure of the burner, it has been consistently observed that St is exponentially proportional to the Ri. Therefore, in this study, FFT analysis was conducted under ujet = 55 and 60 cm/s, where K-H instability was observed. Figure 8a displays frequency changes according to the co-flow rate, with frequencies ranging from 7.5 to 12.5 Hz. Figure 8b, based on the derived frequencies, applies the Ri and St as suggested in previous studies, illustrating their correlation. Here, “f” represents frequency, “Lf” the flame length, “uco” the co-flow velocity, “ρco” the density of the co-flow, “ρb” the density of burned gas, and “g” the gravitational acceleration. As shown, similar to prior studies, St is found to be proportional to Ri.
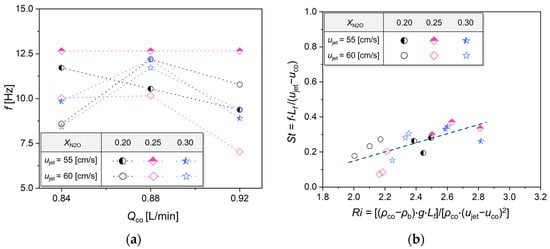
Figure 8.
(a) Frequency variation with Qco and (b) correlation between Richardson number and Strouhal number in K-H instability.
Here, we aim to physically evaluate the contributions of each variable that composes Ri in K-H instability. Firstly, the difference in density between the surrounding gas and the burned gas, represented as ρco − ρb, indicates that an increase in this density difference intensifies K-H instability. Additionally, the momentum of the jet, represented as ujet − uco, is included in the denominator of Ri as a square. This implies that at lower velocity differences, K-H instability is dominated by buoyancy, but at higher velocity differences, it is influenced by both the buoyancy and momentum of the jet, in line with previous research findings [36,37].
3.4. NOx Emission Characteristics in Non-Combustion: Electric Furnace
3.4.1. Determining Reaction Temperatures
In the context of our study, as elaborated in Section 3.3, the occurrence of K-H instability enhances the residence time within the recirculation zone, which subsequently increases the NO formation rate while diminishing the NO2 formation rate. This section is dedicated to examining the formation of NOx as a result of N2O reduction in an electric furnace, distinctively absent of combustion reactions. Firstly, a numerical analysis simulating the co-flow flame was conducted to set a reaction temperature in the electric furnace similar to that in the combustion experiments. The numerical analysis utilized a one-dimensional reaction structure analysis model, the Plug Flow Reactor (PFR), integrated into the ANSYS Chemkin-Pro 2022 software [38], and calculations were performed using the GRI 3.0 reaction mechanism [39].
Figure 9a presents the schematic for the computational domain. The top view of the simulated coaxial burner, depicted in Figure 9b, shows N2O and diluents being emitted from the area labeled “Aco-flow,” which forms an annulus region. For PFR model application, a circle with a diameter of Dcal = 2.79 cm, corresponding to this annulus area, was chosen. The reactor’s length was set to align with the observed flame length. The reactants, mirroring the composition used in the co-flow flame experiment, were a mixture of CO2 as the primary gas, diluted N2O to concentrations of 0, 20%, 25%, and 30%, and the co-flow rates were maintained at 0.84, 0.88, and 0.92 L/min. The reactor wall was maintained under adiabatic conditions to simulate realistic thermal behavior. The primary objective of this calculation was to ascertain the reaction temperature for N2O decomposition within the co-flow flame setup. This was achieved by aligning the experimental NO emission data with the calculated NO values; the corresponding wall temperature at this intersection was then established as the reaction temperature, “Tmodel,” for N2O decomposition.
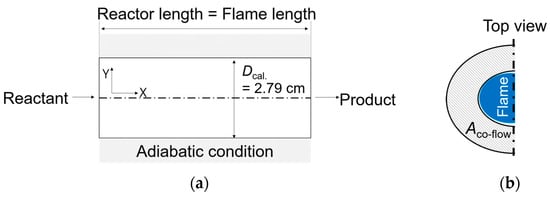
Figure 9.
(a) Schematic of computational domain and (b) top view of the co-flow burner.
Figure 10 displays the transformation rates of NO and NO2 at varying calculated reaction temperatures. It is observed that NO emissions escalate with an increase in reaction temperatures, while the emission of NO2 reaches its zenith around 1325 K, subsequently diminishing as the reaction temperature further elevates. Importantly, the reduction in NO2 emissions aligns with the presence of K-H instability. Delving into the reaction coefficients from the GRI 3.0 reaction mechanism employed in our computations reveals that the activation energy for the conversion of NO to NO2 in reaction Equation (8) is 0 cal/mol, whereas for the reverse process from NO2 to NO in reaction Equation (9), it is −240 cal/mol [39]. This implies that the oxidation of NO2 to NO occurs more rapidly than its reduction from NO to NO2, suggesting a predominant conversion of NOx to NO, especially under extended residence times prompted by K-H instability. We aim to corroborate this inference with experiments conducted in an electric furnace, as detailed in the next section.
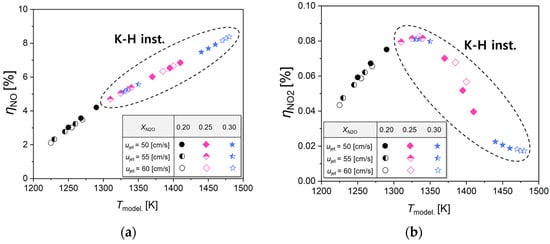
Figure 10.
Calculated reaction temperature-dependent formation rates of (a) NO and (b) NO2.
3.4.2. Effects of Reaction Temperature and Residence Time
In this section, we conducted experiments using an electric furnace as the heat source, adopting reaction temperatures derived from simulations in Section 3.4.1. This approach aimed to validate our hypothesis, discussed in Section 3.3, where the characteristics of NOx emissions vary with residence time. In the experiments utilizing the electric furnace, the gas mixture consisted of 71.1% N2, 18.9% O2, and a specific concentration of N2O (100,000 ppm). The selected reaction temperatures ranged from 1100 K to 1500 K, increasing in increments of 100 K, covering the range deduced from Figure 10. To match the NOx emission levels observed in the co-flow flame experiments (as shown in Figure 6), residence times of 1, 2, and 4 s were determined through iterative testing. Figure 11a,b display the concentrations of NO and NO2 produced due to N2O decomposition within the electric furnace. Remarkably, the generation of NO shows a linear increase with escalating reaction temperatures, exhibiting consistent results regardless of residence time, mirroring findings from the co-flow flame tests. In contrast, the NO2 output demonstrates an exponential escalation at a residence time of 1 s, with reaction temperatures rising; however, it becomes significantly minimal at a residence time of 4 s. These results corroborate the observations from co-flow flame experiments and validate our hypothesis: K-H instability leads to diminished NO2 emissions as residence time increases during the N2O decomposition process.
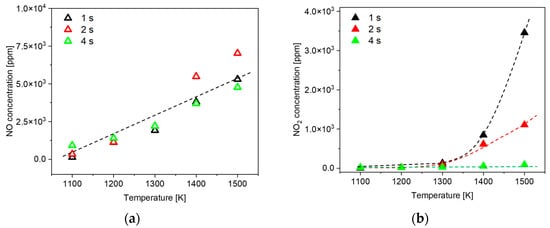
Figure 11.
Effects of reaction temperature and residence time on the concentrations of (a) NO and (b) NO2 at electric furnace.
3.5. Comprehensive Characterization of NOx Emissions in the N2O Thermal Decomposition Process
Here, we focus on elucidating the interplay between K-H instability and the emission characteristics of NOx in the N2O thermal decomposition process. Figure 12 elucidates the relationship between effective thermal conductivity and the formation rates of NO and NO2. We propose a novel approach to define effective thermal conductivity, , as a pivotal parameter influencing NOx emissions in co-flow flame scenarios. This approach is represented by a formula expressed in terms of a dimensionless number:
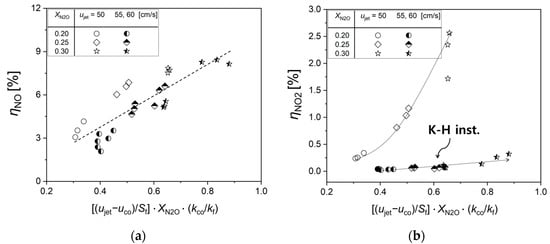
Figure 12.
Characterization of (a) NO and (b) NO2 formation rates with effective thermal conductivity in N2O decomposition process.
In this formula, the first term embodies a dimensionless velocity factor, represents the co-flow shear layer (), normalized by the flame propagation velocity (), which is related to K-H instability (refer to Figure 8b). The second term, representing the N2O dilution concentration (), provides the eigenvalue for the NOx formation rates (refer to Figure 4 and Figure 5). The third term, representing normalized thermal conductivity, symbolizes the ratio of the thermal conductivity of the burned gases, which exerts the most dominant influence on N2O thermal decomposition, to the thermal conductivity of the co-flow gas derived from the reaction temperatures established in Section 3.4.1. An increase in normalized thermal conductivity enhances heat transfer from the burned gas to the co-flow gas, thereby increasing the NOx conversion rate (refer to Figure 11).
Figure 12a reveals that an elevation in effective thermal conductivity linearly escalates the NO formation rate. Contrastingly, the NO2 formation rate exhibits two distinct trends contingent on the occurrence of K-H instability. In scenarios where K-H instability is not present, as at ujet = 50 cm/s, an increment in effective thermal conductivity triggers an exponential rise in NO2 formation rate. On the contrary, at ujet = 55 and 60 cm/s, where K-H instability is present, the NO2 formation rate experiences a linear, albeit gradual, increase. Below are the respective fitting equations for each scenario, with “R” indicating the correlation coefficient:
Drawing from the detailed outcomes of this research, our findings are expected to significantly inform the development and operational strategies of combustion systems tailored for N2O reduction processes. This entails designing and managing these systems to optimize their functionality while substantially lowering NOx emissions. Particularly when adopting combustion as the heat source, the intrinsic combustion instability is inherently challenging to eliminate, thereby emphasizing that the recirculation structure of the flow field induced by combustion instability can modify the residence time of the reactants. Therefore, if the results of this study are applied from an engineering perspective, it can be inferred that using the instability characteristics represented by the Ri and St numbers proposed in our paper, the intensity of combustion instability can be quantitatively assessed. Subsequently, through , the emission rates of NO and NO2 in the burner can be predicted. This aligns with our objective of enhancing the efficiency of N2O decomposition mechanisms in a manner that concurrently addresses the environmental concerns associated with NOx pollutants.
4. Conclusions
This comprehensive study has systematically explored the intricacies of NOx formation in the N2O thermal decomposition process, specifically examining the impact of Kelvin–Helmholtz (K-H) instability in a combustion environment. Utilizing both premixed CH4 co-flow flames and an electric furnace as distinct heat sources, we have investigated the dynamics of NOx emissions under various operational conditions, including reaction temperature, residence time, and N2O dilution rates. The key findings derived from this comprehensive analysis are as follows.
- (1)
- Dynamic flame behavior: Diluting N2O around a premixed flame leads to an increase in flame length and a decrease in flame propagation velocity, along with the induction of K-H instability. The observed K-H instability within the study was quantitatively characterized using the Richardson number and the Strouhal number. This demonstrates the crucial role of N2O in augmenting oxygen supply within the flame and significantly altering the dynamics of flame behavior.
- (2)
- NO formation and N2O dilution rates: Higher N2O dilution rates consistently resulted in increased NO formation, independently of the nozzle exit velocity or co-flow rate. This underscores the significant impact of N2O concentration on NO production in thermal decomposition processes.
- (3)
- NO2 formation and K-H instability: In scenarios devoid of K-H instability, particularly at lower nozzle exit velocities (ujet = 50 cm/s), we observed an exponential increase in NO2 formation rates, attributable to the reduced residence time of N2O near the flame surface, which in turn limits pyrolysis effectiveness. Conversely, at higher nozzle exit velocities, where K-H instability is suppressed, NO2 formation rates exhibited a more gradual linear increase, suggesting that the occurrence of K-H instability is a critical factor in optimizing the N2O decomposition process for minimal NOx production.
- (4)
- Impact of effective thermal conductivity: A novel approach to define effective thermal conductivity showed that increases in this parameter linearly increased the NO formation rate. In contrast, the NO2 formation rate varied depending on the presence or absence of K-H instability, demonstrating the critical role of thermal dynamics in NOx emissions.
This research provides a comprehensive understanding of the factors influencing NOx formation in the thermal decomposition of N2O, particularly when combustion reactions are employed as the heat source. It highlights the inevitable impact of combustion instability on NOx formation, offering crucial insights for the development of more efficient and environmentally friendly burners for N2O reduction.
Author Contributions
Conceptualization, J.-H.C. and S.H.Y.; methodology, J.P.; software, S.K. and D.H.K.; validation, S.Y. and D.G.P.; formal analysis, J.P.; investigation, J.P.; resources, D.G.P. and D.H.K.; data curation, S.Y.; writing—original draft preparation, J.P.; writing—review and editing, S.H.Y.; visualization, D.G.P.; supervision, J.-H.C. and S.H.Y.; project administration, J.-H.C. and S.H.Y.; funding acquisition, S.H.Y. All authors have read and agreed to the published version of the manuscript.
Funding
This work was supported by the Technology Innovation Program (20015606, Development of the POU Scrubber with Smart Control for Simultaneous Reduction of Greenhouse Gases and Fine Dusts emitted from the Semiconductor and Display Manufacturing Process) funded by the Ministry of Trade, Industry and Energy (MOTIE, Republic of Korea).
Data Availability Statement
Data are contained within the article.
Conflicts of Interest
The authors declare no conflict of interest.
References
- Ding, J.G.; Zhang, C. The Construction of “Belt and Road Initiative” and International Climate Governance. Mod. Int. Rel. 2018, 9, 53. [Google Scholar]
- United Nations. Kyoto Protocol to the United Nations Framework Convention on Climate Change; United Nations: Geneva, Switzerland, 1998. [Google Scholar]
- Fenhann, J. Industrial Non-Energy, Non-CO2 Greenhouse Gas Emissions. Technol. Forecast. Soc. Chang. 2000, 63, 313–334. [Google Scholar] [CrossRef]
- Scott, M.J.; Sands, R.D.; Rosenberg, N.J.; Izaurralde, R.C. Future N2O from US Agriculture: Projecting Effects of Changing Land Use, Agricultural technology, and Climate on N2O Emissions. Glob. Environ. Chang. 2002, 12, 105–115. [Google Scholar] [CrossRef]
- Trogler, W.C. Physical Properties and Mechanisms of Formation of Formation of Nitrous Oxide. Coord. Chem. Rev. 1999, 187, 303–327. [Google Scholar] [CrossRef]
- Dickinson, R.E.; Cicerone, R.J. Future Global Warming from Atmospheric Trace Gases. Nature 1986, 319, 109–115. [Google Scholar] [CrossRef]
- Campbell, M.; Pierce, J.T. Atmospheric Science, Anaesthesia, and the Environment. BJA Educ. 2015, 15, 173–179. [Google Scholar] [CrossRef]
- Martin, D. Depletion of the Ozone Layer in the 21st Century. Angew. Chem. Int. Ed. 2010, 49, 489–491. [Google Scholar]
- Galle, M.; Agar, D.W.; Watzenberger, O. Thermal N2O Decomposition in Regenerative Heat Exchanger Reactors. Chem. Eng. Sci. 2001, 56, 1587–1595. [Google Scholar] [CrossRef]
- Lu, Z.M.; Lu, J.D. Influences of O2 Concentration on NO Reduction and N2O Formation in Thermal DeNOx Process. Combust. Flame 2009, 156, 1303–1315. [Google Scholar] [CrossRef]
- Hu, X.Y.; Dong, C.Q.; Yang, Y.P.; Zhang, J.J. The Effect of Biomass Pyrolysis Gas Reburning on N2O Emission in a Coal-fired Fluidized Bed Boiler. Chin. Sci. Bull. 2011, 56, 1429–1433. [Google Scholar] [CrossRef]
- Mahammadunnisa, S.K.; Manoj Kumar Reddy, P.; Linga Reddy, E.; Subrahmanyam, C.H. Catalytic DBD Plasma Reactor for CO Oxidation by in N2O Decomposition. Catal. Today 2013, 211, 53–57. [Google Scholar] [CrossRef]
- Jo, J.O.; Trinh, Q.H.; Kim, S.H.; Mok, Y.S. Plasma-Catalytic Decomposition of Nitrous Oxide over γ-Alumina-Supported Metal Oxides. Catal. Today 2018, 310, 42–48. [Google Scholar] [CrossRef]
- Martin, R.J.; Brown, N.J. Nitrous Oxide Formation and Destruction in Lean, Premixed Combustion. Combust. Flame 1990, 80, 238–255. [Google Scholar] [CrossRef]
- Nicol, D.G.; Steele, R.C.; Marinov, N.M.; Malte, P.C. The Importance of The Nitrous Oxide Pathway to NOx in Lean-Premixed Combustion. J. Eng. Gas Turbines Power 1995, 117, 100–111. [Google Scholar] [CrossRef]
- Roy, B.; Chen, L.; Bhattacharya, S. Nitrogen Oxides, Sulfur Trioxide, and Mercury Emissions during Oxy-fuel Fluidized Bed Combustion of Victorian Brown Coal. Environ. Sci. Technol. 2014, 48, 14844–14850. [Google Scholar] [CrossRef] [PubMed]
- Li, S.; Xu, M.; Jia, L.; Tan, L.; Lu, Q. Influence of Operating Parameters on N2O Emission in O2/CO2 Combustion with High Oxygen Concentration in Circulating Fluidized Bed. Appl. Energy 2016, 173, 197–209. [Google Scholar] [CrossRef]
- Glarborg, P.; Johnsson, J.E.; Dam-Johansen, K. Kinetics of Homogeneous Nitrous Oxide Decomposition. Combust. Flame 1994, 99, 523–532. [Google Scholar] [CrossRef]
- Yun, J.G.; Kim, J.Y.; Lee, H.M.; Baik, G.Y.; Jeon, M.K.; Yun, J.H.; Hong, J.G. A Study on the N2O Reduction Rate According to Temperature and Residence Time in the Exhaust Gas Atmosphere Emitted on Combustion of Air and Oxygen. ACS Omega 2022, 7, 3434–3441. [Google Scholar] [CrossRef]
- Li, Y.H.; Hsu, C.H.; Lin, P.H.; Chen, C.H. Thermal Effect and Oxygen-Enriched Effect of N2O Decomposition on Soot Formation in Ethylene Diffusion Flames. Fuel 2022, 329, 125430. [Google Scholar] [CrossRef]
- Zel’dovich, Y.B. The Oxidation of Nitrogen in Combustion Explosions. Acta Physicochim. 1946, 21, 577–628. [Google Scholar]
- Liang, L.; Hui, S.; Pan, S.; Shang, T.; Liu, C.; Wang, D. Influence of Mixing, Oxygen and Residence Time on the SNCR Process. Fuel 2014, 120, 38–45. [Google Scholar] [CrossRef]
- Lee, H.M.; Yun, J.G.; Hong, J.G. A Study of Nitrous Oxide Thermal Decomposition and Reaction Rate in High Temperature Inert Gas. J. ILASS-Korea 2020, 25, 132–138. [Google Scholar]
- Lingens, A.; Neemann, K.; Meyer, J.; Schriber, M. Instability of Diffusion Flames. Int. Symp. Combust. 1996, 26, 1053–1061. [Google Scholar] [CrossRef]
- Ross, H.D.; Sotos, R.G.; T’ien, J.S. Observations of Candle Flames under Various Atmospheres in Microgravity. Combust. Sci. Technol. 1991, 75, 155–160. [Google Scholar] [CrossRef]
- Yoon, S.H.; Han, J.K.; Park, J.; Yun, J.H.; Keel, S.I. Self-Excitation in Laminar Lifted Free-Jet Propane Flames Diluted with Nitrogen. Combust. Flame 2011, 158, 1960–1969. [Google Scholar] [CrossRef]
- Yoon, S.H.; Park, J.; Kwon, O.B.; Yoon, J.H.; Keel, S.I.; Kim, J.S.; Bae, D.S. Experimental Study on Self-Excitations in Nitrogen-Diluted Laminar Lifted Butane Flames. Fuel 2012, 91, 51–60. [Google Scholar] [CrossRef]
- Kimura, I. Stability of Laminar-Jet Flames. Int. Symp. Combust. 1965, 10, 1295–1300. [Google Scholar] [CrossRef]
- Toong, T.Y.; Salant, R.F.; Stopford, J.M.; Anderson, G.Y. Mechanisms of Combustion Instability. Int. Symp. Combust. 1965, 10, 1301–1313. [Google Scholar] [CrossRef]
- Chen, L.D.; Seaba, J.P.; Roquemore, W.M.; Goss, L.P. Buoyant Diffusion Flames. Int. Symp. Combust. 1989, 22, 677–684. [Google Scholar] [CrossRef]
- Guahk, Y.T.; Lee, D.K.; Oh, K.C.; Shin, H.D. Flame-Intrinsic Kelvin-Helmholtz Instability of Flickering Premixed Flames. Energy Fuels 2009, 23, 3875–3884. [Google Scholar] [CrossRef]
- Zhang, X.K.; He, Y.L.; Tang, S.Z.; Wang, F.L.; Xie, T. An Electromagnetics-Temperature-Component Multi-Physical Coupled Model for Electric Furnace in Calcium Carbide Smelting Process. Appl. Therm. Eng. 2020, 165, 114552. [Google Scholar] [CrossRef]
- Andrews, G.E.; Bradley, D. Determination of Burning Velocities: A Critical Review. Combust. Flame 1972, 18, 133–153. [Google Scholar] [CrossRef]
- Vu, T.M.; Cha, M.S.; Lee, B.J.; Chung, S.K. Tip Opening of Premixed Bunsen Flames: Extinction with Negative Stretch and Local Karlovitz Number. Combust. Flame 2015, 162, 1614–1621. [Google Scholar] [CrossRef]
- Löffler, G.; Wargadalam, V.J.; Winter, F.; Hofbauer, H. Decomposition of Nitrous Oxide at Medium Temperatures. Combust. Flame 2000, 120, 427–438. [Google Scholar] [CrossRef]
- Hamins, A.; Yang, J.C.; Kashiwagi, T. An Experimental Investigation of The Pulsation Frequency of Flames. Int. Symp. Combust. 1992, 24, 1695–1702. [Google Scholar] [CrossRef]
- Sato, H.; Amagai, K.; Arai, M. Diffusion Flames and Their Flickering Motions Related with Froude Numbers under Various Gravity Levels. Combust. Flame 2000, 123, 107–118. [Google Scholar] [CrossRef]
- Kee, R.J.; Rupley, F.M.; Miller, J.A. Chemkin-II: A Fortran Chemical Kinetics Package for the Analysis of Gas-Phase Chemical Kinetics; Sandia National Lab (SNL-CA): Livermore, CA, USA, 1989.
- Smith, G.P.; Golden, D.M.; Frenklach, M.; Moriarty, N.W.; Eiteneer, B.; Goldenberg, M.; Bowman, C.T.; Hanson, R.K.; Song, S.; Gardiner, W.C.; et al. GRI-Mech 3.0. 1999. Available online: http://combustion.berkeley.edu/gri-mech/ (accessed on 1 January 2020).
Disclaimer/Publisher’s Note: The statements, opinions and data contained in all publications are solely those of the individual author(s) and contributor(s) and not of MDPI and/or the editor(s). MDPI and/or the editor(s) disclaim responsibility for any injury to people or property resulting from any ideas, methods, instructions or products referred to in the content. |
© 2023 by the authors. Licensee MDPI, Basel, Switzerland. This article is an open access article distributed under the terms and conditions of the Creative Commons Attribution (CC BY) license (https://creativecommons.org/licenses/by/4.0/).