Article

New Power System Planning and Evolution Path with Multi-Flexibility Resource Coordination

1
State Grid Gansu Electric Power Company, Lanzhou 730000, China
2
Tsinghua Sichuan Energy Internet Research Institute, Chengdu 610000, China
*
Author to whom correspondence should be addressed.
Energies 2024, 17(1), 273; https://doi.org/10.3390/en17010273
Submission received: 7 November 2023 / Revised: 6 December 2023 / Accepted: 12 December 2023 / Published: 4 January 2024
(This article belongs to the Section F1: Electrical Power System)

Abstract

:
With the continuous development of large-scale wind and photovoltaic power worldwide, the net load fluctuation of systems is increasing, thereby imposing higher demands for power supply assurance and new energy consumption capacity within emerging power systems. It is imperative to establish a quantifiable and efficient model for planning new power systems, to propose an analytical approach for determining optimal evolutionary paths, and to advance research on flexible resource planning across wide areas. In this paper, based on the simplified operating characteristics of multi-type flexible resources, a source-grid-load-storage collaborative planning and evolution analysis framework is established. Secondly, the lowest total cost of the whole life cycle of the system is taken as the optimization goal, the multiple flexible resource investment decisions and production operation constraints of various flexible resources on all sides of the system are considered, and the source-grid-load-storage planning model is established. Then, through the investment decision-making strategy setting of the system in different planning level years, the evolutionary path analysis method of the whole life cycle economy and weighted environmental protection benefit of the system is given. Finally, by taking the sending-end power grid in Gansu Province as an example, a case study is carried out. Calculations of new energy, key channels within the province, energy storage capacity, and load-side response capacity requirements for 2025, 2030, and 2060 are optimized. Based on the above analysis, the optimal evolution path of the power grid is proposed. When considering the weighted benefits of economy and environmental protection, the greater the weight of environmental protection benefits, the greater the possibility of choosing a radical scheme. The model and method proposed in this paper can provide technical reference for the future development planning and evolution analysis of new power systems.

1. Introduction

Continuously increasing the proportion of new energy is a key way by which to build new power systems and achieve the goals of a carbon peak and carbon neutrality. According to the New Power System Development Blue Book issued by the National Energy Administration, China’s newly installed energy capacity will account for more than 40% by 2030, and electricity generation will account for more than 20%. Renewable energy will become the main feature of the installed power sources in the overall formation period (2030 to 2045), and it will become the main power supply source in the consolidation and improvement period (2045 to 2060) [1,2]. However, the strong volatility and weak support of wind and solar power supplies will lead to a sharp increase in the demand for the flexible regulation of the system [3,4], which poses new challenges in terms of power supply and grid planning. Traditional simulation methods based on steady load curves are unable to consider the flexibility requirements caused by the fluctuation of wind and solar power output. The fluctuation of renewable energy output leads to various operational modes in the power system, increasing operational risks, while grid planning may also constrain the integration of renewable energy. Therefore, given the increasing share of renewable energy in a new power system, it is urgent to establish a coordinated optimization planning model for source-grid-load-storage that considers multiple flexibility constraints. This will enable a scientific and reasonable analysis of the positioning and value of flexible resources such as the power supply, grid interconnection, and energy storage in a high proportion of renewable energy power systems, supporting future scenario studies of the new power system and meeting the system’s flexibility requirements in a more economical manner [5,6].
Currently, extensive research has been conducted by both domestic and international scholars regarding the assessment of flexible resource characteristics, source-grid-load-storage planning, as well as power system evolution analysis [7]. Regarding the assessment of flexible resource characteristics, in reference [8,9,10], the flexibility demand and the flexibility supply potential considering network constraints were respectively quantified at the node and system levels, the evaluation indicators of system flexibility were constructed, and the meanings and models of each index were analyzed in detail. In reference [11], a new flexible supply–demand balance analysis system for power systems with a very high proportion of renewable energy sources was proposed. In reference [12], by addressing the problems of wind and light abandonment and the insufficient flexibility of power systems after large-scale new energy access, a flexibility evaluation method considering wind and light abandonment was proposed. In reference [13], a comprehensive rating system was established, including the penetration rates of network interconnection, wind power, solar power, electric heating, and electric cooling, and a new method was proposed for the multi-temporal evaluation of the flexibility needs of power systems. The methodology and findings provided can be utilized for assessing the market viability of flexibility solutions.
In terms of power system source-grid-load-storage planning, reference [14] put forward a set of multi-aspect evaluation systems, including economy, reliability, energy utilization, technology, and environmental protection, to evaluate source-grid-load-storage systems. In reference [15,16], scholars established a mathematical model of power generation planning for a new power system considering the cooperative optimization operation of the load and storage of the source network to achieve the lowest costs while taking into account policy requirements, such as dual-carbon targets and wind and the light abandonment rate, and they verified the feasibility of the model through numerical examples. In reference [17], a planning strategy for the multiple power supply capabilities of a new power system based on situational awareness was proposed, which improved the security and stability of the entire system and reduced the carbon emission and total cost of the system during the whole life cycle. In reference [18], scholars proposed a medium- and long-term power planning framework that took into account the interaction process between transmission and distribution networks so as to coordinate the allocation capacity of source-load-storage regulation resources in transmission and distribution systems.
In terms of power system evolution analysis, in reference [19,20], scholars analyzed the connotations and characteristics of the new power system from four perspectives: structure, form, technology, and mechanism, and they analyzed and studied the evolution path of the new power system.
In references [21,22,23], complete analysis models of national solar thermal, nuclear power, and wind storage power generation were respectively established, and a reasonable scale and layout for the construction of China’s future new power system was proposed. In reference [24], scholars proposed a global sensitivity method considering flexibility balance to analyze the evolution path of high-proportion renewable energy development. In reference [25], based on the policy background of the domestic new power system, the characteristics and connotations were analyzed, a new model for the identification of the development stage of the power system was constructed, and the overall path of the development path of the new power system was proposed from the perspective of power supply, transmission and distribution, and load. In addition, a new development path for the power system for the entire supply and demand chain is proposed by taking the Hebei power grid as an example.
In summary, current research regarding load-storage collaborative planning and the evolutionary analysis methods of source networks considering system flexibility still has the following shortcomings:
  • The flexible supply–demand balance model is complicated to calculate and solve, and the potential of inter-provincial mutual benefit for the grid and load side is insufficient;
  • The time-series modeling fails to accurately capture the uncertainties in both power supply and load sides, while the grid structure’s limited capacity for mutual relief demand hinders quantification of resource endowment disparities;
  • In the face of challenges posed by resource endowment characteristics and differences in flexibility resources, there still exist several complex issues that need to be addressed regarding the technical–economic decision making and evolutionary development of source-network-charge-storage aspects within provincial power grids as well as the optimal path for power grid differentiation.
In view of the above problems, this paper proposes a method of source-grid-load-storage collaborative planning and evolution analysis for provincial new power systems considering multiple types of flexible resources. Firstly, based on the multi-type flexible resource adjustment characteristics considering the resource endowment of provincial power grids, based on the time-series production and operation simulation of dual guaranteed power supply constraints, the province-level power grid load and storage collaborative planning model aiming at the optimal system economy is established. Secondly, the optimal evolutionary development path of weighted economic and environmental benefits in the whole life cycle of the power system is obtained through the technological and economic evolution prediction and evolutionary development decision-making strategy setting of different planning target level years. Finally, taking Gansu Province’s power grid as an example, we analyze, optimize and calculate the new energy, grid interconnection, energy storage capacity and load-side response capacity in 2025, 2030 and 2060. Then, we form a planning scheme, summarize and analyze the multi-year economy of provincial power grids under different evolutionary development paths, and give suggestions based on the weighted benefits of environmental protection. The main innovations of this study are as follows:
  • A collaborative planning model of source-grid-load-storage of provincial power grid is constructed considering the regulatory characteristics of various flexible resources. We also consider adding double guarantee constraints to ensure a more reliable power supply.
  • Furthermore, the text conducts a comprehensive analysis, optimization and calculation of specific scenarios pertaining to the Gansu power grid. It proposes planning suggestions and provides a summary and analysis of the economic benefits associated with different evolutionary and development paths.
  • Considering the weighted economic and environmental benefits throughout the entire life cycle of the power system, an optimal evolutionary development path is proposed.
The research results can provide a technical reference for the future planning and development analysis of provincial new power systems.

2. Materials and Methods

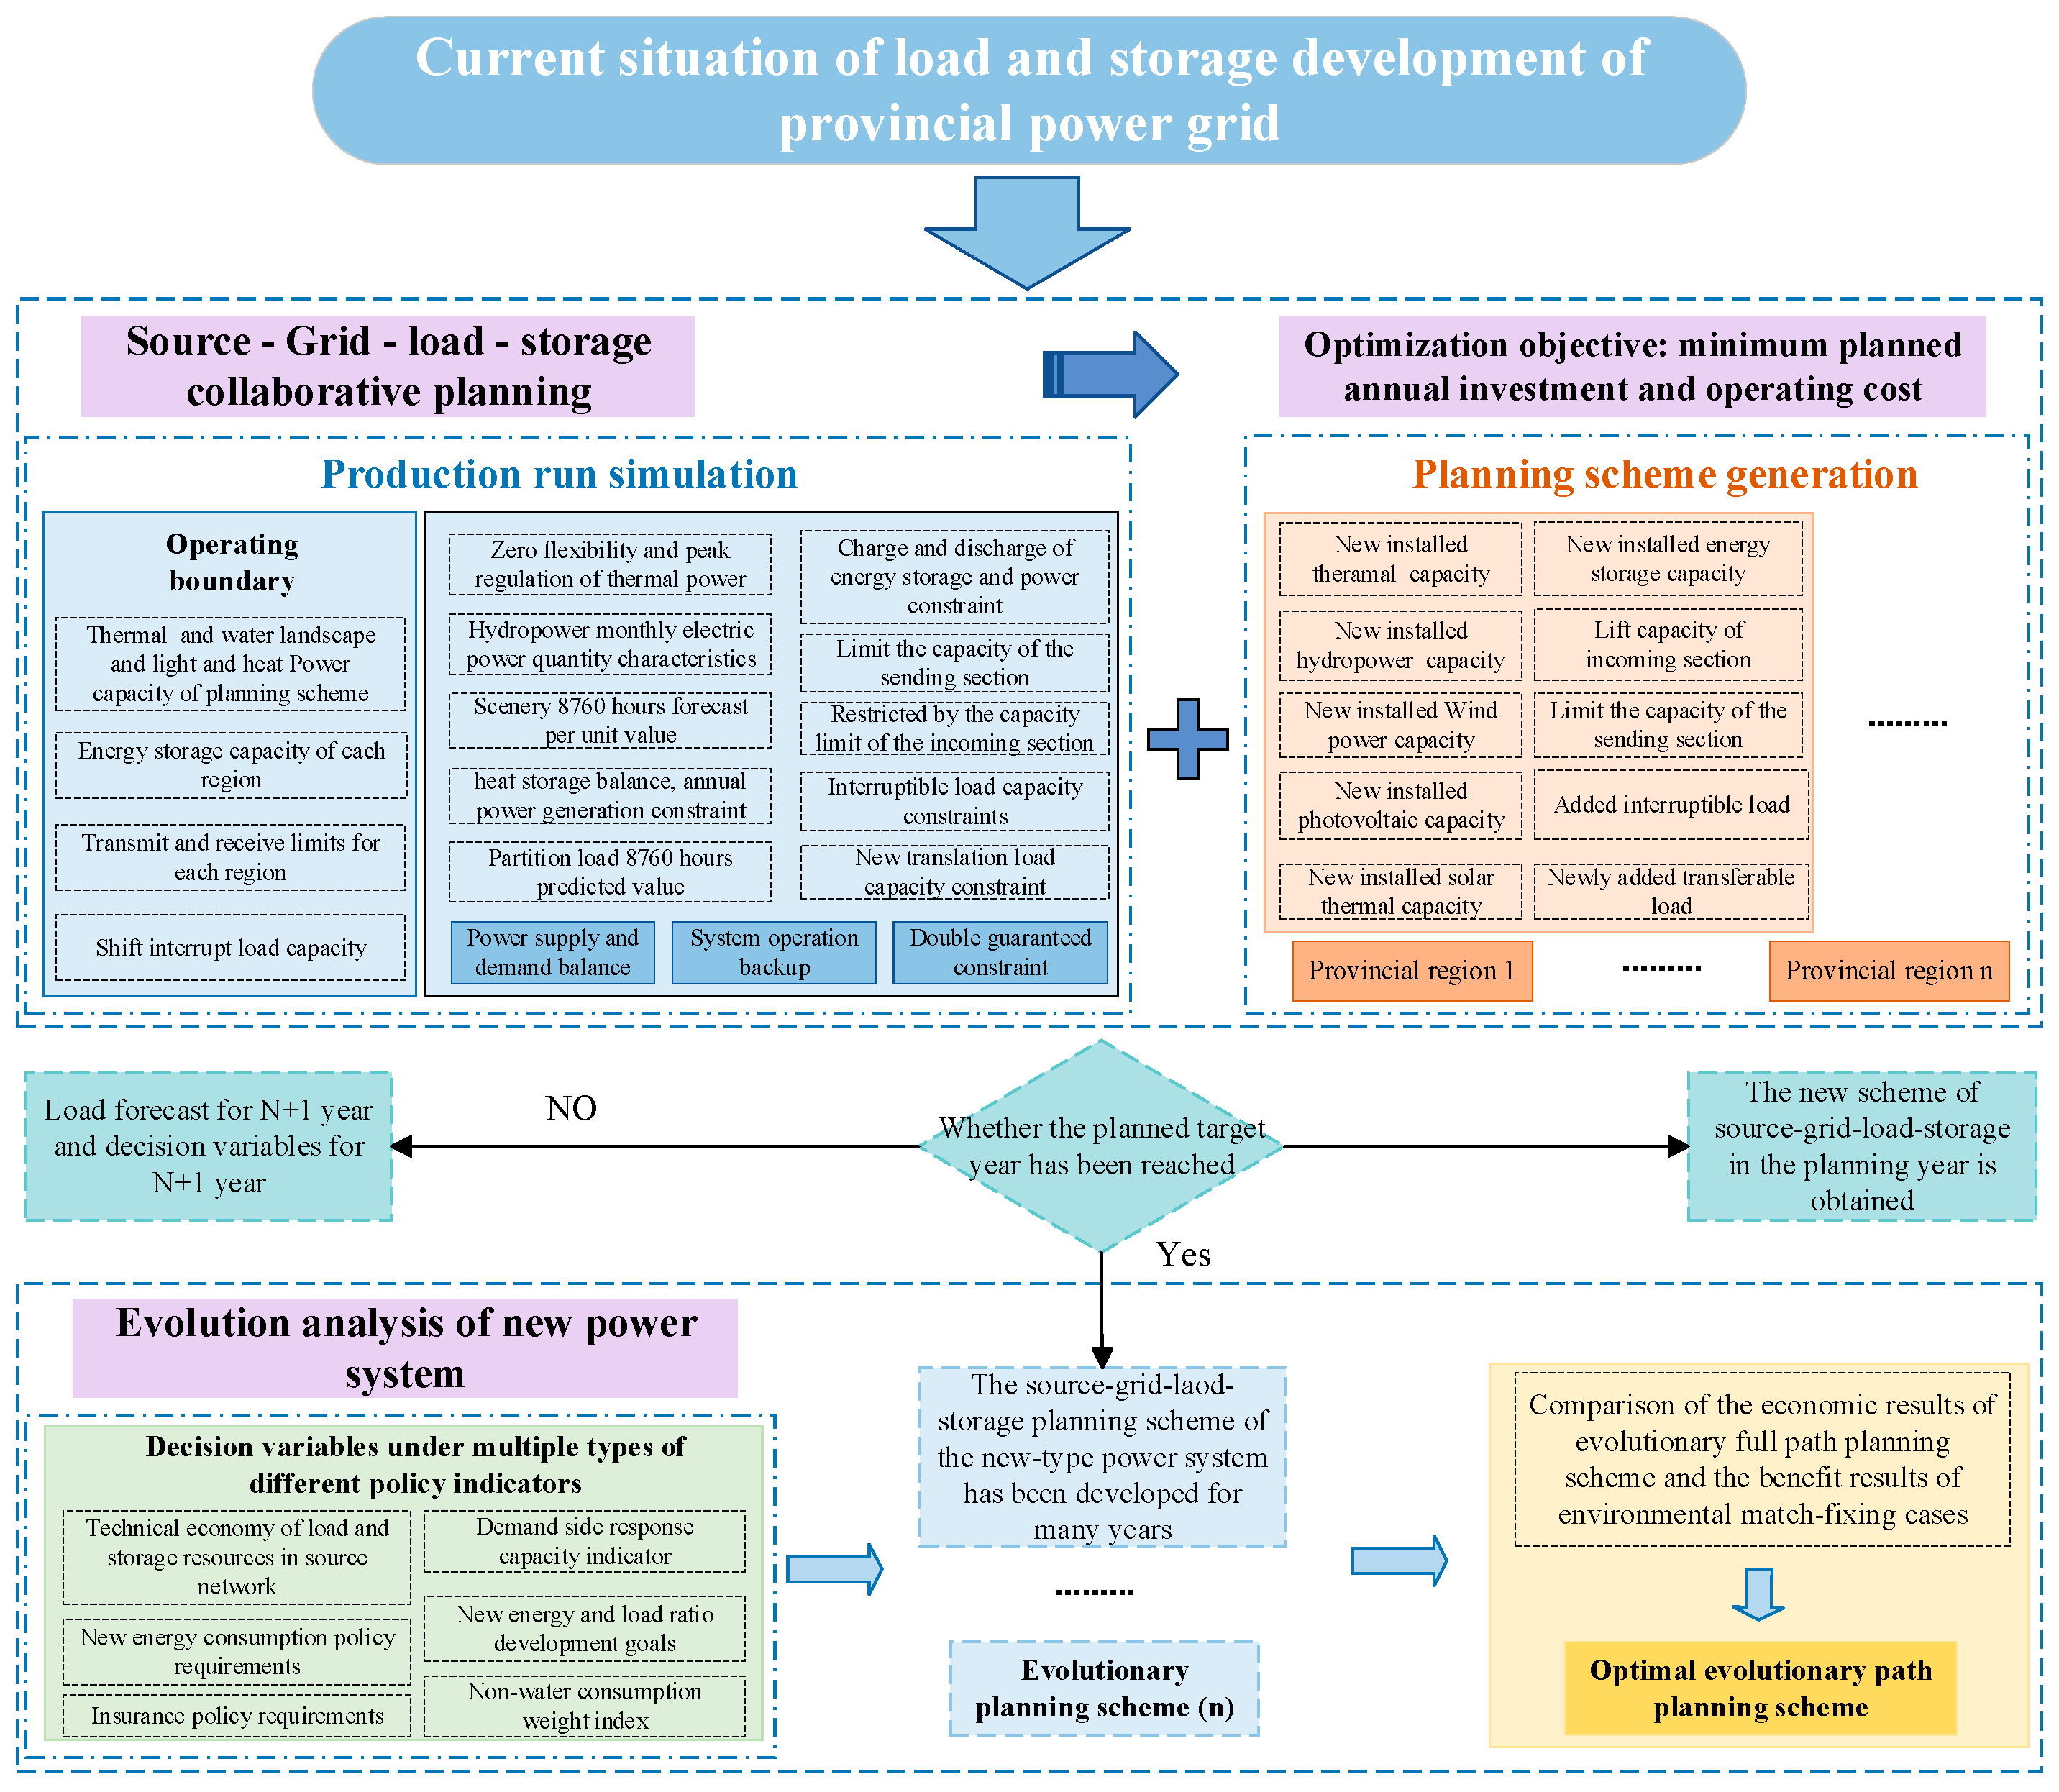
2.1. Framework of Source-Grid-Load-Storage Collaborative Planning and Evolution Analysis

The essence of constructing a new power system lies in meeting the requirements of power balance and ensuring reliable power supply under the high uncertainty associated with a significant proportion of new energy. Therefore, it is particularly critical to plan the flexible resource allocation among source-grid-load-storage sides. The proposed method in this paper, known as source-grid-load-storage cooperative planning and evolution analysis, is a technical scheme based on production simulation model. This scheme aims to harness the technical and economic potential of flexible resources across source-grid-load-storage interfaces with the objective of economic optimization. It takes into account factors such as dual support constraints, supply–demand balance, and operational reserve constraints. The capacity of source-grid-load-storage is optimized through time series production simulation, aligning with the planning level year and analyzing the economic aspects of its planning scheme.
The collaborative planning of source-grid-load-storage will be continued in accordance with the current planning scheme until the completion of the target year’s planning, thus establishing a fundamental framework for multi-year planning and evolutionary analysis of future power systems. The evolution and development of the new power system involve various decision variables in the process, including the proportion of renewable energy generation to load, non-water consumption weight, demand-side response capacity index, supply protection policy requirements, and new energy consumption requirements. By formulating different policy strategies and decision-making directions to generate a range of evolutionary schemes, and through comparative analysis of their economic and environmental weighted benefits, the optimal evolutionary path can be determined. The research framework of the collaborative planning and evolution analysis for the new power system source-grid-load-storage is shown in Figure 1.

2.1.1. Construct a Flexible Resource Model

Due to the differences in adjustment directions among various resources and the coupling of upper and lower adjustment capabilities within the specified interval, consideration is given to the difference in adjustment rates only when accounting for the coupling relationship between short-term frequency adjustment factors and medium-to-long-term peak regulation as well as supply–demand balance. The planning and evolution analysis method described in this paper primarily focuses on the long-term regulation of peak demand and supply as well as the matching of demand flexibility. The modeling of multi-type flexible resources primarily considers two key factors, which are adjustment direction and adjustable capacity.
The adjustment direction in the power system supply and demand balance includes two directions: upward and downward. The adjustment direction of different measurement resources is not consistent when facing the same adjustment target. The term “regulating capacity” refers to the power supply capacity of the power system in a specific direction and at a specific time, which is collectively provided by conventional power sources, renewable energy, grid infrastructure, energy storage systems, and flexible loads. Among them, the adjustment direction and capacity modeling of conventional power supply have reached a relatively advanced stage, while new energy lacks upward adjustment capability. However, it possesses real-time power generation output that enables downward adjustment capacity and ability. The model for regulating flexible resources in power supply, power grid, flexible load and energy storage is as follows:
  • On the power supply side: Flexibility adjustment resources on the power supply side mainly refer to the flexible transformation of thermal power, as well as flexible resources such as heat-electricity decoupling during heating season, hydroelectric power, gas-fired units, and solar-thermal units. Among them, the flexible transformation of thermal power and heat-electricity decoupling during heating season are mainly used to improve and increase the down-regulation capacity of thermal power, while the up-down regulation capacity of hydroelectric power units is limited by the water flow during wet and dry periods. Solar-thermal units have a certain degree of flexibility adjustment capability with reasonable allocation of thermal storage duration and light resources.
  • On the grid side: The flexibility regulation capacity at the provincial level is mainly derived from inter-provincial power exchange and cross-regional direct current (DC) adjustment. However, the adjustment range is subject to the supply–demand characteristics of the inter-provincial power exchange and the receiving end of the DC system, which can vary over time.
  • On the load side: The loads consist primarily of interruptible and shiftable loads as well as orderly electricity consumption. However, the flexibility response characteristics of these loads may impose limitations on their total capacity in order to ensure power supply.
  • On the energy storage side: The flexibility adjustment ability of the energy storage side primarily stems from the charging and discharging processes as well as the limitations imposed by storage capacity and charging/discharging strategies.
By utilizing the aforementioned types of flexibility resources, the needs for ensuring power supply and accommodating new energy can be met.

2.1.2. Source-Grid-Load-Storage Collaborative Planning and Evolution Analysis

According to the development goal of the new power system in the future, combined with the resource endowment, load forecasting and development mode of the province, the resources of the load and storage side of the source network are coordinated planning. Provincial power grid planning is based on operation constraints and considers the requirements of power supply security and new energy consumption under source load uncertainty. The planning model can be abstracted into the following forms:
min ( y = 1 Y C z ( y , t ) ) ϕ s o u r c e ( x , u ) 0 ϕ l i n e ( x , u ) 0 ϕ l o s d ( x , u ) 0 ϕ s t o ( x , u ) 0 F ( x , t , u ) 0
where C z ( y , t ) is the total system cost in y years in the evolution cycle considering the influence of decision variables; ϕ s o u r c e ( x , u ) , ϕ l i n e ( x , u ) , ϕ l o a d ( x , u ) and ϕ s t o ( x , u ) , respectively, denote the operational constraints of the flexible resources at each side of the source-grid-load-storage in the operational simulation. F ( x , t , u ) denotes the system operation constraints with decision variables in the operation simulation. x is the vector matrix of optimized output results in production operation simulation; t is the input parameter vector matrix of multi-type decision variables in planning simulation; u is the input parameter vector matrix in the production run simulation.
In a production simulation model of coordinated flexibility regulation characteristics under different development levels and years, with the future objectives of ensuring power supply and accommodating new energy, a mixed-integer nonlinear optimization problem is formed due to the presence of numerous 0–1 variables related to the constraints of solar thermal and thermal power operation. To reduce the scale of the model solution, the online capacity of the entire thermal power and solar thermal units is linearized by defining it.
Constraints are formed by specifying the requirements for thermal power peak regulation capability (flexibility transformation) and minimum start-up mode, seasonal electricity and energy constraints for hydroelectric power, inter-regional power exchange limits, demand-side response electricity and energy constraints, and energy storage electricity and energy constraints. The investment and operating costs of various types of flexibility resources are quantified, and an optimization solution is sought to determine the capacity and operating output of multiple categories of flexibility resources, integrating source, grid, load, and storage in a coordinated and integrated planning and evolutionary analysis.

2.2. Multiple Flexible Resource Collaborative Planning Model

2.2.1. Objective Function

Assume that the total system cost is recorded as C s y s , including the investment cost of power supply, power grid, energy storage and system operation cost. The goal of model optimization is to minimize the total system cost and meet the following conditions.
min C s y s = C s y s i n v + C s y s o p e r C s y s i n v = C s o u r c e i n v + C l i n e i n v + C s t o i n v + C l o a d i n v C s y s o p e r = C s o u r c e o p e r + C l i n e o p e r + C s t o o p e r + C l o a d o p e r
where C s y s i n v and C s y s o p e r denote the total investment cost and total operation cost of the regulation resources at each side of source-grid-load-storage, respectively; C s o u r c e i n v , C l i n e i n v , C l o a d i n v and C s t o i n v denote the construction costs of the source, grid, load and storage side, respectively. C s o u r c e o p e r , C l i n e o p e r , C l o a d o p e r and C s t o o p e r denote the operating costs of the source, grid, load and storage side, respectively.
C s o u r c e i n v = i = 1 N g C g , i i n v Δ G i + i = 1 N h C h , i i n v Δ H i + i = 1 N w C w , i i n v Δ W i + i = 1 N p C p , i i n v Δ P s o l a r i + i = 1 N c s p C c s p , i i n v Δ P c s p i C l i n e i n v = i = 1 N 1 C l , i i n v Δ L i C s t o , j i n v = C s , j 1 i n v ( 1 μ ) Δ S j 1 , Δ S j 1 S Δ C l o a d i n v = i = 1 N d z C d z , i i n v Δ D z i + i = 1 N d f C d f , i i n v Δ D f i
where C g , i i n v , C h , i i n v , C w , i i n v , C p , i i n v , C c s p , i i n v , C l , i i n v , C s , i i n v , C v , i i n v and C d f , i i n v , respectively, denote the unit capacity investment costs of thermal power, hydroelectric power, wind power, photovoltaic power, solar thermal, line, energy storage, transferable load and interruptible load. N denotes the number of types of power supplies, lines, and loads. G i , H i , W i , P s o l a r i , P c s p i , L i , S i , D z i and D f i , respectively, denote the capacity to be built for the ith thermal power, hydroelectric power, wind power, photovoltaic power, solar thermal, line, energy storage, transferable load and interruptible load, which are optimization decision variables. Considering the economic cost of energy storage technology shows a downward trend, S j 1 refers to the new energy storage capacity in j − 1 year. S is the capacity critical value of the change in energy storage construction cost; μ is the rate at which the new size exceeds S .
C s o u r c e o p e r = t = 1 T i = 1 N ( C g , i u p g i , t u p + C g , i g i , t + C h , i h i , t + C w , i w i , t + C p , i p s o l a r i , t + C c s p , i p c s p i , t ) C l i n e o p e r = t = 1 T i = 1 N C l , i l i , t C s t o o p e r = t = 1 T i = 1 N C s , i s i , t C l o a d o p e r = t = 1 T i = 1 N ( C d , i z d z i , t + C d , i f d f i , t + C d , i c u t d i , t c u t )
where T denotes the number of periods. C g , i u , p is the unit start-stop cost of the ith thermal power plant. C g , i , C h , i , C w , i , C p , i , C c s p , i , C l , i and C s , i , respectively, denote the unit generation cost of thermal power, hydroelectric power, wind power, photovoltaic power, solar thermal power, line, energy storage, transferable load and interruptible load. C d , i z , C d , i f and C d , i c u t are the unit interruption, translation and load-cutting costs of the ith load, respectively, and the above parameters are known quantities. g i , t u p is the start–stop capacity of the ith thermal power at time t. g i , t , h i , t , w i , t , p s o l a r i , t , p c s p i , t , l i , t and s i , t are, respectively, the output of the ith thermal power, hydroelectric power, wind power, photovoltaic power, solar thermal, line and energy storage at time t. d z i , t , d f i , t and d d , i c u t are the ith interruptible load power at time t, the shift-able load power and the shear load, respectively, and the above parameters are optimization decision variables.

2.2.2. Investment Decision

Investment decisions mainly consider the maximum planning capacity of source-grid-load-storage, the supply adequacy of the system, and the proportion of clean energy generation that reflects the evolution and transformation of the power system.
Power systems generally have high requirements for power supply assurance, and its constraints are shown as follows.
t = 1 T i = 1 N d d i , t c u t β t = 1 T i = 1 N d d i , t
where d i , t c u t denotes the size of the ith load at time t. β is the sufficiency of power supply, and the cutting load is generally required to be less than β times the total load.
The proportion of clean energy generation can reflect the green evolution degree of the energy power system, and its constraints are as follows.
t = 1 T i = 1 N rb R b i , t α t = 1 T i = 1 N d d i , t
where R b i , t denotes the power generation output of the ith clean energy at time t. N r b denotes the number of clean energy equipment, including hydroelectric power, wind power, photovoltaic, and solar thermal. α is the penetration rate of clean energy power generation, which is closely related to the depth of new power system planning and evolutionary transformation.
Similarly, the policy and indicator requirements of other new power system construction can be transformed into corresponding constraints and incorporated into planning decisions.

2.2.3. Construct the Simulation Model of Production Operation

The constraints of the production and operation simulation model mainly consider the power supply and demand balance of the system, the total reserve constraints of the system in the whole region, the output operation characteristics constraints of conventional thermal power, hydroelectric power, solar thermal, wind power, photovoltaic and other power supplies, the transmission limit constraints of the interconnected grid, the load-side response capacity and power constraints, and the charging and discharging power requirements of the energy storage system.
The power supply and demand balance constraint of the system meets the following conditions.
i Ω n g g i , t + i Ω n h h i , t + i Ω n w p w i , t + i Ω n p s p s o l a r i , t + i Ω n p c p c s p i , t i Ω n l s l i , t + i Ω n l r l i , t + i Ω n s ( s i , t d i s s i , t c h a ) = i Ω n d ( d i , t d i , t c u t ) + i Ω n dz d z i , t i Ω n d f d f i , t
where Ω n denotes the collection of the output of various types of power sources, transmission capacity on the grid side, response capacity on the load side, and charging and discharging capacity on the energy storage side in region n. s i , t d i s denotes the discharge capacity of the ith energy storage system at time t. s i , t c h a denotes the charging capacity of the ith energy storage system at time t.
When considering the reserve requirements of the system to balance supply and demand flexibility, flexible loads, grid mutual assistance capabilities, and energy storage discharge capabilities are considered into the system’s reserve capacity in addition to stable power sources in this paper. Furthermore, the load reserve benchmark does not account for the capacity of flexible loads and net load capacity from new energy output. By considering flexibility in the allocation of system reserves, it is possible to further reduce conventional power source capacity while enhancing integration capability for new energy to meet actual operational reserve requirements in planning schemes for new power systems. The constraints for system reserves satisfy the following conditions.
g i , t u r + h i , t u r + p c s p i , t u r l l s i , t u r + l l r i , t u r + s c h a i , t u r κ ( d i , t p w i , t p s o l a r i , t d z i , t u r d f i , t u r )
where g i , t u r , h i , t u r , p c s p i , t u r , l l s i , t u r , l l r i , t u r , s c h a i , t u r , d z i , t u r and d f i , t u r denote, respectively, the standby capacity that can be provided by thermal power, hydroelectric power, solar thermal, outward inter-regional electricity transfer, inward inter-regional electricity transfer, energy storage systems, transferable load and interruptible load of the ith power grid at time t in a specific region. κ indicates the ratio of the system standby capacity to the net load capacity.
The operation characteristics of thermal power units are complicated, which can be described by the operating upper limit, minimum start-up mode and start–stop constraint. The conditions for its constraints to be satisfied are shown in the following formula.
0 g i , t θ i G i λ g , i O g , i , t g i , t O g , i , t O g , i , t = O g , i , t 1 + g i , t o n g i , t o f f σ t = 1 N G i t = 1 N O g , i , t τ = 1 T o n g i , t τ o n O g , i , t G i τ = 1 T o f f g i , t τ o f f
where G i denotes the rated capacity of the ith thermal power unit in the target year. θ i and σ are, respectively, the monthly upward capacity limit of thermal power units and the minimum start-up mode coefficient within the region. O g , i , t is the total online capacity of the ith thermal power unit at time t. λ g , i is the minimum output ratio of the ith thermal power unit; g i , t o n and g i , t o f f are the unit capacity increase and decrease in the ith thermal power unit at time t, respectively. T o n and T o f f are the minimum start-up and shutdown intervals of thermal power units, respectively.
Hydroelectric power units are primarily influenced by monthly inflow and discharge rates, which impose limitations on both monthly power generation capacity and power generation thresholds, as depicted in the subsequent equation.
0 h i , t μ i H i 0 t = 1 N m h i , t E h , i m
where μ i is the monthly maximum upward adjustment capacity coefficient of the ith hydroelectric power unit. H i is the rated capacity of the ith hydroelectric power unit in the target year. N m is the total number of time segments per month. E h , i m is the monthly available power generation of the ith hydroelectric power unit affected by monthly incoming water.
The solar thermal power generation system emulates the operation of a synchronous machine through the utilization of a steam turbine generator. In addition to start-up, shutdown, and upper and lower limit constraints, it is primarily regulated by the duration of thermal energy storage. Moreover, there exist limitations on daily electricity generation and annual utilization hours, which are all subject to the following conditions.
t = 24 n + 1 24 n + 24 p c s p , i , t t = 24 n + 1 24 n + 24 I D N I , n , t η s o l a r , h , n = 0 364 t p c s p , i , t A i h P c s p , i
where A i h and P c s p , i represent the design annual operating hours and rated installed capacity of the ith solar thermal power unit, respectively. I D N I , n , t is the solar radiation intensity of the new energy base at time t on the nth day. η s o l a r , h is the energy conversion efficiency of the power station.
The new energy output of wind power and photovoltaic is greatly affected by meteorological resources. The output constraints of wind power and photovoltaic, respectively, meet the following conditions.
0 w w , t p w b , w , t W w , w N w 0 p s o l a r , p , t p s o l a r b , p , t P s o l a r , p , p N s o l a r , t T
where p w b and p s o l a r b are the normalized predicted power coefficients of wind power and photovoltaic power field at time t, respectively, that is, the power generation capacity of the normalized electric field. W w and P s o l a r , p are the installed capacity of wind power and photovoltaic power plants in the target year, respectively.
The power flow of the transmission section is greatly affected by the transmission conditions of the line, and the constraint of the power flow of the transmission section is shown in the following equation.
l i , t L max l r , i N m , t T l i , t L max l s , i N m , t T
where L max l r and L max l s are, respectively, constrained by the incoming and outgoing power limits of the line or section at time t.
The load side response is affected by the load response and regulation capacity limits in the provincial transmission network, which are mainly constrained as follows:
d z i max d z i , t d z i max 0 d f i , t d f i max d z i , t = 0
where d z i max and d z i max denote the maximum power values of the transferable load and the interruptible load, respectively.
The charge and discharge constraints of the energy storage system meet the following conditions.
0 s i , t d i s , s i , t c h a S i E s , i , t E s , i , t 1 = η s , i s i , t c h a s i , t d i s / η s , i 0 E s , i , t T s , i S i
where S i denotes the rated capacity of the ith energy storage system in the target year. η s , i denotes the charging and discharging efficiency of the ith energy storage system. E s , i , t represents the charge or electric quantity status of the ith energy storage system at time t. T s , i denotes the continuous charging and discharging time of the ith energy storage system.

2.3. Boundary Calculation

The demand curve of sub-regional load in Gansu Province for 8760 h was derived using the extrapolation method, taking into account historical measured load values from Gansu Province and other cities as well as future growth forecasts outlined in the “14th Five-Year Plan” and “15th Five-Year Plan”. In the future, there are plans for large-scale new energy bases in different provinces of central and eastern China within the three regions, which will be interconnected through cross-regional direct current transmission. In the simulation calculation, it is necessary to include the cross-region DC transmission demand into the calculation of sub-regional net load in Gansu and undertake the task of sub-regional new energy transmission absorption. To address the challenge of modeling the equivalent adjustment characteristics of the four provinces, this study relies solely on the actual historical curve of inter-provincial mutual economic relations to establish the boundaries for equivalent supply and demand analysis, facilitating interconnection and economic integration between Gansu and these provinces.
The initial decision variable value is determined by considering the natural resource endowment of the sub-region, which is represented by the ratio of new energy generation in the sub-region to the sub-region load, as shown in Table 1.
As can be seen from the analysis of Table 1, the new energy planning is based on sub-regional development goals and involves an increment in proportion relative to existing new energy sources. This approach exemplifies the characteristics of natural resource endowment while closely aligning with actual development and planning requirements, thereby adhering to the principles of sustainable development. Notably, Region 1 assumes primary responsibility for augmenting the proportion of new energy generation within the province owing to its abundant natural resource endowment. Despite having marginally less abundant natural resources and their respective proportions compared to Region 1, Region 2 outperforms Region 3 in terms of advancements made in new energy development. Being a load center region, limitations imposed by scarce land resources and historical developmental factors impede the utilization of natural resources within Region 3, leading to a comparatively lower share of new energy generation. Therefore, the transmission of newly generated clean energy predominantly depends on interconnected backbone grids linking Regions 1 and 2 to fulfill the province’s objective for enhanced renewable power production.
The wind power, photovoltaic power and load of each zone were formed by using the historical measured values in the different regions to form per unit value, which is used as the input of uncertain source load parameters. Based on the above actual operation data and future development goals and indicators, an analysis of the construction and evolution of Gansu’s new power system was carried out. The flexible resource adjustment characteristics of source-grid-load-storage in Gansu Province are mainly considered in the following aspects:
  • Firstly, considering the influence of the seasonal variability of hydroelectric power conversion, the constraints of hydroelectric power generation capacity in each month and the constraints of the installed capacity of hydroelectric power generation capacity in each month are given. The monthly hydroelectric power generation utilization hours and regulation capacity constraints are shown in Table A1.
  • Secondly, the peak load capacity of thermal power units will be constrained during winter due to their reliance on heat generation. However, by implementing measures such as thermal–electric decoupling and enhancing flexibility, it is possible to enhance the adaptability of thermal power units to changes in power demand. In terms of power supply-side planning, it is essential to consider the impacts of thermal power heating and flexibility improvement separately in order to determine optimal ramping capabilities and operating strategies. This approach ensures reliable provision of both power and heating while enhancing the overall flexibility of thermal power units to meet the requirements of the power system. The specific situation of peaking capacity affected by thermal power heating and flexible transformation is shown in Table A2.
  • Thirdly, the regulation capability of solar thermal units is constrained by factors such as solar irradiance and the capacity of the solar collector and the thermal storage system. The regulation capability of solar thermal units is mainly utilized within the day. The cost of various types of power supply, grid, energy storage, and demand-side resources in the construction of the new power system in Gansu Province is set in combination with the actual project parameters in Gansu, as shown in Table A3. Gansu Province is divided into three regions formed by three transmission cross-sections: the Hexi transmission cross-section, the Wubai–Guandong transmission cross-section and the Guandong–Hebai transmission cross-section.

3. Results

The analysis in this paper is conducted using the Gansu power grid as a case study. Based on the development status of resource endowment and heavy load analysis of key transmission cross-sections in Gansu Province, three decision schemes are formulated: conservative, moderate, and radical. By comparing and analyzing these schemes while considering economic optimality goals and actual calculation deviations, a construction plan for the future new power system in Gansu is proposed.

3.1. Planning Scheme

Based on the aforementioned boundary data, the collaborative planning of source-grid-load-storage can be utilized to calculate an optimal planning scheme that meets the target new energy generation ratio of 45% by 2030. The proposed scheme incorporates a demand-side response, accounting for 5%, thereby ensuring an energy utilization rate exceeding 95%. Moreover, it guarantees power shortage or restriction at a remarkably low proportion of only 1/10,000, thus satisfying both system guarantee requirements and providing double assurance for new energy consumption.
The planned annual new capacity is calculated based on a five-year cycle, and the power supply development planning for each planning year from 2025 to 2060 is determined using the source-grid-load-storage planning model, as shown in Figure 2.
The expansion of hydroelectric power is limited to 10.5 GW, as depicted in Figure 2, due to constraints imposed by available resources. The growth of thermal power is hindered by elevated investment and operational costs; thus, the targeted thermal power capacity for 2060 is set at 45.9 GW. By the target year, the total installed capacity of new energy is planned to be 361 GW, of which 146 GW of wind power and 215 GW of photovoltaic power.
The capacity requirements of two key transmission cross-sections in the future are obtained by using the source-grid-load-storage planning model. The evolution path of the capacity of two key transmission cross sections from 2022 to 2060 is shown in Figure 3.
As can be seen from Figure 3, the demand for mutual capacity of key transmission cross-sections in Gansu Province shows an increasing trend from 2022 to 2060. In particular, from 2030 to 2060, the mutual capacity of key transmission cross-sections is in great demand. The capacity demand of the Hexi transmission cross-section is projected to reach 15.36 GW by 2060, representing a significant increase of 9.56 GW compared to the year 2022. The capacity of the Wubai–Guandong–Hebai transmission cross-section is expected to reach 21.40 GW by 2060, indicating a substantial growth of 10.90 GW in comparison with the year 2022. The main reason for the rapid growth of the mutual capacity of key transmission cross-sections is that with the development of economy and the improvement of people’s living standards, the power load is constantly increasing. In light of the rapid development of new energy in recent years, large-scale new energy access requires greater transmission section capacity.
The demand planning was conducted based on the upper limit of the demand-side response index, taking into account the system’s economic objectives due to the significant advantages offered by the load-side response transformation and response cost. The corresponding results are presented in Figure 4.
As can be seen from the planning results in Figure 4, the load-side demand response of Region 3 is greater, indicating that there are higher demands and requirements in terms of power demand-side response capability. This suggests the necessity for further improvements in load-side responsiveness and efficiency to effectively address the escalating demands and stricter energy efficiency requirements.
In order to ensure that the maximum energy storage capacity fully contributes to meeting the duration demand for energy storage within the system’s flexibility balance, the energy storage charging area in the system planning year is integrated based on the equal area rule. This efficient integration allows for an effective utilization of the maximum demand capacity and enables us to obtain an appropriate energy storage duration curve. Similarly, in the event of a deficiency in meeting the demand for energy storage duration, supplementary short-term energy storage capacity can be incorporated based on the equal area rule, thereby ensuring comprehensive system flexibility and compliance with regulatory requisites. The energy storage duration demand considering the participation of the maximum required capacity is shown in Figure 5. According to the proposed planning scheme in this paper, it is projected that the required operational duration for energy storage will be 5.1 h by 2030 and will increase to 7.2 h by 2060. As the proportion of renewable energy generation rises, there will be a gradual escalation in the demand for equivalent energy storage capacity.

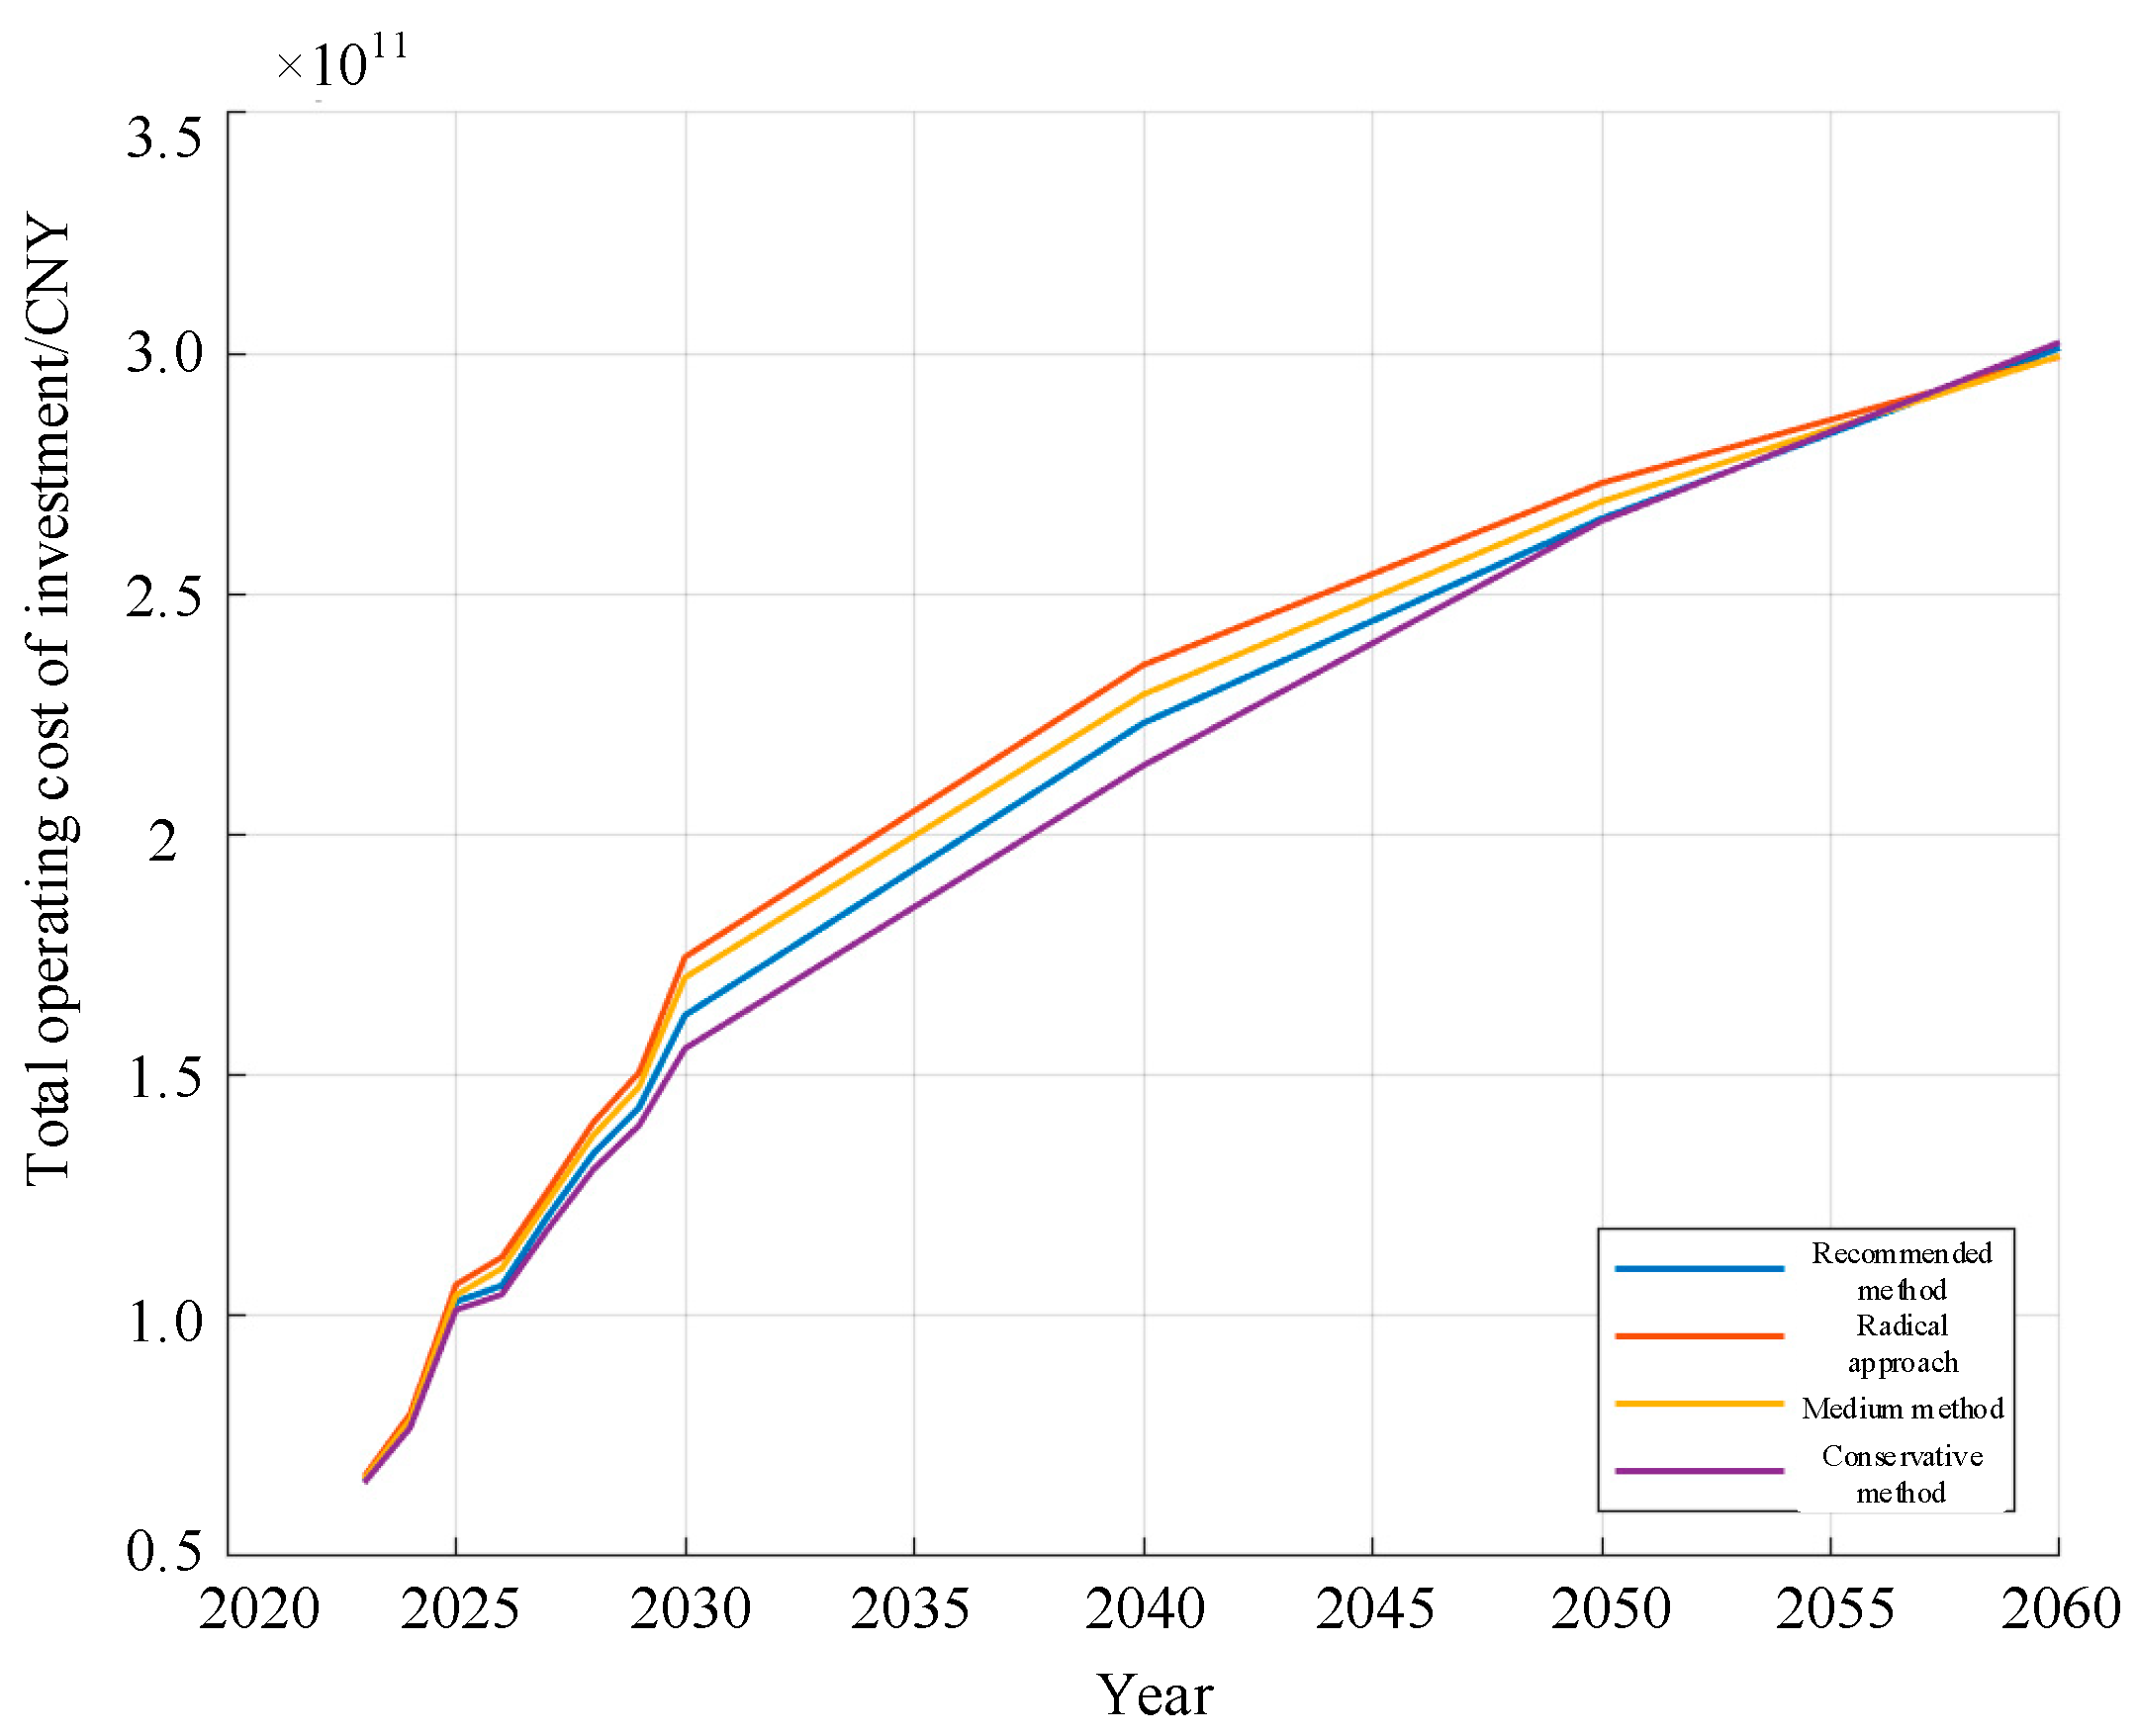
3.2. Optimal Evolutionary Path

As shown in Figure 6, the evolution path of Gansu’s new power system is categorized into three distinct phases, namely radical transformation, normal transformation, and conservative transformation. Additionally, the planned time sequence incorporates a penetration ratio for new energy.
As can be seen from Figure 6, within the same year, the aggressive transformation strategy incurs a higher total investment cost compared to both the conservative and normal transformation strategies. In the radical transformation strategy, due to the large-scale access of new energy, it may have an impact on the stability and reliability of the power grid. To ensure the stable operation of the grid, additional investments are needed to provide stability control and backup energy. And radical transformation may involve more complex and advanced technologies, the development and application of which require significant capital investment.
The weighted benefits of economy and environmental protection are considered in different transformation paths, taking into account the overall cost of the system and the total capacity of coal power generation. Given China’s increasing emphasis on environmental impact within the framework of green and low-carbon transformation, a comprehensive weighted benefit ratio of 1:5 is selected based on standardized costs and coal power generation, as illustrated in Table 2.
By analyzing various pathways and fitting a weighted benefit curve, the optimal value of weighted benefit can be determined. Collaborative planning of source-grid-load-storage can then lead to the formulation of a recommended scheme and evolutionary development path by adjusting decision variable inputs based on their approximate linear correlation with a weighted benefit.

4. Discussion

Firstly, the proposed planning and optimization method for the first time comprehensively considers the regulating characteristics of multiple types of flexible resources in the provincial-level power grid in this paper. The source–load relationship is accurately modeled in a precise temporal manner, incorporating various types of new energy, energy storage, and other flexible resources into the planning scope. This enables a more comprehensive analysis of the resource endowment and potential flexibility within the system.
Secondly, considering the dual security constraints, power–energy balance constraints, and operational reserve constraints in the temporal production operation simulation, which enables a more accurate consideration of the coordinated planning of sources-grid-load-storage within the system. This facilitates the establishment of an economically optimal provincial-level power grid source-grid-load-storage coordination planning model.
Then, by delineating distinct planning objectives, conducting predictive evolution of techno-economic performance over successive years, and formulating adaptive development decision strategies, multiple evolving path planning schemes can be derived. Considering the optimal goal of the economic and environmental weighted benefits throughout the entire life cycle of the power system, the best evolving development path can be identified. Analyzing the multi-year economic and environmental weighted benefits of the evolving development path allows for a better assessment of the long-term economic and environmental benefits of the evolutionary planning schemes, providing a more comprehensive technical reference for future planning.
Based on the model and method proposed in this paper, the power grid of Gansu Province is analyzed and studied. The calculation results reveal that the implementation of the radical transformation scheme leads to a 43.3 billion yuan increase in system cost compared to the conservative scheme while simultaneously reducing coal power generation by 174 GWh. When considering the weighted benefits of economy and environmental protection, it is observed that as the weight assigned to environmental protection benefits increases, the optimal scheme aligns more closely with the radical approach.
The technology and economy of the flexible resources on each side of source-grid-load-storage have a great impact on the planning results. Due to the good technology and economy of the demand-side response resources, the planning results of the source-grid-load-storage are planned according to their upper limit constraints. In the future construction of the new power system, attention should be paid to the resource potential on the demand side to improve the penetration rate of new energy generation.

5. Conclusions

In this paper, various forms of flexible resource coordination such as light and heat, and the mutual benefit of provincial power grid and demand-side response are considered, and a collaborative planning model of source-grid-load-storage is established, and the decision variable setting and evolution analysis method under different system policies and index system requirements are analyzed. The following conclusions are obtained:
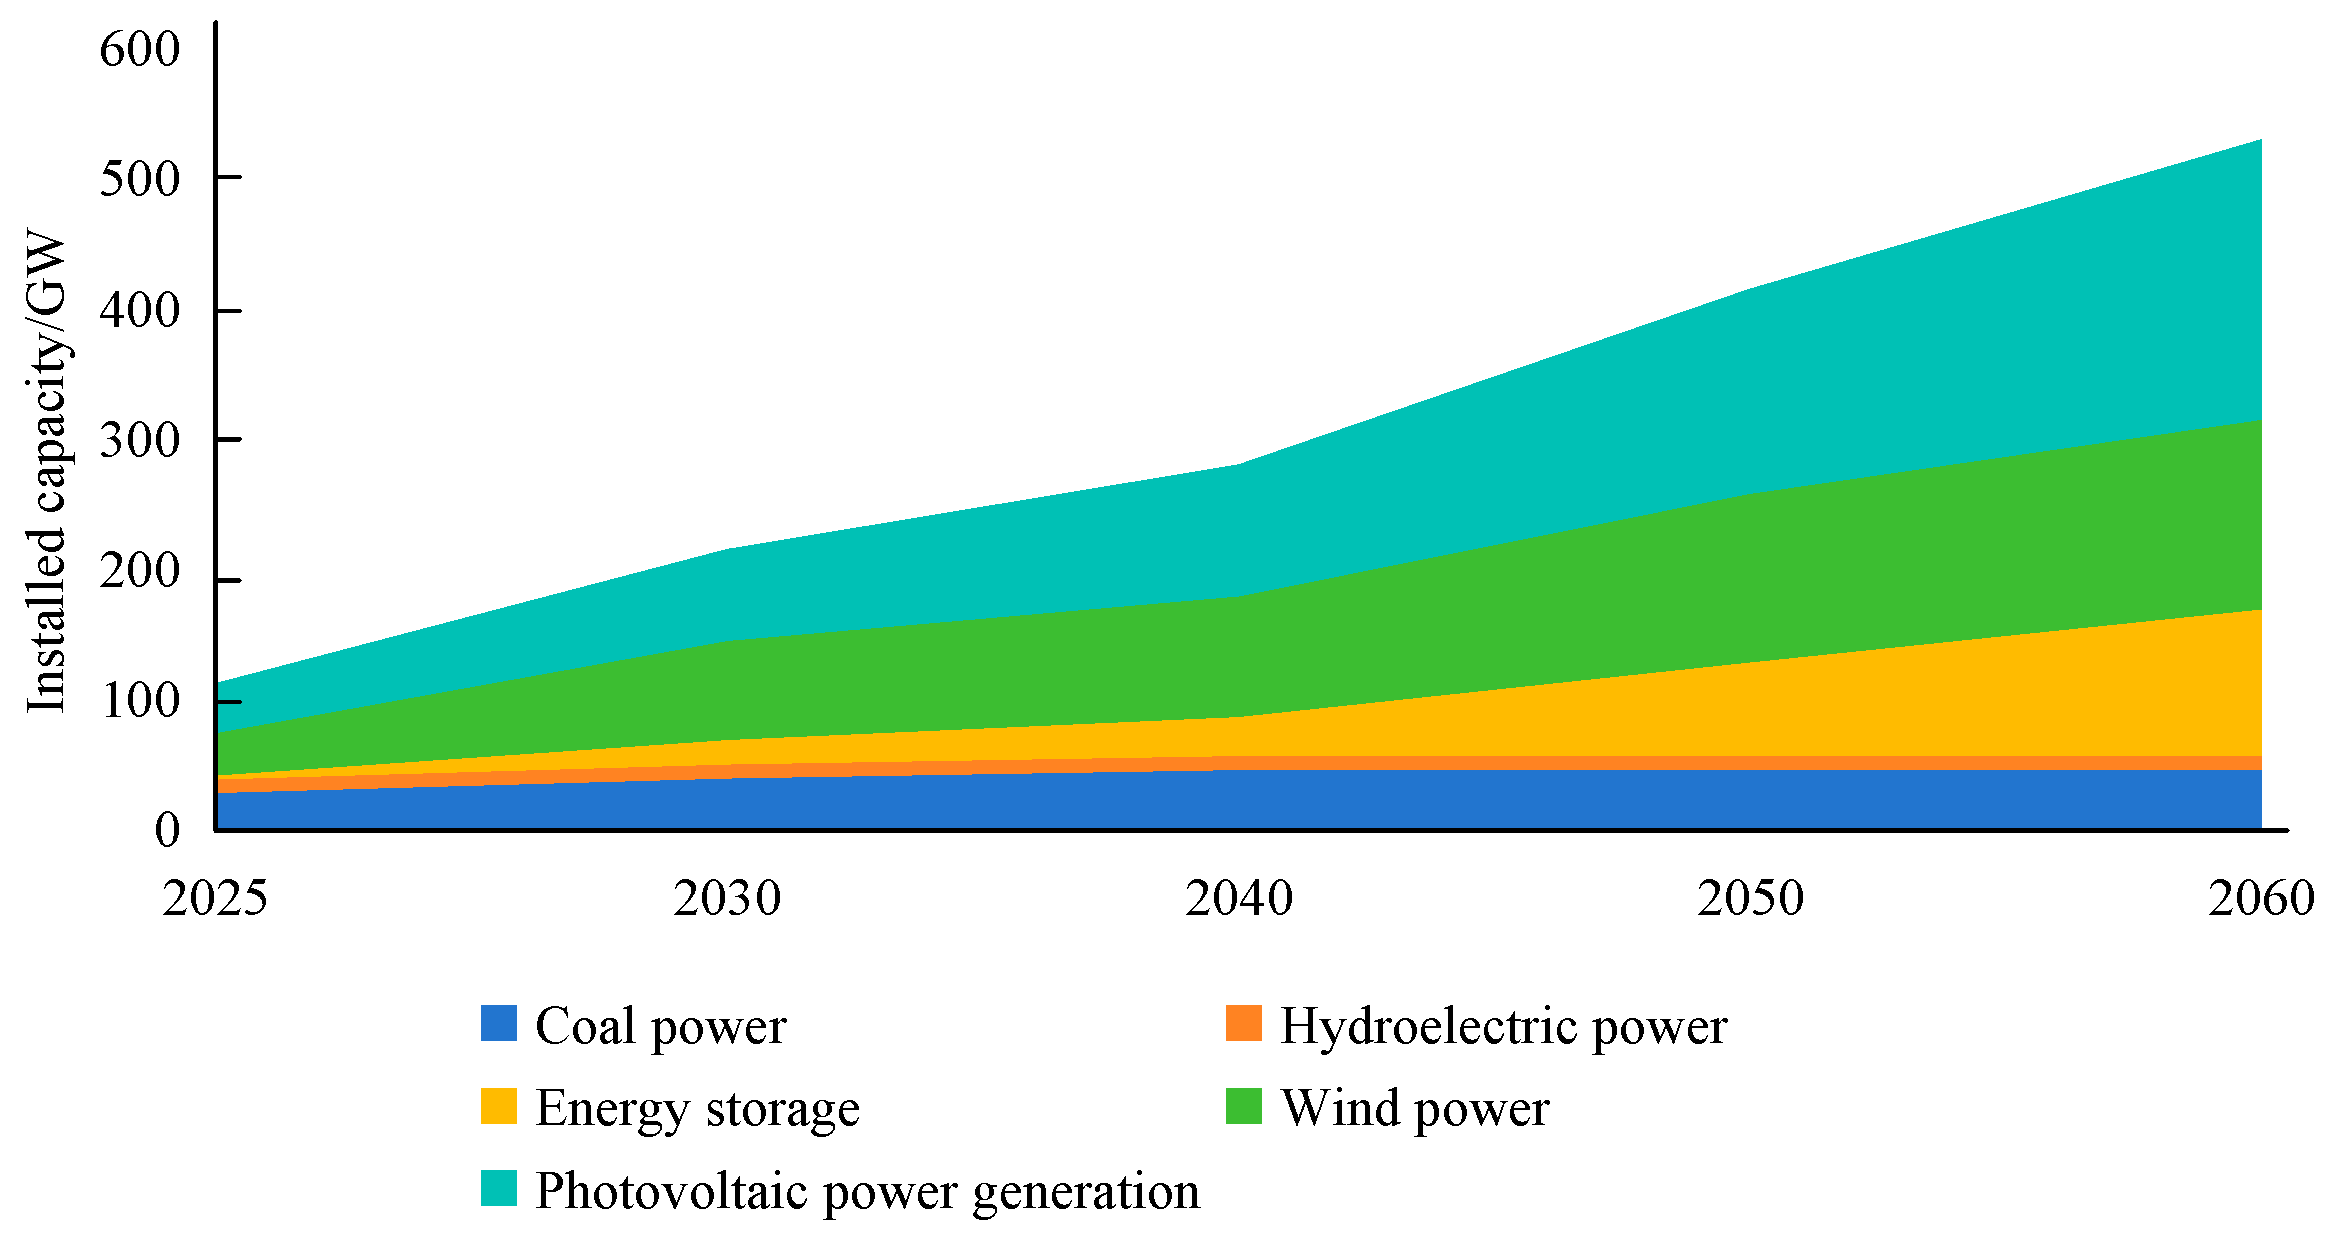
  • The planning results of the source-grid-load-storage in Gansu Province reveal a substantial demand for flexible resources on the source-grid-load-storage side, which is driven by the rapid development of new energy sources on the power side. Under the constraints of double protection, the spatial mutual benefit capacity of the power grid plays a significant role in this system. It is crucial to strengthen or anticipate timely enhancements to transmission capacity within the power grid channel due to its high utilization rate. In order to achieve lower electricity costs and facilitate a seamless transformation of our energy power system, meticulous planning of the source-grid-load-storage side becomes imperative.
  • In the era of rapid energy storage development, this study examines and discusses the configuration of energy storage duration to enhance power supply reliability and optimize new energy utilization. Through statistical analysis of the simulated running hours of each regional energy storage time series, we evaluated the annual non-zero operational hours and calculated the charging hours required for mid-year energy storage participation planning. According to the 2030 planning scenario, it is anticipated that the average duration of energy storage participation will be approximately nine hours, while by 2060, there will be a demand for energy storage participation lasting up to 14 h. Therefore, when conducting energy storage planning for a new power system, it is essential to engage in integrated planning for various types of long-term energy storage resources, including solar and thermal, pumped storage, and hydrogen energy storage. This approach aims to mitigate the potential risks associated with insufficient energy storage duration in the future power system, thereby ensuring reliable power supply while avoiding excessive costs resulting from an extensive deployment of short-cycle energy storage solutions.
  • In the future, the new energy, interconnected power grid and energy storage planning of the new energy system are coupled and restricted each other, so it is necessary to establish a model that takes into account accuracy and efficiency as well as carry out overall planning from the perspective of the system. The research shows that both power supply and energy storage can provide adjustment ability for the system, and there is a reasonable ratio of different types of power supply and energy storage in economy. On the one hand, power grid interconnection can play the smoothing effect of new energy output between regions. On the other hand, it can play the complementary characteristics of power generation and load between regions, and it can also provide adjustment capacity for the system and reduce the system’s demand for energy storage.

Author Contributions

Conceptualization, X.L.; methodology, J.Q., X.W. and Z.J.; software, C.Y. and Z.J.; validation, X.L. and B.C.; formal analysis, C.Y.; investigation, X.W.; resources, X.L.; data curation, C.Y.; writing—original draft preparation, J.Q. and X.W.; writing—review and editing, X.L., J.Q., C.Y., B.C., X.W. and Z.J.; visualization, B.C.; supervision, X.L.; project administration, X.L. All authors have read and agreed to the published version of the manuscript.

Funding

This paper was funded by the Major Science and Technology Special Project of Gansu Province, the Management Consulting Project of Economic and Technological Research Institute of Gansu Electric Power Company, State Grid (Research on Construction plan of New Power System Demonstration Zone at typical regional level in Gansu Province) and the ten key research projects of the State Grid Gansu Electric Power Company in 2023, grant number: 22ZD6GA032, SGGSJY00XXWT2310040 and SGGSKY00BGJS2310273.

Data Availability Statement

Data are contained within the paper.

Conflicts of Interest

Authors Xuejun Li, Changhai Yan and Boyang Chen were employed by the State Grid Gansu Electric Power Company. The remaining authors declare that the research was conducted in the absence of any commercial or financial relationships that could be construed as a potential conflict of interest.

Abbreviations

The abbreviations or symbols used in this text are detailed below:
Nomenclature
Abbreviations or Symbol
C z ( y , t ) the total system cost in y years in the evolution cycle considering the influence of decision variables p c s p i , t the output of the ith solar thermal power at time t
ϕ s o u r c e ( x , u ) the operational constraints of the source-side flexibility resource in the operational simulation l i , t the output of the ith line at time t
ϕ l i n e ( x , u ) the operational constraints of the grid-side flexibility resource in the operational simulation s i , t the output of the ith energy storage at time t
ϕ l o a d ( x , u ) the operational constraints of the load-side flexibility resource in the operational simulation d z i , t the ith interruptible load power at time t
ϕ s t o ( x , u ) the operational constraints of the storage-side flexibility resource in the operational simulation d f i , t the ith shift-able load power at time t
F ( x , t , u ) the system operation constraints with decision variables in the operation simulation d d , i c u t the ith shear load power at time t
C s y s i n v the total investment cost of the regulation resources at each side of source-grid-load-storage d i , t c u t the size of the ith load at time t
C s y s o p e r the total operation cost of the regulation resources at each side of source-grid-load-storage β the sufficiency of power supply
C s o u r c e i n v the construction costs of source side R b i , t the power generation output of the ith clean energy at time t
C l i n e i n v the construction costs of grid side N r b the number of clean energy equipment
C l o a d i n v the construction costs of load side α the penetration rate of clean energy power generation
C s t o i n v the construction costs of storage side Ω n the collection of the output of various types of power sources, transmission capacity on the grid side, response capacity on the load side, and charging and discharging capacity on the energy storage side in region n
C s o u r c e o p e r the operating costs of source side s i , t d i s the discharge capacity of the ith energy storage system at time t
C l i n e o p e r the operating costs of grid side s i , t c h a the charge capacity of the ith energy storage system at time t
C l o a d o p e r the operating costs of load side g i , t u r the standby capacity that the thermal power of the ith grid can provide at time t in a specific region
C s t o o p e r the operating costs of storage side h i , t u r the standby capacity that the hydroelectric power of the ith grid can provide at time t in a specific region
C g , i i n v the unit capacity investment costs of thermal power p c s p i , t u r The standby capacity that the solar thermal of the ith grid can provide at time t in a specific region
C h , i i n v the unit capacity investment costs of hydroelectric power l l s i , t u r the standby capacity that the outward inter-regional electricity transfer of the ith grid can provide at time t in a specific region
C w , i i n v the unit capacity investment costs of wind power l l r i , t u r the standby capacity that the inward inter-regional electricity transfer of the ith grid can provide at time t in a specific region
C p , i i n v the unit capacity investment costs of photovoltaic power s c h a i , t u r the standby capacity that the energy storage of the ith grid can provide at time t in a specific region
C c s p , i i n v the unit capacity investment costs of solar thermal d z i , t u r the standby capacity that the transferable load of the ith grid can provide at time t in a specific region
C l , i i n v the unit capacity investment costs of line d f i , t u r the standby capacity that the interruptible load of the ith grid can provide at time t in a specific region
C s , i i n v the unit capacity investment costs of energy storage κ the ratio of the system standby capacity to the net load capacity
C v , i i n v the unit capacity investment costs of transferable load G i the rated capacity of the ith thermal power unit in the target year
C d f , i i n v the unit capacity investment costs of interruptible load θ i the monthly upward capacity limit of thermal power units
G i the capacity to be built for the ith thermal power σ the minimum start-up mode coefficient of thermal power units
H i the capacity to be built for the ith hydroelectric power O g , i , t the total online capacity of the ith thermal power unit at time t
W i the capacity to be built for the ith wind power λ g , i the minimum output ratio of the ith thermal power unit
P s o l a r i the capacity to be built for the ith photovoltaic power g i , t o n the unit capacity increase in the ith thermal power unit at time t
P c s p i the capacity to be built for the ith solar thermal g i , t o f f the unit capacity decrease in the ith thermal power unit at time t
L i the capacity to be built for the ith line T o n the minimum startup intervals of thermal power units
S i the capacity to be built for the ith energy storage T o f f the minimum shutdown intervals of thermal power units
D z i the capacity to be built for the ith transferable load μ i the monthly maximum upward adjustment capacity coefficient of the ith hydroelectric power unit
D f i the capacity to be built for the ith interruptible power H i the rated capacity of the ith hydroelectric power unit in the target year
S j 1 the new energy storage capacity in j − 1 year N m the total number of time segments per month
S the capacity critical value of the change in energy storage construction cost E h , i m the monthly available power generation of the ith hydroelectric power unit affected by monthly incoming water
μ the rate at which the new size exceeds S A i h the design annual operating hours of the ith solar thermal power unit
C g , i u , p the unit start-stop cost of the ith thermal power plant P c s p , i the rated installed capacity of the ith solar thermal power unit
C g , i the unit generation cost of thermal power I D N I , n , t the solar radiation intensity of the new energy base at time t on the nth day
C h , i the unit generation cost of hydroelectric power η s o l a r , h the energy conversion efficiency of the power station
C w , i the unit generation cost of wind power p w b the normalized predicted power coefficients of wind power at time t
C p , i the unit generation cost of photovoltaic power p s o l a r b the normalized predicted power coefficients of photovoltaic power field at time t
C c s p , i the unit generation cost of solar thermal power W w the installed capacity of wind power in the target year
C l , i the unit generation cost of line P s o l a r , p the installed capacity of photovoltaic power plants in the target year
C s , i the unit generation cost of energy storage L max l r constrained by the incoming power limits of the line or section at time t
C d , i z the unit interruption costs of the ith load L max l s constrained by the outgoing power limits of the line or section at time t
C d , i z the unit translation costs of the ith load d z i max the maximum power values of the transferable load
C d , i c u t the unit load cutting costs of the ith load d f i max the maximum power values of the interruptible load
g i , t u p the start–stop capacity of the ith thermal power at time t S i the rated capacity of the ith energy storage system in the target year
g i , t the output of the i thermal power at time t η s , i the charging and discharging efficiency of the ith energy storage system.
h i , t the output of the ith hydroelectric power at time t E s , i , t the charge or electric quantity status of the ith energy storage system at time t
w i , t the output of the ith wind power at time t T s , i the continuous charging and discharging time of the ith energy storage system
p s o l a r i , t the output of the ith photovoltaic power at time t

Appendix A

Table A1. Monthly hydroelectric power generation utilization hours and regulation capacity constraints.
MonthGenerating Capacity/GWhPercentage of Installed Generating Capacity/%
11.240
21.240
31.860
42.895
54.395
65.895
75.895
86.095
95.895
104.195
112.260
121.340
Table A2. Peak regulation capacity affected by thermal power heating and flexibility transformation.
MonthDepth of Peak Regulation/%Flexible Transformation/%
16045
26045
36040
45030
55030
65030
75030
85030
95030
106040
116045
126045
Table A3. Flexibility resource cost parameter settings.
Equipment CostParameter SettingUnit
Thermal power3700CNY/kW
Hydroelectric power4418CNY/kW
Solar thermal power generation6350CNY/kW
Wind powerRegion 1: 4000CNY/kW
Region 2: 4200CNY/kW
Region 3: 4400CNY/kW
Photovoltaic power generationRegion 1: 3100CNY/kW
Region 2: 3200CNY/kW
Region 3: 3300CNY/kW
Line1400CNY/kW
Storage1650CNY/kW
Thermal power operation0.45CNY/kWh
Hydroelectric power operation0.04CNY/kWh
Demand side1080CNY/kW
Thermal power starts and stops0.3071CNY/kWh
Wind power operation0.03CNY/kWh
Wind power operation0.02CNY/kWh
Demand-side response0.4CNY/kWh
Load limiting1.8CNY/kWh

References

  1. New Power System Development Blue Book; National Energy Administration: Beijing, China, 2023.
  2. Energy Research Institute; National Development and Reform Commission. Research on the Development Scenario and Path of China’s 2050 High-Proportion Renewable Energy; Energy Research lnstitute, National Development and Reform Commission: Beiing, China, 2015. [Google Scholar]
  3. IEA. Power Systems in Transition; IEA: Paris, France, 2020. [Google Scholar]
  4. Yang, B.; Li, Y.; Yao, W.; Jiang, L.; Zhang, C.; Duan, C.; Ren, Y. Optimization and Control of New Power Systems under the Dual Carbon Goals: Key Issues, Advanced Techniques, and Perspectives. Energies 2023, 16, 3904. [Google Scholar] [CrossRef]
  5. Nguyen, H.N.; Zhang, C.; Mahmud, M.A. Optimal coordination of G2V and V2G to support power grids with high penetration of renewable energy. IEEE Trans. Transp. Electrif. 2015, 1, 188–195. [Google Scholar] [CrossRef]
  6. Moghaddam, I.N.; Chowdhury, B.H.; Mohajeryami, S. Predictive operation and optimal sizing of battery energy storage with high wind energy penetration. IEEE Trans. Ind. Electron. 2018, 65, 6686–6695. [Google Scholar] [CrossRef]
  7. Kaushik, E.; Prakash, V.; Mahela, O.P.; Khan, B.; El-Shahat, A.; Abdelaziz, A.Y. Comprehensive Overview of Power System Flexibility during the Scenario of High Penetration of Renewable Energy in Utility Grid. Energies 2022, 15, 516. [Google Scholar] [CrossRef]
  8. Lu, Z.; Li, H.; Qiao, Y. Power system flexibilityplanning and challenges considering high proportion of renewable energy. Autom. Electr. Power Syst. 2016, 40, 147–158. [Google Scholar]
  9. Abdin, A.F.; Zio, E. An integrated framework for operational flexibility assessment in multi-period power system planning with renewable energy production. Appl. Energy 2018, 222, 898–914. [Google Scholar] [CrossRef]
  10. Li, J.L.; Guo, Z.D.; Ma, S.L.; Zhang, G.Q.; Wang, H. Overview of the “Source-grid-load-storage” Architecture and Evaluation System Under the New Power System. High Volt. Eng. 2022, 48, 4330–4342. [Google Scholar]
  11. Zongxiang, L.; Yisha, L.; Ying, Q. Flexibility Supply-Demand Balance in Power System with Ultra-high Proportion of Renewable Energy. Autom. Electr. Power Syst. 2022, 46, 3–16. [Google Scholar]
  12. Cang, L.; Bian, X.; Liang, S.; Yang, X.; Zhao, J.; Shi, S. Power System Flexibility Evaluation Considering Renewable Energy Accommodation. Power Syst. Technol. 2023, 47, 338–349. [Google Scholar]
  13. Heggarty, T.; Bourmaud, J.Y.; Girard, R.; Kariniotakis, G. Multi-temporal assessment of power system flexibility requirement. Appl. Energy 2019, 238, 1327–1336. [Google Scholar] [CrossRef]
  14. Bian, X.; Wu, S.; Zhao, J.; Xu, L.; Zhou, B. Multi-level flexible resources planning of new power system considering source-load carbon responsibility allocation. Power Syst. Autom. Equip. 2023, 43, 3–13. [Google Scholar]
  15. Wei, X.; Liu, D.; Gao, F.; Liu, L.; Wu, Y. Generation Expansion Planning of New Power System Considering Collaborative Optimal Operation of Source-grid-load-storage Under Carbon Peaking and Carbon Neutrality. Power Syst. Technol. 2023, 47, 1–13. [Google Scholar]
  16. Pourmoosavi, M.A.; Amraee, T. Low carbon generation expansion planning with carbon capture technology and coal phase-out under renewable integration. Int. J. Electr. Power Energy Syst. 2021, 128, 106715. [Google Scholar] [CrossRef]
  17. Li, D.; Cheng, X.; Ge, L.; Huang, W.; He, J.; He, Z. Multiple Power Supply Capacity Planning Research for New Power System Based on Situation Awareness. Energies 2022, 15, 3298. [Google Scholar] [CrossRef]
  18. Xie, K.; Li, H.; Wang, J. Overall Planning of Source-Load-Storage Resources Considering Coordination in Transmission and Distribution Network. Electr. Power Constr. 2021, 42, 41–52. [Google Scholar]
  19. Zhang, Z.; Kang, C. Challenges and Prospects for Constructing the New-type Power System Towards a Carbon Neutrality Future. Proc. CSEE 2022, 42, 2806–2819. [Google Scholar]
  20. Kang, C.; Du, E.; Guo, H.; Li, Y.; Fang, Y.; Zhang, N.; Zhong, H. Six Elements Analysis of New Power Systems. Power Grid Technol. 2023, 47, 1741–1750. [Google Scholar]
  21. Ren, D.; Xiao, J.; Hou, J.; Du, E.; Jin, C.; Liu, X. Research on the construction and evolution of China’s new power system under the dual carbon target. Grid Technol. 2022, 46, 3831–3839. [Google Scholar]
  22. Sun, X.; Wang, Y.; Li, Q.; Li, F.; Yang, P. Research on planning of photothermal power station completely replacing thermal power in new power system. Grid Technol. 2022, 46, 2948–2954. [Google Scholar]
  23. Wei, X.; Liu, D.; Gao, F.; Liu, L.; Wu, F. New power system generation planning considering source-grid-load-storage coordinated optimal operation under dual-carbon objective. Grid Technol. 2023, 47, 3648–3661. [Google Scholar]
  24. Lu, Z.; Li, H.; Qiao, Y. Morphological Evolution of Power Systems with High Share of Renewable Energy Generations from the Perspective of Flexibility Balance. J. Glob. Energy Interconnect. 2021, 4, 12–18. [Google Scholar]
  25. Chen, X.; Tian, G.; Huang, Y.; Yang, Y.; Li, J.; Wu, Y.; Chi, Y. New power system development path mechanism design. Glob. Energy Interconnect. 2023, 6, 166–174. [Google Scholar] [CrossRef]
Figure 1. Source-grid-load-storage collaborative planning and evolution analysis framework.
Energies 17 00273 g001
Figure 2. Power supply development plan of Gansu Province from 2025 to 2060.
Energies 17 00273 g002
Figure 3. The development demand of mutual capacity of key transmission cross-sections.
Energies 17 00273 g003
Figure 4. Regional load response capacity demand planning in Gansu Province.
Energies 17 00273 g004
Figure 5. The configuration requirements of equivalent energy storage duration in different planning years.
Energies 17 00273 g005
Figure 6. The total cost under different evolution paths.
Energies 17 00273 g006
Table 1. Decomposition table of the development target for new energy power generation in Gansu Province.
Year202220252030
The proportion of new energy in electricity development target313645
Rate of increase 16.137.14
Region 1 (the Hexi)0.81970.95191.1899
Region 2 (the Wubai–Guandong transmission cross-section)0.52470.60930.7617
Region 3 (the Guandong–Hebai transmission cross-section)0.11040.12820.1603
Table 2. Cost and environmental protection under different evolution paths.
Construction SchemeTotal System Cost
(CNY/100 Billion)
Total Coal Power Generation
(100 GWh)
Weighted Benefit
Radical transformation program8.40995.41595.7570
Normal transition plan8.27125.76555.7234
Conservative transformation plan7.97697.15425.7425
Recommended scheme8.1200--
Disclaimer/Publisher’s Note: The statements, opinions and data contained in all publications are solely those of the individual author(s) and contributor(s) and not of MDPI and/or the editor(s). MDPI and/or the editor(s) disclaim responsibility for any injury to people or property resulting from any ideas, methods, instructions or products referred to in the content.

