1. Introduction
China is committed to adopting more effective policies and measures to reach peak emissions of CO
2 by 2030 and achieve carbon neutralization by 2060 [
1]. Renewable energy sources, such as wind turbines and photovoltaic (PV) energy, will gradually become the main power supply. However, the output of renewable energy is uncertain [
2,
3], and it needs to be coordinated with flexible resources to provide a stable power supply to meet the load.
A high penetration of distributed generation causes voltage fluctuations and efficiency problems in active distribution networks [
4,
5]. If the system can take appropriate peak regulation measures or install energy storage (ES) equipment that can cooperate with peak regulation, it can effectively compensate for the intermittency, variability and uncertainty of wind turbine and PV output, thereby improving the power penetration rate of renewable energy. The idea of using scheduled capacity is proposed when accessing wind power [
6]. Compared with the traditional method of ensuring access capacity, the maximum installed capacity can be increased up to 160 MW, and the wind energy penetration increases from 125 to 421 GWh/year while allowing for the removal of some wind turbines or limiting the output of wind turbines. For the specific situation in China, by formulating reasonable subsidy policies and increasing the transmission capacity of contact lines, the proportion of renewable energy power generation is increased [
7]. The penetration rate of wind power can be improved by using heat pumps from the perspective of an integrated energy system [
8]. This would be feasible for any percentage of wind power, especially wind inputs above 20–25%. The impact of ES equipment on wind power penetration is studied [
9]. The improvement in wind energy integration can be between 1.7% and 8% by using ES equipment. The highest proportion of renewable energy in Finland that can reach primary energy is studied [
10]. In an optimistic situation, the proportion can be as high as 70%. In the current state, it can also reach more than 40%, but the article does not consider the constraints of the power system. Another effective way to increase the penetration of renewable energy is to combine electricity with other forms of demand. In view of the lack of energy and fresh water in Jordan, renewable energy power generation is combined with seawater desalination [
11]. The demonstrated configuration can increase the share of intermittent renewables in the production of electricity to up to 76%, resulting in a high reduction in fuel consumption, CO
2 emissions and costs. The load can be supplied by wind power generation combined with hydrogen production, which uses wind power that cannot be consumed by the system to produce hydrogen, and analyses of the feasibility of commercial promotion of this combination are conducted [
12]. In addition, wind power and PV power generation are complementary on a long-term scale. When studying the maximum power penetration, the optimal ratio of wind turbines and PV equipment is also an important research topic. An optimal ratio analysis of wind power, PV and wave power generation in Denmark using Energy PLAN evaluation software is carried out [
13]. It is found that the optimal mixture seems to be when onshore wind power produces approximately 50% of the total electricity production from renewable energy sources. Although taking appropriate measures or investing in flexible resources can improve the power penetration rate of renewable energy, it often increases the power supply cost of the power system, and this should guide the investment and construction of flexible resources from the perspective of the power supply economy.
The construction of ES equipment provides a new technical path for the safe and reliable operation of power systems with high proportions of renewable energy. Most ES optimization models established in the existing literature take the minimum system investment cost and operation cost as the objective function. The influence of the net load, wind turbine output, network topology, capacity configuration of wind farms and ES power station and installation costs on the optimization planning is analyzed [
14]. In the optimization model established [
15], the life model constraints and system operation constraints of the ES device are considered, and the planning model of the ES device is established with the goal of determining the life cycle cost and unit operation cost. It is found that the planning cost of ES plants will decrease by 5–23% when the wind abandoned rate increases by 2%. A planning method for hybrid ES capacity is proposed [
16], which determines the capacity of hybrid ES according to the peak–valley difference of load curve. By establishing the mathematical model between the peak–valley difference and the capacity of the ES, the detailed fitting function can be calculated to guide the capacity allocation of hybrid ES. Since ES can improve the utilization of renewable energy, an ES capacity expansion planning model considering multiple functions of hybrid ES systems is established [
17]. The benefit of hybrid ES in capacity expansion construction is increased by 10.4% by the proposed model. The single ES effect is often limited. ES can only maximize its effectiveness when combined with other flexible resources.
However, due to the timing characteristics of ES equipment, it is often difficult to solve the optimization model. A bi-level programming method is used to propose a joint planning model of distributed generation and ES in an active distribution network [
18], a. In this model, the optimization goal is to find the optimal location and capacity of DGs and ES devices, while the secondary goal is to optimize the operation of ES devices. In order to solve the model, an improved binary particle swarm optimization algorithm based on chaos optimization is proposed. The joint planning method of DGs and storage manages to reduce the planning errors, and it achieves the lowest annual cost compared with other methods. A data-driven ES system planning method based on robust optimization and the scenario method is proposed [
19]. By combining two-stage robust optimization with scenario method theory, it can better adapt to the risk preferences set by planners. A wind power–PV cell-heat storage hybrid power system is established [
20]. A multi-objective decision making evolutionary algorithm is proposed. It is found that hybrid ES reduces the net present cost by 5.3% and 11.4%, respectively, compared to thermal ES and a battery. ES is the key element for the flexible adjustment ability of the system. However, simply relying on ES to provide the flexibility required by the system will cause problems such as greatly increasing the investment cost of the power system and reducing the utilization rate of equipment. The ES and interconnected power grids cooperate with each other and give full play to their complementary benefits to improve the safety and economy of clean power systems.
The interprovincial tie-line has the characteristics of large capacity, controllability and flexibility and has a wide range of applications. An optimal scheduling strategy for interprovincial emergency power support after ultra-high voltage direct current (UHVDC) blocking is proposed [
21]. Through the coordinated control of the two levels of network and province, the coordinated optimal scheduling of interprovincial emergency power support after UHVDC blocking can be realized. A tie-line supply and demand coordination plan model considering security constraints is proposed [
22]. The model can give the best tie-line plan to meet the operational needs of a province. A hierarchical optimization model of tie-lines based on the whole network coordination is proposed [
23], which realizes the automatic compilation and flexible adjustment of the tie-line plan and provides an achievable way to combine the tie-line plan with the power grid’s operational state. In order to balance the efficiency and flexibility of tie-line scheduling, the optimization model of tie-line operation mode is established on the basis of the tie-line load rate [
24]. More wind energy can be consumed by connecting power systems through tie-lines and coordinating scheduling of generators and tie-lines. The levels of expected energy that is not supplied because of scenario reduction techniques based on the clustering method, i.e., k-means, Gaussian mixture model and Fuzzy C-means, are 147%, 38% and 130% higher than that of the SSM. An optimal dispatch method for decentralized generators considering environmental constraints, dynamic rating of tie-lines and wind power generation is proposed [
25]. It is found that applying dynamic tie-line rating can reduce the total operation cost and emission of a multi-area network. Most of the existing studies have formulated tie-line power adjustment schemes for short-term power demand, without considering the seasonal characteristics of renewable energy output and flexibly adjusting the tie-line power from the perspective of power and energy balance.
In summary, in order to achieve the “double carbon” goal, it is necessary to vigorously develop renewable energy power generation. In order to compensate for the intermittence, variability and uncertainty of wind turbine and PV output, the system must take appropriate peak shaving measures or install equipment that can cooperate with peak shaving. The existing research has the following shortcomings: (1) When flexible resources are put into construction, the role of interprovincial tie-lines is not fully realized, resulting in low equipment utilization and high power supply costs. (2) When carrying out the flexible dispatch of tie-line power, only the short-term operation mode of the power system is often considered, and the seasonal characteristics of renewable energy output are not taken into account, and the flexible adjustment is carried out from the perspective of a system power balance analysis.
In view of the shortcomings of the existing research, a method considering the peak regulation demand power supply economy of the power system is proposed. It is characterized by analyzing the peak regulation problem of the power system at different time scales for the power and energy balance demands of the power system. The main innovative work is as follows:
- (1)
The current situation of power supply and demand for a provincial power grid is analyzed. The problems and challenges of a new type of power system in China are put forward.
- (2)
The source load balancing problems at different time scales are proposed. The optimization model of power on tie-lines for a long-term electricity balance is developed. The difficulty of long-term electricity balance can be alleviated by flexibly adjusting the power on the tie-lines of a provincial power grid.
- (3)
With the cooperation between ES and flexible adjustment of the power on a tie-line, an optimal planning model for an ES system with power supply cost as the objective function is established. The actual output curve of each type of unit is obtained by day-ahead economic dispatch, and the power supply cost of the whole system is accurately calculated.
The organization of the article is as follows:
Section 2 introduces the current situation of supply and demand in Henan Province and the development trend of future power sources. An optimization planning model for energy storage capacity is established, and the solving methods are given in
Section 3. The case study is conducted in
Section 4. The obtained conclusions are given in
Section 5.
2. Power Supply Structure and Development Trend in Henan Province
China has a vast area of territory and 34 provincial administrative regions. Due to the differences in the power composition and power surplus of each province, each province faces different challenges in formulating low-carbon power generation schemes. Henan Province has a high demand for electricity, an electricity gap, a high-carbon existing power supply, and tight environmental constraints. The pressure of the electricity revolution is higher in Henan than in most other provinces.
There is a positive correlation between the per capita electricity consumption and the level of social development. The per capita electricity consumption in Henan Province is only 74% of the national average. China is the largest developing country and is currently developing steadily. The rapid economic development will increase the demand for energy. In the future of Henan Province, with the development of the economy, there will be a substantial increase in electricity demand. It is expected that the electricity consumption in 2050 will reach about two times the current electricity consumption. In 2019, the overall power consumption in Henan Province was 336.4 billion kWh, and the power generation in the province was 281.57 billion kWh (coal-fired thermal power accounted for 86.72%) [
26,
27]. The external dependence of electric energy was 16%. The difference between local power generation and electricity consumption in various cities of Henan Province in 2019 is shown in
Figure 1, and the shortfall is 54.8 billion kWh. The remaining required electricity is supplied from outside the province. The UHV line from Xinjiang to Hami is the main channel, and the annual supply of electricity is about 40 billion kWh/year. The composition of power and electricity in cities of Henan Province is shown in
Figure 2. Thermal power accounts for a large proportion. China has determined that the number of thermal power units will not increase. In the future, the shortfall of electricity will be provided by wind and PV units. And the development potential of wind power and PV in Henan Province is high, laying a solid foundation for the realization of an energy revolution in Henan Province.
The most important feature of the current power system is that it cannot achieve a large amount of ES, and it needs to achieve almost real-time power balance. Therefore, the power planning scheme of Henan Province should not only consider the power balance problem from the energy point of view, but it should also consider the power balance problem from the power point of view. Electricity from renewable generators and provincial tie-lines will become very important. However, the output of renewable generators is uncertain, which leads to the verification of power planning schemes. It is necessary to consider the balance of power and electricity at different time scales.
3. ES Capacity Planning for Power and Energy Balance
3.1. Quantitative Evaluation Method of Power and Energy Balance Demand
The power and energy balance is the basic condition for the safe operation of the power grid. The adjustability of flexible resources in the system needs to be able to meet the adjustment needs and maintain a certain level of reserve. For the power and energy balance problem of a provincial power grid, many kinds of flexible resources can be called upon. However, the adjustment characteristics of flexible resources are different. They are suitable for peak shaving problems at different time scales.
Table 1 classifies several common flexible resources.
- (1)
Annual power balance pressure
The power planning department generally carries out power planning based on an annual assessment cycle and uses data from previous years to predict electricity consumption. Considering the uncertainty of the load and renewable units, the power supply is generally redundantly configured to ensure annual power balance. When the internal resources are insufficient to support the annual power balance, the annual power balance can be achieved by developing renewable units and changing the interprovincial power exchange plan.
- (2)
Quarterly and monthly power balance pressure
When meeting the requirements of the annual power balance, it is also necessary to carry out quarterly and monthly power balance analyses. The output of renewable units in the power configuration scheme has obvious seasonal characteristics, and with the large-scale development of wind turbines and PV units, these seasonal characteristics will become increasingly significant. However, due to the large time span between different seasons and months, when a power gap occurs in a quarter or month, the only flexible resources available are thermal power units, hydropower with reservoirs and interprovincial power exchange plans. By changing the output time period of thermal power units and hydropower with reservoirs, the problem of insufficient power can be effectively solved. However, China has determined that the number of thermal power units will not increase, and hydropower development has also tended to be saturated. China’s economy is still in the stage of rapid development, and electricity consumption is still growing. The existing thermal power and hydropower units are insufficient to support peaking demand. With the current vigorous development of the electricity market, changing the interprovincial power interaction plan according to the demand for electricity and improving the support capacity of the surrounding areas to the areas lacking power supply will be essential.
- (3)
Weekly power balance pressure
The power and energy balance analysis is carried out weekly. When a power gap occurs during the evaluation period, the power shortage gap can be reduced by using thermal power units, hydropower with reservoirs, pre-arranged alternate power supplies, limited pumped storages, and changes in interprovincial power exchange plans. Because the span between different time periods is not as large as the quarterly and monthly power balance, some pumped storage units can be used to achieve power transfer between different time periods and improve resource utilization while reducing power shortages. A weekly power balance is easier to achieve when using thermal power units, hydropower with reservoirs and interprovincial power exchange plans to reduce power shortages, but similar problems still exist.
- (4)
Daily power balance pressure
When the power balance of the above time scale is satisfied, it is necessary to carry out daily power balance assessments. When a power gap occurs during the evaluation period, electrochemical ES can be used for daytime power transfer. Such dispatching measures are relatively very comprehensive. Various types of electrochemical ES have been applied in the power system. However, due to the high cost of ES equipment, it is not possible to apply this strategy on a large scale. Therefore, it is necessary to optimize the configuration of ES equipment according to the economy of power supply to improve the utilization rate of the ES equipment.
- (5)
Hourly peak pressure
The day-ahead unit commitment is an important part of provincial power grid dispatching and an effective tool to analyze the intraday peak load regulation pressure. In the analysis of unit combination, the time interval is generally hours or 15 min, and the load level in each time interval is considered to remain unchanged. To satisfy the power balance, the resources on each side of the source–grid–load–storage should also have a certain amount of reserve, and the reserve level can characterize the peak shaving pressure of the intraday hour level. When a power gap occurs during the evaluation period, load-side resources such as demand-side response can be widely used to reduce the shortage of power supply. Compared with other measures, demand-side response resources still have development potential. The further promotion and application of smart homes, electric vehicles and other equipment further increases these kinds of flexible resources.
There are differences in the regulation characteristics of callable flexible resources, resulting in differences in the challenges that are faced in managing the power and energy balance at different time scales. In order to quantitatively evaluate the peak regulation pressure at different time scales, the following indicators are defined: the proportion of power supply shortage, recorded as
RT, can be calculated as follows:
Among them, T represents the evaluation period, represents the load per unit time, and M represents the type of all available flexible units in the evaluation period; represents the maximum output of the mth type of unit at tth time. When RT > 0, it means that there is a lack of power supply in the evaluation period, and it is necessary to provide power support in other time periods in the region or increase the transmission power of the interprovincial tie-line in the external power grid. When RT < 0, it means that there is no lack of power supply in the evaluation period, and it is necessary to carry out optimal scheduling in the evaluation period to improve the power supply income.
Wind power and PV power generation will become the main power supply in Henan Province. In order to fully absorb these wind and PV energy sources, it is necessary to make full use of existing flexible resources and vigorously develop other flexible resources. Combined with the research results, the potential of various flexible resources in Henan Province is judged as follows:
3.2. Flexible Adjustment Scheme of External Power Supply for Medium- and Long-Term Power and Energy Balance Demand
According to the theory of interconnected power systems, the outgoing power curve should be maintained at one or several levels [
3]. Therefore, the following constraints apply:
Among them, Pline represents the capacity of the tie-line, and k1 and k2 represent the proportional coefficient and are fixed constants.
In the electricity market environment, with the goal of minimizing the variance in the lack of power supply in each quarter of the receiving end system, a scheme of adjusting the power purchase curve of foreign power according to different seasons is determined. The lack of power supply for each quarter can be expressed as follows:
The minimum difference between the lack of power supply in each quarter is the objective function to flexibly adjust the external power, which can be expressed as follows:
The shortage of power supply in each quarter before and after adjustment is shown in the following
Figure 3. With the improvement of the electricity market, the transmission power curve can be adjusted according to different time scales such as month and week, so as to meet the peak shaving problem of the power system at different time scales, as shown in
Figure 4.
3.3. ES Capacity Planning Model and Solution for Short-Term Power and Energy Balance Demand
The construction of a certain capacity of ES equipment stabilizes the uncertainty of the renewable energy output, calculates the power supply cost of different power supply schemes, and provides a scientific basis for determining a reasonable ES configuration scheme.
3.3.1. Calculation of Power Supply Cost
The power supply cost of a wind–solar–thermal power generation system mainly includes the equipment investment cost of wind turbines and PV units, the coal consumption cost and environmental cost of coal-fired units, the maintenance cost of equipment and the investment cost of ES equipment.
- (1)
Wind turbine and PV equipment investment costs and maintenance costs are as follows:
Among them, c represents the coefficient of equal annual value, r represents the discount rate, and x represents the operating life of the equipment.
The investment cost of wind turbines and PV equipment can be calculated as follows:
Among them, cwind1 and cwind2, respectively, represent the equal annual value coefficient and operation and maintenance ratio of the wind turbine, is the power generation capacity of the wind power generation group, and is the unit installation cost of the wind turbine; and , respectively, represent the equal annual value coefficient and operation and maintenance ratio of PV units, is the power generation capacity of PV units, and is the unit investment cost of PV units.
- (2)
Coal consumption cost and environmental cost of coal-fired units
The power generation cost of thermal power units is composed of the equipment maintenance cost, coal consumption cost, start–stop cost and environmental cost.
- (1)
Equipment maintenance cost can be calculated as follows:
Among them,
represents the operation and maintenance ratio of equipment,
and
represent the unit investment cost of supercritical units and ultra-supercritical units, respectively, and
and
represent the number of supercritical units and ultra-supercritical units, respectively.
Among them,
N is the total number of thermal power units, and
,
,
are the power generation cost parameters of thermal power units.
is a 0–1 variable, indicating the start–stop state of the unit, and
is the cost of the unit’s start–stop once. The power generation cost parameters of thermal power units are shown in [
12], which will not be expanded here.
- (2)
Environmental cost of thermal power units can be calculated as follows:
Among them, d represents the ratio of the cost required to control the emission of CO2 and other wastes per ton of coal to the coal price.
- (3)
The investment cost of ES equipment is determined as follows:
The operating life of ES equipment is closely related to its charging and discharging power. The operating life is calculated by the following formula:
Among them, n represents the maximum full discharge times during the operation of ES, PESS represents the capacity of ES equipment, and Pcha,t represents the discharge power of ES equipment at time t.
The investment cost of wind turbines and PV equipment can be calculated as follows:
3.3.2. Day-Ahead Economic Dispatch
In order to accurately calculate the operating cost of ES equipment under the corresponding capacity, it is necessary to determine the timing output of each type of unit according to the scheduling sequence. According to the order of scheduling priority from high to low, the balance of power and energy is mainly realized by the following four types of resources: (1) wind power and PV power generation in the province, (2) external power (considering the power market), (3) demand-side response in the province, and (4) thermal power + ES in the province.
- (1)
Wind power and PV power generation in the province
The climate change in the same area in recent years has been limited. Therefore, using the wind turbine and PV time series output curve in recent years, combined with the wind turbine and PV installed capacity set in the region to achieve the “carbon neutrality” goal, the time series output of renewable energy can be determined. For a power system with a certain installed capacity of thermal power, when the installed capacity of wind and solar is small, it can achieve 100% consumption of wind and solar power; when the installed capacity of wind–solar units increases to a certain critical value, the peak output of wind–solar units cannot be consumed. It is allowed to reasonably abandon the peak output of some wind turbines and PV units to reduce the peak regulation pressure of the system, that is
where
and
represent the maximum output of the wind turbine and PV equipment at time t, respectively.
- (2)
Demand-side response in the province
The user load is divided into the movable load and the immovable load. The immovable load includes lighting equipment, air conditioning, refrigerator, television and induction cooker, etc., and does not participate in optimal scheduling. Movable loads include electric vehicles, washing machines, water heaters and vacuum cleaners. Movable loads can be optimally scheduled according to different time scales. By shifting the movable load, the net load curve is smoother. On the one hand, this can reduce the capacity of the ES system configuration and the number of charging and discharging times of the ES system. On the other hand, it can improve the power supply reliability of the power system and reduce the power loss rate.
Assuming that a certain proportion of the load in the power system is a shiftable load, we can set a constant
Pl,day and satisfy the following formula:
The daily load curve can be adjusted to
- (3)
Thermal power and ES equipment in the province
Day-ahead economic dispatch is carried out to determine the timing output of thermal power units and ES equipment. The daily coal consumption cost, environmental cost of thermal power units and charging and discharging cost of ES equipment are taken as the objective functions, and the following constraints are taken into account.
For the power system with wind turbines, PV and thermal power units, the actual active power output of each type of unit is recorded as
Pw,t,
PPV,t and
Pc,t, respectively, and the active power of the load is recorded as
Pl,t. The thermal power unit and ES equipment provide available adjustment capacity for wind turbines and PV to achieve power balance, which can be expressed by the following formula.
Among them, t is the time variable, which usually represents the
tth time interval, and
Pother,t represents the output of biomass and other units.
Ptran,t represents the external electric power. The thermal power unit has a minimum/maximum output constraint, a maximum ramp rate constraint, a minimum start/stop time constraint and so on:
where
PGi,min and
PGi,max represent the minimum output and maximum output of the
ith unit at
tth time, respectively;
Pram,Gi represents the maximum climbing power of the
jth unit of the
ith type;
Ti,minon and
Ti,minoff represent the minimum operation and minimum downtime of the
jth unit of the i
th type, respectively;
Ti,on,t and
Ti,minoff,t represent the continuous operation and shutdown time of
ith unit at
tth time, respectively.
In order to cope with the prediction error, the thermal power unit is required to leave a certain capacity of upper and lower reserve space, as shown in the following formula:
Among them, α and β represent the reserve coefficient of renewable energy power and load power, respectively.
The relationship between the amount of energy that is stored in the ES and the charging and discharging power is constrained:
There are upper and lower limit constraints on the ES capacity:
In order to prevent the loss of load in the next scheduling cycle due to the uncertainty of the renewable energy output, it is necessary to ensure that the amount of electricity that is stored by the ES device at the end of the scheduling cycle is greater than the sum of the net loads in the next scheduling cycle.
There is an upper limit constraint on the charging and discharging power of ES equipment:
Among them, and are constants, which are related to the ES equipment used.
The economic dispatch optimization model established in this paper is a linear optimization model, which can be solved by the linear programming method.
4. Example Analysis
The future electricity demand of Henan Province can be predicted based on the national energy policy, as shown in
Table 2. The established policy scenarios and energy revolution scenarios are set. Under the two scenarios, the self-sufficiency ratio of electricity in Henan Province is 75% and 68.5%, respectively. The ratio of electricity generated from renewable energy to the total local electricity generation is 72.6% and 93.4%, respectively.
4.1. Quantitative Analysis of Electricity Balance at Different Time Scales in Henan Province
The power composition scheme outlined in
Table 1 laid the foundation for the realization of the dual carbon goal of Henan Province, but the realization of the above scheme faces challenges in terms of power balance (real-time power), among which the power supply planning scheme in the energy revolution scenario faces greater challenges. In order to focus on the problem, the following is a brief analysis of the power supply scheme in 2050 in the energy revolution scenario.
Figure 5 shows the daily statistics of electricity consumption and wind power + PV power generation in Henan Province in 2050. According to the dispatch priority, the wind power and PV power generation in the province will be consumed first, the statistics in
Figure 6 will be obtained, and the “load-wind and solar output” will be supplied by the power from outside the province, the demand response + ES in the province + ES, and the thermal power supply in the province. We found that (1) the daily electricity data in
Figure 6 have a negative value, which can indicate that on the day of wind and solar power, only wind power + PV power generation has exceeded the load demand, and at this time, with the cooperation of a demand-side response and ES, not only can the power balance be realized, but also, electricity can be sold to other regions; (2) most of the daily electricity data in
Figure 6 are positive, with significant differences and large fluctuations, which is the huge challenge faced by the daily electricity balance in Henan Province.
Figure 6 is the daily time scale statistics of the electricity surplus and deficit in Henan Province, at this time; the electricity surplus and deficit in Henan Province on the quarterly, monthly and weekly time scales can also be considered, and as shown in
Figure 7,
Figure 8 and
Figure 9, it can be seen that the weekly, monthly and quarterly electricity surplus and deficit also exhibit large differences and large fluctuations.
According to the scheduling priority, calls from outside the province should be continued at this time. It may be assumed that the electricity generated from outside the province is used in the electricity market environment, that is, that Henan Province buys more electricity on days with more a severe power shortage and less electricity on days with less power shortage, as indicated in
Figure 6, so as to minimize the power balance pressure of the province. Therefore, how to reasonably arrange the 301.8 billion kWh of external electricity in
Table 2 is very important for the power balance of Henan Province. At the same time, it should also be taken into account that in order to achieve the national dual carbon goal, the National Energy Administration estimates that “In 2050, China’s total installed power supply capacity will be 7.5 billion kW, of which 6.87 billion kW will be installed clean energy, accounting for 92%; The installed capacity of coal-fired power has been reduced to 300 million kW, the capacity of hydrogen-fired units has been reduced to 100 million kW, and the ES capacity has been reduced to 600 million kW”. This means that because the wind and PV power supply will play the role of the main power supply in the country, the peak regulation pressure throughout the country will be very large, even considering the power market environment. When the wind and light output in Henan Province is small, the sending system is likely to be short on wind and light, that is, Henan Province may not be able to buy electricity in the power market every day to fully meet the needs of the province.
Taking into account factors such as the operational specifications of the interconnected power system, it may be considered that Henan Province will be able to purchase electricity on a weekly basis in 2050: the electricity market will be able to meet the electricity demand submitted by Henan Province every week, but the external power will remain at a relatively stable level during the week.
Figure 10 shows the timing power of the external power in the first week of the simulation analysis (reflecting the basic requirement that the exchange power of interprovincial contact lines in the interprovincial power system specification must be maintained at a relatively stable level),
Figure 11 shows the data on external electricity purchased per week in Henan Province for 52 weeks of a year (reflecting the mutual support between provincial and regional power grids through the power market), and
Figure 12 shows the daily electricity statistics after considering external power generation. As shown in
Figure 12, the external power load—wind and solar output—has significantly decreased the daily electricity data compared with
Figure 10 (load—wind and solar output).
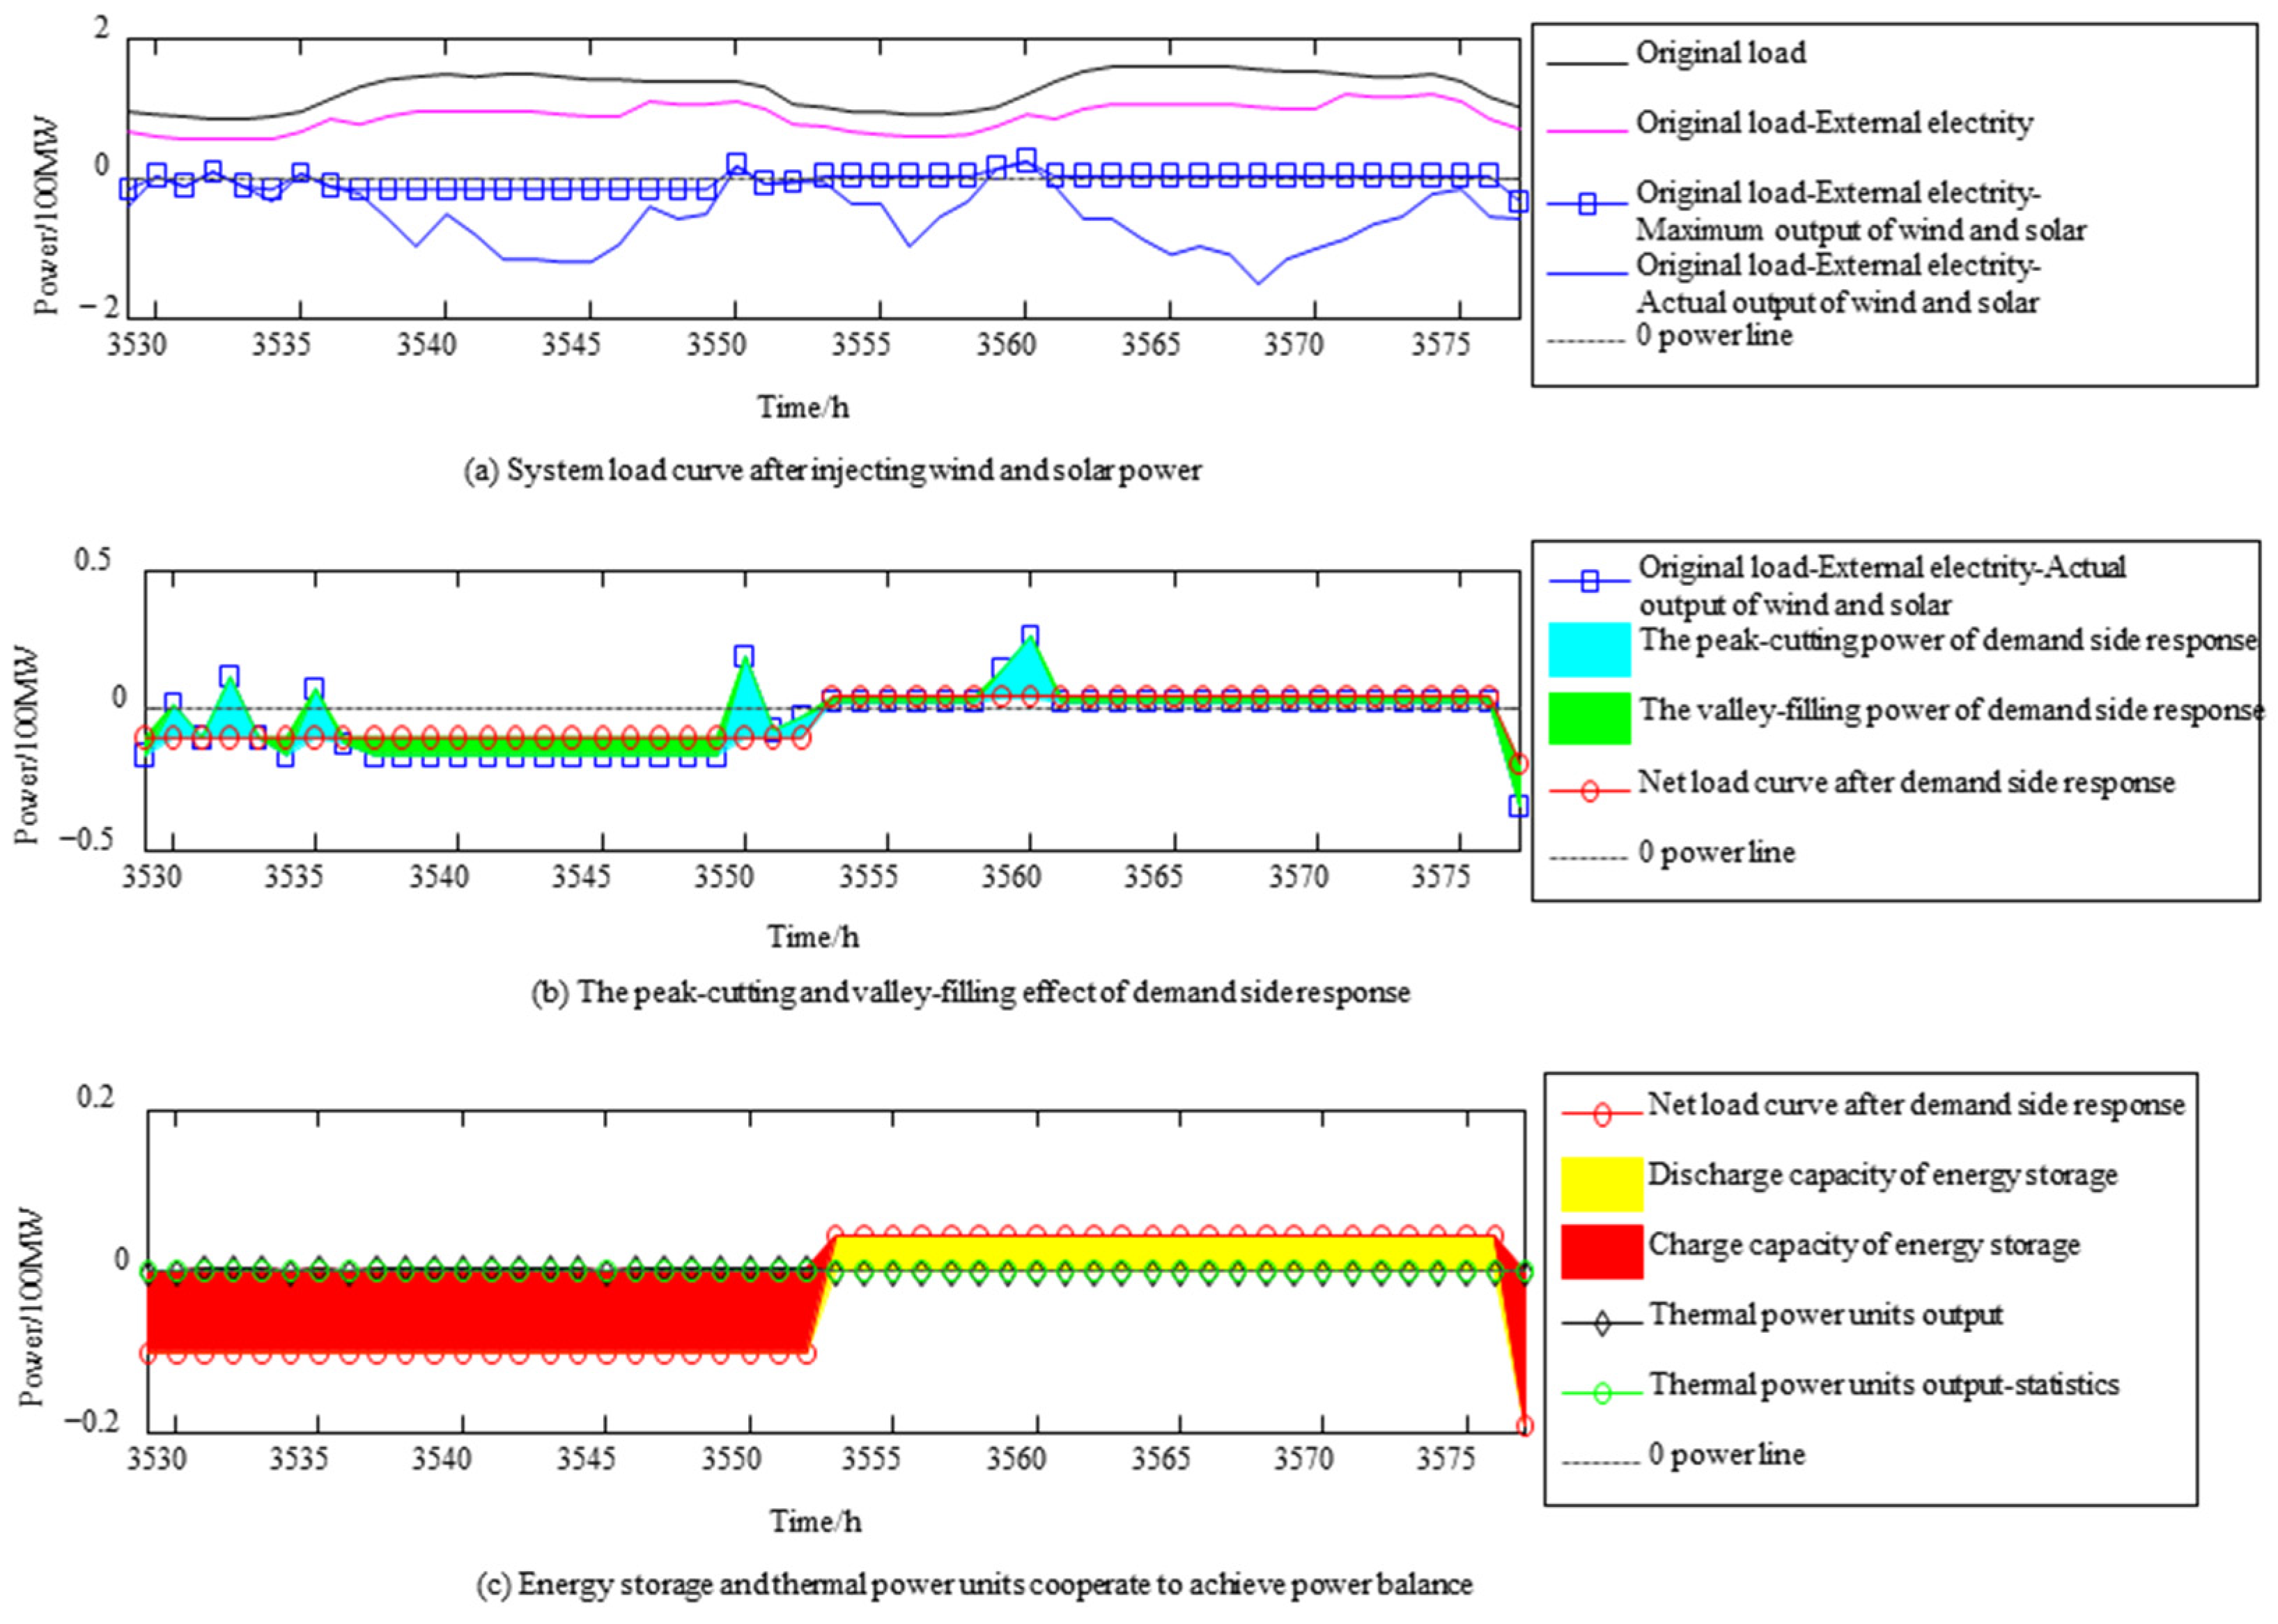
More recently, the intraday load (the original load minus wind and PV power output) in
Figure 12 is shaved and valley-filled through demand-side response and ES, and the load curves on day 1, day 92, and day 182 are shown in
Figure 13, which are analyzed as follows:
- (1)
Day 1 represents a small number of power shortage days in Henan Province, and the power shortage is about 12 million kW. Henan Province still retains 20.25 million kW thermal power units in 2050, so the shortage power can be supplied by the thermal power units in
Table 2 so that the power balance can be achieved on the first day.
- (2)
The 92nd day represents a large number of power shortage days in Henan Province, and the power shortage is about 45 million kW, which is higher than the installed capacity of thermal power units of 20.25 million kW, so there will be a risk of power shortage on the 92nd day, which may lead to power rationing.
- (3)
The 182nd day represents the Henan Provincial Electric Energy Prosperity Day, when the ES in Henan Province is fully charged, and electricity needs to be sold through the interprovincial contact line.
In the simulation analysis, it was found that there was a risk of power shortage for a total of 90 days.
According to the above analysis, it can be seen that although
Table 2 shows that the annual power balance is achieved, there is a risk of power shortages in Henan Province on some days, and this is not an isolated phenomenon. In summary, according to the balance scheme of annual electricity, due to the different amounts of electricity consumption in each quarter, month, week and day, the annual electricity balance cannot guarantee the power balance of the quarters, months, weeks and days, and it is necessary to use the adjustment of the external power curve to solve the power balance problem on a long-term scale and the configuration of the ES to solve the power balance problem within a day and over several days.
4.2. Quantitative Analysis of the Impact of External Power on the Power Balance of the Power System in Henan Province
When thermal power units are not considered, the proportion of power supply shortage at different time scales in Henan Province is shown in
Figure 14. Due to the strong uncertainty of the renewable energy output, the lack of power supply at different time scales and in different time periods shows strong uncertainty, and the power supply is more likely to be sufficient in the period when the output of PV and wind turbines is larger.
Assuming that in the electricity market environment, the power supply curve of the interprovincial liaison line can be adjusted on an annual, seasonal and monthly basis, the monthly transmission of electricity by the interprovincial liaison line is shown in
Figure 15a–c. When the power demand of the connecting line is adjusted monthly, the demand for conventional units can be greatly reduced, the peak regulation demand of the power system can be reduced, and the power supply reliability of the power system will be greatly improved, as shown in
Figure 16.
In addition, as can be seen from
Figure 16, flexible adjustment of the interprovincial contact line can reduce the demand for conventional units, and when the transmission power of the interprovincial contact line is adjusted according to different time scales, the maximum regulation demand ratio will be reduced from 37.73% to 10.50%, and the maximum power demand will be reduced from 8.439 billion kWh to 2.299 billion kWh, so it can be concluded that the demand capacity for thermal power units can be reduced from 5023 MW to 1369 MW; it can be seen that the method in this paper can provide methodological support for the withdrawal of fossil energy units.
The flexible adjustment method of tie-line power in this paper can effectively alleviate the demand for long-term peak shaving. In order to demonstrate the effectiveness of the method proposed in the article, the tie-line power is adjusted according to different time scales and [
3]. The maximum monthly net consumed electricity during a year is shown in
Table 3. It can be seen that the method proposed in this paper can greatly reduce the demand for peak shaving compared to the method proposed in [
3]. Moreover, the effect of different time scale adjustment methods on the long-term peak shaving demand is inconsistent.
4.3. Quantitative Analysis of the Impact of ES on the Power Balance of the Power System in Henan Province
- (1)
Analysis of the power balance of the power system in Henan Province under the given policy scenario
The power system of Henan Province needs to give priority to arranging calls from outside the province, followed by the need to absorb wind and solar power generation, and then smooth the system power curve under the action of demand-side response and ES equipment, and finally use the controllable power of thermal power units to achieve supply and demand balance, while the ES capacity should be set to continuously discharge to the maximum load of the system for 4 h.
According to
Figure 14, because the installed capacity of wind and solar units in the system is greater than the maximum load of the system, the load of the system may become negative, and the flexible resources of rechargeable and dischargeable types such as demand-side response and ES must be invoked; in order to meet the power balance of the system, it is likely that 100% of the wind and solar power generation will not be consumed, and the wind power or PV power generation in certain periods must be discarded.
The maximum power of energy storage is set as the maximum load of the system, and the energy storage capacity is changed by changing the continuous maximum discharging time. The maximum continuous discharge time is traversed to search for the best energy storage capacity. The investment capacity of ES equipment is closely related to the operation effect of the system. The maximum annual load of the system is 155 million kW, and the maximum load of the system can be continuously discharged for 1/2/3/4/5/6/7/8 h under eight conditions. The unit power supply cost refers to the average power supply cost of wind and PV power generation and thermal power. The price of PV equipment is 2.5 CNY/W, the price of wind turbines is 4.5 CNY/W, the price of ES is 1.2 CNY/Wh, and the standard price of coal is 600 CNY/ton. The number of annual utilization hours of PV equipment is 1300 h, and the number of annual utilization hours of wind turbine is 2000 h. Some simulation results are given in
Table 4.
With the increase in ES capacity, the absorption effect of the system on wind and solar energy has gradually improved, the proportion of wind and solar curtailment has decreased from 12.6% to 5.0%, and the annual utilization hours of thermal power units have decreased from 2790 h to 2354 h, which means that only 95% of wind and solar power can be absorbed by installing 1.24 billion kWh of ES (8 h of continuous power supply to the maximum load of the system) under the condition of fully exploiting the demand-side response and the flexibility of thermal power units.
With the increase in ES capacity, the average power supply cost of wind and solar power and thermal power has gradually increased from 0.307 CNY/kWh to 0.485 CNY/kWh, which is mainly due to the high idle rate of ES equipment (the number of full discharge times has decreased from 170 times/year to 51 times/year), which shows that in the future, it is necessary to fully explore the value attributes of ES equipment in various ways and obtain additional benefits by providing a variety of auxiliary services such as reserve capacity, reactive power support, system frequency modulation and black start.
In addition, the scale of the demand-side response in the above analysis is as follows: 5% of the daily power demand is translated to other periods of the day according to the dispatch demand, which is roughly equivalent to the installation of 1~150 million kWh ES equipment, which shows that through the flexible electricity price mechanism or the signing of demand-side response contracts with power users has huge economic benefits, and the cost of ES equipment can be decreased by more than CNY 10 billion per year.
Based on the above analysis results, it is recommended for the established policy scenario to not pursue 100% consumption of wind and solar power sources in the system, and it is appropriate to control the proportion of wind and solar power curtailment at 7~8%, and ES needs to be installed in the system at four times the maximum load of the system.
- (2)
Analysis of the power balance of the power system in Henan Province under the scenario of energy revolution
The power system in Henan Province needs to give priority to arranging calls from outside the province, then needs to absorb wind and solar power generation, then smooth the system power curve under the action of demand-side responses and ES equipment, and finally use the controllable power of thermal power units to achieve a balance between supply and demand.
Figure 17 shows the power balance on a heavy load day in summer.
According to
Figure 17, it is not difficult to find that as the installed capacity of wind and solar units in the system further increases (from 280 million kW in the established policy scenario to 420 million kW in the energy revolution scenario) to the maximum load of the system, even if the flexible resources of rechargeable and dischargeable types such as demand-side responses and ES are used, there will be a high proportion of wind and solar curtailment.
The maximum annual load of the system is 178 million kW, and the maximum load of the system can be continuously discharged for 1/2/3/4/14/21/27/31/40/48/60/80 h under 12 conditions.
Table 5 shows the simulation results of the system under different ES installed capacities. It can be seen that the energy revolution scenario is not exactly the same as the established policy scenario: due to the high capacity of the wind and solar power assembly capacity of 420 million kW, the system has always been unsatisfactory in absorbing wind and solar energy, and even if the ES can continuously discharge the maximum load of the system for 48 h (14.24 billion kWh installed capacity), the proportion of wind and solar energy curtailment is still as high as 13.3% and the alleviation of wind and solar curtailment by ES is very limited, which means that under the energy revolution scenario, there is not only a short-term scale (within one or more days) peak shaving demand, but also a long-term wind and PV energy transfer demand, that is, the excess wind and PV energy in summer is transferred to winter use, which is difficult to achieve only through ES equipment.
Based on the above analysis, for the energy revolution scenario, the following is concluded: (1) In order to avoid a large amount of idle ES equipment, the consumption requirements of wind and PV energy should be appropriately relaxed, and more curtailment of wind and solar energy should be allowed in the system. (2) It is necessary to absorb wind and PV energy from the perspective of multi-energy comprehensive utilization, for example, the development of electric hydrogen, electric gas, electrolytic aluminum, purified silicon and other power loads that are not sensitive to electricity time.
From the perspective of flexible resources to support the realization of the energy revolution, it is recommended that:
(1) Henan Province should carry out flexible transformation of thermal power units, retain the capacity of thermal power units and reduce the amount of thermal power; (2) demand-side response resources are fully developed to effectively reduce the investment in ES equipment and save system investment; (3) it is recognized that ES equipment is suitable for fulfilling short-term (one or several days) peak shaving demands but has a limited effect on long-term (quarterly or annual) peak shaving demands and leads to a large amount of idle equipment; (4) the smooth realization of the energy revolution must also consider the comprehensive utilization of energy.


