Article

An Energy Management Strategy for an Electrified Railway Smart Microgrid System Based on Integrated Empirical Mode Decomposition

School of Electrical Engineering, Beijing Jiaotong University, Beijing 100044, China
*
Author to whom correspondence should be addressed.
Energies 2024, 17(1), 268; https://doi.org/10.3390/en17010268
Submission received: 4 December 2023 / Revised: 29 December 2023 / Accepted: 1 January 2024 / Published: 4 January 2024
(This article belongs to the Section A1: Smart Grids and Microgrids)

Abstract

:
The integration of a renewable energy and hybrid energy storage system (HESS) into electrified railways to build an electric railway smart microgrid system (ERSMS) is beneficial for reducing fossil fuel consumption and minimizing energy waste. However, the fluctuations of renewable energy generation and traction load challenge the effectiveness of the energy management for such a complex system. In this work, an energy management strategy is proposed which firstly decomposes the renewable energy into low-frequency and high-frequency components by an integrated empirical mode decomposition (IEMD). Then, a two-stage energy distribution approach is utilized to appropriately distribute the energy flow in the ERSMS. Finally, the feasibility and effectiveness of the proposed solution are validated through case study.

1. Introduction

Nowadays, it has become a global consensus that we should fully utilize renewable energy sources due to concerns regarding energy security and environmental degradation. As a typical major energy consumer, the electrified railway system comes with a strong demand for energy conservation [1]. Renewable energy sources, photovoltaic (PV), wind power (WP), etc., can be integrated with a conventional traction power supply system (TPSS), which solely obtains electricity from the public grid powering the electrified railway to reduce the energy consumption, forming an electrified railway smart microgrid system (ERSMS) [2,3]. Therefore, the ERSMS is an energy-saving and environmental-friendly option [4,5]. However, both traction load and renewable energy sources are highly stochastic and fluctuating sources. Potentially, this produces some power quality and transient disturbance issues to ERSMS operation. In addition, the regenerative braking energy (RBE) generated by locomotives will be injected to the overhead line, impacting the power flow of the ERSMS as well [6,7]. Incorporating an energy storage system (ESS) into the ERSMS has become a common choice for power conditioning and RBE storage [8,9]. However, there are two main challenges for building a complex ERSMS containing an ESS: the first is to appropriately select energy storage media for matching the energy requirement of the specific usage scenario; the second is to develop a high-performance energy management strategy (EMS) for distributing energy within the ERSMS, mitigating the fluctuations and enhancing the energy utilization efficiency.
There are a number of energy storage media, which are classified into two categories: high energy density and longer response time ones, represented by various batteries; high power density and short response time ones, represented by supercapacitors and flywheels [10]. The results of [11,12] demonstrate that combining a supercapacitor with a battery is effective in reducing power consumption during load start-up. Considering the substantial energy and power requirements of the traction load and the fluctuation of renewable energy generation power, a hybrid ESS (HESS) composed of batteries and supercapacitors is a reasonable solution for the ERSMS.
For EMS, the common method involves initially decomposing the power generated by renewable energy sources. This allows the HESS to store high-frequency components, while providing low-frequency or constant components to meet the load demand. The early used single-step methods, such as the ones based on first-order low-pass filters [13], Kalman filters [14], and H∞ filters [15], gradually become unsuitable for decomposing the fluctuating power due to the suboptimal performance and the computational complexity [16]. Currently, the time-frequency analysis-based methods can be divided into non-adaptive power smoothing methods such as the Discrete Fourier Transform (DFT) [17], Discrete Wavelet Transform (DWT) [18], and adaptive power smoothing methods such as the Empirical Mode Decomposition (EMD) and improved EMD-based method [19,20]. However, the non-adaptive power smoothing methods are generally inappropriate for analyzing nonlinear and non-stationary signals. The DFT assumes smooth datasets, facing challenges with the non-stationary nature of renewable energy sources. Selecting the appropriate mother wavelet is also a challenge when using the DWT [21]. Although the EMD is a better choice, it comes with mode mixing and disparate amplitude issues in the intrinsic mode functions (IMFs) [19,20]. To tackle such issues, the complementary ensemble empirical mode decomposition with adaptive noise (CEEMDAN) was employed in [21,22], providing a resolution to the challenges encountered in EMD. Although this method enhances the classification of IMFs using an improved empirical approach, there is room for further improve. Jia et. al. applied the gray relational analysis (GRA) for denoising analysis of the decomposed IMFs. The superior results demonstrate that the GRA can be used for IMF classification [23]. After energy decomposition, it is important to determine the energy distribution within the entire energy system. Recently, Liu et. al. developed a bi-level model of a railway traction substation energy management system for attaining the optimal power reference and HESS size [24]. Zhao et al. proposed a control strategy clarifying the energy distribution relationship between the HESS and traction power supply system under different operation modes [25]. An EMS for ERSMS including PV and ESS has been proposed in [6,26], which enhances the overall economic efficiency of system operations. However, these approaches are restricted to a single renewable energy source or a single ESS or both, so that further research on EMS for ERSMS incorporating multiple renewable energy sources and HESS is required.
In view of the above, the present investigation aims to address the shortcomings of the EMD, as well as the research gaps in the complex energy distribution strategy for ERSMS. The main contribution and innovation of this work are as follows.
(i)
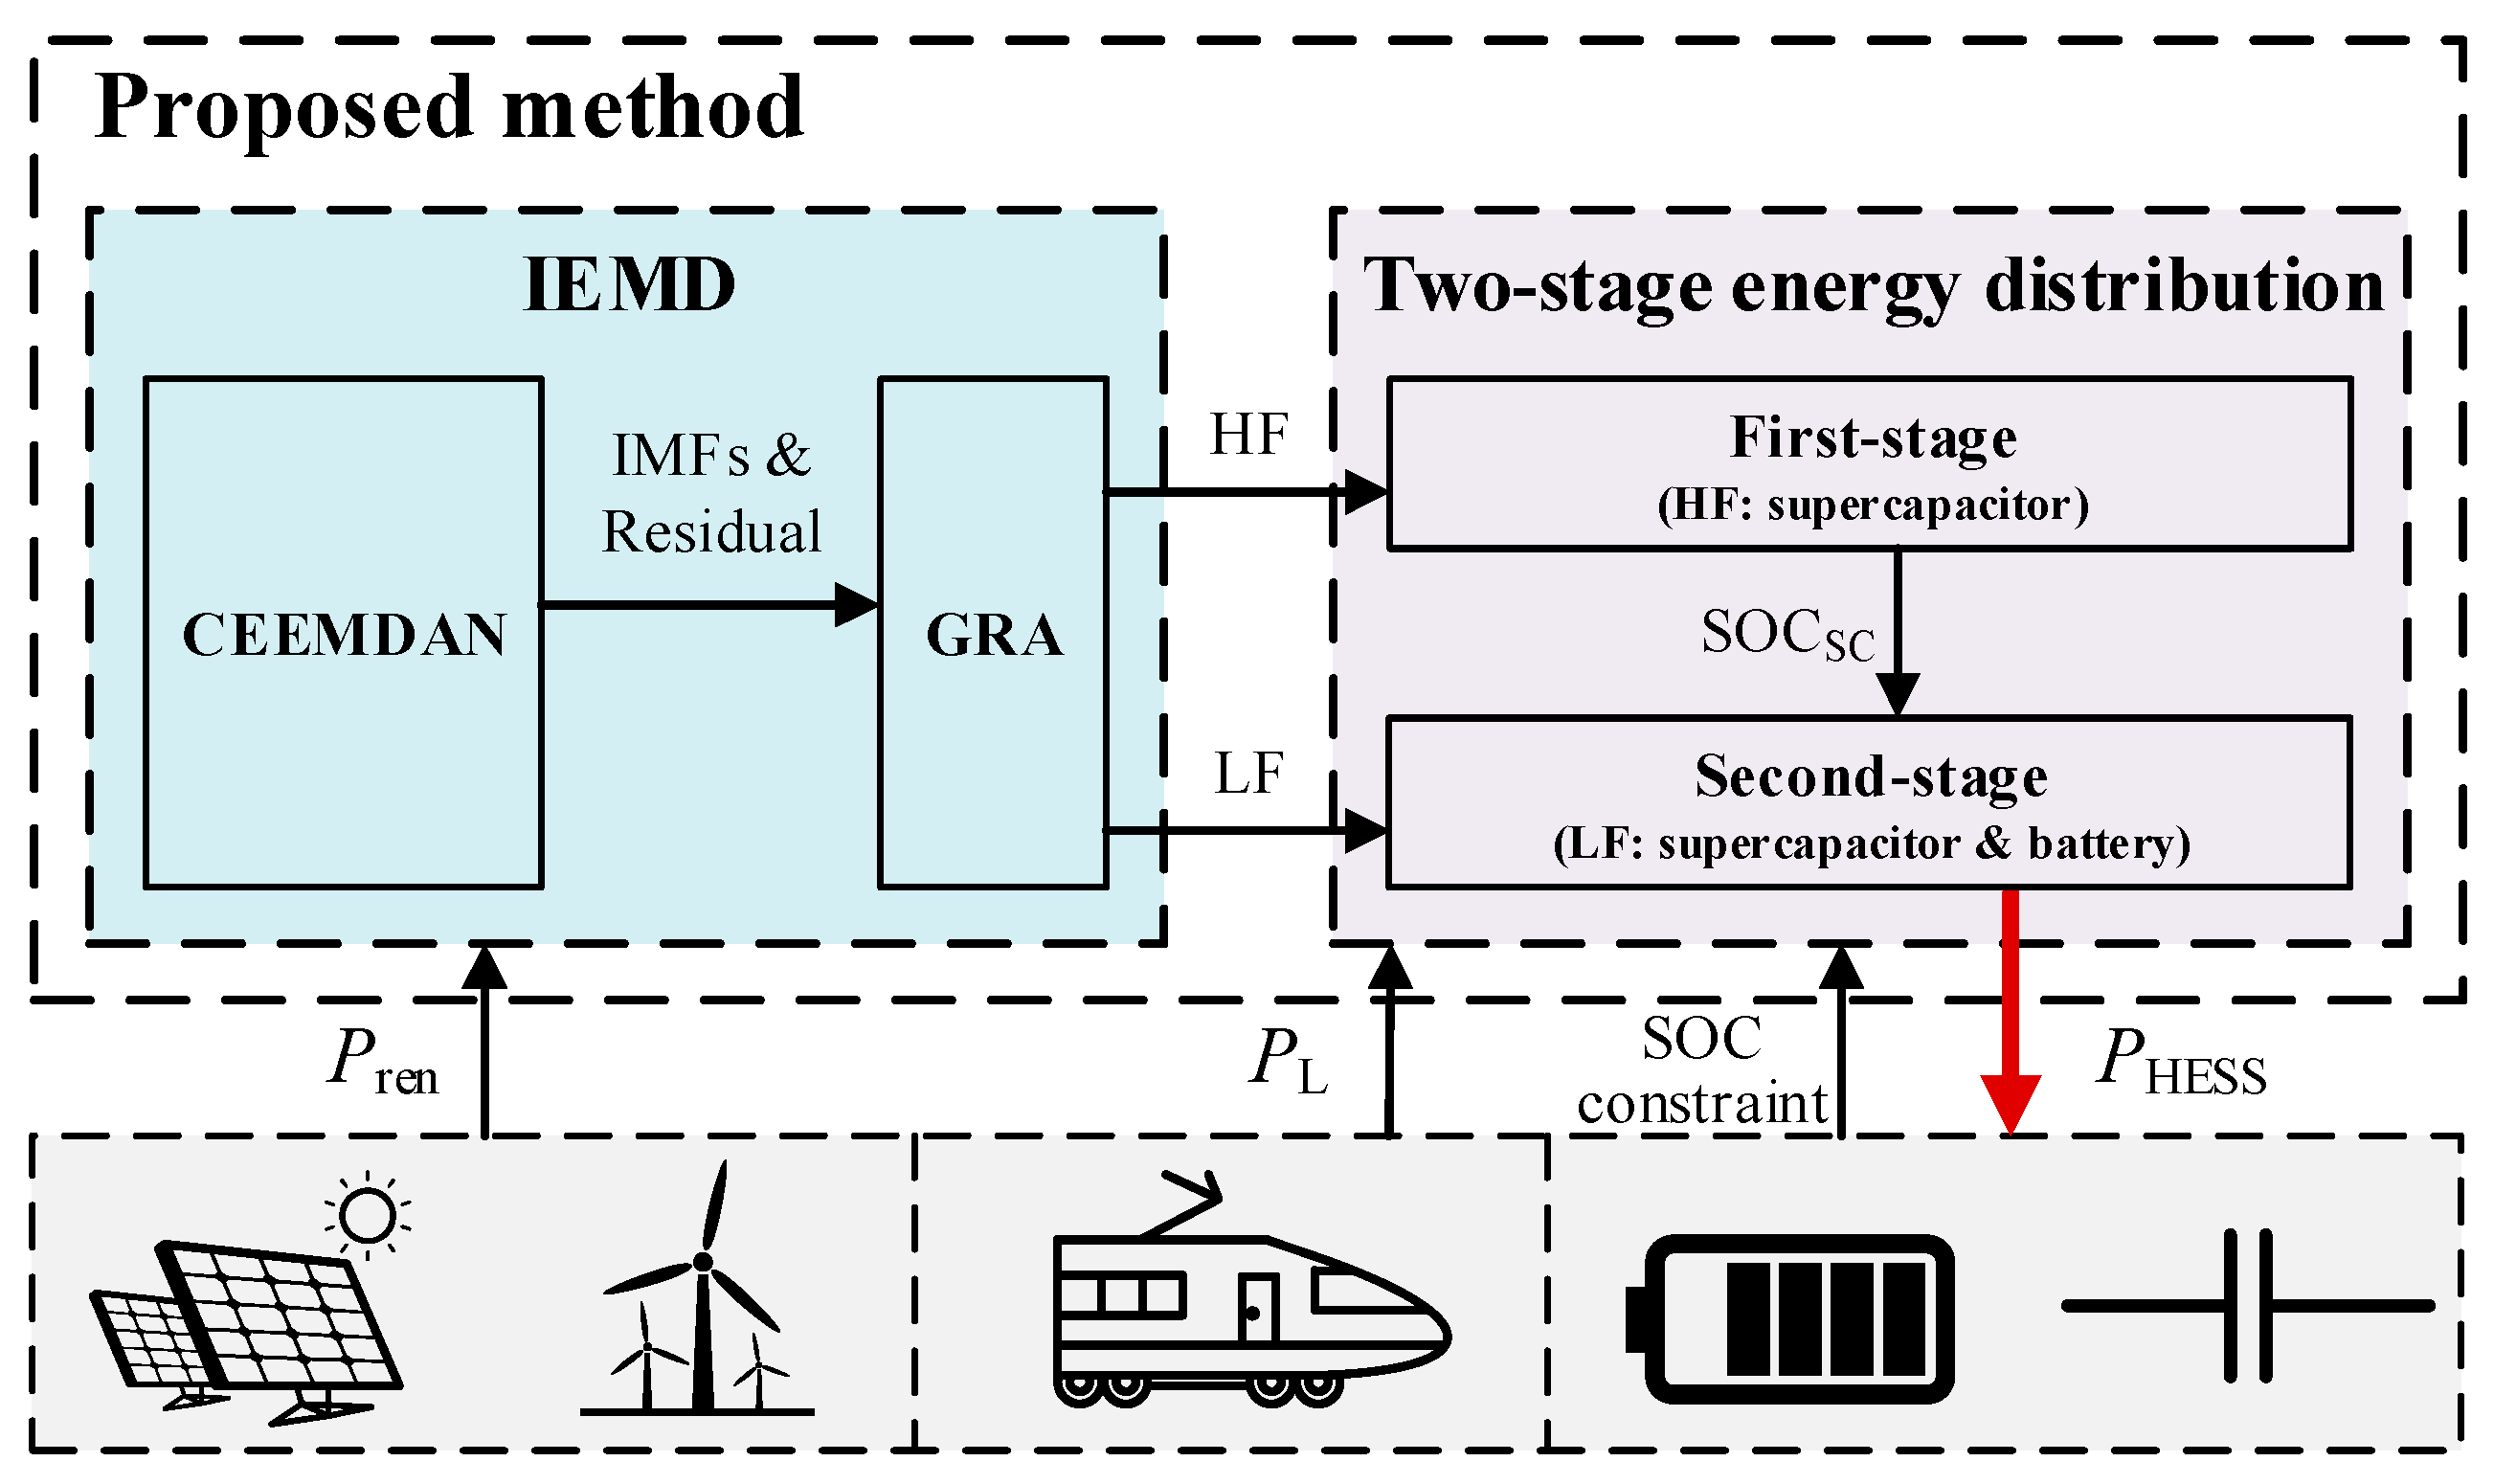
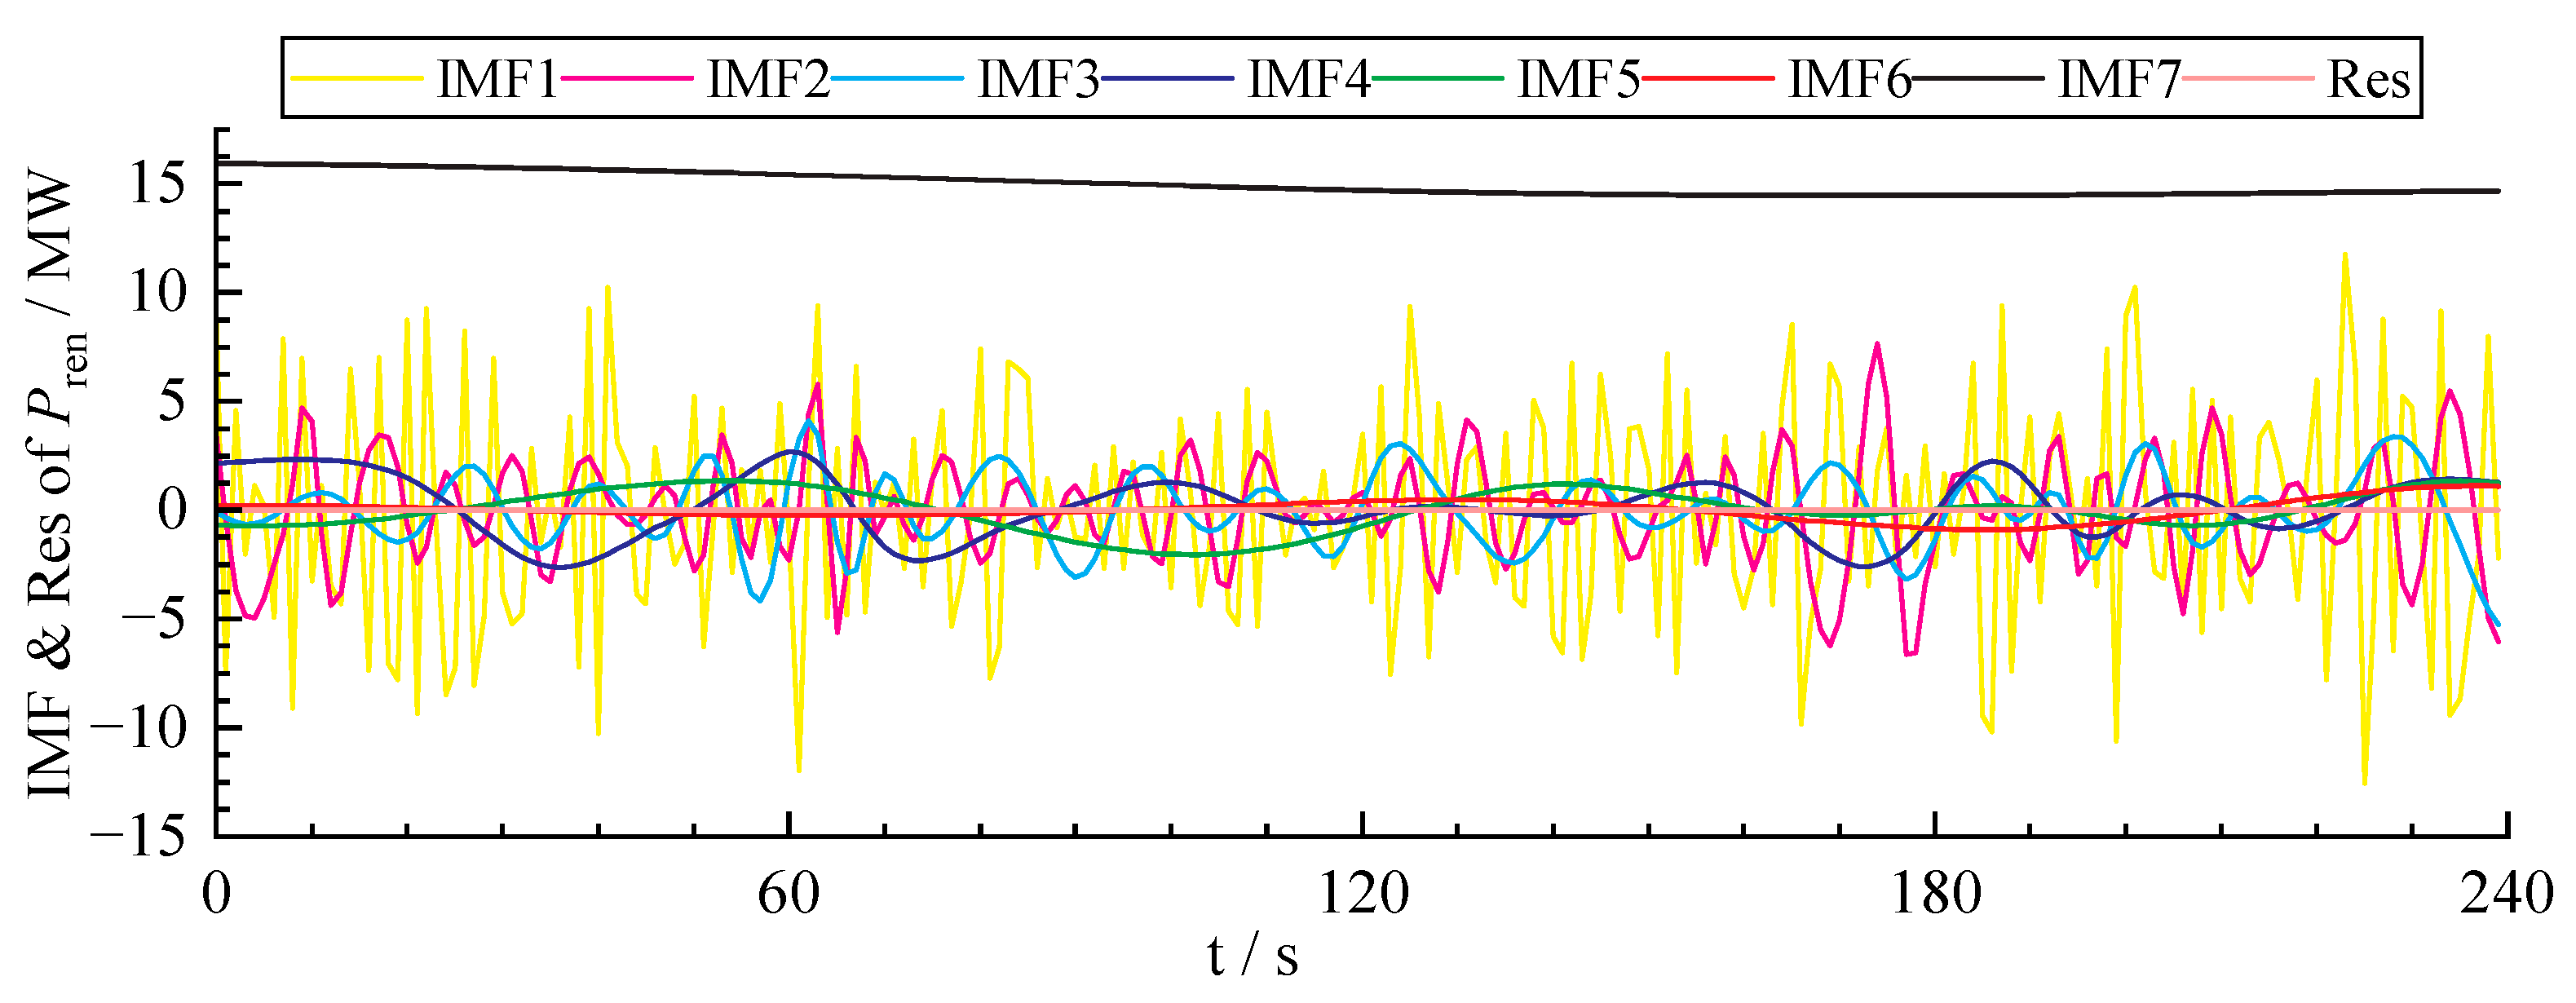
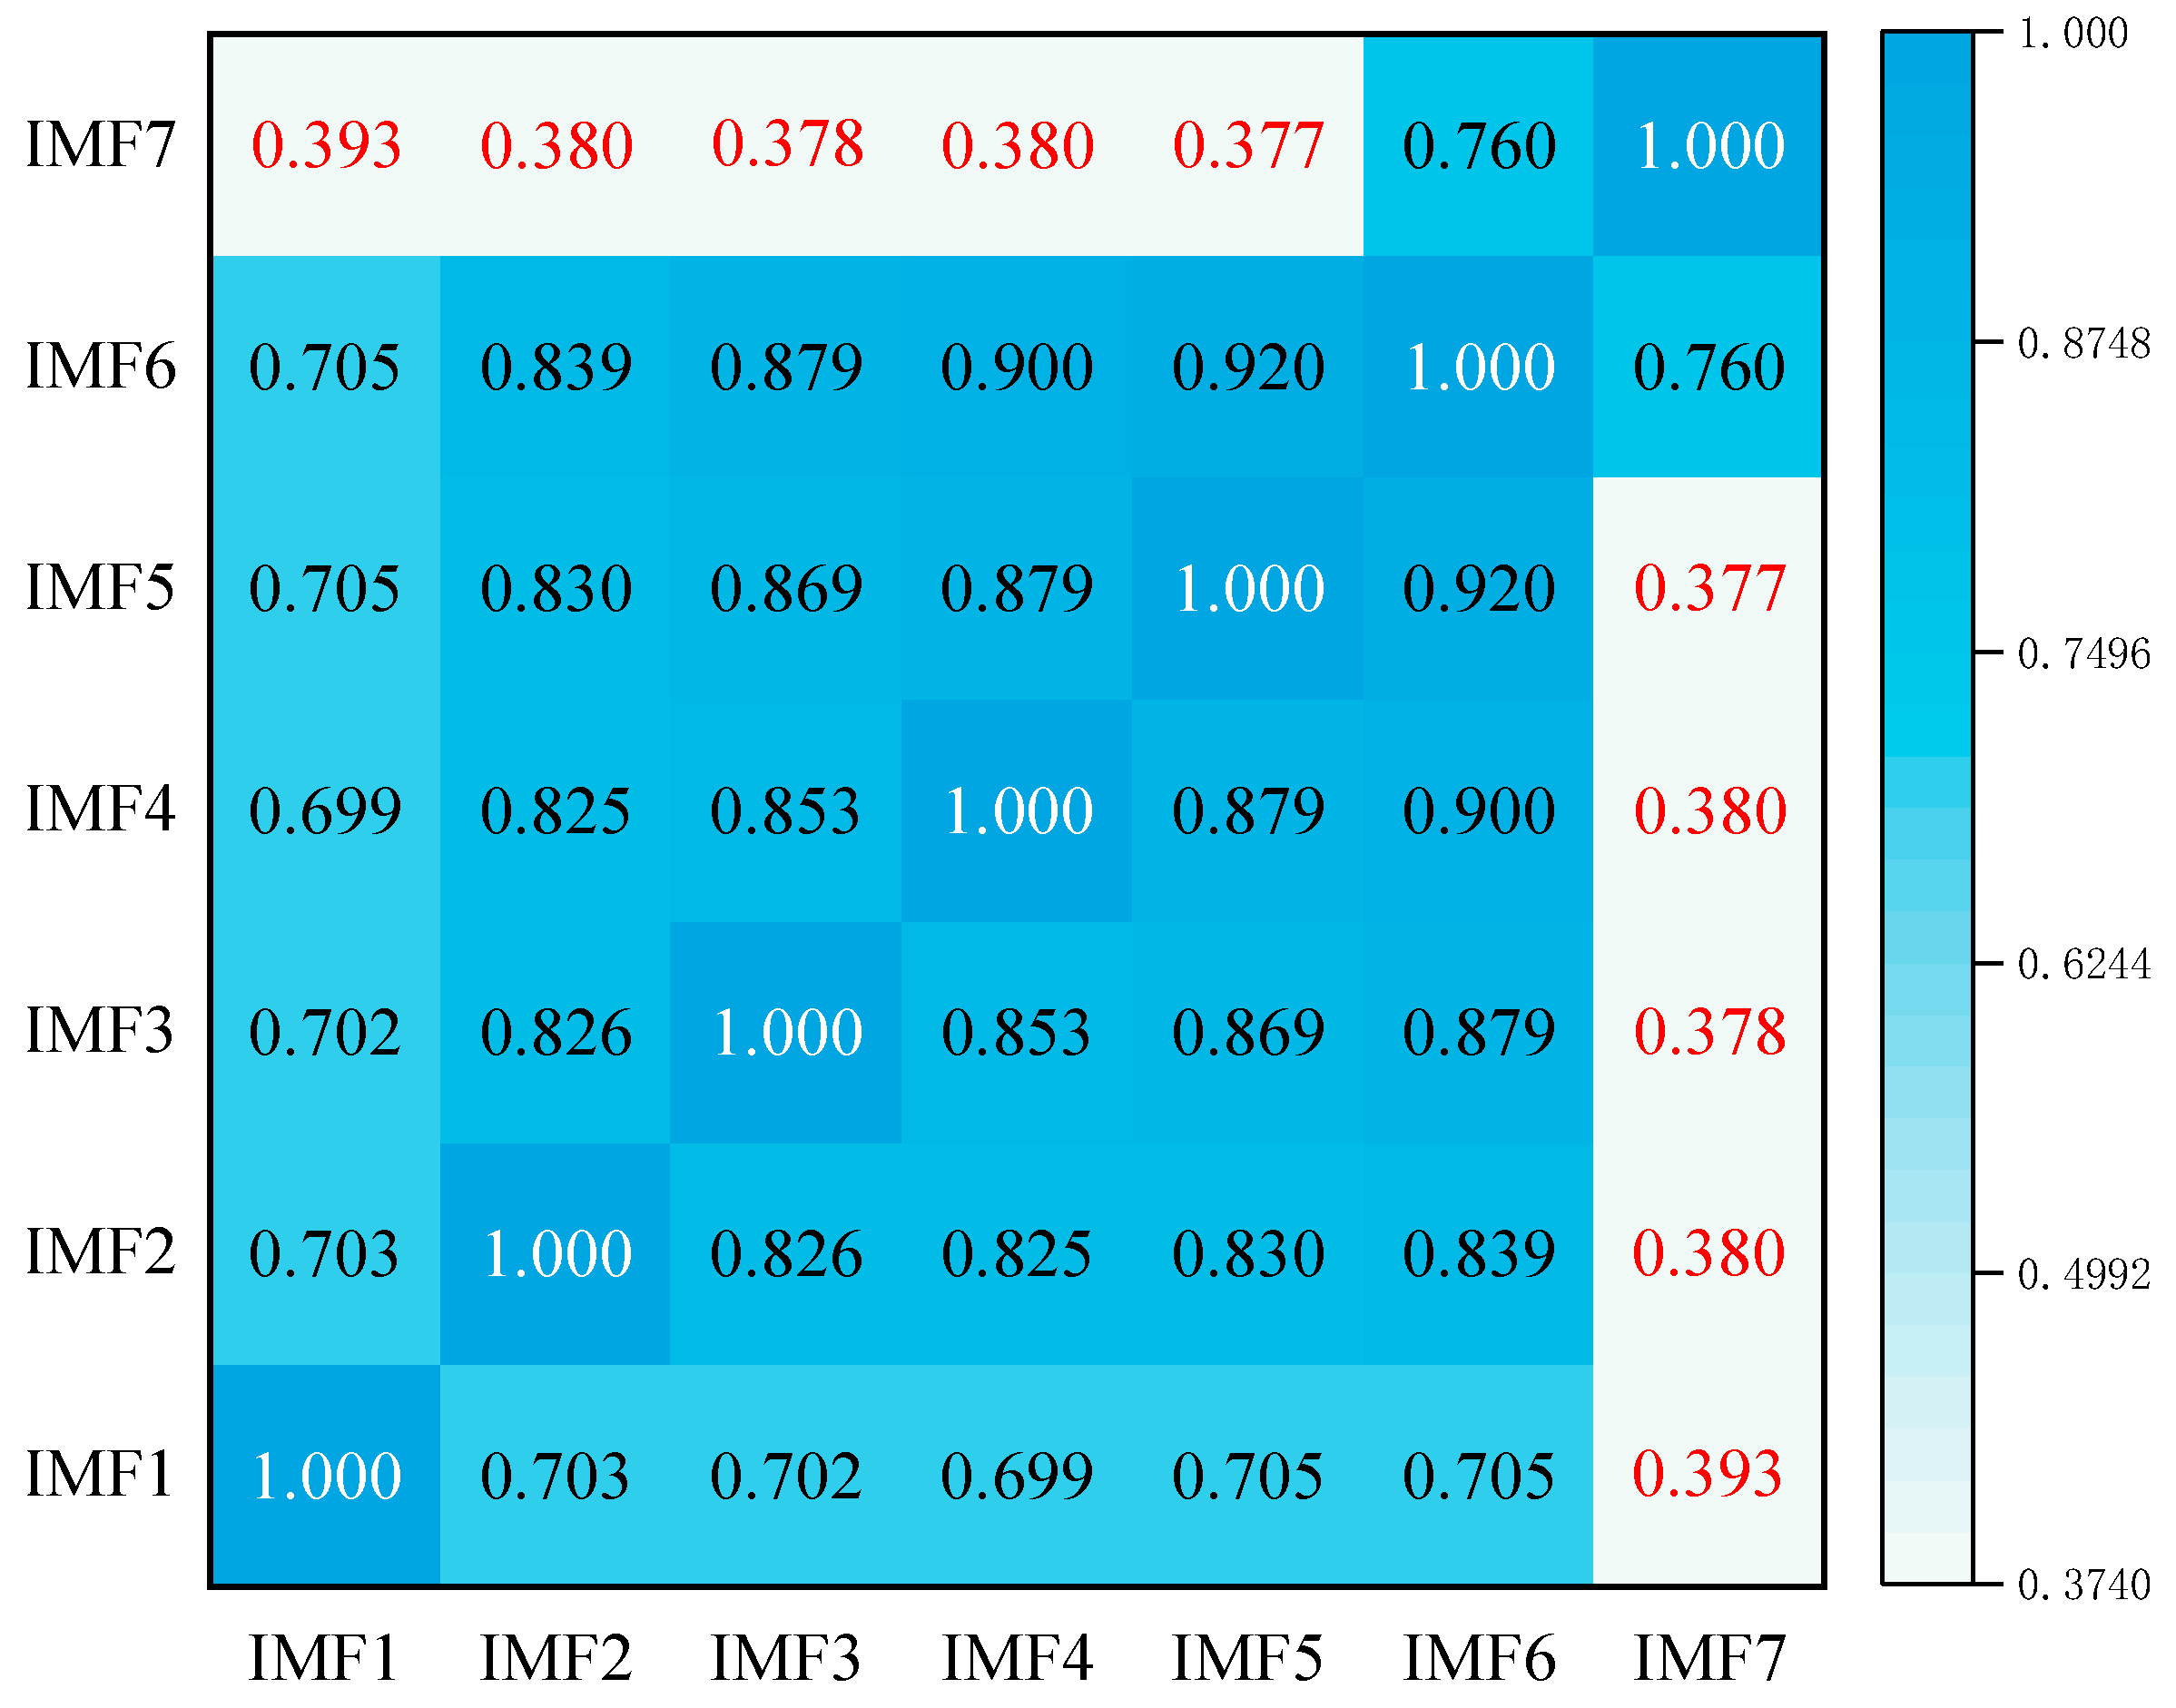
Combining the CEEMDAN and the gray relation analysis (GRA), an integrated empirical mode decomposition (IEMD) is proposed. The IEMD first divides the renewable energy into a series of IMFs, and then classifies the IMFs to low-frequency and high-frequency components for distribution.
(ii)
On the basis of the supercapacitor absorbing high-frequency components and the HESS regulating low-frequency components of the renewable energy power, a two-stage distribution strategy is proposed for minimizing the fluctuations of the renewable energy power in the ERSMS.
The remainder of this paper is organized as follows. Section 2 introduces the ERSMS configuration, including the structure and operation modes. Section 3 introduces the proposed method including an integrated empirical mode decomposition method to decompose the renewable energy power and a two-stage energy distribution to distribute the power within the ERSMS. Section 4 presents results based on the designed case study. Finally, conclusions are drawn in Section 5.

2. ERSMS Configuration
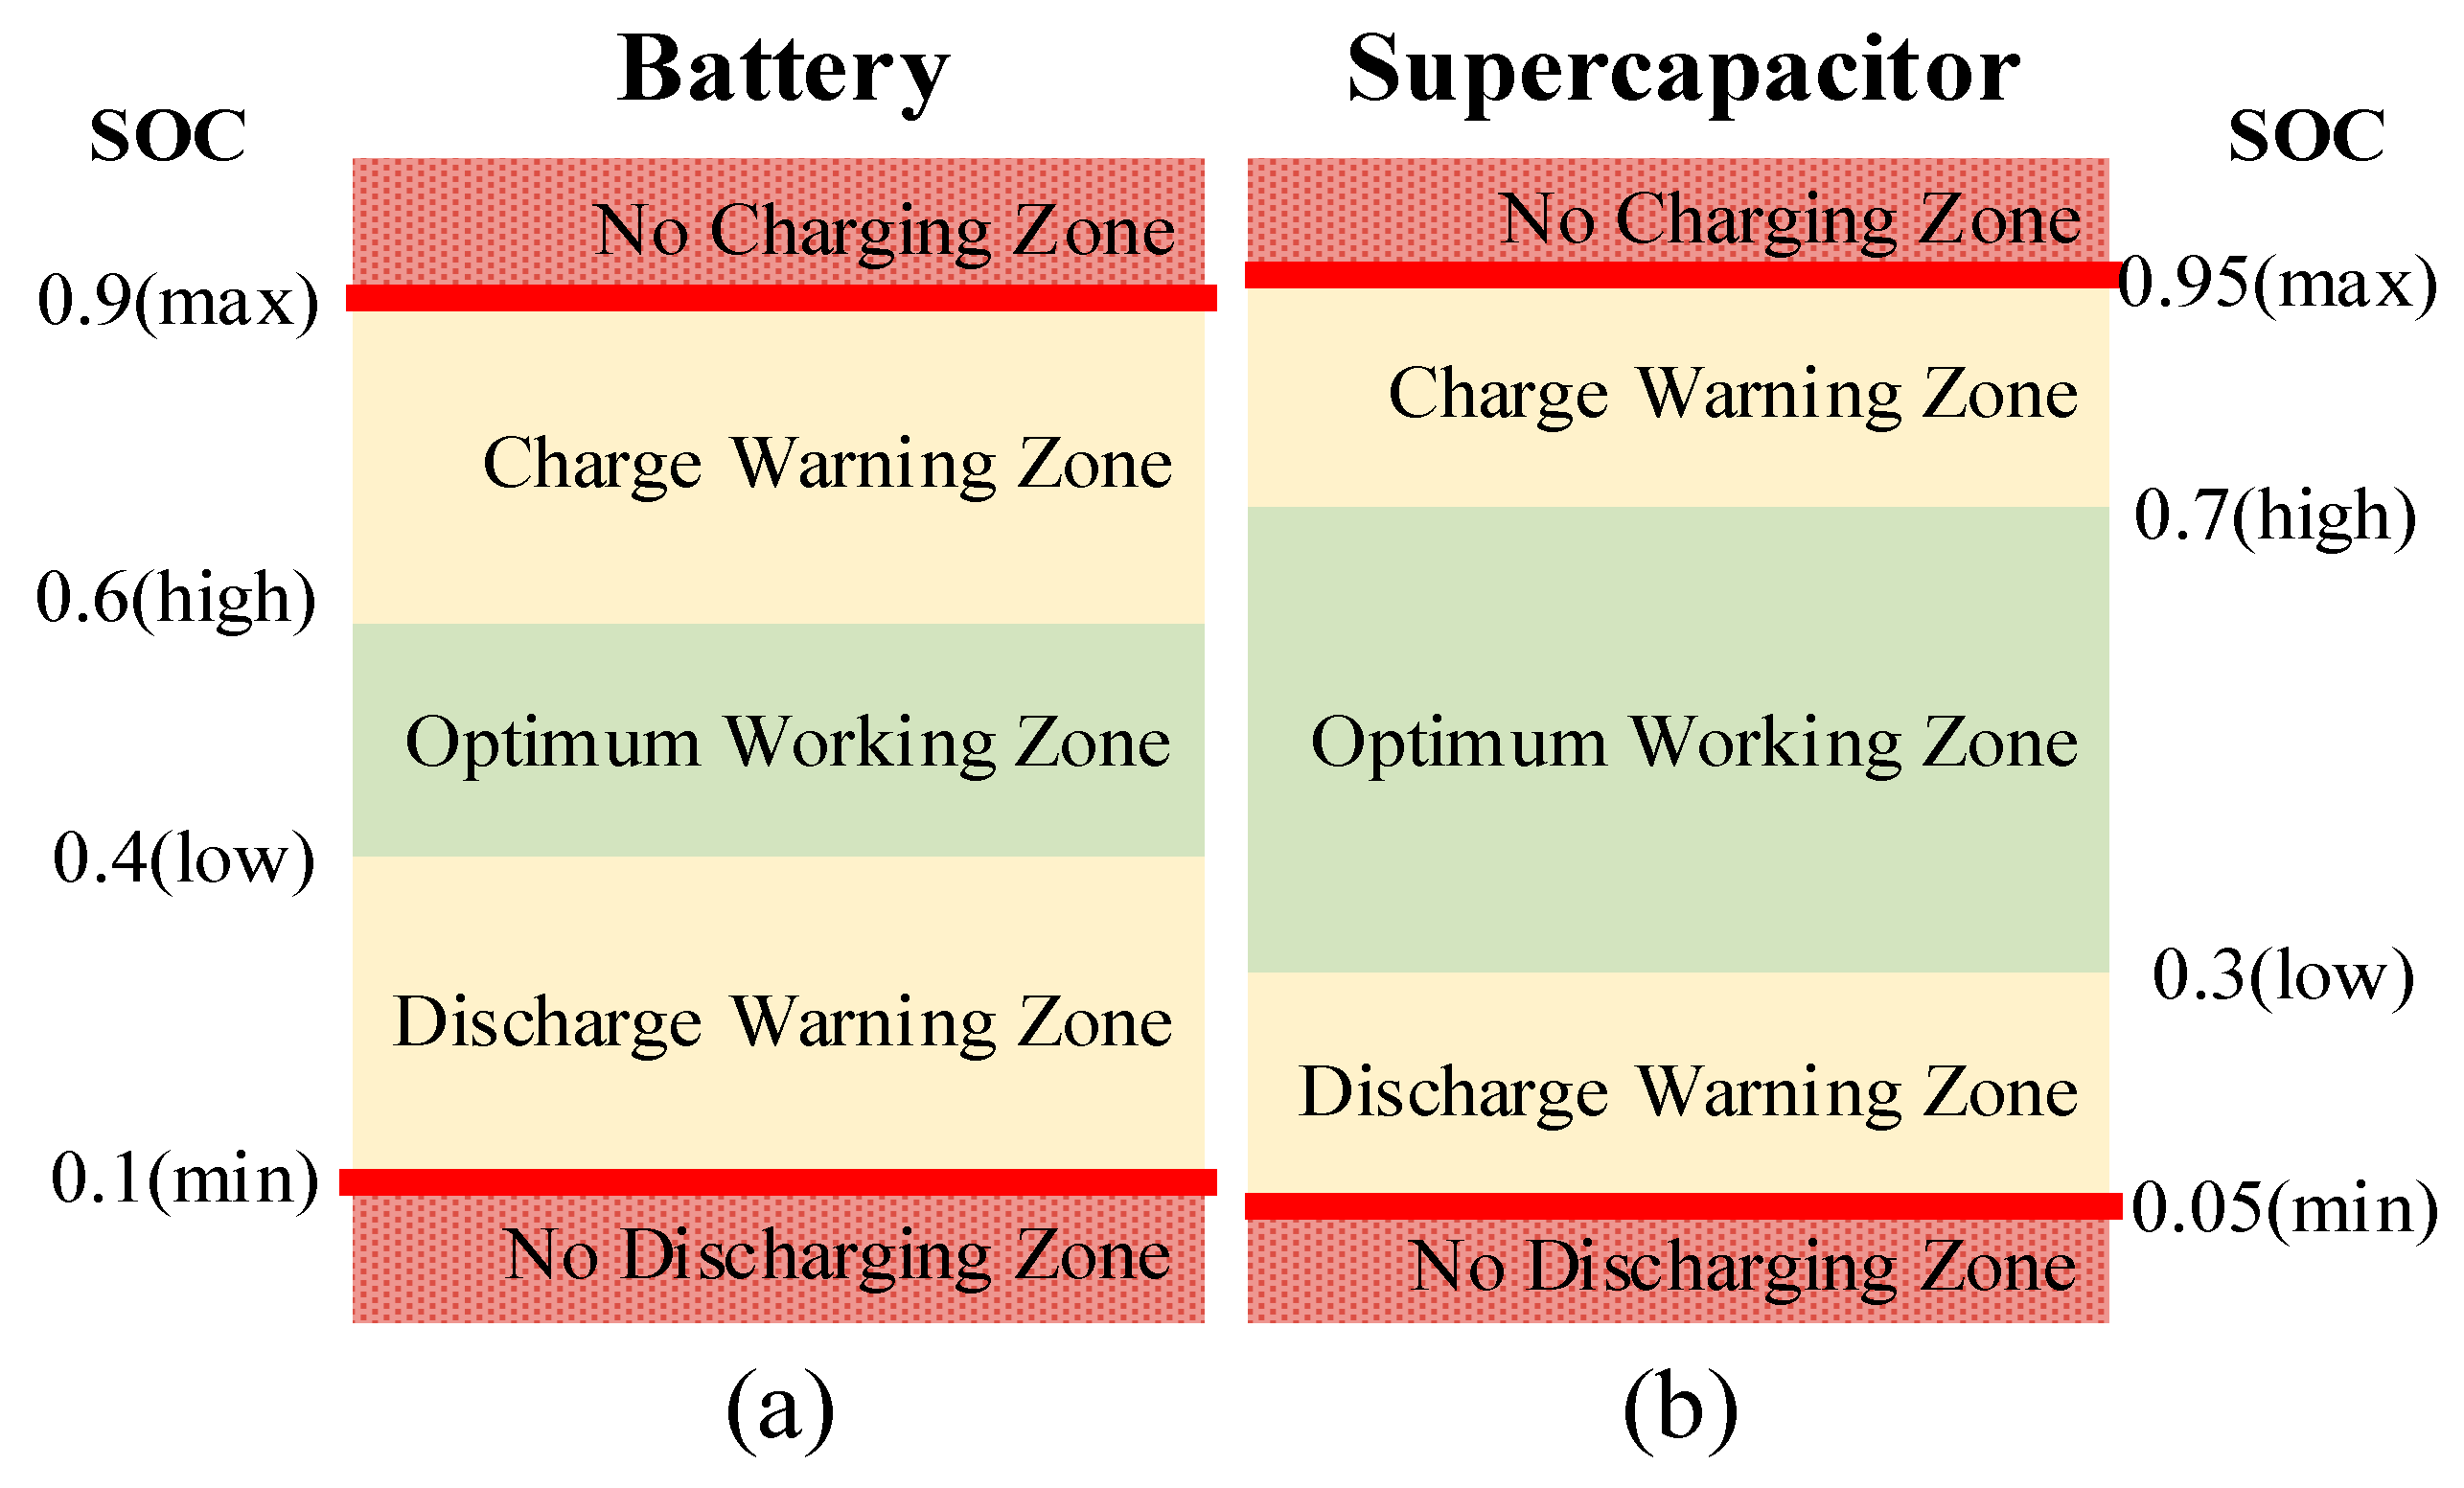
2.1. Structure

The structure of a typical ERSMS is presented in Figure 1, which composes four parts: a public grid, a TPSS, a renewable energy generation system, and an HESS. In the TPSS a V/v connection traction transformer is installed for obtaining the power from the three-phase public grid supplying the traction load of the two single-phase catenary sections. A railway power conditioner (RPC) with typical back-to-back topology [26,27], i.e., single-phase ac-dc-ac converter, is employed not only to balance the power between section a and section b but also to provide a dc-link to which a number of renewable energy generation and energy storage units can be connected. The renewable energy generation system is associated with the natural resources endowment along the railway line, e.g., photovoltaic, wind, hydropower, geothermal, tidal, etc. This study focuses on the wind power (WP) and photovoltaic (PV)since they are commonly available. The electricity generation and its efficiency will be influenced by climate factors [28,29]. So far, in this ERSMS the power is exchanged among the four parts.

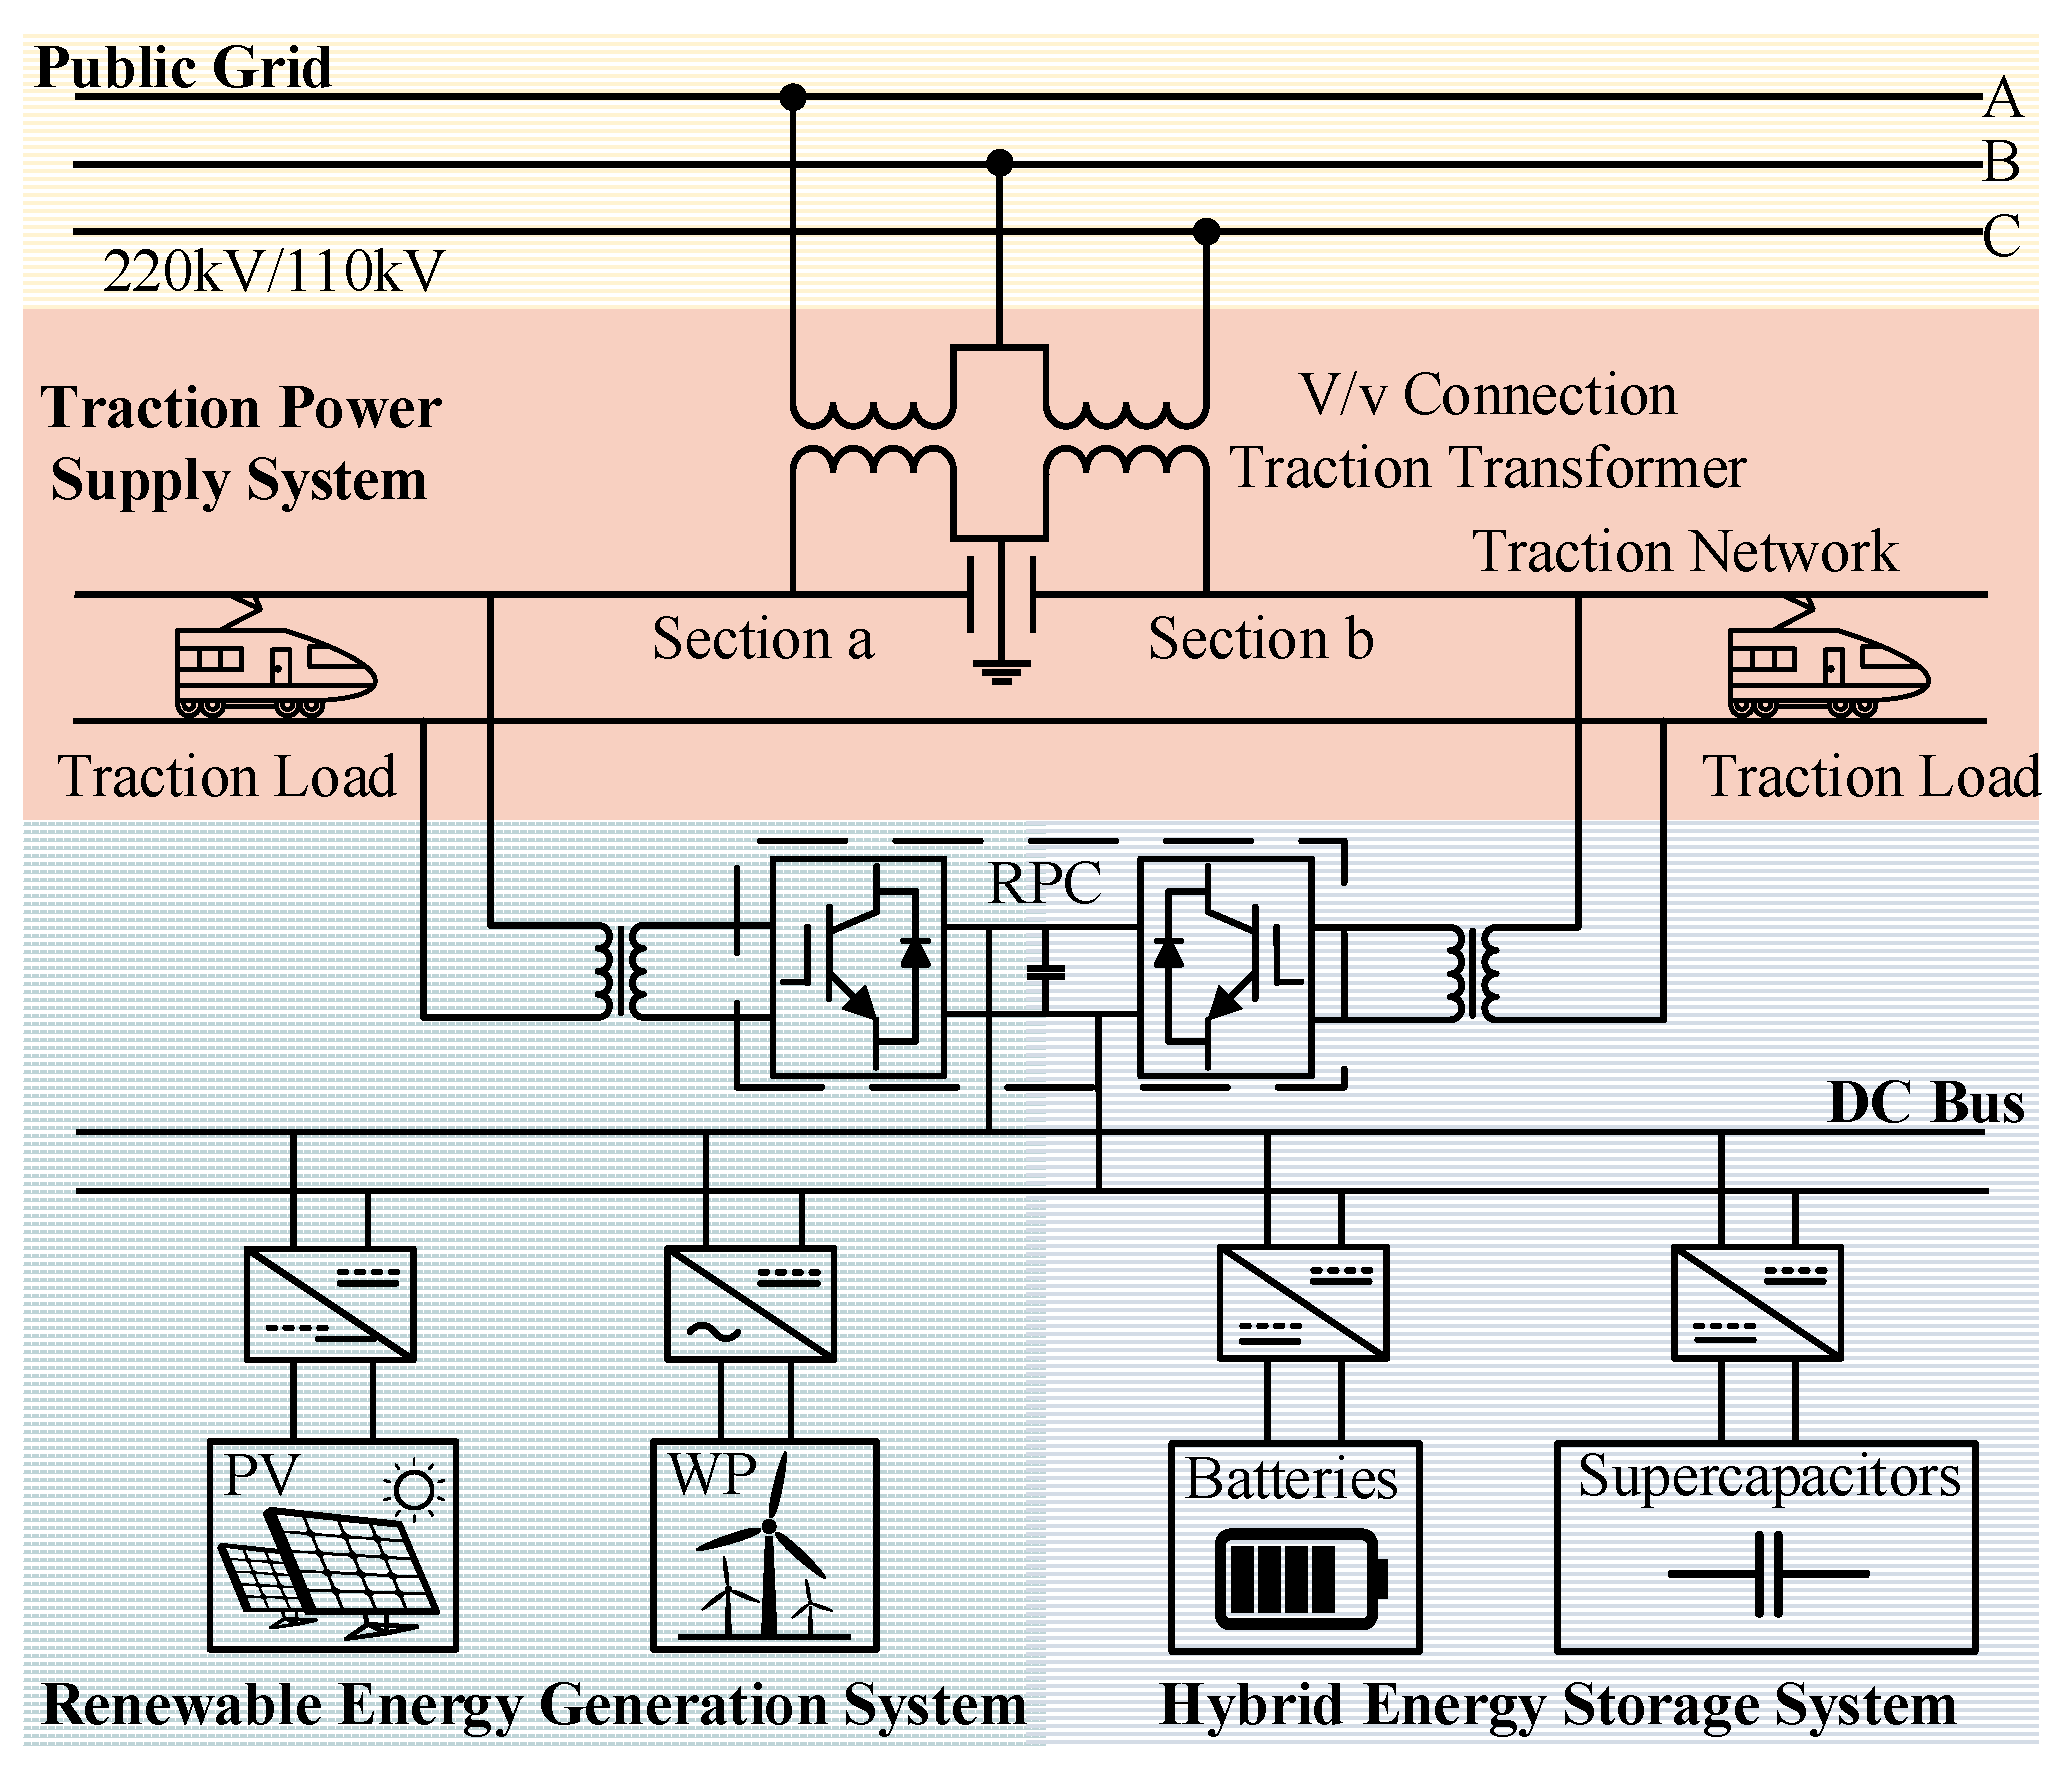
2.2. Operation Modes

The operation modes of the ERSMS are classified according to the operating experience and relevant published review [3,25]. As shown in Figure 2, different operation modes of the ERSMS can be classified based on the state of the traction load PL, which is defined as the total power of the trains and the traction network loss of both section a and section b. By comparing PL with its traction state threshold, the value Ptra, and regenerative state threshold value Preg, the following three ERSMS operation modes are defined.
  • Mode 1: PL > Ptra > 0
This is the traction mode in which the traction power of the trains is more than regenerative braking power of the other trains. According to the absolute difference between the PL and the total renewable energy generation power Pren, as well as the relative capacities of the available charging and discharging power of the HESS, PHESS_Avail and PHESS_Surp, this mode is further divided into four scenarios.
  • When 0 < P ren P L P HESS _ Avail , the HESS is in the charging state. In this situation, part of the Pren is used to meet the PL, and all the rest are stored in the HESS, denoted by PHESS. The power flow relationship among the four parts of the ERSMS is demonstrated by Figure 2a and Equation (1).
    P HESS = P ren P L P abd = 0
  • When P HESS _ Avail < P ren P L , the HESS is in the charging state. After meeting the PL and fully charging the HESS, there is some excess power that cannot be utilized by the ERSMS. This part of the power is named as abandoned power Pabd, which will be injected into the public grid or discarded. The power flow relationship of the ERSMS is demonstrated by Figure 2 and Equation (2).
    P HESS = P HESS _ Avail P abd = P ren P L P HESS
  • When 0 < P L P ren P HESS _ Surp , the HESS is in the discharging state. Under this condition, both Pren and PHESS support the PL together. The power flow relationship of the ERSMS is demonstrated by Figure 2c and Equation (3).
    P HESS = P L P ren P abd = 0
  • When P HESS _ Surp < P L P ren , the HESS is in the discharging state. Compared to the previous condition, Pren and PHESS is insufficient for filling the PL. We have no choice but to purchase the lacking power from the public grid. The power flow relationship of the ERSMS is demonstrated in Figure 2d and Equation (4).
    P HESS = P HESS _ Surp P abd = 0
  • Mode 2: PL < Preg < 0
This is the regenerative mode in which the traction power of the trains is less than the regenerative braking power of the other trains. Apparently, the HESS needs to be in the charging state under this mode. By comparing the sum of Pren and |PL| with PHESS_Avail, this mode can be further divided into two scenarios.
  • When P ren + P L > P HESS _ Avail , the HESS is in the charging state. Although the HESS is working at its maximum capacity, the PHESS cannot completely store the |PL| (i.e., RBE) and Pren. As a result, there is still some Pabd. The power flow relationship of the ERSMS is illustrated by Figure 2e and Equation (5).
    P HESS = P HESS _ Avail P abd = P ren + P L P HESS
  • When P ren + P L P HESS _ Avail , the HESS is in the charging state. In this case, all the energy from the renewable energy generation and locomotive braking are stored in the HESS. The power flow of the ERSMS is illustrated by Figure 2f and Equation (6).
    P HESS = P ren + P L P abd = 0
  • Mode 3: Preg < PL < Ptra
This is no-load mode regarding that there is no train load on the traction network. The PL is only the open circuit loss of the traction network. Based on the comparison between Pren and PHESS_Avail, this mode is further divided into two scenarios.
  • When P ren > P HESS _ Avail , the HESS is in the charging state. Part of Pren is absorbed by the maximum capacity of the HESS. The remaining Pren becomes Pabd, excepting the small part related to the network loss. The power flow relationship of the ERSMS is presented by Figure 2g and Equation (7).
    P HESS = P HESS _ Avail P abd = P ren P HESS P L
  • When 0 P ren P HESS _ Avail , the HESS is in the charging state. Excepting the little power for the network loss, renewable energy is fully stored in the HESS. The power flow relationship of the ERSMS is presented by Figure 2h and Equation (8).
    P HESS = P ren P L P abd = 0
As presented above, modes 1-1, 1-2, 1-3, 3-1, and 3-2 are fully energy self-sufficient; renewable energy may be abandoned in modes 1-2, 2-1, and 3-1; and purchasing power from the external grid is required in mode 1-4.

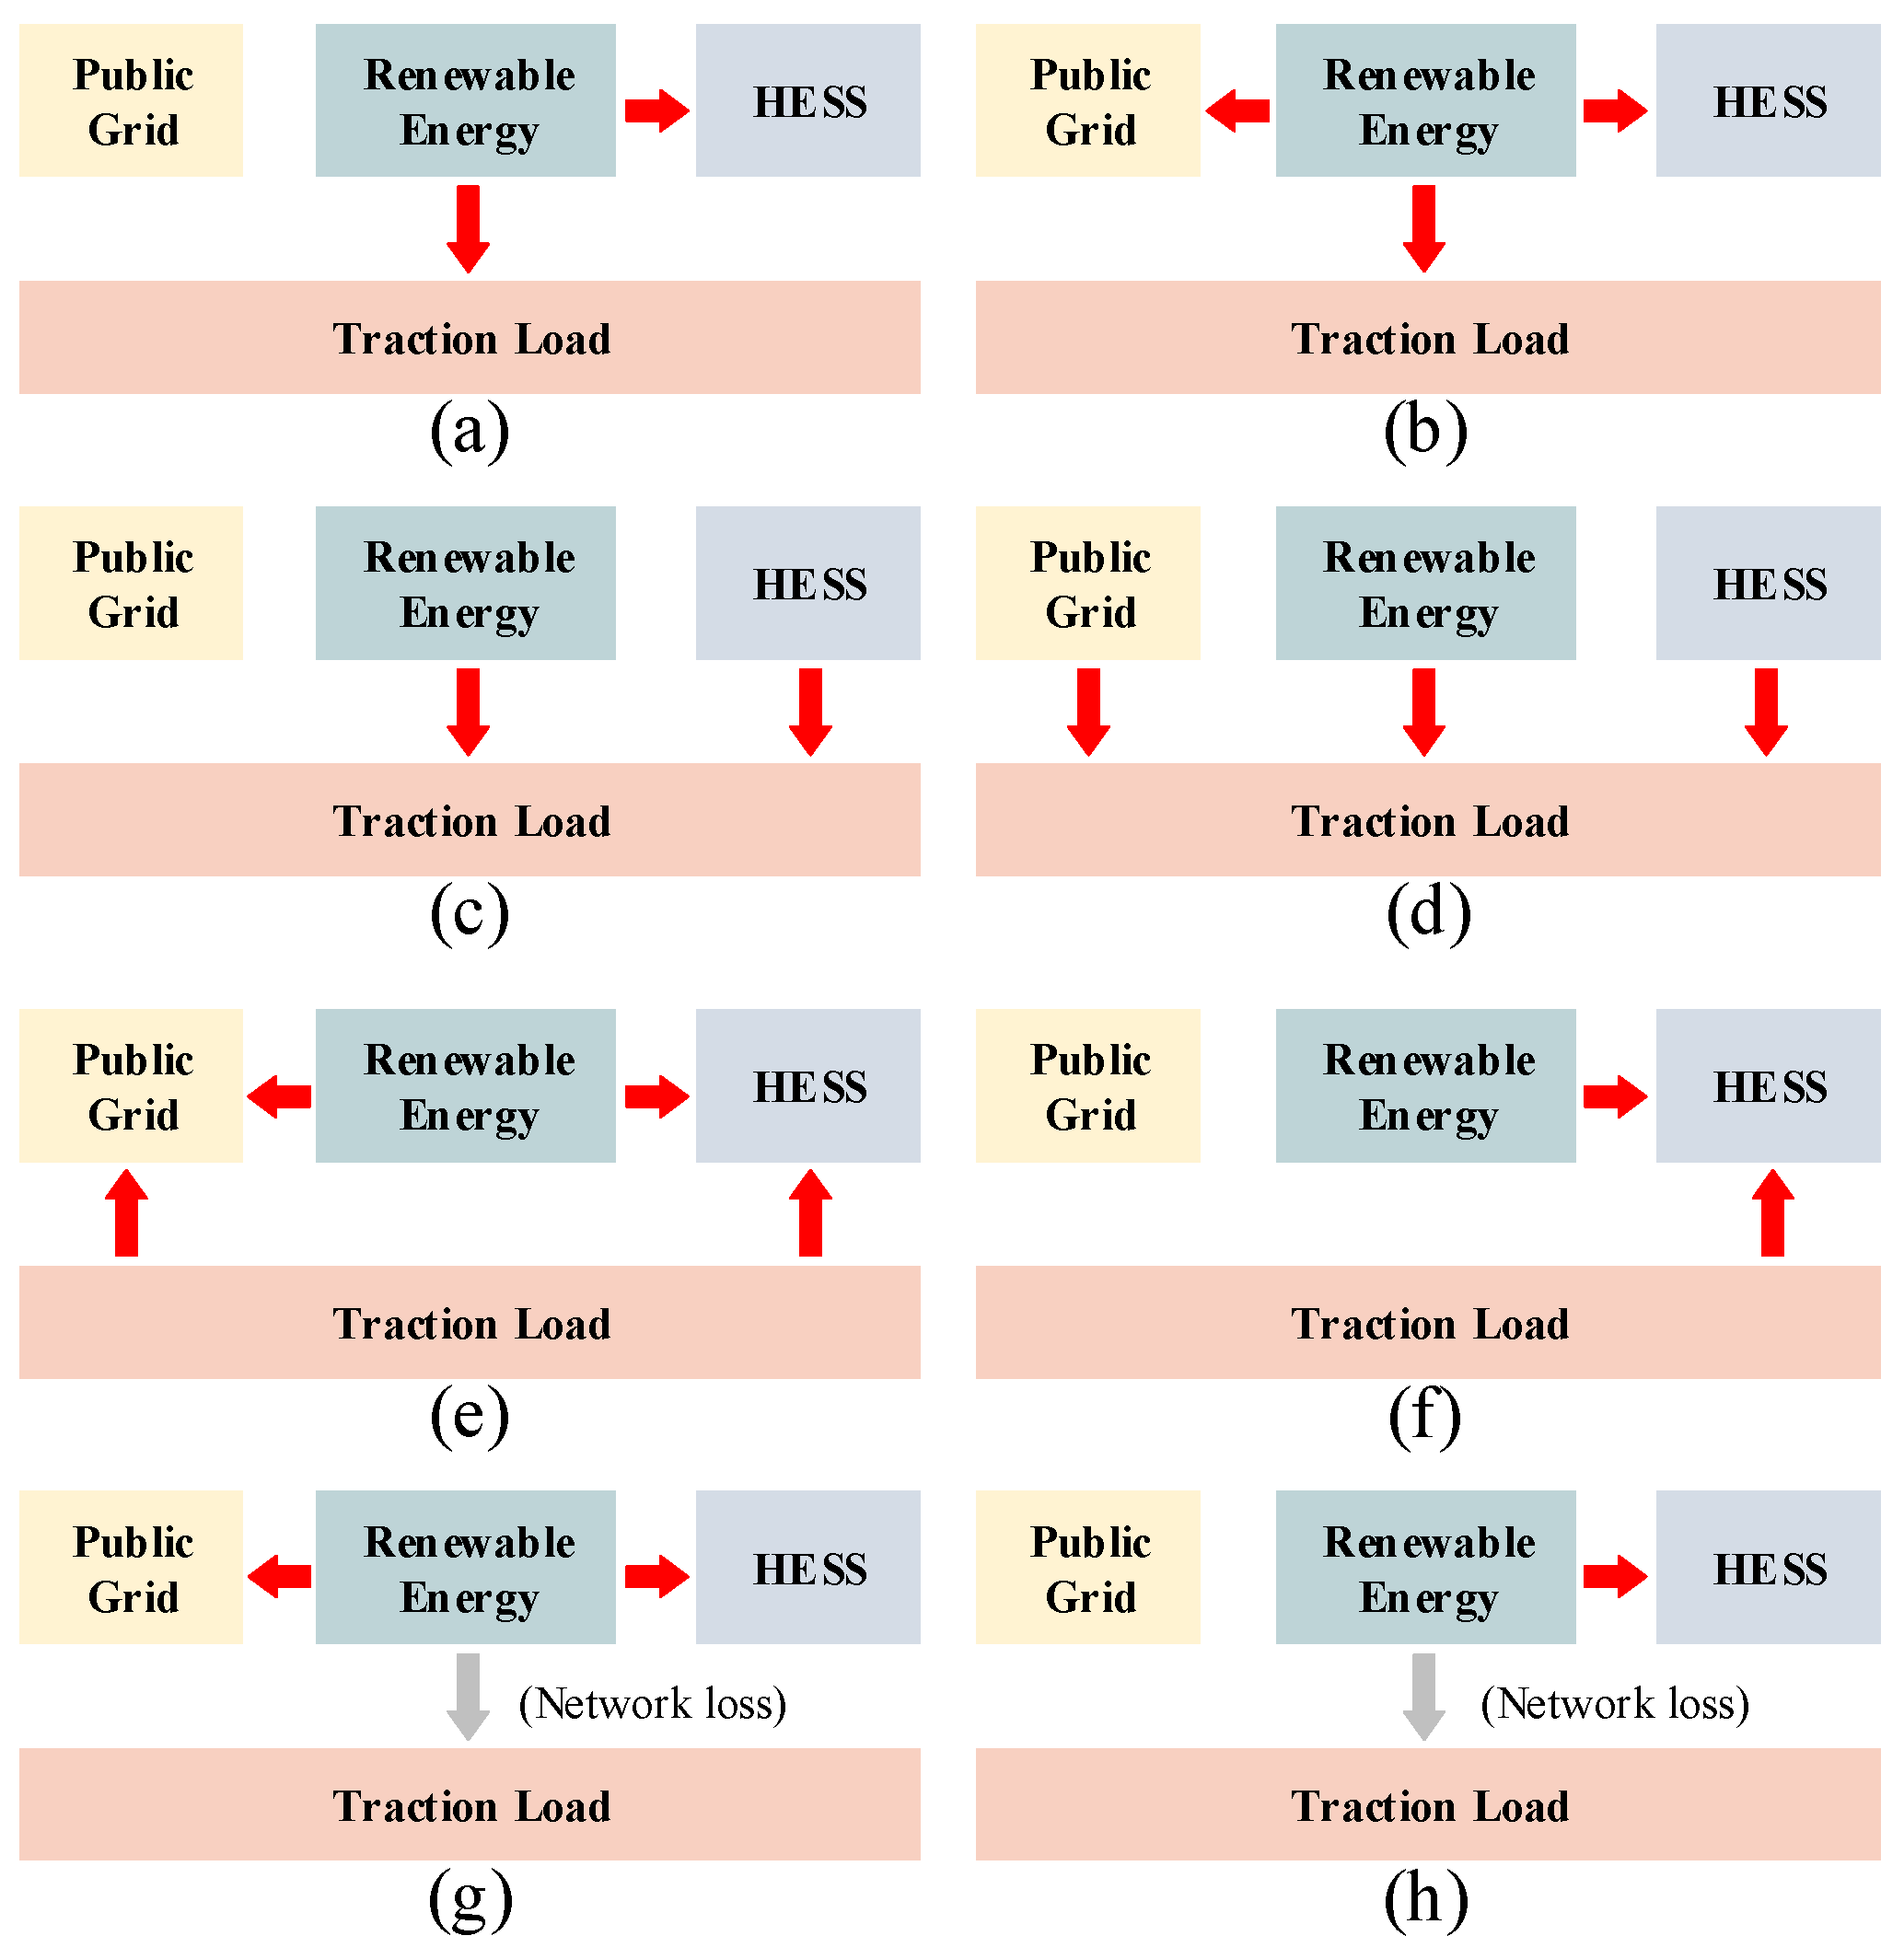
2.3. HESS Protection Strategy

Typically, the state of charge (SOC) is the most critical factor for an energy storage system affecting the operating status and stability. For an HESS, five operation zones of the batteries and supercapacitors are defined according to their SOCs as shown in Figure 3: no charging/discharging zone, charge/discharge warning zone, and optimum working zone.
When the SOC of a battery or supercapacitor is outside the optimum working zone, the HESS cannot be charged or discharged at its maximum power capacity. Therefore, it is necessary to restrict the charging or discharging power according to the battery’s or supercapacitor’s remaining capacity. Based on the operation zone definition of Figure 3, a protection strategy is given as
P c = P c max 0 , S O C max     S O C S O C max     S O C high P d = P d max 0 , S O C     S O C min S O C low     S O C min
where the subscripts c and d represent the charging and discharging states, respectively; P c and P d stand for the target charging and discharging power of the batteries or supercapacitors, respectively; and P c and P d are the target charging and discharging values without regard to restrict the charging or discharging power, respectively.

3. Proposed Method

3.1. Overall Methodology

In this work, an energy management strategy for the ERSMS is proposed consisting of an IEMD and a two-stage energy distribution processes, as shown in Figure 4. Initially, the IEMD decomposes the fluctuating renewable energy generation power into high-frequency and low-frequency components through the CEEMDAN and GRA steps. Then, the two-stage energy distribution deals with these power components yielding charging/discharging powers of the HESS by taking into account the traction load requirement as well as the SOC constraints. The basis of this process is that firstly, high-frequency components are absorbed through the supercapacitor; secondly, low-frequency components are further distributed according to the ERSMS operation modes. Details of the algorithms of the proposed method are described in the following parts of this section.

3.2. Integrated Empirical Mode Decomposition

The Empirical Mode Decomposition is one of the most commonly used decomposition methods, which is applicable on nonlinear and non-stationary complex time series [19]. The EMD method decomposes such time series into a finite and small number of intrinsic modes along with a residual. The functions representing the intrinsic modes are known as IMFs. Recognizing the shortcomings of unclear classification of the IMFs of conventional EMD methods, an IEMD is proposed combining a CEEMDAN decomposition and a GRA classification. First, apply the CEEMDAN to an original signal, i.e., the renewable energy power, by the following steps.
Step 1: Add the Gaussian white noise signal γ j ( t ) to Pren(t), which is the renewable energy generation power in the time domain. The jth signal is represented as P ren j ( t ) = P ren ( t ) + ε γ j ( t ) , j = 1 , 2 , , i . The experimental signal P ren j ( t ) is decomposed by the EMD to obtain I M F 1 j ( t ) . The first IMF and the residual of the decomposition, denoted by P IMF - 1 ( t ) and P r 1 ( t ) , are given as
P IMF - 1 ( t ) = 1 I j = 1 I I M F 1 j ( t )
P r 1 ( t ) = P ren ( t ) P IMF - 1 ( t )
Step 2: Add γ j ( t ) to the first residual P r 1 ( t ) , represented as P r 1 j ( t ) = P r 1 ( t ) + ε 1 E 1 ( γ j ( t ) ) , j = 1 , 2 , , i . The P r 1 j ( t ) are decomposed through the EMD and also obtain their first-order components I M F 2 j ( t ) . Similarly, the second IMF and residual are acquired:
P IMF - 2 ( t ) = 1 I j = 1 I I M F 2 j ( t )
P r 2 ( t ) = P r 1 ( t ) P IMF - 2 ( t )
Step 3: Repeat the above process until the residual is a monotonic function and cannot be decomposed. Finally, the original signal can be represented as the sum of a series of IMFs as well as the residual.
P ren ( t ) = k = 1 K P IMF - k ( t ) + P r ( t )
After the decomposition above, some IMFs featuring a fast fluctuation with lower magnitudes are defined as high-frequency IMFs (HF-IMFs); the others exhibiting a slow fluctuation with higher magnitudes are defined as low-frequency IMFs (LF-IMFs). Although the IMFs can be simply classified by watching their shapes, in this work a GRA method is utilized to quantitatively classify them. Using the GRA, all the IMFs are classified by the following steps.
Step 1: The IMF and residual sequences are normalized by dividing their mean values.
P IMF - i ( t ) = P IMF - i ( t ) P ¯ IMF , i = 1 , 2 , , K
P r ( t ) = P r ( t ) P ¯ r
where P ¯ IMF and P ¯ r represent the mean values of the IMFs and the residual, respectively.
Step 2: The first IMF P IMF - 1 ( t ) is selected as the reference sequence in a discrete time domain P tar ( t ) , while the remaining IMFs and residual are designated as the comparison sequence P comp - i ( t ) .
P tar ( t ) = P IMF - 1 ( t )
P comp - i ( t ) = P IMF - i ( t )   , i = 2 , 3 , , K P r ( t )
Step 3: Calculate the gray correlation coefficient ξ i and determine the gray correlation degree ri.
ξ i ( t ) = min i min t P tar ( t ) P comp - i ( t ) P tar ( t ) P comp - i ( t ) + ρ max i max t P tar ( t ) P comp - i ( t ) + ρ max i max t P tar ( t ) P comp - i ( t ) P tar ( t ) P comp - i ( t ) + ρ max i max t P tar ( t ) P comp - i ( t )
r i = 1 n t = 1 n ξ i ( t ) , t = 1 , 2 , , n
where ρ is the resolution coefficient (within the [0, 1] interval; the value is usually 0.5).
Step 4: According to the values of ri, the P IMF - i ( t ) are sorted in ascending order. The ones with their r values close to r1 are classified as HF-IMFs, the others with their r values far from r1 are the LF-IMFs.
P HF ( t ) = i = 1 u P IMF - i ( t )
P LF ( t ) = i = 1 v P IMF - i ( t ) + P r ( t )
where u and v are the numbers of the HF-IMFs and the LF-IMFs, respectively.

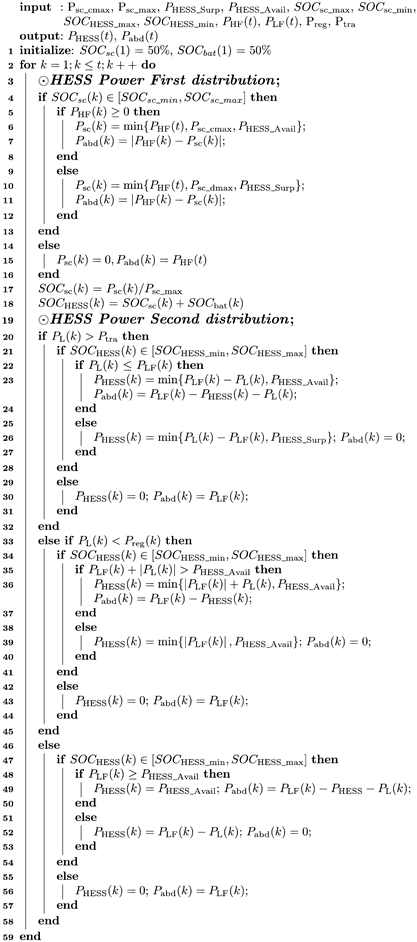
3.3. Two-Stage Energy Distribution

So far, the decomposed renewable energy generation power should be distributed for utilization. The first distribution stage is based on the fact that the supercapacitors absorb high-frequency renewable energy power PHF(t) avoiding potential power quality and stability issues. The remaining low-frequency renewable energy power PLF(t) is distributed by the second stage according to the operation modes as presented in Section 2.2. The two-stage distribution process is given in Algorithm 1.
Algorithm 1: The Two-Stage Energy Distribution
Energies 17 00268 i001
After the initializing the steps, the first stage starts from checking the SOCSC. If it is within the normal range, the supercapacitors will be charged or discharged according to the PHF(k) under the given strategy. On the contrary, when the SOCSC is out of the normal range, the PHF(k) will be discarded. Finally, refresh SOCHESS by SOCSC.
The second stage starts from the judgement of the operation modes provided in Section 2.2. Then, if the SOCHESS is within the normal range, the HESS will balance the power flow among the ERSMS through charging or discharging under the given strategy. On the contrary, when the SOCHESS is outside the normal range, the HESS takes no action so that the traction load can just be supplied by an external grid.

4. Results

4.1. Parameters

The active power of the traction load of a traction substation during a given period is obtained from traction calculation based on a train operation schedule, as shown in Figure 5. For easily discerning the results, a short part of this load is zoomed in for illustrating the energy management performance.
The renewable energy generation power under consideration is based on the weather data of a Chinese city. Figure 6 gives the wind power PWind, PV power PPV, as well as their sum, i.e., the renewable energy power Pren = PWind + PPV, corresponding to the time of Figure 4. The average value and peak value of the wind power are 8.02 MW and 13.7 MW, respectively. The PV power fluctuates more severely with its average value of 6.92 MW and peak value of 25.38 MW. The total renewable energy power is with an average value of 14.94 MW and a peak value of 37.06 MW.
In addition, the parameters of the relevant HESS are given in Table 1. These parameters are determined by taking into account the power requirement of the traction load and the specific climatic conditions in the local area.

4.2. Case Study

It is noted that all the algorithms of the proposed method including the IEMD and the two-stage energy distribution are implemented by C# programming through Microsoft Visual Studio. The highly fluctuating renewable energy power shown in Figure 6 is decomposed and classified by the IEMD. Initially, the renewable energy power decomposition is conducted through the CEEMDAN procedure. As presented in Figure 7, seven IMFs and one residual (Res) of the renewable energy power are obtained. The IMFs and Res exhibit different shapes in terms of oscillation speed and magnitude.
To divide these components more clearly, the IMFs are classified through the GRA procedure. According to Figure 6, the IMF1 (yellow line) is the most fluctuating component in both speed and magnitude angles. This means that the components correlated to this IMF1 are high-frequency ones, and vice versa, they are low-frequency ones. Using IMF1 as the target sequence and the other six IMFs as a comparison sequence, the gray correlation degree (r-value) can be obtained. Based on these r values, a correlation heatmap of the IMFs is depicted as shown in Figure 8. The IMF2, IMF3, IMF4, IMF5, and IMF6 have a value of approximately 0.7 r compared to IMF1, i.e., high correlation. However, the r value of the IMF7 is less than 0.4, i.e., not highly correlated with IMF1. This conclusion can be obtained by observing the color of the first column of the heatmap as well. Furthermore, the residual magnitude is extremely small, and it is treated as one of the LF-IMFs. As a result, the Pren is divided into two sets, i.e., P HF ( t ) and P LF ( t ) .
P HF ( t ) = i = 1 6 P IMF - i ( t )
P LF ( t ) = P IMF - 7 ( t ) + P r ( t )
So far, through the IEMD process, the decomposed LF-IMFs of renewable energy power are shown in Figure 9. Compared with the result of conventional EMD method, the PLF of the proposed IEMD shows a much slower fluctuation with a much smaller magnitude.
Finally, the decomposed renewable energy power is distributed by the two-stage method for utilization. The power decomposition results of both the proposed IEMD and conventional EMD are treated by the two-stage energy distribution, yielding the ERSMS supply result given by Figure 10. On the whole, in the ERSMS, the traction load is supplied by the renewable energy and the HESS as much as possible. After the two-stage energy distribution, the power flow of Pren + PHESS by IEMD (blue line) becomes a significantly slower fluctuation compared to that of conventional EMD (pink line). This will benefit the lifespan of the HESS.
From the perspective of electricity consumption, owing to the two-stage energy distribution, most of the traction load is supplied by the Pren + PHESS leading to a high energy self-sufficient rate. Furthermore, for the heavy load over 10 MW in Figure 10 (the parts upper than the dashed line), the Pren and PHESS cover nearly 89% of PL for the proposed IEMD after the distribution (overlapped area of blue line and black line compared to the area of black line), while the counterpart of the conventional EMD after the distribution is less than 83% (overlapped area of pink line and black line compared to the area of black line).
It should be noted that the proposed method does not only work under the given situation that both the PV and WP supply a traction load. On the one hand, the IEMD is an approach utilized to decompose the fluctuation of the total renewable energy power regardless of the specific types of renewable energy sources. On the other hand, under an extreme climatic condition, i.e., there is no renewable energy power available, the two-stage energy distribution still adjusts the HESS, regulating the energy flow between the public grid and traction load.

5. Conclusions

This work proposed an energy management strategy for the integration of renewable energy and HESS in electrified railways. This strategy incorporates an IEMD process for the renewable energy generation power and a two-stage energy distribution for the energy flow among the ERSMS. By the IEMD, the severely fluctuating renewable energy generation power is divided into high-frequency and low-frequency parts. Through the two-stage energy distribution, the former is absorbed by the supercapacitors to the best of the SOCSC’s ability, and the latter is used by the traction load as much as possible based on the HESS operation. The case study validates that the proposed method provides superior energy utilization performance than the conventional method by means of power fluctuation and electricity consumption.
For further research it is proposed to integrate advanced machine learning algorithms to adaptively adjust the energy distribution based on real-time conditions. Furthermore, it is possible to develop mathematical models by combining train schedule with climate data, enabling renewable energy power prediction based on regression analysis so as to satisfy traction load demand.

Author Contributions

Conceptualization, J.Y. and M.S.; methodology, J.Y. and M.S.; validation, M.S. and K.S.; formal analysis, M.S. and K.S.; data curation, M.S.; writing—original draft preparation, M.S.; writing— review and editing, M.S., J.Y. and K.S.; supervision, J.Y. and K.S.; funding acquisition, J.Y. and K.S. All authors have read and agreed to the published version of the manuscript.

Funding

This work was supported by the Fundamental Research Funds for the Central Universities under Grant 2021CZ103.

Institutional Review Board Statement

Not applicable.

Informed Consent Statement

Not applicable.

Data Availability Statement

The data presented in this study are available on request from the corresponding author. The data are not publicly available due to privacy.

Conflicts of Interest

The authors declare no conflict of interest.

References

  1. Zuo, J.; Dong, L.; Yang, F.; Guo, Z.; Wang, T.; Zuo, L. Energy Harvesting Solutions for Railway Transportation: A Comprehensive Review. Renew. Energy 2023, 202, 56–87. [Google Scholar] [CrossRef]
  2. Brenna, M.; Foiadelli, F.; Kaleybar, H.J. The Evolution of Railway Power Supply Systems Toward Smart Microgrids: The Concept of the Energy Hub and Integration of Distributed Energy Resources. IEEE Electrif. Mag. 2020, 8, 12–23. [Google Scholar] [CrossRef]
  3. Feng, C.; Gao, Z.; Sun, Y.; Chen, P. Electric Railway Smart Microgrid System with Integration of Multiple Energy Systems and Power-Quality Improvement. Electr. Power Syst. Res. 2021, 199, 107459. [Google Scholar] [CrossRef]
  4. D’Arco, S.; Piegari, L.; Tricoli, P. Comparative Analysis of Topologies to Integrate Photovoltaic Sources in the Feeder Stations of AC Railways. IEEE Trans. Transp. Electrif. 2018, 4, 951–960. [Google Scholar] [CrossRef]
  5. Zhu, X.; Hu, H.; Tao, H.; He, Z. Stability Analysis of PV Plant-Tied MVdc Railway Electrification System. IEEE Trans. Transp. Electrif. 2019, 5, 311–323. [Google Scholar] [CrossRef]
  6. Akbari, S.; Hashemi-Dezaki, H.; Fazel, S.S. Optimal Clustering-Based Operation of Smart Railway Stations Considering Uncertainties of Renewable Energy Sources and Regenerative Braking Energies. Electr. Power Syst. Res. 2022, 213, 108744. [Google Scholar] [CrossRef]
  7. Yuan, J.; Cheng, K.; Qu, K. Optimal Dispatching of High-Speed Railway Power System Based on Hybrid Energy Storage System. Energy Rep. 2022, 8, 433–442. [Google Scholar] [CrossRef]
  8. Lu, Q.; Gao, Z.; He, B.; Che, C.; Wang, C. Centralized-Decentralized Control for Regenerative Braking Energy Utilization and Power Quality Improvement in Modified AC-Fed Railways. Energies 2020, 13, 2582. [Google Scholar] [CrossRef]
  9. Khan, K.A.; Khalid, M. Improving the Transient Response of Hybrid Energy Storage System for Voltage Stability in DC Microgrids Using an Autonomous Control Strategy. IEEE Access 2021, 9, 10460–10472. [Google Scholar] [CrossRef]
  10. Yuan, J.; Peng, L.; Zhou, H.; Gan, D.; Qu, K. Recent Research Progress and Application of Energy Storage System in Electrified Railway. Electr. Power Syst. Res. 2024, 226, 109893. [Google Scholar] [CrossRef]
  11. Zhang, Y.; Diao, L.; Pei, H.; Wu, Q.; Zhang, J.; Du, H.; Xu, C. A Power-Speed Hierarchical Optimization Framework of Diesel/Battery/Supercapacitor Vehicular Hybrid Propulsion Systems. Ocean. Eng. 2023, 288 Pt 1, 116043. [Google Scholar] [CrossRef]
  12. Malozyomov, B.V.; Martyushev, N.V.; Kukartsev, V.A.; Kukartsev, V.V.; Tynchenko, S.V.; Klyuev, R.V.; Zagorodnii, N.A.; Tynchenko, Y.A. Study of Supercapacitors Built in the Start-Up System of the Main Diesel Locomotive. Energies 2023, 16, 3909. [Google Scholar] [CrossRef]
  13. Han, X.; Chen, F.; Cui, X.; Li, Y.; Li, X. A Power Smoothing Control Strategy and Optimized Allocation of Battery Capacity Based on Hybrid Storage Energy Technology. Energies 2012, 5, 1593–1612. [Google Scholar] [CrossRef]
  14. Li, X. Fuzzy Adaptive Kalman Filter for Wind Power Output Smoothing with Battery Energy Storage System. IET Renew. Power Gener. 2012, 6, 340–347. [Google Scholar] [CrossRef]
  15. Howlader, A.M.; Matayoshi, H.; Senjyu, T. A Robust H∞ Controller Based Gain-Scheduled Approach for the Power Smoothing of Wind Turbine Generator with a Battery Energy Storage System. Electr. Power Compon. Syst. 2015, 43, 2156–2167. [Google Scholar] [CrossRef]
  16. Li, Y. Research on Fusion Method of Nonlinear System. In Proceedings of the 2022 IEEE 6th Information Technology and Mechatronics Engineering Conference (ITOEC), Chongqing, China, 4–6 March 2022; pp. 261–264. [Google Scholar] [CrossRef]
  17. Ponomarev, A.V. Systems Analysis of Discrete Two-Dimensional Signal Processing in Fourier Bases. In Advances in Signal Processing, Intelligent Systems Reference Library; Springer: Cham, Switzerland, 2020; pp. 87–96. [Google Scholar]
  18. Khokhar, S.; Mohd Zin, A.A.; Memon, A.P.; Mokhtar, A.S. A New Optimal Feature Selection Algorithm for Classification of Power Quality Disturbances Using Discrete Wavelet Transform and Probabilistic Neural Network. Measurement 2017, 95, 246–259. [Google Scholar] [CrossRef]
  19. Huang, N.E.; Shen, Z.; Long, S.R.; Wu, M.C.; Shih, H.H.; Zheng, Q.; Yen, N.-C.; Tung, C.C.; Liu, H.H. The Empirical Mode Decomposition and the Hilbert Spectrum for Nonlinear and Non-Stationary Time Series Analysis. Proc. R. Soc. Lond. Ser. A Math. Phys. Eng. Sci. 1998, 454, 903–995. [Google Scholar] [CrossRef]
  20. Wu, Z.; Huang, N.E. Ensemble Empirical Mode Decomposition: A Noise-Assisted Data Analysis Method. Adv. Adapt. Data Anal. 2009, 1, 1–41. [Google Scholar] [CrossRef]
  21. Li, M.; Li, Y.; Choi, S.S. Dispatch Planning of a Wide-Area Wind Power-Energy Storage Scheme Based on Ensemble Empirical Mode Decomposition Technique. IEEE Trans. Sustain. Energy 2021, 12, 1275–1288. [Google Scholar] [CrossRef]
  22. Liang, T.; Xie, G.; Fan, S.; Meng, Z. A Combined Model Based on CEEMDAN, Permutation Entropy, Gated Recurrent Unit Network, and an Improved Bat Algorithm for Wind Speed Forecasting. IEEE Access 2020, 8, 165612–165630. [Google Scholar] [CrossRef]
  23. Jia, Y.; Li, G.; Dong, X.; He, K. A Novel Denoising Method for Vibration Signal of Hob Spindle Based on EEMD and Grey Theory. Measurement 2021, 169, 108490. [Google Scholar] [CrossRef]
  24. Liu, P.; Lai, J.; Chen, T.; Zeng, X.; Cheng, Y. Coordination Control Strategy of Co-Phase Traction Power Supply System Integrated with Hybrid Energy Storage Systems. In Proceedings of the 2022 5th International Conference on Energy, Electrical and Power Engineering (CEEPE), Chongqing, China, 22–24 April 2022. [Google Scholar]
  25. Zhao, S.; Feng, Q.; Yang, H.; Zhang, Y. Control Strategy of Hybrid Energy Storage in Regenerative Braking Energy of High-Speed Railway. Energy Rep. 2022, 8, 1330–1338. [Google Scholar] [CrossRef]
  26. Li, X.; Zhu, C.; Liu, Y. Traction Power Supply System of China High-Speed Railway under Low-Carbon Target: Form Evolution and Operation Control. Electr. Power Syst. Res. 2023, 223, 109682. [Google Scholar] [CrossRef]
  27. Ma, F.; Luo, A.; Xu, X.; Xiao, H.; Wu, C.; Wang, W. A Simplified Power Conditioner Based on Half-Bridge Converter for High-Speed Railway System. IEEE Trans. Ind. Electron. 2013, 60, 728–738. [Google Scholar] [CrossRef]
  28. Salkuti, S.R. Optimal Operation of Electrified Railways with Renewable Sources and Storage. J. Electr. Eng. Technol. 2021, 9, 239–248. [Google Scholar] [CrossRef]
  29. Liu, S.; Yan, J.; Yan, Y.; Zhang, H.; Zhang, J.; Liu, Y.; Han, S. Joint operation of mobile battery, power system, and transportation system for improving the renewable energy penetration rate. Appl. Energy 2024, 357, 122455. [Google Scholar] [CrossRef]
Figure 1. Structure of a typical ERSMS.
Energies 17 00268 g001
Figure 2. Operation modes of the ERSMS. (a) mode 1-1; (b) mode 1-2; (c) mode 1-3; (d) mode 1-4; (e) mode 2-1; (f) mode 2-2; (g) mode 3-1; (h) mode 3-2. Arrows represent the direction of energy flow.
Energies 17 00268 g002
Figure 3. Operation zones corresponding to SOC: (a) battery; (b) supercapacitor.
Energies 17 00268 g003
Figure 4. The overall methodology.
Energies 17 00268 g004
Figure 5. (a) Traction load power curve of a traction substation by traction calculation based on a train operation schedule; (b) zoom in a short part of the traction load power curve.
Energies 17 00268 g005
Figure 6. Typical renewable energy generation power.
Energies 17 00268 g006
Figure 7. Decomposed IMFs and Res by CEEMDAN.
Energies 17 00268 g007
Figure 8. The correlation heatmap of the IMFs where low correlation is indicated by red color.
Energies 17 00268 g008
Figure 9. Decomposition results of PLF by proposed IEMD and conventional EMD.
Energies 17 00268 g009
Figure 10. ERSMS supply results after the two-stage energy distribution based on proposed IEMD and conventional EMD.
Energies 17 00268 g010
Table 1. HESS parameters.
Parameter NameBatterySupercapacitor
Rated capacity (kW)20,00010,000
Maximum charging power (kW)11,0008500
Maximum discharging power (kW)10,5008500
Charging efficiency (%)9095
Discharging efficiency (%)9095
Maximum SOC (%)9095
Minimum SOC (%)105
Current SOC (%)5080
Disclaimer/Publisher’s Note: The statements, opinions and data contained in all publications are solely those of the individual author(s) and contributor(s) and not of MDPI and/or the editor(s). MDPI and/or the editor(s) disclaim responsibility for any injury to people or property resulting from any ideas, methods, instructions or products referred to in the content.

