Article

Toward a Fast but Reliable Energy Performance Evaluation Method for Existing Residential Building Stock

1
Department of Architecture, Roma Tre University, Via Ostiense, 133B, 00154 Rome, Italy
2
Innovation Lab, RIMOND, Via Giovanni da Castel Bolognese, 81, 00153 Rome, Italy
3
Buildings, Energy and Environment Research Group, Faculty of Engineering, University of Nottingham, University Park, Nottingham NG7 2RD, UK
*
Author to whom correspondence should be addressed.
Energies 2023, 16(9), 3930; https://doi.org/10.3390/en16093930
Submission received: 24 March 2023 / Revised: 28 April 2023 / Accepted: 3 May 2023 / Published: 6 May 2023
(This article belongs to the Section G: Energy and Buildings)

Abstract

:
Building a reliable energy model for old residential buildings with insufficient documentation and user assistance is a challenging and time-consuming task. Nevertheless, the ambitious European decarbonization targets require this building stock to be renovated, making energy assessment a key priority. In line with this goal, the following study explores a more simplified and automatic framework to generate a residential building energy model (BEM). The paper’s approach is based on the concept of urban building energy modelling (UBEM) archetypes or building prototypes and is customized according to the principles of dynamic simulations performed in the existing BEM software, Integrated Environmental Solutions Virtual Environment IES VE, and Solemma Open Studio. Therefore, based on three real starting inputs, a prototype database (DB) of assigned inputs is generated, i.e., an input matrix, using Google Maps as a geometry source. Other data are drawn from tabular DB. The proposed approach is evaluated by benchmarking the simulation results with precise models and monitoring the data that come from the Horizon2020 project REZBUILD. Nevertheless, a level of simplification is introduced that creates less accurate results for total or system-level energy consumption; this is compensated for using a set of simple calibration steps. The approach gives promising results for daily indoor temperature, making it a suitable indicator for evaluating further retrofitting alternatives.

Graphical Abstract

1. Introduction

The construction sector constitutes about one-third of the final energy consumption in Europe, with 62.8% of that being space heating, 15.1% for water heating, 20.6% for lightning and appliances (including cooking), and the rest for space cooling and other [1]. Renovating the existing building stock to a zero-carbon-ready level is a key priority for achieving the sector’s decarbonization targets for 2030 and 2050 in the Net Zero Emission Scenario [2,3]. However, “the retrofitting of buildings is a significant challenge since at least 40% of a building’s floor area in developed economies was built before 1980 when the first thermal regulations came into force” [4,5]. Therefore, the retrofit of building which existed prior to the 1980s is a necessary but demanding task.
A general retrofit process includes five phases: (i) project setup and pre-retrofit survey, (ii) performance assessment, (iii) identification of retrofitting options, (iv) site implementation and commissioning, and (v) validation and verification [6]. The first three steps clarify the feasibility studies and energy performance certificates (EPCs) that will be necessary before application permits and/or government funding benefits can be obtained [7]. The refurbishment laws and regulations might vary depending on the country, but the need for an energy assessment is constant. Therefore, a key point of the retrofit plan is choosing the most suitable mathematical model for an accurate energy assessment of the existing and refurbished building state [8,9].
Indeed, there is a wide spectrum of available methodologies for energy assessment of buildings. The existing methodologies can be divided into two main groups, bottom-up and top-down. The top-down methods are based on large public or national datasets and are mainly used for building stock analysis (e.g., energy benchmarking) [10]. The bottom-up approaches, on the other hand, consider the experience per building-level and are classified as white-, grey- and black-box modelling analysis. Compared to the grey- and black- models, the white-box approach is not data-driven, but it can provide a comprehensive understanding of building behaviour. Which methodology is more suitable is determined based on the analysis scope and data availability [11,12].
The white-box models (i.e., building energy models BEM) are physics-based models built on the principle of conservation of matter and energy. The concept follows five steps: (i) data collection and processing, (ii) model generation, (iii) simulation, (iv) calibration, and (v) application [13,14]. Therefore, the modelling complexity and accuracy vary according to the input data and the chosen simulation typology. Based on the conduced simulation type, the BEM can undergo a (static) quasi-static or more detailed dynamic simulation modelling (DSM). In the stationary methods, the calculation relating to each elementary interval is independent of the others, while in the dynamic methods, the calculation of an elementary interval considers the calculation results of the previous interval [15,16,17].
The latter provides detailed building energy balance analysis at a simulated timestamp every hour or less, so higher modelling complexity and more inputs are required. The BEM inputs, regardless of the typology, are grouped into (i) location, i.e., weather data, (ii) geometric data, and (iii) non-geometric data further branched into construction, loads, and system inputs [18]. However, the DSM is more demanding compared to the stationary model since it requires a series of dynamic parameters, such as hourly, weekly, and monthly profiles for ventilation, occupancy, and system operation. In fact, the range of needed inputs is the main drawback for DSM. Nevertheless, without a successful data acquisition and model generation, no further retrofit optioneering can be conducted [14,17,19,20].
The means of how and where the data are collected is based on the retrofit scale, while the overall feasibility, among other factors, is controlled by time and cost constraints. On building-level retrofits, the input parameters are usually gathered through multiple visual inspections, occupant surveys, and as-built document collection [6,21,22]. However, contrary to the new buildings, it is common to have an older building with insufficient or no documentation of its building state, or for it to be less feasible to perform detailed and complex inspections [23,24,25,26]. Therefore, the energy assessment of these buildings is often completed based on simplified inputs, default data, or reference tables from external sources [22,27,28]. However, this approach needs to be further controlled and validated to avoid certain modelling uncertainties that might affect the accuracy of the BEM simulations [29,30]. The data collection, and therefore the energy assessment completed on the district level, can be even more complex. Urban building energy modelling UBEM is a bottom-up physics-based approach that is the equivalent of a district-level approach for BEM generation of multiple buildings simultaneously. The concept follows the same assessment steps, beginning with data acquisition, but the collection of data for the UBEM simulations can be even more challenging since the analysis’s scope demands a higher input automatization and data availability [31].
A model generation concept inspired by the need for more automatic generation of models is the use of building prototypes of archetypes [32]. As is usually the case with UBEM, the building stock being considered is grouped into archetypes or buildings with similar attributes, such as the age of construction and typology. Therefore, once a typical building template is generated, it is extrapolated among the existing archetypes [14,33,34]. After the simulations, the models are validated with real, monitored data, and when necessary, a final calibration is performed. In this context, hourly climate data from either a typical meteorological TMY or an actual meteorological year AMY can be downloaded from open archives, such as EnergyPlus [13,35,36]. Then, the geometry is automatically extracted through geospatial data-based tools, such as GIS shapefiles, LiDAR, CityGML, and GeoJSON [37,38]. The non-geometric data is obtained from tabular input sources, building audits, public data, etc. [39]. Another alternative for non-geometric data collection is regulations, guidelines, and instructions that provide adequate modelling support by proposing predefined modelling inputs [40,41]. In fact, there are many existing BEM software options that provide their own input templates of building prototype models. However, even though there is a variety of prototype templates for non-residential buildings, the archive of the residential ones is not abundant or diverse. Therefore, it is not common to have access to an automatic generation of different residential building prototypes when conducting building-level BEM analysis [42,43,44].
In line with the need to follow an accurate but less-time consuming assessment path for building-level retrofits of old residential buildings that were built before the first appearance of thermal regulations (i.e., before 1980) [4], the following study explores a more simplified and automatic framework to generate residential BEMs. This paper’s approach keeps the DSM benefits but simplifies the collection of input data and model generation, following the concept of UBEM archetypes or building prototypes. The approach is customized according to the principles of dynamic simulation modelling performed in the Integrated Environmental Solutions, Virtual Environment IES VE and Solemma Climate Studio BEM software. In line with the other available BEM environments listed and compared in the review ([36], Table 1), IES VE is considered a trustworthy BEM software that provides an in-depth suite of integrated analysis tools to conduct various analyses of buildings’ energy demands and performance (including light, HVAC and loads, airflow, and energy and carbon analyses). It provides hourly and sub-hourly data and can be coupled with other systems [45]. Solemma, although it is relatively new BEM tool, also provides satisfactory advanced analyses of daylight, electric lighting, and conceptual thermals. It can provide hourly data and be coupled with other add-ins from the Rhino (Grasshopper) Environment [46].
By using the approach proposed in the following study, designers can perform a DSM analysis more quickly using IES VE and Solemma Climate Studio. Thus, this study contributes to the European ambition of supporting and driving renovation of the individual existing building units that were built before the 1980s. Hence, at this early stage of the analysis, the focus of this study is to understand the limitations of the considered, simplified DSM and to explore the potential of its development in a new, more reliable, and faster evaluation tool.
Accordingly, the paper tested the proposed approach in two residential buildings located in two different countries: Spain (built in the 1940s), and Italy (built in the 1960s). The chosen demo sites were previously studied as part of the Horizon 2020 project REZBUILD, where detailed designs and simulations were performed together with parallel monitoring on-site [47]. Hence, the existing detailed observations of the case studies were used as a reference to evaluate the margin of error of the proposed simplified approach. Based on the experience from REZBUILD, the model is defined as “accurate” when the difference in the energy consumption stays below 10%; for indoor temperatures, the proposed range is ±5 °C/day.
The study is documented in Section 2, which presents the steps taken to structure a typical archetype template or, as it is later called, input matrix; Section 3 describes the demo sites and their BEM simplifications; Section 4 describes the results of the comparative analysis between the data from the simulations completed in IES VE and Solemma and the REZBUILD Horizon 2020 outputs; finally, the significances of the outputs are interpreted and summarized in the Section 5.

2. DSM of Residential Prototypes

With the aim of bridging the comprehensive white-box dynamic simulation analysis and the generic concept of the UBEM archetype, the study explored a more automatic and simplified approach for input collection and BEM generation [14]. The purpose of the proposed approach is to: (i) reduce the assistance required by the user for BEM generation, (ii) automate the building-level BEM DSM procedure, (iii) reduce the time necessary for energy assessment with DSM, and (iv) evaluate the limits and potential of the proposed new assessment framework adequate for retrofit of old residential buildings.
The research was divided into two main steps, a data interoperability study and an energy assessment framework, as shown in Figure 1. The theoretical understanding of the input correlation supported the formation of the Residential Prototype Input Matrix used for the generation of the DSMs in IES VE and Solemma, which is discussed more in Section 2.2. As the two software programs have different simulation engines, Apache in IES VE and EnergyPlus in Solemma, each had its own limitations, hence certain modelling simplifications were considered for better alignment between the simulations.
The considered simplifications distinguishing the new approach from the standardized DSM methodology are:
  • Weather data
    • Use of typical meteorological year TMY instead of AMY.
  • Geometric data
    • Design of a simplified architectural model defined as a simplified LoD3 model based on the CityGML scale where the roof geometry is either simplified or considered as a flat surface. In the latter case, the roof insulation effect can be considered as additional insulation resistance, see Appendix C [48,49].
  • Non-geometric data
    • The building thermal bridges are neglected. It is expected that this simplification affects the results; however, the exclusion is made according to the software modelling limitations and the nature of the analysed sector. The method is applicable for the existing old residential buildings, whereas discussed [50] the incidence of thermal bridges is lower. A higher level of thermal insulation corresponds to a higher incidence of thermal bridges. Hence, in the case of old existing buildings with lower degree of insulation, the effect is reduced. Although the standards prohibit any type of simplification for thermal bridges in existing buildings, TB is not considered due to the very old nature of the buildings and margin of error. When the study extends to newer buildings, this will be adjusted.
    • The indoor temperature is considered to be uniformly distributed in the whole thermal zone [11].
    • The required air changes per hour ACH of natural ventilation is considered fixed.
    • The mechanical system for heating, cooling and ventilation are considered as an ideal air system, meaning that the system is acting as a sole component whose operation is regulated by minimalized input parameters [51].
The modelling path was chosen and applied based on the available data from two case studies that were conducted in Italy and Spain, and according to the simulation requirements of the two chosen software programs, IES VE and Solemma.

2.1. Data Interoperability

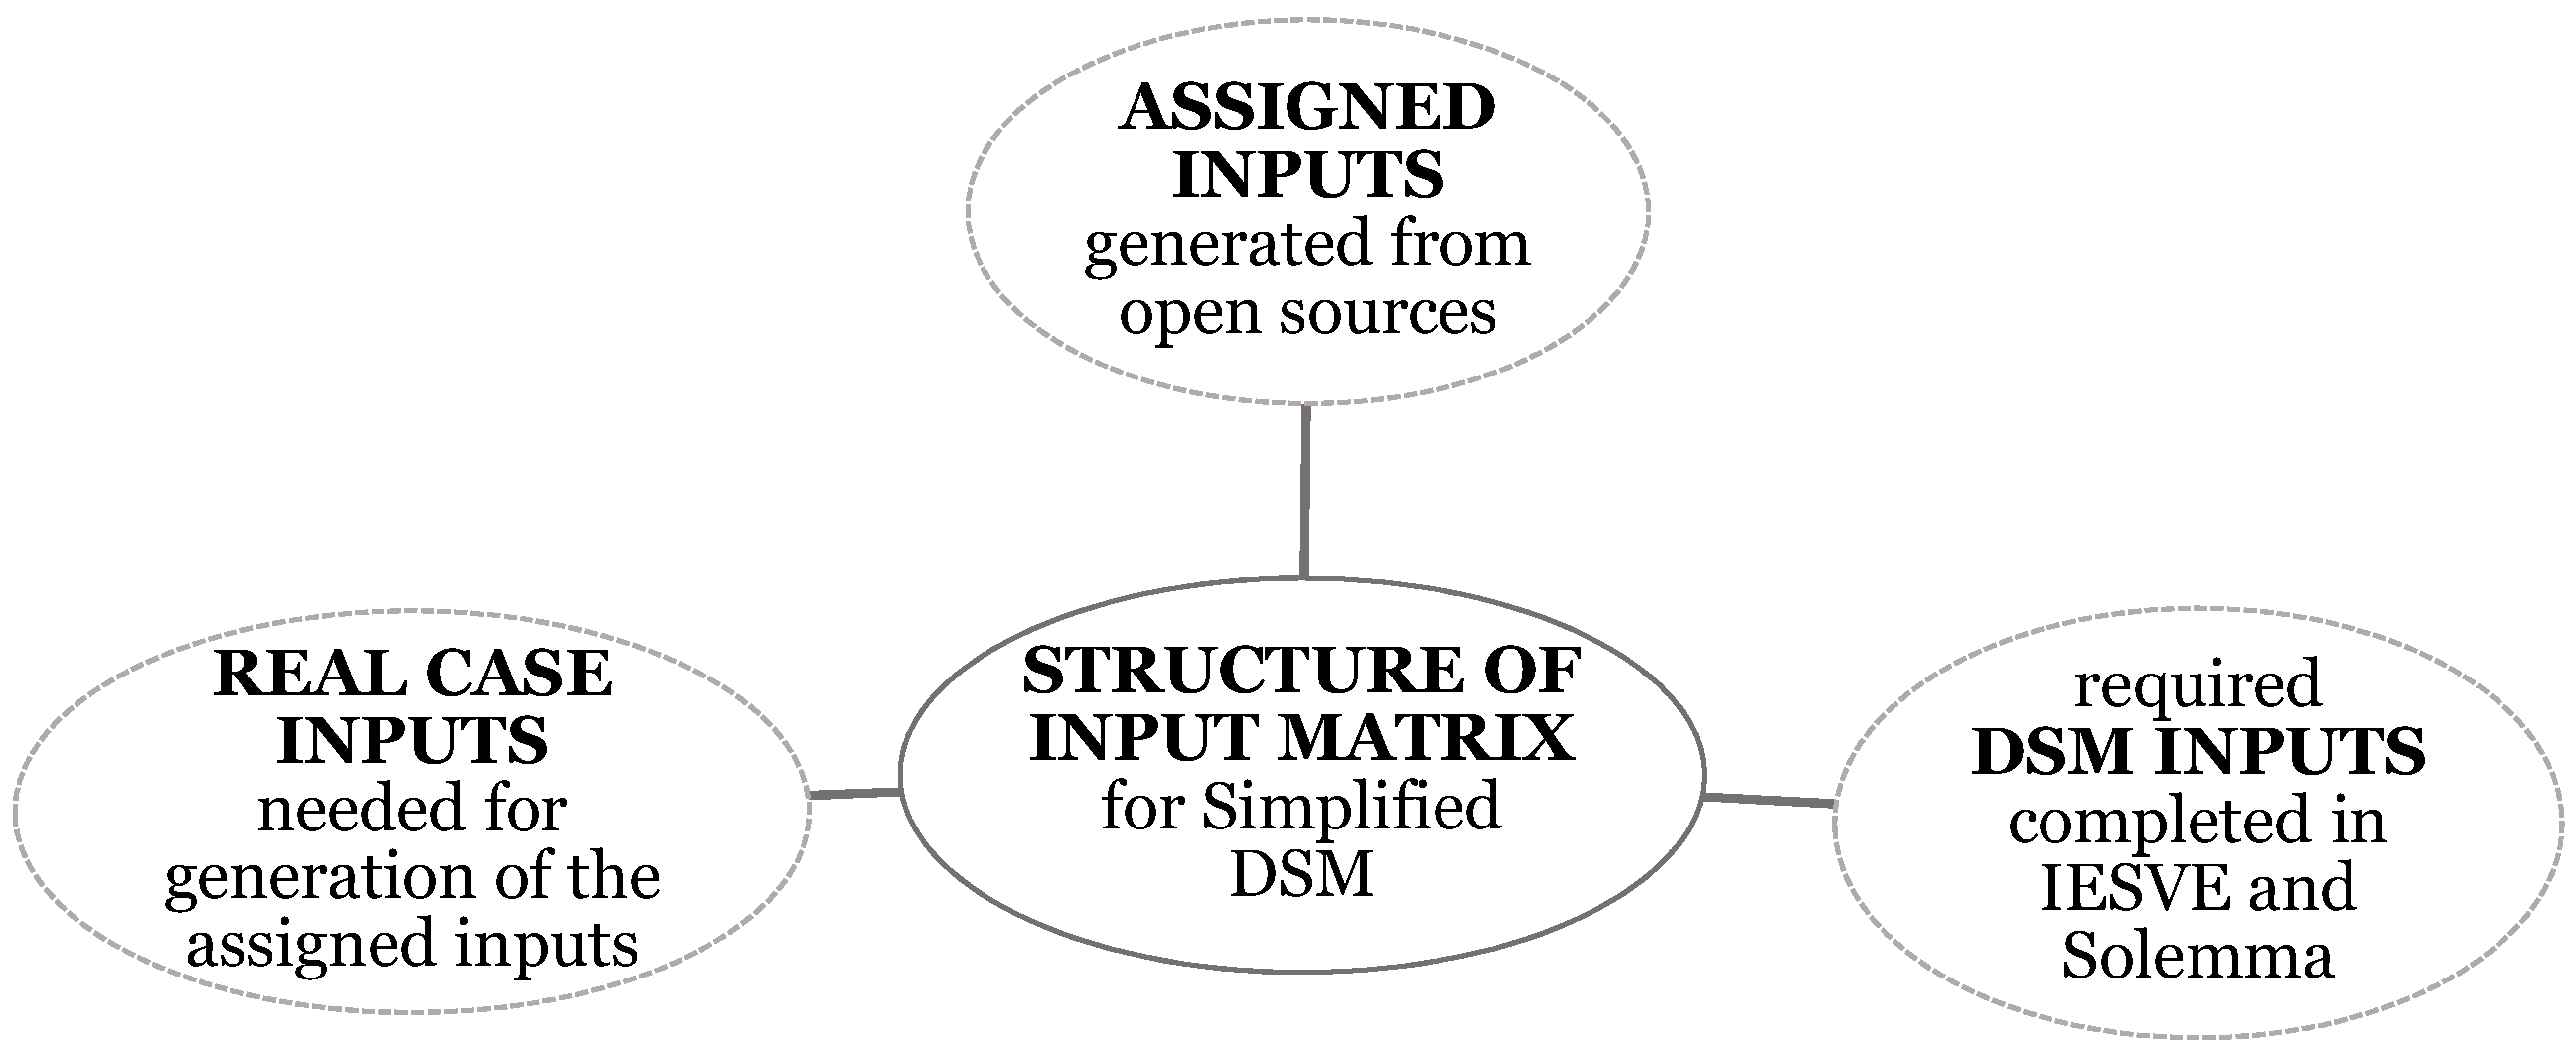
Research for this paper began with an interoperability analysis between the input data (Figure 2). The modelling inputs were grouped in three categories: (i) assigned inputs: the case study inputs that can be obtained through open sources/tools; (ii) real case inputs: the inputs needed from the case study for the generation of assigned inputs; and (iii) DSM inputs: the inputs needed to perform the DSM analysis. Based on the limits from each group, the final input database was ultimately referred to as an input matrix.
To better understand the correlation of the inputs, the main input database (or the input matrix, as it was called) was divided into two separate DBs: a DB of real case inputs and a generated DB that contained the inputs assigned to the prototype (Table 1). The minimum number of inputs, i.e., the real case inputs, that needed to be collected from the building was reduced to three: the location, year of construction, and typology. In terms of the location, the studied database was limited to the locations of the two case studies, Italy and Spain. Regarding the year of construction, the formulated DB covered the old residential buildings constructed in the period between 1900 and 1980. Finally, based on the typology, the analysed DB included residential case studies of several types: single (detached) house SFH, terraced house TH, multi-family house MFH, and apartment blocks AB. On the other hand, the generated DB was fed by the weather data, geometric data, and non-geometric data of construction, loads, and systems.
Consequently, the weather data and geometric data were generated if the location was known. The generation of the construction data was based on the location and year of construction while the load data required only a known building’s typology. The systems profile was more complex in this sense, as its generation required a known location, year of construction, and typology.

2.2. Residential Prototype Input Matrix

Table 2 reports the generated DB categories and subcategories together with the generation source. Five types of generation sources were used. For the generation of the weather data, the online TMY archives, such as (i) OpenBuilding and EnergyPlus, were used. Then, the geometric data were generated through a geospatial data extraction (ii) Google Maps. The system properties came from the (iii) REZBUILD studies and (iv) Tabula, while the latter was also used as a source for the generation of the construction properties. Finally, the (v) BS ISO, UNI EN, CEN EN, and ASHRAE available technical normative properties defined the building loads and other parameters that were related to the system set conditions and operating profiles.

2.2.1. Geometric Data

The geometrical boundary conditions were defended through visual Google Maps Street View observation and subsequent proportional measuring, shown in Figure 3. With this “simple measuring tool” the building plans and elevations were easily obtained, and the architectural model was built using this information. Other information deduced from Google Maps included the dimensions and position of the building components (windows, doors, shadings, etc.). The building position boundaries, such as existing adjacent buildings and surrounding shadings, were also considered. The last data extracted from Google Maps were the orientation of the building.
The chosen software for the architectural modelling was Autodesk Revit. The components were modelled as generic entities without combining materials or defining thicknesses. The architectural model was built without consideration of the indoor space distribution. In other words, each demo site was represented as a whole thermal zone. In the case of multiple floors, each floor was represented as an individual thermal zone. Based on the BEM software’s geometrical sensitivity, certain geometrical simplifications were also introduced. One simplification referred to the complex pitched roof geometry, which was simplified into a flat roof, while the effect of the removed unheated space was included in the thermal resistance input of the roof.
Finally, once modelled, the geometry was imported to the two different BEM environments. The transit from Revit to IES VE was completed based on the BIM to BEM concept: a .gbXML file exported from Revit was imported to IES VE. The procedure for Solemma was slightly different. Since this software is a plug-in to Rhino, the geometry transfer from Revit to Rhino was enabled through a second plug-in called Rhino.Inside.Revit.

2.2.2. Non-Geometric Data Collection

Tabula

The building taxonomy of the analysed demo sites was obtained from the TABULA WebTool [39], a reliable source developed within the framework of the Energy Projects TABULA [52] and EPISCOPE [53]. Based on the real case inputs, i.e., the year of construction, location, and the building typology, the correct building Tabula category was chosen, and consequently, the stratigraphy and the adequate thermal transmittance for each building component was extracted. Another package extracted from Tabula was the mechanical system, containing the COP and typology of the system for heating, ventilation, and cooling, and DHW.

Building Standards

The building standards, including the building loads and other parameters (i.e., the thermal zone set point values and operating profiles), are drawn from several sources:
  • BS ISO 17772-1:2007 Energy performance of buildings. Indoor environmental input parameters for the design and assessment of energy performance of buildings [41]
  • UNI 10339:1995 Impianti aeraulici al fine di benessere. Generalità, classificazione e requisiti. Regole per la richiesta d’offerta, l’offerta, l’ordine e la fornitura [54]
  • UNI EN 13203-2:2015 Apparecchi a gas domestici per la produzione di acqua calda—Parte 2: Valutazione del consumo di energia [55]
  • CEN EN 15316-3-1:2007 (Later replaced with EN 12831-3:2017—Energy performance of buildings—Method for calculation of the design heat load—Part 3: Domestic hot water systems heat load and characterization of needs, Module M8-2, M8-3)) Energy performance of buildings—Method for calculation of system energy requirements and system efficiencies—Part 3: Space distribution systems (DHW, heating and cooling) [56]
  • ANSI/ASHRAE/ISE Addendum to ANSI/ASHRAE/IES Standard 90.1—2019 [57]
  • ASHRAE: Handbook of Fundamentals. American Society of Heating, Refrigerating and Air-Conditioning Engineers, Atlanta [40].

2.3. Conducted Analysis

For more comprehensive understanding of the reliability and the limits of this approach, the BEM analysis were divided into two categories:
  • Passive Design Analysis
    • BEM dynamic simulations without a present mechanical system
  • Active Design Analysis
    • BEM dynamic simulations with mechanical systems based on tabular inputs
    • BEM dynamic simulations with calibrated heating system
The accuracy of the approach was evaluated based on the daily indoor temperature variation, annual energy balance flow, and the annual energy consumption, both total and distributed per system. The analysis framework is summarized in Figure 4.

3. Demo Site Description

The proposed method was structured and assessed on two demo sites. As previously stated, the chosen demo sites come from the Horizon2020 Project REZBUILD. The REZBUILD project contributed to the Net Zero Energy Building (NZEB) targets by introducing an innovative and collaborative refurbishment ecosystem: “Rezbuild promoted innovation in the building sector with the integration of technologies to achieve the goal of an annual renovation rate of 2.5%, up from the current rate of less than 1%, a 60% reduction in primary energy consumption, as well as a 30% reduction in installation time invested, compared to traditional renovations.” [47].
Therefore, the data needed to test the proposed simplified BEM method came from the REZBUILD framework: (i) monitoring data collected by the sensors in the reference demo sites installed during the REZBUILD project and (ii) simulation results from the detailed BEM models completed in IES VE. The monitoring data was organized in two phases: pre-intervention monitoring and post-intervention monitoring processed through an IoT platform built on cutting-edge technologies “Maetrics”, used within the REZBUILD consortium [58].
The usage of monitoring data was crucial. Due to the availability of the data sets, it was possible to understand the indoor temperature trend in both analysed scenarios: in the passive case (heating system off) and in the active case (heating system on). This clarified the efficiency of the envelope seal and consequently, the efficiency of the heating system. Moreover, due to the existing monitoring data, the models could be corrected, which supported a more accurate estimation and evaluation of energy performance by the predictive energy models. The publication of energy bill data, made more accessible by modern meter instruments, could also be considered as an excellent source of data that could refine the models.
The demo sites being studied in REZBUILD are three residential buildings in different climatic conditions, envelopes, and construction periods and are located in Spain, Italy, and Norway, respectively. This paper omits the third demo site, the one in Oslo, from its analysis. In the subsequent phases of study, as these analyses are deepened further, the objective is to include all possible cases and extend the framework.

3.1. Demo Site Madrid, Spain

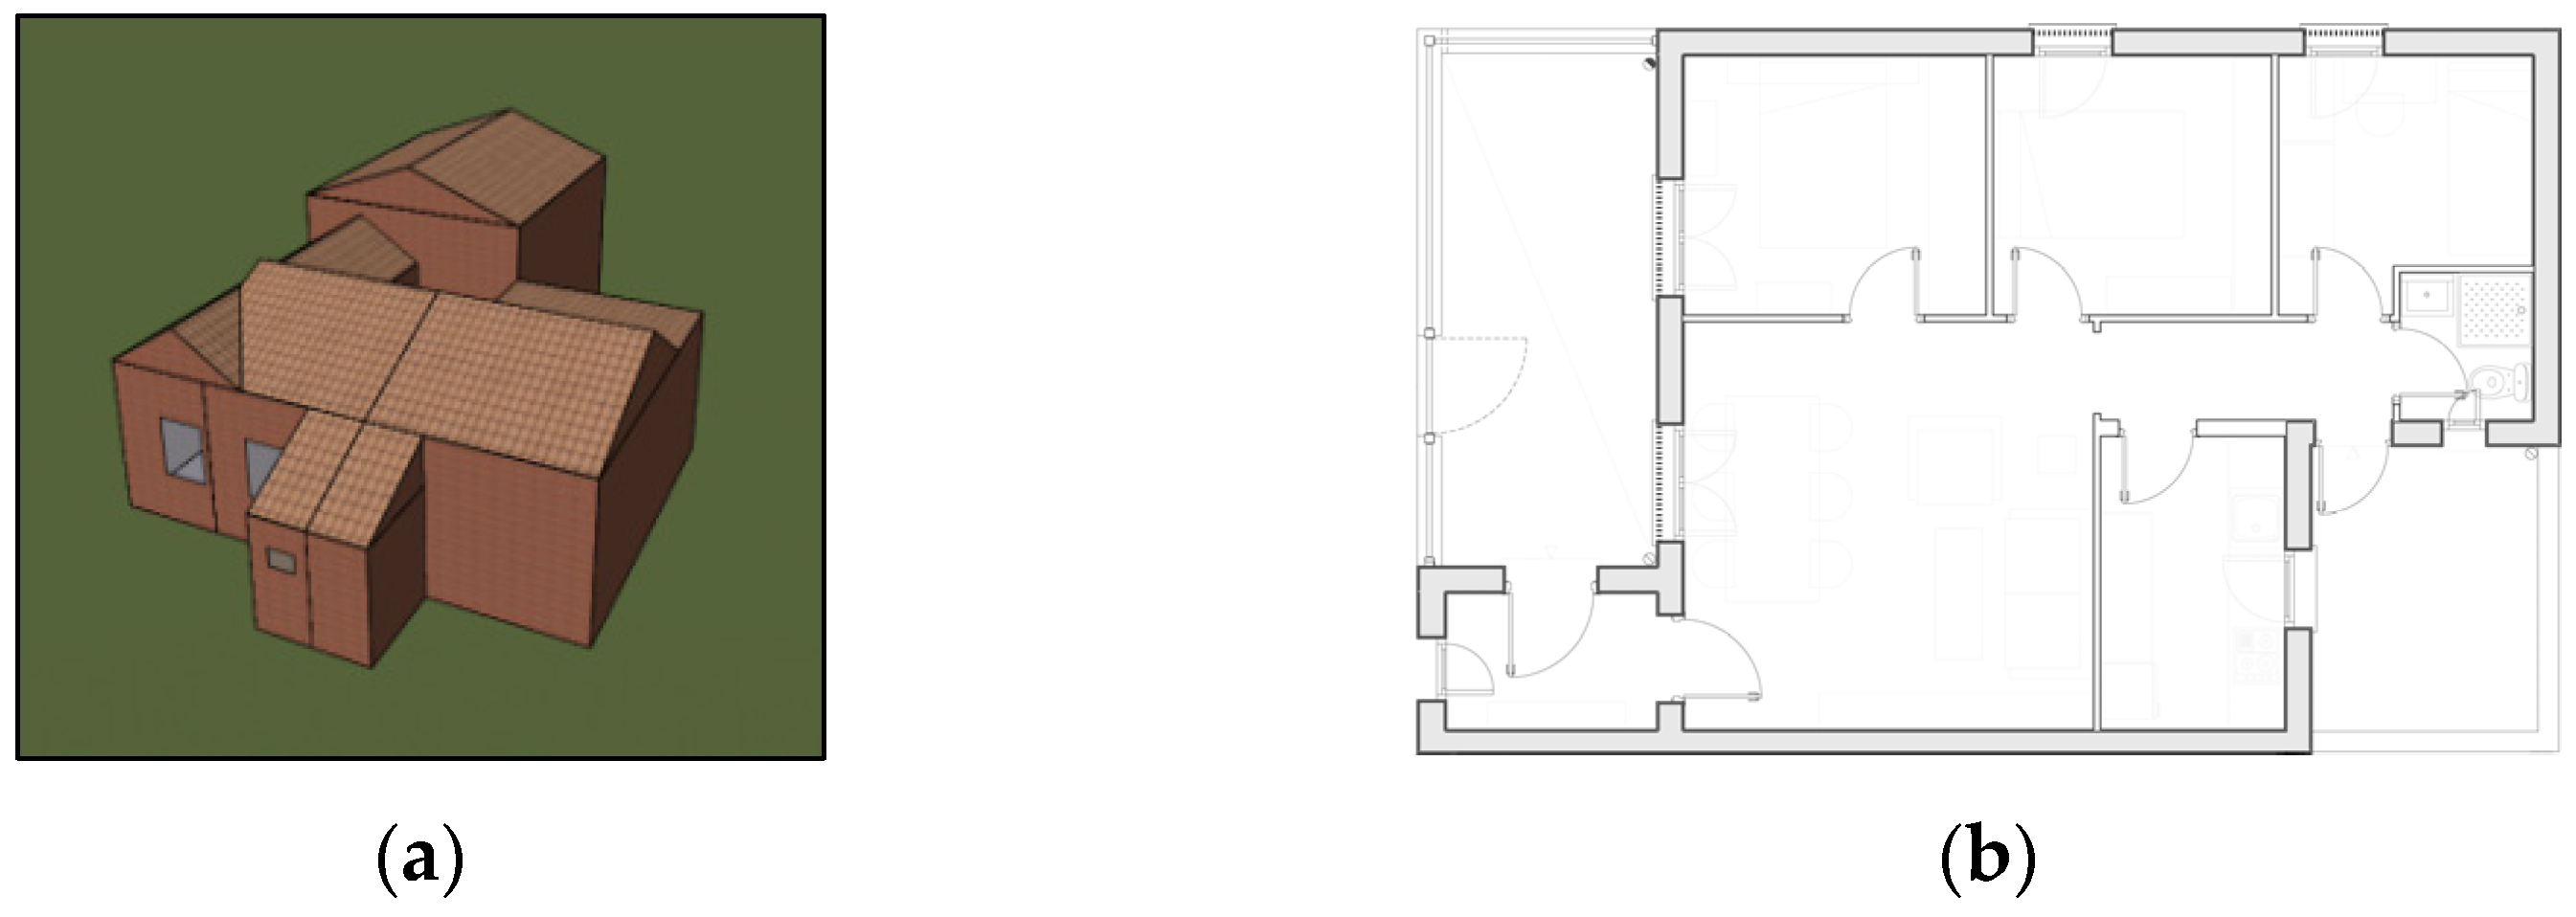
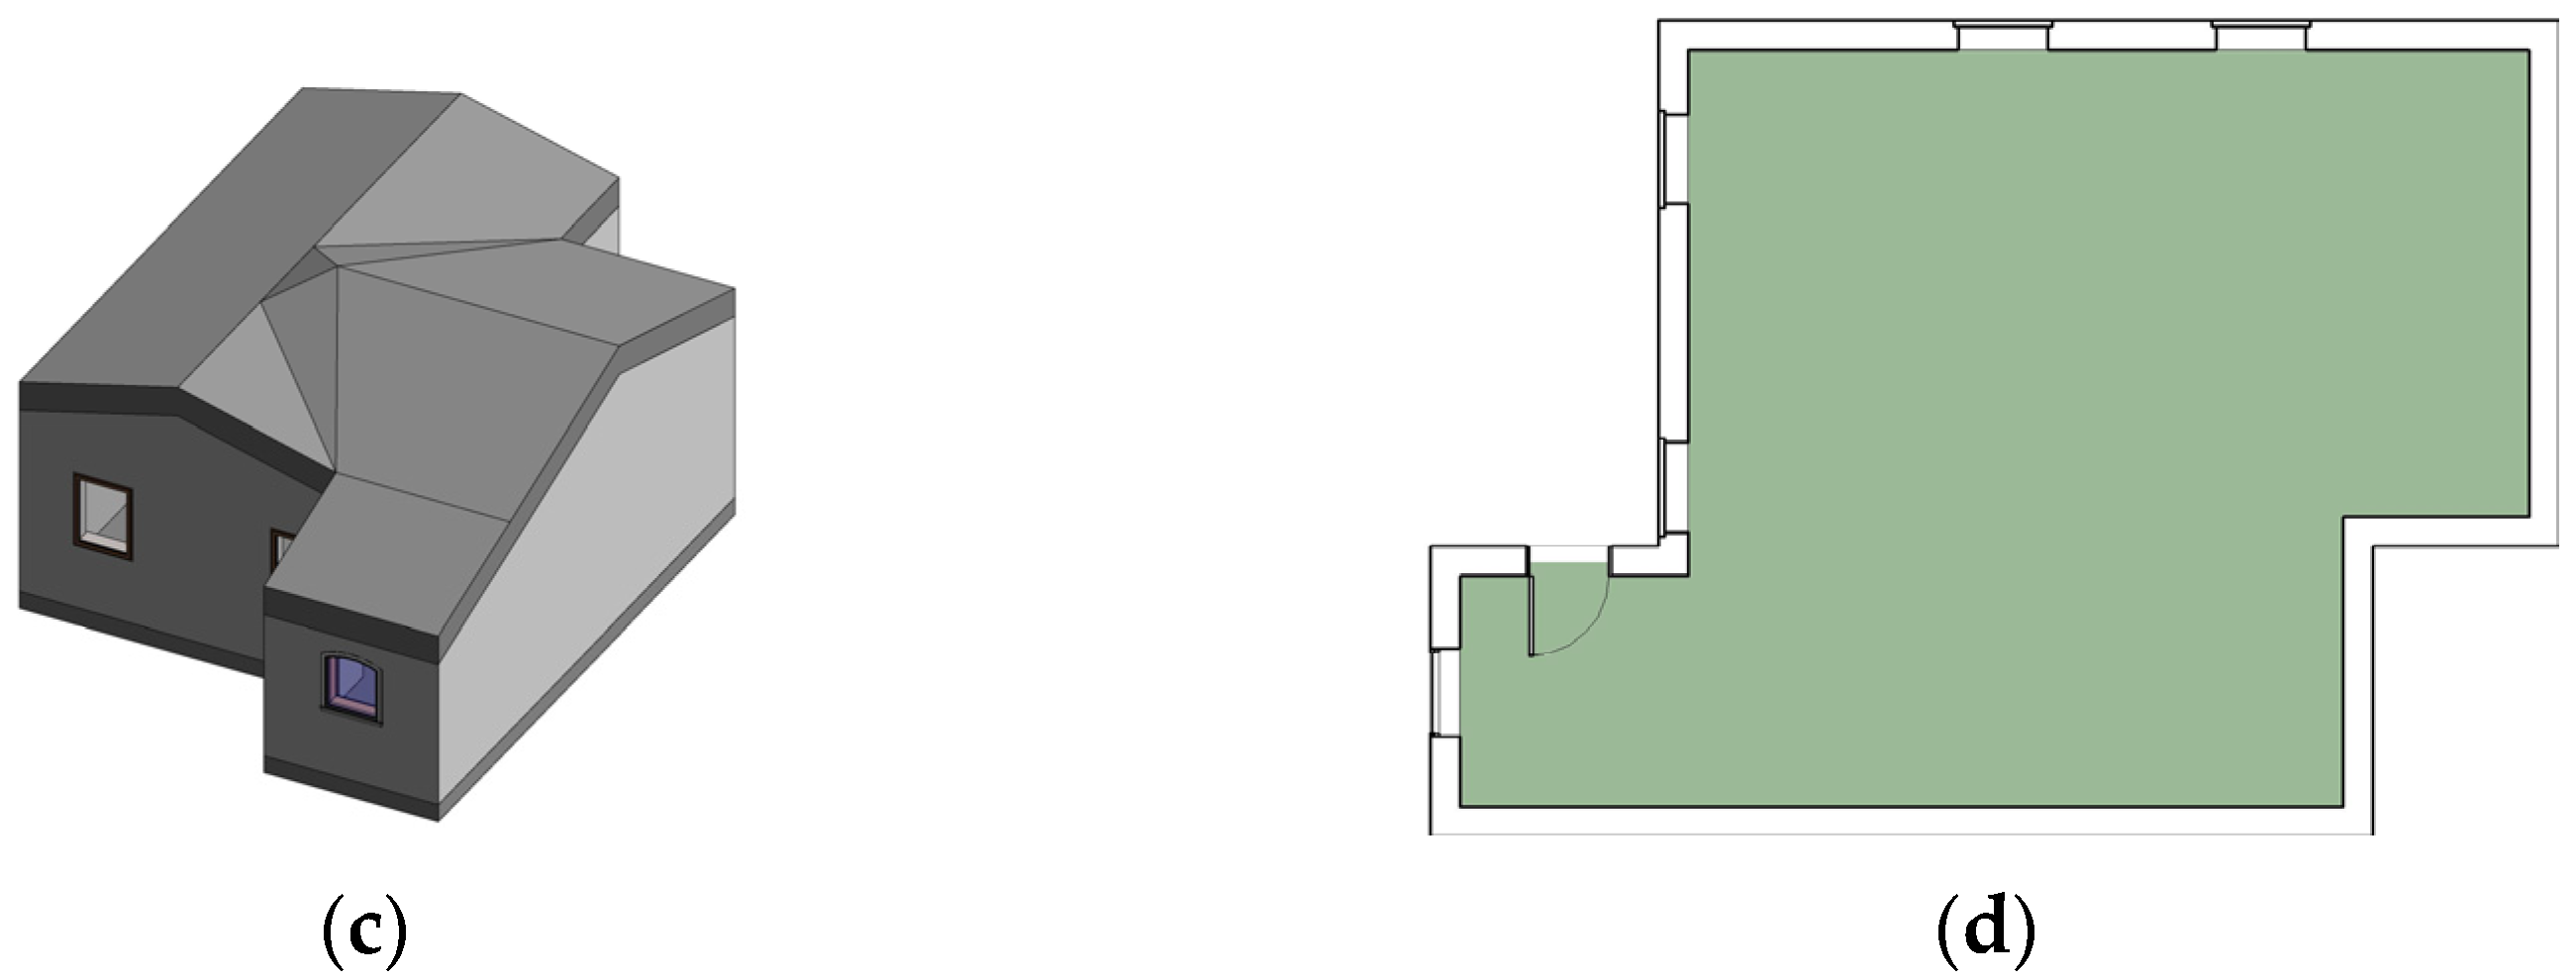
The demo site in Madrid, Spain, is a semi-detached house (multi-family house) typology, representing typical single familiar dwellings in the Madrid community (Figure 5). The building is located in a district in Madrid City, which is an area with a high degree of urban poverty. This dwelling is near the end of its lifecycle and is not insulated. It has a main layer of solid bricks and old metal frame single glazing. The year of construction is 1940.

3.2. Demo Site Martellago, Italy

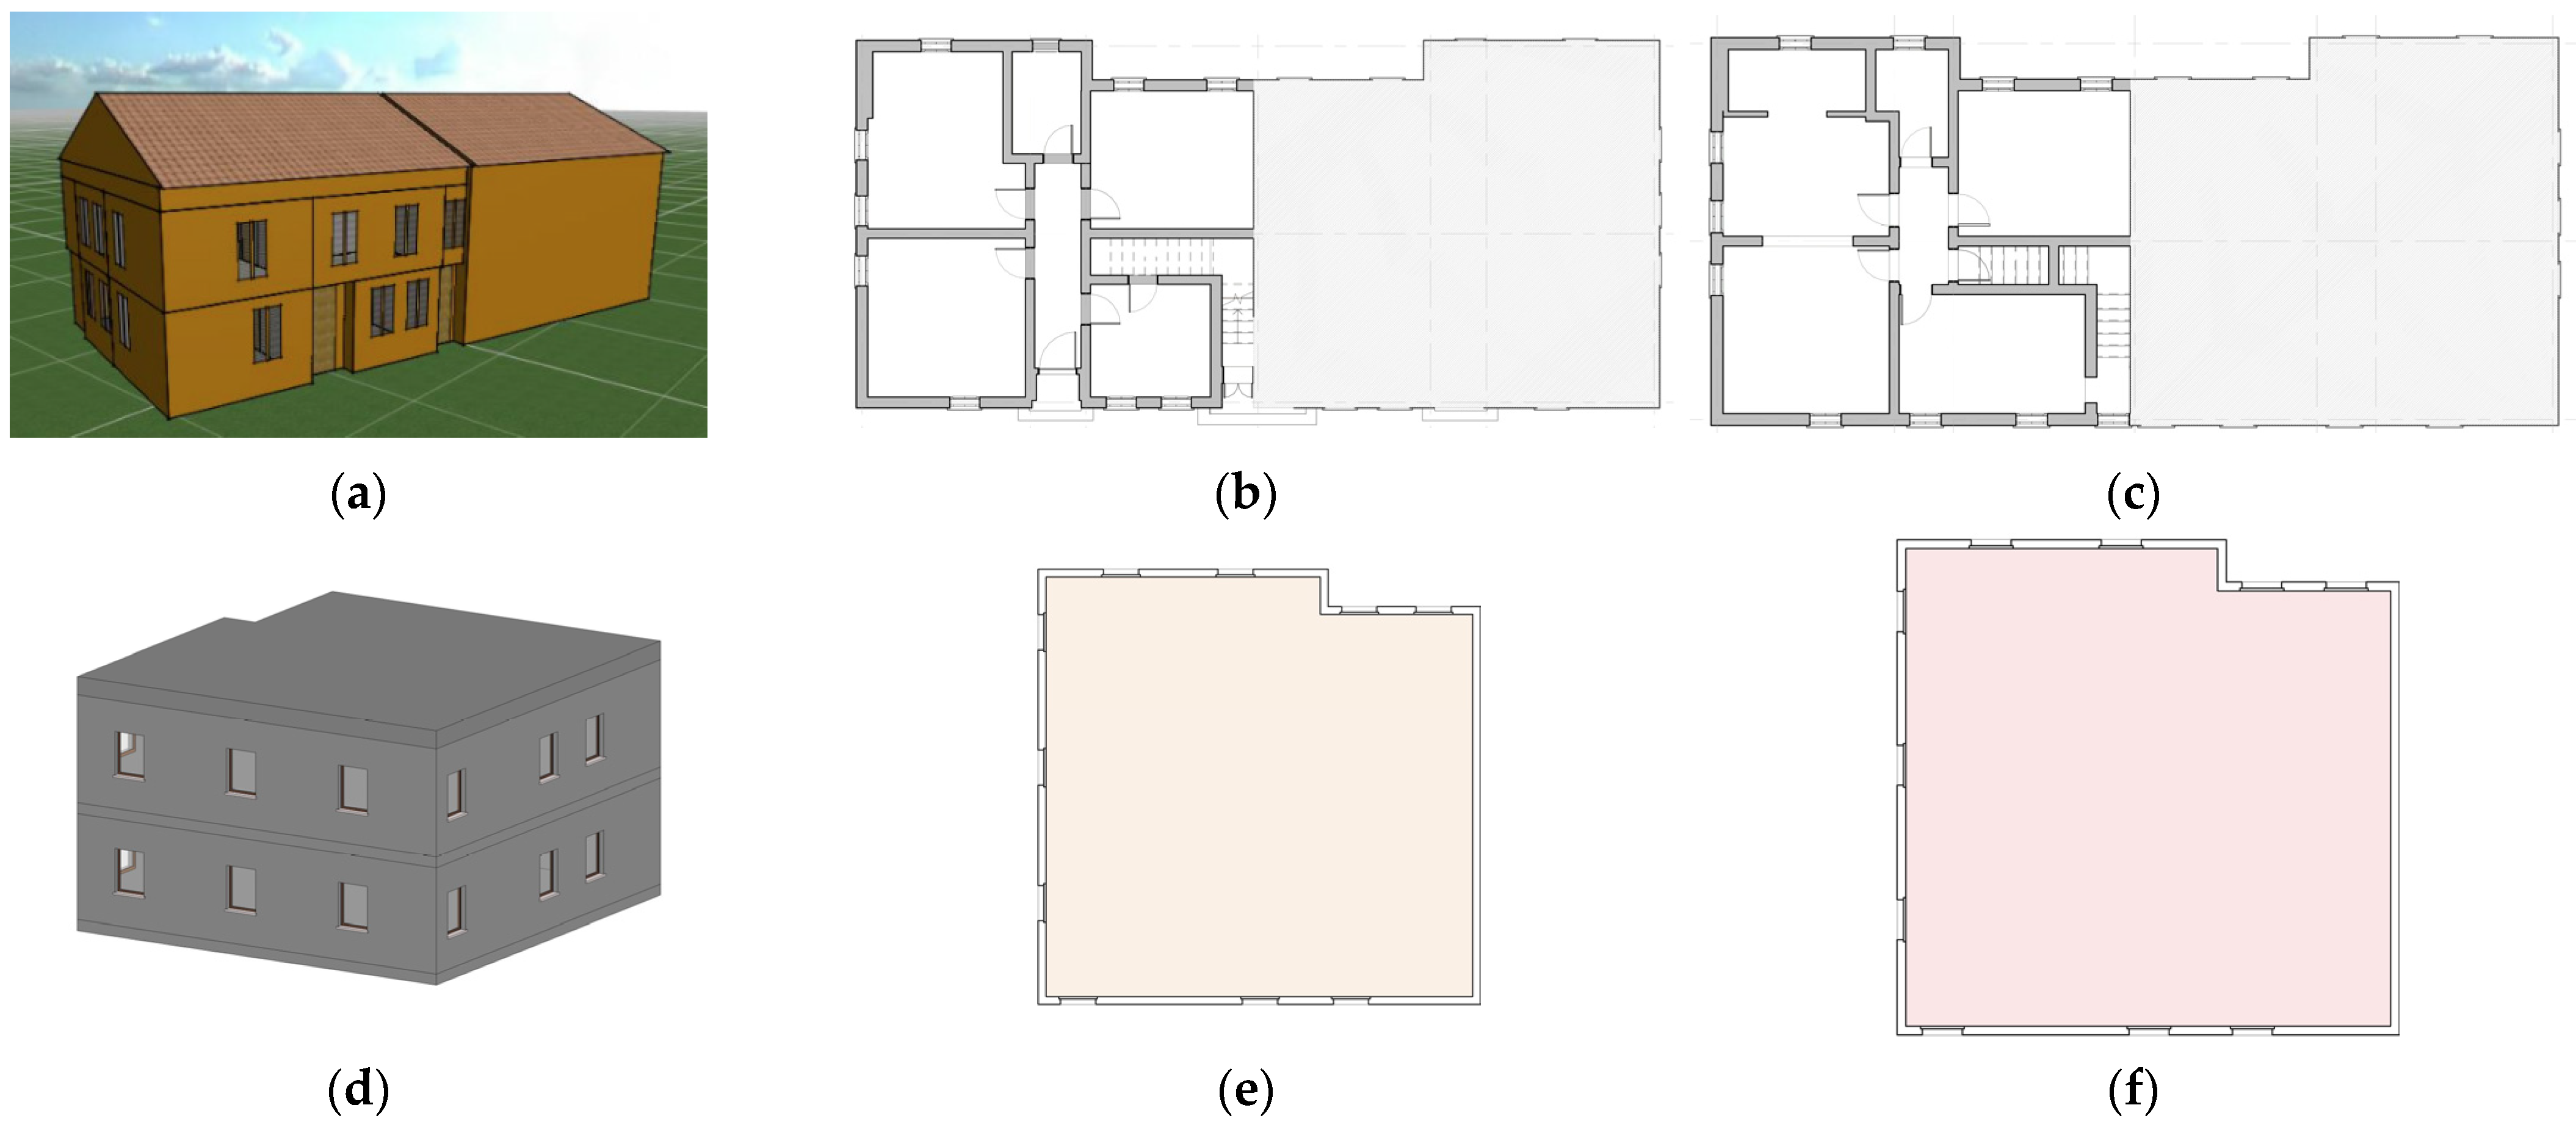
The demo site in Martellago, Italy, is an apartment block of social housing typology. It is located in the inland town of Martellago, located in Venice, and benefits from a mild climate (Figure 6). Based on the available documentation, the year of construction is estimated to be between 1960 and 1970. The demo has no buildings surrounding it. The dwelling is in the original status of construction with a structure of load-bearing masonry built from solid bricks without any insulation layer.
The generated input matrix for each demo together with a comparison between the detailed (REZBUILD) and simplified models can be found in the Appendix A and Appendix B.

4. Results

4.1. Approach Accuracy—Passive Design

This section is dedicated to the first phase of the BEM analysis—Passive Design without the presence of the mechanical systems. The accuracy of this approach was evaluated through comparing the indoor temperature data from the simulations with the on-site monitoring, and the alignment between the models in IES VE and Solemma was determined considering the energy balance and indoor temperature.

4.1.1. Temperature Deviation

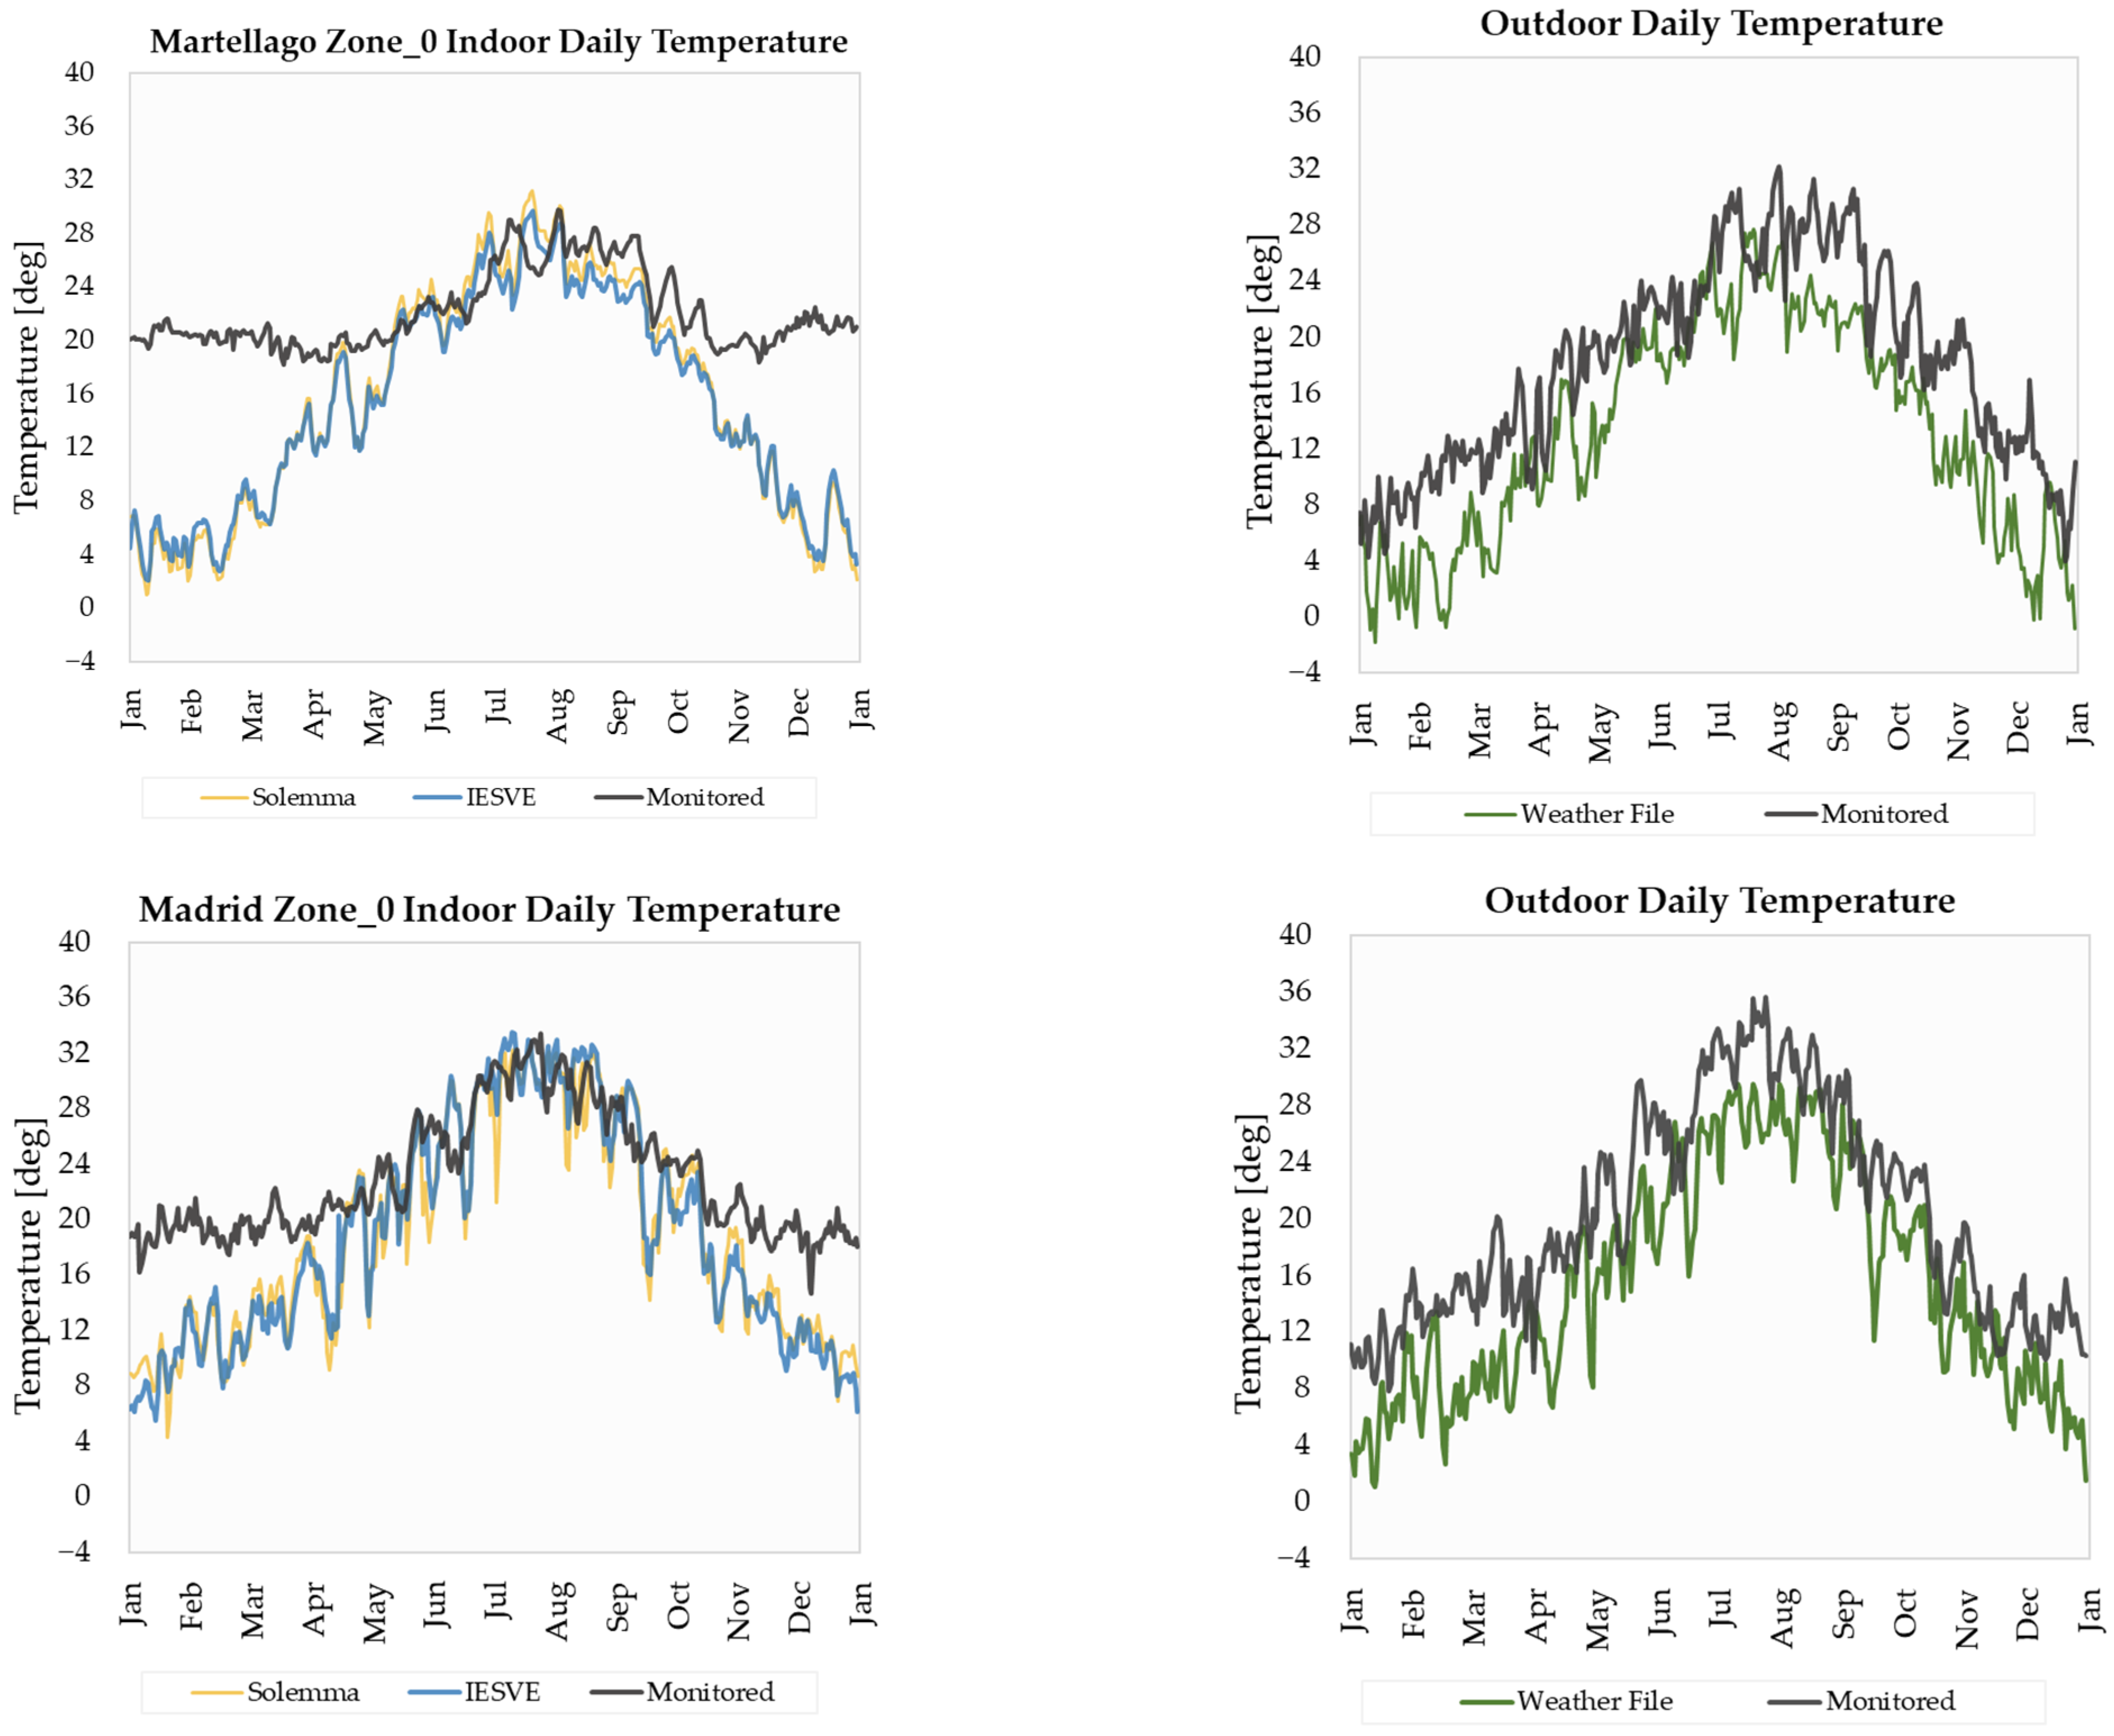
Both temperature variations, the daily average indoor temperature per zone and the outdoor temperature per location, were analysed, as seen in Figure 7. Since the plotted simulations run without an active mechanical system, the indoor temperature variation in the BEMs is affected only by the inputs and the software calculation methods. Moreover, for a realistic comparison with the monitoring data (which includes the months with active heating), the validation period is limited to the off-heating season months, from May to October. The insights from this shot analysis are:
  • From October to May, the simulated daily indoor temperatures overlapped.
  • From May to October, the simulated indoor temperature deviated from the monitoring but in an acceptable range.
  • In terms of the outdoor air temperature, the temperature from the typical meteorological year TMY file is always below the monitored, actual AMY one.
Figure 8 proposes a more quantitative understanding of the spotted temperature deviation during the warmer months. The deviation between the daily temperatures from the simulations and the ones obtained from the monitoring was reported in the range of 1–4.5 °C.

4.1.2. Energy Balance

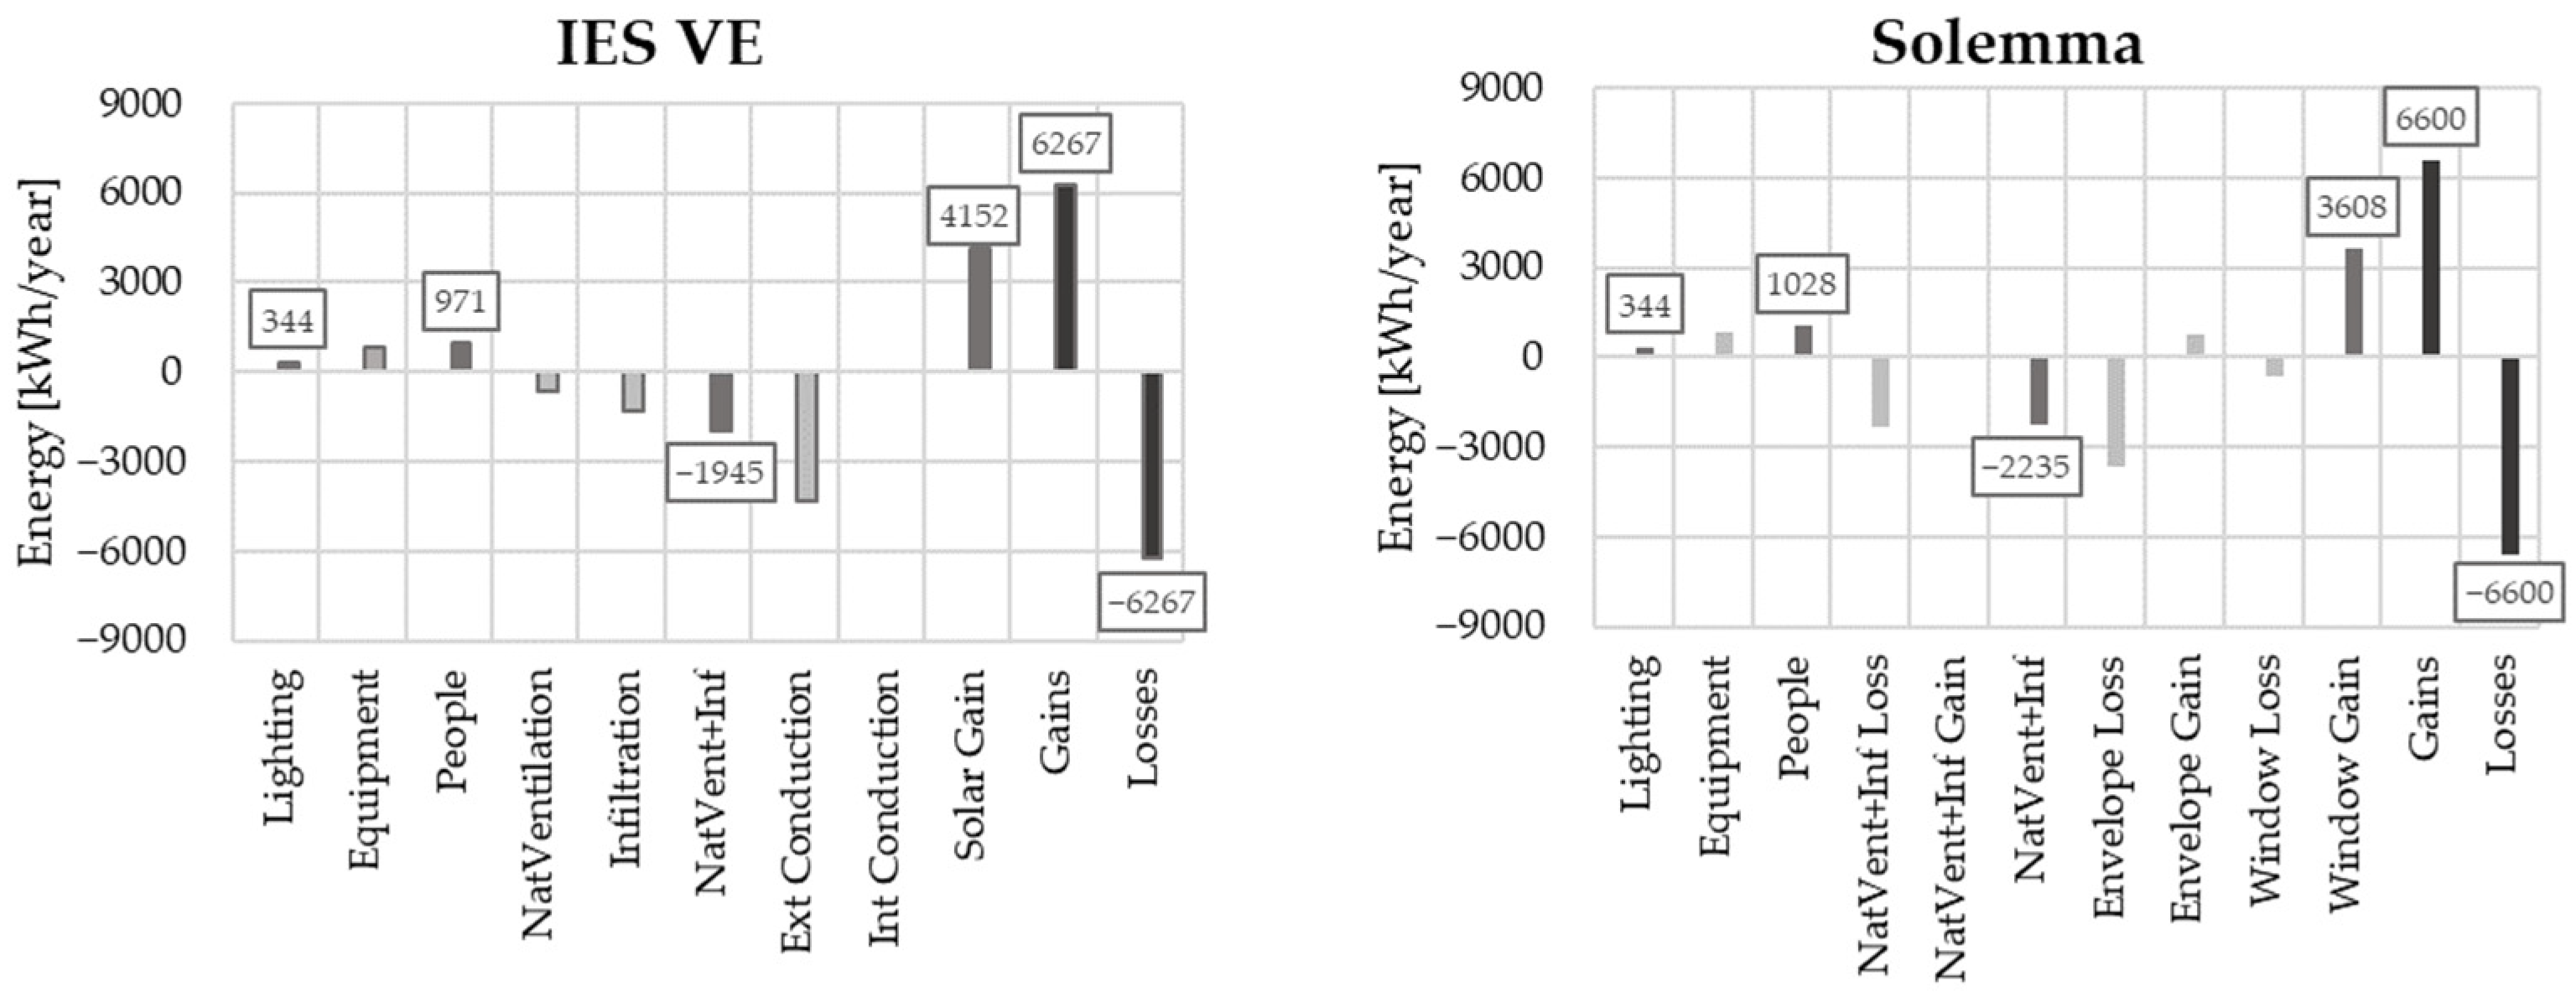
The two software programs, IES VE and Solemma, categorized the energy flow differently. IES VE distinguished gains from lighting, equipment, people, natural ventilation, infiltration, solar gains, external, and internal conduction losses while Solemma grouped the flows into gains/losses of lighting, people, equipment, envelope, windows, and infiltration. To perform a more appropriate comparison between the two simulations, the infiltration ACH in Solemma was fixed as the sum of the needed ACH for natural ventilation and infiltration.
As reported in Figure 9, the two software programs were aligned in terms of lighting, people, natural ventilation, and infiltration. A slight difference was noted, but it was considered to be acceptable. Then, IES VE classified the type of energy as conduction flow and solar gains through the whole envelope (opaque + transparent elements). Contrary to this, Solemma categorized the flow per element type, envelope flow (opaque elements), and window flow (transparent elements), combining the conduction and solar energy. Therefore, a more detailed comparison of the two models could not be provided. However, as the plots show, the overall annual gain and loss from the two simulations stayed in the same range of around 6000 kWh/year.

4.2. Approach Accuracy—Active Design

This section is dedicated to the second phase of the research, Active Design; it also includes the simulation of the mechanical systems. The accuracy of this approach was evaluated through comparing the energy consumption and indoor temperature data obtained from the simulations and the on-site monitoring.

4.2.1. Energy Consumption Deviation

Table 3 presents the annual consumption of the Madrid case study using data from the two software programs, Solemma and IESVE, together with the monitoring data collected from the sensors placed on-site.
In terms of the total energy consumption, the model in IES VE consumed almost two times more energy than the monitored one, while the model in Solemma deviated less, around 3500 kWh/year or +27.6% more compared to the monitoring. Regarding the distribution of the total energy consumption from the two simulations, the results of lighting, equipment, and DHW system consumption were slightly different (max difference of 12% for the DHW system); however, there was a large difference in the amount of energy consumed by the two heating systems. The IES VE model consumed 21,510 kWh/year while Solemma’s was 13,170 kWh/year, which is a difference of 8340 kWh/year.

4.2.2. Heating System Calibration

Although the two heating systems were modelled as ideal electrical systems with a COP equal to 1, the energy consumed differed. To understand the meaning of the noted deviation, a series of experimental trials were performed.
As Table 4 states, the heating system in IES VE was considered a referent point with a fixed COP value of 1, while Solemma’s heating system COP varied between 1 and 0.6. The last iteration with a COP value of 0.6 aligned the heating electricity consumption to the one received in IES VE. The difference in terms of heating lowered to 2%, and for the total energy consumption, this difference decreased further, to only 1%.
Figure 10 reports the indoor temperature variation for the two case studies, with and without a calibrated heating season. Therefore, for the Martellago case study, the daily indoor temperature, without the calibration included, is kept at 20 °C from November to March (heating on), between 12 and 22 °C during Oct, April, and May (heating off, mid-season months) and between 18 and 32 °C from June to September (summer months). The calibration of the heating season was therefore only changed in terms of the daily temperature during the mid-season months by keeping it above 20 °C. A similar situation occurred for the Madrid case study, where the daily indoor temperature without the calibration was kept at 20 °C from November to March (heating on), between 12 and 28 °C during Oct, April, and May (heating off, mid-season months) and between 14 and 33 °C during summer months, from June to September. After the calibration, the daily temperature in the mid-season months stayed between 20 and 28 °C.
The considered heating season, before the calibration shown in Figure 10a, was from the 15 of October to the 15 of April for Madrid and from the 22 of October to the 7 of April for Italy. The heating season was decided following the country’s rules; however, based on the temperature variation, the chosen heating season was not adequate for the studied cases. An important deviation was noted during the mid-season months of April, May, and October. The simulated daily temperatures from the two software programs, were lower than the monitored temperatures, highlighting that the heating systems were used during these months. Figure 10b represents the daily indoor temperature variation of the models with the calibrated heating season. The calibration was completed based on the monitoring data, the new heating season lasted from 1 of October to 31 of May and had a tabularized set point of 20 °C. As the graphs show, after the calibration was performed, the mid-season temperature divergence was resolved as expected, so the energy consumed for heating and, consequently, the overall energy consumption increased and made the difference between the model and the monitoring data even higher (Solemma output: +4.6% Madrid, +7.7% Martellago).
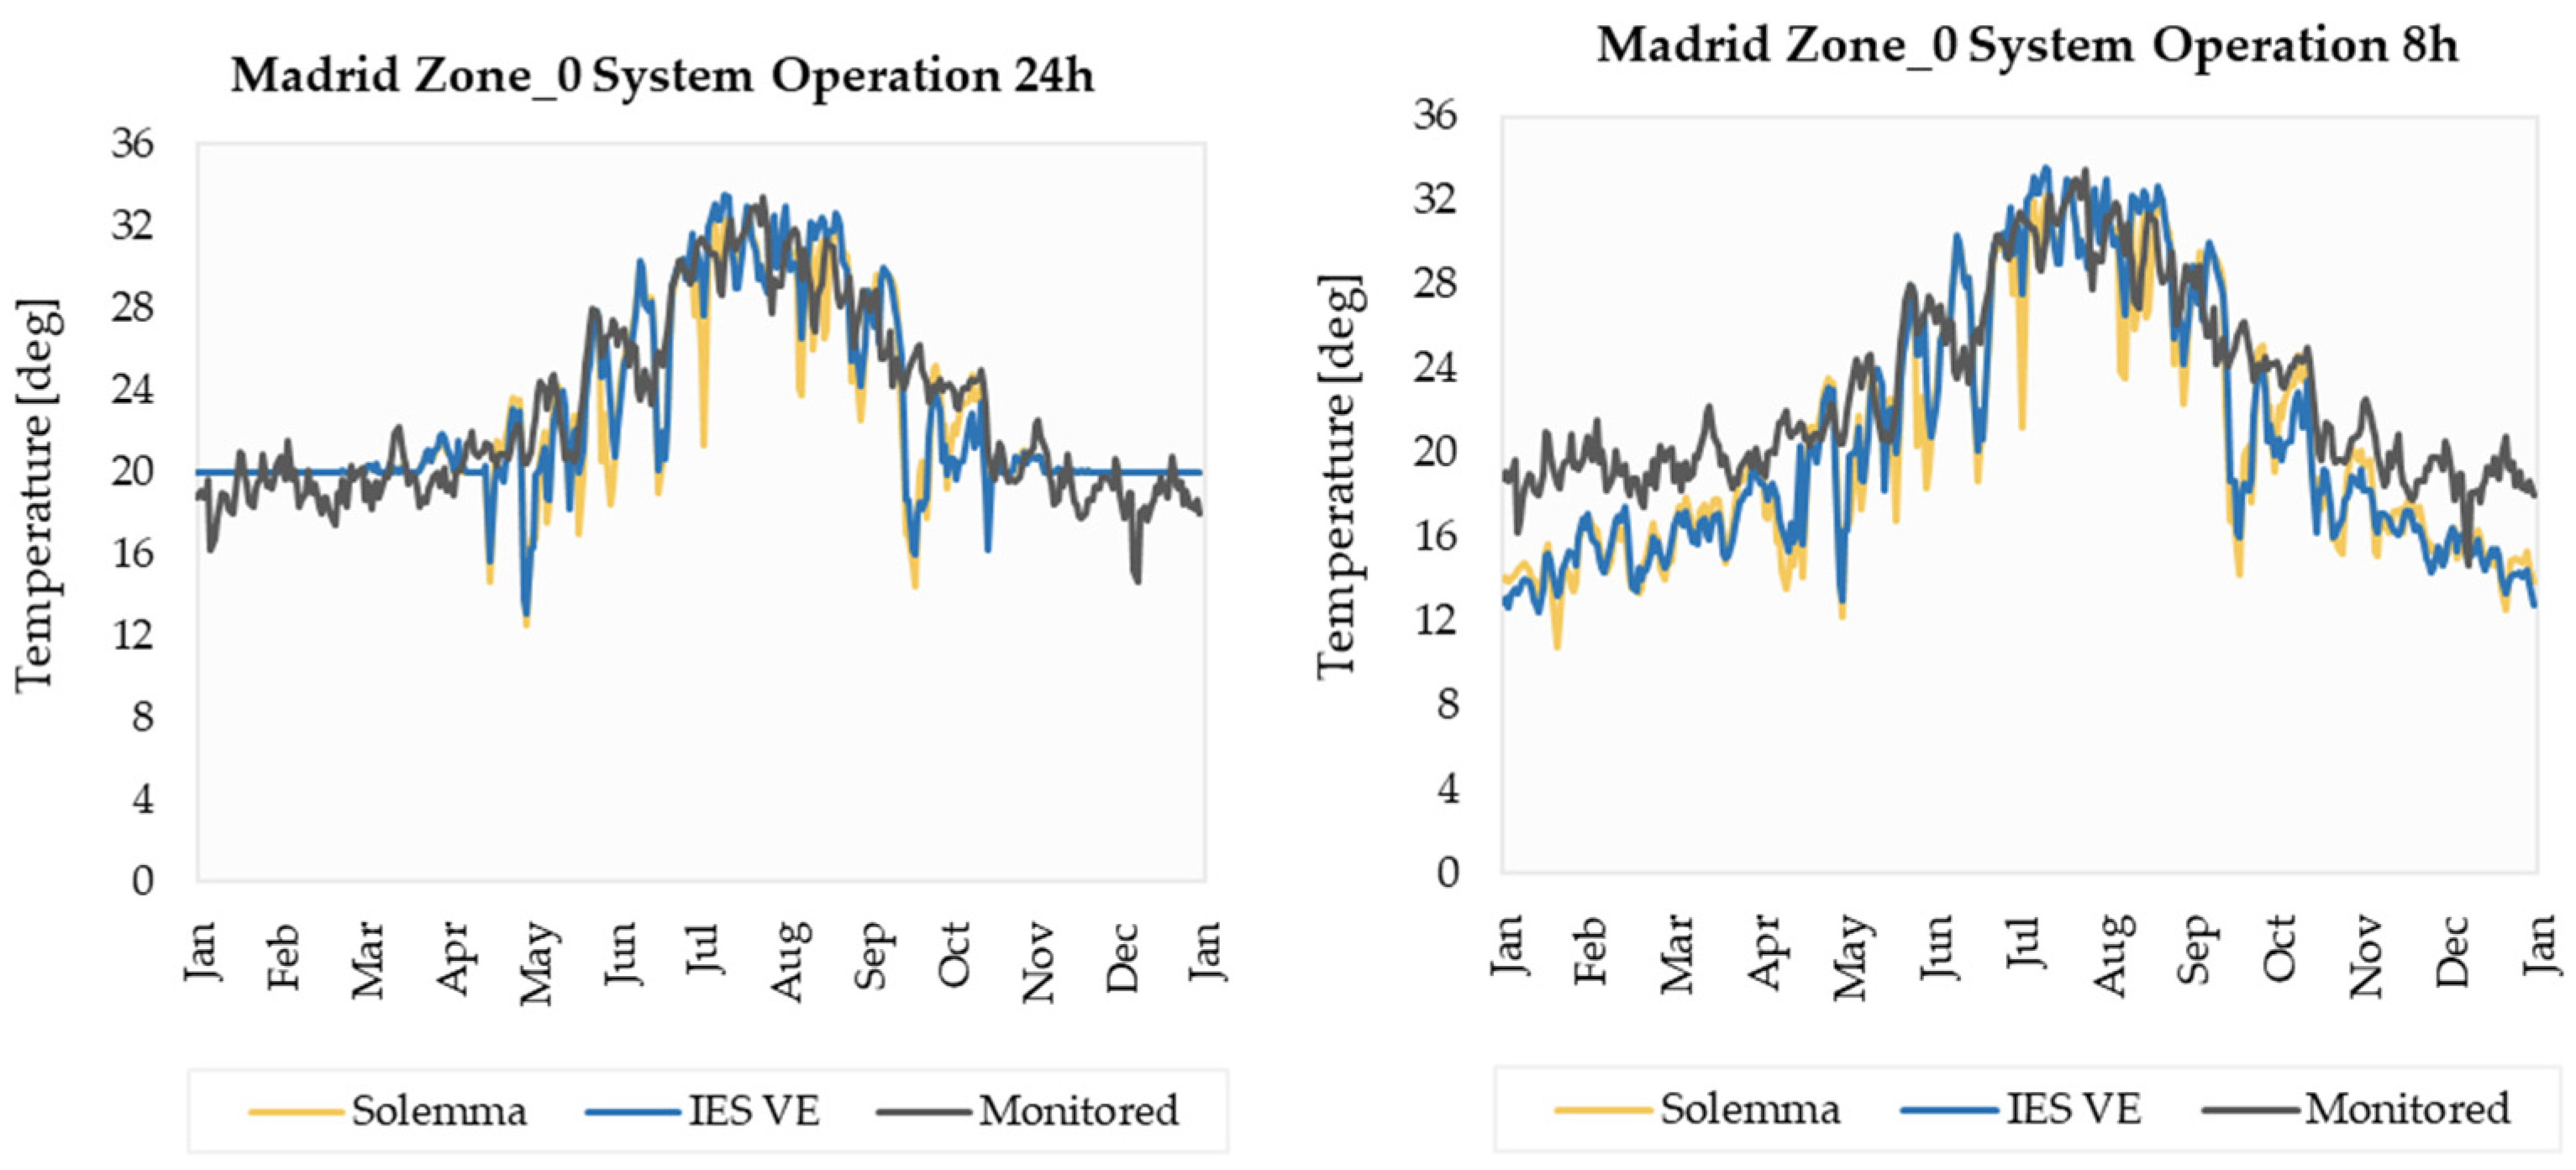
The second calibration trial set was performed with the focus on the heating system operating profile. In the previous analysis, the heating system operated 24 h/each weekday according to the chosen tabular set point of 20 °C and the country’s recommended heating season, from the 15 of October to the 15 of April for Madrid, and from the 22 of October to the 7 of April for Italy. At this stage, the heating set point and season duration were kept as proposed but the operation of the heating system was limited to 8 h/each weekday, from 7:00 to 11:00 and from 18:00 to 22:00. As far for the heating system COP value, the IES VE model kept the tabular matrix value while the Solemma model kept the calibrated one (Table 4).
Figure 11 shows the daily temperature variation before and after the calibration of the heating system profile for the Madrid case study. As can be noted in the graphs, the simulated daily indoor temperature differed more from the monitoring one when the operational profile of 8 h was used. However, as reported in Table 5, the new operational profile gave positive results in terms of the energy consumption. The total energy consumption from the two-software simulation, in reference to the monitoring data, was reduced from around +95% to +6%.

4.3. Comparative Analysis with the Advanced REZBUILD DSM

This section focuses on the comparison between the simplified DSM in IES VE and the advanced one conducted as part of the Horizon 2020 project REZBUILD. Unlike the model in this research, the latter model was created using real case inputs and precise operational profiles that were defined according to multiple surveys and inspections conducted on site. Its deviation from the monitoring was defined as −5.3%, 12,123 kWh of total energy against the 12,803 kWh monitored, and as such was considered verified.
The energy consumption per system from the IES VE model of this study (further called IES VE prototype), after the final calibration from Table 5, was compared with the one coming from the REZBUILD project, shown in Figure 12. Compared to the IES VE REZBUILD model, the IES VE prototype:
  • Overestimated the energy consumption for Space Heating and DHW;
  • Underestimated the energy consumption for Lighting and Equipment;
  • Overestimated the total energy consumption for 11.3% (6% from the monitoring).

4.4. Summary of Analysis Outputs

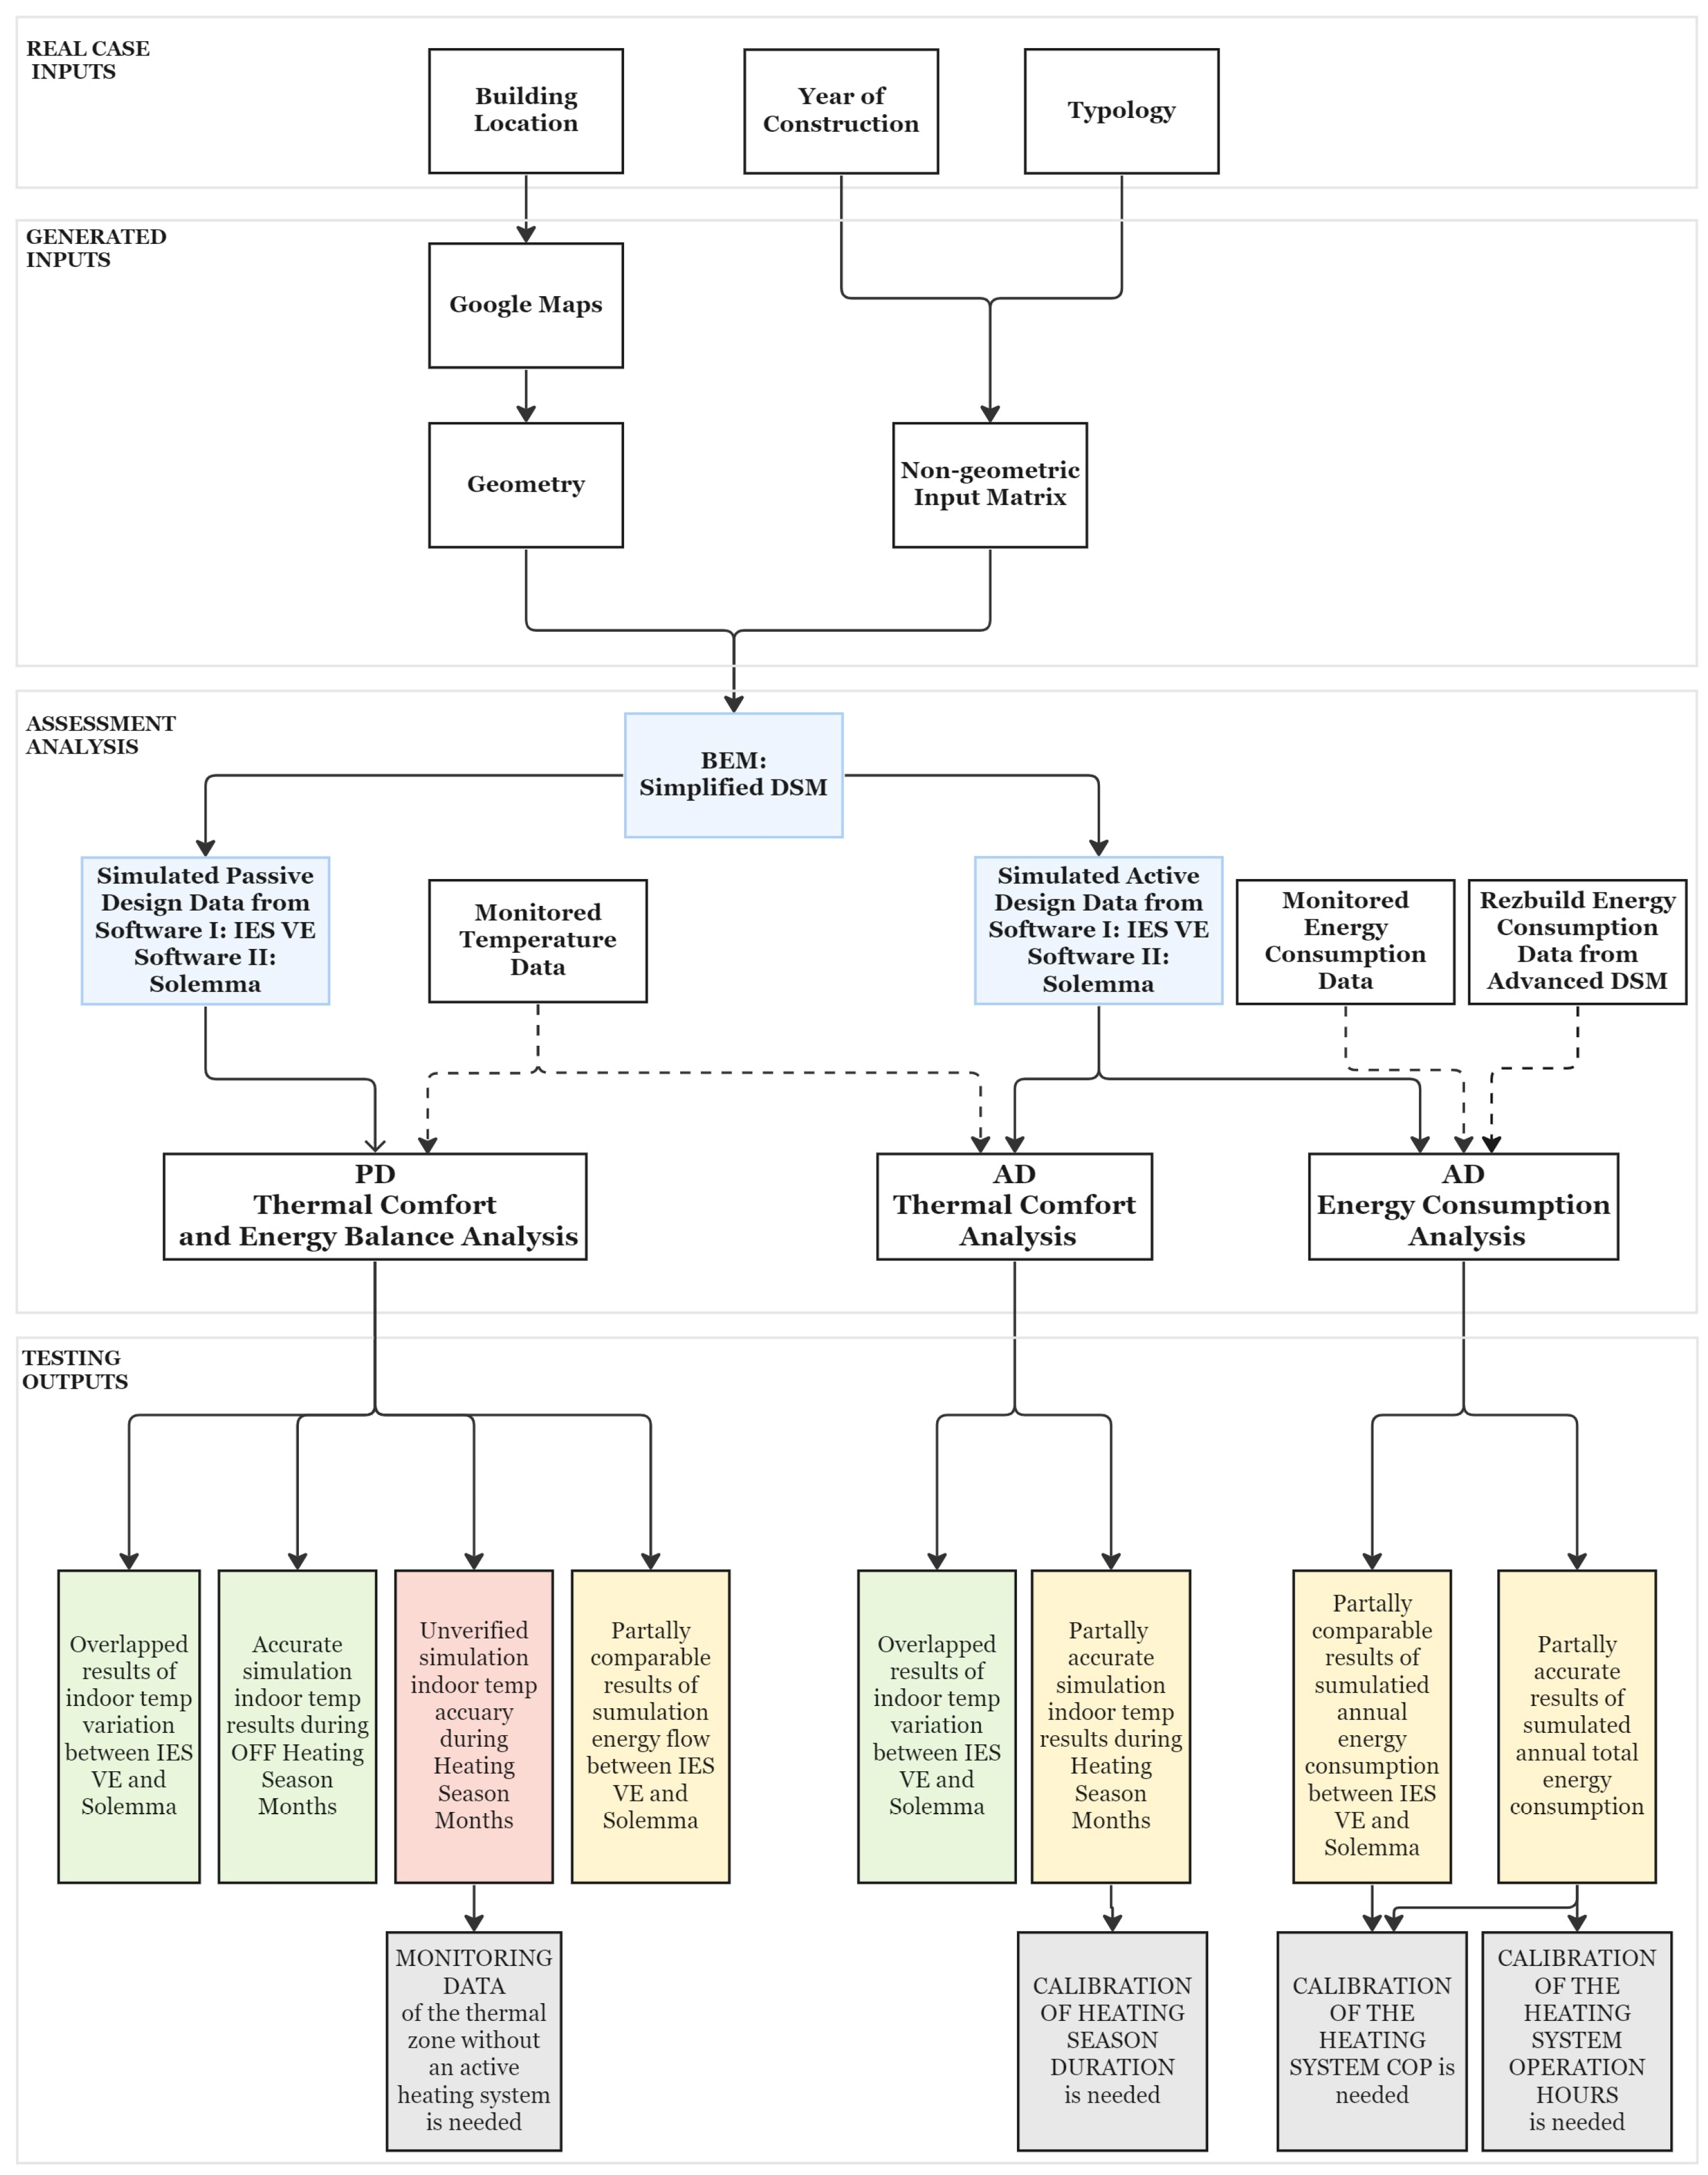
All results from the comparative analysis between the simulations in Solemma and IES VE, as well as the results benchmarking in reference to the REZBUILD data, are summarized in Figure 13.

5. Discussion and Conclusions

The BEM for detailed retrofit analysis of the old residential buildings can be quite challenging and time consuming, especially when the models undergo dynamic simulations [17]. This comes as no surprise since these residential units (build before 1980) often have insufficient or no building documentation and the assistance of the occupants cannot always be granted [4,25,26]. There is an arsenal of BEM guidelines and template inputs available, but the archive for complete and differential residential prototypes is still poor [42,44].
Accordingly, this study proposes a more simplified and automatic path for data collection and model generation that can be used for building energy assessments with dynamic simulations completed in BEM software programs IES VE and Solemma. The framework demands that an input matrix be generated which is structured by:
  • The tabular (non-geometric) matrix data generated based on three real case parameters, i.e., the location, year of construction and typology;
  • Geometric simplified LoD3 models extracted from the location in Google Maps [48,49].
The approach is applicable for residential buildings located in Italy and Spain, such as the chosen case studies in the paper. The simulation outputs from the analysed case studies are reported in Section 4 and cover two scenarios: passive design (no mechanical systems included) and active design (mechanical systems included). The approach is verified based on the comparison between the simulation data and the outputs from the detailed BEM analysis conducted in REZBUILD [47] (Figure 13).
The passive design analyses demonstrate an overlap of the daily indoor temperature variation between IES VE and Solemma. Both simulations deviate from the monitoring data in an acceptable range from 1 to 4.5 °C. This statement applies only to the off-heating months. Then, the comparison of the energy balance between IES VE and Solemma indicates an aligned building behaviour of the two simulations. The overall annual gains and losses in both software programs vary around 6000 kWh/year. From the BEM active design analyses, the simulated daily indoor temperature is proven to have a slight deviation from the monitoring temperature, except for the two mid-season months, April and October. The following is resolved with an adequate calibration of the heating season duration. Regarding the energy consumption, IES VE overestimates the consumption by approximately two-fold, while Solemma’s overestimation is approximately 28%. The two models can be aligned to a difference of 1% with a COP calibration, and the deviation between the calibrated models and the monitoring data can be reduced to 6% if the operating hours are changed from 24 h/day to 8 h/day.

5.1. Compliance with the Indoor Temperature

Therefore, the approach gives promising results for the daily indoor temperature, meaning that it can be a suitable indicator to evaluate what further retrofitting alternatives may be necessary. The only months which contradict these results are the mid-season months, April and October; the results show a need for a simple adjustment of the heating season duration. The tabular inputs defining the duration of the heating season are based on the government’s recommendations, which are more applicable for units with collective heating rather than the detached residential units studied in this paper. However, this study proposes a correction rule, based on which the heating system is on from 1 of October to 31 of May but controlled with the tabular indoor temperature set point. Verifying temperature compliance when presented with a dynamic natural ventilation is outside the scope of this study.

5.2. Compliance with the Energy Consumption

In terms of energy consumption, this approach has a limited accuracy. The IES VE and Solemma simulations share similar consumption portions for equipment, lighting, and DHW, while the heating demands differ significantly. Mainly, more than half of the total consumption comes from the heating system, and therefore, the simulation difference between the IES VE and Solemma heating consumption (8340 kWh) results in an overall simulation difference of +66% (% in reference to the monitoring data). Although the passive analyses prove the alignment between the IES VE and Solemma model, the heating energy consumption does not overlap. This does not imply of a weakness of the proposed approach but rather demonstrates the present difference in the calculation methods of the two software programs. In fact, the two software programs have an Ideal-Air-System but use different simulation engines, which is why different calibrations are needed for their heating energy consumptions. The study explores a potential path to calibrate the simulation models to the monitoring data, and although it was successful for the studied cases, as shown in Figure 11, it is too soon to state that this can be replicated to other case studies. Regarding the energy consumption per system, based on the comparison between the annual simulation data from the simplified model in IES VE and the detailed IES VE BEM model, shown in Figure 12, the approach posed by this paper does not provide an acceptable accuracy.
Accordingly, for better compliance with the energy consumption, the study needs a deeper understanding of the Ideal-Air-System that is used and its correlation with various tabular heating system inputs. A sensitivity analysis could evaluate the impact of each system input, and a series of testing with other case studies could potentially provide a set of correction coefficients that would maintain the automatic nature of the approach but increase its flexibility and reliability. Moreover, although it is useful to compare the simplified BEM with the detailed BEM from REZBUILD, it is preferred to provide a more accurate verification based on real monitoring data. Whenever this is possible, the input matrix can be modified and the accuracy of system-level consumption can be improved.
To conclude, the proposed framework for simplified and automatic data collection and model generation for the purpose of the BEM dynamic simulation analysis in IES VE and Solemma has the potential to become a fast and reliable method for energy assessment of residential buildings. The level of simplification introduced can lead to less accurate results in terms of total or system-level energy consumption, but when the limits of this research are overcome, a set of calibration coefficients can be introduced to quickly compensate for the simulation error. Nevertheless, this does not indicate that the method should be mistrusted; instead, its potential should be further explored and adequately shaped for different levels of detailed analysis.

Author Contributions

Conceptualization, S.C. (Stefano Converso), S.R. and P.C.; methodology, S.C. (Stefano Converso); validation, S.C. (Stefano Converso), S.R. and P.C.; formal analysis, I.V.; investigation, I.V. and S.C. (Stefano Ciprigno); resources, P.C.; writing—original draft preparation, I.V. and S.C. (Stefano Ciprigno); writing—review and editing, P.C. and S.C. (Stefano Converso); visualization, I.V.; supervision, S.C. (Stefano Converso) and S.C. (Stefano Ciprigno); project administration, S.C. (Stefano Converso). All authors have read and agreed to the published version of the manuscript.

Funding

This research received no external funding.

Data Availability Statement

The rest of the data used or generated is confidential.

Conflicts of Interest

The authors declare no conflict of interest.

Appendix A. Tabular Input Matrix

Demo Site I: Martellago/semidetached residential building/1960.
WeatherDescriptionSource-IES VESolemmaREZBUILD
Weather fileTMYEnergy+ITA_Venezia-Tesera.161050_IGDG
GeometryDescriptionSourceGeneratedIES VESolemmaREZBUILD
Area Zone 0 [m2]-Google Maps98.698.698.681
Area Zone 1 [m2]-Google Maps98.698.698.681
Volume Zone 0 [m3]-Google Maps284.9284.9284.9
Volume Zone I [m3]-Google Maps289.9289.9289.9
ConstructionDescriptionSourceTabularIES VESolemmaREZBUILD
Ground boundary---Default ground
resistance
Ground
Temperature
Envelope boundary---Outdoor Air
Temperature
Outdoor Air
Temperature
External Wall
U-value [W/m2K]
Mortar, hollow 25 cm brick wall, plasterboard;Tabula1.761.761.77Wall23 cm 1.77
Wall29.5 cm 1.53
Wall32 cm 1.46
Detached Wall
U-value [W/m2K]
Modelled as the External Wall;Tabula1.761.761.762.46
Ground Floor
U-value [W/m2K]
Concrete base to the terrain;Tabula2.002.082.001.01
Horizontal
Partition
[W/m2K]
Reinforced concrete and hollow tiles mixed floor; 1.651.651.651.94
Roof
U-value [W/m2K]
Pitched roof with wood structure and boarding with U = 1.8 W/m2 KTabula1.171.171.14Roof 1.88
Attic Floor 3.13
Simplified pitched roof void with
R = 0.3 m2 K/W
Windows
U-value [W/m2K]
Single glazing with wooden frame;Tabula4.904.935.893.12 (glazing)
1.74 (total)
Door
U-value [W/m2K]
Wooden door;Tabula3--2.40
LoadsDescriptionSourceTabularIES VESolemmaREZBUILD
OccupancyDensity [pers/m2]UNI 103390.040.040.04
Sensible gain [W/pers]Assumption6464-
Latent gain [W/pers]Assumption7070-
Metabolic rate [met]Calculated0.70.7
EquipmentPower density [W/m2]BS ISO 17772-12.42.42.4
Sensible gain [W/pers]Assumption2.42.4-
Latent gain [W/pers]Neglected0--
LightingLighting power density
[W/m2]
Addendum ad to ANSI/ASHRAE/IES Standard 90.1—20196.56.56.5
Illuminance target
[LUX]
Default--200
Max sensible gain [W/m2]Assumption6.56.5-
InfiltrationAir leakage [ACH]ASHRAE: Handbook of
Fundamentals
0.60.60.6
Natural VentilationAir change [ACH]UNI TS 113000.30.30.3Dynamic
SystemsDescriptionSourceTabularIES VESolemmaREZBUILD
DHW SystemTypeTabula/REZBUILDDHWDHWDHW
Generator sourceTabula/REZBUILDNatural gasNatural gasElectricity
COPTabula/REZBUILD111
Hot water inlet
temperature [deg]
EN 13203-2
CEN EN 15316-3-1
101010
Hot water outlet
temperature [deg]
EN 13203-2
CEN EN 15316-3-1
606060
Total flow rate [L/h]EN 13203-2
CEN EN 15316-3-1
2727-
Flow rate per
person [m3/h/per]
Calculated0.006-0.006
Heating SystemTypeTabula/REZBUILDRadiatorsIdeal HVACIdeal Air
System
Generator sourceTabulaREZBUILDNatural GasNatural GasElectricity
COPTabula/REZBUILD0.80.80.8
Setpoint [deg]BS ISO 17772-1202020
Cooling SystemNoneTabula/REZBUILD
Demo Site II: Madrid/semidetached residential building/1940.
WeatherDescriptionSourceTabularIES VESolemmaREZBUILD
Weather fileTMYOne
Building
ESP_MD_Madrid-Barajas-Suarez.AP.08221_TMYx.2007-2021.epw
GeometryDescriptionSourceTabularIES VESolemmaREZBUILD
Area [m2] Google Maps64.3764.3764.3777.84
Volume [m3] Google Maps235.3235.3235.3
ConstructionDescriptionSourceTabularIES VESolemmaREZBUILD
Ground boundary---Default ground
resistance
Ground
temperature
Envelope boundary---Air
Temperature
Air
Temperature
External Wall
U-value [W/m2K]
Mortar, solid 24 cm brick, and gypsum;Tabula2.562.562.552.03
Detached Wall
U-value [W/m2K]
Modelled as the
External Wall;
Tabula2.562.562.552.18
Ground Floor
U-value [W/m2K]
Ceramic tile and
mortar;
Tabula0.950.950.940.99
Roof
U-value [W/m2K]
Pitched roof with curved ceramic tiles, wooden structure, wattle, ventilated air chamber, wattle, and gypsum;Tabula4.174.174.206.25
Windows
U-value [W/m2K]
Single glazing with wooden frame medium density, old blinds;Tabula4.594.595.824.16
Door
U-value [W/m2K]
Wooden door;Tabula3--0.56/5.88
LoadsDescriptionSourceTabularIES VESolemmaREZBUILD
OccupancyDensity [pers/m2]UNI 103390.040.040.04
Sensible gain [W/pers]Assumption -
Latent gain [W/pers]Assumption -
Metabolic rate [met]Calculated
EquipmentPower density [W/m2]BS ISO 17772-12.42.42.4
Sensible gain [W/pers]Assumption2.42.4-
Latent gain [W/pers]Neglected0--
LightingLighting power density [W/m2]Addendum ad to ANSI/ASHRAE/IES Standard 90.1—20196.56.56.5
Illuminance target
[LUX]
Default--200
Max sensible gain
[W/m2]
Assumption6.56.5-
InfiltrationAir leakage [ACH]ASHRAE: Handbook of
Fundamentals
0.60.60.6
Natural VentilationAir change [ACH]UNI TS 113000.30.30.3Dynamic
SystemsDescriptionSourceTabularIES VESolemmaREZBUILD
DHW SystemTypeTabula/REZBUILDDHWSDHWSDHWS
Generator sourceTabula/REZBUILDElectricityElectricityElectricity
COPTabula/REZBUILD111
Hot water inlet
temperature [deg]
EN 13203-2
CEN EN 15316-3-1
101010
Hot water outlet
temperature [deg]
EN 13203-2
CEN EN 15316-3-1
606060
Total flow rate [L/h]EN 13203-2
CEN EN 15316-3-1
2727-
Flow rate per
person [m3/h/per]
Calculated0.01-0.01.
Storage volume [L]Calculated100100-
Heating SystemTypeTabula/REZBUILDElect HeaterApSysIdeal Air
System
Generator sourceTabula/REZBUILDElectricityElectricityElectricity
COPTabula/REZBUILD111
Setpoint [deg]BS ISO 17772-1202020
Cooling SystemNoneTabula/REZBUILD

Appendix B. Tabular Schedules

InputOccupancyEquipmentLightingDHW
SourceBS ISO 17772-1BS ISO 17772-1BS ISO 17772-1EN 13203-2
CEN EN 15316-3-1
HourWeekdaysWeekendsWeekdaysWeekendsWeekdaysWeekendsWeekdaysWeekends
0110.50.50000
1110.50.50000
2110.50.50000
3110.50.50000
4110.50.50000
5110.50.50000
6110.50.50000
70.50.80.50.50.150.1511
80.50.80.70.70.150.150.260.26
90.50.80.70.70.150.150.130.13
100.10.80.50.50.150.150.070.07
110.10.80.50.50.050.050.130.13
120.10.80.60.60.050.050.20.2
130.10.80.60.60.050.0500
140.20.80.60.60.050.050.070.07
150.20.80.60.60.050.050.070.07
160.20.80.50.50.050.050.070.07
170.50.80.50.50.20.200
180.50.80.70.70.20.20.20.2
190.50.80.70.70.20.20.070.07
200.80.80.80.80.20.20.460.46
210.80.80.80.80.20.20.930.93
220.80.80.80.80.20.200
230.610.60.60.150.1500
240.610.60.60.150.1500

Appendix C. Roof Resistance

Characteristics of Roof R u
m 2 K / W
1Tiled roof with no felt, boards or similar0.06
2Sheeted roof, or tiled roof with felt or boards or similar under the tiles0.2
3As 2 (above) but with aluminium cladding or other low emissivity surfaces at underside of roof0.3
4Roof lined with boards and felt0.3
Note: The values in this table include the thermal resistance of the ventilated space and the thermal resistance of the pitched roof construction. They do not include the external surface resistance, Rse.

References

  1. Gross Energy, EU, 1990–2020, 2020. [Online]. Available online: https://ec.europa.eu/eurostat/statistics-explained/index.php?title=Energy_statistics_-_an_overview#Final_energy_consumption (accessed on 3 April 2023).
  2. IEA. Global Energy and Climate Model; IEA: Paris, France, 2022. [Google Scholar]
  3. European Comission. Stepping up Europe’s 2030 Climate Ambition Investing in a Climate-Neutral Future for the Benefit of Our People; European Commission: Brussels, Belgium, 2020. [Google Scholar]
  4. IEA. Renovation of Near 20% of Existing Building Stock to Zero-Carbon-Ready by 2030; IEA: Paris, France, 2022. [Google Scholar]
  5. Civiero, P.; Pascual, J.; Arcas Abella, J.; Salom, J. Innovative PEDRERA Model Tool Boosting Sustainable and Feasible Renovation Programs at District Scale in Spain. Sustainability 2022, 14, 9672. [Google Scholar] [CrossRef]
  6. Ma, Z.; Cooper, P.; Daly, D.; Ledo, L. Existing building retrofits: Methodology and state-of-the-art. Energy Build. 2012, 55, 889–902. [Google Scholar] [CrossRef]
  7. Rademaekers, K. Market Study for a Voluntary Common European Union Certification Scheme for the Energy Performance of Non-Residential Buildings; DG Energy (ENER) (European Commission): Rotterdam, The Netherlands, 2014. [Google Scholar]
  8. Deb, C.; Schlueter, A. Review of data-driven energy modelling techniques for building retrofit. Renew. Sustain. Energy Rev. 2021, 144, 110990. [Google Scholar] [CrossRef]
  9. Gonzalez-Caceres, M.; Rabani; Martínez, W. A systematic review of retrofitting tools for residential buildings. IOP Conf. Ser. Earth Environ. Sci. 2019, 294, 012035. [Google Scholar] [CrossRef]
  10. Vaisi, S.; Firouzi, M.; Varmazyari, P. Energy benchmarking for secondary school buildings, applying the Top-Down approach. Energy Build. 2023, 279, 112689. [Google Scholar] [CrossRef]
  11. Li, Z.O.Y.; Zhang, L.; Chen, J.; Im, P.; DeGraw, J. Grey-box modeling and application for building energy simulations—A critical review. Renew. Sustain. Energy Rev. 2021, 146, 111174. [Google Scholar] [CrossRef]
  12. Amara, F.; Agbossou, K.; Cardenas, A.; Dubé, Y. Comparison and Simulation of Building Thermal Models for Effective Energy Management. Smart Grid Renew. Energy 2015, 6, 95–112. [Google Scholar] [CrossRef]
  13. Kamel, E. A Systematic Literature Review of Physics-Based Urban Building Energy Modeling (UBEM) Tools, Data Sources, and Challenges for Energy Conservation. Energies 2022, 15, 8649. [Google Scholar] [CrossRef]
  14. Ang, Y.Q.; Berzolla, Z.M.; Reinhart, C.F. From concept to application: A review of use cases in urban building energy modeling. Appl. Energy 2020, 279, 115738. [Google Scholar] [CrossRef]
  15. Asadi, E.; Silva, M.G.; Antunes, C.H.; Dias, L. Multi-objective optimization for building retrofit strategies: A model and an application. Energy Build. 2012, 44, 81–87. [Google Scholar] [CrossRef]
  16. A Technical Manual for SBEM. Part of the National Calculation Methodology: SBEM for Assessing the Energy Perfomance of Building; UK Ministry of Housing, Communities & Local Government: London, UK, 2015.
  17. ISO/FDIS 13790; Energy Performance of Buildings—Calculation of Energy Use for Space Heating and Cooling. International Organization for Standardization: Geneva, Switzerland, 2007.
  18. Cerezo, C.; Dogan, T.; Reinhart, C.F. Towards standarized building properties template files for early design energy model generation. In Proceedings of the Building Simulation Conference, 2014 ASHRAE/IBPSA-USA, Atlanta, GO, USA, 10–12 September 2014. [Google Scholar]
  19. Jradi, M. Dynamic Energy Modelling as an Alternative Approach for Reducing Performance Gaps in Retrofitted Schools in Denmark. Appl. Sci. 2020, 10, 7862. [Google Scholar] [CrossRef]
  20. ISO 52017-1:2017; Energy Performance of Buildings—Sensible and Latent Heat Loads and Internal Temperatures—Part 1: Generic Calculation Procedures. International Organization for Standardization: Geneva, Switzerland, 2017.
  21. Kim, D.; Lee, J.; Do, S.; Mago, P.J.; Lee, K.H.; Cho, H. Energy Modeling and Model Predictive Control for HVAC in Buildings: A Review of Current Research Trends. Energies 2022, 15, 7231. [Google Scholar] [CrossRef]
  22. ISO 16346:2013; Energy Performance of Buildings—Assessment of Overall Energy Performance. ISO: Geneva, Switzerland, 2013.
  23. Cho, K.H.; Kim, S.S. Energy Performance Assessment According to Data Acquisition Levels of Existing Buildings. Energies 2019, 12, 1149. [Google Scholar] [CrossRef]
  24. Andersen, R.; Jensen, L.B.; Ryberg, M. Using digitized public accessible building data to assess the renovation potential of existing building stock in a sustainable urban perspective. Sustain. Cities Soc. 2021, 75, 103303. [Google Scholar] [CrossRef]
  25. Fonseca, A. Simulation model to find the best comfort, energy and cost scenarios for building refurbishment. J. Build. Perform. Simul. 2018, 11, 205–222. [Google Scholar] [CrossRef]
  26. Iralde, N.S.I.; Pascual, J.; Salom, J. Energy retrofit of residential building clusters. A literature review of crossover recommended measures, policies instruments and allocated funds in Spain. Energy Build. 2021, 252, 111409. [Google Scholar] [CrossRef]
  27. Mata, É.; Kalagasidis, A.S.; Johnsson, F. Building-stock aggregation through archetype buildings: France, Germany, Spain and the UK. Build. Environ. 2014, 81, 270–282. [Google Scholar] [CrossRef]
  28. Cardinale, N.; Negro, E.; Selicati, V. Energy audit of 1900s buildings for sustainable renovation. J. Phys. 2022, 2385, 012010. [Google Scholar] [CrossRef]
  29. Yu, J.; Chang, W.-S.; Dong, Y. Building Energy Prediction Models and Related Uncertainties: A Review. Buildings 2022, 12, 1284. [Google Scholar] [CrossRef]
  30. Happle, G.; Fonseca, J.A.; Schlueter, A. A review on occupant behavior in urban building energy models. Energy Build. 2018, 174, 276–292. [Google Scholar] [CrossRef]
  31. Monteiro, C.S.; Costa, C.; Pina, A.; Santos, M.Y.; Ferrão, P. An urban building database (UBD) supporting a smart city information system. Energy Build. 2018, 158, 244–260. [Google Scholar] [CrossRef]
  32. Johari, F.; Peronato, G.; Sadeghian, P.; Zhao, X.; Widén, J. Urban building energy modeling: State of the art and future prospects. Renew. Sustain. Energy Rev. 2020, 128, 109902. [Google Scholar] [CrossRef]
  33. Johari, F.; Munkhammar, J.; Shadram, F.; Widén, J. Evaluation of simplified building energy models for urban-scale energy analysis of buildings. Build. Environ. 2022, 211, 108684. [Google Scholar] [CrossRef]
  34. Pasichnyi, O.; Wallin, J.; Kordas, O. Data-driven building archetypes for urban building energy modelling. Energy 2019, 181, 360–377. [Google Scholar] [CrossRef]
  35. Huld, T.; Paietta, E.; Zangheri, P.; Pascua, I.P. Assembling Typical Meteorological Year Data Sets for Building Energy Performance Using Reanalysis and Satellite-Based Data. Atmosphere 2018, 9, 53. [Google Scholar] [CrossRef]
  36. Sola, A.; Corchero, C.; Salom, J.; Sanmarti, M. Simulation Tools to Build Urban-Scale Energy Models: A Review. Energies 2018, 11, 3269. [Google Scholar] [CrossRef]
  37. Mastrucci, A.; Baume, O.; Stazi, F.; Leopold, U. Estimating energy savings for the residential building stock of an entire city: A GIS-based statistical downscaling approach applied to Rotterdam. Energy Build. 2014, 75, 358–367. [Google Scholar] [CrossRef]
  38. Janečka, K. Transformation of 3D geospatial data into CityGML—A case of Prague. Rep. Geod. Geoinform. 2019, 107, 41–48. [Google Scholar] [CrossRef]
  39. TABULA WebTool, [Online]. Available online: https://webtool.building-typology.eu/#bm (accessed on 3 April 2023).
  40. ASHRAE: Handbook of Fundamentals; American Society of Heating, Refrigerating and Air-Conditioning Engineers: Atlanta, GO, USA, 2021.
  41. ISO 17772-1:2017; Energy Performance of Buildings—Indoor Environmental Quality—Part 1: Indoor Environmental Input Parameters for the Design and Assessment of Energy Performance of Buildings. ISO: Geneva, Switzerland, 2017.
  42. Energy Office of Energy Efficiency & Renewable Energy: Building Energy Code Program, [Online]. Available online: https://www.energycodes.gov/prototype-building-models#IECC (accessed on 3 April 2023).
  43. Energy Office of Energy Efficiency & Renewable Energy: Buildings, [Online]. Available online: https://www.energy.gov/eere/buildings/articles/openstudio (accessed on 3 April 2023).
  44. Gonzalo, F.D.A.; Santamaría, B.M.; Burgos, M.J.M. Assessment of Building Energy Simulation Tools to Predict Heating and Cooling Energy Consumption at Early Design Stages. Sustainability 2023, 15, 1920. [Google Scholar] [CrossRef]
  45. IES. ApacheView USER guide IES Virtual Environment; IES: Glasgow, UK, 2017. [Google Scholar]
  46. Available online: https://climatestudiodocs.com (accessed on 3 April 2023).
  47. CORDIS EU Research Results, [Online]. Available online: https://cordis.europa.eu/project/id/768623 (accessed on 3 April 2023).
  48. Biljecki, F.; Ledoux, H.; Stoter, J. An improved LOD specification for 3D building models. Comput. Environ. Urban Syst. 2016, 59, 25–37. [Google Scholar] [CrossRef]
  49. CityGML, [Online]. Available online: https://www.ogc.org/standard/citygml/ (accessed on 3 April 2023).
  50. Issuu Ponti Termici in Edilizi, [Online]. Available online: https://issuu.com/pubdocs/docs/ponti_termici_in_edilizia (accessed on 3 April 2023).
  51. Bigladder Software Ideal Load Air System, [Online]. Available online: https://bigladdersoftware.com/epx/docs/8-0/engineering-reference/page-092.html (accessed on 3 April 2023).
  52. TABULA Project Team. Use of Building Typologies for Energy Performance Assessment of National Building Stocks. Existent Experiences in European Countries and Common Approach; Institut Wohnen und Umwelt GmbH: Darmstadt, Germany, 2010. [Google Scholar]
  53. EPISCOPE. Energy Performance Indicator Tracking Schemes for the Continuous Optimisation of Refurbishment Processes in European Housing Stocks; Institut Wohnen und Umwelt GmbH: Darmstadt, Germany, 2013. [Google Scholar]
  54. UNI 10339:1995; Impianti Aeraulici al Fini di Benessere. Generalità, Classificazione e Requisiti. Regole per la Richiesta D’offerta, L’offerta, L’ordine e la Fornitura. Certifico Srl: Perugia, Italy, 1995.
  55. UNI EN 13203-2:2015; Apparecchi a Gas Domestici per la Produzione di Acqua Calda—Parte 2: Valutazione del Consumo di Energia. Certifico Srl: Perugia, Italy, 2015.
  56. CEN EN 12831-3:2017; Energy Performance of Buildings—Method for Calculation of the Design Heat Load—Part 3: Domestic Hot Water Systems Heat Load and Characterisation of Needs, Module M8-2, M8-3. Comite Europeen de Normalisation: Bruxelles, Belgique, 2017.
  57. ANSI/ASHRAE/IES Standard 90.1-2019; Energy Standard for Buildings Except Low-Rise ANSI/ASHRAE/IES Standard 90.1-2019, Energy Standard for Buildings Except Low-Rise. ASHRAE: Peachtree Corners, GA, USA, 2019.
  58. Maetrics IoT Services, [Online]. Available online: https://mannienergy.com/en/services/maetrics-iot-services/ (accessed on 3 April 2023).
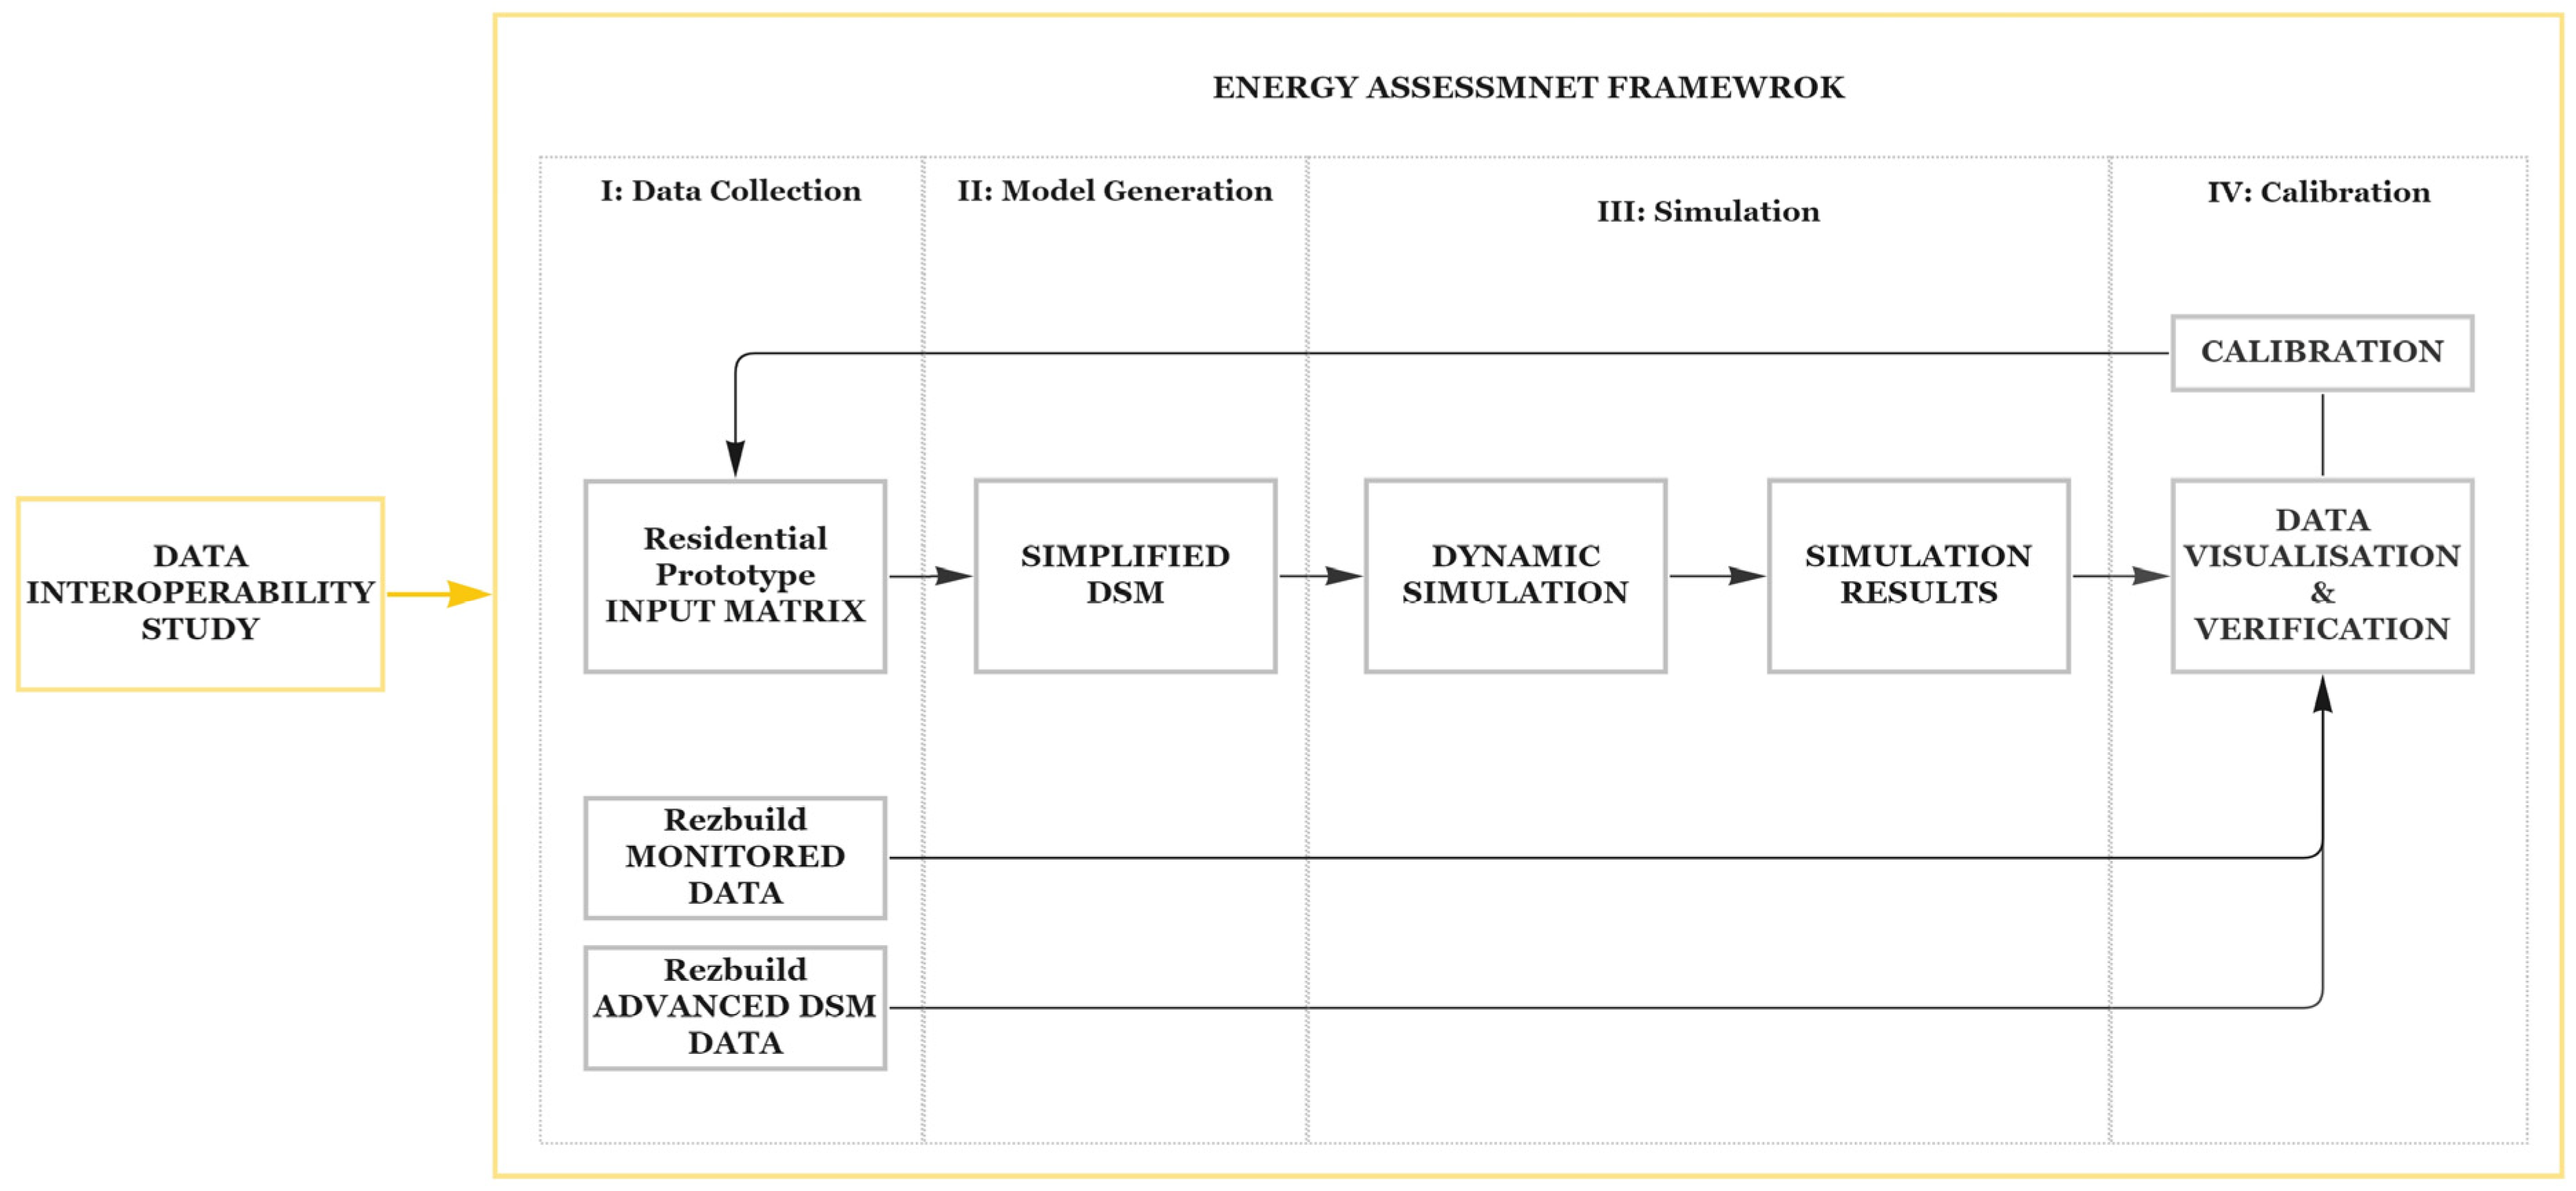
Figure 1. Methodology adopted to build a fast but reliable BEM for energy assessment of old residential case studies in Italy and Spain.
Energies 16 03930 g001
Figure 2. Adopted type of inputs that require interoperability for a successful build of the Input Matrix for Simplified DSM.
Energies 16 03930 g002
Figure 3. Geometry extraction procedure.
Energies 16 03930 g003
Figure 4. Proposed energy assessment framework.
Energies 16 03930 g004
Figure 5. Madrid demo site: (a) detailed BEM model 3D; (b) detailed plan zone_0; (c) Simplified model; (d) Simplified plan zone_0.
Energies 16 03930 g005aEnergies 16 03930 g005b
Figure 6. Martellago demo site: (a) detailed 3D model; (b) detailed plan zone_0; (c) detailed plan zone_1; (d) simplified model; (e) simplified plan zone_0; (f) simplified plan zone_1.
Energies 16 03930 g006
Figure 7. Madrid demo site: Comparison between available monitored data and simulation results from IES VE and Solemma.
Energies 16 03930 g007
Figure 8. Daily indoor temperature deviation.
Energies 16 03930 g008
Figure 9. Madrid demo site: Monthly energy flow comparison between IES VE and Solemma simulations.
Energies 16 03930 g009
Figure 10. Comparison between available monitored data and simulation results from IES VE and Solemma—Mechanical heating system included: (a) Indoor daily temperature variation considering the proposed heating season; (b) Indoor daily temperature variation considering a calibrated heating season.
Energies 16 03930 g010
Figure 11. Madrid demo site: Calibration of the heating system operating profile.
Energies 16 03930 g011
Figure 12. Madrid demo site: Energy consumption distribution comparison.
Energies 16 03930 g012
Figure 13. Testing output.
Energies 16 03930 g013
Table 1. Input dependency.
Input Matrix
Real Case DBGenerated DB
InputCategoryWeather dataGeometric dataNon-geometric data
ConstructionLoadsSystems
LocationItaly
Spain
Year of
construction
1900–1980
TypologySingle
(Detached) House SFH
Terraced House TH
Multi Family House MFH
Apartment Blocks AB
Table 2. Generated input sources.
Data GroupInput GroupInput SubgroupSource
Weather DataWeather FileTMYOpen Archives (OneBuilding, EnergyPlus)
Geometric DataArchitectural Model-Google Maps
Orientation-Google Maps
Non-geometric DataConstructionOpaque ElementsTabula
Transparent ElementsTabula
LoadsOccupancy BS ISO 17772-1, UNI 10339
Equipment BS ISO 17772-1
LightingANSI/ASHRAE/ISE Addendum ad to ANSI/ASHRAE/IES Standard 90.1—2019
InfiltrationASHRAE: Handbook of Fundamentals. American Society of Heating, Refrigerating and Air-Conditioning Engineers, Atlanta
Natural VentilationUNI 10339
SystemsHeating SystemTabula, BS ISO 17772-1, REZBUILD
DHW SystemTabula, UNI EN 13203-2, CEN EN 15316-3-1, REZBUILD
Cooling SystemTabula, BS ISO 17772-1, REZBUILD
Mechanical VentilationTabula, BS ISO 17772-1, REZBUILD
Table 3. Madrid—Annual energy consumption.
Demo SiteData SourceTotal
Energy
Total
Elect
Light
Elect
Equip
Elect
DHW
Elect
Heating
Elect
Heating
Wood
Madrid
Spain
IES VE24,92024,920340800227021,510-
Solemma16,33416,236343823199713,170-
Monitored12,8035617- ---~4800
Table 4. Madrid demo site: Heating system COP calibration.
SoftwareHeating SourceCOPHeatingDeltaTotal EnergyDelta
IES VE
(Version 2022.1.2.0)
Electricity121,510REF24,920REF
Solemma
(Version 2022)
Electricity113,170−39%16,334−34%
SolemmaElectricity0.914,633−32%17,797−29%
SolemmaElectricity0.816,462−23%19,626−21%
SolemmaElectricity0.6520,261−6%23,425−6%
SolemmaElectricity0.621,9502%25,1141%
Table 5. Madrid demo site: Heating system Operational profile calibration.
Demo
Site
Data
Source
Daily
Operation
Heating
Source
System
COP
Total
Energy
DeltaHeating
Energy
Delta
Madrid
Spain
Monitored---12,803REF-REF
IES VE24 hElectricity124,920+95%21,510Data
Absence
IES VE8 hElectricity113,540+6%10,130
Solemma24 hElectricity0.625,114+96%21,950
Solemma8 hElectricity0.613,606+6%10,443
Disclaimer/Publisher’s Note: The statements, opinions and data contained in all publications are solely those of the individual author(s) and contributor(s) and not of MDPI and/or the editor(s). MDPI and/or the editor(s) disclaim responsibility for any injury to people or property resulting from any ideas, methods, instructions or products referred to in the content.