Article

Detection Stability Improvement of Near-Infrared Laser Telemetry for Methane Emission from Oil/Gas Station Using a Catadioptric Optical Receiver

1
School of Mechanical Science and Engineering, Northeast Petroleum University, Daqing 163318, China
2
School of Physics and Electronic Engineering, Northeast Petroleum University, Daqing 163318, China
3
School of Architecture and Civil Engineering, Northeast Petroleum University, Daqing 163318, China
*
Authors to whom correspondence should be addressed.
Energies 2023, 16(9), 3854; https://doi.org/10.3390/en16093854
Submission received: 17 March 2023 / Revised: 20 April 2023 / Accepted: 27 April 2023 / Published: 30 April 2023
(This article belongs to the Topic Clean and Low Carbon Energy)

Abstract

:
Open-path laser telemetry of methane leakage yields security guarantees of energy storage and transportation for oil/gas station production operation. In order to further improve the long-term detection stability under the condition of long-distance non-cooperative targets, a catadioptric optical receiver (COR) consisting of a Fresnel lens, cone reflector and parabolic reflector is proposed to focus the laser echo light that deviates gradually with the increase in atmospheric turbulence. The geometric configuration parameters of COR are optimized by the ray-tracing method, and the condensing performance of COR is further verified. The self-developed methane laser telemetry system coupled with COR is calibrated in the laboratory and then moved to the field for a signal receiving stability experiment under turbulence interference. The results show that the receiving angle of COR increases 3.8 times compared with the Fresnel lens optical receiver (FOR). The RMSE and IS of the COR system are 0.00173 V and 84.79%, respectively. For comparison, these two evaluating indicators of the FOR system are 0.00288 V and 76.23%. This self-developed methane laser telemetry system coupled with COR is feasible for improving the long-term detection stability of remote leakage monitoring in oil/gas stations.

1. Introduction

Methane emissions have 80 times the climate-change effects of carbon dioxide over a 20-year timeframe and are responsible for a quarter of today’s global warming [1,2]. An increase in the energy intensity technology is correlated with a decrease in greenhouse gas emissions [3]. Currently, natural gas is considered to be an important link in the transition from the fossil energy system to a renewable energy system. In other words, natural gas use has risen dramatically and can replace ordinary fuels and electricity power for both environmental and economic reasons.
As a result, new storage and transport units are being constructed, and larger amounts of petroleum and especially natural gas are distributed worldwide. This change presents both opportunities and challenges. One of these challenges is how to best control methane emissions while embracing this new energy economy. The most significant segment in the oil and gas production and supply chain for methane emissions is natural gas field production (over 50%), followed by petroleum systems as a whole (over one-third) [4,5].
Methane emission inventories are undercounted as reported by the U.S. EPA (Environmental Protection Agency) [6,7]. Recent research has shown that methane emissions from the oil and gas sectors are also underestimated in Canada [8]. Methane fugitive emissions (leaks) are a major issue in both the oil and gas sectors, not only in environmental and economic terms because of the wasting of important natural energy but also importantly from a safety perspective [9]. For these and other reasons, it is important to develop excellent technologies to monitor natural gas and specifically methane emissions. Laser absorption spectroscopy sensing technology is making it easier to monitor leaks and control emissions, putting the industry in a position to recover the lost revenue that each year’s methane emissions represent [10,11,12,13,14].
The monostatic open-path tunable laser absorption spectroscopy (MOP-TLAS) monitoring system is widely established for the protection of standoff facilities in the oil and gas sector [15], such as for leakage detection and warnings in the natural gas depot. In a MOP-TLAS monitoring system, the laser transmitter and receiver are located in the same fixed position. The effective path length is doubled, resulting in increased sensitivity. Depending on the desired distance to cover, simple reflective surfaces to highly precise retro-reflectors are used. He et al. [16] presented a highly effective method to measure methane emissions from landfills based on MOP-TLAS. The methane concentrations in six different directions were measured by placing six flat mirrors coated with aluminum films around a testing distance of 10 m.
Xia et al. [17] developed a movable MOP-TLAS platform combined with a retro-reflector array to continuously measure the atmospheric variations of the concentrations of methane and carbon dioxide over paths of up to 2.6 km. Zhu et al. [18] presented field deployment results of a portable MOP-TLAS for the localization and quantification of fugitive methane emissions, and the employment of a retro-reflector achieved the flexible measuring of different area sources under distances ranging from 1 to 1000 m.
The MOP-TLAS monitoring technology has made great breakthroughs in the telemetry range and concentration limit for methane detection in the oil/gas industry, but any deviation introduced by the laser transmission or the optical transceiver system will deteriorate the detectability and reliability of this technique [19]. Although the collimator can compress the divergence angle of the laser beam to a small range, the existence of the divergence angle will also lead to a decrease in parallelism of laser transmission with the increase in the detection distance.
In the MOP-TLAS monitoring system, a retro-reflector typically consists of three mirrors or reflective prism faces, which return an incident laser beam in the opposite direction [20]. It is obvious that the reflected laser echo is not a strictly parallel beam when it reaches the surface of the receiving lens. Since there is a certain off-axis angle between the laser echo and the optical axis of the receiving lens, the optical signal finally focused on the photodetector will inevitably have light intensity loss, which will intensify with the extension of the detection distance.
When laser absorption spectroscopy is used for gas remote detection in open space, weak signals carrying effective absorption information are extremely sensitive to optical noise, uncontrollable environmental noise, etc. Therefore, the more laser echo intensity received by the photodetector will be beneficial to improve the signal-to-noise ratio (SNR) of the system and further ameliorate the measurement accuracy [21,22,23,24]. To this end, several scholars have provided valuable resolves into this issue. In terms of concentration signal processing, Li et al. [25] applied normalized WMS-2f/1f to improve the sensitivity and robustness of methane continuous monitoring.
Some scholars also optimized from the perspective of the optical transmitter and receiver. Li et al. [26] introduced a focus-tunable lens into a TLAS telemetry collimation system to dynamically adjust the divergent performance of the laser beam to maximize the received optical signal in methane remote detection. To receive more signal light and enhance the signal-to-noise ratio, Xiao and Hu [27] used a lens and its focal length, the spot size of the reflecting surface and a filter plate to optimizing the optical path.
However, there are still some defects in the actual application of the above methods. Turning the focal length of collimator lens by controlling the current will increase the complexity of the system circuit and introduce more random noise. Optimizing the lens size and focal length is only a compromise improvement. The immutable parameters of optical receiving elements will be difficult to adapt to the change of telemetry distance.
In this work, a catadioptric optical receiver (COR), which consists of a Fresnel lens, cone reflector and parabolic reflector is proposed to improve the remote detection stability performance of the methane laser telemetry sensor in the non-cooperative target scenario. The relation between the convergence point offsets of the Fresnel lens and the incidence angle of laser echo is analyzed. The geometric configuration parameters of COR are optimized by the TracePro 7.4.3 optical software, and the condensing performance of COR is further verified. The COR model with optimal parameters is customized and deployed into the independently developed methane laser telemetry system and a signal receiving stability experiment under turbulence interference is carried out to evaluate the reliability of COR.

2. Methods

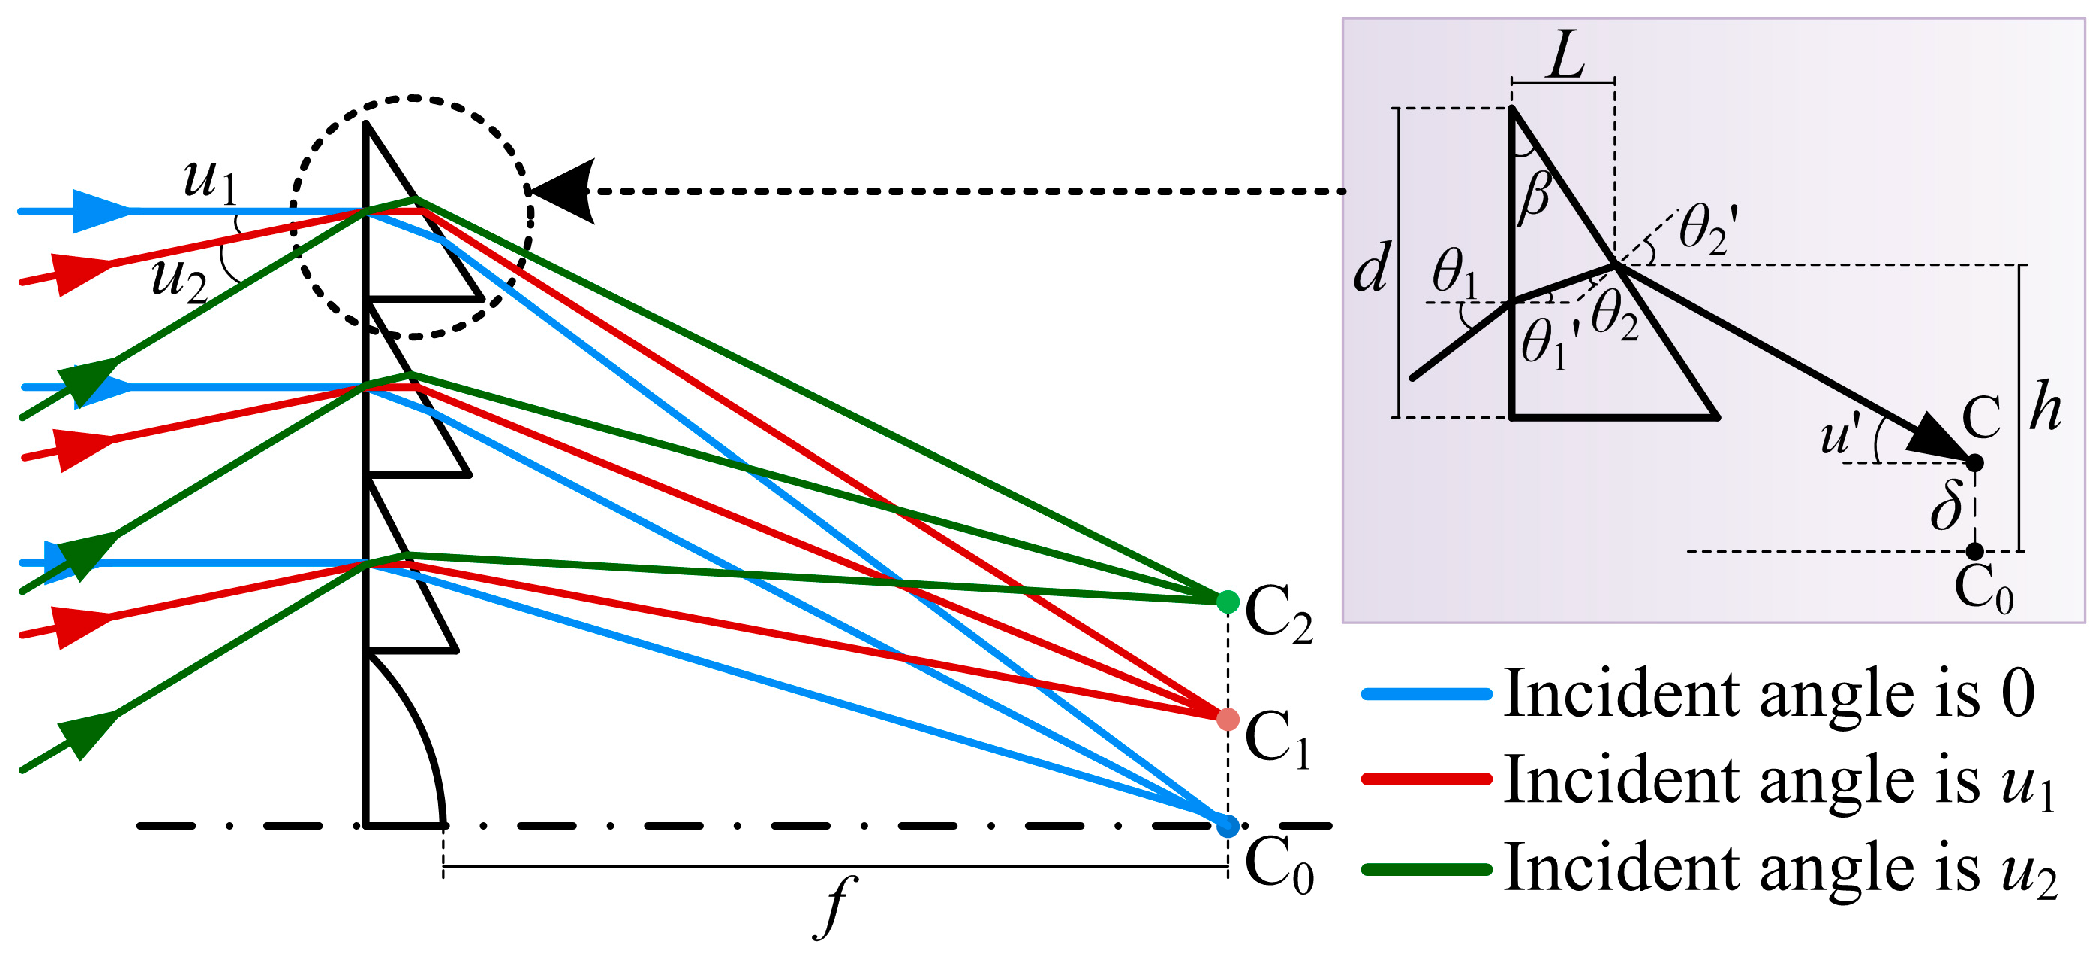
2.1. Optical Model of Convergence Point Offsets for Fresnel Lens

A Fresnel lens has a significant advantage in enhancing the receiver performance of light [28]. However, when the incident angle of echo light rays is not 0, it will affect the echo receiving power of the detector. The optical path of echo light rays with different incident angle is shown in Figure 1. u is the incident angle of echo light rays. u′ is the exiting angle of echo light rays. μ1 is the incident angle on the incident plane of the Fresnel lens. μ1′ is the refraction angle on the incident plane. μ2 is the incident angle on the exiting plane of the Fresnel lens. μ2′ is the refraction angle on the exiting plane. α is the vertex angle of the serrate prism. f is the focal length of the Fresnel lens. L is the horizontal distance between the exiting point and the incident plane. h is the vertical distance between the exiting point and the optical axis. δ is the deviation of the echo light ray convergence point. Additionally, n is the refractive index of the Fresnel lens.
According to the refraction law and the geometric relationships, the refraction angle of each interface can be derived as follows:
u = θ 1
θ 1 = arcsin ( sin θ 1 / n )
u = arcsin n sin β i + θ 1 β i
tan u = h δ f ( d / 2 ) tan β
By combining the above equations, it can be obtained that the convergence point offset of a Fresnel lens is
δ = h f tan arcsin n sin α + arcsin ( sin u / n ) α + d 2 tan α tan arcsin n sin ( α + arcsin ( sin u / n ) ) α

2.2. Optical Model of Segmentation Cell of a Parabolic Reflector for COR

When the echo light rays are parallel to the optical axis of the Fresnel lens, the signal reception performance of the methane laser telemetry sensor can be greatly improved, but with a poor focusing ability to the echo light rays with a large off-axis angle. A composite parabolic concentrator (CPC) can be designed with a large field angle, but its light gathering performance is low. In the fields of solar photovoltaic and visible light communication, the Fresnel lens and composite parabolic reflector are usually combined to form a secondary focusing system [29,30].
Therefore, based on the design idea of multi-layer structure decomposition and multi-level light gathering, a novel catadioptric optical receiver that consists of a Fresnel lens, cone reflector and parabolic reflector is proposed, and its parameters are optimized using TracePro optical software. The parabolic reflector can be divided into multiple annular condenser cells. The reflected optical path of the echo light ray in each cell is shown in Figure 2.
As shown in Figure 2, the incident aperture of the annular condenser cell is R1, the exit aperture is R2, the length is L, the reflecting surface inclination is tan β, the angle between the echo light ray and the optical axis is u′, the horizontal distance between the reflection point and the incident port is l, and the distance from the falling point of the outgoing light to the photosensitive surface of detector along the radial direction to the edge of photosensitive surface is d, which can be obtained from the geometric relationship:
d = tan 2 β + u tan α L 1
Only when 0 < d < 2R2 is met can the incident light can be received by the photosensitive surface of the detector.

3. Results and Discussion

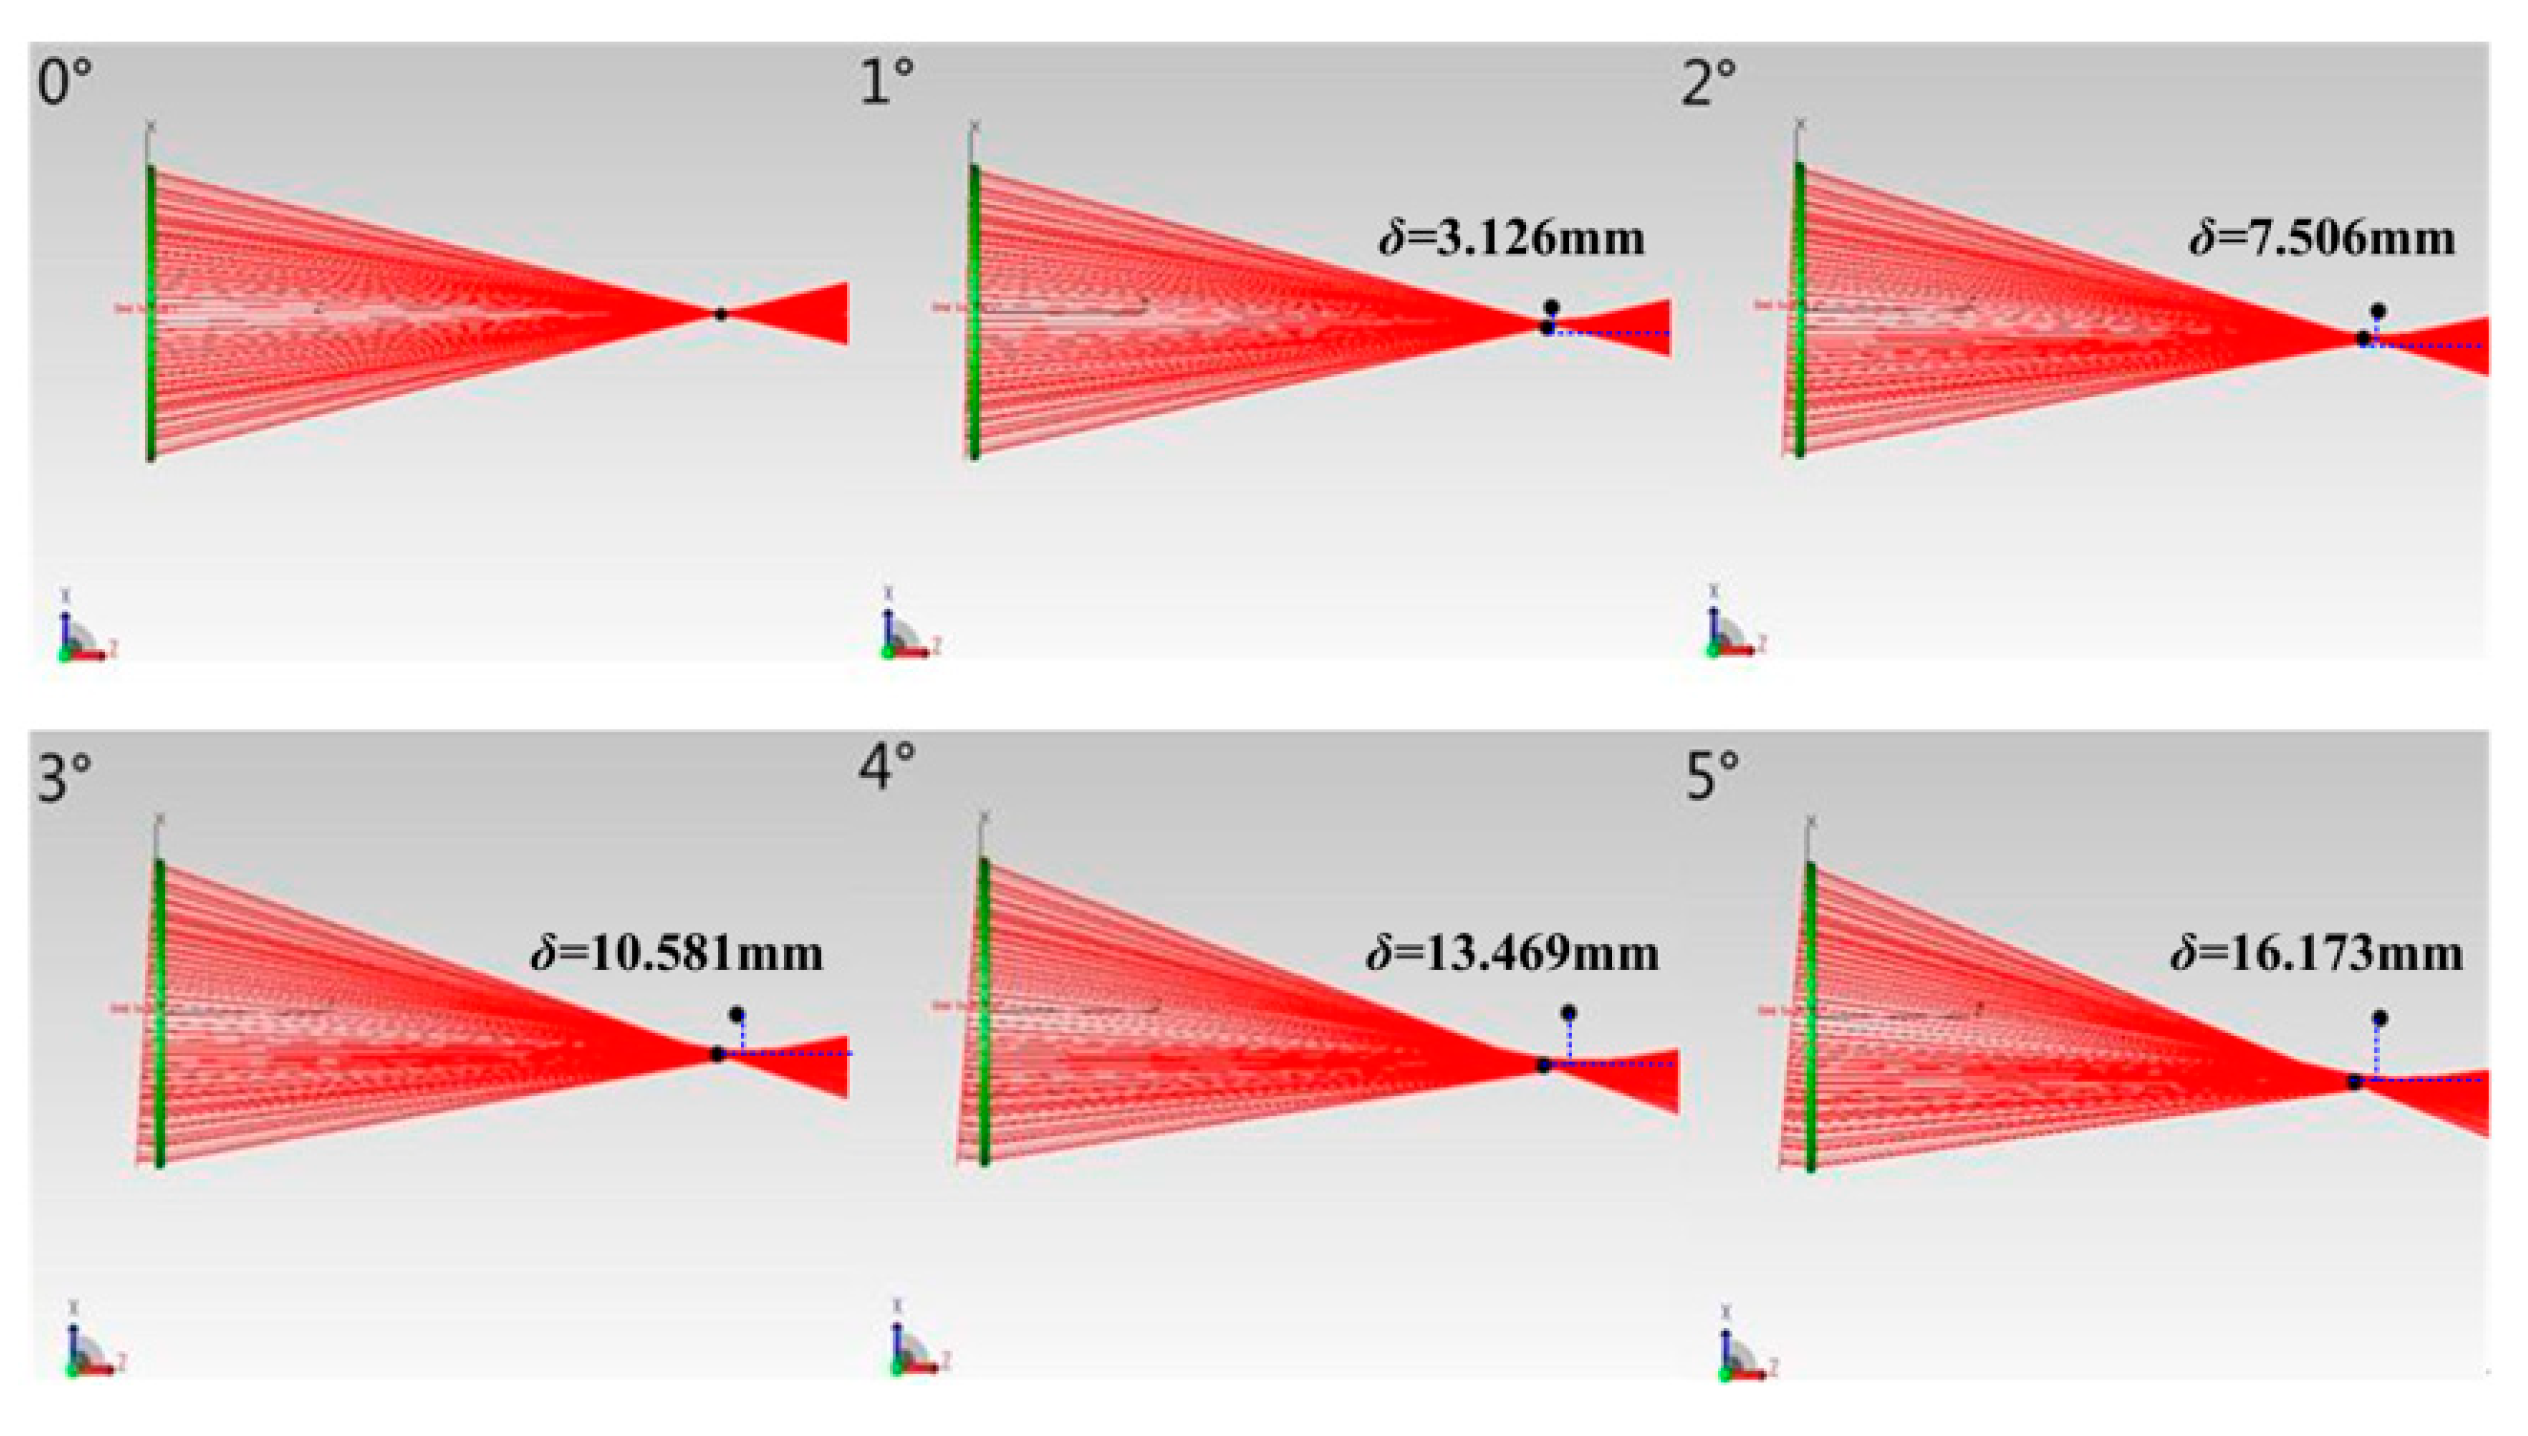
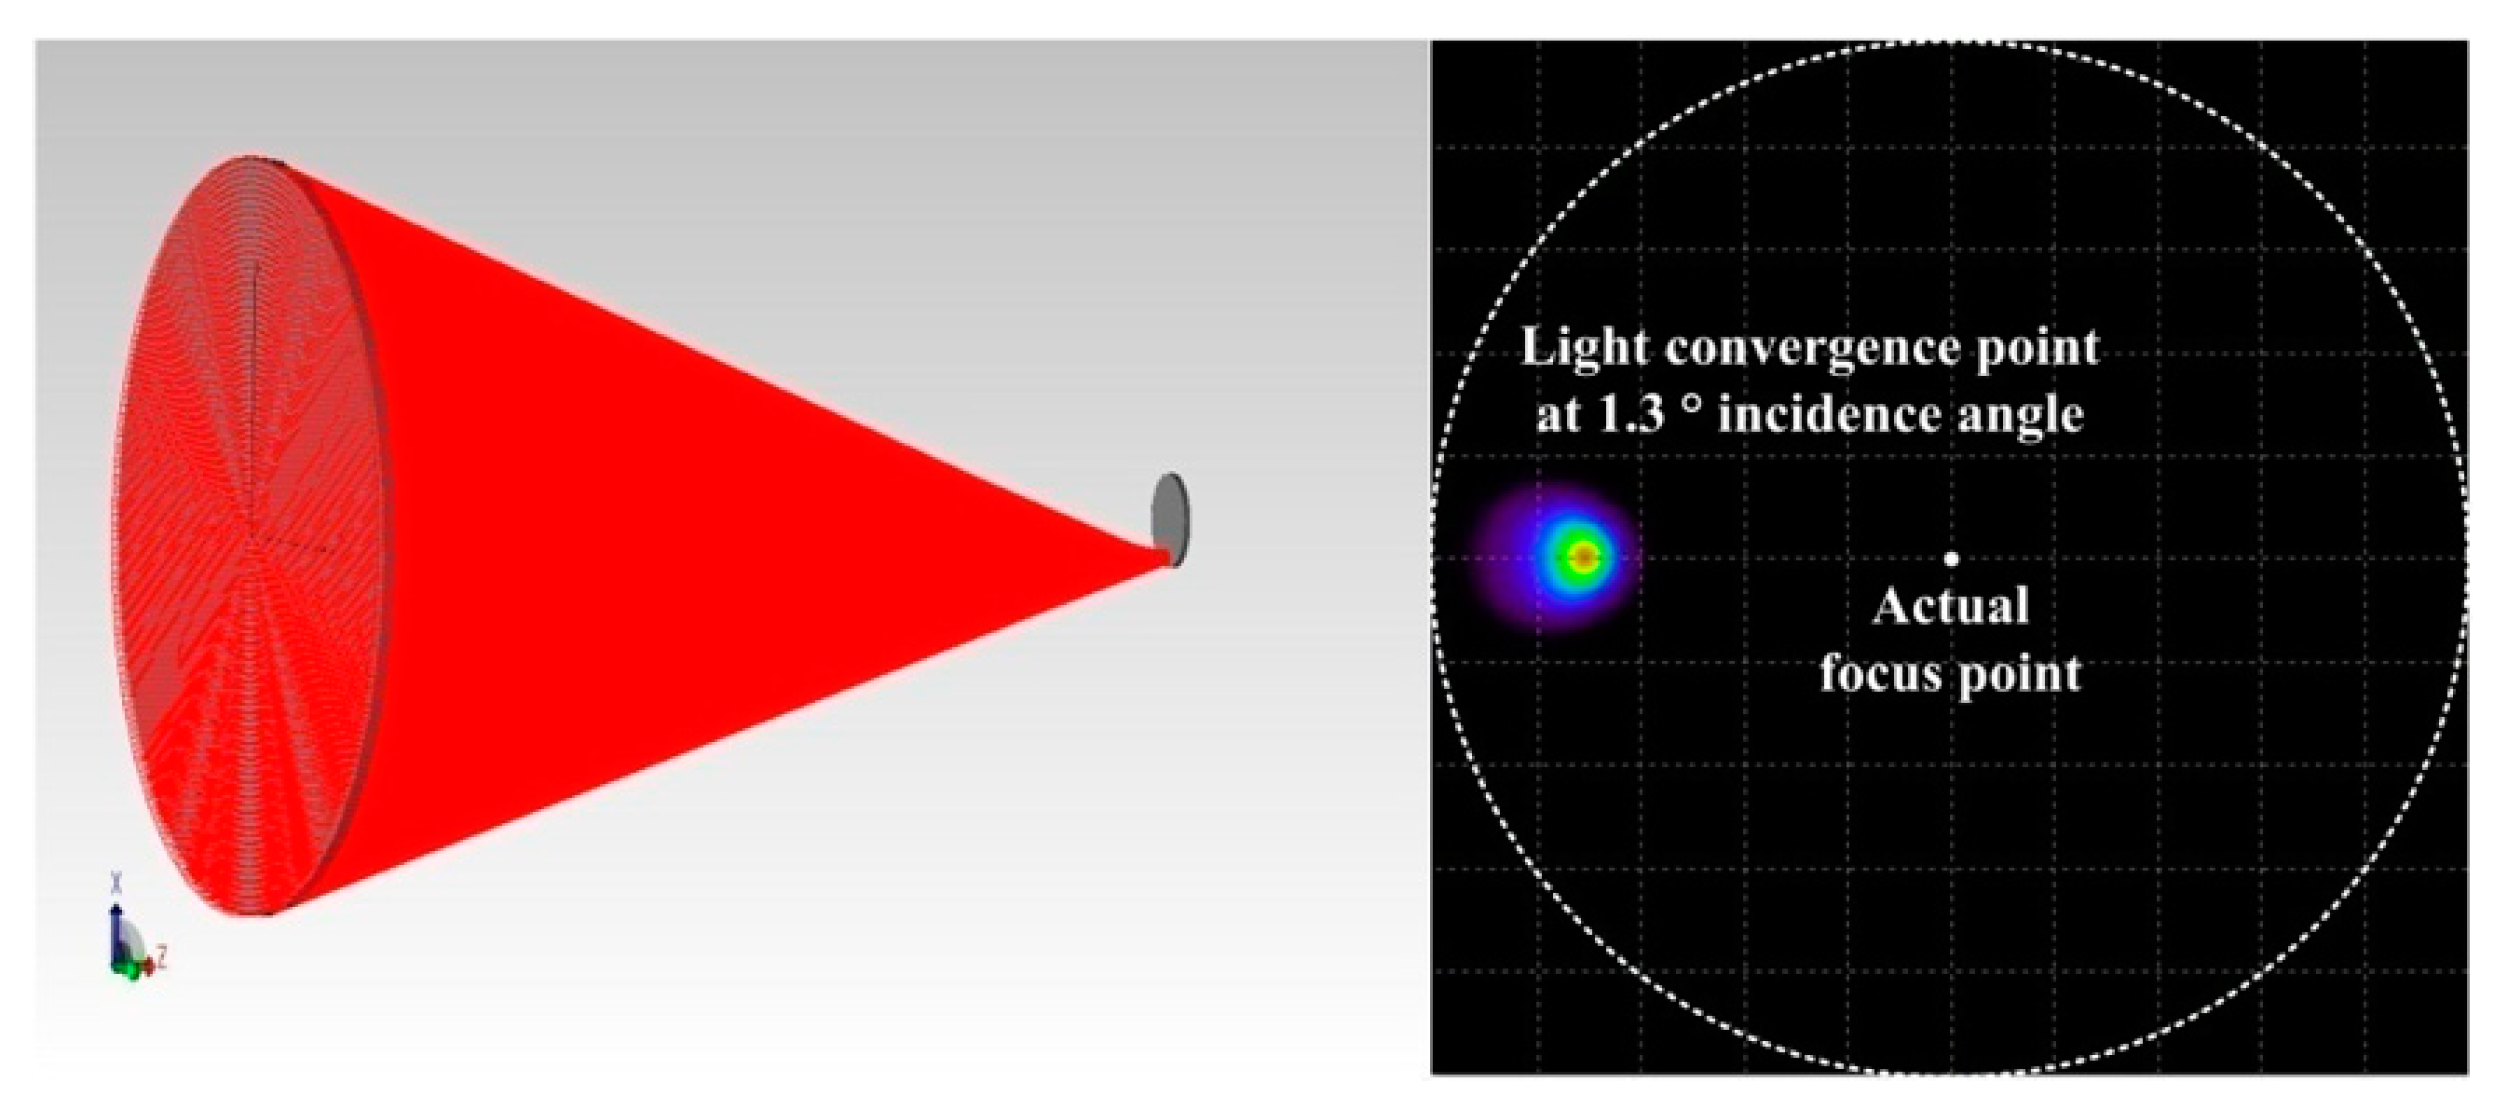
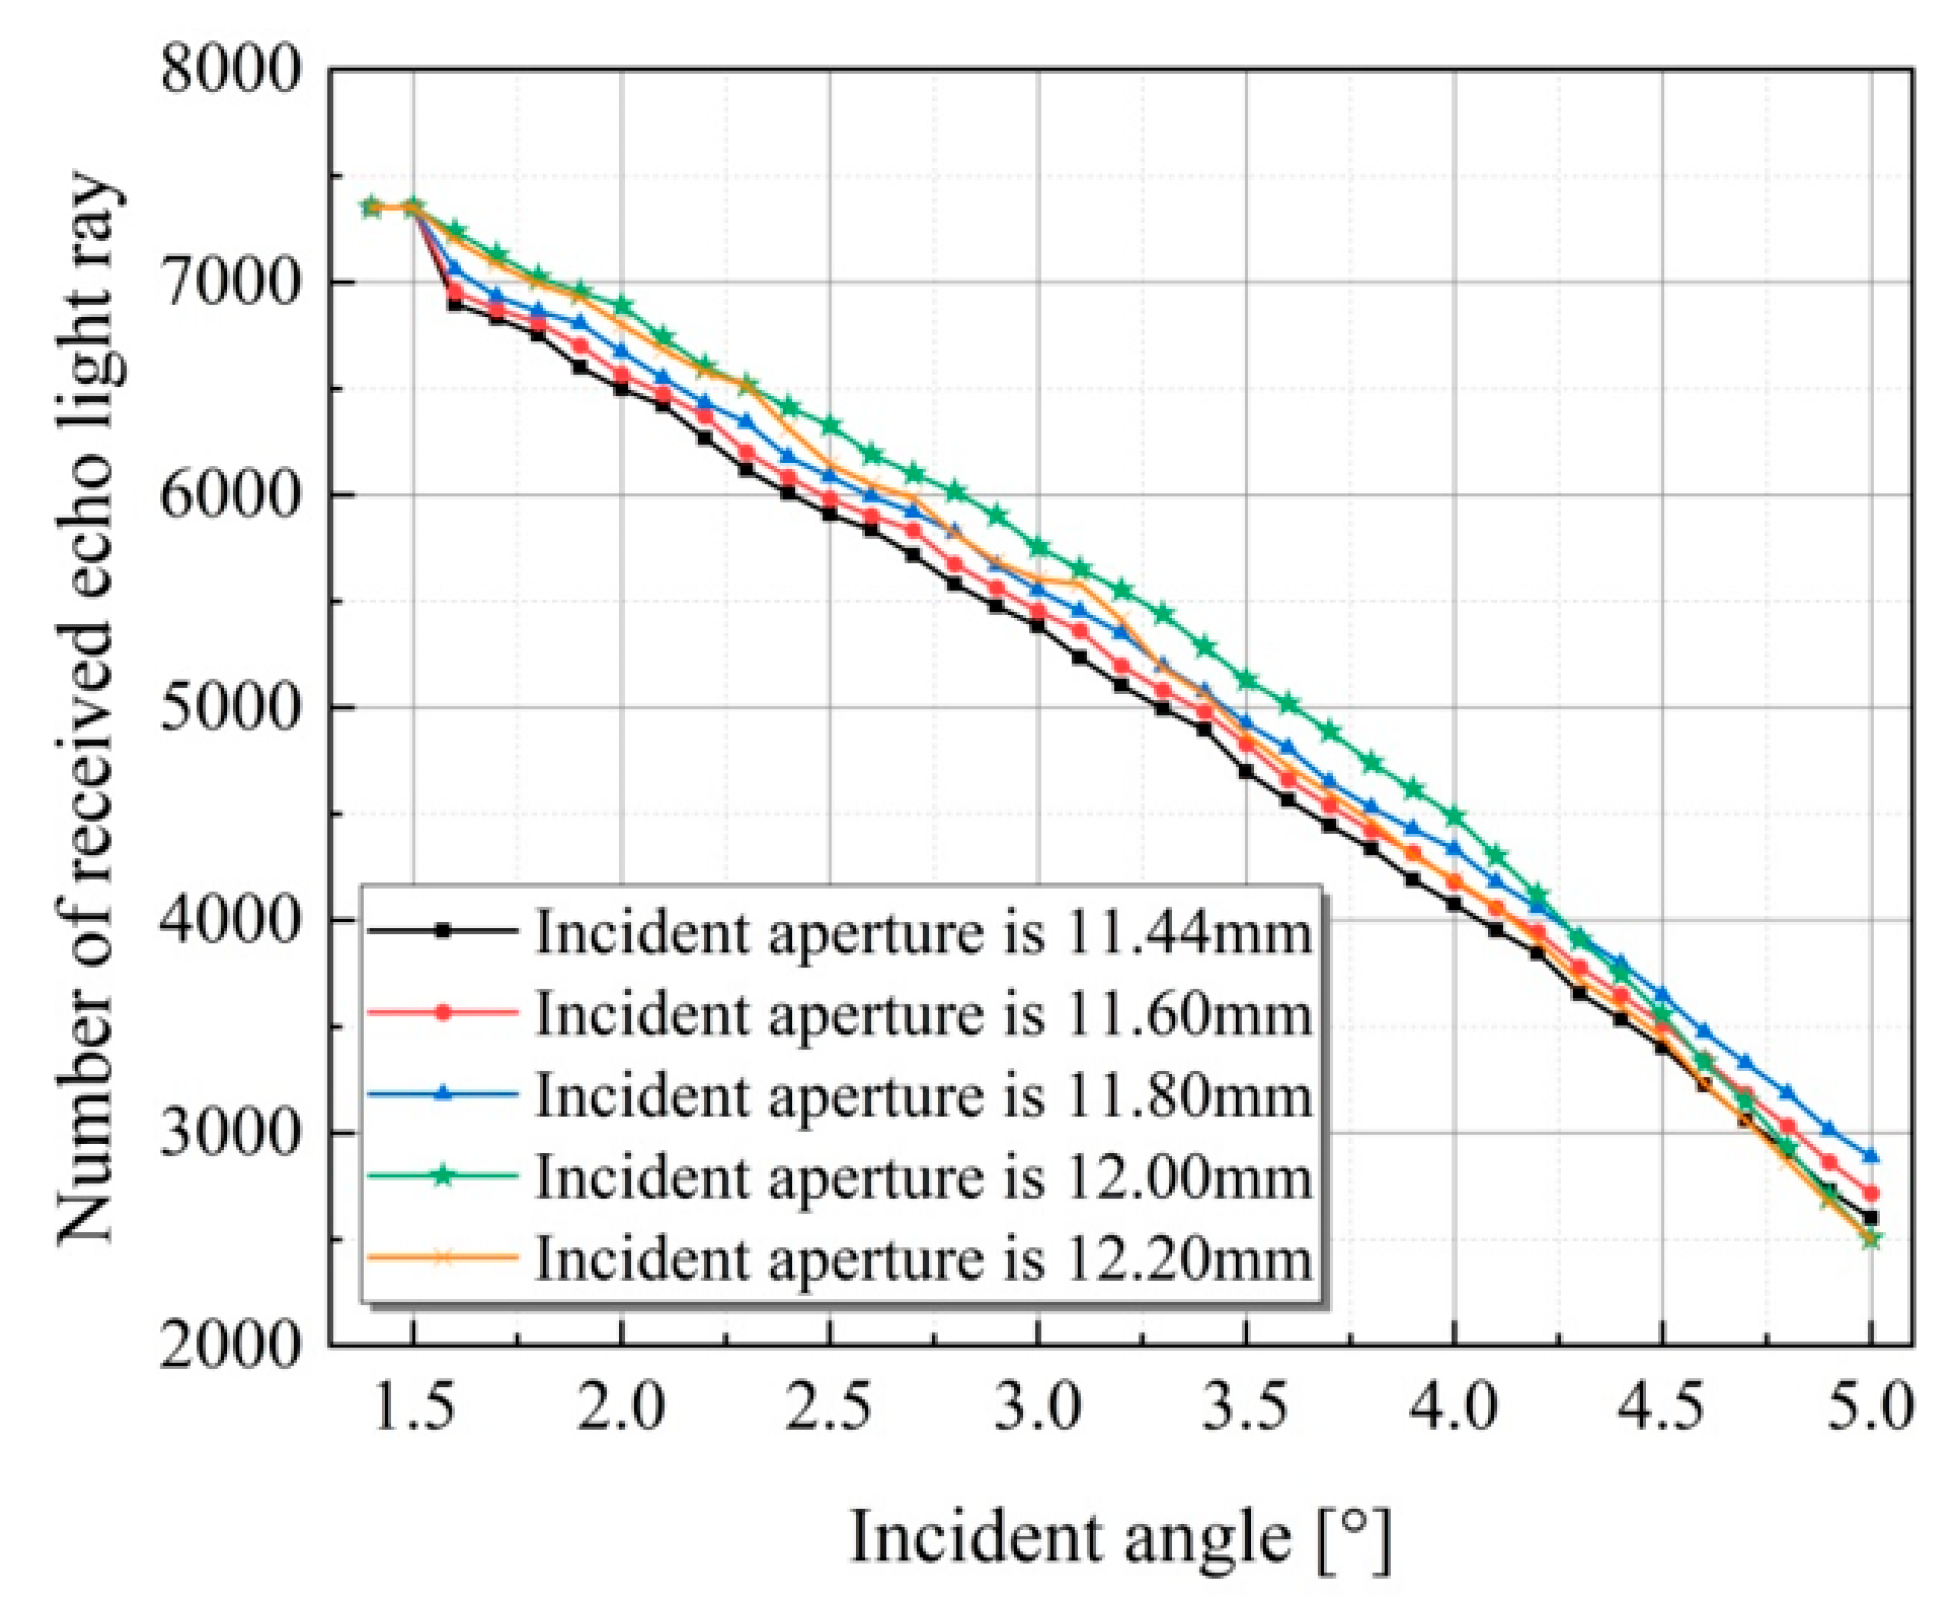
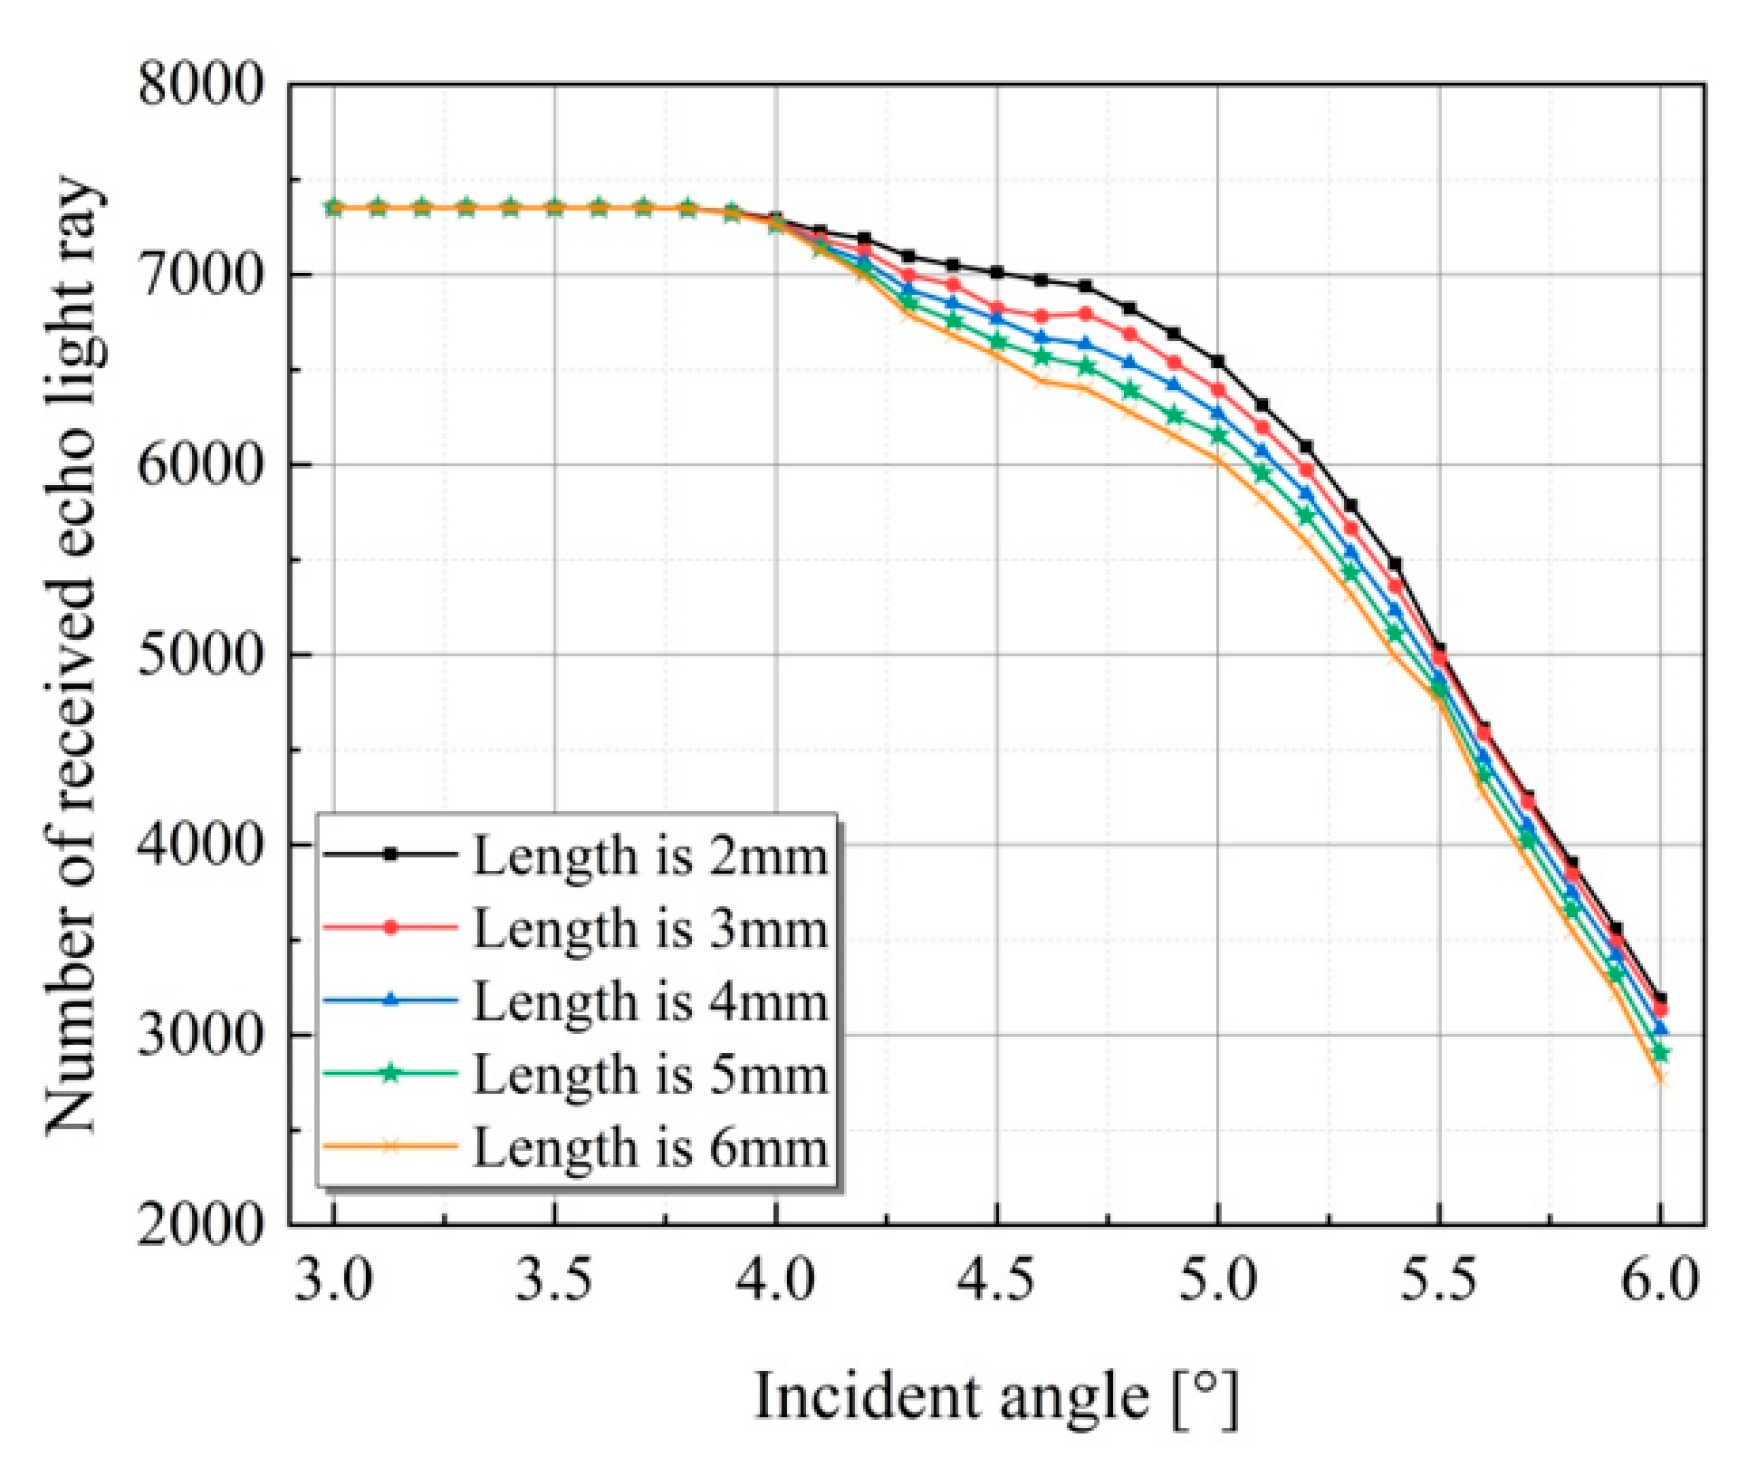
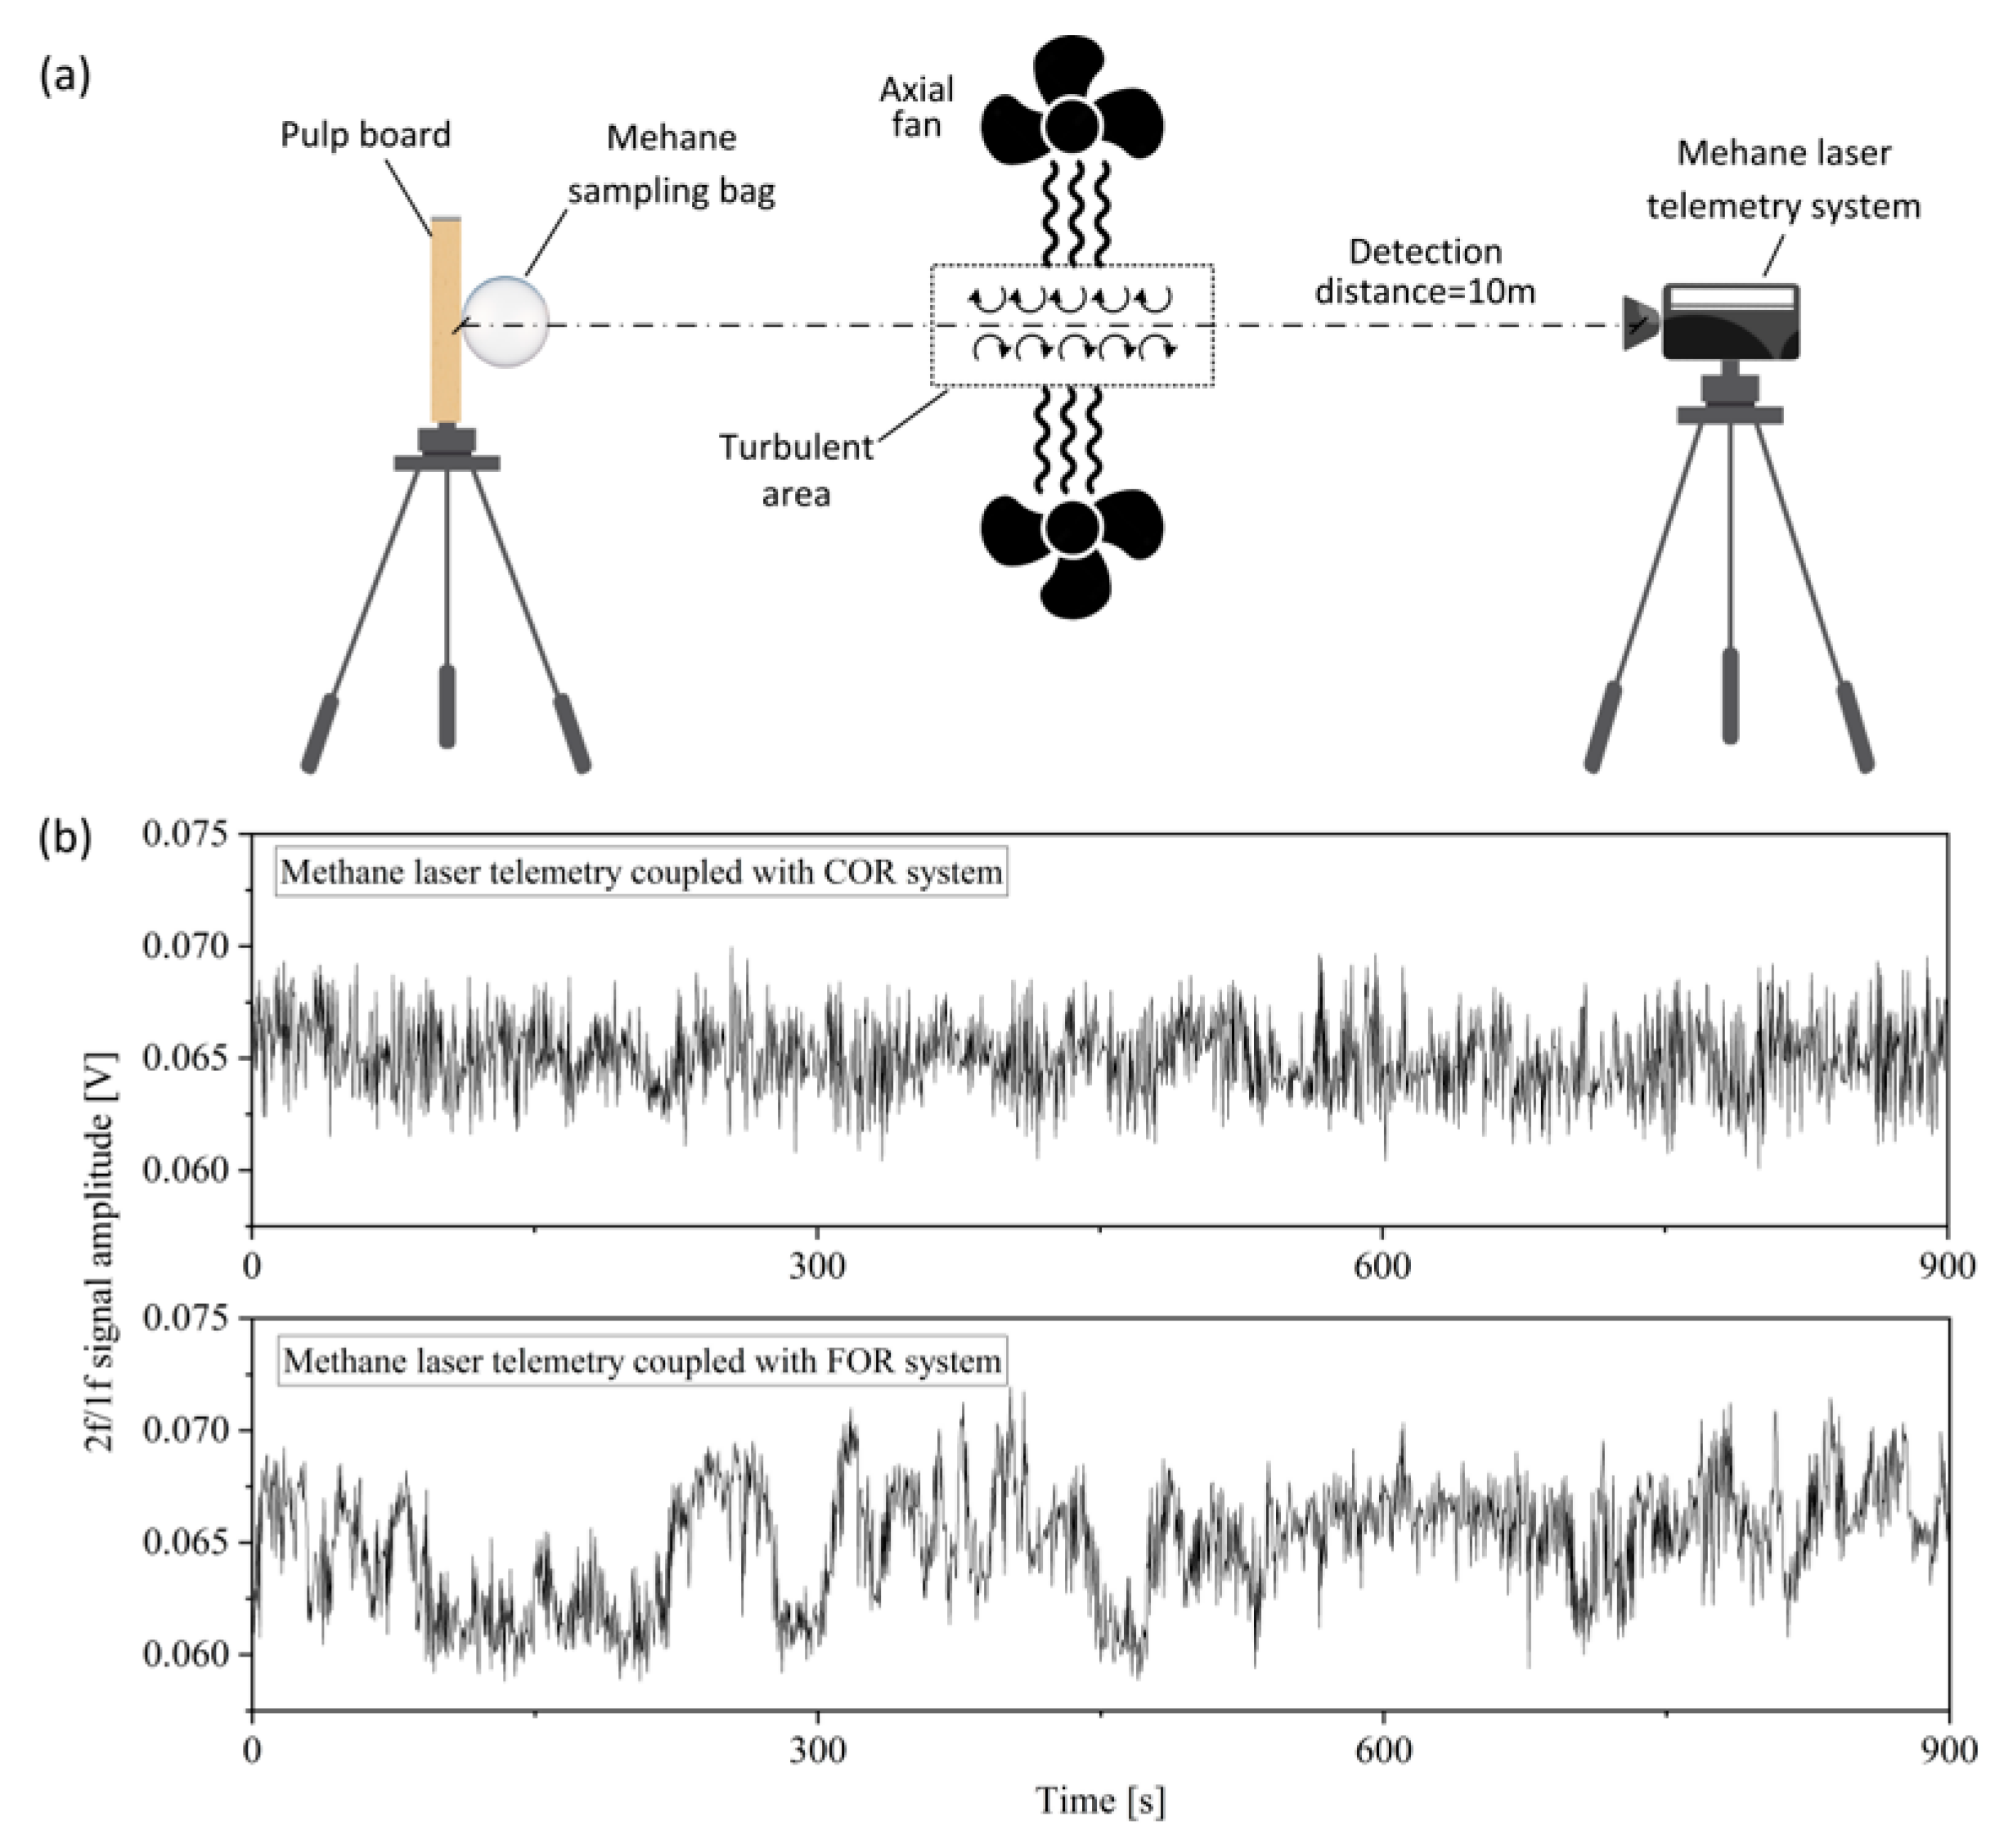
3.1. Structural Parameters for Optimization Analysis of COR

The modeling and simulation of the Fresnel lens was implemented in TracePro software, and its specific parameters are shown in Table 1. As shown in Figure 3, the incident light rays from 0° to 5° were traced, and the deviation of the convergence point is marked. As the incident light gradually deviates from the optical axis of the Fresnel lens, the focal shift along the X-axis direction (i.e., the radial direction of the Fresnel lens) increases proportionally with the change of the incident angle, and the focal shift is about three times the incident angle, which is consistent with the analytical result of Equation (5).
The simulation analysis of the Fresnel lens optical reception in TracePro software was performed, and a receiving plane with a size of 5 mm at the focus of the Fresnel lens as the photosensitive surface of the detector was added. As shown in Figure 4, the optical efficiency was 82.5% at the incident angle with 1.3°. According to the definition of the receiving angle of the condenser system, the incident angle corresponding to 90% of the optical efficiency under the vertical incidence was the receiving angle. Due to the absorption loss when the light passes through the semi-transparent medium, the maximum optical efficiency of the Fresnel lens in this paper was 92.2%. Therefore, the receiving angle was 1.3° for the single Fresnel lens used as the condenser.
When the incident angle of the echo light ray was less than 1.3°, the detector could achieve the maximum optical efficiency only by using a Fresnel lens. Therefore, the functional contribution of COR was started from an incident angle greater than 1.3°. When the incident angle was greater than 1.3°, the parabolic reflector part of COR was optimized and analyzed according to the edge-ray principle.
The principle is as follows: the optical receiving efficiency of the detector under angle-by-angle light ray is maximized, and a light ray that has entered the reflection cell cannot escape through secondary reflection. Considering the complexity and cost of the actual preparation process, the parabolic reflector part of COR is divided into the annular condenser cells with a length L1 of 2 mm, and the exit aperture is R2, 1 of the first-stage annular condenser cell is set to be 5 mm. When the incident angle of the echo light ray is 1.4°, the first-stage annular condenser cell model with incident apertures of 5.2, 5.4, 5.6, 5.8, 6.0, 6.2 and 6.4 mm is ray-traced, and the simulation results are shown in Figure 5.
The amount of light received on the detector can be increased by adjusting the incident aperture. However, when the radius of the incident plane reaches 6.4 mm, some light rays have been reflected. Further analysis of the 6.3 mm aperture model shows that the incident light is also reflected. Therefore, the incident aperture corresponding to the best focusing effect of 1.4° incident light is 6.2 mm. However, when the incident aperture reaches 6.4 mm, some light has been reflected from the model.
Further analysis of the 6.3 mm incident aperture model shows that a small amount of the echo light ray also escapes. Therefore, for the echo light ray with an incident angle of 1.4°, the incident aperture corresponding to the best focusing effect is 6.2 mm. In this case, the optical receiving efficiency of detector does not reach the maximum value, because a small amount of light rays are projected on the incident aperture edge. When the second-stage cell is added, the extended overall length will improve this problem.
Similarly, the exit aperture of the previous stage is used as the incident aperture of the next stage. By changing the reflecting surface inclination, the structural parameters of the annular condenser cell at all stages can be determined in turn, as shown in Table 2.
The structural parameters were input into MATLAB (R2018b) software for curve fitting to obtain the parabolic equation. The incident aperture of parabolic reflector part was 11.44 mm, the exit aperture was 5 mm, and the length was 24 mm. The optical receiving efficiency of the parabolic reflector part of COR is shown in Figure 6. The parabolic reflector part had good focusing performance for the echo light in the range of 0° to 2.9° of the incident angle. With the continuous increase in the incident angle, its focusing performance dropped sharply.
When the incidence angle was 5°, its optical receiving efficiency was only 27.2%. The main reason is that the length of the parabolic reflector is short, and the shift of the convergence point of the echo light rays is about three times of the incident angle, which means that most of the light rays cannot enter the parabolic reflector. Therefore, further optimization and analysis can be carried out by adding the cone reflector at the front of the parabolic reflector part and changing the reflecting surface inclination and length.
The length of the first-stage cone reflector was set to 2 mm, the exit aperture is known to be the same as the incident aperture of the parabolic reflector, and the reflecting surface inclination can be changed by changing the incident aperture of cone reflector. The cone reflector model with incident apertures of 11.44, 11.6, 11.8, 12, 12.2, 12.4 and 12.6 mm was built, and the concentrating performance simulation of the echo light rays under different incident angles was implemented. The number of echo light rays for each incident angle condition was 7351, and the number of echo light rays received by the detector is shown in Figure 7.
The echo light rays can be fully received by the detector regardless of the incident aperture when the incident angle is less than 1.5°. When the incident angle changed from 1.6° to 4.2°, the number of echo light rays received by the detector first decreased and then increased with increasing incident aperture. The maximum value was achieved when the incident aperture was 12 mm. When the incident angle ranged from 4.2° to 5°, the change trend of the number of echo light rays received by the detector was consistent with that of the former.
However, the number of received echo light rays reached a maximum at the incident aperture of 11.8 mm. Considering the design principles and practical manufacturing difficulties, the incident aperture of the first-stage cone reflector was set as 12 mm. Thus, when the reflecting surface inclination was 0.28, there was an optimal solution for the concentrating performance under the incident angel changed from −5° to 5°.
The reflecting surface inclination and incident aperture were set and maintained as constant for the first-stage cone reflector. It should be noted that the first-stage cone reflector was given a length change only. To ensure that the light passing through the Fresnel lens was not blocked when entering the COR, a Fresnel lens installation section with an inner diameter of 50 mm and a length of 4 mm was designed at the COR front end. In addition, the second-stage cone reflector was added, and its incident aperture was consistent with the size of the Fresnel lens.
The ray-tracing simulation was performed, and the number of received echo light rays by the detector is shown in Figure 8. The different length combinations of the first-stage and second-stage cone reflectors determine the concentrating performance for the echo light rays with an incident angle greater than 3.9°. With the increase in the incident angle, the increase in the length of the first-stage cone reflector led to increasingly less echo light rays on the detector. When the length was 2 mm, the echo light rays were better received by the detector.
The complete optical structure of COR was obtained through optimization design as shown in Figure 9. COR was successively connected by the Fresnel lens installation section, the second-stage cone reflector, the first-stage cone reflector and the parabolic reflector. The Fresnel lens was located at the incident end. When the incident angle of the echo light rays were less 1.3°, the echo light rays were directly focused on the detector by the refraction of the Fresnel lens.
For echo light rays with incident angle greater than 1.3°, the echo light rays first pass through the refraction of the Fresnel lens, some of which can be directly incident to the detector, and the rest enter the detector through multiple reflections of the cone reflector and parabolic reflector. In order to evaluate the optical receiving performance of COR, two optical models, the single Fresnel lens optical receiver (FOR) and the Fresnel lens and parabolic reflector combining optical receiver (POR) were established in the TracePro software as the contrast reference.
The simulation analysis of the echo light ray receiving performance was conducted, and the results are shown in Figure 10. When the incident angle of echo light ray was 0°, the optical receiving efficiencies of all three optical receivers were 92.2%. Thus, the Fresnel lens of these three optical receivers plays a direct focusing role when the echo light rays are parallel to the optical axis. As the incident angle increases gradually, the optical efficiency of these three optical receivers declines. COR was compared with FOR: the optical receiving efficiency of FOR was reduced to 0 when the incident angle was greater than 2°. Thus, the detector could not receive the echo light ray.
In comparison, the concentrating performance of COR with an incident angle greater than 2° was significantly improved. According to the definition of the receiving angle, the receiving angle of FOR was only 1.3°, while the receiving angle of COR was 4.9°, which is 3.8 times that of FOR. At this time, the optical efficiency of COR was 83.5%. Compared with POR, COR and POR had basically the same optical receiving efficiency in the incident angle variant range of 0° to 2°. When the incident angle was between 2° and 5°, the optical efficiency of COR was 30% higher than that of POR. When the incident angle was greater than 5°, although the optical efficiency of both decreased rapidly with the increase in the incident angle, the optical efficiency of COR was still palpably higher than that of POR.

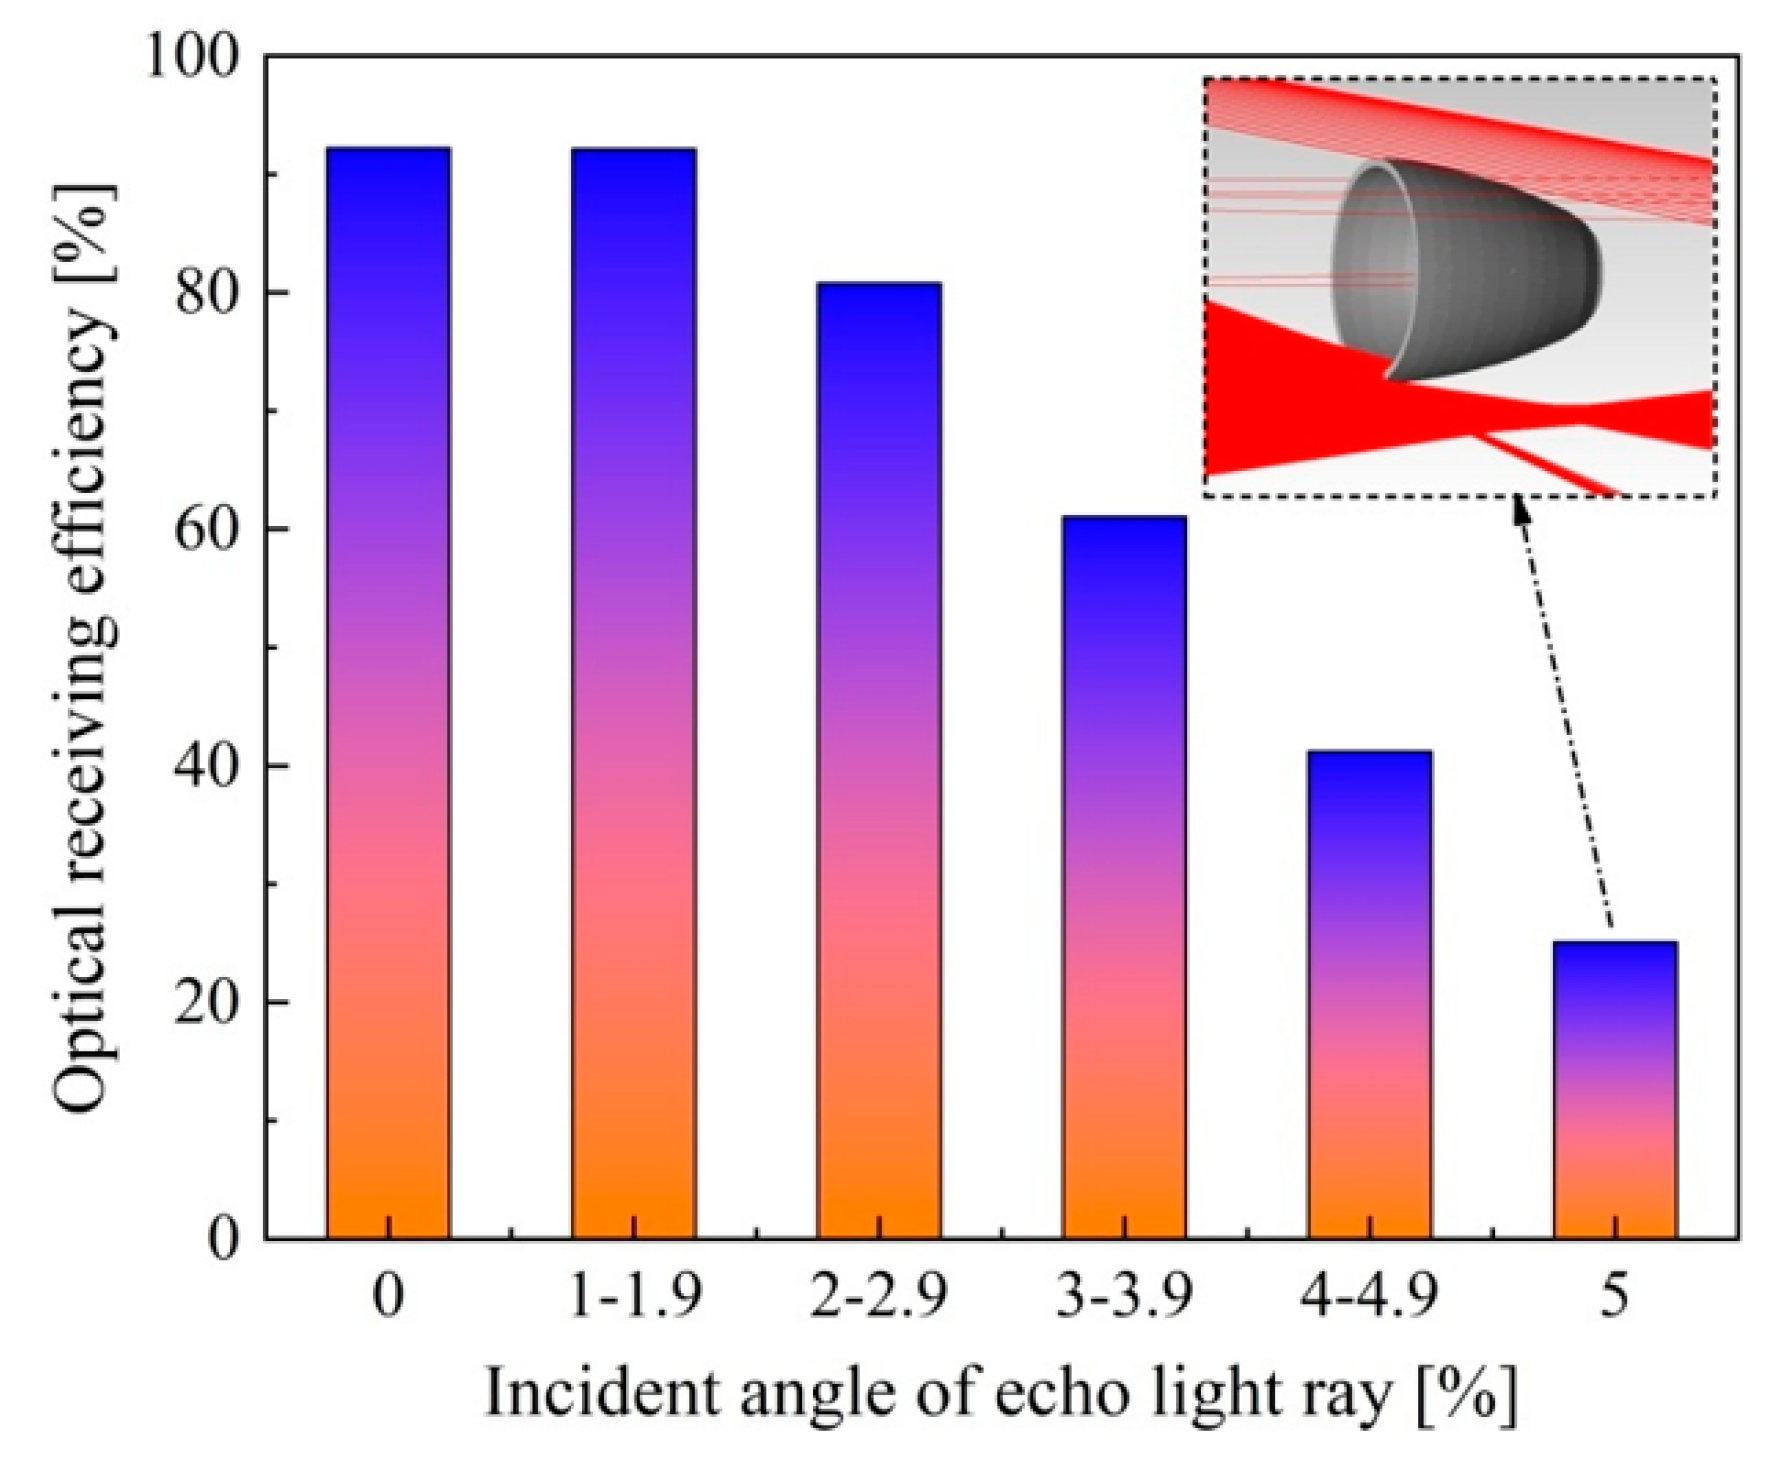
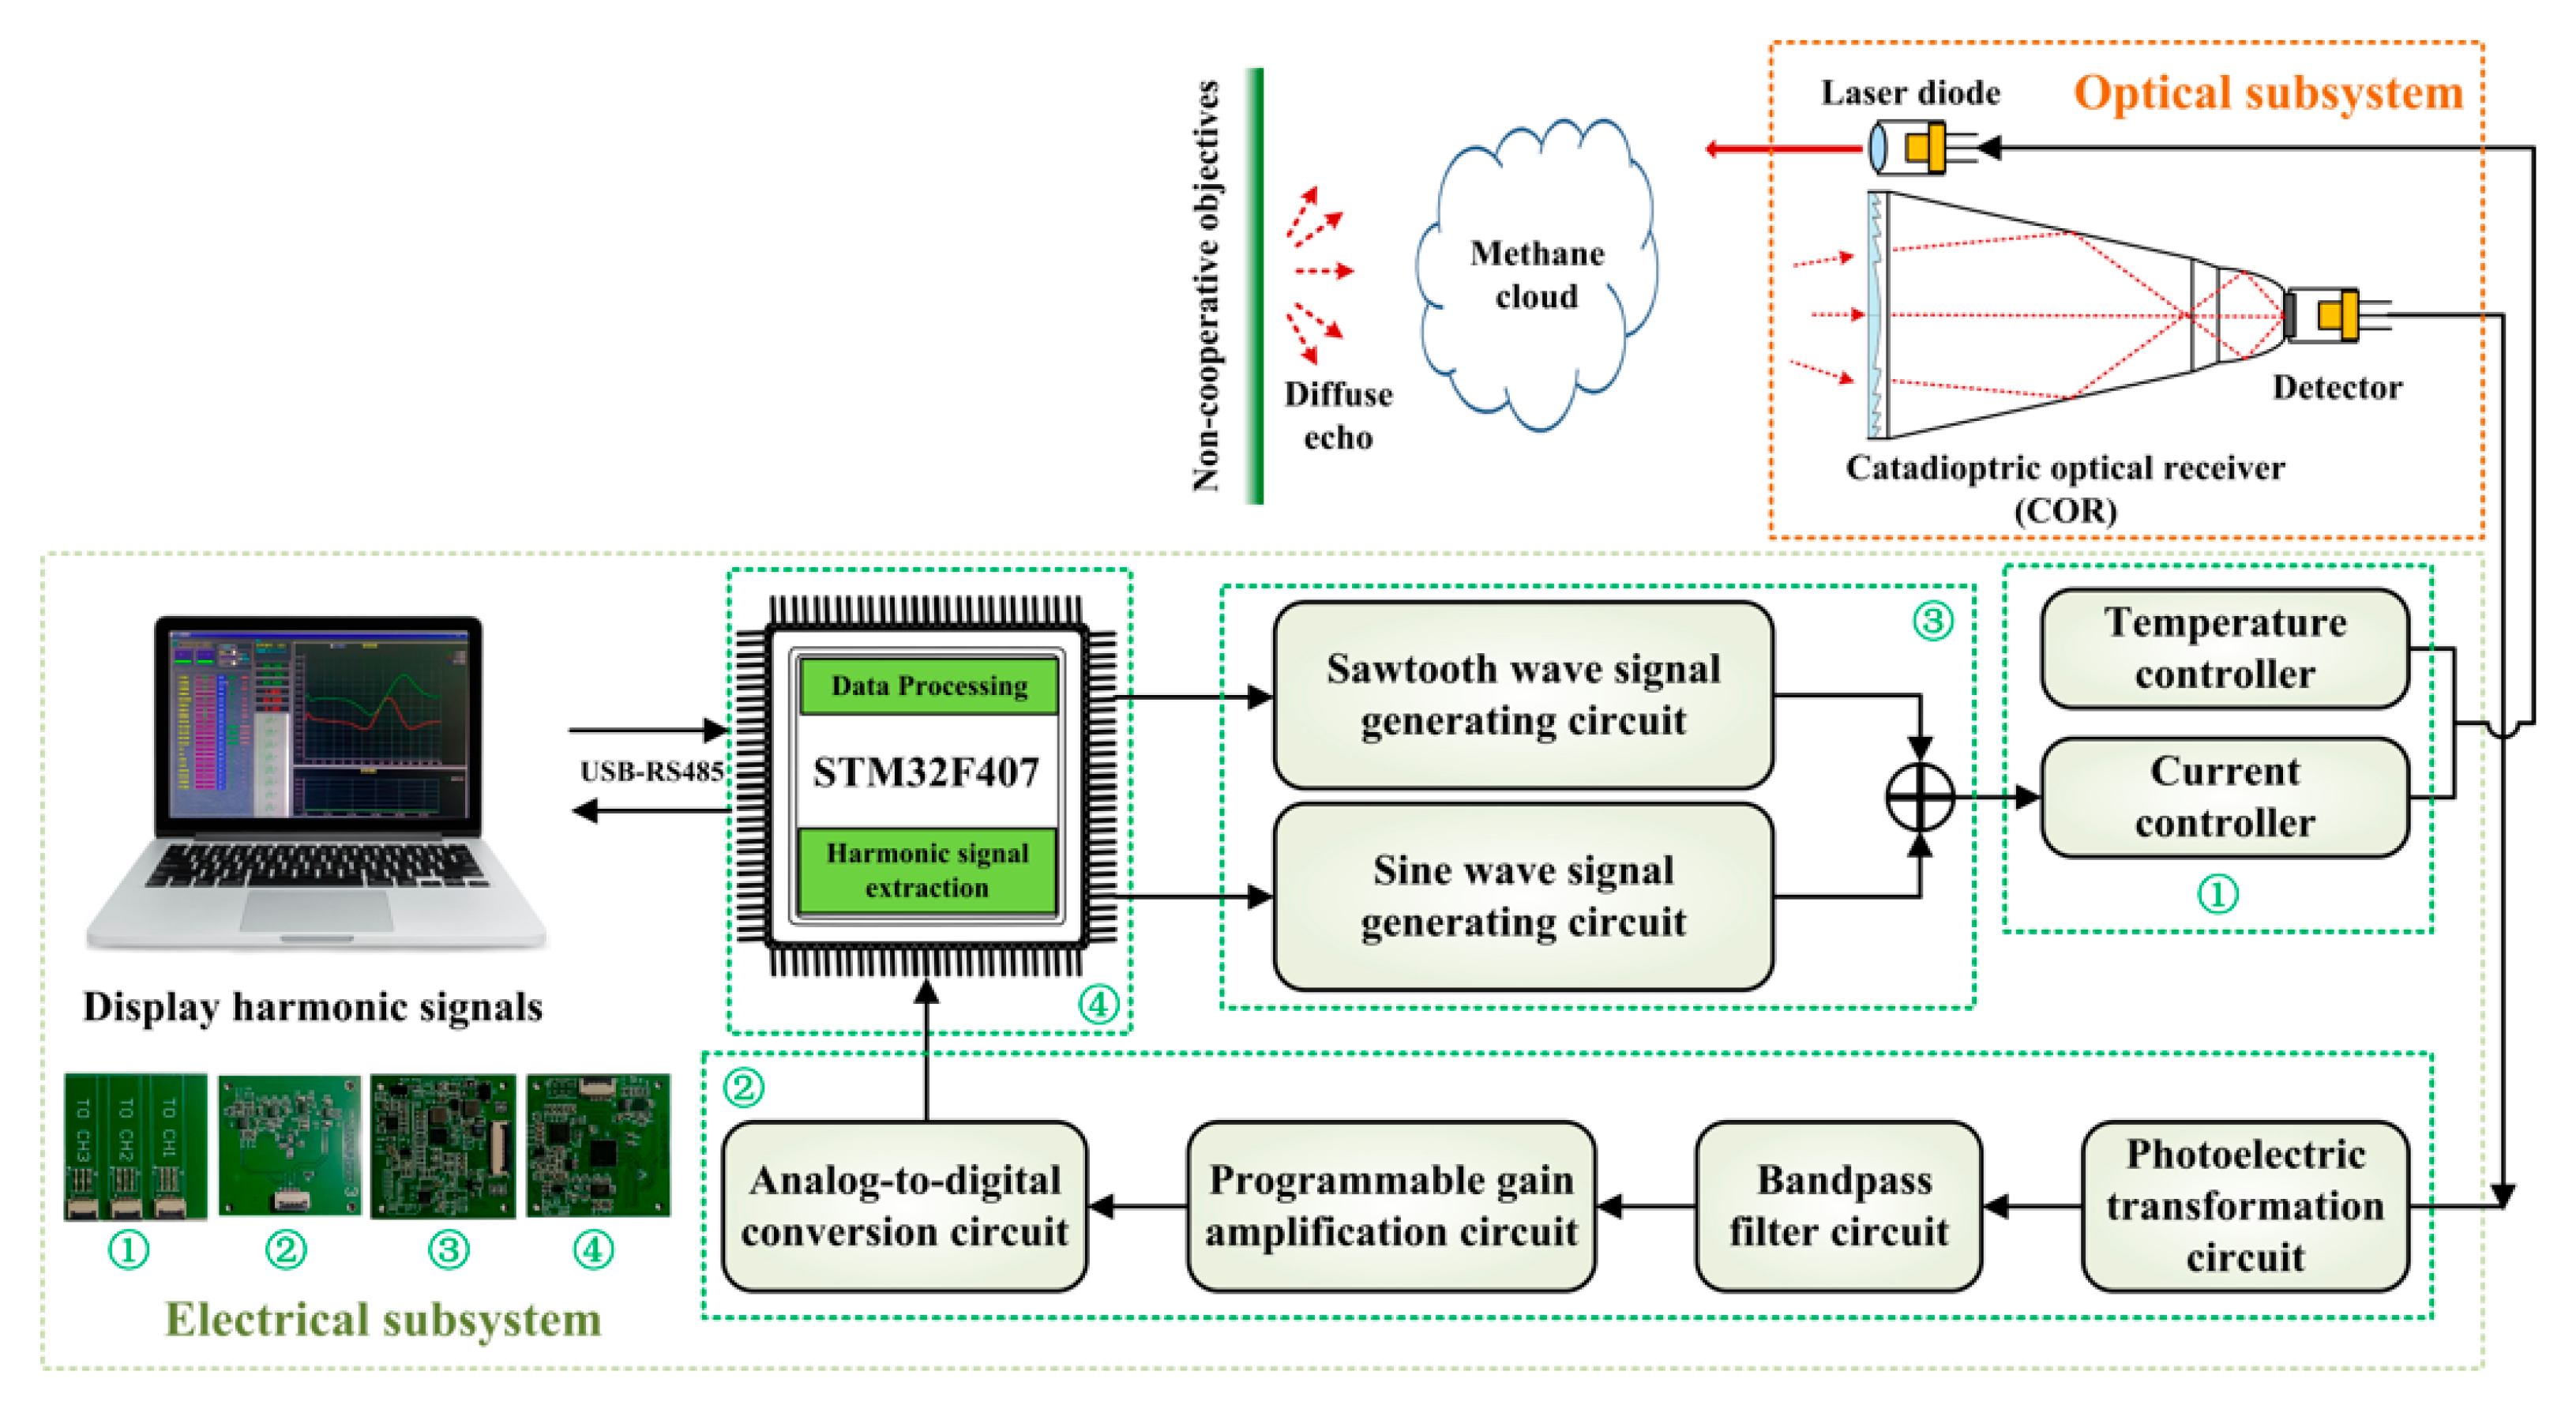
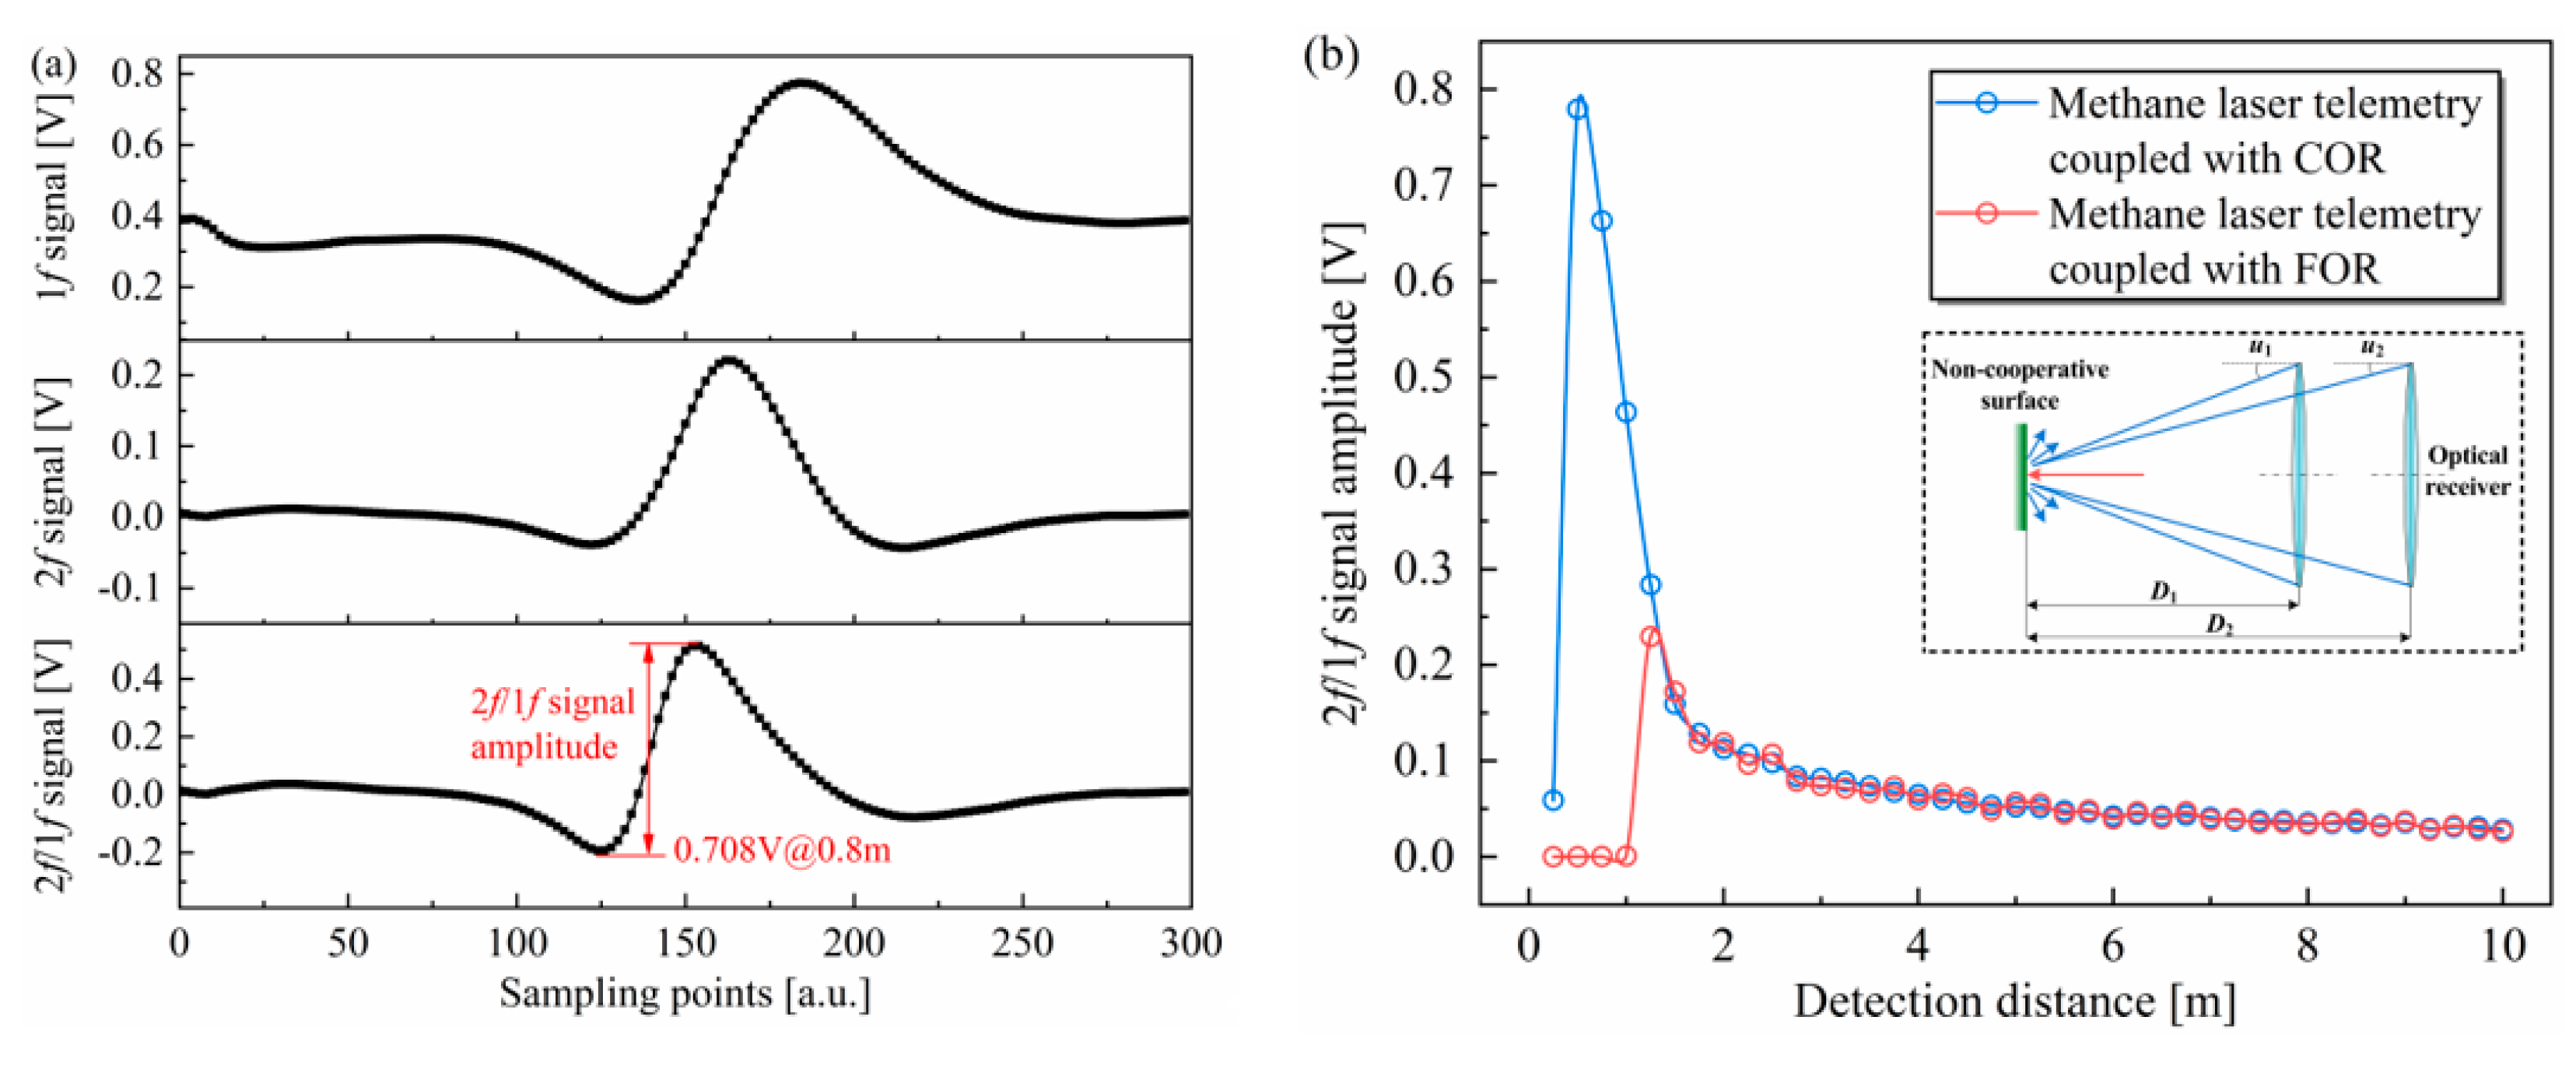
3.2. Performance Analysis of Methane Laser Telemetry Coupled with the COR System

The schematic of the independently developed methane laser telemetry coupled with the COR system is shown in Figure 11. The sensor architecture mainly includes an optical subsystem and electrical subsystem. In the optical subsystem part, a single-mode continuous distributed feedback laser diode (EP-1653-DM, Eblana Photonics, Dublin, Ireland) using a TO39 package structure was employed as the laser sources with the wavelength ∼1653.7 nm (corresponding to the absorption features of methane), output power of 10 mW and optical linewidth of 2 MHz. A K9 Plano convex lens (100006, United Optical Technology (Beijing) Co., Ltd., Beijing, China) was involved to control the divergence angle of the laser beam and was installed on the optical lens mounts in front of the laser diode.
The collimated emission laser beam was diffusely reflected by the non-cooperative target (white latex paint wall) after passing through the methane cloud. The echo light was collected by the COR to ensure the reception strength of the laser echo signal. A Fresnel lens (Φ = 50 mm, f = 93 mm) functioned as a refraction tool of COR to take the lead in receiving as many echo signals as possible. A stereolithography-600 3D printer (Shenzhen Sogaworks Technology Co., Ltd., Shenzhen, China) was used to fabricate the reflective cavity part of COR, and the inner wall of the reflective cavity was plated with a silver film. The reflectivity reached more than 95%.
The COR was embedded in the stacked lens tubes to maintain the mechanical stability. An InGaAs PIN photodiode (LSIPD-L2.5, Beijing Lightsensing Technologies Ltd., Beijing, China) was placed at the exit end of COR to transform the optical signal into an electrical signal. The active diameter was 2.5 mm, and the spectral responsivity was 0.83 mA/mW. Since the spectral reception range of the photodetector was optical signals of all wavelengths from 800 to 1700 nm, a visible light band-pass filter was configured to filtrate out the ambient background stray light. The STM32F407 Microcontroller unit was the main controller for the electrical module.
Excellent linearity and smoothness of the saw tooth wave shape was achieved using a circuit that generated waves with numerical control of the baseline and slope. Combined saw tooth and sine waves were used as laser driver signals. The operational amplifiers were adopted in the photoelectric conversion circuit for obtaining high-speed and ultra-low noise signals. With the utilization of a multistage band-pass filter circuit and programmable gain amplification circuit, methane information was converted from analog to digital. The updated LabVIEW program was adopted to control the system parameters and measure laser spectra signals. The program featured laser scanning and modulation, data acquisition, harmonic signal demodulation and display and methane concentration data output.
The previously verified methane concentration inversion method based on the novel wavelength modulation spectroscopy was adopted in this work [21], that is, the methane concentration was characterized using the signal amplitude obtained by normalizing the first harmonic (1f) signal to the second harmonic (2f), and the reliable telemetry stability was secured using the distorted harmonic waveform recognition algorithm. The signal receiving experiment of the methane laser telemetry system was first performed in the hallway of NEPU Chemical Laboratory building. In order to visually show the feasibility of COR, we replaced the COR in the methane laser telemetry system with a single Fresnel lens as a reference object for comparison.
The detection system was mounted on the tripod to reduce the interference of mechanical vibration on the results during the test. The tripod was positioned at forty different detection distances within a 10 m linear range with a variation interval of 0.25 m. To simulate the scene of natural gas leakage clouds, a gas sampling bag made of thermoplastic polyurethanes was placed in the optical path, which was filled with methane of 1%vol. For each distance, the methane 2f/1f signal amplitude was collected for one minute, and the mean values in the time interval were plotted as a function of the distance as shown in Figure 12.
The measured signals from the methane laser telemetry system coupled with COR are shown in Figure 12a. Due to the nonlinear behavior of the laser intensity modulation, the residual amplitude modulation produced a background in the 2f signal. It can be compressed by using the the first harmonic (1f) normalized second harmonic (2f) signal (i.e., 2f/1f siganl).
As shown in Figure 12a, the change rule of the second harmonic signal amplitude of these two systems with the detection distance is consistent, and both of them show a trend of increasing first and then decreasing. However, within the detection distance of less than 1.25 m, the second harmonic amplitude of the COR system is significantly higher than that of the FOR system, which will also provide a better detection signal-to-noise ratio.
The reason for this phenomenon can be explained as follows: when the distance between the optical receiving system and the target surface is relatively short, the incident angle of the diffuse reflection echo light is relatively large relative to the optical axis of the optical receiving system, and the Fresnel lens of the FOR system causes the echo light to not be fully focused on the detector. The COR system not only relies on the refraction focusing function of the Fresnel lens but also uses the secondary reflection function to further focus the echo light with too large incidence angle so that its detector can receive more echo light with the absorption signal.
With the extension of the detection distance, the incident angle of the echo light decreases gradually. When it is less than the effective receiving angle of the Fresnel lens, both systems can concentrate all the echo light to the detector only by relying on the Fresnel lens. However, the light intensity of the echo light decreases rapidly with the increase in the detection distance, which was confirmed in our previous work [31], resulting in the continuous reduction of the amplitude of the second harmonic signal, and the signal intensity of these two systems is basically the same. It is obvious that the signal reception effect of the COR system shows more satisfactory results when measured in close range.
To evaluate the detection limit of the methane laser telemetry system coupled with COR, the 300 ppm·m methane was continuously monitored for more than 1200 s with the scan frequency of 5 Hz. Figure 13 shows the Allan deviation analysis for the continuous measurement. The Allan deviation reflects the fluctuation of the measurement result with the passage of the integration time. It indicates that the optimum integration time was 319.6 s, and the corresponding detection limit was 5.13 ppm⋅m. When the integration time was within 320 s, the trend of the Allan deviation decreasing was basically the same as ~1/sqrt(τ), which indicates that thermal noise of passive device was dominant in the measurement results at this time. When the integration time was over 320 s, increasing the integration time could not further improve the detection limit.
The transmission of the laser beam through the atmospheric air beside the absorbing gaseous components and atmospheric aerosols is affected by air flow turbulence, which results in the amplitude and beam deflection of the received echo light rays [17]. Therefore, atmospheric turbulence will cause the incident angle of the echo light to fluctuate randomly when it enters the optical receiver of the methane laser telemetry system. The weakening of received laser signal becomes more pronounced with increasing incident angles. In order to investigate the stability performance of the methane laser telemetry sensor under the effect of atmospheric turbulence, time series measurements of methane gasbag were performed in an empty outdoor space.
A comparative experiment was implemented by using a methane laser telemetry system with COR and the system with FOR. For both systems, the sampling period of the methane laser telemetry sensor was 0.5 s. The methane gasbag with an integrated concentration of 300 ppm⋅m was monitored at a detection distance of 10 m within 900 s. The calibration experiment of the signal amplitude of the methane gasbag was completed in the laboratory indoor in advance, and the signal amplitude at this integrated concentration was 0.0652 V. Two industrial axial flow fans were placed on both sides of the laser light path, and the fan wind speed was set at 12 m/s to simulate the atmospheric turbulence area. The schematic diagram of outdoor experiment and the 2f/1f signal amplitude data of these two systems are shown in Figure 14.
The signal amplitude markedly fluctuated during the measurement cycle for these two systems, which is partly due to the background noise generated by the internal electronic components of the sensor system but in large part because of the atmospheric turbulence. However, the fluctuation range (~0.00989 V) of the measurement data obtained by the COR system was significantly smaller than that of the FOR system (~0.0131 V). The root mean square error (RMSE) and indication stability (IS) were introduced to quantitatively assess the stability performance of these system.
RMSE = 1 N i = 1 N X i X 0 2
IS = 1 - X max X min X mean × 100 %
where N is the total number of data samples; Xi is the measured signal amplitude data; X0 is the real signal amplitude; Xmax is the maximum data; Xmin is the minimum data; and Xmean is the average data. The RMSE and IS of the COR system were 0.00173 V and 84.79%, respectively. These two evaluating indicators of the FOR system were 0.00288 V and 76.23%, which indicates that the COR system had better detection stability performance under the effects of atmospheric turbulence.

4. Conclusions

In this paper, we explored methane emission remote detection stability by a catadioptric optical receiver on the basis of the near-infrared laser absorption spectroscopy telemetry technique. The relation between the convergence point offsets of the Fresnel lens and the incidence angle of laser echo was analyzed. A catadioptric optical receiver consisting of a Fresnel lens, a second-stage cone reflector, a first-stage cone reflector and a parabolic reflector was proposed, and the geometric configuration parameters were optimized using the ray-tracing method. Then, the COR module was manufactured and installed in the self-developed methane laser telemetry system. The signal receiving stability experiment under turbulence interference was performed to evaluate the reliability of COR. The main conclusions of this work are as follows:
(1)
Compared with FOR, the receiving angle of COR increased 3.8 times. Compared with POR, their optical efficiency decreases rapidly when the incident angle was greater than 5°, but the optical efficiency of COR was still significantly higher than that of POR.
(2)
The RMSE and IS of the COR system were 0.00173 V and 84.79%, respectively. For comparison, these two evaluating indicators of the FOR system were 0.00288 V and 76.23%. The developed catadioptric optical receiver provided superior stability for laser telemetry of methane.
Based on the results obtained, both the simulation and experimental results demonstrated that the self-developed methane laser telemetry system coupled with COR can be arranged as a leakage long-term monitoring tool for methane gas in an oil/gas station. At present, this method has only been tested in excellent indoor and outdoor environments. In practice, the environment of an oil/gas station site can be complicated.
In the process of using lasers for telemetry, unfavorable weather conditions have an impact on laser detection sensitivity, such as the attenuation of laser power due to the absorption and scattering effects of fog, rain and snow in the atmosphere. For future work, we are working hard on the optimization design of the signal filtering and waveform reconstruction to improve the detection limit of the methane laser telemetry system. In addition, we envision the combining methane optical telemetry, scanning tomography and gas diffusion modeling techniques for the acquisition for flux measurements of fugitive methane emissions.

Author Contributions

Conceptualization, D.G.; methodology, D.W.; software, W.Z.; validation, D.G. and Y.L.; formal analysis, D.W.; investigation, D.G.; resources, H.Q.; data curation, Y.L.; writing—original draft preparation, D.W.; writing—review and editing, H.Q.; visualization, D.W.; supervision, D.G.; project administration, H.Q.; funding acquisition, D.W. and H.Q. All authors have read and agreed to the published version of the manuscript.

Funding

This research was funded by Scientific and Technological Achievements Industrialization Cultivation Funding, grant number 15011210801 and Postdoctoral Support Project of Heilongjiang Province, grant number LBH-Q21084.

Data Availability Statement

Data are available on request from the authors. The data that support the findings of this study are available from the corresponding author upon reasonable request.

Conflicts of Interest

The authors declare that they have no conflict of interest.

Nomenclature

dDeviation of the echo light ray convergence point for COR, cmGreek letters
fFocal length of the Fresnel lens, mmαVertex angle of serrate prism, °
hVertical distance between the exiting point and the optical axis, cmtan βReflecting surface inclination, °
LHorizontal distance between the exiting point and the incident plane, cmδDeviation of the echo light ray convergence point for the Fresnel lens, cm
nRefractive index of the Fresnel lens, -μ1Incident angle on the incident plane of the Fresnel lens, °
NTotal number of data samples, -μ1′Refraction angle on the incident plane, °
R1Incident aperture of the annular condenser cell, cmμ2Incident angle on the exiting plane of the Fresnel lens, °
R2Exit aperture of the annular condenser cell, cmμ2′Refraction angle on the exiting plane, °
uIncident angle of echo light ray, °
u′Exiting angle of echo light ray, °
XiMeasured signal amplitude data, -
X0Real signal amplitude, -
XmaxMaximum measurement data, -
XminMinimum measurement data, -
XmeanAverage measurement data, -

References

  1. Allen, D.T.; Cardoso-Saldaña, F.J.; Kimura, Y.; Chen, Q.; Xiang, Z.; Zimmerle, D.; Bell, C.; Lute, C.; Duggan, J.; Harrison, M. A Methane Emission Estimation Tool (MEET) for predictions of emissions from upstream oil and gas well sites with fine scale temporal and spatial resolution: Model structure and applications. Sci. Total Environ. 2022, 829, 154277. [Google Scholar] [CrossRef] [PubMed]
  2. Floerchinger, C.; McKain, K.; Bonin, T.; Peischl, J.; Biraud, S.C.; Miller, C.; Ryerson, T.B.; Wofsy, S.C.; Sweeney, C. Methane emissions from oil and gas production on the North Slope of Alaska. Atmos. Environ. 2019, 218, 116985. [Google Scholar] [CrossRef]
  3. Konieczna, A.; Roman, K.; Borek, K.; Grzegorzewska, E. GHG and NH3 Emissions vs. Energy Efficiency of Maize ProductionTechnology: Evidence from PolishFarms; a Further Study. Energies 2021, 14, 5574. [Google Scholar] [CrossRef]
  4. Sun, S.; Ma, L.; Li, Z. A Source-Level Estimation and Uncertainty Analysis of Methane Emission in China’s Oil and Natural Gas Sector. Energies 2022, 15, 3684. [Google Scholar] [CrossRef]
  5. Heydarzadeh, Z.; Kinnon, M.M.; Thai, C.; Reed, J.; Brouwer, J. Marginal methane emission estimation from the natural gas system. Appl. Energy 2020, 277, 11557. [Google Scholar] [CrossRef]
  6. Brandt, A.R.; Heath, G.; Kort, E.; O’sullivan, F.; Petron, G.; Jordaan, S.; Tans, P.; Wilcox, J.; Gopstein, A.; Arent, D.; et al. Methane leaks from north american natural gas systems. Science 2014, 343, 733–735. [Google Scholar] [CrossRef]
  7. Wang, J.; Ji, J.; Ravikumar, A.P.; Savarese, S.; Brandt, A.R. VideoGasNet: Deep learning for natural gas methane leak classification using an infrared camera. Energy 2022, 238, 121516. [Google Scholar] [CrossRef]
  8. MacKay, K.; Lavoie, M.; Bourlon, E.; Atherton, E.; O’Connell, E.; Baillie, J.; Fougere, C.; Risk, D. Methane emissions from upstream oil and gas production in Canada are underestimated. Sci. Rep. 2021, 11, 8041. [Google Scholar] [CrossRef]
  9. Liu, C.; Wang, Y.; Li, Y.; Xu, M. Experimental study on new leak location methods for natural gas pipelines based on dynamic pressure waves. J. Nat. Gas Sci. Eng. 2018, 54, 83–91. [Google Scholar] [CrossRef]
  10. Bakkaloglu, S.; Lowry, D.; Fisher, R.E.; France, J.L.; Brunner, D.; Chen, H.; Nisbet, E.G. Quantification of methane emissions from UK biogas plants. Waste Manag. 2021, 124, 82–93. [Google Scholar] [CrossRef]
  11. Kordella, S.; Ciotoli, G.; Dimas, X.; Papatheodorou, G.; Etiope, G. Increased methane emission from natural gas seepage at Katakolo Harbour (Western Greece). Appl. Geochem. 2020, 116, 104578. [Google Scholar] [CrossRef]
  12. Schimmelmann, A.; Ensminger, S.A.; Drobniak, A.; Mastalerz, M.; Etiope, G.; Jacobi, R.D.; Frankenberg, C. Natural geological seepage of hydrocarbon gas in the Appalachian Basin and Midwest USA in relation to shale tectonic fracturing and past industrial hydrocarbon production. Sci. Total Environ. 2018, 644, 982–993. [Google Scholar] [CrossRef] [PubMed]
  13. Hollenbeck, D.; Zulevic, D.; Chen, Y. Advanced Leak Detection and Quantification of Methane Emissions Using sUAS. Drones 2021, 5, 117. [Google Scholar] [CrossRef]
  14. Zhang, E.J.; Teng, C.C.; van Kessel, T.G.; Klein, L.; Muralidhar, R.; Wysocki, G.; Green, W.M.J. Field Deployment of a Portable Optical Spectrometer for Methane Fugitive Emissions Monitoring on Oil and Gas Well Pads. Sensors 2019, 19, 2707. [Google Scholar] [CrossRef]
  15. Ro, K.S.; Johnson, M.H.; Varma, R.M.; Hashmonay, R.A.; Hunt, P. Measurement of greenhouse gas emissions from agricultural sites using open-path optical remote sensing method. J. Environ. Sci. Health A 2009, 44, 1011–1018. [Google Scholar] [CrossRef] [PubMed]
  16. He, H.; Gao, S.; Hu, J.; Zhang, T.; Wu, T.; Qiu, Z.; Zhang, C.; Sun, Y.; He, S. In-situ testing of methane emissions from landfills using laser absorption spectroscopy. Appl. Sci. 2021, 11, 2117. [Google Scholar] [CrossRef]
  17. Xia, J.; Zhu, F.; Zhang, S.; Kolomenskii, A.; Dong, J.; Okada, K.; Strohaber, J.; Schuessler, H.A. Probing greenhouse gases in turbulent atmosphere by long-range open-path wavelength modulation spectroscopy. Opt. Laser Eng. 2019, 117, 21–28. [Google Scholar] [CrossRef]
  18. Zhu, H.; Letzel, M.O.; Reiser, M.; Kranert, M.; Bächlin, W.; Flassak, T. A new approach to estimation of methane emission rates from landfills. Waste Manag. 2013, 33, 2713–2719. [Google Scholar] [CrossRef]
  19. Li, J.; Du, Z.; Liu, C. Standoff Chemical Detection Using Laser Absorption Spectroscopy: A Review. Remote Sens. 2020, 12, 2771. [Google Scholar] [CrossRef]
  20. Lewellen, J.W.; Harris, J.R. Performance estimates for a multicube retroreflector design. Opt. Commun. 2019, 441, 26–32. [Google Scholar] [CrossRef]
  21. Shen, S.; Li, W.; Wang, M.; Wang, D.; Li, Y.; Li, D. Methane near-infrared laser remote detection under non-cooperative target condition based on harmonic waveform recognition. Infrared Phys. Technol. 2022, 120, 103977. [Google Scholar] [CrossRef]
  22. Barrass, S.; Gérard, Y.; Holdsworth, R.J.; Martin, P.A. Near-infrared tunable diode laser spectrometer for the remote sensing of vehicle emissions. Spectrochim. Acta A 2004, 60, 3353–3360. [Google Scholar] [CrossRef] [PubMed]
  23. Yang, H.; Bu, X.; Cao, Y.; Song, Y. A methane telemetry sensor based on near-infrared laser absorption spectroscopy. Infrared Phys. Technol. 2021, 114, 103670. [Google Scholar] [CrossRef]
  24. Zhang, Y.; Ding, J.; Zhang, X.; Fang, J.; Zhao, Y. Open-path sensor based on QCL for atmospheric N2O measurement. Results Phys. 2021, 31, 104909. [Google Scholar] [CrossRef]
  25. Shao, L.; Fang, B.; Zheng, F.; Qiu, X.; He, Q.; Wei, J.; Li, C.; Zhao, W. Simultaneous detection of atmospheric CO and CH4 based on TDLAS using a single 2.3 μm DFB laser. Spectrochim. Acta A 2019, 222, 117118. [Google Scholar] [CrossRef]
  26. Li, G.; Ma, K.; Jiao, Y.; Jiang, Q.; Zhang, X.; Zhang, Z.; Wu, Y.; Song, D. Performance enhancement of DFBL based near-infrared CH4 telemetry system using a focus tunable lens. Microw. Opt. Technol. Lett. 2021, 63, 1147–1151. [Google Scholar] [CrossRef]
  27. Xiao, C.; Hu, S. Optimization of the Optical Path of the Methane Telemetry System Based on TDLAS Technology. In Proceedings of the International Conference on Optical Instruments and Technology: Optical Systems and Modern Optoelectronic Instruments, Beijing, China, 2–4 November 2020; p. 114341B. [Google Scholar]
  28. Xu, N.; Ji, J.; Sun, W.; Huang, W.; Li, J.; Jin, Z. Numerical simulation and experimental validation of a high concentration photovoltaic/thermal module based on point-focus Fresnel lens. Appl. Energy 2016, 168, 269–281. [Google Scholar] [CrossRef]
  29. Cabral, D. Development and performance comparison of a modified glazed CPC hybrid solar collector coupled with a bifacial PVT receiver. Appl. Energy 2022, 325, 119653. [Google Scholar] [CrossRef]
  30. Peng, X.; Kong, L. Design and optimization of optical receiving antenna based on compound parabolic concentrator for indoor visible light communication. Opt. Commun. 2020, 464, 125447. [Google Scholar] [CrossRef]
  31. Wang, D.; Wu, G.; Li, D.; Qi, H.; Lv, Y. Research on Echo Power Detection Based on Laser Radiation Transmission Characteristics of Non-Cooperative Target Surface. In Proceedings of the 16th International Heat Transfer Conference, Beijing, China, 13 August 2018. [Google Scholar]
Figure 1. Deviation optical path of the Fresnel lens convergence point.
Energies 16 03854 g001
Figure 2. Optical model of a segmentation cell of a parabolic reflector for COR.
Energies 16 03854 g002
Figure 3. Focusing deviation of the Fresnel lens at different incident angles.
Energies 16 03854 g003
Figure 4. Light convergence point at 1.3° incident angles.
Energies 16 03854 g004
Figure 5. The ray tracing results of the first-stage annular condenser cell under different incident apertures.
Energies 16 03854 g005
Figure 6. The optical receiving efficiency of the parabolic reflector part of COR under different incident angles of echo light rays.
Energies 16 03854 g006
Figure 7. The relationship between the number of received echo light rays and the incident aperture of the first-stage cone reflector.
Energies 16 03854 g007
Figure 8. The relationship between the number of received echo light rays and the length of the first-stage cone reflector.
Energies 16 03854 g008
Figure 9. The relationship between the number of received echo light rays and the length of the first-stage cone reflector.
Energies 16 03854 g009
Figure 10. The variation of the optical receiving efficiency of three optical receivers over the incident angle of echo light rays.
Energies 16 03854 g010
Figure 11. Schematic of the independently developed methane laser telemetry coupled with the COR system.
Energies 16 03854 g011
Figure 12. (a) Observed signals at a detection distance of 0.8 m from the methane laser telemetry system coupled with COR. (b) The 2f/1f signal amplitude of the methane laser telemetry system coupled with COR or Fresnel lens variations according to detection distance.
Energies 16 03854 g012
Figure 13. Allan deviation analysis for the 300 ppm⋅m methane measurement.
Energies 16 03854 g013
Figure 14. A signal-receiving stability experiment under turbulence interference. (a) Schematic diagram of experimental configuration. (b) 2f/1f signal amplitude measurement data during the monitoring period.
Energies 16 03854 g014
Table 1. Optical parameters of the Fresnel lens in this work.
Diameter
[mm]
Focal Length
[mm]
Thickness
[mm]
Pitch
[°]
Groove Spacing
[mm]
Refractive
Index
509321101.516
Table 2. Structural parameters of the annular condenser cell from the first stage to the twelfth stage.
Stage Number123456789101112
Incident aperture
[mm]
6.207.007.808.509.109.6010.1010.5010.8411.1411.3411.44
Exit aperture
[mm]
5.006.207.007.808.509.109.6010.1010.5010.8411.1411.34
Length
[mm]
2.002.002.002.002.002.002.002.002.002.002.002.00
Disclaimer/Publisher’s Note: The statements, opinions and data contained in all publications are solely those of the individual author(s) and contributor(s) and not of MDPI and/or the editor(s). MDPI and/or the editor(s) disclaim responsibility for any injury to people or property resulting from any ideas, methods, instructions or products referred to in the content.

