1. Introduction
The basic circuits used in impedance measurements are ac bridges. In a classical impedance bridge, composed of two voltage sources and two compared impedances, the impedance ratio is directly determined by the ratio of the voltages across the source terminals. For many years, the aim of electronic bridge development has been to replace the previously used systems—which reproduced the ratio of two sinusoidal voltages based on elements with strong magnetic coupling, such as measuring transformers and inductive voltage dividers—with a system of two electronic voltage sources. This allows the simplification of the construction of the bridge and the comparison of impedances of any kind and facilitates the automation of the bridge balancing process.
Real progress in the development of bridges with electronic voltage sources became possible when the method of digital frequency synthesis was used to generate sinusoidal signals. Such digital sources of sine wave voltages were characterized by, among others, precise and largely frequency-independent amplitude and phase adjustment, as well as very good amplitude, phase and frequency stability. This allowed the construction of fully digital automatic impedance bridges with increasingly better metrological properties. The first bridge with digital sine wave voltage sources, devoid of elements with strong magnetic coupling, is presented in [
1]. In the following years, new digital bridge solutions were presented, with the main trend being related to the construction of bridges for accurate impedance measurements and developed mainly by the National Metrological Institutes (NMI) or in cooperation with them [
2,
3,
4,
5,
6,
7,
8,
9,
10,
11,
12,
13,
14].
Currently, automatic fully digital bridges allow comparisons of impedance standards with an uncertainty of 10
−6–10
−5 in the audio frequency range [
15,
16,
17,
18,
19,
20,
21]. Achieving such measurement uncertainties requires the use of systems based on DAC and ADC converters with extremely high resolutions and appropriate, often advanced, digital signal processing algorithms. The fully digital bridges developed so far can be classified according to various criteria, due to the possibility of comparing impedance elements with different terminal layouts, e.g., three-terminal, two-port coaxial and four-port coaxial [
22]. Considering the issues presented in [
18], the division of bridges is important due to the method of determining the reference voltage ratio, which determines the ratio of the compared impedances. The first group is sourcing bridges (generating or DAC-based), in which the reference voltage ratio is determined by the amplitude and phase settings of digital voltage sources. The second group is digitizing bridges (sampling or ADC-based), in which the reference voltage ratio is determined by measurement (sampling method) of the output voltages of digital sources. In both cases, the reference voltage ratio is determined in the equilibrium state of the bridge. The bridges mentioned above, used in impedance standard comparisons, are relatively complex solutions that use commercial lock-in amplifiers as zero detectors. In addition, the bridge-balancing process requires multiple measurements of the low-level unbalanced signal, which significantly increases the total measurement time.
Impedance measurements play an important role not only in the above-mentioned area related to standard comparisons, but also in many fields of science, technology and industry. In many applications, there is often less demand for measurement accuracy. What is important, however, is a less complicated, and thus more economical, construction and a relatively short measurement time. These advantages allow the use of these types of bridges as measurement circuits combined with accurate capacitive and resistance sensors. They can also be used in electrochemical impedance spectroscopy [
23,
24,
25,
26]. One of the possible ways to develop systems that meet such requirements may be based on the use of experience and research results on the automatic digital balanced bridges discussed above. Such a possibility is provided by the construction of unbalanced bridges, which the authors have been researching for a long time [
27]. In an unbalanced bridge, it is advantageous to bring it to a state close to equilibrium. In this state, the unbalanced voltage is measured, so it is not necessary to use sources with precise adjustment of the amplitude and phase of the output voltages. This greatly simplifies the design of the bridge. The digital unbalanced bridge is a bridge in which the ratio of the compared impedances is determined by measuring the ratio of the output voltages of the sine wave sources relative to the unbalanced voltage in a state close to equilibrium using digital signal processing methods.
The metrological properties of the digital automatic unbalanced bridge were presented by the authors in [
28]. It was shown there that parasitic admittances occurring in the branch of the zero detector have a significant impact on the achieved measurement uncertainty. The effective method of minimizing this impact presented there requires prior measurement of the parasitic admittances, which was a certain disadvantage of this solution. The article presents a concept eliminating this disadvantage by using the interpolation method in an unbalanced bridge. This work is also an extension of the research described in reference [
29], mainly in the part concerning the assessment of the uncertainty of impedance measurement and the experimental verification of the applied measurement method, which was carried out using impedance standards with much better metrological properties.
2. Measurement Method
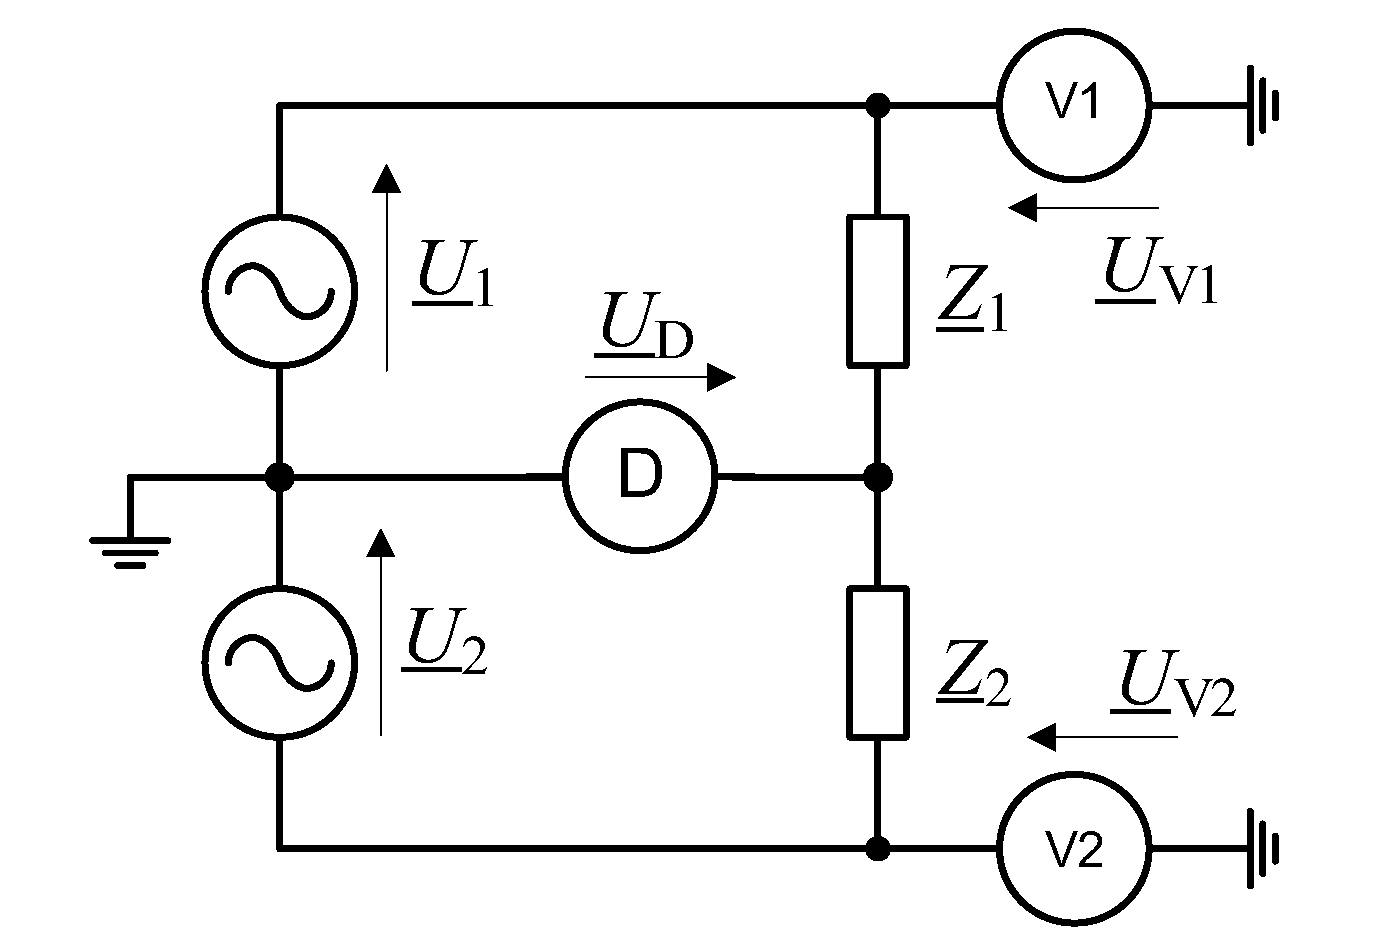
In the unbalanced digital impedance bridge (
Figure 1), by means of which elements with impedances
Z1 and
Z2 are compared, a state close to equilibrium is achieved by adjusting the amplitude and phase of voltages
U1 and
U2 generated by digital sources of sinusoidal voltages. The system measures the unbalanced voltage
UD with the use of the zero indicator D and the voltage ratio
U1/
U2 with the use of an appropriate measuring circuit that enables the measurement of the complex voltage ratio; most often it is a multichannel sampling system usually called a digitizer. In
Figure 1, this system is represented by voltmeters V1 and V2.
The ratio of the compared impedances
Z1 and
Z2 is given by the relation:
where
is the ratio of the compared impedances,
is the ratio of the output voltages of digital voltage sources measured with a digitizer, and
is the relative unbalanced voltage of the bridge. From the measurement of the real component
A and the imaginary component
B of the voltage ratio
and the real component
and the imaginary component
respectively, of the relative unbalanced voltage
, the impedance ratio can be represented as
If we mark the real and imaginary components of the impedance ratio
KZ by
E and
F, respectively, then the relations (3) and (4) are obtained, which allow the determination of the ratio of the dominant and residual impedance components for comparisons of any kind of impedances (such as R-C or L-C):
In Reference [
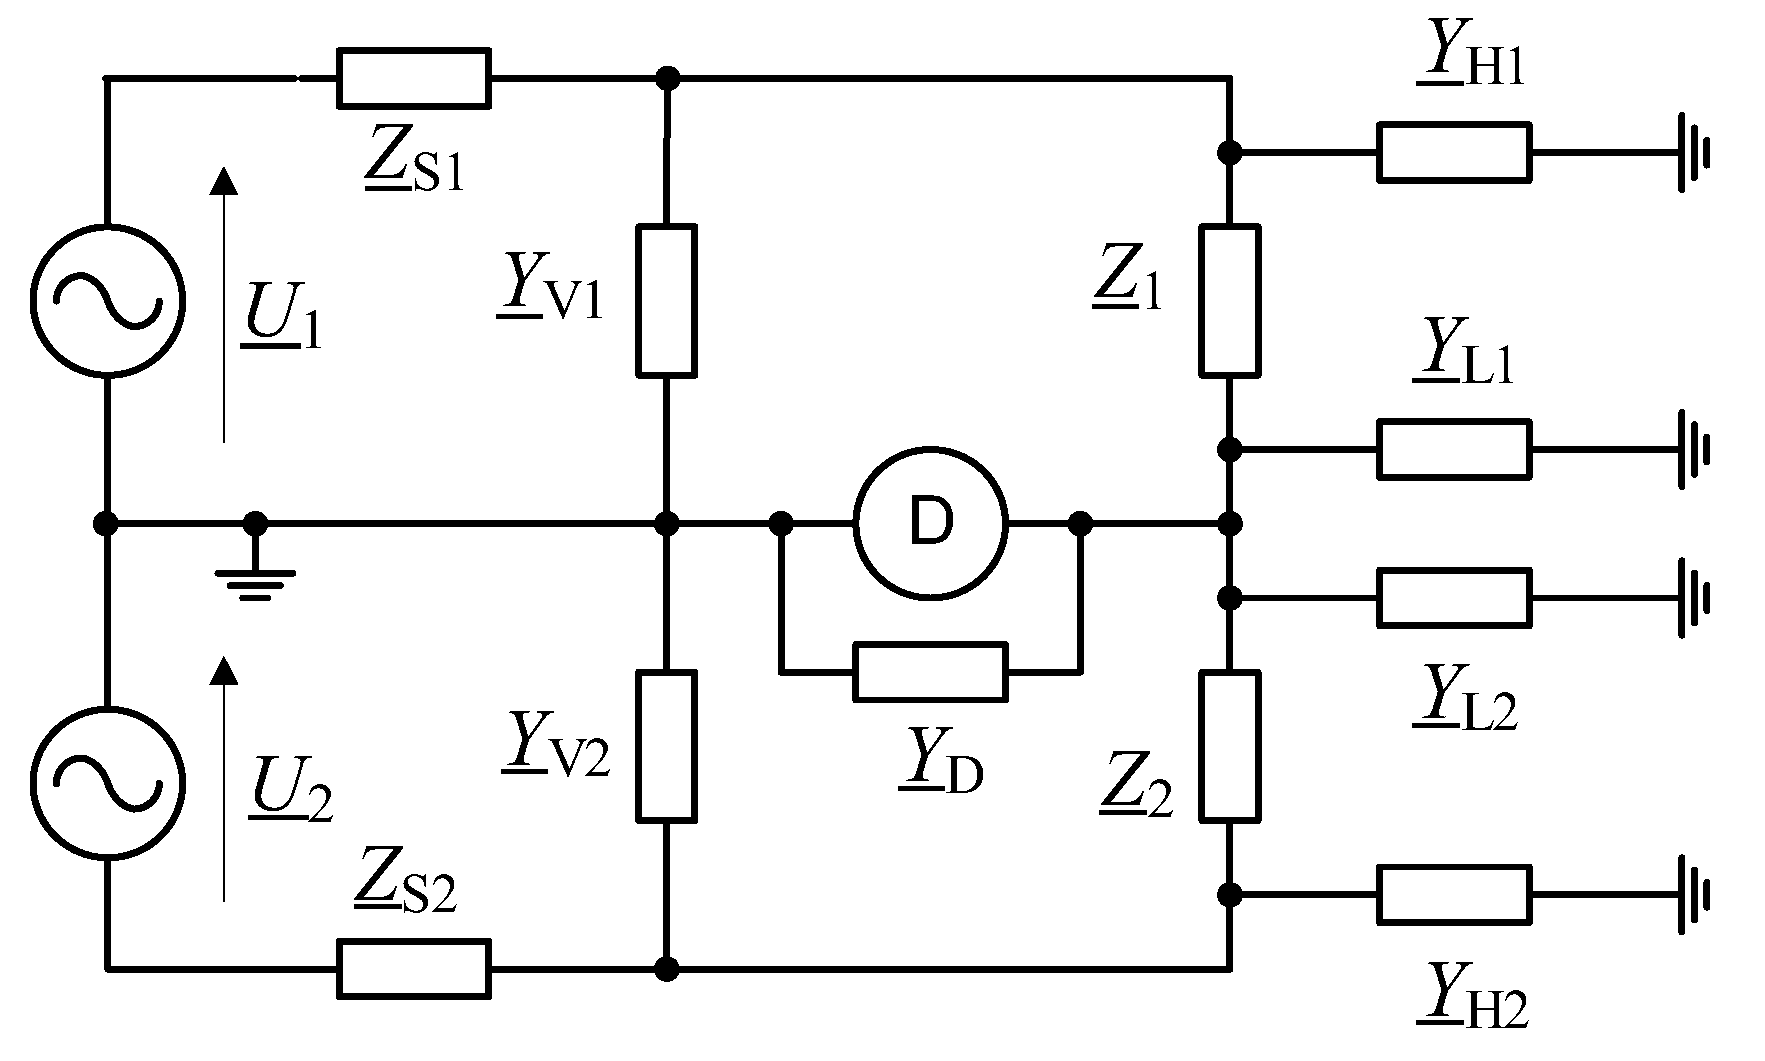
29], it was shown, among others, that to obtain a sufficiently low value of the uncertainty of the impedance comparison, it is necessary to consider the parasitic admittances of individual elements of the measurement circuit. In order to explain the limitations related to the influence of parasitic admittances occurring in the real measurement system, the equivalent diagram of the bridge is presented in
Figure 2, which includes the most important of the mentioned quantities.
In the schematic diagram shown in
Figure 2,
ZS1 and
ZS2 represent the output impedances of digital voltage sources;
YV1,
YV2 and
YD represent, respectively, the input admittances of the
U1 and
U2 voltage measuring system and the input admittance of the zero detector; and
YH1,
YL1,
YH2 and
YL2 represent, respectively, the parasitic admittances associated with the compared impedance elements
Z1 and
Z2.
In Reference [
28] it was shown that the input admittance of the zero detector
YD and the parasitic admittances of the compared impedances
YL1 and
YL2 have the most significant impact on the result of the impedance comparison, which together can be presented as equivalent impedance
YE =
YD +
YL1 +
YL2. If this admittance is included in (1), then the following relation is obtained:
The method of measuring impedance using an unbalanced bridge, presented in [
28], requires knowledge of the admittance
YE, the value of which was determined by measurement. Including it in the mathematical model of the bridge significantly minimized the impedance comparison error caused by the influence of the
YE admittance. It was also shown that the measurement uncertainty of
YE admittance was significant for the effectiveness of minimizing this impact.
The interpolation method proposed in the article eliminates this inconvenience. The concept of the interpolation method presented here in relation to the unbalanced bridge consists in performing a double measurement of the ratio of the voltages
KUV and the unbalanced voltage
UD,r for two different voltage settings of the bridge sources, whose settings are selected so that the value of the unbalanced voltages is close to zero. To explain this concept, Equation (5) is presented in the form:
where
is a quantity independent of the voltages present in the bridge, and which will be referred to as the unbalanced voltage coefficient. The value of the coefficient
kr depends on the values of the compared impedances and the parasitic admittance in the measurement diagonal of the bridge and has a constant value for a specific measurement frequency. If the results of measurements made for the above-mentioned two states of bridge unbalance are considered, then a system of equations is obtained:
Solving the system of Equations (8) and (9), one obtains the relation:
Equation (10) shows that the sought impedance ratio KZ can be determined from the results of two measurements of the ratio of voltages and reproduced by digital voltage sources and unbalanced voltages and respectively. Knowledge of the admittance value YE is not required to determine the ratio of the compared impedances. It should be noted that the denominator of the fraction in expression (10) could theoretically take a value approaching zero if the measurements of the offset voltage were made for two identical values of the digital settings of the voltage sources, which, however, is contrary to the interpolation method presented here.
Moreover, it can be added that, in the presented method, it is advantageous to choose the values of and for which the condition = is met, which will be discussed later in the paper. It can also be shown that, in this case, the systematic errors of the unbalanced voltage measurement from the use of a digitizer are eliminated, which is another advantage of the proposed measurement method.
3. Measurement Uncertainty
The aim of the considerations is to determine the measurement uncertainty of the real component
E and the imaginary component
F of the ratio of the compared impedances
KZ. First, the measurement error of the impedance ratio Δ
KZ is determined. It can be shown, based on Equation (10), that this error is given by the following relation:
which considers the measurement errors of the ratios of the voltages
and
and the unbalanced voltages
and
, respectively.
If the settings of the digital voltage sources in both measurements are selected so that the aforementioned condition is met:
then expression (11) takes the form:
Considering that
finally, the following relation is obtained, defining the measurement error of the impedance ratio in an unbalanced bridge using the interpolation method:
To determine the measurement errors of the real part
E and the imaginary part
F of the impedance ratio, the complex errors occurring in relation (15)—the impedance ratio (16), the ratio of the measured voltages reproduced by digital voltage sources (17–18) and the unbalanced voltages (19–20)—are presented in the form of the sum of their real and imaginary parts:
Considering the relations (16–20) in (15), the following form of the expressions defining the measurement error, respectively, of the real and imaginary parts of the ratio of the compared impedances
Z1 and
Z2 are obtained:
Assuming that the individual values of errors occurring in (21) and (22) are statistically independent, we can proceed to the measurement uncertainty [
30] of the ratio of the compared impedances
Z1 and
Z2 and present them in the following form:
The analysis of dependencies (23), (24) shows that the contribution of the measurement uncertainty of the unbalanced voltage components to the value of the combined standard uncertainty of the measurement of the real component
E and the imaginary component
F of the ratio of the compared impedances
KZ (third and fourth components of the expression under the square root) can be minimized by appropriate selection in the process of measuring the values of
and
as well as
and
, which was mentioned in
Section 3 and which is consistent with the assumptions of the interpolation method presented here.
4. Settings of Digital Voltage Sources in the Interpolation Method
In
Section 2, it was mentioned that, in order to eliminate systematic errors in the measurement of unbalanced voltages using a digitizer, it is beneficial to select the settings of digital voltage sine wave sources in such a way as to reproduce the ratio of the voltages
and
, so that, in both cases, the unbalanced voltages
and
are obtained, which have the same modulus value and differ in an argument by 180 degrees (Equation (12)). It is therefore assumed that the voltage ratio reproduced in both cases should have the same modulus value and the opposite sign. It is assumed that, in both cases, the unbalanced voltage has a relatively small value, i.e., the bridge is slightly unbalanced. Based on the assumptions given above, the procedure for selecting the settings of the digital voltage sine wave source (DVSS) can be presented as follows. Assuming that the ratio of the compared impedances
KZ is known, the ratio of the reproduced voltages
KU is also known for which the bridge is close to equilibrium. Therefore, it is assumed that, in the first and second cases, the value of
KU is changed to obtain
and
values with the same modulus value and opposite phase. This procedure can be written as follows:
where
α is a positive real number of relatively small value, in practice not exceeding a few percent. Taking into account (25) and (26) in relations (8) and (9), we obtain:
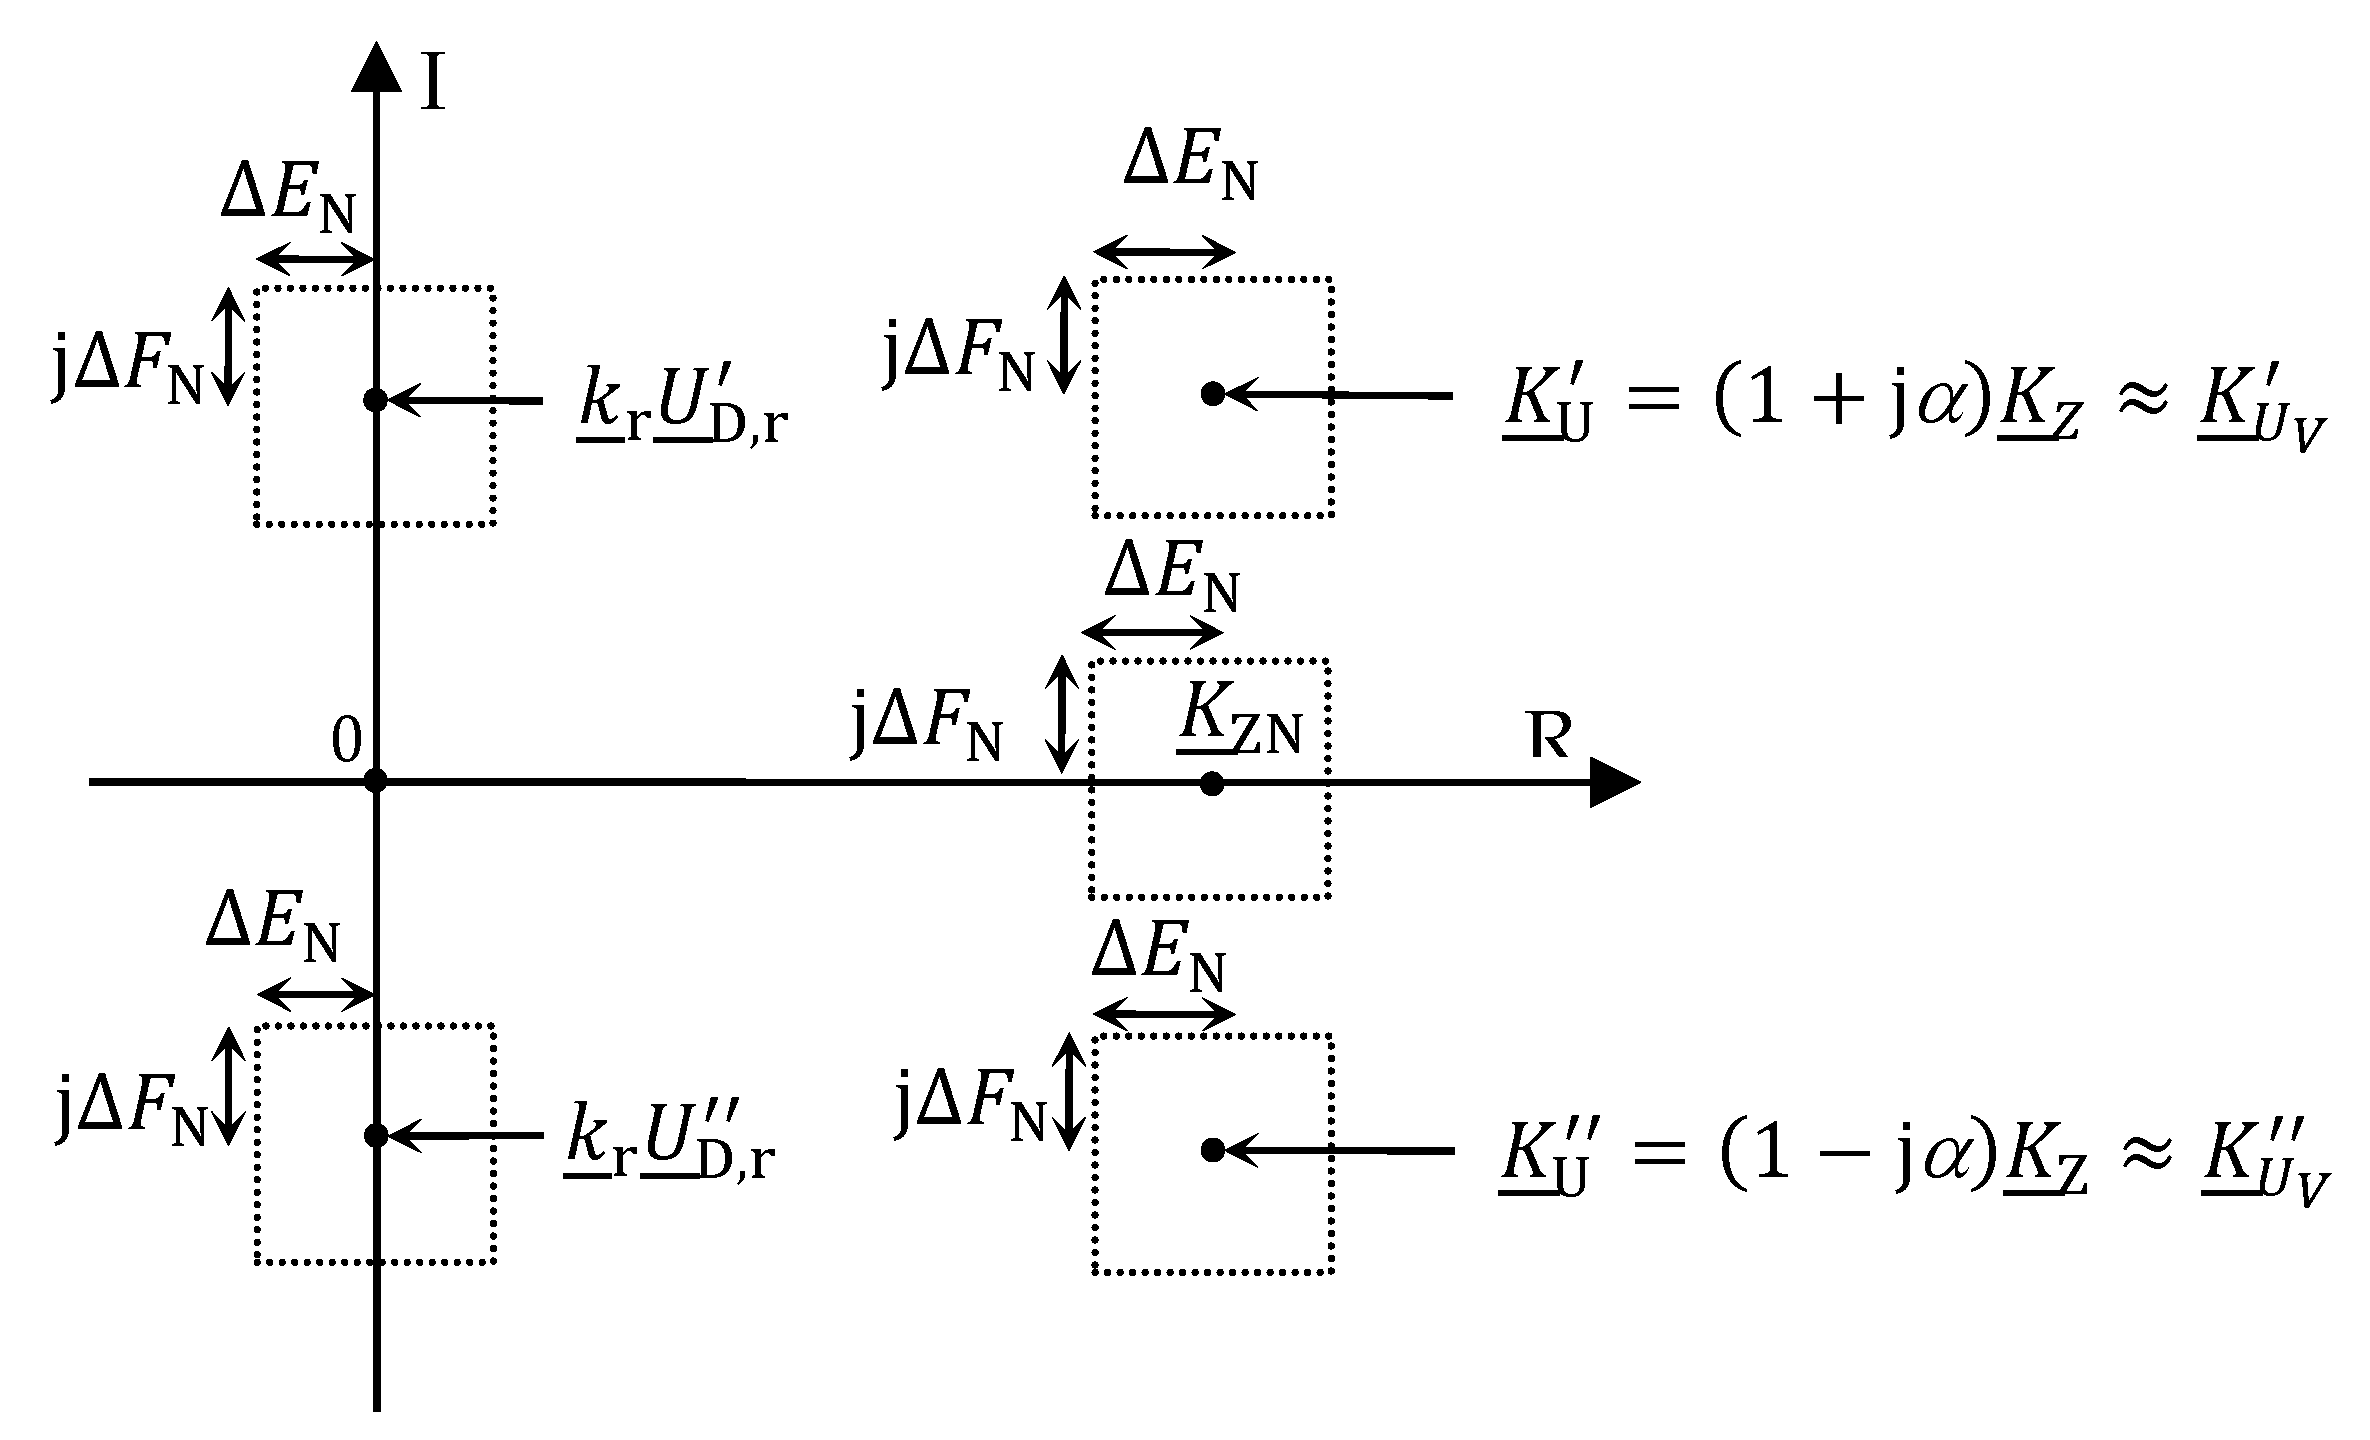
The procedure related to the selection of DVSS settings in the proposed interpolation method can be illustrated graphically. For this purpose, it is assumed that the nominal value of the ratio of the compared impedances
KZN is known, which differs from the correct value
KZ by a certain value of the error of the real part Δ
EN and the imaginary part Δ
FN (cf. (16)), which can be expressed by the relation:
Figure 3 shows a graphical interpretation of the selection of DVSS settings in the interpolation method for R-R and C-C comparisons, for which it can be assumed that the ratio of the compared impedances is equal to the real part of
KZ.
The presented considerations show that the smaller the difference between the nominal KZN value and the correct KZ value of the ratio of the compared impedances (respectively, small ΔEN and ΔFN values), the more effective will be the elimination of systematic unbalanced voltage measurement errors, and thus the lower the uncertainty of the impedance comparison.
6. Conclusions
This paper presents an automatic digital unbalanced impedance bridge designed for comparing two-port impedance elements in the audio frequency range. The interpolation method used in the bridge allows the determination of the ratio of the compared impedances based on only two measurements of the ratio of the output voltages of the sources and the bridge unbalanced voltages. It has been shown that, thanks to the interpolation method, it is possible to significantly reduce the influence of some parasitic admittances on the measurement result, without the need to determine their values. It should be added that, in the balanced bridge in the equilibrium state, this influence is negligibly small, while in the unbalanced bridge previously developed by the authors, it was necessary to experimentally determine the above-mentioned admittances and programmatically correct their impact on the measurement result [
28]. The measurement method described in this article has been experimentally verified by performing a series of comparisons of selected kind impedance standards (R-R, R-C and C-C), in the bridge circuit based on a universal commercial data acquisition card. It is confirmed that, in this relatively simple digital unbalanced bridge, which is based on the interpolation method, it is possible to compare impedance standards with an uncertainty of 10
−5 and less.
The analyses and verification experiments presented in this article were aimed at determining the operating conditions of the bridge, allowing the achievement of the lowest possible uncertainty of measurement, and thus concerned only the comparison of impedance standards. However, taking into account the simplicity of the topology of the bridge circuit presented here, it is possible to build, based on relatively cheap commercial data acquisition cards and application software, a measurement system with good metrological properties, allowing for the measurement of impedance components in the band from 20 Hz to 10 kHz with an uncertainty of level 10
−5 ÷ 10
−4. Such a system can be used both in industrial measurements and for research purposes. Further works carried out by the authors in this field include expanding the application area of the bridge as a measuring system combined with accurate impedance sensors, including primarily capacitive and resistive ones. Since the proposed bridge allows accurate measurements of impedance values above 1 kΩ, it limits the possibility of cooperation with inductive sensors, which usually have lower impedance values. The authors, using their previous experience in this field [
32], are working on a bridge circuit modification that will enable the measurement of low impedances, including those below 1 Ω. It is also planned to use the modified bridge in electrochemical impedance spectroscopy (EIS) [
33], especially for battery research, where EIS is one of the basic methods of studying phenomena occurring in electrochemical dc voltage sources.
