Article

Wind Retrieval from Constellations of Small SAR Satellites: Potential for Offshore Wind Resource Assessment

1
Department of Wind and Energy Systems, Technical University of Denmark, Frederiksborgvej 399, 4000 Roskilde, Denmark
2
Synspective Inc., 3-10-3 Miyoshi, Koto-ku, Tokyo 135-0022, Japan
*
Author to whom correspondence should be addressed.
Energies 2023, 16(9), 3819; https://doi.org/10.3390/en16093819
Submission received: 28 February 2023 / Revised: 13 April 2023 / Accepted: 22 April 2023 / Published: 29 April 2023

Abstract

:
The planning of offshore wind energy projects requires wind observations over long periods for the establishment of wind speed distributions. In the marine environment, high-quality in situ observations are sparse and restricted to point locations. Numerical modeling is typically used to determine the spatial variability of the wind resource. Synthetic Aperture Radar (SAR) observations from satellites can be used for retrieval of wind fields over the ocean at a high spatial resolution. The recent launch of constellations of small SAR satellites by private companies will improve the sampling of SAR scenes significantly over the coming years compared with the current sampling rates offered by multi-purpose SAR missions operated by public space agencies. For the first time, wind fields are retrieved from a series of StriX SAR scenes delivered by Synspective (Japan) and also from Sentinel-1 scenes delivered by the European Space Agency. The satellite winds are compared with wind speed observations from the FINO3 mast in the North Sea. This leads to root-mean-square errors of 1.4–1.8 m s 1 and negative biases of −0.4 m s 1 and −1.0 m s 1 , respectively. Although the Geophysical Model Functions (GMF) applied for wind retrievals have not yet been tuned for StriX SAR observations, the wind speed accuracy is satisfactory. Through conditional sampling, we estimate the wind resource from current and future SAR sampling scenarios where the number of SAR satellites in orbit is increasing over time. We find that hourly samples are needed to fully capture the diurnal wind speed variability at the site investigated. A combination of SAR samples from current missions with samples from clusters of small SAR satellites can yield the necessary number of wind speed samples for accurate wind resource estimation. This is particularly important for sites with pronounced diurnal wind speed variability. An additional benefit of small SAR satellites is that wind speed variability can be mapped at the sub-km scale. The very high spatial resolution is valuable for characterizing the wind conditions in the vicinity of existing offshore wind farms.

1. Introduction

The installation of offshore wind energy is accelerating globally as the demand for electricity increases, and nations have set binding targets for CO 2 emissions in order to limit the average global temperature increase to well below 2 this century [1]. Offshore wind energy is becoming a competitive source of renewable energy [2], and floating offshore wind is maturing as an alternative to turbines with fixed bottom foundations [3]. These trends lead to an increased demand for wind observations over coastal seas as well as far offshore, where measurement stations are sparse. In connection with the planning of offshore wind farms, the current industry practice is to obtain wind information from numerical modeling in combination with anemometer or lidar observations at selected point locations. The representativeness of these point measurements is very site-dependent and not always well known.
Satellites can provide ocean winds over large areas and with coverage almost anywhere on Earth. Synthetic Aperture Radar (SAR) observations from active microwave sensors can be used for retrieval of ocean wind fields at spatial resolutions on the order of 1 km [4,5,6,7,8,9]. Coastal seas are covered by SAR wind fields. whereas coarser-resolution satellite wind products, e.g., from scatterometers, lack coverage near the coast [10]. Although wind products retrieved from SAR have been available for over twenty years, they are not yet widely used in connection with the planning of offshore wind farms in practice. Important barriers for user uptake in the field of wind energy include (i) the limited number of samples available from current satellite missions, (ii) the lack of observations at the heights where wind turbines operate, and (iii) limited knowledge about the trustworthiness of satellite wind retrievals, e.g., in non-neutral atmospheric conditions.
The number of SAR scenes available over a given area of interest varies from site to site depending on the latitude, the mission objectives set by space agencies, and the user’s rights to access image archives. Overall, the number of available SAR samples has increased dramatically over the past decades, especially since the launch of the Sentinel-1 mission by the European Space Agency in 2014. Open access to the full Sentinel-1 data archive is provided via Copernicus (https://www.copernicus.eu/, accessed on 26 April 2023). For sites within Europe, the maximum number of overlapping Sentinel-1 SAR samples currently ranges from 1500 over the Mediterranean to 4000 over the Barents Sea. Additional coverage may be obtained from other multi-purpose SAR missions e.g., RADARSAT-2, (https://www.asc-csa.gc.ca/eng/satellites/radarsat2/, accessed on 26 April 2023) by the Canadian Space Agency, TerraSAR-X, (https://www.dlr.de/content/en/articles/missions-projects/TerraSAR-X/TerraSAR-X-earth-observation-satellite.html, accessed on 26 April 2023) by the German Aerospace Center, and ALOS PALSAR, (https://www.eorc.jaxa.jp/ALOS/en/index_e.htm, accessed on 26 April 2023) by the Japan Aerospace Exploration Agency.
Recently, technological progress in the field of SAR sensing has made it possible to launch small and low-cost satellites in the 100-kg class with a SAR instrument on board. Private companies in Finland, the US, and Japan have ventured into launching networks of small SAR satellites, which have the potential to provide much more frequent coverage and a higher spatial resolution than the multi-purpose SAR missions listed above. Japanese Synspective launched its first SAR satellite StriX- α in December 2020 and two follow-up satellites, StriX- β and Strix-1, were launched in March and September 2022. The plan is to launch up to 30 StriX satellites in total over the coming years, and this will change the SAR sampling scenarios completely with respect to the current state-of-the-art. Frequent SAR sampling (i.e., hourly) over a given location on Earth could facilitate a paradigm shift in the way SAR is used for monitoring and responding to disasters [11]. It might also lead to lower uncertainties when it comes to satellite-based wind resource assessment for offshore sites.
The objective of this paper is to quantify the effects of improved temporal sampling delivered by constellations of small SAR satellites with respect to the sampling scenarios of current satellite missions. We present the first wind retrievals from StriX SAR observations and compare them with wind speed observations from a meteorological mast. The time series of the mast observations are then used to estimate the wind resource for current and future SAR sampling scenarios.

2. Background

Wind stress over a sea surface generates cm-scale waves, which interact with radar pulses transmitted by active microwave sensors. In other words, the observed radar backscatter is closely linked to the wind stress and, therefore, to the local wind speed. The retrieval of ocean winds from radar backscatter relies on empirical Geophysical Model Functions (GMF) formulated as:
σ 0 = B 0 ( U , θ ) [ 1 + B 1 ( U , θ ) cos ϕ + B 2 ( U , θ ) cos 2 ϕ ] p ,
where σ 0 is the observed radar backscatter coefficient, U is the wind speed at the height of 10 m above m.s.l., ϕ is the wind direction relative to the radar look direction, θ is the radar incidence angle, and p is a constant of 1.6. B 0 , B 1 , and B 2 are coefficients describing the bias, the upwind-downwind modulation, and the main wind direction modulation [5,12,13,14,15,16].
GMFs were initially developed for scatterometers operating at C-band (5.6 GHz) with vertical polarization in transmit and receive (VV). The model functions are also suitable for the retrieval of wind fields from SAR imagery at a much higher spatial resolution of approximately 1 km [17]. SAR instruments operate with a single viewing angle, whereas scatterometers are capable of scanning a given point at the ocean surface from multiple angles simultaneously. In connection with wind speed retrievals from SAR observations, it is necessary to use a priori information about the wind direction in order to eliminate ambiguities. Wind directions may be extracted through the detection of wind-aligned streaks in the SAR imagery itself [18,19]. For operational processing, however, it is more convenient to use wind directions from numerical models [20,21].
Dedicated GMFs have been developed for the X-band (9.6 GHz) SAR sensors TerraSAR-X [22,23,24,25] and CosmoSkyMed [26]. For a given wind speed and direction, the radar backscatter coefficient in the X-band is not so different from that in the C-band, and existing GMF can thus be adopted to the X-band through an adjustment of coefficients. Wind speed retrievals based on the most recent GMF for X-band (XMOD2) lead to a RMSE of 1.5 m s 1 and a bias of −0.2 to −0.3 m s 1 when compared with ocean buoy observations [22,24]. This is comparable to results reported for C-band SAR in the literature [27,28].
Thanks to their extensive spatial coverage, wind products retrieved from SAR can be utilized for mapping offshore wind resources at the basin scale. This has been demonstrated for the seas of Europe [29], Japan [30,31], China [32,33], the Great Lakes [34], and the east coast of the US [35]. The mapping of wind resources from satellite observations typically follows the same approach as wind resource assessment based on time series observations from in situ or model data [36]. A Weibull function is fitted to a histogram of wind speeds. The shape and scale parameters characterizing this function are then used to estimate the wind power density for each grid point in a spatial domain.
For satellite-based wind resource assessment, each satellite acquisition is typically considered a random sample, which is independent of other samples collected at different times. Barthelmie and Pryor [37] simulated different satellite sampling scenarios and calculated the uncertainties introduced by a limited number of samples (with respect to a full-time series of 10-min observations from meteorological masts). They concluded that a minimum of 60–70 random samples are needed to estimate the mean wind speed within a ±10% uncertainty bound at the 90% confidence level, whereas nearly 2000 samples are required to estimate the wind power density within the same level of uncertainty. The effects of (i) differing averaging periods for individual observations, (ii) data set density, (iii) temporal biases, and (iv) truncation of the wind speed distribution due to limitations inherited from the SAR wind retrieval processing were examined. The effects of the absolute accuracy of SAR wind retrievals and of the vertical extrapolation of wind speeds were not considered.
Satellite sampling scenarios have changed significantly since the analyses by Barthelmie and Pryor [37], and this motivates us to revisit the analysis of sampling effects on wind resource assessment uncertainties. Thanks to a new generation of SAR sensors offering wide swath scanning and frequent overpasses, the density of available SAR scenes over a given site has already increased by an order of magnitude from 10 2 in 2003 to 10 3 today. Small SAR satellites can potentially deliver daily or even hourly samples, and this might increase the sampling density to the order of 10 4 in the near future. Constellations of satellites in different orbits will facilitate acquisitions at different times of the day, whereas current polar-orbiting missions are restricted to providing morning and evening overpasses.
As for the truncation of wind speed distributions, a lower threshold still applies to wind speeds retrieved from SAR observations. A wind speed of 2 m s 1 or higher is required to generate the small-scale waves at the sea surface, which a SAR is sensing. Today, it is common practice to include all available samples in a Weibull analysis and therefore, the low-wind samples are accounted for even if their absolute accuracy is questionable. The high threshold for SAR wind retrievals has increased from 24 m s 1 to 30 m s 1 through improvement of C-band GMFs [15,16]. More extreme wind speeds may be resolved using cross-polarized SAR observations [38,39]. So the higher threshold has practically been eliminated. Differences in the averaging periods for in situ (10–60 min) and SAR observations (<1 min) have not changed over time, and since the sensitivity to such differences is found to be small in previous works [37,40], we do not consider it here.

3. Data

We focus on a study area in the North Sea located around the FINO3 research platform (Section 3.2), whose longitude and latitude are 7.158167° E and 55.19503° N. FINO3 is located 70 km north of the German island of Sylt, and two large offshore wind farms, Sandbank and DanTysk, are operating in the vicinity of the mast. In the following, we describe the data sets collected and analyzed on this site.

3.1. Satellite Observations

Satellite SAR observations from StriX- β and from Sentinel-1 over the FINO3 site are analyzed. The main specifications of these two SAR sensors are summarized in Table 1, and the observation modes utilized in this publication are summarized in Table 2.

3.1.1. StriX SAR Scenes

StriX- β , launched in March 2022, is the second demonstration SAR satellite in the upcoming Synspective’s constellation. Figure 1 shows the StriX satellite’s pre-launch and in-orbit configurations. The development of the StriX satellites and the pre-launch performance evaluation are described by Pyne et al. [41]. The satellite’s main specifications and initial observations are presented in Orzel et al. [11]. The initial calibration process was conducted from late April until early June 2022, as described in Orzel et al. [42]. It relies on observations of the Amazon rain forest [43]. Non-uniform parts of the Amazon (e.g., rivers, hills) were filtered using a chi-square test. The elevation antenna pattern was estimated from data and stands in a good agreement with pre-launch measurements. The calibration is an ongoing process over the entire lifetime of the satellite. The calibration factor is reprocessed whenever new rain forest observations are acquired, and its accuracy is currently within 1 dB. Amazon observations allow us to monitor the pointing direction and correct biases if necessary. Additional measurements with a dedicated X-band corner reflector are planned, and atmospheric effects are not yet included in the calibration process.
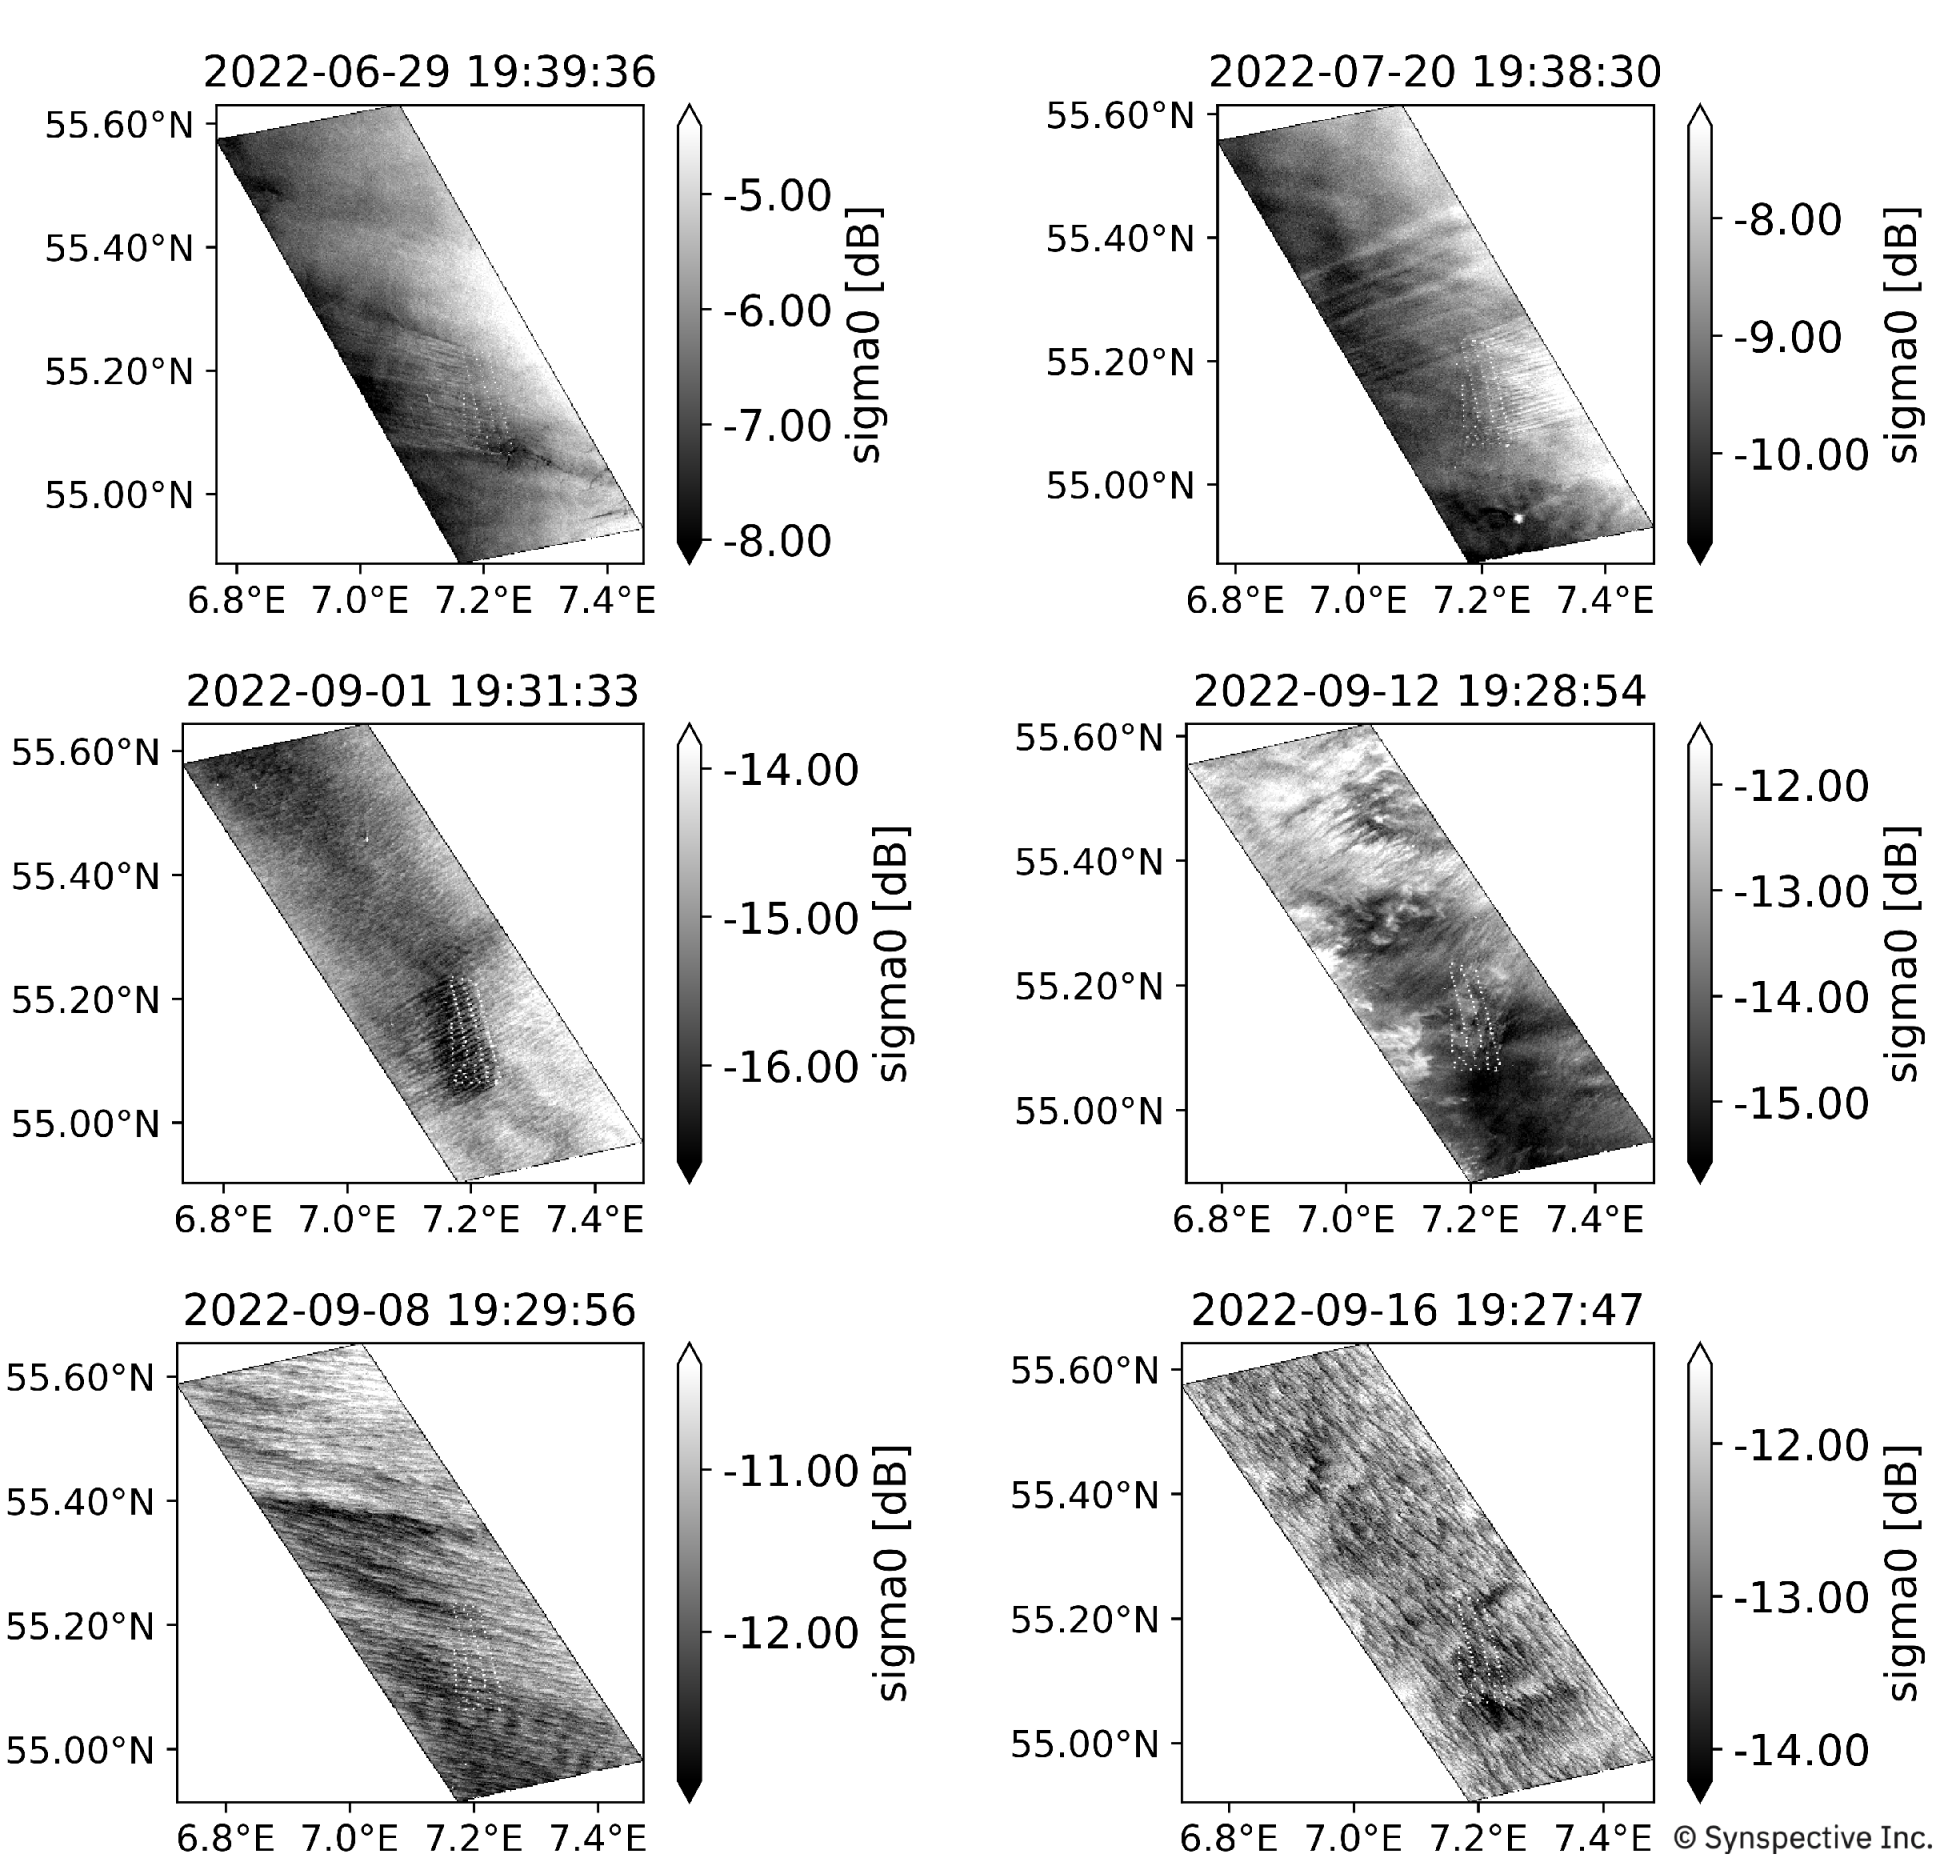
A total number of 74 StriX- β images were acquired over FINO3 during the months of June to September 2022. The input scenes in ground range gridded product format (GRD) have a ground range and azimuth pixel spacing of 5 m. We multi-looked these data sets into 100 m grid cells prior to the wind retrieval processing. Figure 2 presents six examples of StriX- β scenes acquired in the stripmap mode. The elevation antenna pattern was corrected and the images calibrated to give the radar backscatter coefficient, σ 0 . The wind turbines of DanTysk and the meteorological mast can be spotted as pixels with very high σ 0 values ( σ 0 > 0 ) compared with the surroundings. While Strix satellites can observe targets at off-nadir angles in the range 15–45 , this analysis uses observations at off-nadir angles from 19 to 39 . The corresponding noise equivalent sigma zero (NESZ) at the center of the swath was in the range between −23 dB and −17 dB, respectively. All StriX- β observations were collected on the ascending-left orbit using a single elevation beam.

3.1.2. Sentinel-1 SAR Scenes

Through the Copernicus Open Access Hub (https://scihub.copernicus.eu, accessed on 26 April 2023), we collected all available scenes from the European SAR mission Sentinel-1 over FINO3 during the period January 2015 to August 2022. The mission consists of two satellites: Sentinel-1A covers the period January 2015 to present, and Sentinel-1B covers the period April 2016 to December 2021. We selected the Sentinel-1 scenes acquired in Interferometric Wide (IW) Swath Mode with swath widths of 250 km and a grid spacing of 10 m by 10 m. IW mode captures three sub-swaths using Terrain Observation with the Progressive Scans SAR technique and covers off-nadir angles in the range of 26 to 40 . The products were re-sampled to 100-m grid cells prior to the wind retrieval processing in order to reduce the effects of random speckle noise and long-period ocean waves, which alter the radar incidence angle. The Sentinel-1 GRD data format was used, and a total of 1445 scenes were available for our analysis. One example is shown in Figure 3.

3.2. Meteorological Mast Observations

The German Forschungsplattformen In Nord und Ostsee (FINO) project began in the early 2000s with the installation of offshore meteorological masts in the North and Baltic Seas to study the wind climate over long time scales [44]. Many different meteorological parameters are available from the FINO Datenbank (https://fino.bsh.de, accessed on 26 April 2023). The data is recorded at frequencies between 1 and 10 Hz and averaged in intervals ranging from 10 to 30 min. Observations for this analysis were taken for the periods from January 2015 to September 2022. All measured quantities used have over 85% data availability, with the highest available wind speed measurement at 107 m height. An overview of the measured quantities used and their associated heights can be found in Table 3.

4. Methods

In the following, we detail the methods used for retrieval of wind speeds from StriX and Sentinel-1 SAR scenes and for comparisons against the observed wind speeds at FINO3. We then proceed to a sampling analysis where mast observations are used to simulate different satellite sampling scenarios for wind resource estimation. We take this approach because the number of available StriX acquisitions over FINO3 is not yet sufficient for wind resource assessment [37].

4.1. SAR Wind Retrieval

Wind speeds were retrieved from the StriX satellite images using the X-band GMF called XMOD2, which is developed for TerraSAR-X imagery and valid for radar incidence angles within the range 20–45 and wind speeds within the range 2–20 m s 1 [22]. It is possible that the coefficients of the GMF can be optimized if they are tuned specifically for StriX satellite observations. At present, the number of available StriX images is too low to develop a dedicated GMF for StriX, so we applied XMOD2 as is. Winds retrieved with XMOD2 are expressed as real winds since the model function is tuned to wind speeds obtained under various atmospheric stability conditions.
Wind retrievals from Sentinel-1 were performed using the GMF called CMOD5.n [15]. Since this model function is tuned to wind speed observations that are cleaned for atmospheric stability effects, the retrieved wind speeds are expressed as equivalent neutral winds [45]. This must be kept in mind when the wind speeds are compared with wind speeds from other sources.
Since we are focusing on a small area close to the FINO3 meteorological mast, we used wind directions observed at the mast as input to the two GMF in order to retrieve the most accurate 10-m wind speed near the mast. As a consequence, the wind directions were uniform across each entire satellite scene.

4.2. Comparison with Mast Observations

The wind speeds retrieved from SAR were compared with wind speed observations from the FINO3 research platform. Since the lowest measurement height at the mast is 31 m, we first extrapolated the mast wind speeds to the height of 10 m above the sea surface. For each time stamp in our mast data series, we found the best fit between the observed wind speed and the measurement height in m expressed on a logarithmic scale. We filtered out time stamps where wind speed measurements were available at fewer than four different heights out of the nine measurement heights. Figure 4 shows examples of the wind speed extrapolation for six time stamps collocated with StriX- β acquisitions. Three StriX- β scenes were obtained with westerly winds and three scenes with easterly winds. One of the profiles obtained with easterly winds (i.e., downstream of the DanTysk wind farm) on 2022-06-29 deviates significantly from the logarithmic profile at heights between 40 m and 90 m. This could be evidence of wind turbine wake effects.
Because the FINO3 platform is located on the edge of the wind farm DanTysk, it was necessary to eliminate cases where the wind blows from easterly directions (0–180° from north) as the mast observations were assumed to be highly distorted by the wind farm. To limit the flow distortion from the FINO3 mast itself, we only used wind speed observations from the cup anemometers oriented 345° from the north (i.e., upstream of the mast).
The FINO3 mast observations are averaged over the temporal domain and the satellite winds over the spatial domain. Comparisons between mast and satellite wind speeds should take this different nature of the data sets into account [46,47]. Taylor’s hypothesis of frozen turbulence [48] states that the relationship between the temporal (t) and spatial (x) dimensions of an air parcel advecting passed a fixed source is approximately:
t = x / U ,
where U is the mean wind speed. Following the approach in Sikora et al. [49], we compared the 10-min mean wind speeds observed at the mast with SAR wind speeds extracted within a footprint upstream of the mast. The footprint was defined as a rectangular box of variable size depending on the wind speed measured at the mast. Figure 5 illustrates the footprint for the StriX- β scenes acquired on 2022-06-10 and 2022-06-14 with wind directions of 227 and 293 and wind speeds of 4.0 m s 1 and 5.7 m s 1 , respectively.

4.3. Satellite Sampling Analysis

To investigate the effect of different satellite sampling strategies on wind resource statistics, we performed a conditional sampling analysis similar to the analysis of Barthelmie and Pryor [37], but with updated sampling scenarios. The approach was to first estimate the wind resource at FINO3 from the full time series of 10-min wind speed observations from the mast. Different samples of this time series were then selected in order to simulate the effects of satellite sampling scenarios on wind resource estimation. We analyzed seven full years, from 2015-01-01 to 2021-12-31, and used the mast measurements at 31 m.
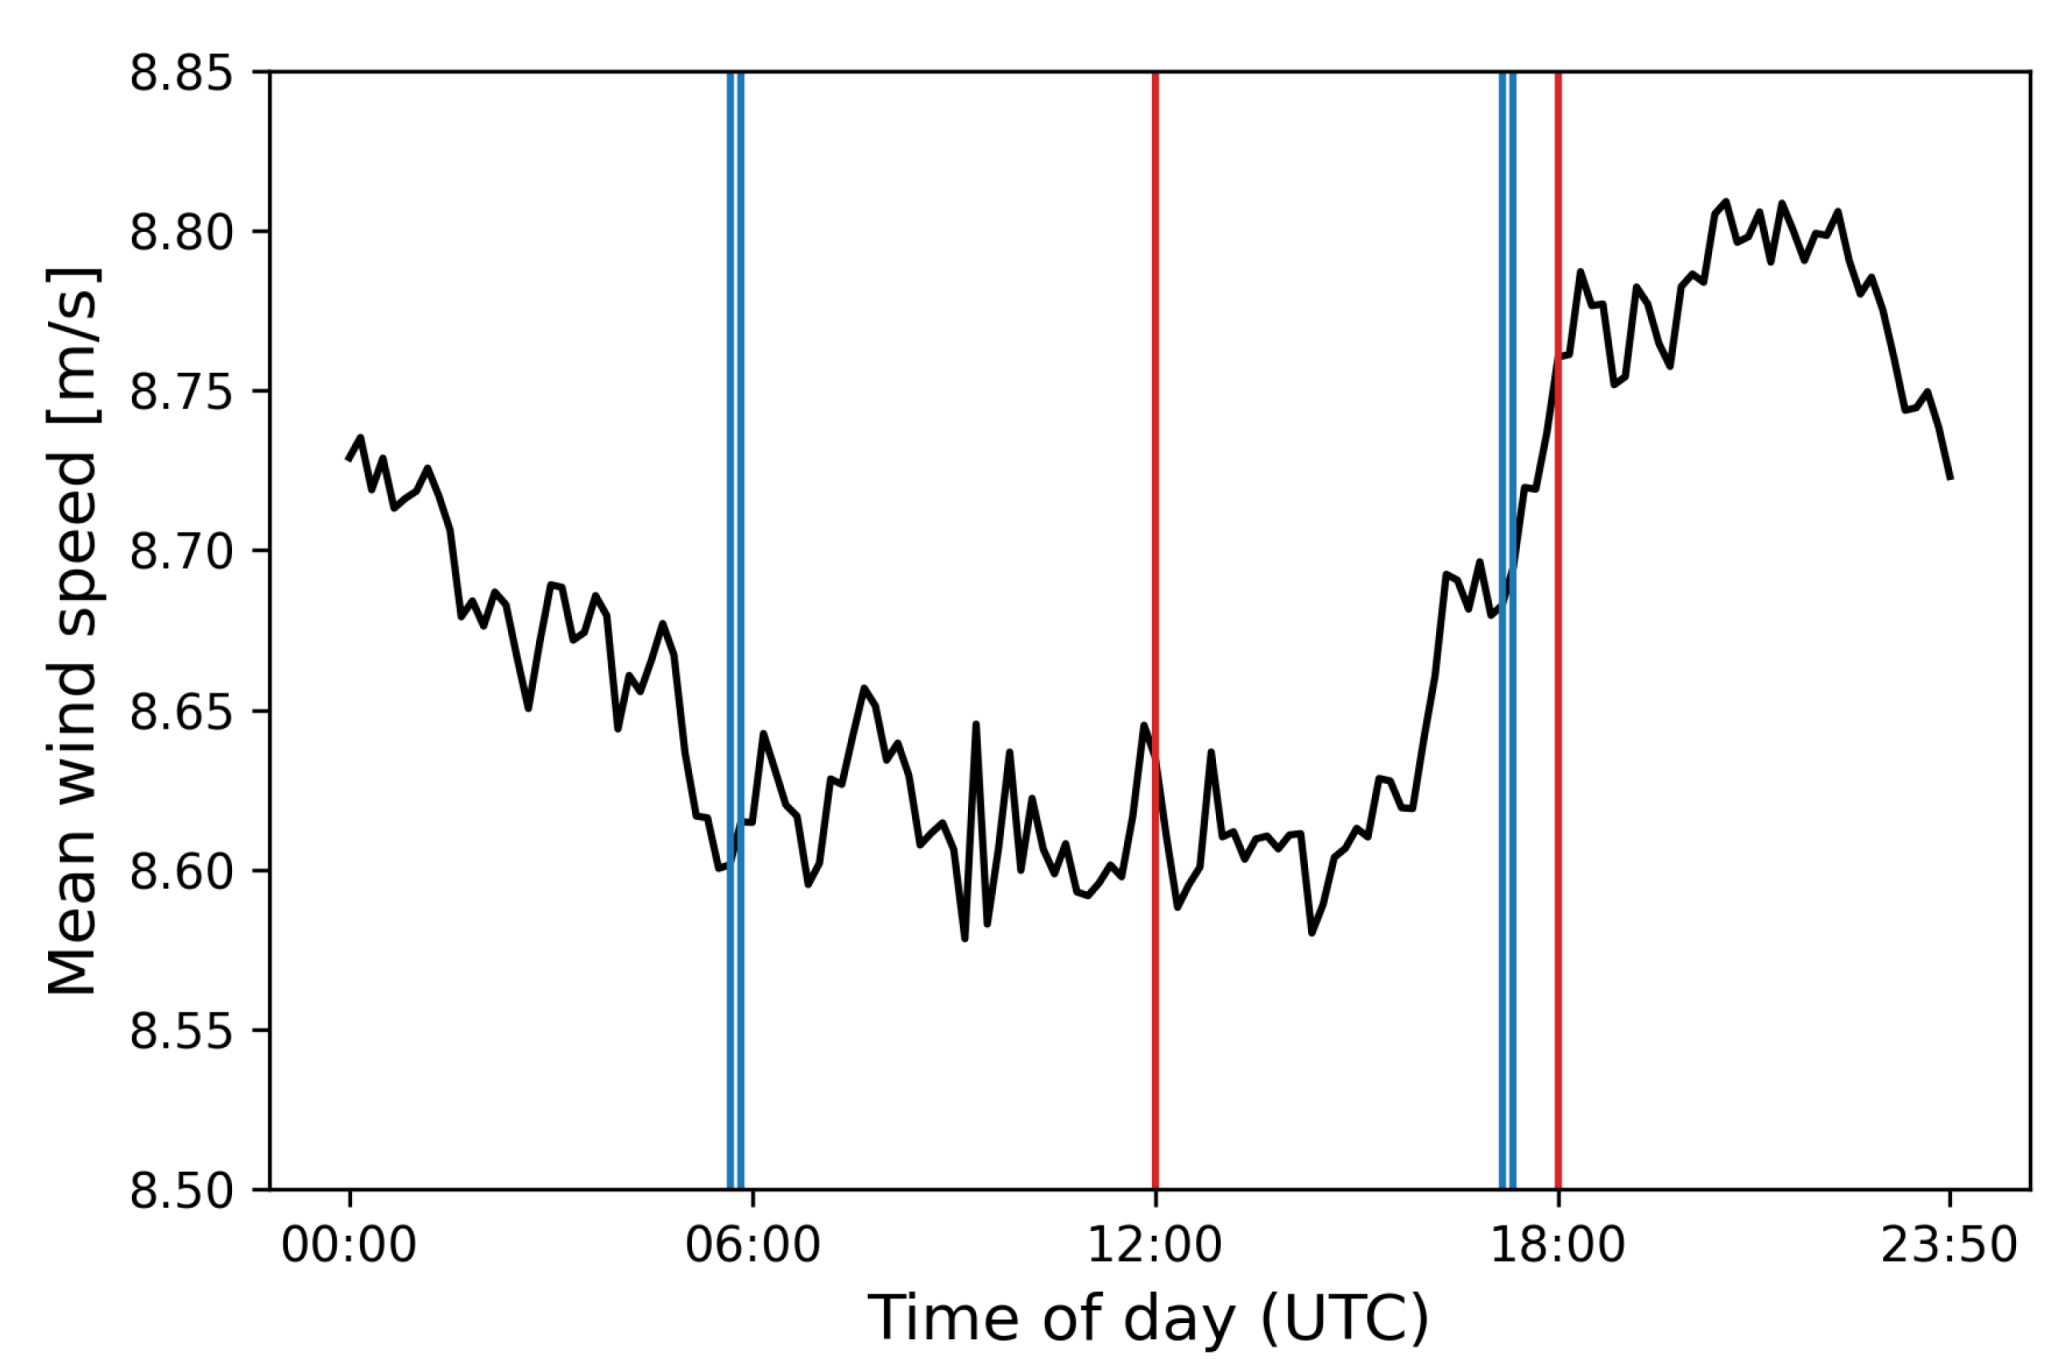
To examine the effect of sampling at specific times of the day, we used four UTC times of 05:40, 05:50, 17:10, and 17:20 to sample from the original time series of wind speed. These times correspond to the sampling times of Sentinel-1. For the truncation of the wind speed interval, we set the lower bound of wind speeds at 2 m s 1 . Given that the recent GMFs (CMOD5.n and XMOD2 as used in this work) are fitted to higher wind speeds (e.g., up to 30 m s 1 we did not implement a threshold for high wind speeds here. We also calculated the combined effect of sampling times and truncation.
To simulate current and future satellite observation scenarios, we performed (i) sampling corresponding to the current Sentinel-1 observation scenario with observations approximately every other day, (ii) daily sampling corresponding to a scenario where six StriX satellites are in orbit, and (iii) hourly sampling corresponding to a scenario with 30 StriX satellites in orbit.
Figure 6 shows the diurnal variability of the mean wind speed observed at the FINO3 mast with indications of the different sampling times used in our analysis. For the daily observation scenario, two times of the noon (12:00) and the evening (18:00) were separately investigated given the diurnal variation of wind speed at this site. The two times roughly correspond to the minimum and maximum of the diurnal mean wind speed averaged over the seven years. For the hourly observation scenario, 24 wind speeds at the top of the UTC hour (00:00, 01:00, , 23:00) were extracted for every date.
Based on the different wind speed samples described above, several wind resource-related statistics were estimated assuming the Weibull distribution:
p ( U = u ) = k c u c k 1 exp u c k ( u 0 , k > 0 , c > 0 ) ,
where U is a random variable of the wind speed (here the FINO3 measurement at the height of 31 m, p ( U = u ) is the probability density function when U = u , and k and c are the shape and scale parameters of the Weibull distribution. By fitting this distribution to a subset of the full time series, the parameters k and c were estimated. Using these estimated parameters, the first to fourth (central) moments (i.e., the mean, variance, skewness, and kurtosis of the wind speed samples) were derived. For example, the expectation (mean) E [ U ] and the variance V [ U ] of the wind speed U take the following forms:
E [ U ] = c Γ 1 + 1 k and
V [ U ] = c 2 Γ 1 + 2 k Γ 1 + 1 k 2 ,
where Γ ( · ) is the Gamma function. Furthermore, an expected energy density, E [ W / m 2 ] is derived:
E = 1 2 ρ c 3 Γ 1 + 3 k
with the air density of ρ = 1.225 kg / m 3 . We calculated these statistics using the estimated shape and scale parameters.
Since the focus here is more on the effects of different satellite sampling scenarios on wind resource assessment than on the prediction of wind power production in absolute terms, the height above sea level was not considered in connection with our sampling analysis and we only used wind observations from the lowest level at FINO3 (31 m). To illustrate how the wind resource changes with height, we also calculated resource statistics based on all available samples for each observation height of the mast up to 107 m.

5. Results

5.1. Wind fields from StriX and Sentinel-1

Figure 7 shows six wind fields retrieved from the StriX- β scenes presented in Figure 2. Three scenes were acquired with easterly wind directions, and three other scenes were acquired with westerly wind directions. Thanks to the very high spatial resolution of StriX- β , the signature of wakes downstream of each individual wind turbine in the DanTysk farm is visible in all six SAR wind fields as streaks with alternating high and low wind speeds. When winds are coming from westerly directions, we can also see the effects of the Sandbank wind farm, even though the wind farm itself is not located within the StriX- β image frames.
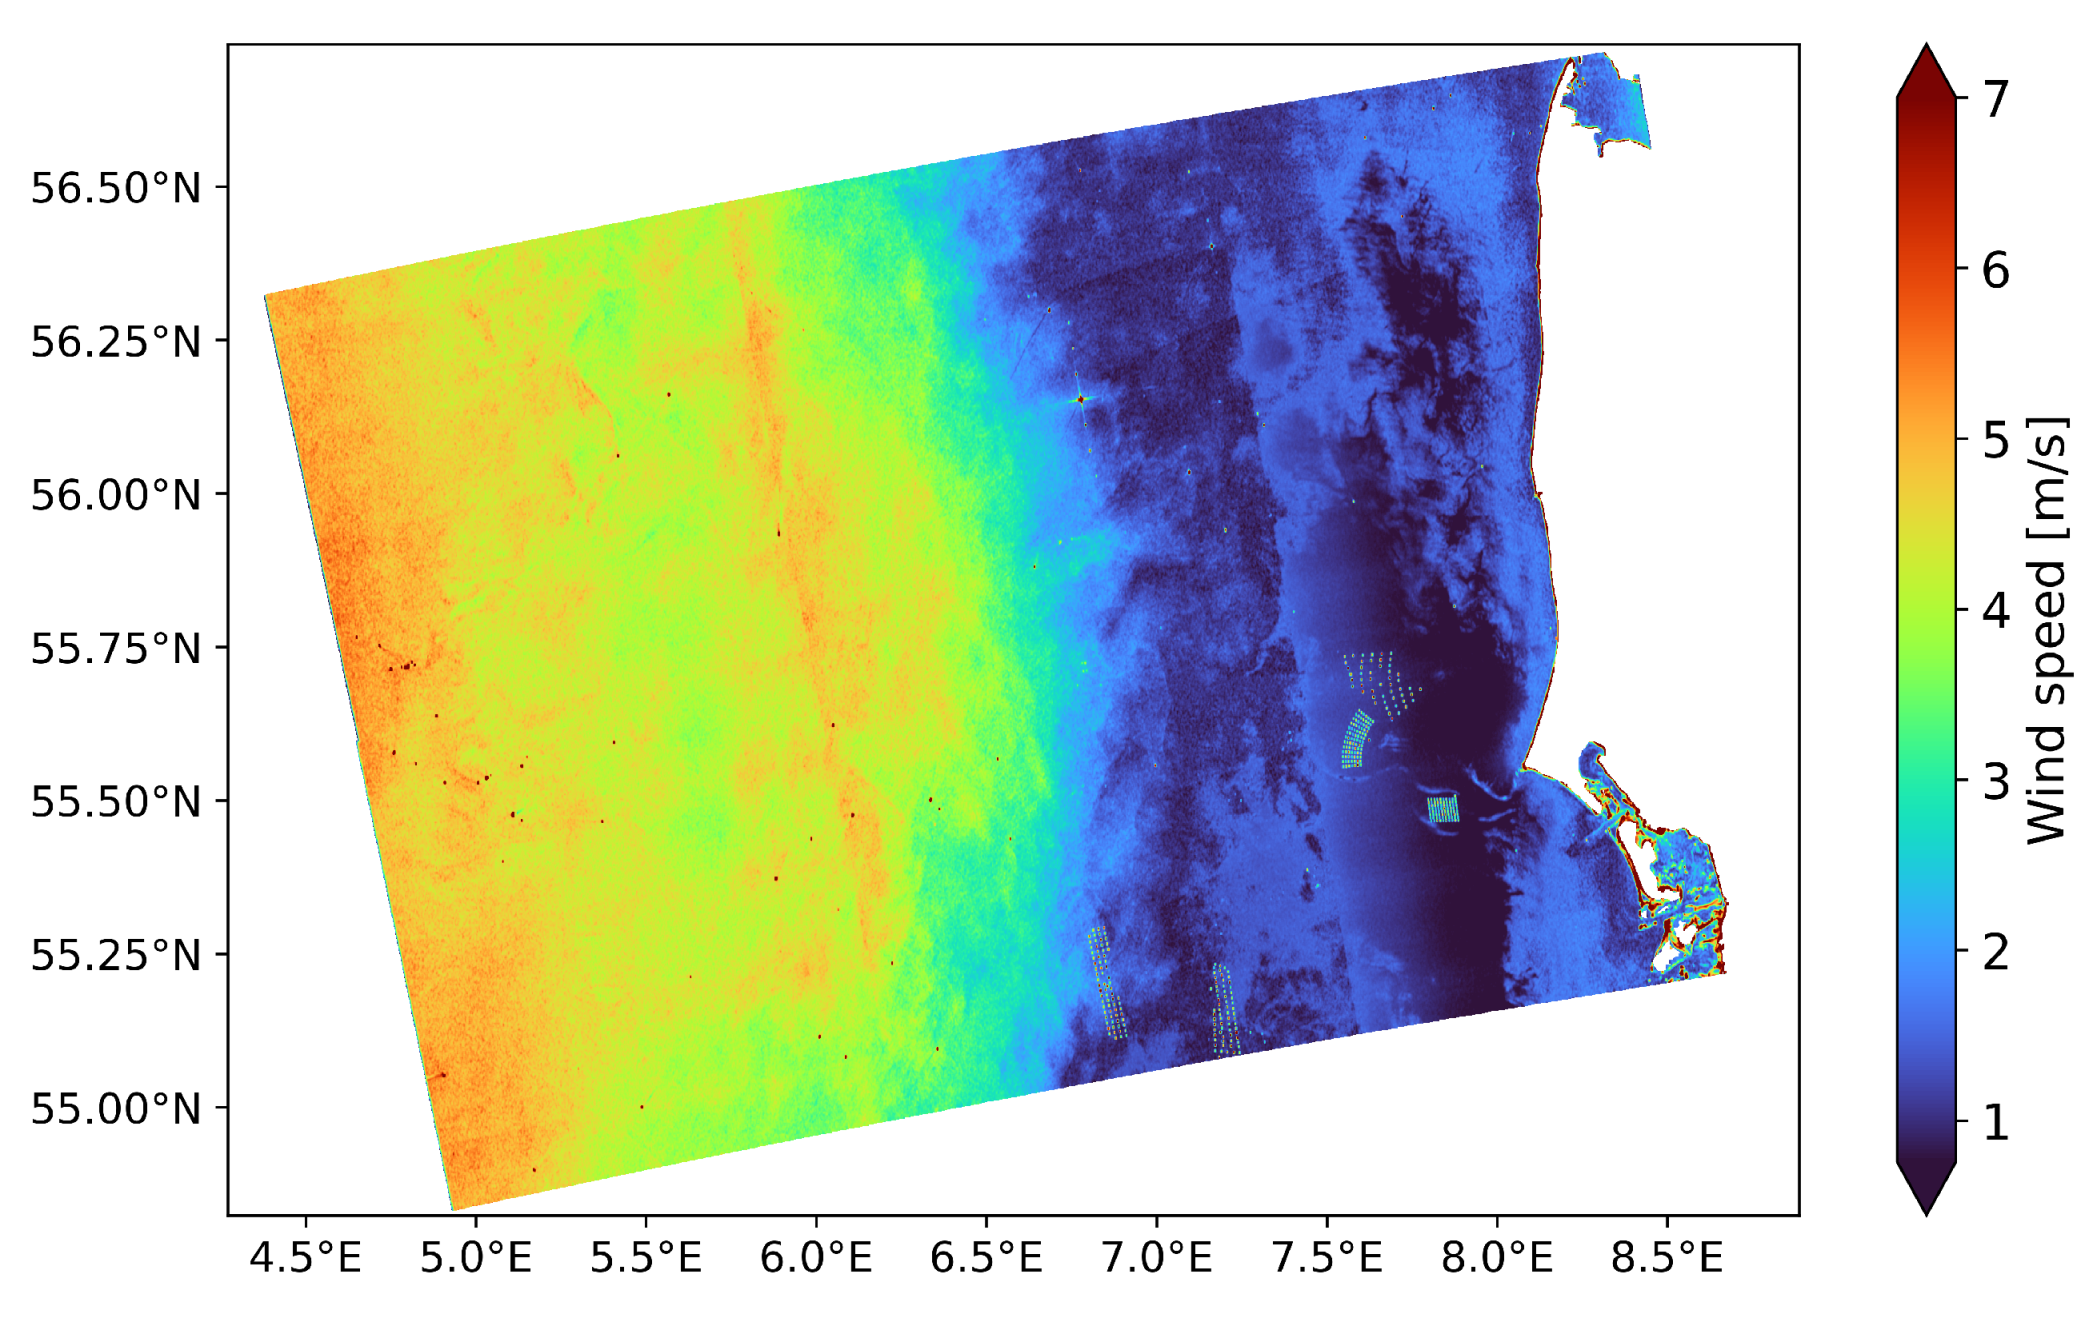
Figure 8 shows an example wind field retrieved from Sentinel-1. The wind farms Dantysk and Sandbank are seen in the lower part of the map, and three other wind farms are located further north at Horns Rev. The scene was acquired on a calm day where wind speeds were within the range of 1–7 m s 1 and increasing with the distance from the coastline.

5.2. Wind Speeds from SAR vs. Mast Observations

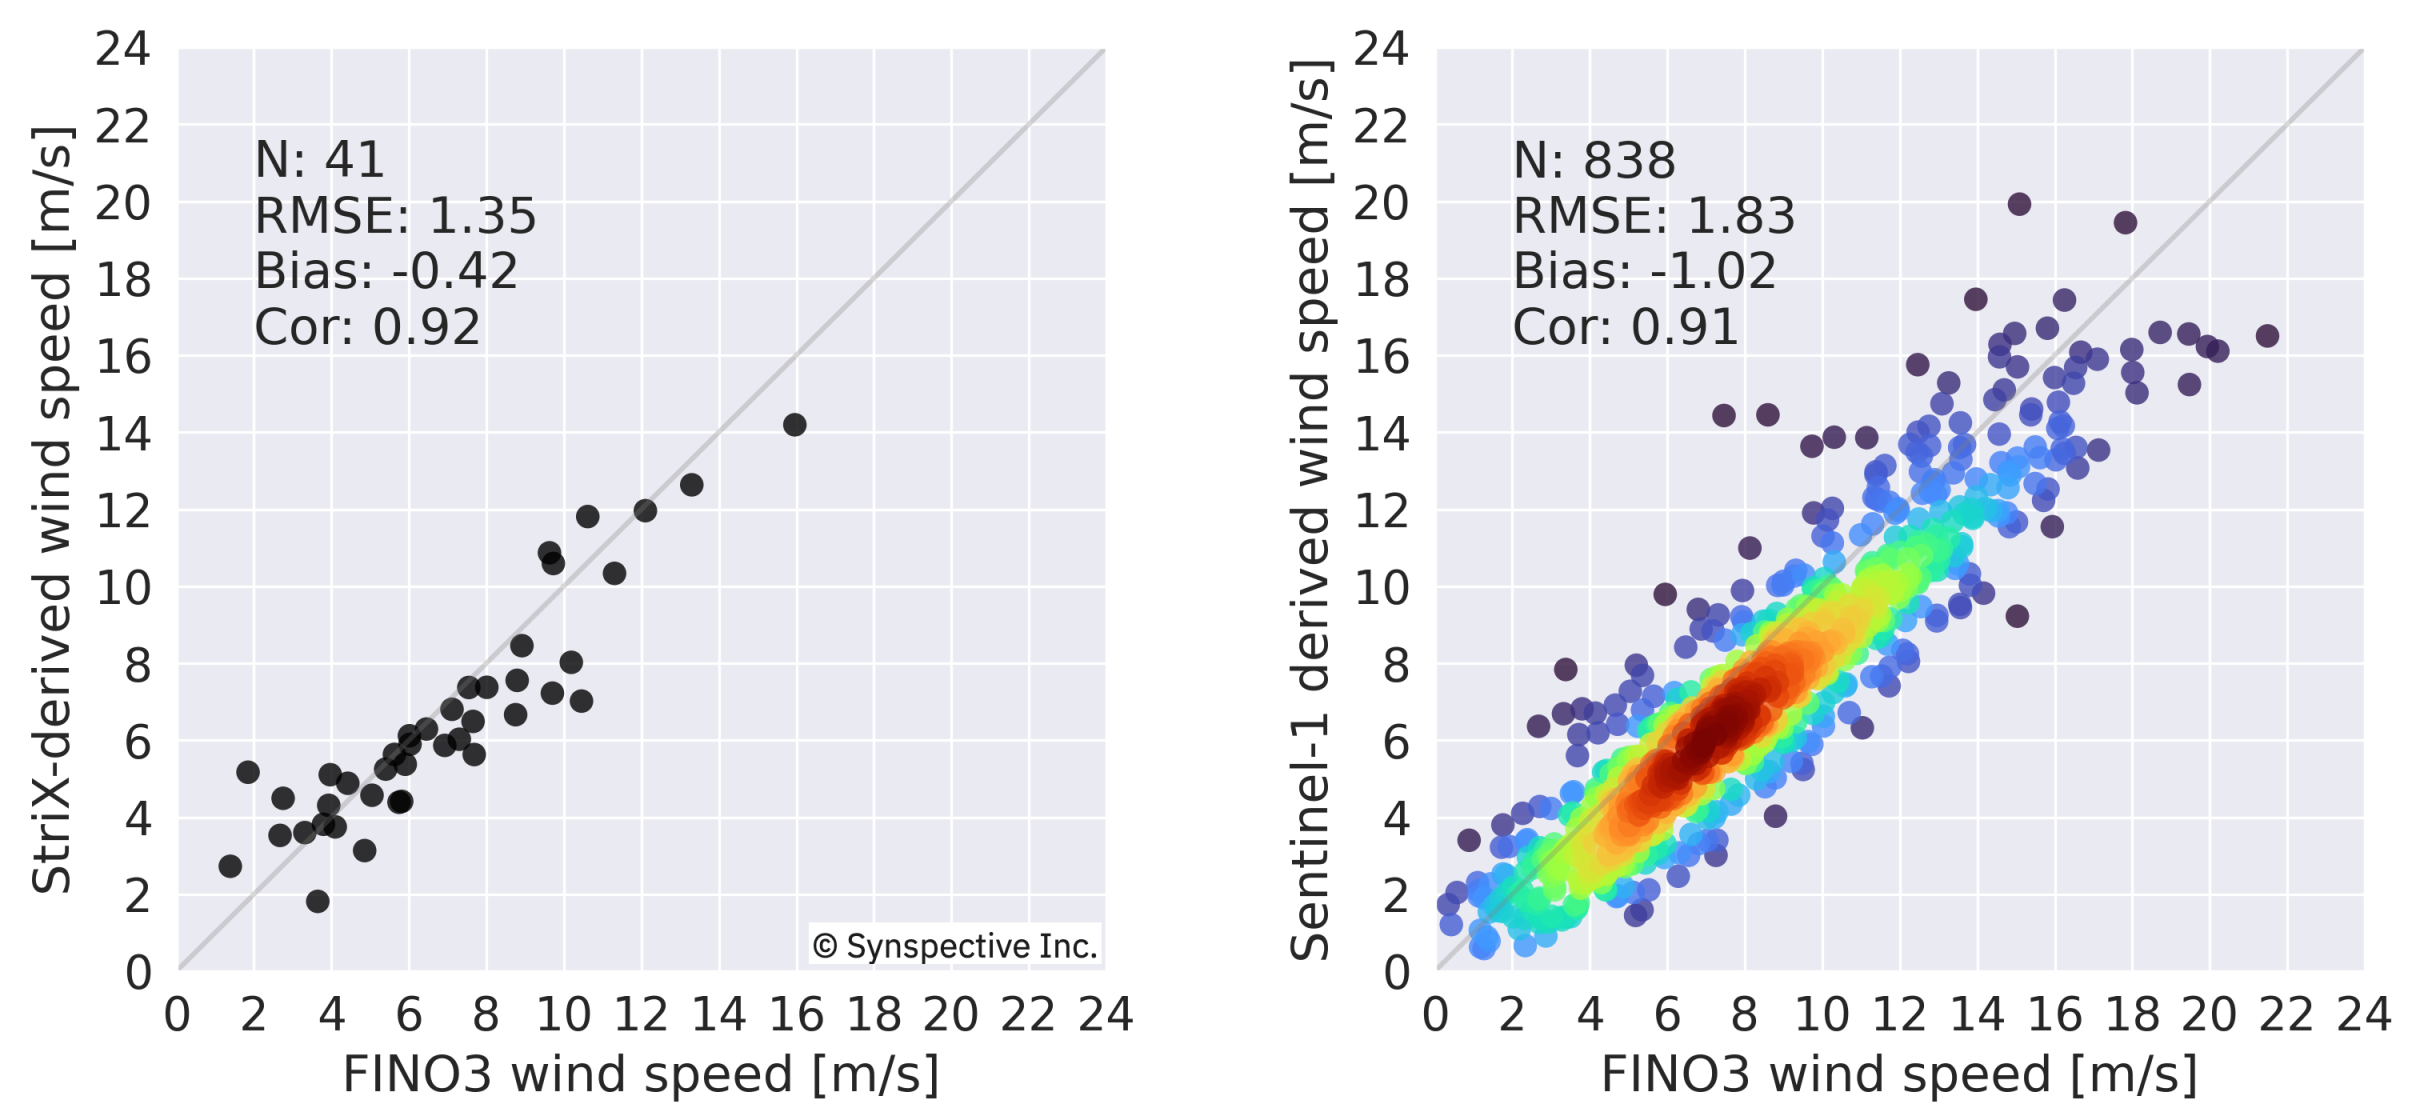
Figure 9 shows scatterplots of wind speeds retrieved from StriX- β and Sentinel-1 SAR vs. wind speed observations from FINO3. For StriX- β , we have 41 samples after filtering, and we see a good correlation between the wind speeds retrieved from StriX- β and the mast observations with R = 0.92. For Sentinel-1, we have 838 samples after filtering, and the data points correlate well with an R = 0.91. We find RMSE values of 1.35 m s 1 and 1.83 m s 1 for StriX and Sentinel-1, respectively. Both data sets show a negative bias, meaning that the satellite wind retrievals are consistently lower than the wind speeds observed at the mast. For StriX- β , the bias is −0.42 m s 1 and for Sentinel-1 it is −1.02 m s 1 .

5.3. Effects of Sampling Scenarios

Table 4 shows the result of the sampling analysis described in Section 4.3. The sampling scenario (1) represents the entire set of mast observations at FINO3 at a height of 31 m where no conditions are applied. The conditions (2) to (4) are based on the same sampling criteria as used in Barthelmie and Pryor [37]: temporal sampling in the early morning and late afternoon, truncation of the actual wind speed distribution, and the cumulative effect of these two sampling conditions.
Our results are consistent with the findings of Barthelmie and Pryor [37] in that both the conditions at fixed times of the day and truncation through elimination of wind speeds less than 2 m s 1 produce biases in the wind resource statistics relative to the statistics calculated from the full time series. The bias introduced by the truncation is the most pronounced and leads to an overestimation of the mean wind speed (3%) and the energy density (2%). Sampling at fixed times of the day, in contrast, leads to a slight underestimation of the mean wind speed and the energy density. This can be because the selected times of day fail to capture the higher wind speeds occurring after 18:00, according to Figure 6.
Through the scenarios (5) to (8), we mimic current and future satellite sampling strategies where daily and hourly observations are made possible. We find that the hourly observations can almost perfectly replicate the wind resource statistics estimated from the original time series of mast measurements. Both versions of the daily observations introduce larger deviations: sampling at noon leads to underestimation, whereas sampling at 18:00 in the evening leads to overestimation of the mean wind speed and the energy density on the order of 1–4%. Again, this can be explained by the diurnal cycle of the mean wind speed (Figure 6). Altogether, these findings indicate that daily observations are not sufficient to capture the wind resource statistics at sites with a diurnal wind speed variation, while hourly observations could suffice.
In order to visualize how the wind resource increases with height, we present our estimated wind resource statistics for different heights on the FINO3 mast in Table 5. The table shows a gradual increase in the mean wind speed from 8.68 m s 1 at 31 m to 9.67 m s 1 at 107 m, and likewise, the energy density increases from 702 W m 2 to 995 W m 2 between the same two heights.

6. Discussion

We have presented the first ocean wind fields retrieved from StriX- β observations. The recent launch of the StriX- β satellite leaves little time for sensor calibration, and our expectation is therefore that the calibration coefficients used to estimate σ 0 from StriX- β SAR observations will continue to improve over time as more ground truth observations are gathered over rain forests. The StriX- β scenes used in this study already show σ 0 values that lie within an uncertainty bound of 1dB, which should be sufficient for wind retrieval processing. Hard targets in the ocean, such as ships and wind turbines, cause high values of σ 0 , which may eventually lead to artificially high wind speeds. Removal of these targets requires advanced detection algorithms [50], but here we have chosen a simpler approach of averaging pixels in the SAR imagery prior to wind retrieval processing. The pixel averaging reduces the cumulative effect of speckle noise, inclinations of the sea surface due to long-period waves, and the bright scattering from hard targets. Removal of bright targets would lead to an overall reduction in the retrieved wind speeds, but since we only extract wind speeds upstream of the turbines at the DanTysk wind farm, we anticipate that the effect on our statistical results would be very limited.
Our results indicate that the XMOD2 function, originally developed for TerraSAR-X observations, is also suitable for wind retrievals from StriX- β observations. Through comparisons with mast observations, we obtain wind speeds with a RMSE of 1.35 m s 1 , which is comparable to previous findings from TerraSAR-X observations [22,24]. We find a negative wind speed bias of −0.42 m s 1 for StriX, which is numerically a bit larger than the bias reported for TerraSAR-X observations. A tuning of the XMOD2 coefficients could lead to a dedicated GMF for StriX SAR observations once a larger archive of StriX imagery is available for the fitting of coefficients. We also find a negative bias for wind retrievals from Sentinel-1 SAR, whereas previous analyses of Sentinel-1 SAR wind fields over the North Sea have shown a small positive bias on the order of 0.1–0.2 m s 1 [28]. In contrast, consistently negative biases on wind speeds retrieved from Sentinel-1 SAR were reported for the Irish Sea by de Montera et al. [51]. The previous analyses of TerraSAR-X and Sentinel-1 wind fields were all based on comparisons against ocean buoy observations.
It is possible that our comparison to mast observations at FINO3, which are obtained at higher levels above the sea surface, has introduced a negative bias for all the comparisons performed. Negative biases were also found for comparisons of numerical model simulations with mast observations at FINO3 by Hahmann et al. [52]. Firstly, flow distortion around the mast and the booms holding cup anemometers could lead to speed-up effects and enhanced wind speed values. Secondly, the wind turbines located at Sandbank, approximately 20 km upstream of the FINO3 mast, might influence the mast observations and the SAR observations differently due to the nature and the varying heights of these observations. Thirdly, the wind farms at Sandbank and DanTysk are built on submerged sandbanks where the waters are shallow. These bathymetry features under the water may have an impact on the small-scale waves at the sea surface, which are sensed by the SAR but not directly by the anemometers on the mast. Finally, winds retrieved from SAR are expressed as equivalent neutral winds, whereas the mast observations represent the real wind speed, which includes atmospheric stability effects driven by thermal gradients in the atmosphere. Atmospheric stability effects could have an impact on the wind speeds observed at the mast and also on the wind speed extrapolation from the measurement levels at 31–107 m to the SAR wind retrieval height of 10 m. Stability conditions over the North Sea have a seasonal dependency that varies from site to site [53,54]. Since the StriX- β data set presented here was acquired during the summer months whereas the Sentinel-1 scenes were obtained during seven full years, it is somewhat surprising that negative wind speed biases are found in both data sets. This could indicate that the other effects mentioned above have a larger impact on the wind speed comparisons than the atmospheric stability. Systematic comparisons at larger scales, e.g., using networks of ocean buoys or profiling lidars, would be helpful for quantifying and correcting the effects of flow distortion by the mast and nearby wind turbines, the effects of ocean bathymetry, and atmospheric stability.
Through simulations of different satellite sampling scenarios based on a conditional selection of data from the full time series of wind speed observations at FINO3, we have reproduced the results published by Barthelmie and Pryor [37]. Our results are based on sampling scenarios for polar-orbiting sun-synchronous satellites operated by public space agencies such as Sentinel-1 with acquisitions at fixed local times of the day around 6:00 and 17:00. The selection of these time stamps reduces the number of samples significantly from 360 × 10 3 to 10 × 10 3 but the estimated mean wind speeds, Weibull parameters, and energy densities are very similar to those estimated from the full time series. A truncation of the wind speeds through filtering of wind speeds lower than 2 m s 1 has a larger impact on the wind resource statistics and leads to an overestimation of the mean wind speed and the energy density. This is also reflected in the statistics for combining the two sampling criteria described here (i.e., sampling at fixed times of the day and eliminating wind speeds lower than 2 m s 1 ). Low wind speeds are particularly challenging in connection with SAR observations at high off-nadir angles since these result in a higher NESZ. If NESZ can be precisely estimated and subtracted, such measurements can be included. Although SAR wind speed retrievals are inaccurate when the wind speed is below 2 m s 1 , we recommend preserving such data and letting them contribute to wind resource predictions rather than eliminating them from statistical analyses.
Our extension of previous analyses to match current and future sampling scenarios by constellations of small SAR satellites suggests that for the FINO3 site, hourly observations lead to mean wind speeds, Weibull parameters, and energy densities that match the estimates based on 10-min sampling almost perfectly. Daily sampling fixed at 12:00 and 18:00, in contrast, leads to deviations from the estimates based on the full wind speed time series, and they are also different from the sampling fixed around 6:00 and 17:00. As seen in Figure 6, there is a diurnal wind speed variation at FINO3, with mean wind speeds ranging from 8.6 m s 1 in the morning to 8.8 m s 1 in the evening. Sampling at fixed times of the day does not capture this variation, and therefore, we see biases in the wind resource predictions on the order of 1–4%.
Our results at FINO3 are representative of the North Sea, where diurnal wind speed variability has also been found in previous studies [54]. The wind speed variability is, however, limited, and the effect of using different satellite sampling scenarios at the FINO3 site is therefore also limited. We anticipate that the effect of hourly sampling would be more pronounced in other regions of the world, which are prone to different climatic conditions and to larger diurnal wind speed variability. For example, Solyali et al. [55] have found mean wind speeds within the range 3.8–6.2 m s 1 at the height of 30 m for a coastal site in Cyprus in the Mediterranean, and Ryu et al. [56] have found mean wind speeds ranging 5.5–6.2 m s 1 at 26 m for an offshore site in South Korea.
The comparison and sampling analyses presented here are valid at 10 m and 31 m above the sea surface, respectively. For wind energy resource assessment, the wind conditions at the turbine height is needed. Modern offshore wind turbines have hub heights exceeding 100 m, and the mast observations from FINO3 show how the wind resource increases dramatically with height. Methods exist for the extrapolation of SAR wind maps to these levels by means of additional data sets for the characterization of vertical wind profiles. Badger et al. [57] extrapolated mean wind speed maps from 10 m to higher levels using a long-term average wind profile calculated from numerical simulations with the Weather Research and Forecast (WRF) model. de Montera et al. [58] demonstrated how wind profiles observed with lidars can be used in combination with machine learning to determine instantaneous wind profiles, and other works have expanded this approach [59,60].
As of September 2022, 35 small X-band SAR satellites had been launched by five commercial companies. Of the 35 satellites, 31 were placed in polar orbits (inclination approximately 95–97 ) and only four satellites were placed in more inclined planes (30–50 ). Polar orbits are advantageous since they provide global coverage and allow the use of high-latitude downlink stations, which are visible on each pass. These orbits are favorable for ocean surface wind speed estimation in connection with wind energy applications since most of the existing offshore wind farms are installed at latitudes higher than 40 and can be monitored almost daily. StriX- β and Sentinel-1 both utilize a sun-synchronous orbit, which is a special kind of polar orbit where the satellite always visits the same spot at the same local time. The diurnal wind speed variability can be resolved with a constellation of SAR satellites in sun-synchronous orbits using different Local Time of the Ascending Node (LTAN) orbit parameters.
SAR imagery acquired in wide-swath SAR mode, such as the Sentinel-1 scenes used in this study, covers large areas with a revisit time on the order of two days over the FINO3 point location. Archived Sentinel-1 scenes have been available since 2015 for most locations in the world, and it is thus possible to gather SAR scenes from the past. StriX and other small SAR satellites cover smaller areas but have a very high spatial resolution, and samples can be obtained upon request over a potential wind farm site. During the four months considered in this analysis, a total of 74 StriX- β were achieved. Sentinel-1 delivered 39 overpasses and TerraSAR-X 10 overpasses during the same period. Combining samples from polar-orbiting satellites operated by public space agencies with the more customized acquisitions that are possible with small SAR satellites offers new possibilities to collect a large number of samples over a specific site and to ensure that diurnal wind speed variability is accounted for.
As shown in Figure 7, it is possible to distinguish the effects of individual wind turbines on the local wind climate from the StriX imagery. The very high spatial resolution of the wind fields retrieved from small SAR satellites could add value in connection with the planning of new wind farm projects, especially if these projects are in the vicinity of existing wind farms in operation. Further investigations are needed to fully determine the potential of small SAR satellites for mapping blocking effects upstream of offshore wind farms and wake effects on the downstream side of the turbines.

7. Conclusions

The recent launch of small SAR satellites by private companies increases the availability of SAR imagery significantly. In the near future, constellations of small SAR satellites will be in orbit, and hourly overpasses of a given site on Earth will be feasible. This could lead to a paradigm shift in the way satellite SAR sensors are used for disaster monitoring and also for the assessment of renewable energy resources. This study has presented a series of StriX- β SAR scenes acquired over the wind farm site DanTysk in the North Sea. For the first time, wind speed maps are retrieved from the StriX- β SAR imagery as well as from the multi-purpose SAR mission Sentinel-1. Comparisons of the SAR wind fields with wind speed observations from the FINO3 mast lead to root-mean-square errors of 1.4 to 1.8 m s 1 and negative biases of 0.4 to 1.0 m s 1 , respectively. These findings are comparable with previous works, but further improvement of the Strix wind retrievals can perhaps be achieved through improvement of the sensor calibration or through the development of a dedicated GMF for Strix wind retrievals as more scenes become available over time. Based on the mast observations of wind speed at FINO3, we have estimated the wind resource at the site. Conditional sampling from the full-time series of wind observations is used to simulate current and future SAR sampling scenarios. Our results suggest that hourly sampling improves the wind resource estimates by up to 4% as compared with sampling at lower frequencies due to the diurnal wind speed variability at the site investigated. Larger improvements may be achieved at other sites with more pronounced diurnal wind speed variability. Small SAR satellites can deliver ocean wind fields at a very high spatial resolution, which is beneficial for mapping the wind conditions around existing and future offshore wind farms.

Author Contributions

Conceptualization, M.B., A.F. and M.K.; methodology, A.F. and M.K.; software, A.F. and M.K.; validation, D.H.; formal analysis, A.F.; investigation, A.F. and K.O.; resources, K.O. and M.B.; data curation, K.O., A.F. and D.H.; writing—original draft preparation, M.B.; writing—review and editing, A.F., K.O., D.H. and M.K.; visualization, M.B., A.F. and K.O.; supervision, M.B., D.H. and M.K.; project administration, M.B. All authors have read and agreed to the published version of the manuscript.

Funding

This research was funded by Synspective Inc. and conducted through a bilateral project between Synspective Inc. and the Technical University of Denmark. D.H. received funding from the European Union’s Horizon 2020 research and innovation programme under the Marie Sklodowska-Curie grant agreement number 860879.

Data Availability Statement

Strix SAR scenes are the property of Synspective Inc. and can be purchased upon request. Sentinel-1 SAR scenes are available from the Copernicus Open Access Hub (https://scihub.copernicus.eu, accessed on 26 April 2023) and meteorological observations from the FINO3 research platform are available from the FINO Datenbank (https://fino.bsh.de, accessed on 26 April 2023).

Acknowledgments

We thank Li XiaoMing, Institute of Remote Sensing and Digital Earth, Chinese Academy of Sciences for providing the XMOD2 code. We acknowledge the efforts of Alvaro Arenas and Rishabh Chavhan.

Conflicts of Interest

Synspective Inc. participated in the design of the study; in the collection, analyses, or interpretation of data; in the writing of the manuscript; and in the decision to publish the results.

References

  1. UNFCCC. Paris Agreement; Technical Report; United Nations: Bonn, Germany, 2015. [Google Scholar]
  2. IRENA. Renewable Power Generation Costs in 2021; Technical Report; International Renewable Energy Agency: Abu Dhabi, United Arab Emirates, 2021. [Google Scholar]
  3. Wind Europe. Scaling Up Floating Offshore Wind towards Competitiveness; Technical Report; Wind Europe: Brussels, Belgium, 2021. [Google Scholar]
  4. Ahsbahs, T.; Badger, M.; Karagali, I.; Larsén, X. Validation of Sentinel-1A SAR coastal wind speeds against scanning LiDAR. Remote Sens. 2017, 9, 552. [Google Scholar] [CrossRef]
  5. Lu, Y.; Zhang, B.; Perrie, W.; Mouche, A.A.; Li, X.; Wang, H. A C-Band geophysical model function for determining coastal wind speed using synthetic aperture radar. IEEE J. Sel. Top. Appl. Earth Obs. Remote Sens. 2018, 11, 2417–2428. [Google Scholar] [CrossRef]
  6. Takeyama, Y.; Ohsawa, T.; Kozai, K.; Hasager, C.; Badger, M. Comparison of geophysical model functions for SAR wind speed retrieval in japanese coastal waters. Remote Sens. 2013, 5, 1956. [Google Scholar] [CrossRef]
  7. La, T.V.; Khenchaf, A.; Comblet, F.; Nahum, C. Exploitation of C-Band Sentinel-1 Images for High-Resolution Wind Field Retrieval in Coastal Zones (Iroise Coast, France). IEEE J. Sel. Top. Appl. Earth Obs. Remote Sens. 2017, 10, 5458–5471. [Google Scholar] [CrossRef]
  8. Wei, S.; Yang, S.; Xu, D. On accuracy of SAR wind speed retrieval in coastal area. Appl. Ocean. Res. 2020, 95, 102012. [Google Scholar] [CrossRef]
  9. Owda, A.; Badger, M. Wind Speed Variation Mapped Using SAR before and after Commissioning of Offshore Wind Farms. Remote Sens. 2022, 14, 1464. [Google Scholar] [CrossRef]
  10. Verhoef, A.; Portabella, M.; Stoffelen, A. High-resolution ASCAT scatterometer winds near the coast. IEEE Trans. Geosci. Remote Sens. 2012, 50, 2481–2487. [Google Scholar] [CrossRef]
  11. Orzel, K.; Fujimaru, S.; Obata, T.; Imaizumi, T.; Arai, M. The on-orbit demonstration of the small SAR satellite. Initial calibration and observations. In Proceedings of the 2022 IEEE Radar Conference (RADARCONF’22), New York, NY, USA, 21–25 March 2022; 2022. [Google Scholar] [CrossRef]
  12. Stoffelen, A.; Anderson, D.L.T. Scatterometer data interpretation: Estimation and validation of the transfer function CMOD4. J. Geophys. Res. 1997, 102, 5767–5780. [Google Scholar] [CrossRef]
  13. Quilfen, Y.; Chapron, B.; Elfouhaily, T.; Katsaros, K.; Tournadre, J. Observation of tropical cyclones by high-resolution scatterometry. J. Geophys. Res. 1998, 103, 7767–7786. [Google Scholar] [CrossRef]
  14. Hersbach, H.; Stoffelen, A.; de Haan, S. An improved C-band scatterometer ocean geophysical model function: CMOD5. J. Geophys. Res. Ocean. 2007, 112, 16. [Google Scholar] [CrossRef]
  15. Hersbach, H. Comparison of C-Band Scatterometer CMOD5.N Equivalent Neutral Winds with ECMWF. J. Atmos. Ocean. Technol. 2010, 27, 721–736. [Google Scholar] [CrossRef]
  16. Stoffelen, A.; Verspeek, J.A.; Vogelzang, J.; Verhoef, A. The CMOD7 Geophysical Model Function for ASCAT and ERS Wind Retrievals. IEEE J. Sel. Top. Appl. Earth Obs. Remote Sens. 2017, 10, 2123–2134. [Google Scholar] [CrossRef]
  17. Dagestad, K.F.; Horstmann, J.; Mouche, A.; Perrie, W.; Shen, H.; Zhang, B.; Li, X.; Monaldo, F.; Pichel, W.; Lehner, S.; et al. Wind retrieval from synthetic aperture radar—An overview. In Proceedings of the SEASAR 2012 Advances in SAR Oceanography, Tromsø, Norway, 18–22 June 2012. [Google Scholar]
  18. Koch, W. Directional analysis of SAR images aiming at wind direction. IEEE Trans. Geosci. Remote Sens. 2004, 42, 702–710. [Google Scholar] [CrossRef]
  19. Lehner, S.; Horstmann, J.; Koch, W.; Rosenthal, W. Mesoscale wind measurements using recalibrated ERS SAR images. J. Geophys. Res. Ocean. 1998, 103, 7847–7856. [Google Scholar] [CrossRef]
  20. Monaldo, F.M.; Beal, R. Wind speed and direction. In Synthetic Aperture Radar Marine User’s Manual; Jackson, C.R., Apel, J.R., Eds.; U.S. Department of Commerce, National Oceanic and Atmospheric Administration: Washingon, DC, USA, 2004; pp. 305–320. [Google Scholar]
  21. Takeyama, Y.; Ohsawa, T.; Kozai, K.; Hasager, C.B.; Badger, M. Effectiveness of WRF wind direction for retrieving coastal sea surface wind from synthetic aperture radar. Wind Energy 2013, 16, 865–878. [Google Scholar] [CrossRef]
  22. Li, X.; Lehner, S. Algorithm for sea surface wind retrieval from TerraSAR-X and TanDEM-X data. IEEE Trans. Geosci. Remote Sens. 2014, 52, 2928–2939. [Google Scholar] [CrossRef]
  23. Li, X.M.; Ren, Y.Z. Mapping of sea surface wind and current fields in the China seas using x-band spaceborne SAR. In Remote Sensing of the Asian Seas; Springer International Publishing: Cham, Switzerland, 2018; pp. 269–284. [Google Scholar] [CrossRef]
  24. Shao, W.; Li, X.; Yang, X. Retrieval of winds and waves from synthetic aperture radar imagery. In Remote Sensing of the Asian Seas; Springer International Publishing: Cham, Switzerland, 2018; pp. 285–303. [Google Scholar] [CrossRef]
  25. Ren, Y.; Lehner, S.; Brusch, S.; Li, X.; He, M. An algorithm for the retrieval of sea surface wind fields using X-band TerraSAR-X data. Int. J. Remote Sens. 2012, 33, 7310–7336. [Google Scholar] [CrossRef]
  26. Nirchio, F.; Venafra, S. XMOD2 - An improved geophysical model function to retrieve sea surface wind fields from Cosmo-SkyMed X-band data. Eur. J. Remote Sens. 2013, 46, 583–595. [Google Scholar] [CrossRef]
  27. Monaldo, F.; Jackson, C.; Li, X.; Pichel, W.G. Preliminary Evaluation of Sentinel-1A Wind Speed Retrievals. IEEE J. Sel. Top. Appl. Earth Obs. Remote Sens. 2016, 9, 2638–2642. [Google Scholar] [CrossRef]
  28. Badger, M.; Ahsbahs, T.; Maule, P.; Karagali, I. Inter-calibration of SAR data series for offshore wind resource assessment. Remote Sens. Environ. 2019, 232, 111316. [Google Scholar] [CrossRef]
  29. Hasager, C.B.; Hahmann, A.N.; Ahsbahs, T.; Karagali, I.; Sile, T.; Badger, M.; Mann, J. Europe’s offshore winds assessed with synthetic aperture radar, ASCAT and WRF. Wind Energy Sci. 2020, 5. [Google Scholar] [CrossRef]
  30. Takeyama, Y.; Ohsawa, T.; Shimada, S.; Kozai, K.; Kawaguchi, K.; Kogaki, T. Assessment of the offshore wind resource in Japan with the ASCAT microwave scatterometer. Int. J. Remote Sens. 2019, 40, 1200–1216. [Google Scholar] [CrossRef]
  31. Takeyama, Y.; Ohsawa, T.; Tanemoto, J.; Shimada, S.; Kozai, K.; Kogaki, T. A comparison between Advanced Scatterometer and Weather Research and Forecasting wind speeds for the Japanese offshore wind resource map. Wind Energy 2020, 23, 1596–1609. [Google Scholar] [CrossRef]
  32. Chang, R.; Zhu, R.; Badger, M.; Hasager, C.; Zhou, R.; Ye, D.; Zhang, X. Applicability of Synthetic Aperture Radar Wind Retrievals on Offshore Wind Resources Assessment in Hangzhou Bay, China. Energies 2014, 7, 3339–3354. [Google Scholar] [CrossRef]
  33. Chang, R.; Zhu, R.; Badger, M.; Hasager, C.; Xing, X.; Jiang, Y. Offshore Wind Resources Assessment from Multiple Satellite Data and WRF Modeling over South China Sea. Remote Sens. 2015, 7, 467–487. [Google Scholar] [CrossRef]
  34. Doubrawa, P.; Barthelmie, R.J.; Pryor, S.C.; Hasager, C.B.; Badger, M.; Karagali, I. Satellite winds as a tool for offshore wind resource assessment: The Great Lakes Wind Atlas. Remote Sens. Environ. 2015, 168, 349–359. [Google Scholar] [CrossRef]
  35. Ahsbahs, T.; MacLaurin, G.; Draxl, C.; Jackson, C.; Monaldo, F.; Badger, M. US East Coast synthetic aperture radar wind atlas for offshore wind energy. Wind Energy Sci. 2020, 5, 1191–1210. [Google Scholar] [CrossRef]
  36. Troen, I.; Petersen, E.L. European Wind Atlas; Risø National Laboratory: Roskilde, Denmark, 1989; pp. 1–656. [Google Scholar]
  37. Barthelmie, R.J.; Pryor, S.C. Can satellite sampling of offshore wind speeds realistically represent wind speed distributions. J. Appl. Meteorol. 2003, 42, 83–94. [Google Scholar] [CrossRef]
  38. Hwang, P.A.; Stoffelen, A.; Van Zadelhoff, G.J.; Perrie, W.; Zhang, B.; Li, H.; Shen, H. Cross-polarization geophysical model function for C-band radar backscattering from the ocean surface and wind speed retrieval. J. Geophys. Res. Ocean. 2015, 120, 893–909. [Google Scholar] [CrossRef]
  39. Vachon, P.W.; Wolfe, J. C-band cross-polarization wind speed retrieval. IEEE Geosci. Remote Sens. Lett. 2011, 8, 456–459. [Google Scholar] [CrossRef]
  40. Petersen, E.L.; TROEN, I.; Frandsen, S.; Hedegaard, K. Windatlas for Denmark; Ris¢ National Laboratory: Roskilde, Denmark, 1981; pp. 1–229. [Google Scholar]
  41. Pyne, B.; Saito, H.; Akbar, P.R.; Hirokawa, J.; Tomura, T.; Tanaka, K. Development and Performance Evaluation of Small SAR System for 100-kg Class Satellite. IEEE J. Sel. Top. Appl. Earth Obs. Remote Sens. 2020, 13, 3879–3891. [Google Scholar] [CrossRef]
  42. Orzel, K.; Fujimaru, S.; Obata, T.; Imaizumi, T.; Arai, M. StriX-α SAR satellite: Demonstration of observation modes and initial calibration results. Proc. Eur. Conf. Synth. Aperture Radar Eusar 2022, 2022, 165–168. [Google Scholar]
  43. Shimada, M.; Freeman, A. A technique for measurement of spaceborne SAR antenna patterns using distributed targets. IEEE Trans. Geosci. Remote Sens. 1995, 33, 100–114. [Google Scholar] [CrossRef]
  44. Leiding, T.; Tinz, B.; Gates, L.; Rosenhagen, G.; Herklotz, K.; Senet, C.; Outzen, O.; Lindenthal, A.; Neumann, T.; Frühmann, R.; et al. Standardisierung und Vergleichende Analyse der Meteorologischen FINO-Messdaten (FINO123); Technical Report; Deutscher Wetterdienst: Offenbach, Germany, 2016. [Google Scholar]
  45. Portabella, M.; Stoffelen, A. On Scatterometer Ocean Stress. J. Atmos. Ocean. Technol. 2009, 26, 368–382. [Google Scholar] [CrossRef]
  46. Hasager, C.B.; Dellwik, E.; Nielsen, M.; Furevik, B. Validation of ERS-2 SAR offshore wind-speed maps in the North Sea. Int. J. Remote Sens. 2004, 25, 3817–3841. [Google Scholar] [CrossRef]
  47. Rannik, U.; Sogachev, A.; Foken, T.; Göckede, M.; Kljun, N.; Leclerc, M.Y.; Vesala, T. Footprint Analysis. In Eddy Covariance; Springer Atmospheric Sciences; Aubinet, M., Vesala, T., Papale, D., Eds.; Springer: Dordrecht, The Netherlands, 2012; pp. 211–261. [Google Scholar] [CrossRef]
  48. Taylor, G.I. The spectrum of turbulence. Proc. R. Soc. Lond. Ser. Math. Phys. Sci. 1938, 164, 476–490. [Google Scholar] [CrossRef]
  49. Sikora, T.D.; Thompson, D.R.; Bleidorn, J.C. Testing the diagnosis of marine atmospheric boundary-layer structure from synthetic aperture radar. Johns Hopkins APL Tech. Dig. 2000, 21, 94–99. [Google Scholar]
  50. El-Darymli, K.; McGuire, P.; Power, D.; Moloney, C. Target detection in synthetic aperture radar imagery: A state-of-the-art survey. J. Appl. Remote Sens. 2013, 7, 12207V. [Google Scholar] [CrossRef]
  51. de Montera, L.; Remmers, T.; O’Connell, R.; Desmond, C. Validation of Sentinel-1 offshore winds and average wind power estimation around Ireland. Wind Energy Sci. 2020, 5, 1023–1036. [Google Scholar] [CrossRef]
  52. Hahmann, A.N.; Sīle, T.; Witha, B.; Davis, N.N.; Dörenkämper, M.; Ezber, Y.; García-Bustamante, E.; González-Rouco, J.F.; Navarro, J.; Olsen, B.T.; et al. The making of the New European Wind Atlas – Part 1: Model sensitivity. Geosci. Model Dev. 2020, 13, 5053–5078. [Google Scholar] [CrossRef]
  53. Sathe, A.; Gryning, S.E.; Pena Diaz, A. Comparison of the atmospheric stability and wind profiles at two wind farm sites over a long marine fetch in the North Sea. Wind Energy 2011, 14, 767–780. [Google Scholar] [CrossRef]
  54. Coelingh, J.P.; Van Wijk, A.J.M.; Holtslag, A.A.M. Analysis of wind speed observations over the North Sea. J. Wind Eng. Ind. Aerodyn. 1996, 61, 51–69. [Google Scholar] [CrossRef]
  55. Solyali, D.; Altunç, M.; Tolun, S.; Aslan, Z. Wind resource assessment of Northern Cyprus. Renew. Sustain. Energy Rev. 2016, 55, 180–187. [Google Scholar] [CrossRef]
  56. Ryu, G.H.; Kim, Y.G.; Kwak, S.J.; Choi, M.S.; Jeong, M.S.; Moon, C.J. Atmospheric Stability Effects on Offshore and Coastal Wind Resource Characteristics in South Korea for Developing Offshore Wind Farms. Energies 2022, 15, 1305. [Google Scholar] [CrossRef]
  57. Badger, M.; Peña, A.; Hahmann, A.N.; Mouche, A.A.; Hasager, C.B. Extrapolating satellite winds to turbine operating heights. J. Appl. Meteorol. Climatol. 2016, 55, 975–991. [Google Scholar] [CrossRef]
  58. de Montera, L.; Berger, H.; Husson, R.; Appelghem, P.; Guerlou, L.; Fragoso, M. High-resolution offshore wind resource assessment at turbine hub height with Sentinel-1 synthetic aperture radar(SAR) data and machine learning. Wind Energy Sci. 2022, 7, 1441–1453. [Google Scholar] [CrossRef]
  59. Optis, M.; Bodini, N.; Debnath, M.; Doubrawa, P. New methods to improve the vertical extrapolation of near-surface offshore wind speeds. Wind Energy Sci. 2021, 6, 935–948. [Google Scholar] [CrossRef]
  60. Hatfield, D.; Hasager, C.B.; Karagali, I. Vertical extrapolation of ASCAT ocean surface winds using machine learning techniques. Wind Energy Sci. Discuss. 2022, 2022, 1–26. [Google Scholar] [CrossRef]
Figure 1. StriX satellite pre-launch (left) and in-orbit (right) configuration.
Energies 16 03819 g001
Figure 2. Six examples of StriX- β scenes acquired over the FINO3 site from June to September 2022. Acquisition times are shown at the top of each scene. (Left): situations with easterly winds; (right): situations with westerly winds. The wind turbines of the DanTysk wind farm stand out as bright objects compared with their surroundings.
Energies 16 03819 g002
Figure 3. Example Sentinel-1 scene acquired over the FINO3 site on 2022-06-26. Several offshore wind farms are visible as the individual turbines stand out as bright objects compared with their surroundings.
Energies 16 03819 g003
Figure 4. Example wind profiles observed (circle) and fitted (line) at the FINO3 mast at times when StriX- β scenes were acquired. (Left): easterly winds; (right): westerly winds. The number in parenthesis means the observed wind direction. Stars indicate the extrapolated wind speeds at 10 m above the sea surface.
Energies 16 03819 g004
Figure 5. Illustration of the rectangular footprint within which SAR wind speeds were extracted. In these examples from 2022-06-10 and 2022-06-14, the wind direction is from 227° and 293°, and the wind speed is 4.0 m s 1 and 5.7 m s 1 at the FINO3 mast (marked with a red cross). The length of the footprint for these cases then becomes 2.4 km (600 s × 4.0 m s 1 ) and 3.4 km (600 s × 5.7 m s 1 ), respectively. The DanTysk wind farm is outlined with thin black lines.
Energies 16 03819 g005
Figure 6. Diurnal variation of the mean wind speed at the height 31 m observed at FINO3. The mean is computed over the period from 2015-01-01 to 2021-12-31. The four blue lines and the two red lines indicate the selected times of day used for the conditional sampling.
Energies 16 03819 g006
Figure 7. Six examples of wind fields retrieved from the StriX- β scenes presented in Figure 2. Acquisition times are shown at the top of each scene. (Left): situations with easterly winds; (right): situations with westerly winds.
Energies 16 03819 g007
Figure 8. Wind field retrieved from the Sentinel-1 scene presented in Figure 3. Winds are coming from the south with wind speeds up to 7 m s 1 far offshore and lower wind speeds on the order of 1–3 m s 1 closer to the coastline.
Energies 16 03819 g008
Figure 9. Scatter plots showing wind speeds at the height 10 m retrieved from (left) StriX SAR and (right) Sentinel-1 SAR vs. wind speed observed at FINO3. The mast observations are extrapolated from measurements at higher levels and the colours in the plot to the right indicate the density of values.
Energies 16 03819 g009
Table 1. StriX- β and Sentinel-1 sensor specifications.
StriX- β Sentinel-1
Orbit typeSun-synchronousSun-synchronous
Orbit altitude560 km693 km
Orbit inclination97.37 98.18
Look directionLeft or rightRight
Center frequency9.65 GHz5.405 GHz
Chirp bandwidth75–300 MHz0–100 MHz
RF peak power1 kW4.3 kW
Duty cycle25%Max 12%
System noise figure2.6 dB3 dB
PRF3000–7000 Hz1000–3000 Hz
PolarizationVVVV + VH or HH + HV
Antenna size4.9 × 0.7 m12.3 × 0.821 m
Table 2. StriX- β and Sentinel-1 observation modes used to collect data analyzed in this publication.
StriX- β Sentinel-1
Observation modeStripmapInterferometric Wide Swath
Off-nadir angle19–39 26–40
Swath width10–30 km (nominal 20 km)250 km
Azimuth resolution2.6 m22.5 m
Slant range resolution1.8 mBeam-dependent: 2.7–3.5 m
Table 3. Characteristics of FINO3 meteorological mast with the heights of available measurements for wind speeds and directions.
Lat°Lon°Wind Speed [m]Wind Direction [m]
55.2007.1631, 41, 51, 61, 71, 81, 91, 101, 10729, 101
Table 4. Wind resource statistics calculated from wind speed observations at the FINO3 mast using different sampling strategies. E is the estimated energy densities and N the number of samples included.
MomentsWeibull Params
HeightMeanStd DevShapeScaleE
Observation Scenario[m][m s 1 ][m s 1 ]SkewnessKurtosis(k)(c)[W m 2 ]N
(1) Entire dataset (no condition)318.684.180.510.052.199.80702352,112
(2) Fixed times = [5:40, 5:50, 17:10, 17:20]318.654.190.520.062.189.777009788
(3) u 2 m s 1 318.914.030.43−0.072.3510.06718341,938
(4) Cumulative criteria of (2) and (3)318.894.050.44−0.052.3310.037159504
(5) Sentinel-1 acquisition times318.604.090.490.022.239.716741329
(6) Daily (every noon)318.644.180.520.062.189.766962430
(7) Daily (every evening)318.764.250.520.062.179.897282455
(8) Hourly318.684.180.510.052.199.8070158,697
Table 5. Wind resource statistics calculated from the whole time-series of wind speed observations for all the heights of the FINO3 mast.
MomentsWeibull Params
HeightMeanStd DevShapeScaleE
[m][m s 1 ][m s 1 ]SkewnessKurtosis(k)(c)[W m 2 ]N
1079.674.770.550.102.1310.91995364,619
1019.554.680.540.092.1510.78952349,642
919.484.650.540.092.1410.70932352,120
819.354.600.540.092.1410.56897338,033
719.304.530.530.072.1610.50873351,859
619.114.440.530.072.1610.29821352,170
518.994.350.520.062.1810.16785351,375
418.854.260.510.052.1910.00745352,461
318.684.180.510.052.199.80702352,112
Disclaimer/Publisher’s Note: The statements, opinions and data contained in all publications are solely those of the individual author(s) and contributor(s) and not of MDPI and/or the editor(s). MDPI and/or the editor(s) disclaim responsibility for any injury to people or property resulting from any ideas, methods, instructions or products referred to in the content.