Article

State-of-Health Prediction of Lithium-Ion Batteries Based on Diffusion Model with Transfer Learning

1
College of Mechanical Engineering, University of Shanghai for Science and Technology, Shanghai 200093, China
2
Shanghai Motor Vehicle Inspection Certification & Tech Innovation Center Co., Ltd., Shanghai 201805, China
*
Authors to whom correspondence should be addressed.
Energies 2023, 16(9), 3815; https://doi.org/10.3390/en16093815
Submission received: 24 March 2023 / Revised: 24 April 2023 / Accepted: 27 April 2023 / Published: 28 April 2023

Abstract

:
An accurate state-of-health (SOH) prediction of lithium-ion batteries (LIBs) is crucial to their safe and reliable. Although recently the data-driven methods have drawn great attention, owe to its efficient deep learning, it is worthwhile to continue devoting many efforts to prediction performance. In practice, fast charging mode has been widely applied in battery replenishing, which poses challenges for SOH prediction due to the diversity of charging conditions and electrochemical properties of LIBs; although, the process is stable and detectable. Furthermore, most previous data-driven prediction methods based discriminative model cannot describe the whole picture of the problem though sample data, affecting robustness of model in real-life applications. In this study, it is presented a SOH prediction model based on diffusion model, as an efficient new family of deep generative model, with time series information tackled through Bi-LSTM and the features derived from the voltage profiles in multi-stage charging process, which can identify distribution characteristics of training data accurately. The model is further refined by means of transfer learning, by adding a featured transformation from the base model for SOH prediction of different type LIBs. Two different types of LIBs datasets are used to evaluate the proposed model and the verified results revealed its better performance than those of other methods, reducing efforts required to collect data cycles of new battery types with the generality and robustness.

1. Introduction

In recent years, considerable attentions have been paid to lithium-ion batteries (LIBs) as dominant energy storage devices and power sources for electric vehicles (EVs), which facilitate the saving of fossil energy and environmentally friendly transportation [1]. However, the battery capacity degradation, affected by some factors, such as temperature, current rate, and battery historical aging path, are raising concerns of LIBs safety and feasible application in EVs, which could cause underuse or overuse of battery pack. Particularly, when the EVs are driving under the random and complex operation instead of in the laboratory cycle, leading to resource waste or some potential disasters [2].
Hence, to achieve timely maintenance and prevent malfunction, accurate predicting the state-of-health (SOH) of LIBs can provide a reference for battery control strategy and protection mechanism, which has drastically altered and pushed forward the sustainable development of EVs [3]. SOH was first proposed to evaluate the aging degree of a battery relative to a new battery in real time and used as an important indicator defined as the ratio of the available capacity in current operation to the rated capacity offered by the manufacture. Due to the different emphasis of power capability and energy capability in hybrid EVs (HEV) and pure EVs (PEV), the resistance and capacity are used as the ratio of SOH for HEV and PEV, respectively [4]. This study focused on the capacity-based SOH prediction.
Many previous research have proposed numerous SOH prediction methods, which are usually divided into two categories, model-driven and data-driven methods. The model-driven methods principally include electrochemical model (EM) and equivalent circuit model (ECM). EM describes the reactions during charging and discharging by electrochemical equations, concentrating on intrinsic aging mechanism in accordance with electrochemical principles. Li et al. [5] analyzed the influence of 26 parameters on an electrochemical model under both the charging process and real-life driving cycles. Randall et al. [6] introduced the side reactions to model degradation mechanisms. However, it is difficult to describe the whole internal parameters of battery accurately by equations due to complicated reaction process. ECM transforms the battery to circuit combined by some electrical components, to simulate the charging and discharging behaviors of LIBs by mathematical equations [7]. Additionally, model parameters are identified through empirical assumptions and mathematical algorithms, such as extend Kalman filter (EKF) [8,9], recursive least squares (RLS) [10], and particle filter (PF) [11]. Nonetheless, it is also difficult to predict precisely due to the discrepancy between battery internal state and model hypothesis.
More recently, the data-driven methods have been spotlighted in SOH prediction of LIBs because of easy acquirement for data and the development of artificial intelligence (AI). The methods neither require the prior knowledge about battery mechanism nor make prediction with human subjective experience or intervention, linking the latent relationships between inputs and outputs. Even more impressively, successful application in natural language processing (NLP), computer vision (CV), and speech processing have enabled these techniques to accelerate progress in research of battery field.
Some advanced data-driven methods based on traditional machine learning (ML) have been applied in SOH prediction, including artificial neural network (ANN) [12], support vector machine (SVM) [13,14], automated machine learning (AutoML) [15], and Gaussian process regression (GPR) [16,17], to capture the complicated relationship between input features and SOH. Additionally, Deep learning (DL) has become research focus recently by virtue of its remarkable performance in large-scale data processing. Some complex neural network models evolved from ANN, such as convolutional neural network (CNN) [18], recurrent neural network (RNN) [19] with its variants the long short-term memory (LSTM) [20] and gated recurrent unit (GRU) network [21], directly approximate high-dimensional nonlinear functions according to batteries life characteristics and have achieved more efficient prediction in complicated working condition. Moreover, the outstanding time series model Transformer [22] has been developed to process the characteristics among time sequence in battery degradation.
In fact, most of the data-driven methods for SOH estimation and prediction of LIBs characterize the discriminative model, which do not require prior knowledge of samples, but directly establish the mapping relationship between the input and output, that is, LIBs cycles (or other health indexes) and capacity. Then, the model will be established after adjusting the weights of the network with training through loss function, which cannot reflect the characteristics of the training data itself and further on the LIBs whole working scenario, endowed better fitting only with the quality and scale of the training data.
The generative model has gained considerable attention for learning joint probability distributions P(X,Y) over complex data, especially with the emergence of ChatGPT [23]. Unlike the discriminative model, its advantage is to model the observed sample data with probability density functions, add prior probabilities P(X), then obtain the posterior probability P(Y|X) by Bayesian formula, which is P(Y|X) = P(X,Y)/P(X) [24]. This modelling idea can identify distribution characteristics of training data accurately and better describe the whole picture of the problem though samples.
The extraction of battery life characteristics can be affected by several time series points involving high noise, which are generated as the asynchronism of message transmission, interference of signal sensor and cumulative error of battery management system (BMS) calculation. By generative model, it can avoid causing a serious deviation for the whole distribution of training data, to achieve robust modeling instead of isolated feature representations [25]. More importantly, as the development of BMS chips and cloud data storage have been breaking new ground in terms of sampling speed and data fidelity, battery operation process can be stored in a detailed large-scale datasets, and SOH prediction is more appropriate to generative model, which means that the prior probabilities P(X) can describe clearly the true distribution of the actual battery degradation process, so as to have a faster learned network learning convergence to the real model with increased sample size [26].
Deep generative model is a class of generative models that train deep neural networks to model the distribution of training samples, and it has noteworthy application in time series field, including time series anomaly detection [27], time series imputation [28], and time series forecasting [29]. Recently, there are several studies in which the deep generative model is used to estimate and predict the battery state, and the published studies based on the deep generative model show that both generative adversarial network (GAN) and variational autoencoders (VAE) with satisfactory battery state data generation results. Kim et al. [30] proposed a fully unsupervised methodology for LIBs capacity estimation, in which latent variables are extracted from electrochemical impedance spectroscopy (EIS) data by using information maximizing GAN. He et al. [31] pointed out a new algorithm named Dynamic-VAE to retrieve partial dimensions of the raw battery-charging data, detecting abnormal data points in the sequential information, so as to identify battery failure accurately. Ardeshiri et al. [32] developed a novel prognostic architecture based on a least-squares GAN with GRU for LIBs cycle life prediction as the generator and multi-layer perceptron as the discriminator, to obtain high prediction accuracy from time-domain features.
In recent years, following the emergence of GAN and VAE, diffusion model as an efficient new family of deep generative model has emerged in many fields with record-breaking performance, including image synthesis and video generation [33]. The diffusion model aims to transform the prior data distribution into random noise before revising the transformations step by step to rebuild a brand-new sample with the same distribution as the prior probabilities [34]. However, as far as it is known, this study is the first attempt to develop SOH prediction approach based on diffusion model with transfer learning, to accomplish an obvious enhancement in SOH prediction of different LIBs. The main contributions of this study are summarized as follows:
  • The fast-charging mode, consisting of multiple stages matching the maximum charging rate under limited conditions, is widely popularized in real-life EV application. The statistical features are extracted from the voltage profile of each stage as the model latent variables. The results prove that the selected features can distinctly characterize the battery degradation trend in the multi-stage charging process.
  • Based on diffusion model, the prediction model is established with time series information tackled via BiLSTM, a versatile multivariate probabilistic time series forecasting method that leverages estimating its gradient to learn and sample from the data distribution at each time step, autoregressively. The transfer learning method is applied on different batteries, enabling the generalizability of proposed approach.
  • The proposed method is verified on two LIBs datasets with different electrochemical properties and charging conditions, and the verification results reveal the higher accuracy compared with other methods, accomplishing an obvious performance improvement in generalizability and robustness.
The remainder of this paper is organized as: Section 2 introduces the methodology of diffusion model applied to SOH prediction and transfer learning. In Section 3, the feature extraction is proposed and the relationship to battery capacity is presented. Section 4 evaluated the experimental results of the proposed method for source and target datasets, and its valid comparison with other methods. Finally, major conclusions drawn from this study and outlines for future research scope are given in Section 5.

2. Methodology

2.1. Diffusion Model Applied to SOH Prediction

Diffusion model, short for the diffusion probabilistic model, emerges as the new advanced class of deep generative models that gradually convert data into noise, then generate new samples by learning the noise removed process, through the forward process and reverse process, respectively [35]. Figure 1 presents the intuition of diffusion model.
The denoising diffusion probabilistic model (DDPM) [34] applied in this study implements the operation via two Markov chains: the forward chain is designed with the goal to progressively add Gaussian noise to the data until it is transformed into a simple prior Gaussian distribution. The reverse chain aims at eliminating noise from data via a deep neural network, which can parameterize the transition by learning the reverse process [36].
In the forward process, the calculation of approximate posterior q(x1:N|x0) is fixed instead of trainable, as Equations (1) and (2),
q x 1 : N x 0 = n = 1 N q x n x n 1
q x n x n 1 ~ N x n ; 1 β n x n 1 , β n I
where βt ∈ (0,1) represents the gradually added Gaussian noise to the signal according to a sequence of variance scales. N denotes the total number of samples, and I represents the unit matrix. The joint distribution pθ(xn−1|xn) signified the reverse process, defined as a Markov chain with trainable instead of fixed Gaussian transitions starting with p(xn) as Equations (3) and (4).
p θ x 0 : N = p x N n = N N p θ x n 1 x n
p θ x n 1 x n ~ N x n 1 , μ θ x n , n , Σ θ x n , n I
where the mean μθ, and variance Σθ are parameterized by deep neural networks with shared parameters θ.
The goal of reverse Markov chain, that is the calculation of pθ(xn−1|xn), is to eliminate the Gaussian noise added in the forward process. In the reverse process, x0 can be sampled by a noise vector p(xn), and iteratively sample from the learnable transition pθ(xn−1|xn) until n = 1. To sample accurately, the reverse Markov chain is trained to match the forward Markov chain; thus, parameter θ needed to be adjusted in order that the posteriori distribution pθ(xn−1|xn) of the reverse Markov chain closely approximates posterior distribution q(xn−1|xn,x0) of the forward process given x0.
Kullback–Leibler (KL) Divergence is the index used to measure the similarity of probability distribution, which can denote the resemblance between the approximate estimated probability distribution and the true probability distribution of the data as a whole. The smaller the divergence value means the two probability distributions are closer to each other, and it can be applied as an objective function to find the optimal value for any approximate distribution. The match of two Markov chains can be achieved by minimizing the Kullback–Leibler (KL) divergence between pθ(xn−1|xn) and q(xn−1|xn,x0) [34]. Furthermore, the KL-divergence between these two is transferred by minimizing the negative log-likelihood using Jensen’s inequality as Equation (5),
D K L q x n 1 x n , x 0 p θ x n 1 x n = E q 1 2 Σ θ μ ˜ n x n , x 0 μ θ ( x n , n ) 2 + C
where C is a constant and irrelevant to θ, and μ ˜ n is mean of q(xn−1|xn,x0). The objective can be simplified in Equation (6) by introducing a new noise network εθ, instead of KL divergence as training objective directly.
E x 0 ~ q x 0 , ε ~ N 0 , I λ n ε ε θ α ¯ n x 0 + 1 α ¯ n ε , n 2
where λ(n) is a positive weighting function, and εθ is a deep neural network with parameter θ that predicts the noise vector ε given x0.
In this study, a multivariable time series prediction method is pointed out. It combines diffusion model and autoregressive model, in which the multivariable means the multi-dimensional feature representing battery degradation trend. The conditional probability model of future time steps for a multivariable time series can be learned through the given value and covariate of the previous moment in the series, and further achieve the LIBs lifespan sequence prediction, and the conditional probability model is as Equation (7):
q χ x t 0 : T 0 x 1 : t 0 1 0 , c 1 : T = Π t = t 0 T q χ x t 0 x 1 : t 1 0 , c 1 : T
where covariate ci:T denotes characteristic of LIBs lifespan sequence, assumed to be known for all the time points, and x i : t 0 R D is the multivariable time series data, which can be learned by the conditional diffusion model introduced above, where i ∈ {1,…,D}, and t means time step. The task is to predict the conditional probability distribution, calculated by diffusion model, of the whole time series based on the data sampled from the training interval, so as to accomplish the prediction of the future data in an autoregressive way.
BiLSTM [37] is a variant model composed of two LSTMs with different data transmission directions. With this structure of network, the important features and correlation of time sequence information before and after the current time point can be obtained in depth. BiLSTM is used as an appropriate autoregressive model to construct a time-dependent network as Equation (8), and it utilizes bidirectional time series information from the past and future derived from current output, mining the data connection of the whole time series deeply, improving utilization of the characteristics of long-term dependence in time series.
h t = B i L S T M θ x t 0 , c t , h t 1
where θ is the shared network weight with the conditional diffusion model, and h0 = 0. Therefore, the expression of conditional probability model can be further simplified in the form of a conditional diffusion model as Equation (9),
q χ x t 0 : T 0 x 1 : t 0 1 0 , c 1 : T = Π t = t 0 T p θ x t 0 h t 1
As depicted in Figure 2, both of xt−1 and ct−1 are used to generate ht−1 after injected into BiLSTM as input, and xt can be obtained by the conditional diffusion model with updated ht−1 as condition. Therefore, a conditional probability model is obtained, which can predict the xt with encoded ht, given xt−1 and ct−1.
Combined with the previous introduction to DDPM, the fixed forward process of this model is still from x0 to xN, but the hidden status ht−1 of each time step is added when building the noise network during the learned reverse process. The training process is performed in the pattern by randomly sampling training data for the acceptable robustness of the model, and the negative log-likelihood of the model with parameter θ is chosen as the optimized loss function as Equation (10), with the initially hidden state ht−1 obtained by BiLSTM in prediction interval.
t = t 0 T log p θ x t 0 h t 1
Hence, a more optimized and detailed objective than Equation (6) can be obtained as Equation (11):
E x 0 ~ q x 0 , ε ~ N 0 , I ε ε θ α ¯ n x t 0 + 1 α ¯ n ε , h t 1 , n 2
where εθ is a neural network conditioned on the hidden state ht.

2.2. Transfer Learning

Most machine learning methods normally are applied under assumed preconditions that training data (source data) and validation data (target data) conform to independent and identical distribution. In practice, however, the distributions of source data and target data are usually diverse, and the inadequate label data can hinder model performance in task data.
Transfer learning, applied to solve this problem in this study, can obtain the knowledge from other tasks and transfer them to new tasks, which can expedite the utilization of models among different datasets [38]. It is not necessary that source data and target data are independent and identical distribution with transfer learning, so the learned model (source task) features and parameters can be transferred to a new analogous model (target task), to relieve the dependence on label data and to accelerate model convergence. The target task need not be trained completely due to the knowledge transferred from source task, which can improve the modeling efficiency and expand the scope of practical application.
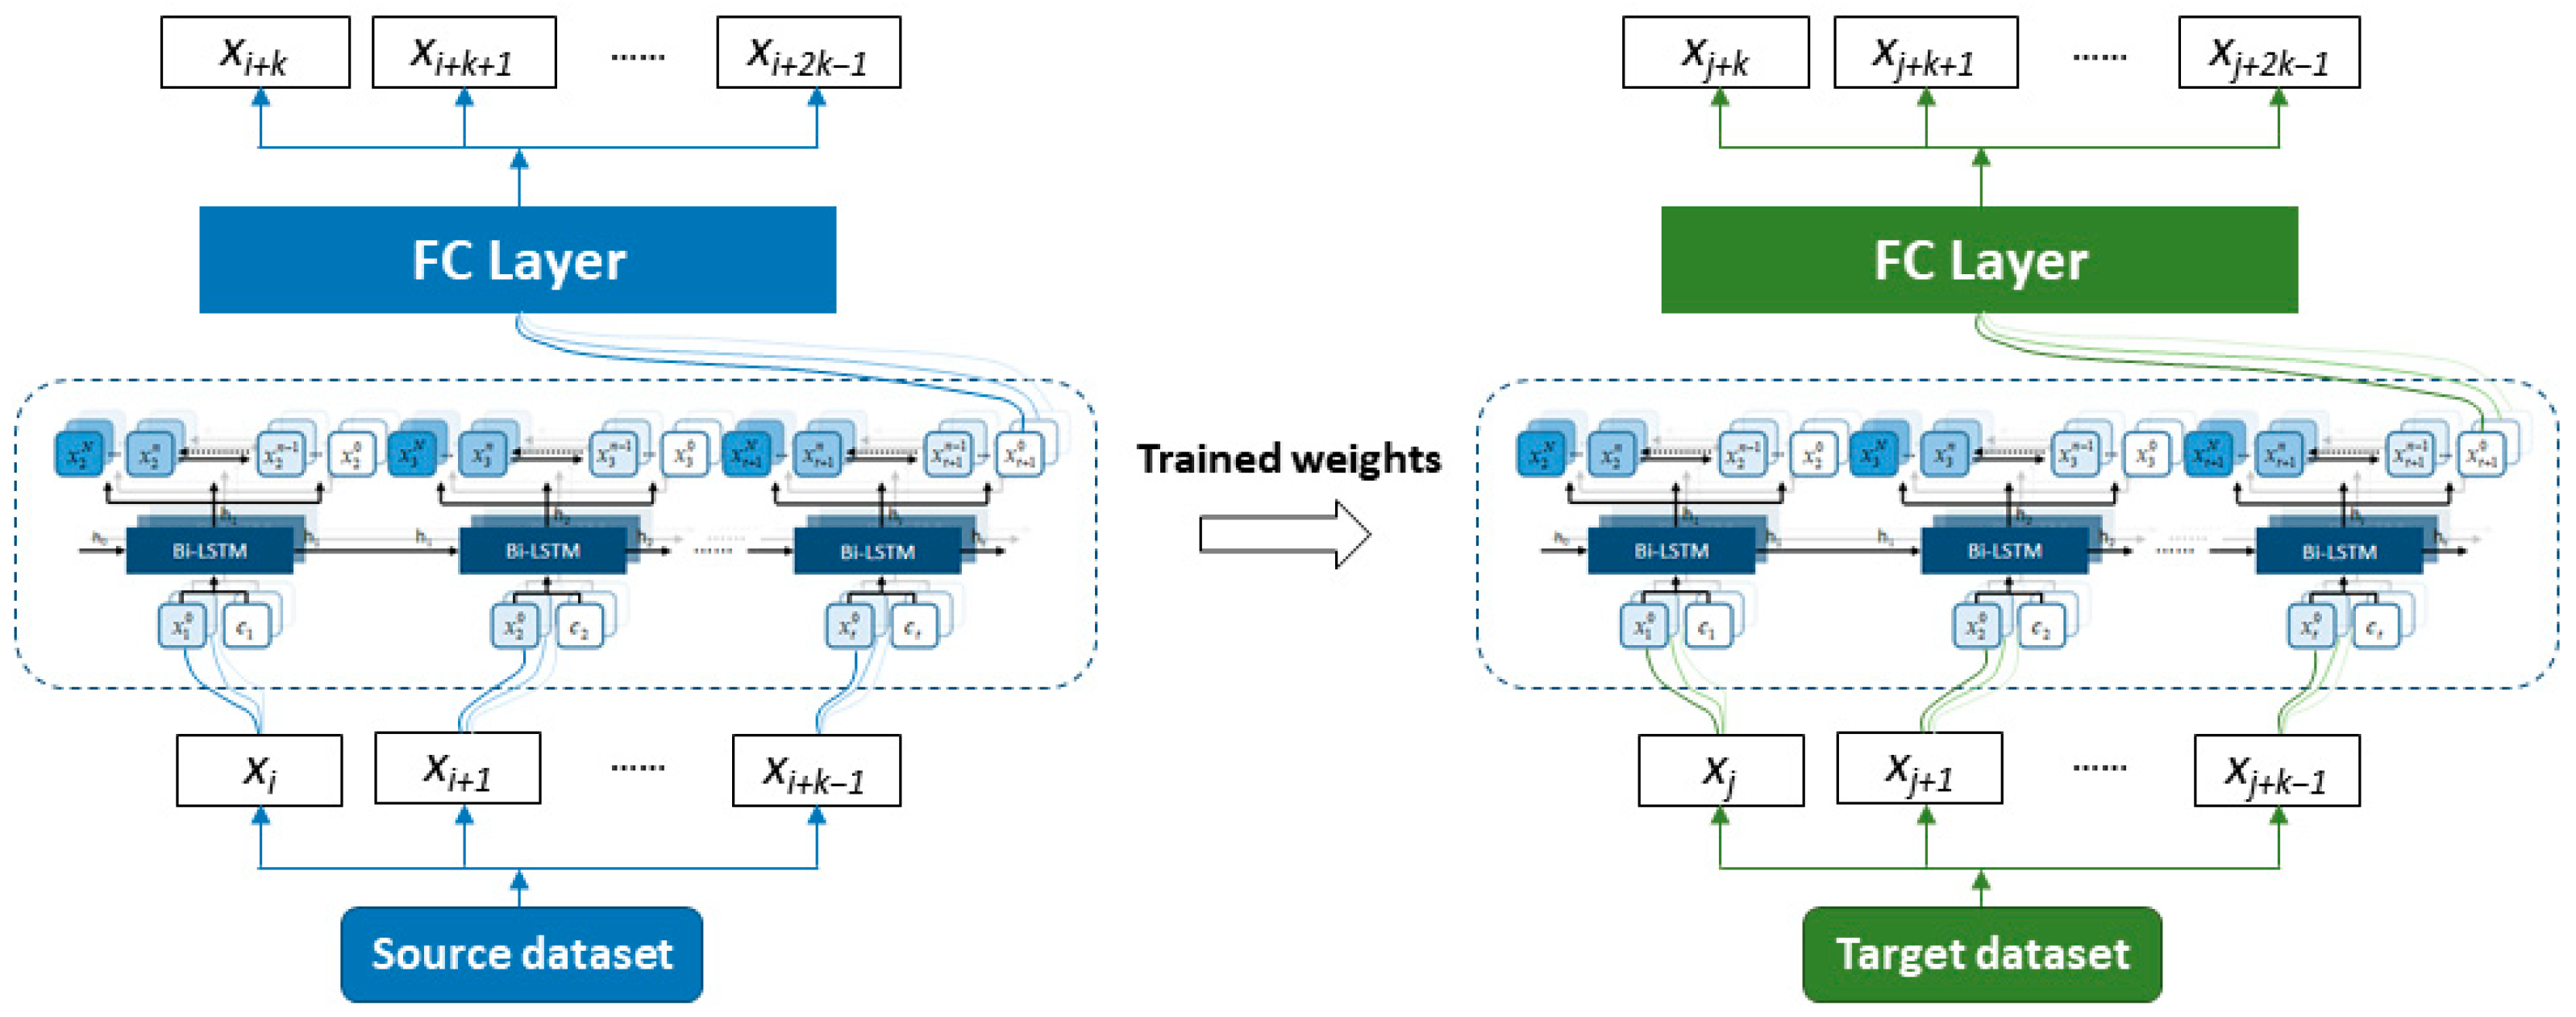
For SOH prediction of different types of LIBs in diverse working conditions and compensating multiple data losses of prediction models and improving model generalization ability, a flexible estimation scheme integrating diffusion model and transfer learning was proposed. It comprises two steps: the first is that target networks pre-training through source dataset to obtain base model, and the second is that transfer learning with fine-tuning strategy to adjust the parameters of middle layer in target networks with other layers unchanged. As shown in Figure 3, in the source task, the diffusion model is finally established through training data and verification of test data. The model parameters and the weights, which represent the internal degradation mode of the battery in the source task, will be locked, retained, and transferred to the target task for an easier SOH prediction. Then, the full connect (FC) layer make a critical difference in fine-tuning SOH prediction for specific batteries or conditions, the weights of which are re-trained based on target battery. Finally, the model network of target task is established efficiently, through the knowledge transferred from source task with small data volumes.

3. Experiment Validation

3.1. Experimental Dataset

Generally, the battery capacity is obtained by a standard full discharge-charge process. For the EV driving scenario in real-life, however, the batteries are discharged under erratic conditions instead of controllable as in the laboratory, which depends on the user behavior with uncertainties in environmental and unpredictable load demand during driving. Conversely, the battery charge is often accomplished in the time of the EVs parking with a stable and detectable grid connection. Therefore, due to the regular charging strategy, a charge process rather than a discharge process is preferred for on-board battery health monitoring.
Fast charging in direct current (DC) mode, widely used in the charging of electric vehicles, have attracted extensive interests because of its efficiency in energy replenishing and quick relief for range anxiety. In order to ensure charging safety and battery life, the BMS can calculate the charging current rate in different stage under the maximum charging power limit, based on the real-time temperature and state-of-charge (SOC) of the batteries, and then transmit the results to charging grid to control the output current. Therefore, in fast charging mode, the current rate and constant current (CC) charging time are quite different due to the discrepancy of temperature and SOC among batteries, which can affect the consistency of data characteristics and demand higher requirements for generalization ability of prediction model.
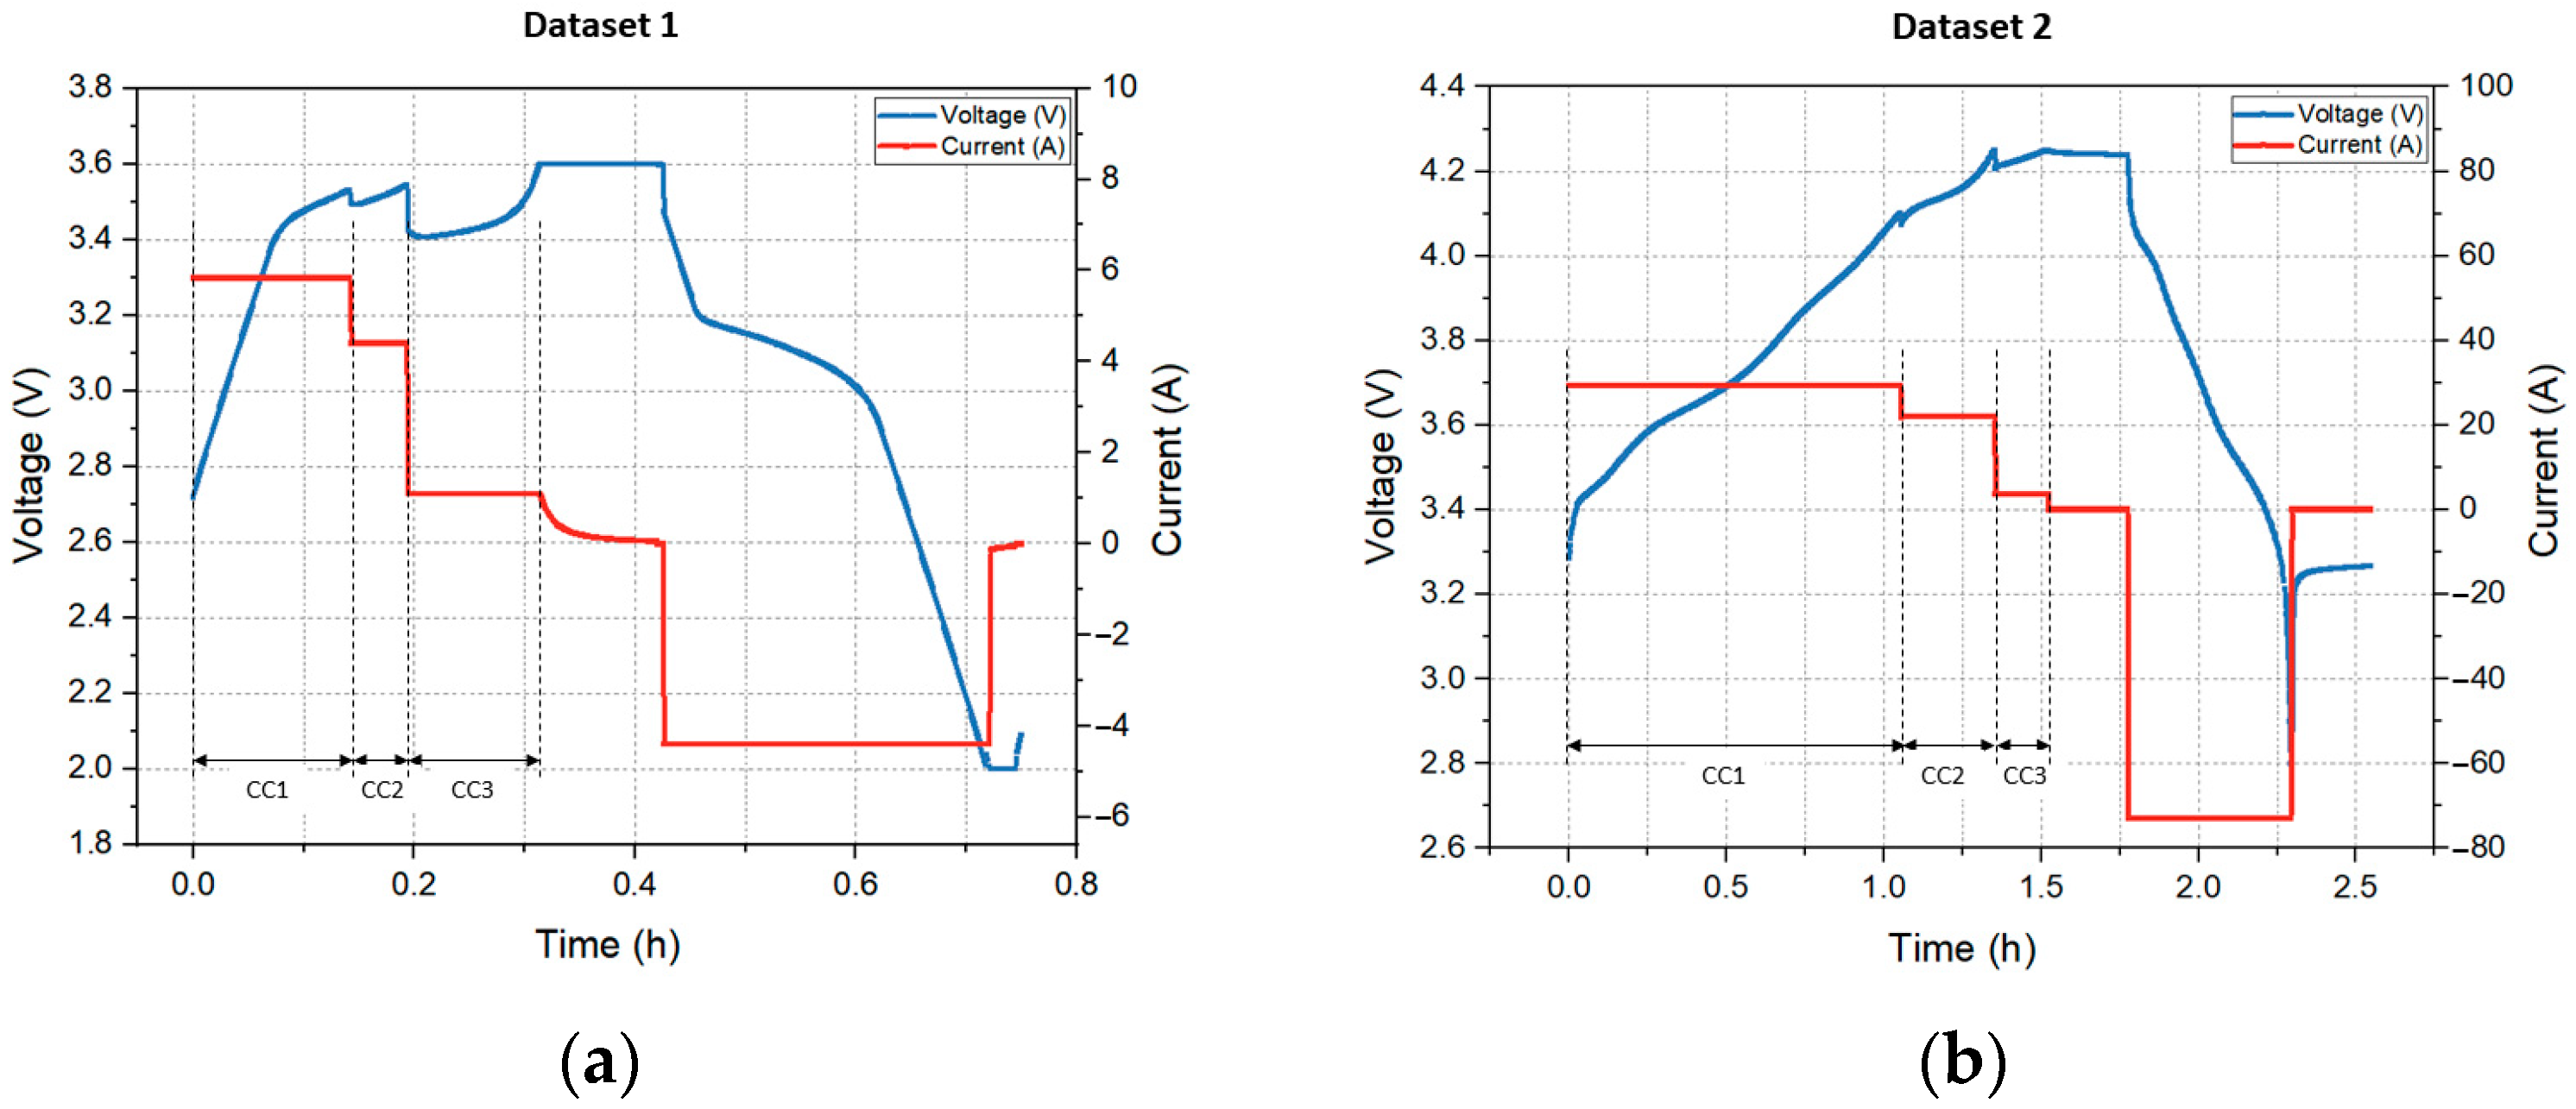
In this study, for simulating the diversity of multi-stage CC charging conditions, the two different types of LIBs datasets with different electrochemical properties and charging conditions are considered. The first is the lithium iron phosphate (LFP) battery dataset from TOYOTA Research Institute [39], named Dataset 1 as source dataset; and the second is the nickel cobalt manganese (NCM) battery dataset from laboratory, named Dataset 2 as target dataset. All batteries underwent a multi-stage charge with three current rate profile and a constant current discharging profile. The specifications of these two datasets are tabulated in Table 1, and the experimental steps of a cycle are shown in Figure 4, and the battery capacity degradation curves are described in Figure 5.
Figure 6 illustrates the voltage variation trends of B1-01, as an example, in the three charging CC stages with increasing cycle number. The voltage curves move leftward, and shape turns to be gentle, which shows that the charging capacity is decreasing, and internal resistance is increasing. Hence, the degradation characteristic can be identified from a slight shift in curve shape of CC stage.

3.2. Feature Extraction

Summarized statistics have been applied to effectively quantify the shape and position characteristics of 2D curve, such as the voltage curve [39] and the voltage relaxation curve [40]. As mentioned above, it is suitable for feature extraction in CC charging stages, due to its high correlation with battery degradation and easy access in real-life driving cycles. The voltage curves of three CC stages are converted to 18 statistical features in three group in total, that is, variance (Var), skewness (Ske), maximum (Max), minimum (Min), mean (Mean), and excess kurtosis (Kur) in every group, and the mathematical description of the six features refers to the calculations in [40].
The Var represents the distribution of the voltage value in one CC stage and decrease in it indicates that the voltages show a concentrated distribution as battery degradation, and vice versa. The Ske means the relationship between sampled voltage data and average voltage, where voltage rises more rapidly with more Ske, consistent with the shape of the voltage curve. Likewise, the lower Kur denotes the gentler distribution of the voltage comparing with a normal distribution. Both Ske and Kur can characterize the shape of the voltage curve. The relationship between battery capacity and the corresponding features extracted from CC1 stage of Dataset 1 is presented in Figure 7, and it is difficult to describe the relationships even only by some certain functions, although the Max, Min and Mean just present an obvious monotonous correlation between capacity and voltage throughout the battery life, respectively. To avoid missing correlative features, which have different correlations in different batteries, all of these 18 features are adopted as model input without feature reduction.

3.3. Implementation Details

The leave-one-out evaluation [7] is used in this experiment settings, instead of the data used for training and validation is acquired from one battery, which is more practical in online prediction for entire life cycle of LIBs without the dependence on other cycle of the same battery. The proposed model can be evaluated in source task as: three batteries are used as training set and another battery is validation set. Four experiments in total are performed, through which the model network and evaluating indexes are determined for source task.
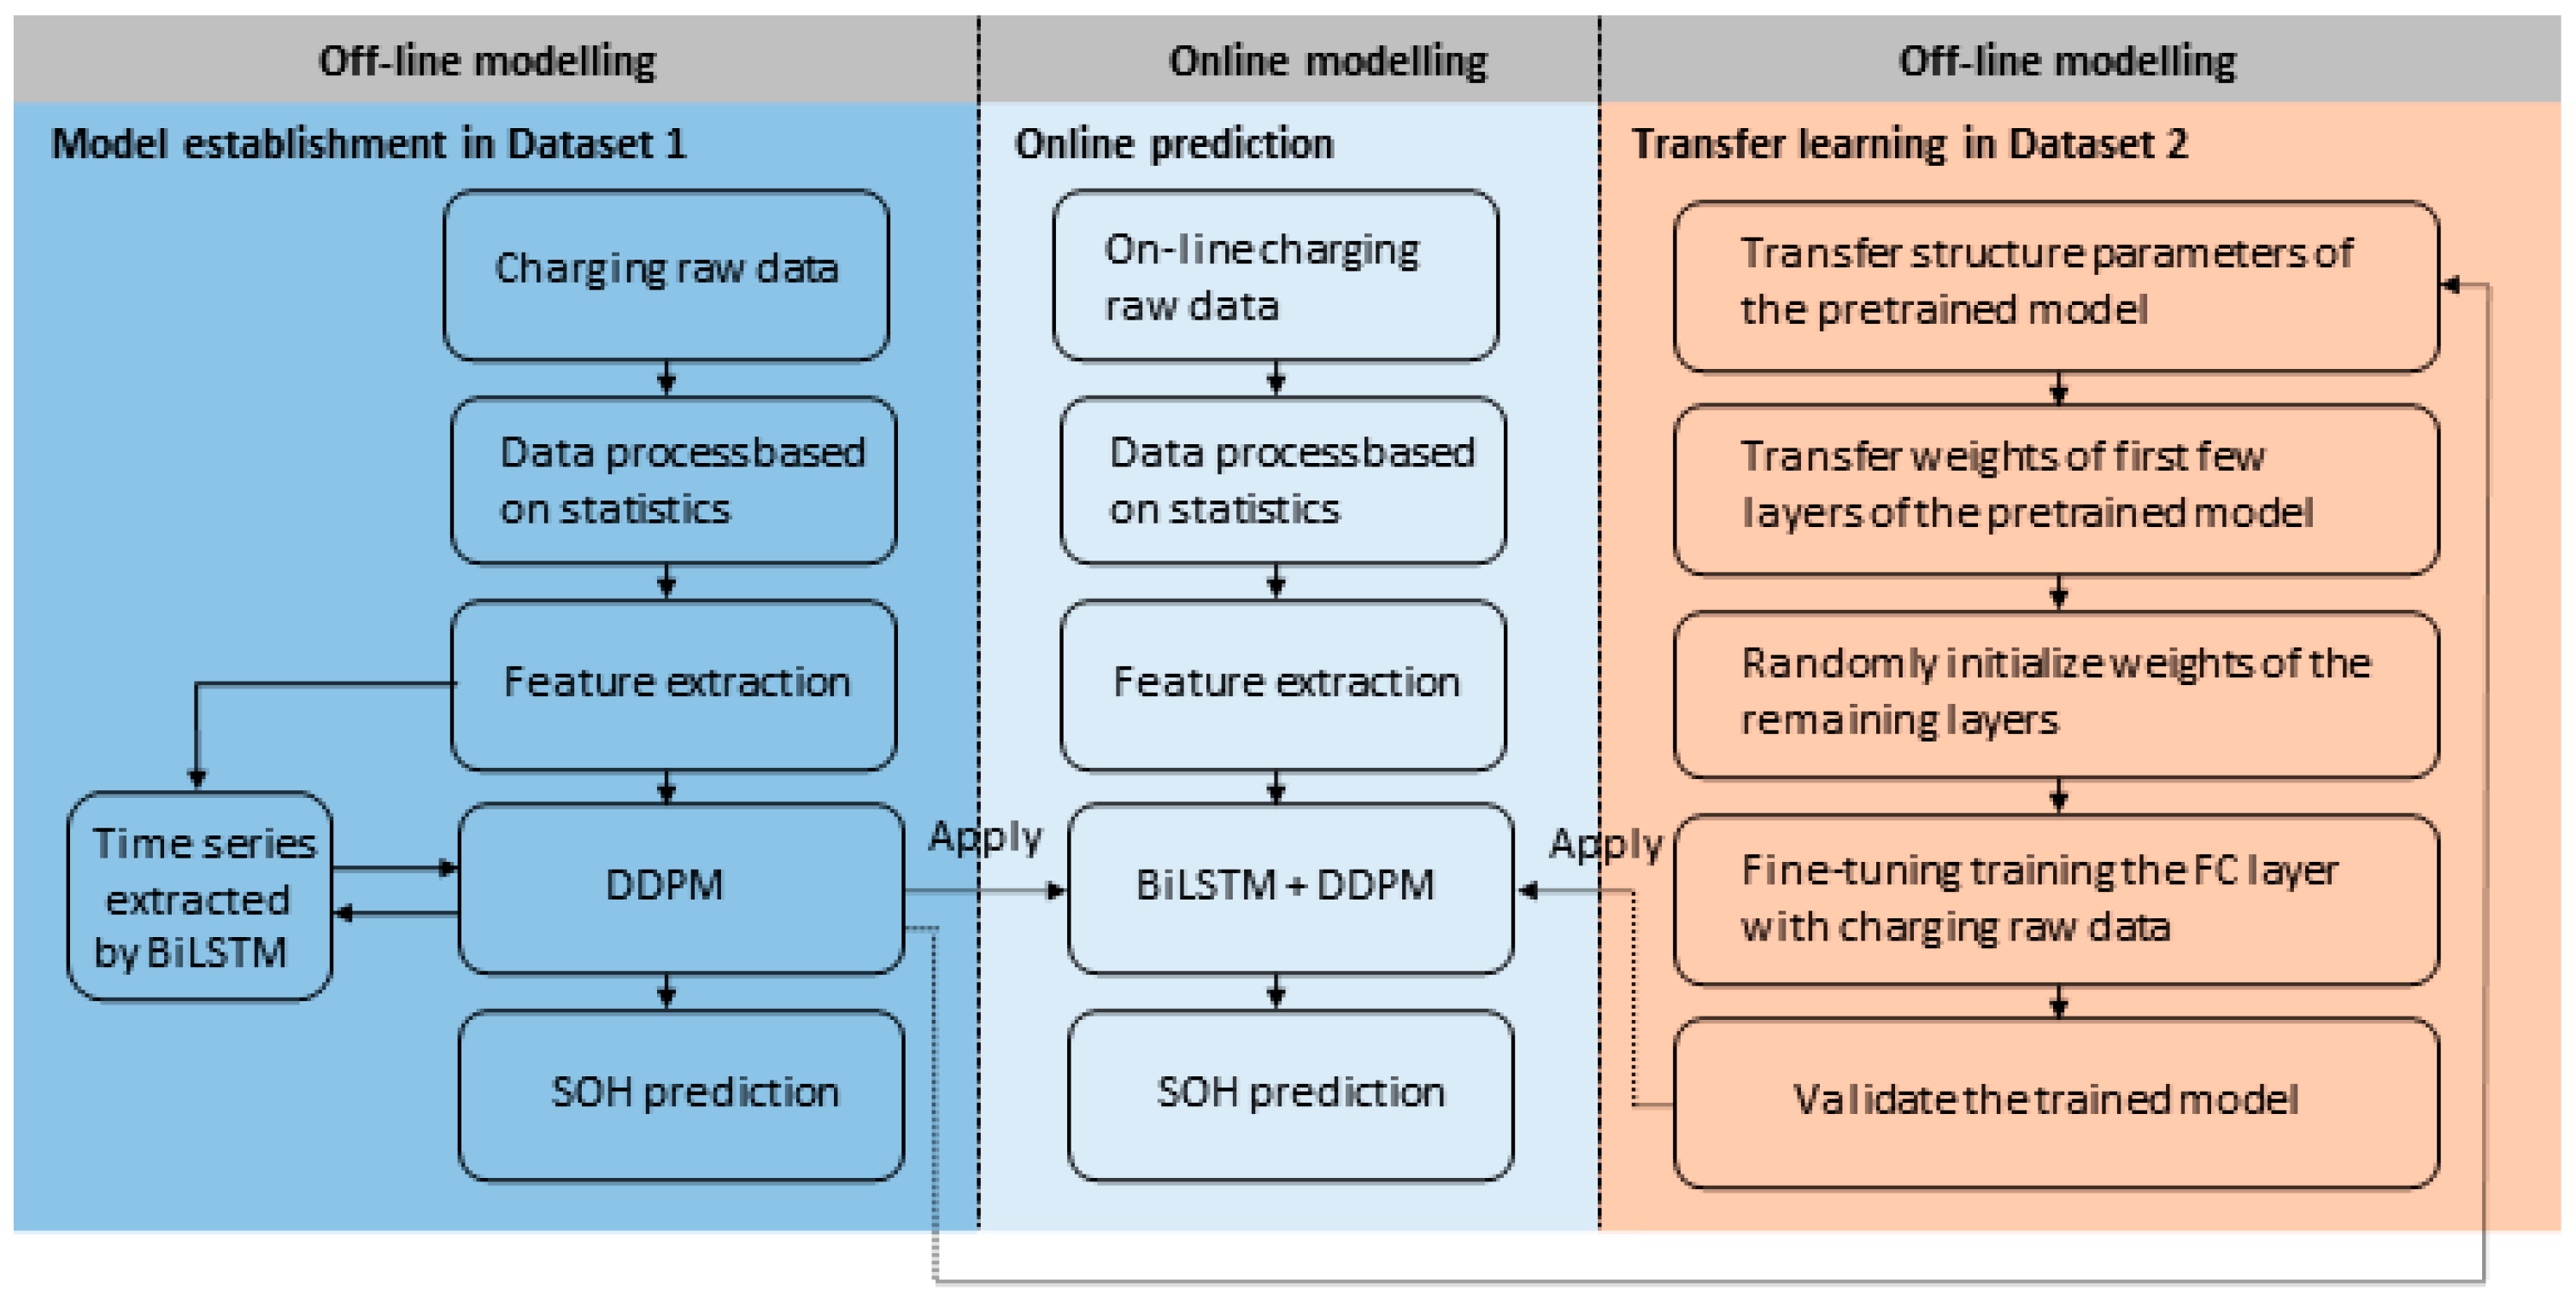
The framework of proposed approach is depicted in Figure 8, combined with off-line modelling and online modelling. In off-line process, the model is established by source dataset, Dataset 1, and validated through leave-one-out evaluation. To promote the generalization in target task, the trained network is transferred and fine-tuned by task dataset, Dataset 2. In the target task, the network layers are frozen so that weights cannot be modified further, and only the FC layer is trained by the data from Dataset 2. It is noteworthy that transfer learning can be applied based on the cycle data reaching 80% SOH at least, to achieve the rapid establishment of prediction model in target task. In online process, the extracted features, from raw data of different LIBs and charging conditions, are directly applied to predict the battery SOH based on the proposed model with transfer learning.

4. Results and Discussion

4.1. Evaluation Criteria

In this study, as the performance of the proposed method is evaluated, the root mean square error (RMSE), mean absolute error (MAE), and mean absolute percentage error (MAPE) indexes are calculated as follows:
RMSE = i = 1 n ( C r e a l n C p r d n ) 2 n
MAE = 1 n i = 1 n C r e a l n C p r d n
MAPE = 1 n i = 1 n C r e a l n C p r d n C r e a l n 100 %
where n is the number of cycles, Creal is the real capacity, and Cprd is the predicted capacity. The results of the evaluation may not be comparable due to the capacity range of different batteries varies greatly, and normalizing can remove the influence caused by different capacity range. The min-max normalization is adopted to map the feature S into uniform interval as follows:
x = a + x min S b a max S min S
where x is true value and x′ is mapped value of interval [a, b].

4.2. Performance on Source Dataset

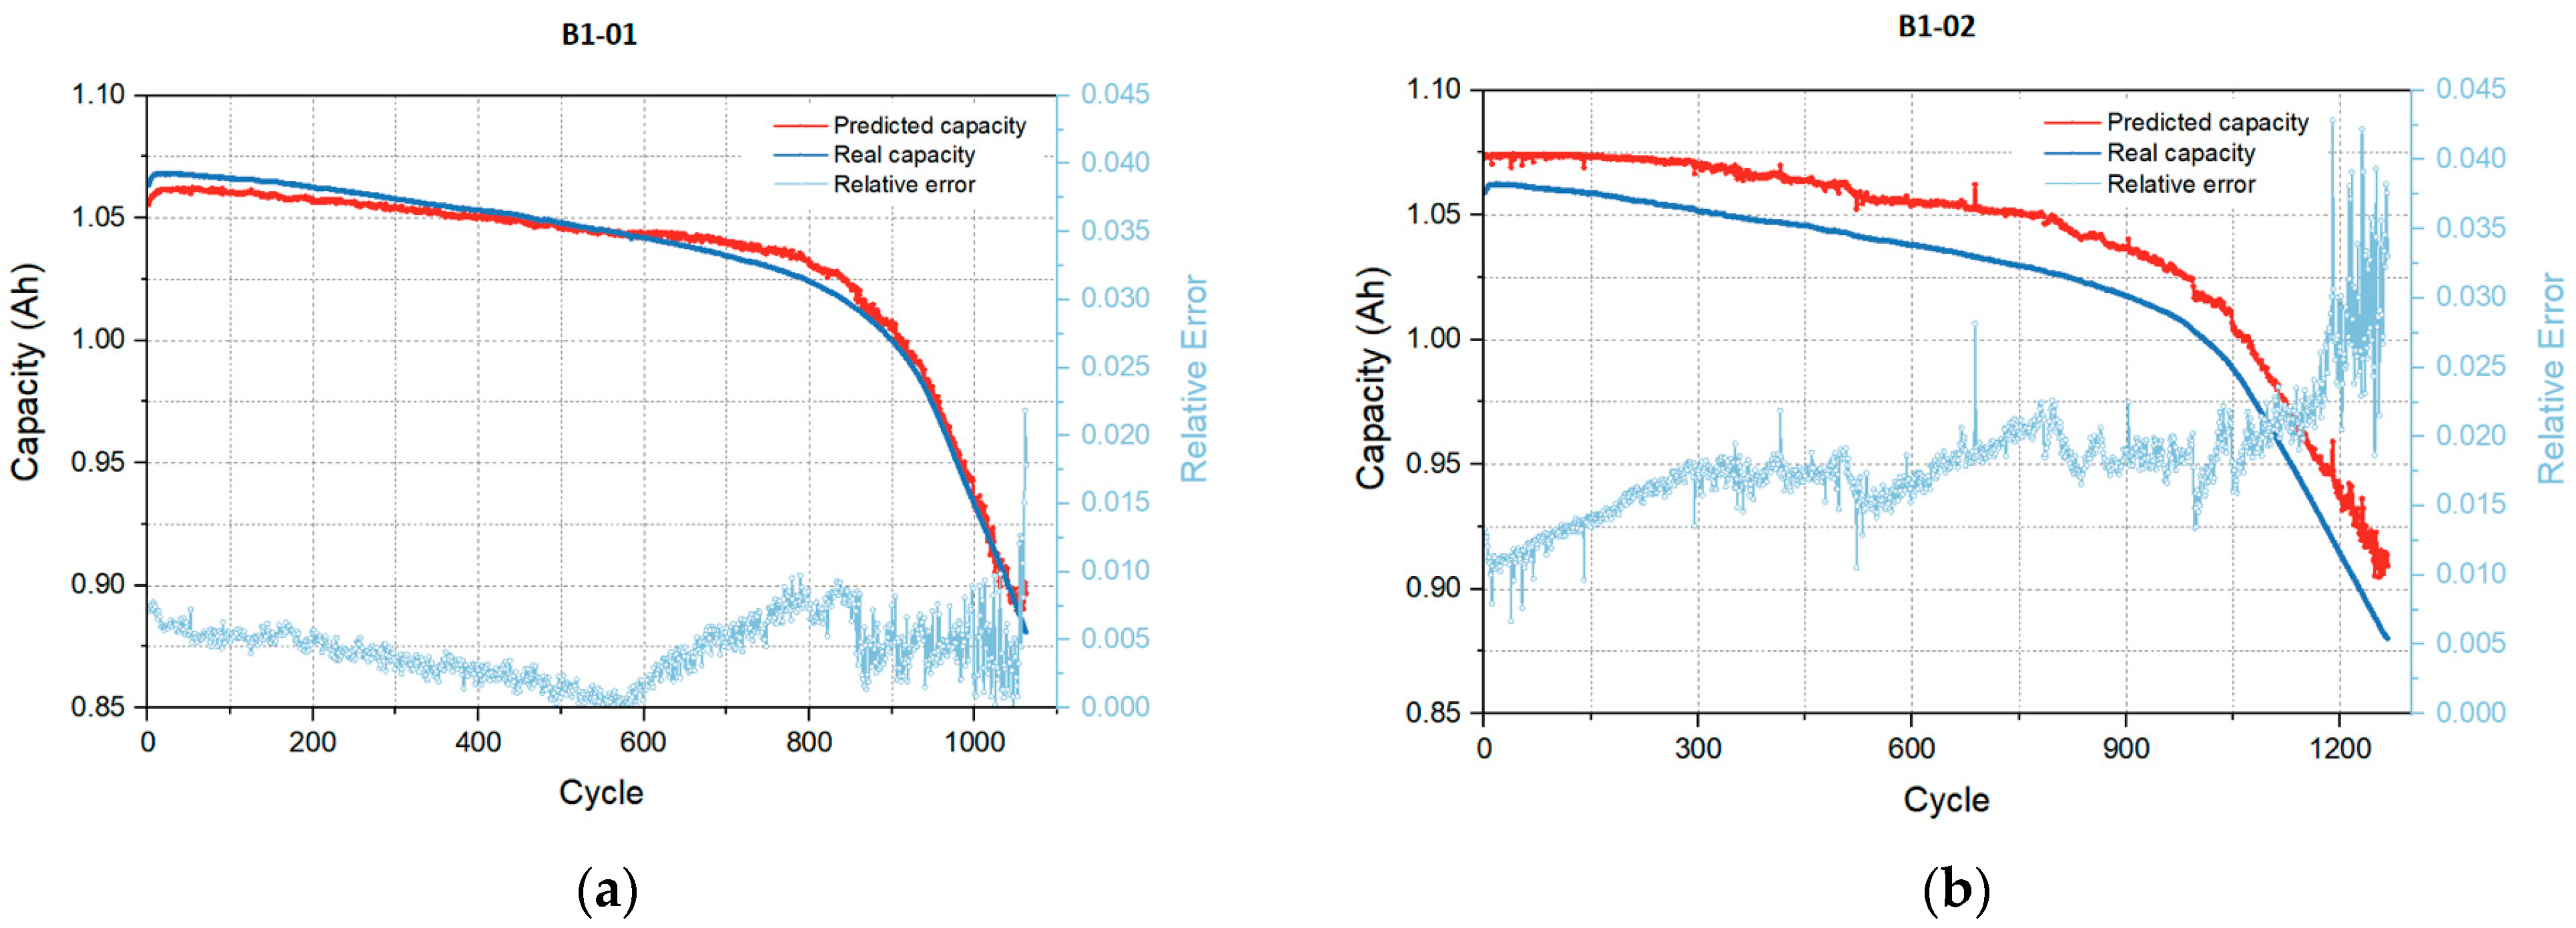
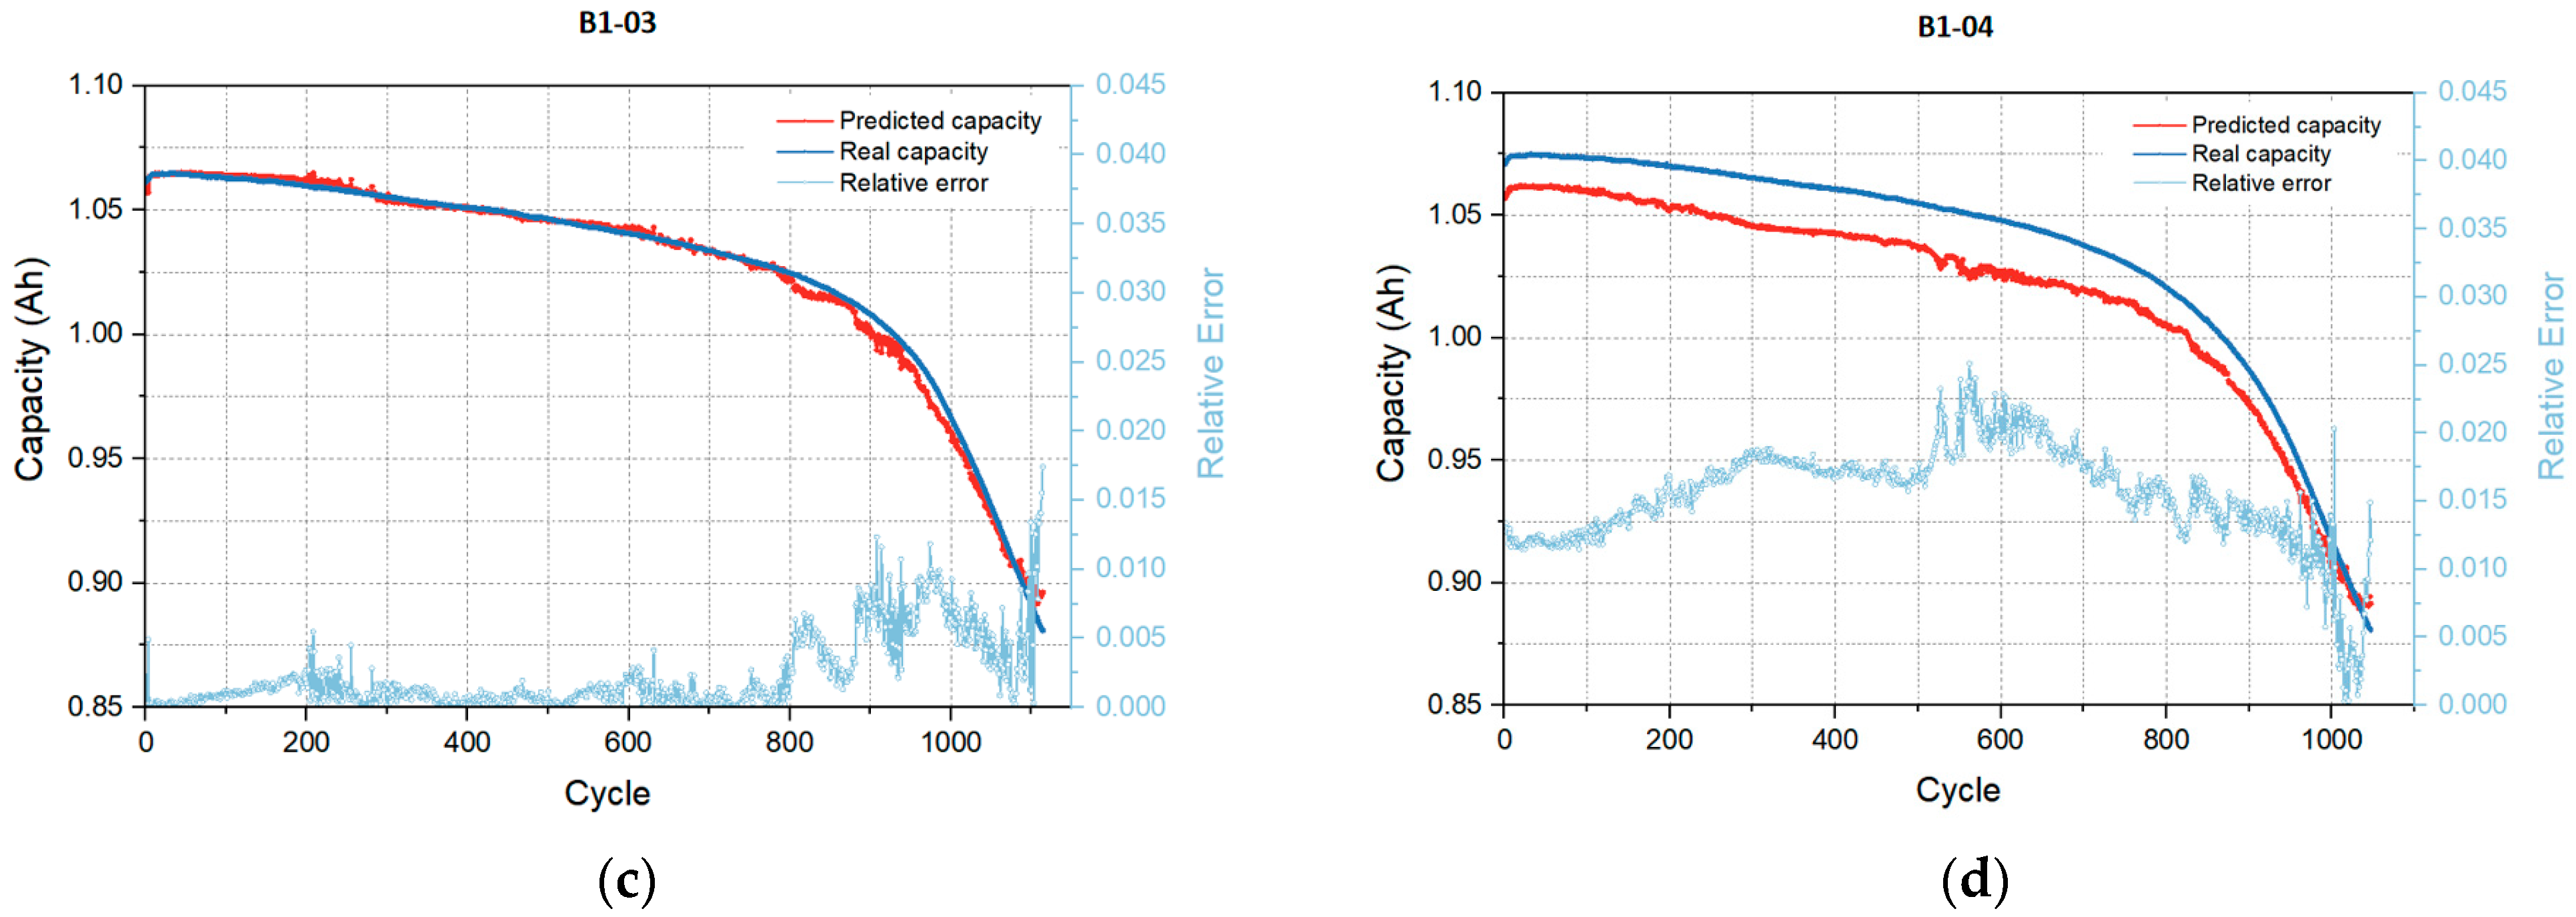
The 18 features are extracted from raw voltage curve of three CC stages, as model inputs. B1-02, B1-03, and B1-04 are used as training set, and the results of B1-01, as a validation set, can be predicted by proposed model. According to this grouping, the results of other three batteries can be validated, respectively. The capacity predictions and relative errors of B1-01, B1-02, B1-03, and B1-04 are depicted in Figure 9. The red solid line denotes predicted capacity, and blue solid line is real capacity. The relative errors determined by the two capacity values are showed less than 4.5% in validation set, which indicates the predictions in SOH trends with high accuracy and robustness for the same category of LIBs.
The RMSE, MAE, and MAPE value are listed in Table 2. Although the lowest prediction accuracy among the four batteries is B1-02, the RMSE, MAE, and MAPE of it are 0.0187, 0.0183, and 1.81%, respectively, the trained model can operate reliably without initial cycles provided and with more practical significance.
To verify the feasibility of the proposed approach, the prediction errors of approaches reported in previous studies were also listed in Table 3, and the same training and validation for Dataset 1 are conducted with RNN, LSTM, GRU, Transformer [22], and CNN-Transformer [41]. It is obvious that the proposed approach achieves a better performance than other methods.

4.3. Performance on Target Dataset

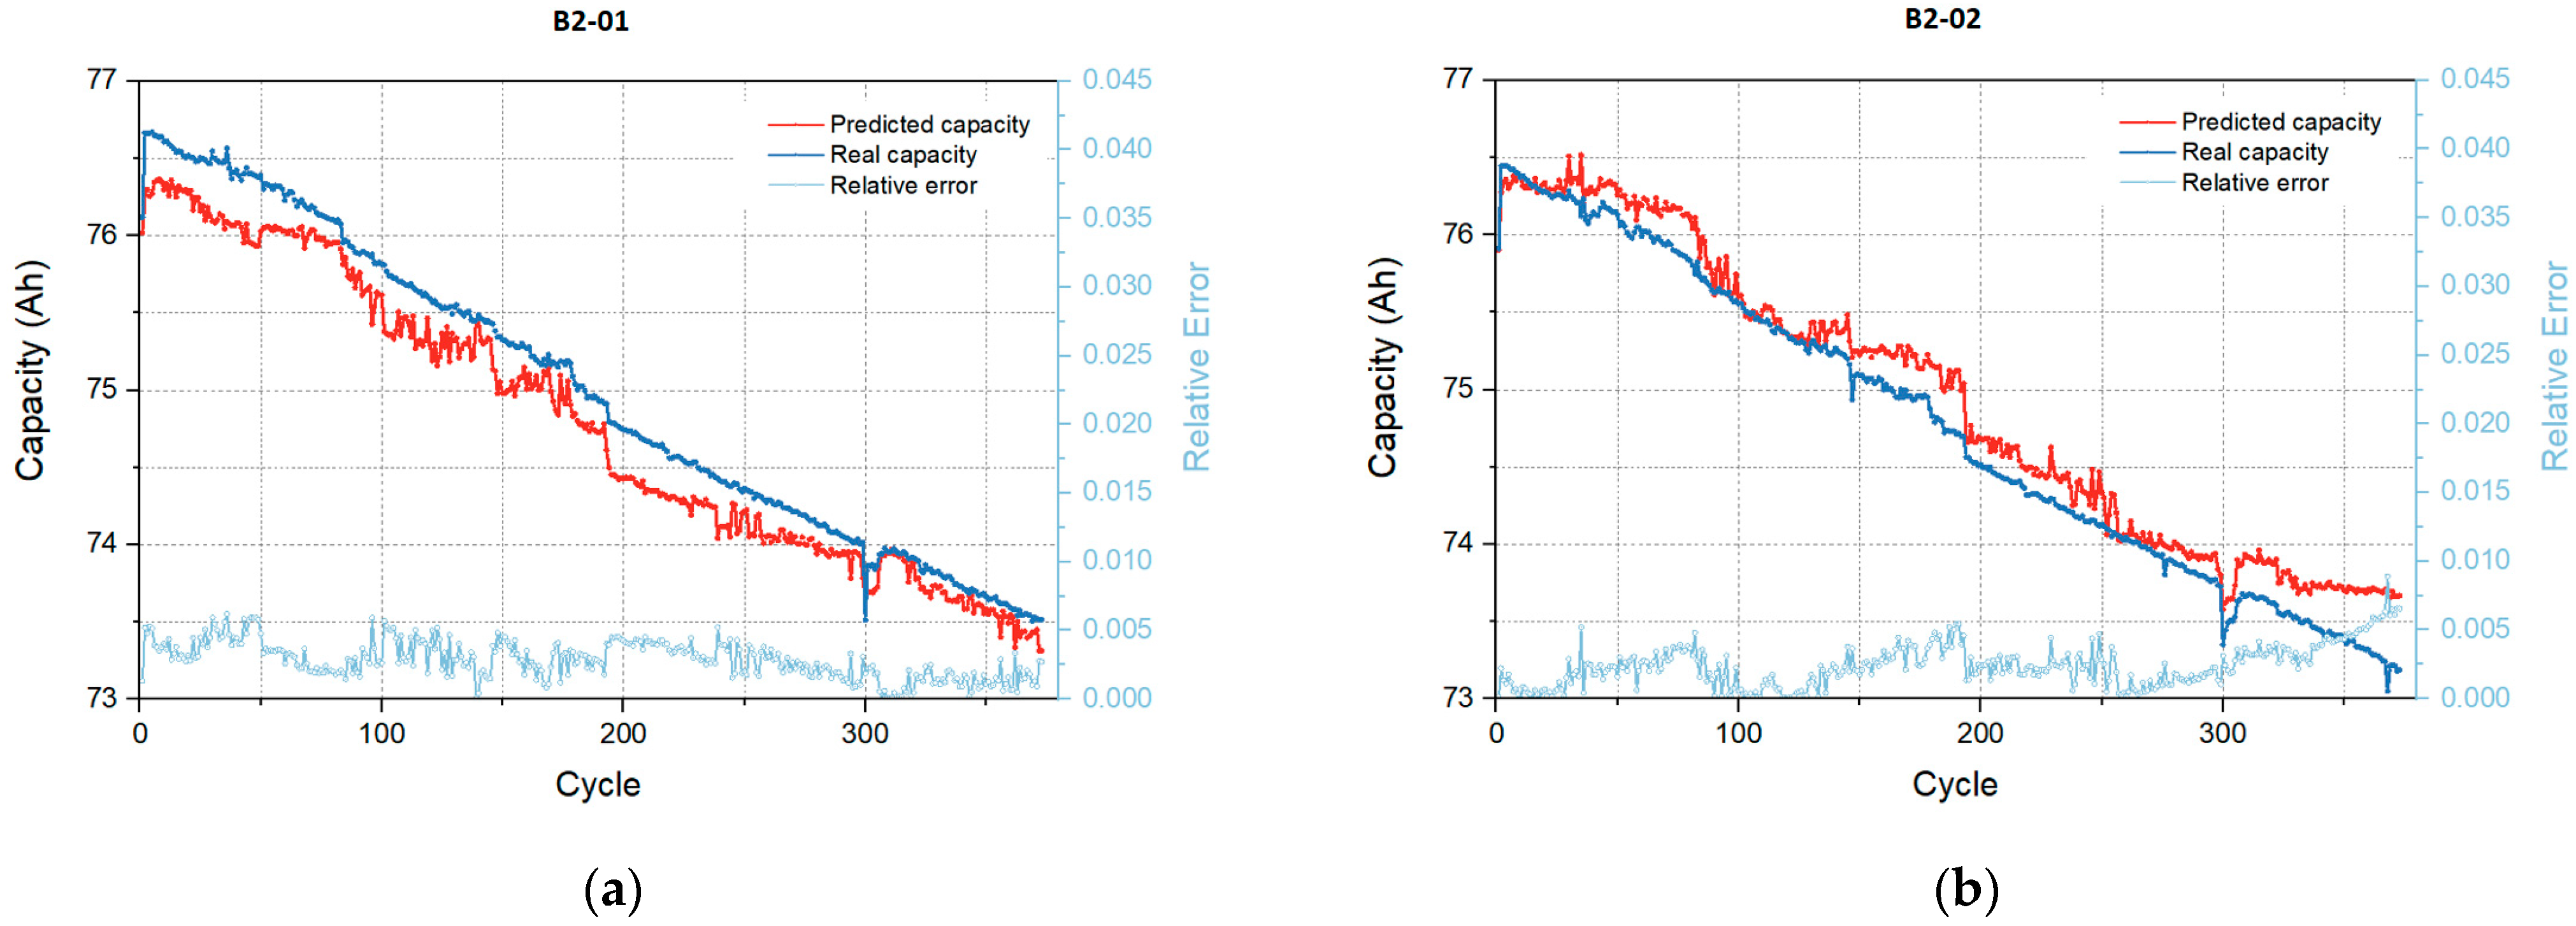
The performance was validated for different battery types in different charging conditions by applying transfer learning to the proposed model trained by the source dataset and re-training using a single battery from the target dataset. Figure 10 depicts the capacity predictions and relative errors of B2-01 and B2-02, illustrating that transfer learning also achieves the high performance of models in SOH prediction of different LIBs.
Furthermore, to confirm the effectiveness of transfer learning, the results obtained by using the proposed model with transfer learning were compared to the model without transfer learning; that is, the model trained by the source dataset is applied directly to the target dataset without transfer learning. These results which are normalized as the capacity range of Dataset 2 in Table 4 manifest that applying transfer learning promotes the proposed model generalization in different situations.

5. Conclusions

This study, as far as is known, is the first to propose the diffusion model applied in the SOH prediction of LIBs and enhanced the SOH prediction with transfer learning. First, for multiple stages of battery charging, the statistical features of voltage profile, extracted as latent variables, are employed to characterize the LIBs degradation. Meanwhile, it is proposed a prediction method based on diffusion model where time series information is accumulated and transmitted through BiLSTM. It can relieve the influence of data noise by learning the probability distribution of training data. Additionally, transfer learning can implement the rapid convergence of proposed model in new battery type and new condition. Then, the experiments on two LIBs cycle life datasets based on different electrochemical properties and charging conditions verify the accuracy and robustness. It is confirmed that the diffusion model with transfer learning could effectively reduce the dependency of label data in target task and build corresponding networks based on less data and faster training. For charging safety, fast charging will be divided into multiple stages under different charging current according to the current state or type of LIBs. The proposed approach is verified generalization ability and prediction accuracy in the multi-stage charging process for different type of LIBs under different condition, which is more practical in fast charging condition. As a next step, it deserves to proceed with further studies on other deep generative model applied SOH prediction of LIBs and to investigate the effective feature optimization techniques in multi-stage charging.

Author Contributions

Conceptualization, C.L. and Z.Z.; methodology, C.L. and S.Z.; software, C.L. and Y.L.; validation, C.L. and Y.L.; formal analysis, C.L. and S.Z.; investigation, C.L.; resources, C.L.; data curation, C.L. and S.Z.; writing—original draft preparation, C.L.; writing—review and editing, C.L.; visualization, C.L.; supervision, Z.Z. and S.Z.; project administration, C.L. and S.Z.; funding acquisition, Z.Z. and C.L. All authors have read and agreed to the published version of the manuscript.

Funding

This research was funded by the National Natural Science Foundation of China, grant number 51977131.

Data Availability Statement

Not applicable.

Conflicts of Interest

The authors declare no conflict of interest.

References

  1. Lai, X.K.; Chen, Q.; Tang, X.; Zhou, Y.; Gao, F.; Guo, Y.; Bhagat, R.; Zheng, Y. Critical review of life cycle assessment of lithium-ion batteries for electric vehicles: A lifespan perspective. eTransportation 2022, 12, 100169. [Google Scholar] [CrossRef]
  2. Tian, H.; Qin, P.; Li, K.; Zhao, Z. A review of the state of health for lithium-ion batteries: Research status and suggestions. J. Clean. Prod. 2020, 261, 120813. [Google Scholar] [CrossRef]
  3. Lai, X.K.; Deng, C.; Li, J.; Zhu, Z.; Han, X.; Zheng, Y. Rapid Sorting and Regrouping of Retired Lithium-Ion Battery Modules for Echelon Utilization Based on Partial Charging Curves. IEEE Trans. Veh. Technol. 2021, 70, 1246–1254. [Google Scholar] [CrossRef]
  4. Deng, Z.; Lin, X.; Cai, J.; Hu, X. Battery health estimation with degradation pattern recognition and transfer learning. J. Power Sources 2022, 525, 231027. [Google Scholar] [CrossRef]
  5. Li, W.; Cao, D.; Jöst, D.; Ringbeck, F.; Kuipers, M.; Frie, F.; Sauer, D.U. Parameter sensitivity analysis of electrochemical model-based battery management systems for lithium-ion batteries. Appl. Energy 2020, 269, 115104. [Google Scholar] [CrossRef]
  6. Randall, A.V.; Perkins, R.D.; Zhang, X.; Plett, G.L. Controls oriented reduced order modeling of solid-electrolyte interphase layer growth. J. Power Sources 2012, 209, 282–288. [Google Scholar] [CrossRef]
  7. Deng, Z.; Hu, X.; Lin, X.; Xu, L.; Che, Y.; Hu, L. General Discharge Voltage Information Enabled Health Evaluation for Lithium-Ion Batteries. IEEE ASME Trans. Mechatron. 2021, 26, 1295–1306. [Google Scholar] [CrossRef]
  8. Zheng, Y.; Qin, C.; Lai, X.K.; Han, X.; Xie, Y. A novel capacity estimation method for lithium-ion batteries using fusion estimation of charging curve sections and discrete Arrhenius aging model. Appl. Energy 2019, 251, 113327. [Google Scholar] [CrossRef]
  9. Song, Z.; Wu, X.; Li, X.; Hou, J.; Hofmann, H.F.; Sun, J. The Sequential Algorithm for Combined State of Charge and State of Health Estimation of Lithium Ion Battery based on Active Current Injection. arXiv 2019, arXiv:1901.06000. [Google Scholar] [CrossRef]
  10. Sung, W.; Lee, J. Implementation of SOH Estimator in Automotive BMSs Using Recursive Least-Squares. Electronics 2019, 8, 1237. [Google Scholar] [CrossRef]
  11. Song, Y.; Liu, D.; Peng, Y. FPGA-based Implementation of Lithium-ion Battery SOH Estimator Using Particle Filter. In Proceedings of the 2020 IEEE International Instrumentation and Measurement Technology Conference (I2MTC), Dubrovnik, Croatia, 25 May–25 June 2020. [Google Scholar]
  12. Lin, H.; Liang, T.P.; Chen, S. Estimation of Battery State of Health Using Probabilistic Neural Network. IEEE Trans. Ind. Inform. 2013, 9, 679–685. [Google Scholar] [CrossRef]
  13. Deng, Z.; Yang, L.; Cai, Y.; Deng, H.; Sun, L.J. Online available capacity prediction and state of charge estimation based on advanced data-driven algorithms for lithium iron phosphate battery. Energy 2016, 112, 469–480. [Google Scholar] [CrossRef]
  14. Klass, V.L.; Behm, M.; Lindbergh, G. A support vector machine-based state-of-health estimation method for lithium-ion batteries under electric vehicle operation. J. Power Sources 2014, 270, 262–272. [Google Scholar] [CrossRef]
  15. Luo, C.; Zhang, Z.; Qiao, D.; Lai, X.K.; Li, Y.; Wang, S. Life Prediction under Charging Process of Lithium-Ion Batteries Based on AutoML. Energies 2022, 15, 4594. [Google Scholar] [CrossRef]
  16. Yang, D.; Zhang, X.; Pan, R.; Wang, Y.; Chen, Z. A novel Gaussian process regression model for state-of-health estimation of lithium-ion battery using charging curve. J. Power Sources 2018, 384, 387–395. [Google Scholar] [CrossRef]
  17. Li, X.; Wang, Z.; Yan, J. Prognostic health condition for lithium battery using the partial incremental capacity and Gaussian process regression. J. Power Sources 2019, 421, 56–67. [Google Scholar] [CrossRef]
  18. Sohn, S.; Byun, H.; Lee, J.H. CNN-based Online Diagnosis of Knee-point in Li-ion Battery Capacity Fade Curve. IFAC-PapersOnLine 2022, 55, 181–185. [Google Scholar] [CrossRef]
  19. Harada, Y.; Lin, L.; Fukui, M. An RNN Approach for Lithium-ion Battery Internal Impedance Estimation. In Proceedings of the 2020 IEEE Region 10 Conference (Tencon), Osaka, Japan, 16–19 November 2020. [Google Scholar]
  20. Singh, M.; Bansal, S.; Vandana; Panigrahi, B.K.; Garg, A.R. A Genetic Algorithm and RNN-LSTM Model for Remaining Battery Capacity Prediction. ASME. J. Comput. Inf. Sci. Eng. 2022, 22, 041009. [Google Scholar] [CrossRef]
  21. Rouhi Ardeshiri, R.; Ma, C. Multivariate gated recurrent unit for battery remaining useful life prediction: A deep learning approach. Int. J. Energy Res. 2021, 45, 16633–16648. [Google Scholar] [CrossRef]
  22. Chen, D.; Hong, W.; Zhou, X. Transformer network for remaining useful life prediction of lithium-ion batteries. IEEE Access 2022, 10, 19621–19628. [Google Scholar] [CrossRef]
  23. Gozalo-Brizuela, R.; Garrido-Merchán, E. ChatGPT is not all you need. A State of the Art Review of large Generative AI models. arXiv 2023, arXiv:2301.04655. [Google Scholar]
  24. Cao, H.; Tan, C.; Gao, Z.; Chen, G.; Heng, P.; Li, S. A Survey on Generative Diffusion Model. arXiv 2022, arXiv:2209.02646. [Google Scholar]
  25. Yang, L.; Zhang, Z.; Hong, S.; Xu, R.; Zhao, Y.; Shao, Y.; Zhang, W.; Yang, M.; Cui, B. Diffusion Models: A Comprehensive Survey of Methods and Applications. arXiv 2022, arXiv:2209.00796. [Google Scholar]
  26. Bond-Taylor, S.; Leach, A.; Long, Y.; Willcocks, C.G. Deep Generative Modelling: A Comparative Review of VAEs, GANs, Normalizing Flows, Energy-Based and Autoregressive Models. IEEE Trans. Pattern Anal. Mach. Intell. 2021, 44, 7327–7347. [Google Scholar] [CrossRef]
  27. Challu, C.; Jiang, P.; Wu, Y.N.; Callot, L. Deep Generative model with Hierarchical Latent Factors for Time Series Anomaly Detection. In Proceedings of the 2022 International Conference on Artificial Intelligence and Statistics, Valencia, Spain, 30 March–1 April 2022. [Google Scholar]
  28. Tashiro, Y.; Song, J.; Song, Y.; Ermon, S. CSDI: Conditional Score-based Diffusion Models for Probabilistic Time Series Imputation. In Proceedings of the 2021 Neural Information Processing Systems, Virtual, 6–14 December 2021. [Google Scholar]
  29. Wu, Y.; Ni, J.; Cheng, W.; Zong, B.; Song, D.; Chen, Z.; Liu, Y.; Zhang, X.; Chen, H.; Davidson, S.B. Dynamic Gaussian Mixture based Deep Generative Model for Robust Forecasting on Sparse Multivariate Time Series. arXiv 2021, arXiv:2103.02164. [Google Scholar] [CrossRef]
  30. Kim, S.; Yun, Y.C.; Choi, J.I. Impedance-based capacity estimation for lithium-ion batteries using generative adversarial network. Appl. Energy 2022, 308, 118317. [Google Scholar] [CrossRef]
  31. He, H.; Zhang, J.; Wang, Y.; Huang, S.; Wang, C.; Zhang, Y.; Guo, D.; He, G.; Ouyang, M. Detecting Electric Vehicle Battery Failure via Dynamic-VAE. arXiv 2022, arXiv:2201.12358. [Google Scholar]
  32. Ardeshiri, R.R.; Razavi-Far, R.; Li, T.; Wang, X.; Ma, C.; Liu, M. Gated recurrent unit least-squares generative adversarial network for battery cycle life prediction. Measurement 2022, 196, 111046. [Google Scholar] [CrossRef]
  33. Oussidi, A.; Elhassouny, A. Deep generative models: Survey. In Proceedings of the 2018 International Conference on Intelligent Systems and Computer Vision (ISCV), Fez, Morocco, 2–4 April 2018. [Google Scholar]
  34. Ho, J.; Jain, A.; Abbeel, P. Denoising Diffusion Probabilistic Models. arXiv 2020, arXiv:2006.11239. [Google Scholar]
  35. Rasul, K.; Seward, C.; Schuster, I.; Vollgraf, R. Autoregressive Denoising Diffusion Models for Multivariate Probabilistic Time Series Forecasting. In Proceedings of the 2021 International Conference on Machine Learning, Virtual, 18–24 July 2021. [Google Scholar]
  36. Abedi, S.; Yoon, S.W.; Kwon, S. Battery energy storage control using a reinforcement learning approach with cyclic time-dependent Markov process. Int. J. Electr. Power Energy Syst. 2022, 134, 107368. [Google Scholar] [CrossRef]
  37. Sun, H.; Sun, J.; Zhao, K.; Wang, L.; Wang, K. Data-Driven ICA-Bi-LSTM-Combined Lithium Battery SOH Estimation. Math. Probl. Eng. 2022, 2022, 8. [Google Scholar] [CrossRef]
  38. Kim, S.; Choi, Y.Y.; Kim, K.J.; Choi, J.I. Forecasting state-of-health of lithium-ion batteries using variational long short-term memory with transfer learning. J. Energy Storage 2021, 41, 102893. [Google Scholar] [CrossRef]
  39. Severson, K.A.; Attia, P.M.; Jin, N.; Perkins, N.; Jiang, B.; Yang, Z.; Chen, M.H.; Aykol, M.; Herring, P.K.; Fraggedakis, D.; et al. Data-driven prediction of battery cycle life before capacity degradation. Nat. Energy 2019, 4, 383–391. [Google Scholar] [CrossRef]
  40. Zhu, J.; Wang, Y.; Huang, Y.; Bhushan Gopaluni, R.; Cao, Y.; Heere, M.; Mühlbauer, M.J.; Mereacre, L.; Dai, H.; Liu, X.; et al. Data-driven capacity estimation of commercial lithium-ion batteries from voltage relaxation. Nat. Commun. 2022, 13, 2262. [Google Scholar] [CrossRef]
  41. LI, S.; Jin, X.; Xuan, Y.; Zhou, X.; Chen, W.; Wang, Y.; Yan, X. Enhancing the Locality and Breaking the Memory Bottleneck of Transformer on Time Series Forecasting. arXiv 2019, arXiv:1907.00235. [Google Scholar]
Figure 1. The diagram of diffusion model.
Energies 16 03815 g001
Figure 2. The flowchart of diffusion model tackling time series with BiLSTM.
Energies 16 03815 g002
Figure 3. The flowchart of proposed approach.
Energies 16 03815 g003
Figure 4. Figure 4. The experimental steps in a test cycle of two datasets. (a) Dataset 1. (b) Dataset 2.
Energies 16 03815 g004
Figure 5. The battery capacity degradation curve of the two datasets. (a) Dataset 1. (b) Dataset 2.
Energies 16 03815 g005
Figure 6. Figure 6. The voltage variation trends of B1-01 in three CC stages. (a) CC1 stage. (b) CC2 stage. (c) CC3 stage.
Energies 16 03815 g006
Figure 7. Figure 7. The six features extracted from CC1 stage as a function of battery capacity. (a) Var. (b) Ske. (c) Max. (d) Min. (e) Mean. (f) Kur.
Energies 16 03815 g007aEnergies 16 03815 g007b
Figure 8. The framework of SOH prediction based on diffusion model and transfer learning strategy.
Energies 16 03815 g008
Figure 9. Capacity prediction results and errors of B1-01, B1-02, B1-03, and B1-04. (a) B1-01. (b) B1-02. (c) B1-03. (d) B1-04.
Energies 16 03815 g009aEnergies 16 03815 g009b
Figure 10. Capacity prediction results and errors of B2-01 and B2-02. (a) B2-01. (b) B2-02.
Energies 16 03815 g010
Table 1. Summary of two LIBs datasets.
Spec.Dataset 1Dataset 2
Rated capacity (Ah)1.173
Number of cells42
Charging current (A)2.64-1.43-1.129.2-21.9-3.65
Discharging current (A)4.473
Max cut-off voltage (V)3.64.3
Min cut-off voltage (V)2.02.7
Number of cycles
(Bn mm denotes the battery code)
B1-01:1062
B1-02:1266
B1-03:1114
B1-04:1047
B2-01:373
B2-02:373
Table 2. Prediction errors of four batteries in Dataset 1.
IndexB1-01B1-02B1-03B1-04
RMSE0.00490.01870.00340.0166
MAE0.00440.01830.00220.0164
MAPE0.43%1.81%0.23%1.55%
Table 3. Comparison of prediction errors with other ML methods.
IndexRNNLSTMGRUTransformerCNN-TransformerProposed Approach
RMSE0.02530.01670.01210.03640.02270.0109
MAE0.02710.01340.01150.02780.02180.0103
MAPE2.94%1.32%1.07%3.03%2.11%1.01%
Table 4. Comparison of the predicted results in two cases of Dataset 2.
CaseIndexB2-01B2-02
With transfer learningRMSE0.00310.0028
MAE0.00270.0023
MAPE0.28%0.24%
Without transfer learningRMSE0.04110.0437
MAE0.03870.0388
MAPE4.03%4.05%
Disclaimer/Publisher’s Note: The statements, opinions and data contained in all publications are solely those of the individual author(s) and contributor(s) and not of MDPI and/or the editor(s). MDPI and/or the editor(s) disclaim responsibility for any injury to people or property resulting from any ideas, methods, instructions or products referred to in the content.