Article

Geochemical and Microstructural Characteristics of Clay Minerals and Their Effects on the Pore Structure of Coal-Measure Shale: A Case Study in Qinshui Basin, China

1
Key Laboratory of Coal Science and Technology (Taiyuan University of Technology), Ministry of Education, Taiyuan 030024, China
2
Shanxi Huaxin Gas Energy Institute Co., Ltd., Taiyuan 030032, China
3
Shanxi Coalbed Methane (Natural Gas) Gathering and Transportation Co., Ltd., Taiyuan 030032, China
4
College of Mining Engineering, Taiyuan University of Technology, Taiyuan 030024, China
*
Author to whom correspondence should be addressed.
Energies 2023, 16(9), 3804; https://doi.org/10.3390/en16093804
Submission received: 13 March 2023 / Revised: 17 April 2023 / Accepted: 26 April 2023 / Published: 28 April 2023

Abstract

:
As the essential component of shale, clay minerals have a vital influence on the pore structure and the gas content of reservoirs. To investigate the compositional characteristics of coal-measure shale and its effects on pore structure, a total of thirteen Taiyuan formation shale samples were collected from the Qinshui Basin and were analyzed using a combination of X-ray diffraction analysis, X-ray fluorescence spectrometry, Fourier transform infrared spectroscopy (FE-SEM), polarized optical microscopy, and field emission scanning electron microscopy. The results show that the principal minerals of the samples are quartz, kaolinite, and illite. Most of the kaolinite was an original terrigenous detrital material with low crystallinity and a low degree of ordering, whereas the illite was mainly composed of 1Md resulting from diagenesis. Clay minerals developed slits, irregularly-shaped or multisized pores during diagenesis, which can be classed into interlayered pores, intergranular pores, and microfractures. Eight micro-morphological forms of clay minerals were summarized based on FE-SEM observations, such as compacted, parallel, bent, tilted, mutually supporting structures, etc., which are mainly formed by the mechanical compaction of clay minerals with different sizes, shapes, and contact relationships. The diversity and complexity of the micro-morphological forms of clay minerals contribute to the strong heterogeneity, low porosity and high permeability anisotropy of shale.

1. Introduction

As an unconventional natural gas resource, a shale gas reservoir is a special porous medium with low porosity and low permeability. Shale gas is adsorbed on the surface of organic matters and clay mineral particles or is stored as a free gas in micron-nanometer pores and fractures. Pores not only provide storage space for shale gas but also have effects on the sorption characteristics of shale. The pore structures, including their size, connectivity, spatial distribution, and shape, all make significant contributions to the gas storage capacity of shale reservoirs [1,2,3]. Porosity in shale reservoirs is the comprehensive result of deposition, compaction, and chemical diagenesis (mineral transformation, cementation, and dissolution) [4,5,6]. The composition of reservoirs plays a decisive role in the formation and evolution of pore structures in the process of diagenesis [7]. Being a significant part of shale, micron-nano pores in organic matter are well developed and provide a large number of adsorption sites and a large amount of storage space for methane. Furthermore, organic acid is generated during the decomposition of organic matters, which is beneficial for the formation of secondary porosity [6,8,9,10,11]. Clay minerals are the other principal components of pore development in shale and coal seams, having an especially significant impact on shale quality [12,13]. In previous studies on oil and gas exploration, clay minerals have not only been used as a tool to predict the quality of organic source rock and determine the hydrocarbon emplacement time, but also to investigate the diagenesis process and reservoir quality. Additionally, clay minerals can also be used for the evaluation of hydrocarbon-generation potential and mechanisms. Since they usually coexist with organic matter in their source rocks, they are sensitive to the changes caused by hydrocarbon generation and expulsion processes [5,6,14,15]. Most sedimentary rocks contain an appreciable amount of clay minerals, which are generally a detrital material of terrigenous origin and authigenic cement. Clay minerals are usually detrimental to reservoir quality because they can be located on grain surfaces in the form of films, plates, and bridges and block up the primary porosity in the process of mechanical compaction. Furthermore, clay minerals are layered aluminosilicates, which are favorable for the development of interparticle micron-nano pores in reservoirs, especially in shale. Previous studies have shown that clay mineral composition and its micropore structure affect the gas sorption capacity of shales. Pores between crystal layers of clay minerals are 1–2 nm in size, which could provide adsorption sites for methane [6,7,16,17,18,19].
Shale gas resources are divided into three types according to their depositional environment: marine shale, marine-terrigenous shale in coal-measure strata, and terrigenous shale. Coal-measure shale gas refers to the natural gas generated and held by dark shale in the coal-measure strata. Coal-measure shale deposits vertically with coal, sandstone, and limestone. A single, continuous deposition layer is generally less than 20 m [20,21]. Coal-measure shale is obviously different from marine shale in its sedimentary environment, kerogen type, reservoir quality and mineral composition. As far as coal-measure shale is concerned, it is generally rich in clay minerals and moderated quartz and commonly poor in carbonate. Clay minerals in coal-measure shale consist mainly of kaolinite and illite [22], whereas marine shale contains abundant illite or illite-smectite mixed layers with only a little kaolinite. The variation in the constituents and content of clay minerals inevitably leads to the unique microscopic pore structure of coal-measure shale. In order to elucidate the geochemical and microstructural characteristics of clay minerals, a range of methods have been used in the literature, such Fourier Transform Infrared (FTIR), X-ray diffraction (XRD), X-ray florescence spectrometry (XRF), and Feld-emission scanning electron microscopy (FE-SEM) [14,17,23]. However, due to the complexity and variety of clay minerals, their geochemical features, geometry, and origin in coal-measure shale, especially in Taiyuan formation shale, have not been studied in detail in previous studies. The relationship between the microstructural characteristics of clay minerals and pore development in shale is also rarely discussed in detail.
This study aims to investigate the micro-morphology of clay-related pores in Taiyuan formation shale (TYS) and to discuss the creation mechanism of those pores using a series of tests. The mineralogical and geochemical data and micromorphology information of shale reservoirs are presented. The origins of clay minerals are determined, and clay-related pore types are distinguished. Moreover, the effects of clay minerals on porosity and permeability are also discussed, which will improve our understanding of pore structure within coal-measure shale.

2. Samples and Methods

Located in the southeast region of the Shanxi Province, the Qinshui Basin is one of the most important coal and coal-bed methane production bases in China. The tectonic history of the Qinshui Basin is discussed in detail by previous studies [24,25]. The study area of this paper is located in the eastern part of the Qinshui Basin, which is a key exploration and development area for deep coalbed methane resources in China. The burial depth of the Taiyuan formation shale in this area generally exceeds 1000 m, with a maximum depth of up to 1700 m. Meanwhile, the average thickness of the coal-bearing strata in this area is 100 m. (Figure S1). The Taiyuan formation is deposited in an epicontinental sea carbonate platform and delta sedimentary environment [26]. Its lithology is mainly composed of dark gray-to-black shale, coal seams, siltstone-to-medium-grained sandstone, and limestone, and its deposition of dark mudstones and shales is 20–70 m in thickness with thin silt sandstones.
To investigate the potential of coal-measure shale resources in this area and explore the co-development mode of deep coalbed methane and shale gas, three exploration wells were drilled in the Tunliu, Yushe, and Zuoquan counties (see Figure 1 for well locations). In this study, a total of 13 TYS samples were collected from the 3 exploration wells at a depth interval of 1100–1700 m based on core observations (Figure 1).
The location of each sample is shown in Figure S1. The samples consist of mudstone, silty mudstone, and silt-sand mudstone with colors of dark gray to gray black. The samples dominated by a certain clay mineral (such as YS-03, rich in illite, and YS-04, rich in kaolinite) were selected to determine the crystal structure and the origin of clay minerals. The shale samples were analyzed by XRD, XRF, FTIR, polarized optical microscopy, and FE-SEM.
The mineralogical compositions of all shale samples were determined using a Rigaku Ultima IV at 40 kV and 30 mA. Samples were crushed to less than 80 mesh and were smeared on the glass side. XRD data were obtained with a step size of 2°/min from 5° to 80° (2θ). The semi-quantitative compositions in mineral percentages were estimated with the software PDXL 2.0 using the RIR method based on the ICDD PDF database.
The XRF analysis was performed on a Rigaku ZSX Primus II with a generator voltage of 50 kV and generator current of 50 mA. The bulk shale samples were reduced into powder with a grain size less than 200 mesh. About 4 g of shale powder was pressed into pellets with a diameter of 30 mm and a thickness of 2 mm under 35 MPa for 45 s. The analytical precision of XRF is within 5%. Concentrations of the major elements were recalculated to 100%.
FTIR measurements were conducted on all shale samples with a Nicolet model 6700 Fourier transform infrared spectrometer. Powder samples were grounded with KBr and pressed into pellets under 10 MPa pressure for 2 min. In order to minimize moisture, the pellets were dried at 110 °C for 48 h. FTIR spectroscopy for all samples was collected in the region of 4000 cm−1 to 400 cm−1 at a resolution of 2 cm.
Thin sections of shale samples were studied by a Leica DM4p polarized optical microscopy following the Chinese Oil and Gas industry standard of SY/T 5368-2016 [27]. Firstly, shale samples were cut into thin sections, and then were treated by rough and fine gridding. Finally, they were polished with cloth to obtain a smooth and glossy surface.
The microscopic morphology of minerals was identified by a Tescan MIRA 3 and a JEOL JSM-7610F FE-SEM equipped with an oxford X-Max 20 energy-dispersive spectrometer (EDS). Small chips with natural broken surfaces were selected. The surfaces of chip samples were mechanically polished with 400 mesh and 600 mesh sandpaper to observe the presence of minerals. Flake samples were mounted on a copper platform with conductive adhesive and coated with gold to provide a conductive surface.

3. Results

3.1. Mineralogical Compositions

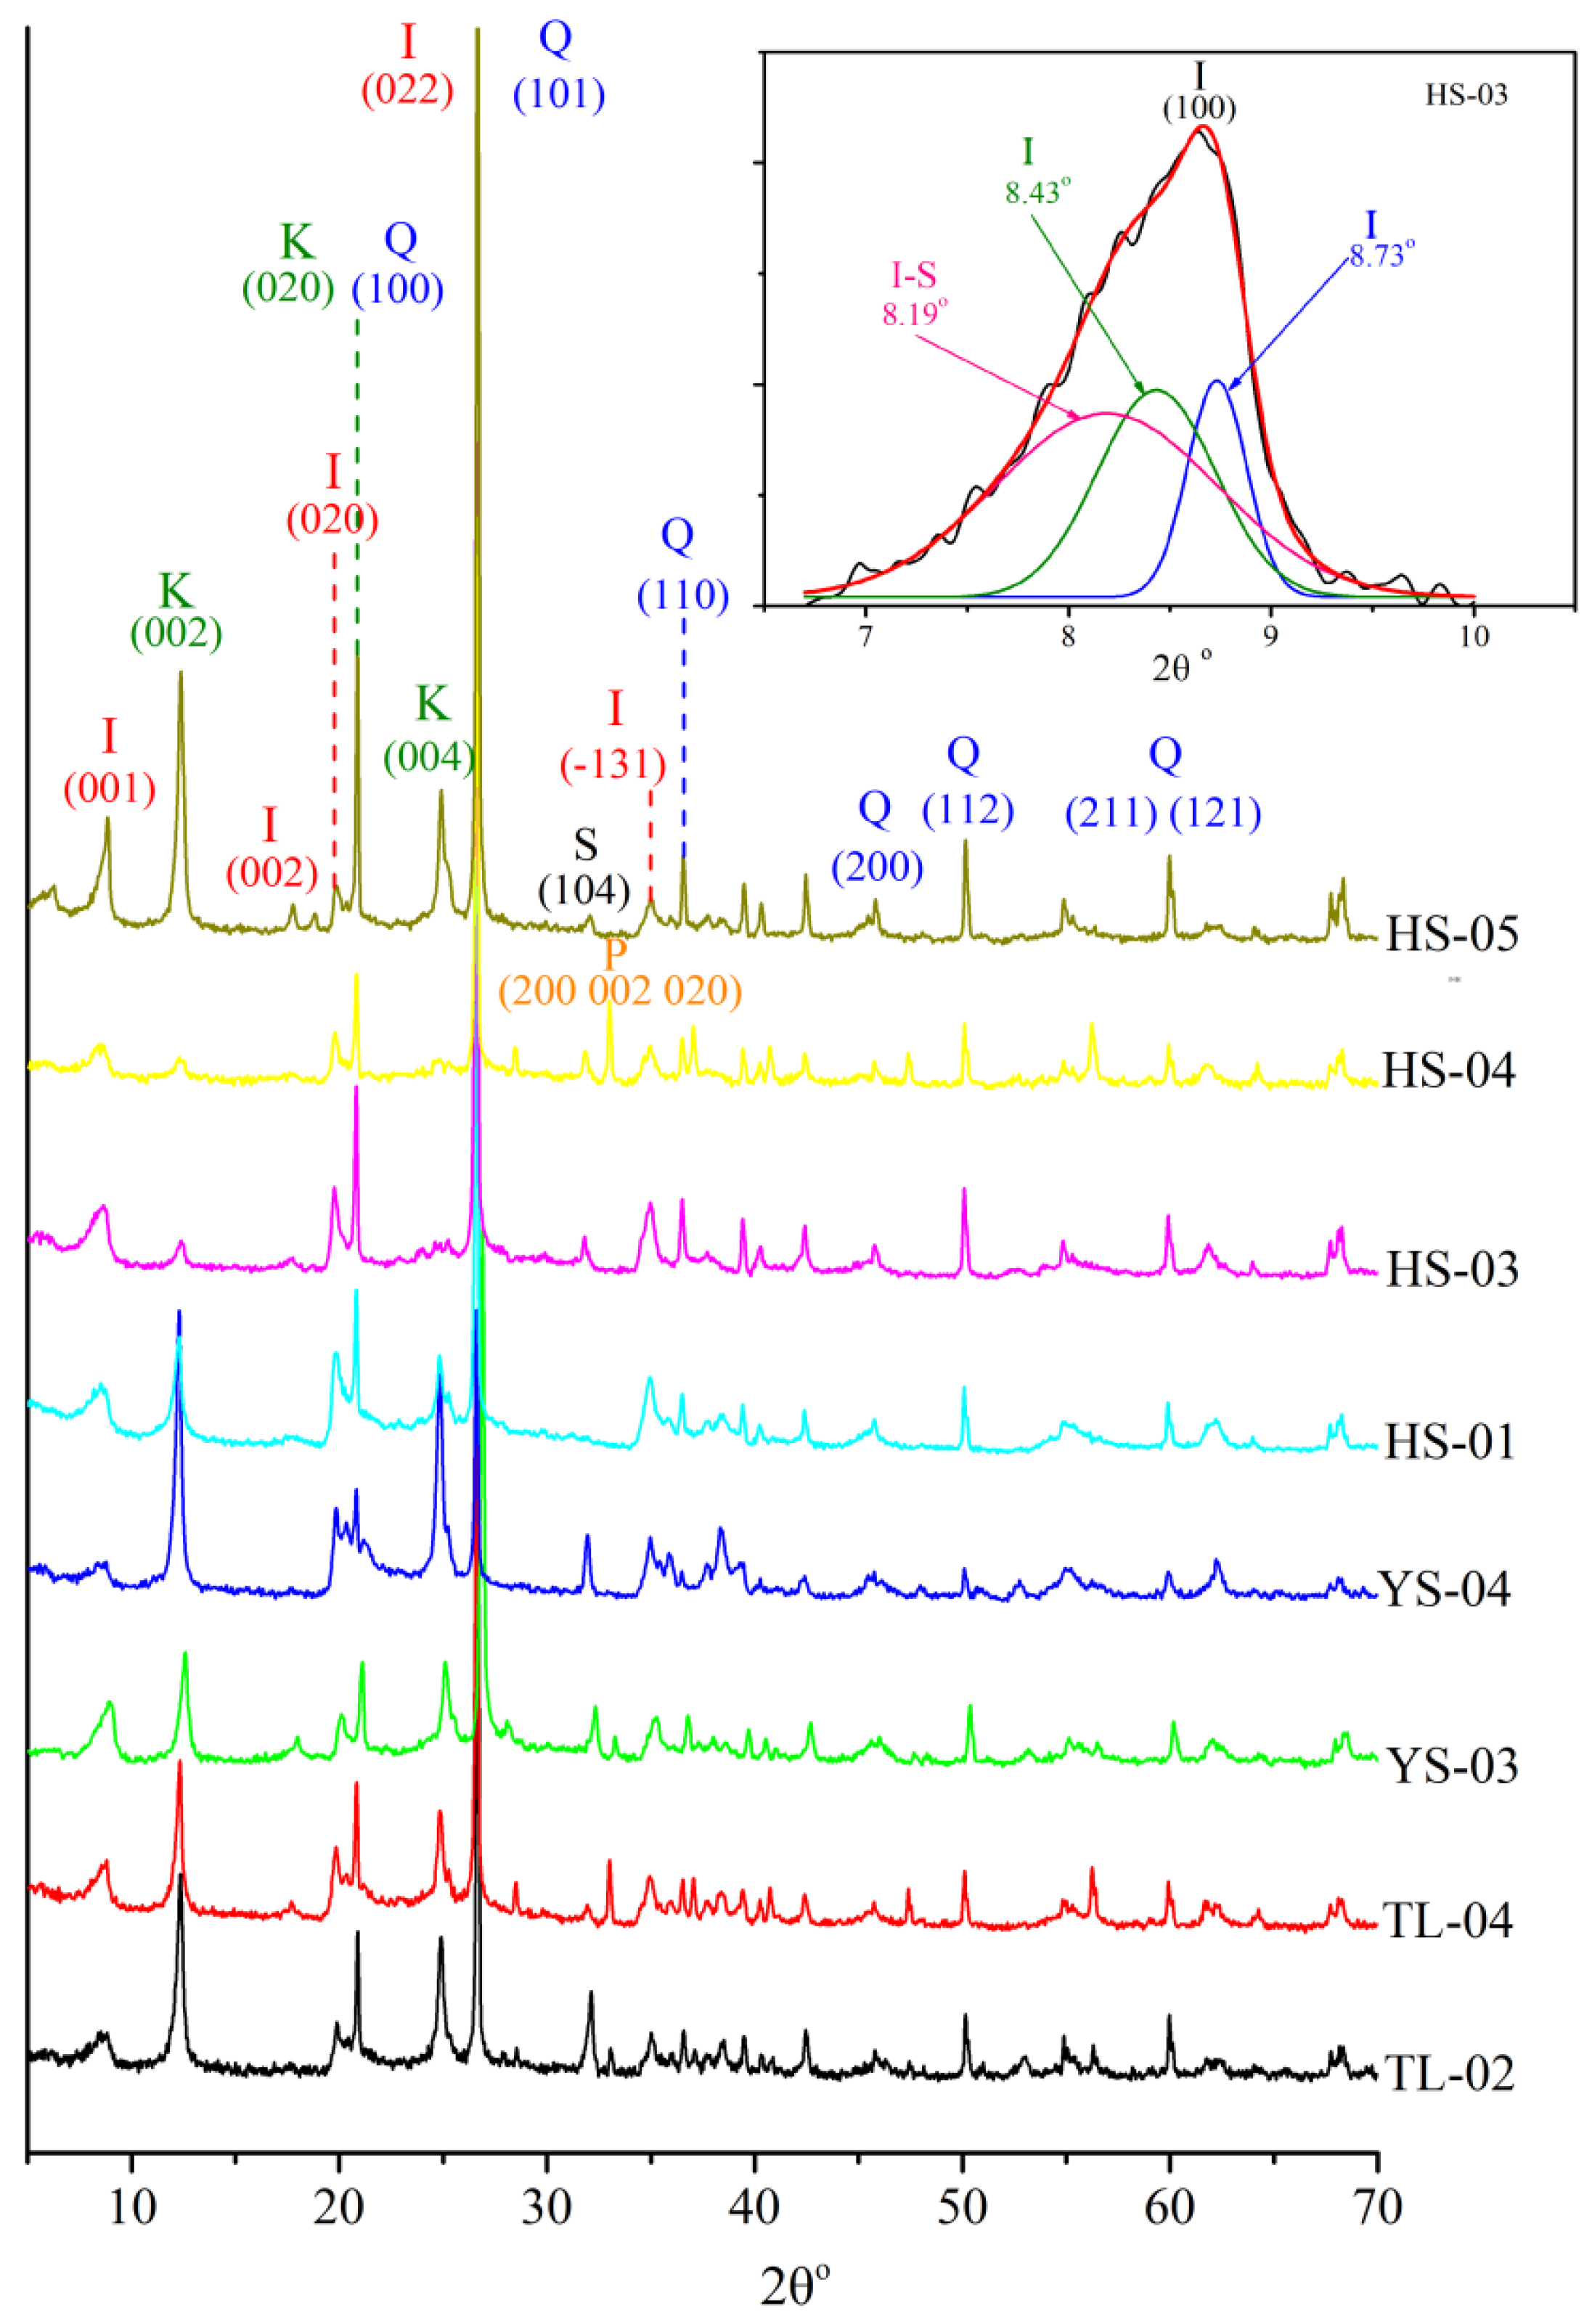
The XRD patterns of random bulk samples show that the samples have similar mineral associations, mainly consisting of clay minerals and quartz with a minor amount of carbonate, pyrites, and siderites (Figure 2).
The characteristic peaks of quartz are located at 26.7° 2θ, which are all intense and sharp, indicating that the samples contain quartz as the dominant phase.
Kaolinite is the major component in the TYS samples and is identified on the XRD pattern with 12.4° 2θ (12.3° to 12.6° 2θ), 20.2° 2θ (19.9–20.4° 2θ), and 24.9° 2θ, etc. The peaks of kaolinite for TYS samples between 002 (12.4° 2θ) and 004 (24.9° 2θ) reflections are merged (Figure 2), and the six peaks between 20.2° and 24.9° were not identified. This suggests that the kaolinite in TYS samples is of low crystallinity and a low degree of ordering, consequently confirming that the kaolinite in the TYS is of a detrital terrigenous origin [28,29,30].
Illite is commonly identified by the reflections at 8.83° 2θ (8.75°–8.90° 2θ), 17.8° 2θ, and 19.7° 2θ, etc. [31]. The reflection of TYS samples at 8.83° 2θ are broad, and a portion of the reflection intensity is found near 8° 2θ (Figure 2), suggesting that illites contain some quantity of I-M mixed layer minerals. The intensity and breadth of peaks near 34.9° 2θ suggest that illites contain a considerable amount of 1Md illite, which mainly results from diagenesis and can be used to indicate the thermal evolution of the reservoirs. The characteristic peak intensities of 2M1 illite on the XRD pattern are weak, indicating only a small number of the illites in the TYS samples are of a detrital terrigenous origin [31].
The results of the XRD semi-quantitative analysis (Table 1) show that the clay mineral content in the samples is significantly high, ranging from 29.9% to 82.6% with an average of 56.2%, indicating that clay minerals are the main component of TYS. Kaolinite is the dominant component of clay minerals with an average content of 32.1%. The following table shows the content percentage of each component in the samples, with illite having a mean value of 21.8%, and chlorite being the least common with an average value of 2.2%. Some samples are rich in pyrite, at up to 8.8% (HS-04).

3.2. Elemental Composition

The results of the XRF analysis are given in Table 2. SiO2 is the most abundant oxide with a percentage from 42.8% to 68.1%. The second most abundant oxide is Al2O3 with a minimum of 19.89%. Fe2O3 and K2O are comparatively abundant with a mean value of 5.93% and 2.63%, respectively, while all the other oxides (TiO2, CaO, MgO and Na2O) are less than 1.0%. Trace elements detected with XRF are mainly Ba, Sr, Zr, V, etc. Ba is more than 500 ppm, and Zr, Sr, and V are over 100 ppm on average.
The average elemental content of TYS samples is compared with the average value of Post-Archean Australian Shales (PAAS) in Figure S2 [23,32,33]. The average content of SiO2 in the TYS samples is almost equal to those in PAAS, while the average content of Al2O3 is much higher. The SiO2/Al2O3 content of the TYS samples varies from 0.95 to 2.98, with a mean value of 2.20, which is considerably lower than that of PAAS. This suggests that the TYS samples contain more clay mineral than does PAAS. The average content of other oxides in the TYS samples, such as K2O, Na2O, CaO, MgO, etc., are all lower than the corresponding oxides in PAAS, which is possibly attributed to the TYS samples rich in kaolinite and poor in carbonate. The average value of Fe2O3 in the TYS samples is slightly less than that of PAAS; however, some of the TYS samples (TL-02, HS-02, HS-04) are rich in Fe2O3, at more than 10% of their content.
The chemical compositions and oxide ratios of clastic rocks are often used to describe the original mineralogy of source rocks, digenetic histories, and mature stages of sediments. The index of compositional variation (ICV) is useful to determine the original composition of sediments, and can be calculated with the following equation [23,34,35]:
ICV = (CaO + Na2O + K2O + Fe2O3 + MgO + MnO + TiO2)/Al2O3
Oxides are the weight percentage. ICV is the ratio of Al2O3 to the other oxides (excluding silicon) in a rock or minerals. The value of ICV tends to be higher for easily erodible minerals and lower for stable minerals. It decreases as the degree of weathering increases. Mudstone with higher ICV values may be produced by first-cycle deposits, while those with lower ICV values are possibly produced by recycling sediments or first-cycle material with intense chemical weathering [20,31]. The ICV of the TYS samples varies from 0.21 to 1.04 with a mean value of 0.44, indicating that these samples are rich in clay minerals and are possibly produced by intense chemical weathering of the first-cycle deposit.
The ratio of K2O/Al2O3 is another index to characterize the original composition of ancient mudrocks. Although the water solubility of K+ is good, it tends to be of high chemical stability when present in mudrocks, such as illite, a quite stable mineral to resist weathering. Therefore, the recycling of old sediments or intense chemical weathering of first-cycle deposit results in a high proportion of illite [23]. The K2O/Al2O3 of the TYS samples ranges from 0 to 0.18, with an average of 0.10, which indicates that clay composition ranges from kaolinite to illite and the source rocks are strongly weathered. Some minerals have a tendency to be lost easily under weathering, whereas other minerals, such as Ti+ and Al+, tend to be stored in weathering products and are not lost as easily. Many studies have confirmed that the Al2O3/TiO2 ratio for shales and sandstones varies insignificantly during sedimentary processes and is almost similar to source rocks, which can be used as an indicator to monitor the geochemical composition of source rocks [34,36,37]. For samples with Al2O3/TiO2 ratios ranging from 0.02 to 0.03, their source rocks are felsic igneous rocks.

3.3. FTIR

In order to identify minerals in the TYS samples, the infrared spectra of typical minerals occurring in shale samples were collected according to XRD results (Figure S3), which includes quartz, kaolinite, illite, and chlorite.
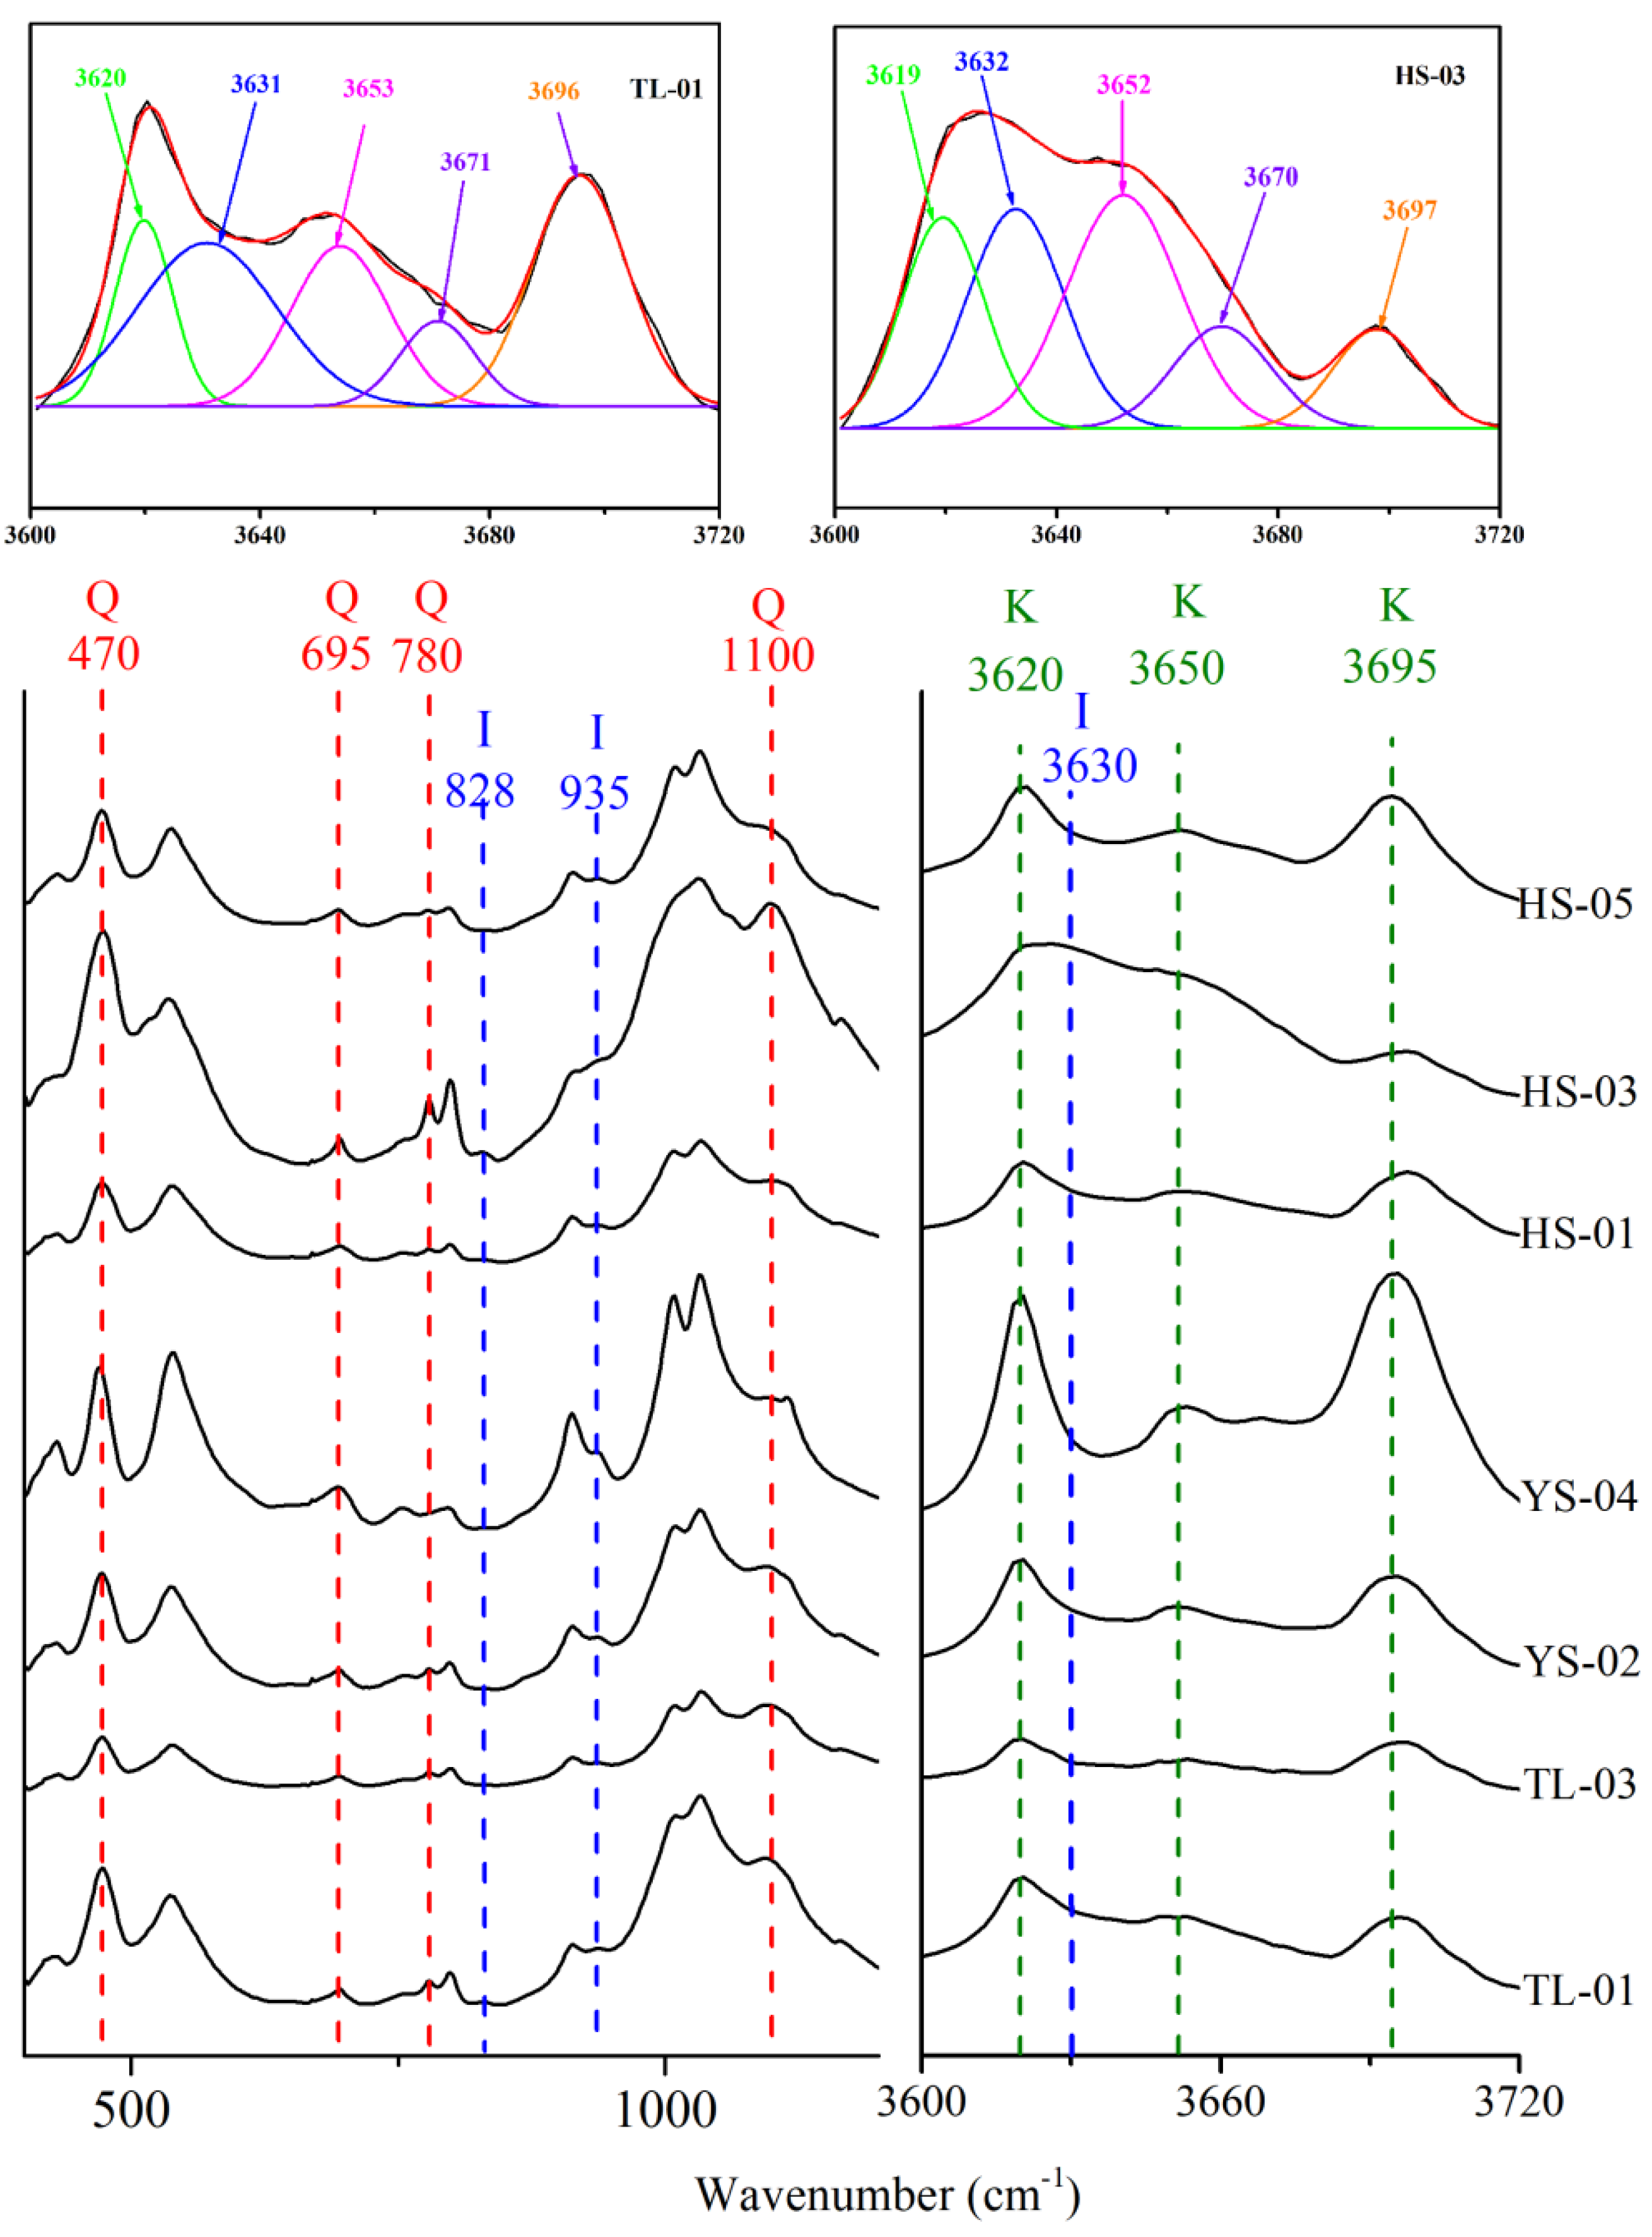
The FTIR spectra for all samples are similar in shape with two main adsorption regions at 1200–4000 cm−1 and 3800–3500 cm−1 (Figure 3).
The Si-O bonds can be recognized by the strong bands in the region of 1200 to 900 cm−1 (stretching) as well as the less intense bands between 800 and 400 cm−1 (bending) [23,34]. The presence of quartz in all samples can be identified by the characteristic bands around 470 cm−1, 695 cm−1, 780 cm−1, and 1100 cm−1. The peak at 695 cm−1 is unique to crystalline materials, and it can be clearly observed on the FTIR spectra that the quartz in the TYS samples has a crystalline structure.
Kaolinite can be easily identified in the FTIR spectrum by the bands of 950–1120 cm−1 and 3600–300 cm−1. The kaolinite has a 1:1 layer structure that comprises a tetrahedral silica sheet and an octahedral alumina sheet, which exhibits a triumvirate of Si-O absorbance at 950–1120 cm−1. The triumvirate of peaks for the sample YS-04 is most notable, confirming the abundant presence of kaolinite (the kaolinite content is 72%). A typical spectrum of kaolinite displays four clearly distinctive peaks at 3620 cm−1, 3650 cm−1, 3670 cm−1, and 3695 cm−1, owing to the unique pattern of inner surface –OH vibration [38,39]. The structural order of kaolinite can be estimated according to the bands in the region of 3600–3700 cm−1. The two peaks for all of the TYS samples at 3696 cm−1 and 3620 cm−1 are clearly distinguished, while the other two peaks at 3670 cm−1 and 3650 cm−1 are only identified if they are distinguished by fitting peak, which shows that the kaolinite in the TYS samples has a low ordered structure [40]. The intensity of the peaks for all samples increases with rising kaolinite content. Additionally, the peaks for sample YS-04 also present the maximum intensity.
The illite is composed of 2 tetrahedral silica sheets and a central octahedral sheet with a 2:1 layer structure. It expresses a single broad absorbance peak at 900–1200 cm−1 and a wide adsorption around 3700–3600 cm−1. The presence of illite can be identified by the shoulder around 935 cm−1 and the peak at 3630 cm−1 in the FTIR spectra, which arise from the Al–OH–Al bending vibration and the stretching vibrations of the –OH groups, respectively. The spectra of most samples show a weak shoulder at 935 cm−1, indicating that there is not much illite present in the samples. The shoulder of sample HS-03 at 935 cm−1 is the highest of all samples, indicating that it contains abundant illite, which is consistent with the results of XRD. As expected, the peak for illite at 3630 cm−1 is overlapped by the vibration of kaolinite and is likely to be identified only by peak fitting. Attributed to OH stretching vibrations in the octahedral sheet, the weak peak located at 828 cm−1 is also evidence for the presence of illite, but it is visible only in a few illite-rich samples (Tl-01, HS-03).
Due to O-H stretches in the interlayered sheet, two broad bands around 3575 cm−1 and 3420 cm−1 are observed in the standard FTIR spectra of chlorite (Figure S2). Through the XRD analysis, chlorite in the shale samples was found to be less than 4% and the FTIR characters of chlorite in the spectrum of the TYS samples are too weak to be identified.

3.4. Petrography

Microscopic identification shows that the analyzed samples have a muddy structure with a small amount of fine-grained detrital particles, and they can be classified into three types based on their debris content [11], namely: mudstones (Figure 4a,b), silty mudstones (Figure 4c), and silt–sand mudstones (Figure 4d). The detrital minerals in the samples consist of quartz, feldspar, and pyrite.
Quartz and clay minerals are common in the compositions of thin sections of shale. Quartz is colorless with a smooth surface and displays irregular or sub-round shapes, which is the predominate mineral of detrital particles and accounts for 60–90% of the detrital grains. Feldspar is also identified in detrital particles, but most of the feldspar has undergone kaolinization or been altered to become a clay mineral. Some samples are rich in pyrite (HS-04: Figure 4e,f) and appear as a framboidal aggregate or large crystal grains with a metallic luster. The size of pyrite grain varies in a large range: some less than 1 μm and some more than 10 μm. In contrast to detrital minerals (quartz, pyrite, feldspar), clay mineral particles are much smaller with a size of only a few microns, and their microstructures cannot be identified with microscopes. Organic matter is black and disperses in mineral particles.

3.5. FE-SEM

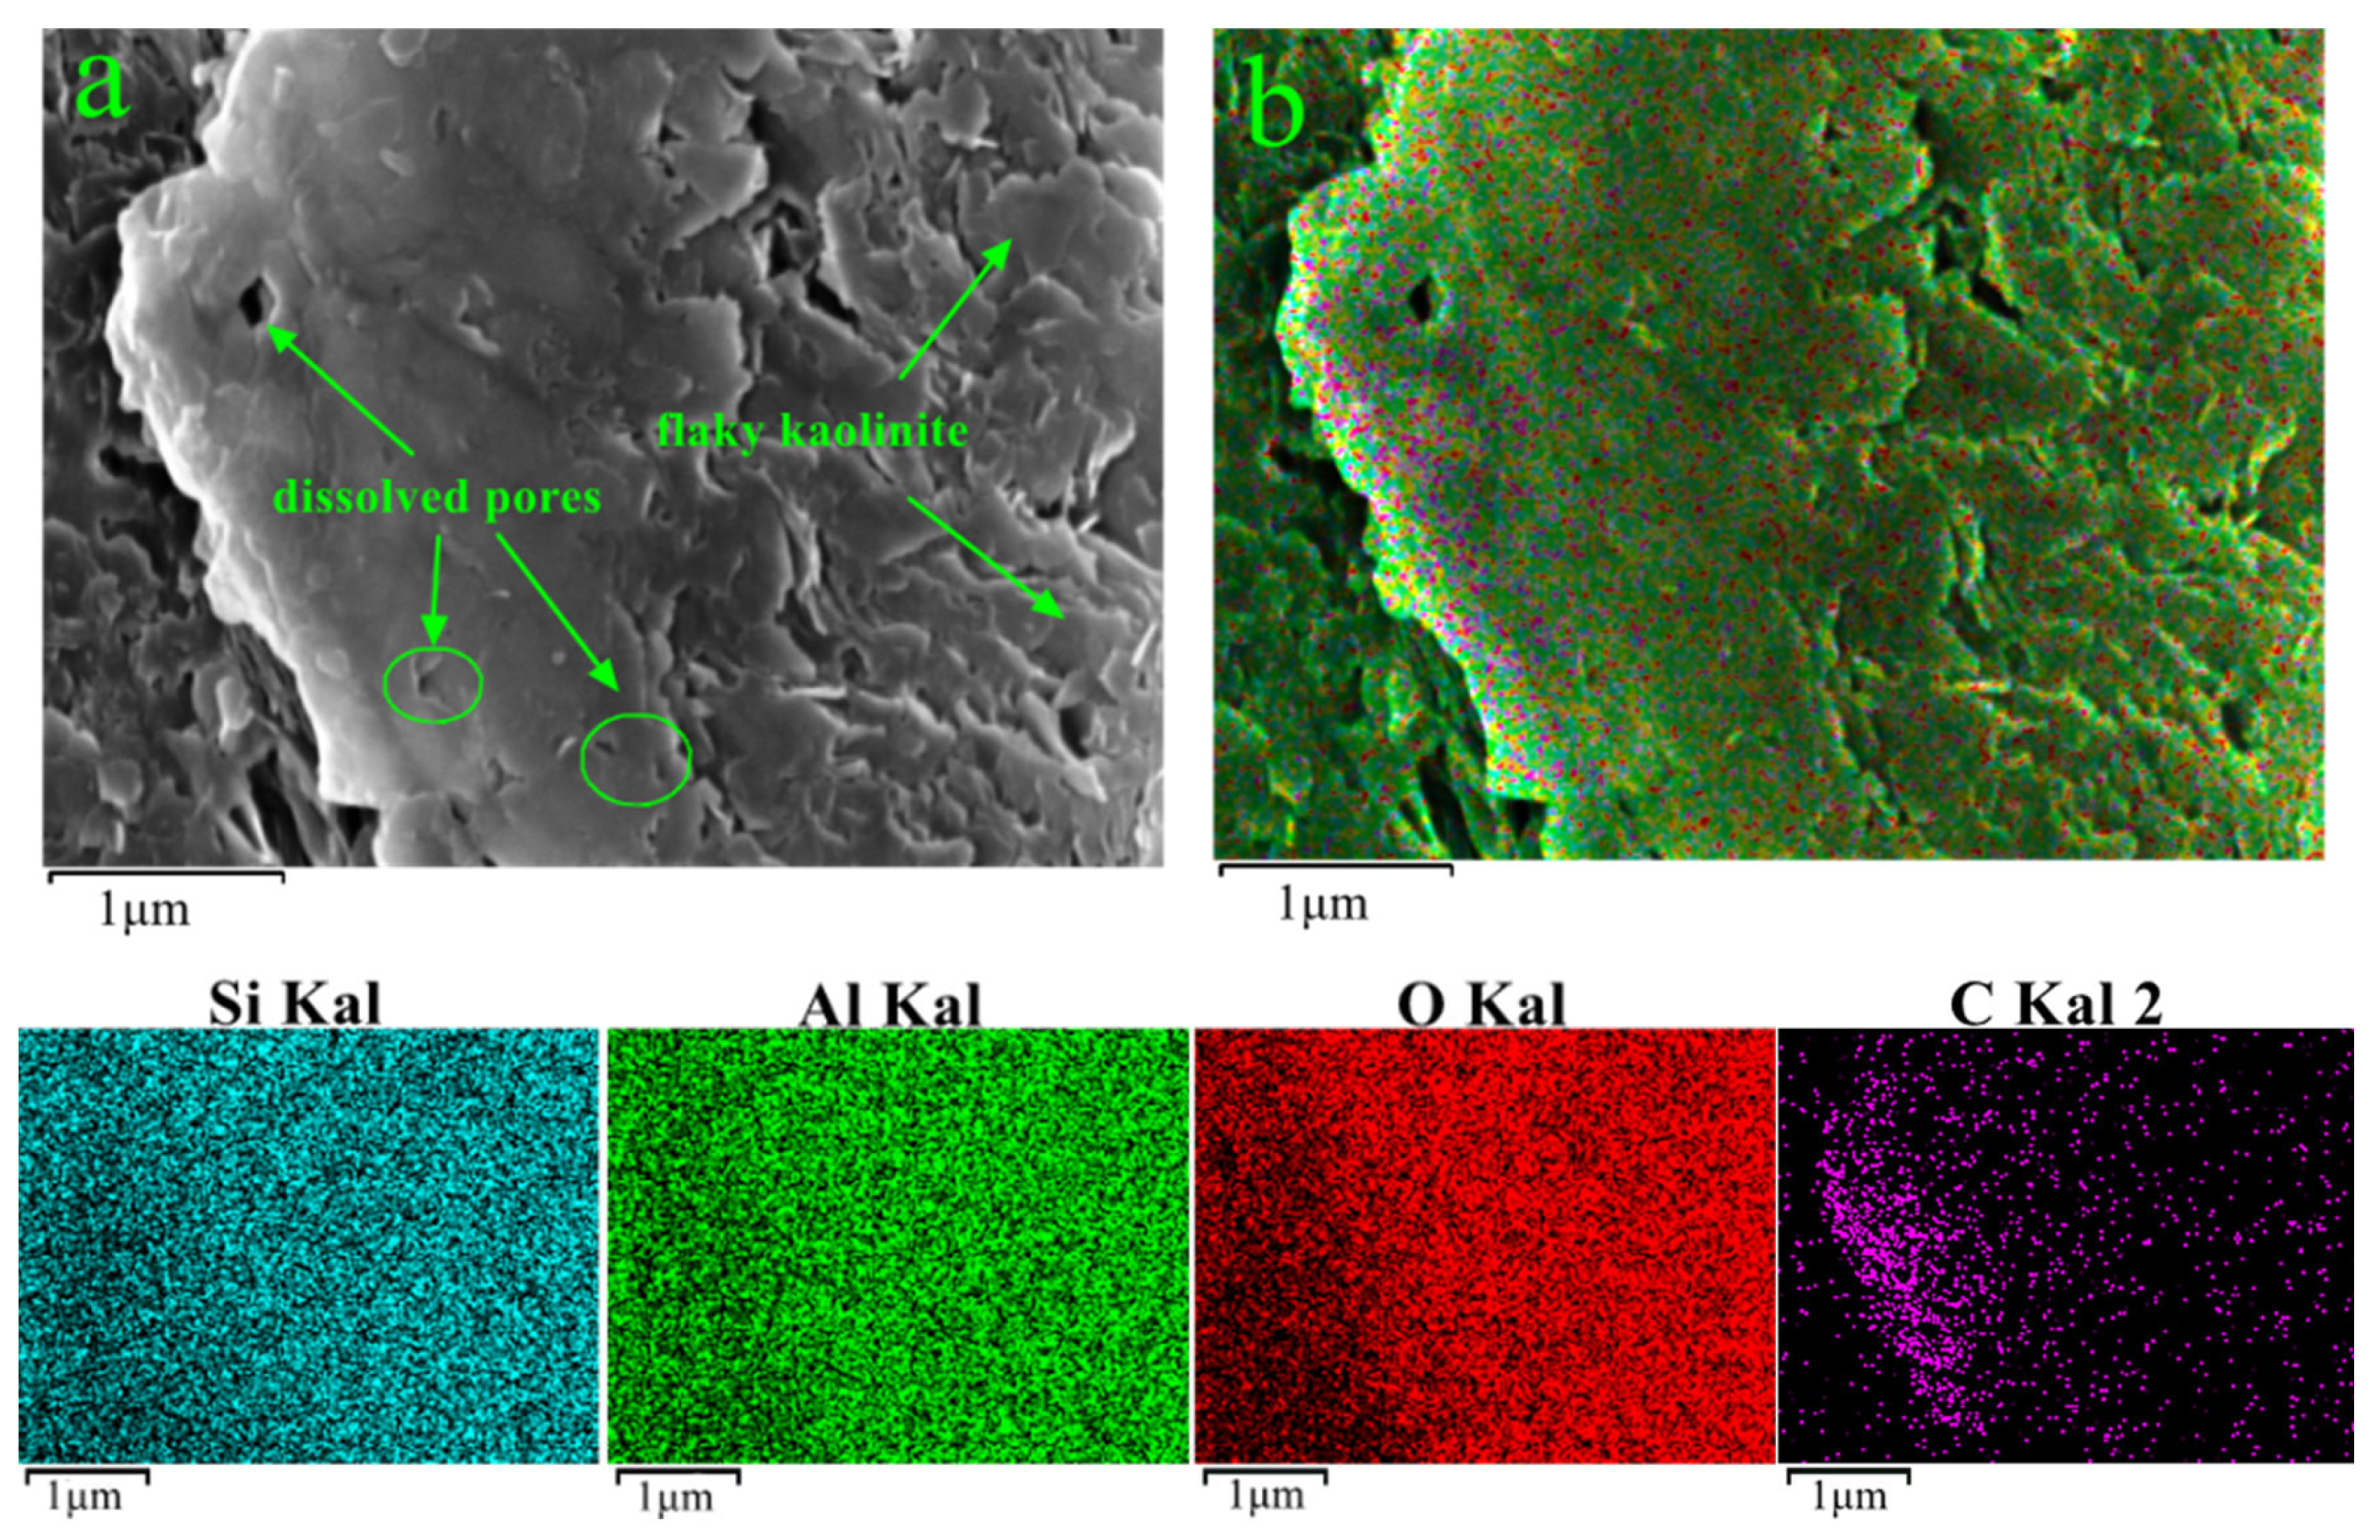
The results of the FE-SEM-EDS analysis (Figure S4, sample YS-01) suggest that the major elements of coal-measure shale are Si, Al, O, C, Mg, Na, Ca, Fe, S, etc. Analyzed samples are mainly composed of quartz and clay minerals, as well as a small amount of organic matter and pyrite. Clay minerals are flaky, leaflike, or multilayered in shape, which is controlled by the crystalline structure (Figure 5: TL-03, Figure 6: YS-03, Figure 7).
As Figure 5a and Figure 7 show, kaolinite in the coal-measure shale presents a booklike or accordion-like shape (Figure 7a: TL-02, Figure 7b: YS-02). Based on EDS analysis, kaolinite is found to coexist with a C element (Figure 5: TL-03 and Figure S5: HS-05), indicating that organic carbon is positive for the formation and preservation of kaolinite in coal-measure shale. OM acid is expelled with the decomposition and hydrocarbon generation of organic matter in the thermal process, and residual carbon is retained. Acid fluid promotes the alteration of feldspar minerals and produces kaolinite [5]. Some kaolinite was determined to contain K element (Figure S5), which differs from the ideal chemical composition of kaolinite, showing that kaolinite is probably formed from the alteration of K-feldspar grains.
Illite exhibits a sheetlike assembly in the FE-SEM images with a size less than 10 μm (Figure 6: YS-03). Under the compaction of overlying strata, many illite particles are curved or entangled, and some of them are even fractured (Figure 7c: TL-01, Figure 7d: HS-01). The EDS results suggest that illite is mainly composed of Si, Al, and O, as well as K, Mg, and Fe.
Chlorite displays leaflike or needle morphology (Figure 7e: TL-03, Figure 7f: HS-02) in the FE-SEM. The leaflike chlorites often gather into a mass nest, and fine channels are developed between the needle chlorites.

3.6. Clay-Related Pores

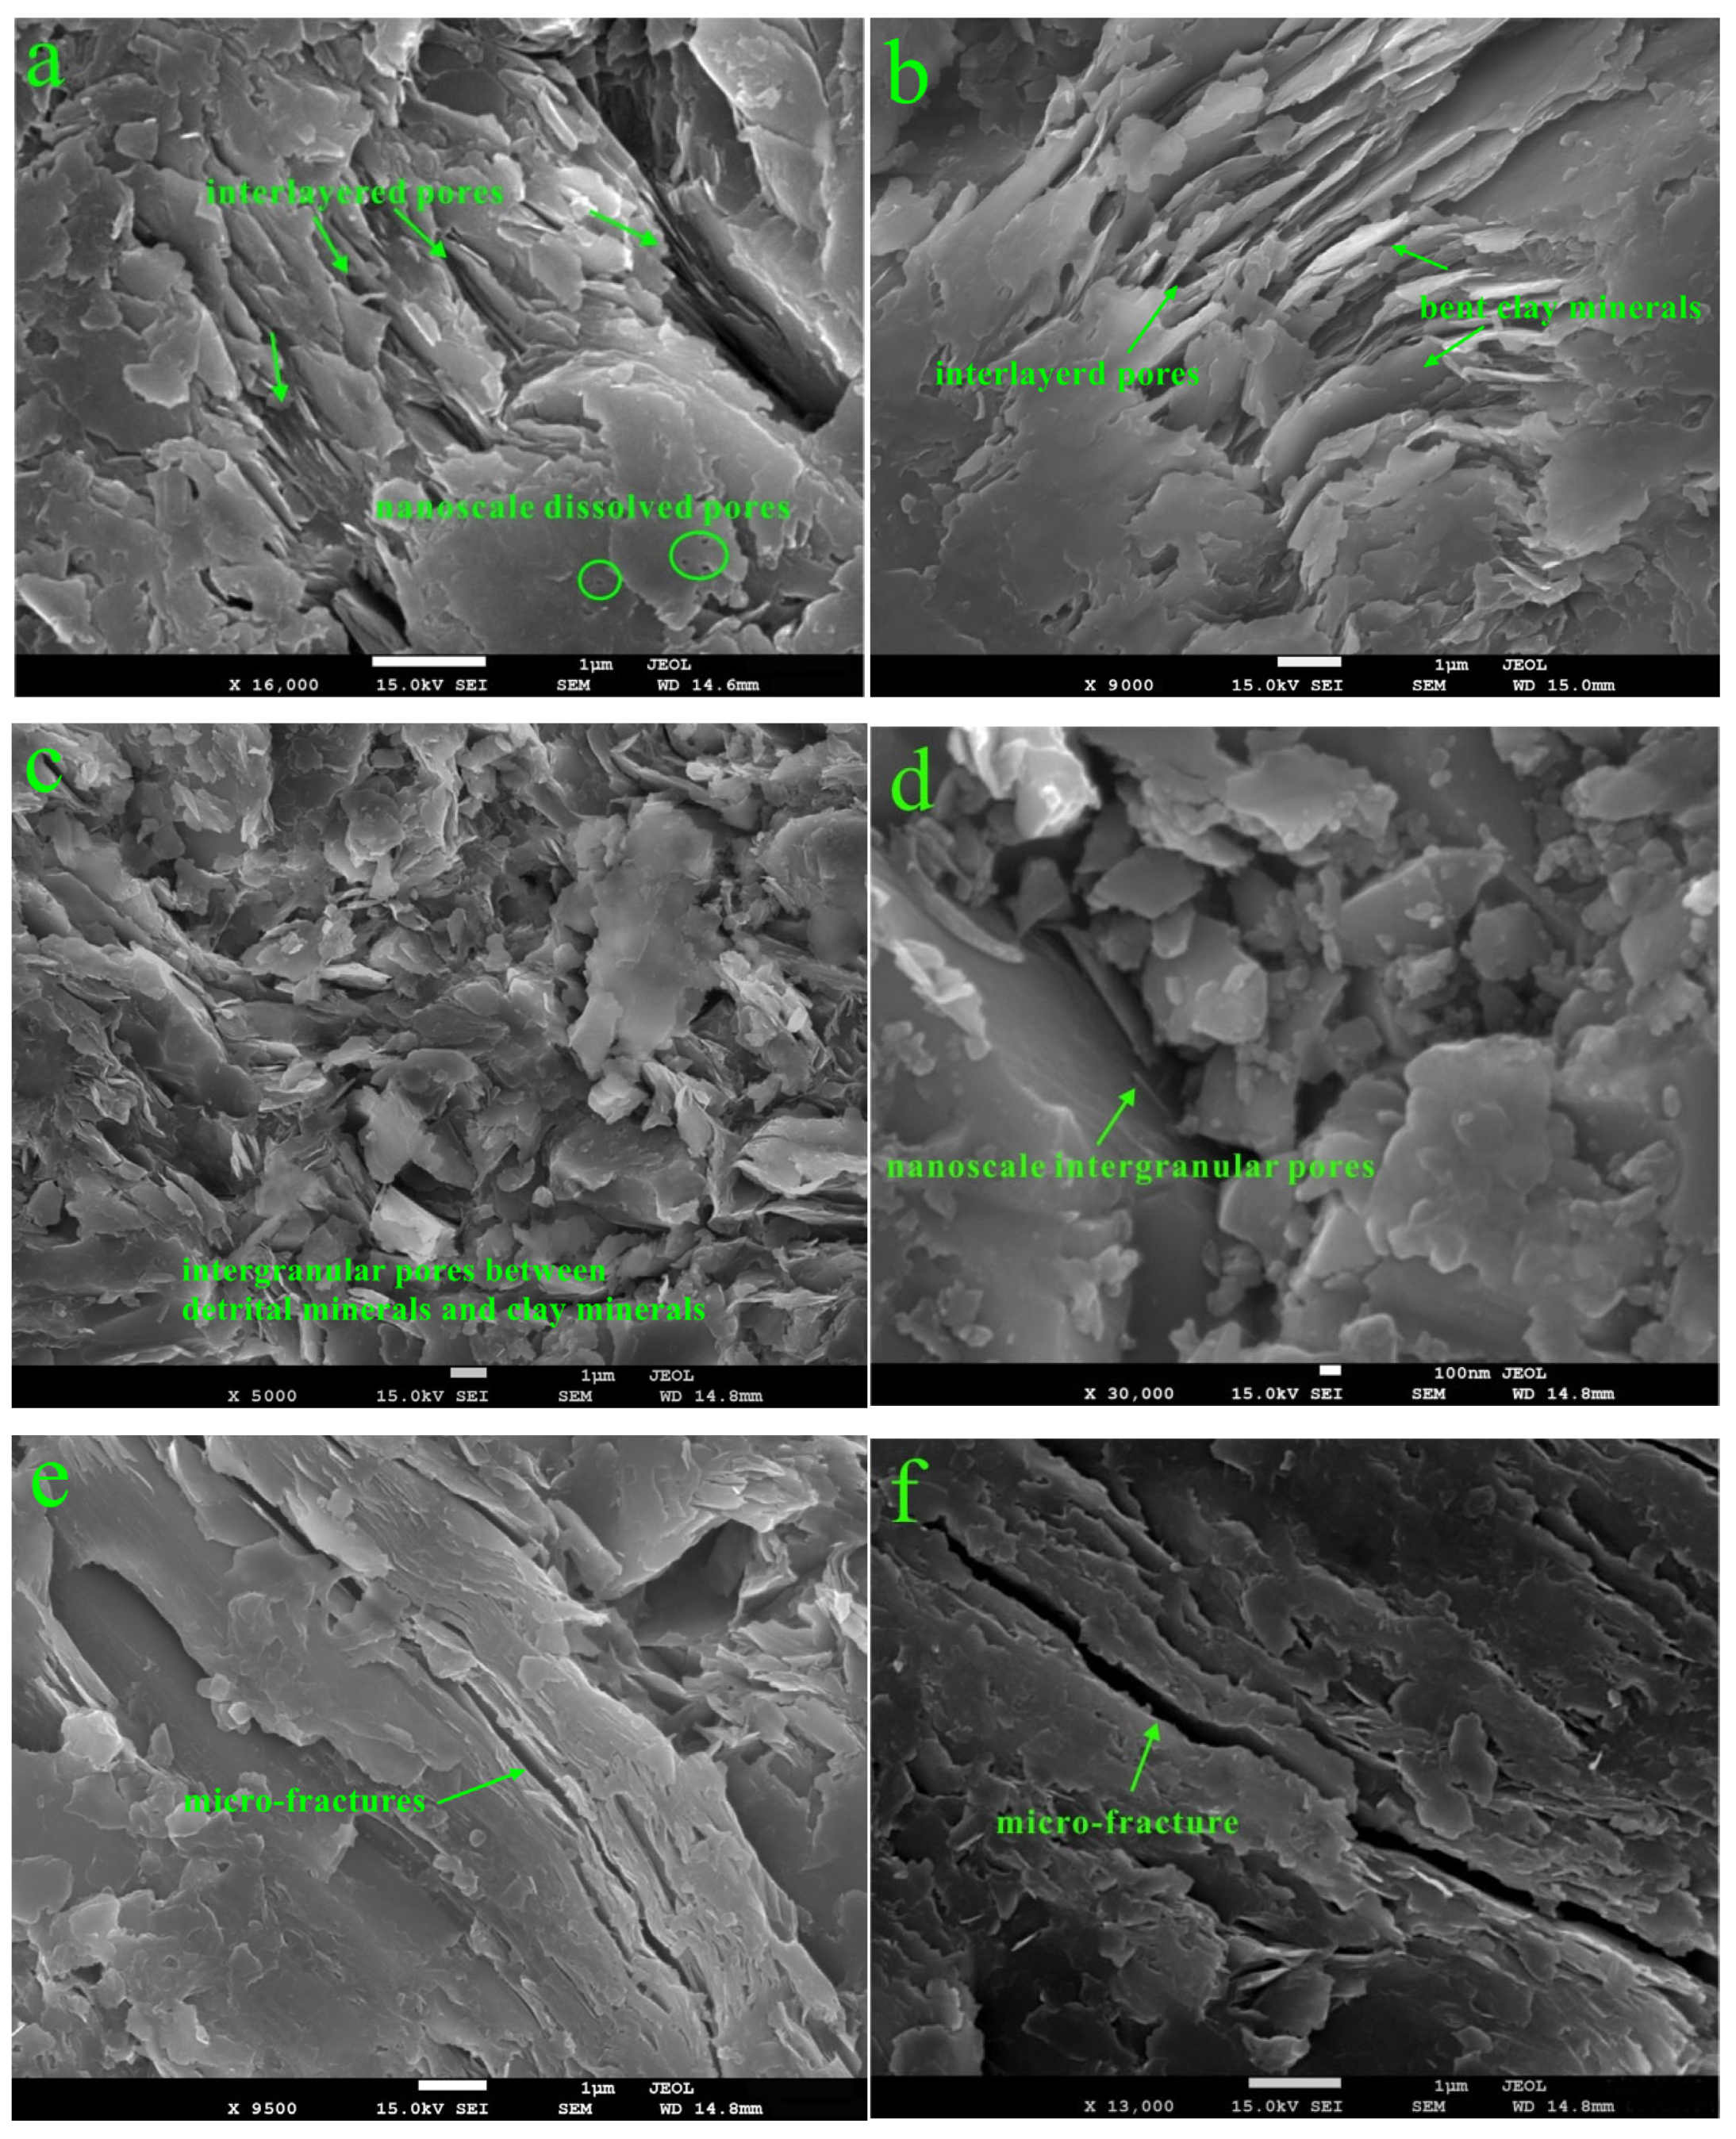
According to the pores’ morphological characteristics, clay-related pores can be divided into interlayered pores, intergranular pores, and microfractures (Figure 7 and Figure 8). The first two types of pores in TYS are widely distributed and present multiple morphologies. The interlayered pores are associated with the interlayered space between (001) crystal planes of clay minerals, taking on silt and shutter shapes (Figure 7a,b and Figure 8a,b: TL-02).
The irregular intergranular pores developed along grain boundaries in clay–clay minerals, clay–brittle minerals, or clay–organic matter (Figure 8c,d: YS-03, Figure 9a: HS-04, Figure 9b: TL-01). Dissolved pores are rare in clay minerals and most of them are nanoscale pores in this study (Figure 5a and Figure 8a). Although the edges of clay minerals could be corroded and altered by organic acid fluid, this isn’t enough for the mineral to develop many and large dissolved pores due to the limited content of OM in shale. Microfractures are also common pore types, commonly caused by the dehydration and contraction of clay minerals during diagenesis (Figure 7b and Figure 8e,f: HS-03, Figure 9e: HS-2).
The size of clay-related pores varies from a nanometer to micrometer scale. The interlayered pores between crystal cleavages are in nano-scale, generally ranging from 1 to 10 μm in length and from 1 to 100 nm in width (Figure 7a,b and Figure 8a,b). Limited by the mineral particles’ size, interparticle pores are in the micron-scale, varying from a few microns to tens of microns (Figure 7c,d, Figure 8c,d and Figure 9e,f: HS-04). With hundreds microns in length and less than 1 um in width, the shutter-shaped microfracture not only facilitates the connection of isolated pores but also provides a migration pathway for gas molecules. The observed dissolved pores are isolated, non-connecting pores in the range of tens of nanometers (Figure 8e,f).

4. Discussion

Affected by compaction, cementation, metasomatism, and dissolution, a series of changes have taken place in the particle morphology, relative spatial locations, and compositions of clay minerals, leading to an increase in the pore types and a decrease in the pore sizes in shales [41,42].

4.1. Effect of Mechanical Compaction on Clay-Related Pores

Clay minerals are the most abundant mineral in the TYS. The effects of compaction on clay minerals is significant because of the low strength, high plasticity, and high deformability of clay minerals. Therefore, the pore structure of shale is also greatly affected by compaction (Figure 9b).
At the early stage of diagenesis, the mutual positions of mineral particles are rearranged, and primary porosity is sharply reduced by the effects of compression. Fine clay minerals are squeezed into pores along with pore fluid, leading to a further reduction in pore sizes. The FE-SEM results show that the morphology of clay minerals is in the form of thin flakes or fibers (Figure 8), which gives them strong plasticity. Clay minerals are prone to swelling and losing their stability when encountering water. The ions on the charged surface of clay minerals form a charged layer with water molecules, resulting in a net charge on the clay minerals. When two charged clay minerals approach each other, the electrostatic force between them causes them to attract and aggregate together [43,44]. As depth and compression increases, clay minerals are deformed and bent under pressure. Due to differences in the sizes and shapes of clay particles, there are variations in their bending deformation, resulting in secondary pores between flaky clay minerals (Figure 9b–e). In addition to clay minerals, shale also contains brittle minerals such as quartz and pyrite, which could generate intergranular pores with various shapes and sizes during the diagenetic process. Quartz particles have relatively smooth surfaces, while the surfaces of clay minerals, pyrite, and other particles in shale have electrical properties, such as clay minerals with negative charges and pyrite particles with positive charges. This leads to clay minerals and pyrite being prone to adsorption onto quartz and forming inter-particle pores. Under overlying pressure, brittle minerals such as quartz and pyrite play a rigid supporting role, partially preventing clay minerals from being fully compacted (Figure 8c,d, Figure 9a,f and Figure S6), and the pores space is retained.
It can be concluded from Figure 8 and Figure 9 that mechanical compaction has a significant impact on the microstructure of clay minerals. Under mechanical compaction, the layered structure of clay minerals is destroyed, showing the arranged lamellar shape. In its original state, each layered structure in clay minerals is filled with ions, water molecules, and other substances. These interactions maintain the stability of the layered structure to varying degrees. However, under pressure, the electrostatic attraction and van der Waals force between layers are broken or changed, leading to the deformation or destruction of the layered structure, which makes clay mineral particles generate thin and flaky structures (Figure 7a,b). Furthermore, during the compaction process, the voids between clay mineral particles are gradually reduced, resulting in an increased contact area between particles and the development of frictional and adhesive forces. These forces cause the clay particles to rearrange and exhibit different bending forms in different directions (Figure 8a,b and Figure 9b–e). In addition, under compaction, the voids and pores between clay particles are squeezed and filled, resulting in a decrease or disappearance of primary pores. However, with further compaction, the interaction forces between clay particles increase, causing the deformation and even destruction of clay minerals, which leads to the generation of secondary pores and fractures (Figure 8e,f and Figure 9d,e).
Affected by particle size, shape, and location and contact-relation with other minerals, clay minerals take on diverse properties under overburden pressure, including stable structure, bending deformation (Figure 7b), fracture, etc.
The morphology and contact relations of clay mineral particles are key factors in determining the types of clay-related pores in shale. The contact-relations between flaky clay minerals are chiefly face–edge or face–face contact and less commonly edge–edge contact, resulting in the diverse slitlike and irregular pores. For irregular mineral particles, the contact relations are dominated by point-to-point contact and point-to-line contact.
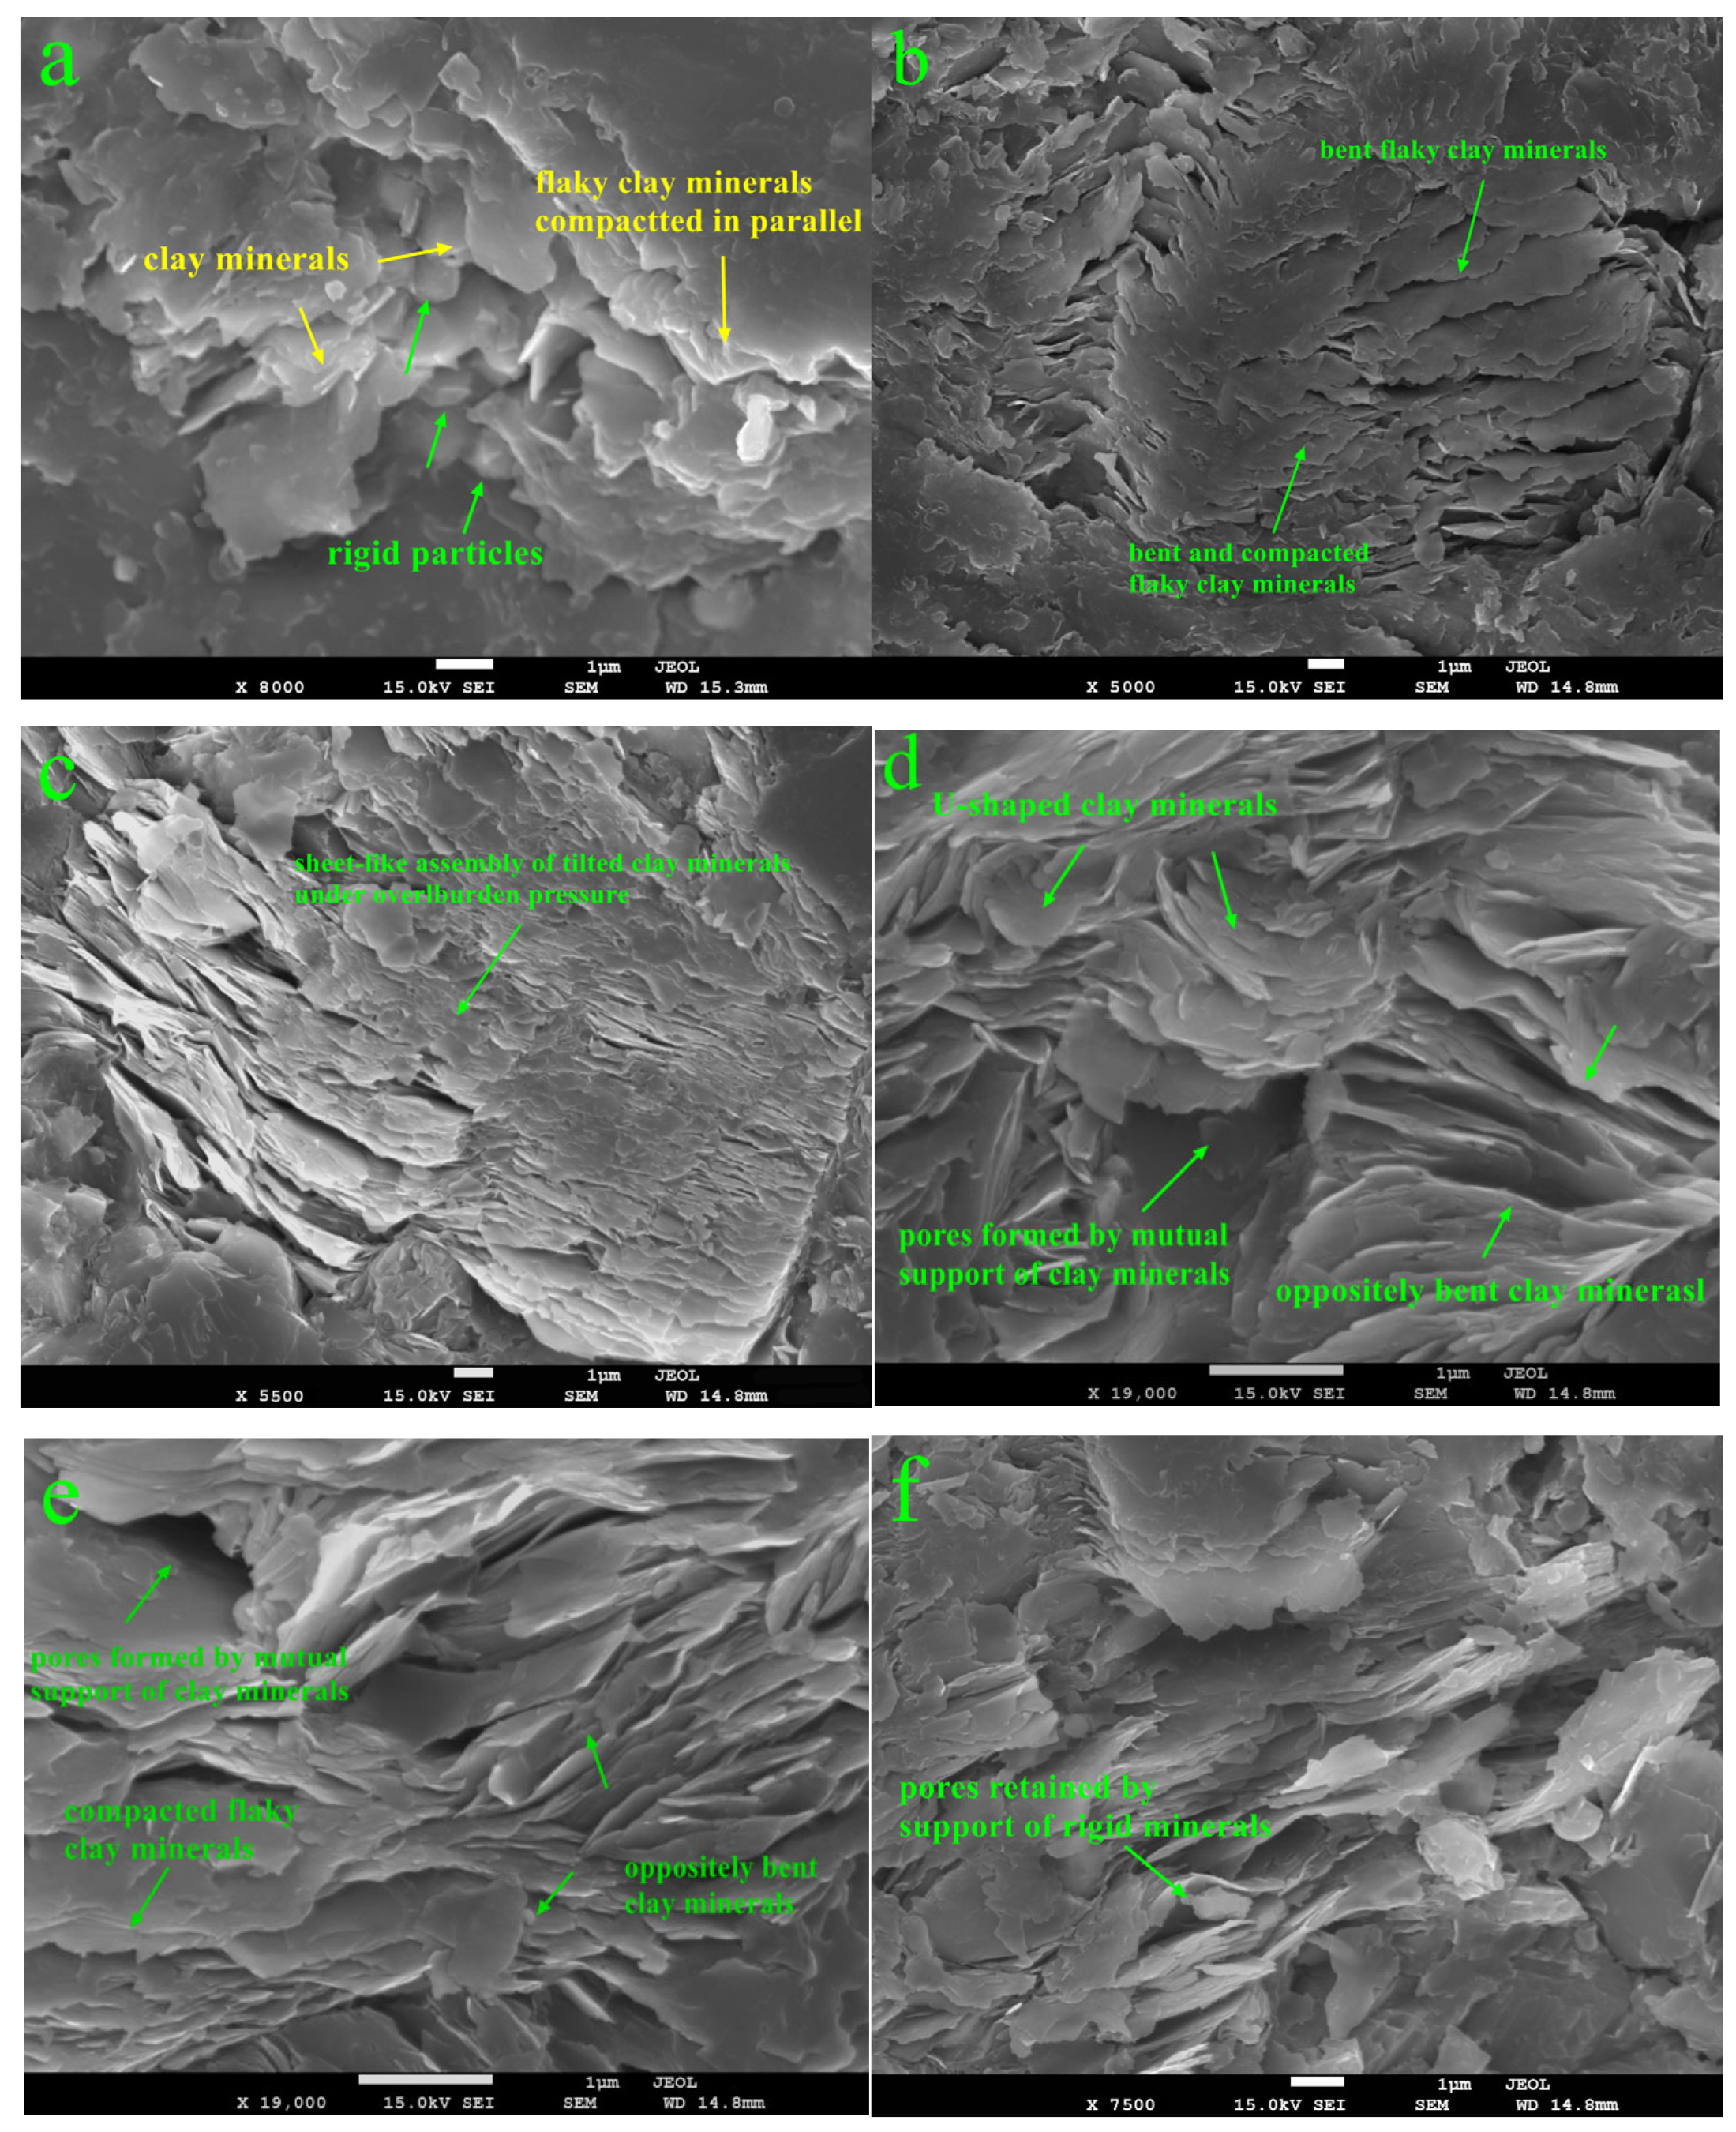
According to the results of the FE-SEM analysis and previous studies, the morphology and arrangement of clay particles with the effects of compaction in TYS are summarized in Figure 10 [17].
It is a common occurrence in the TYS samples that flake clay minerals are superimposed and compacted in parallel (Figure 10a), which is one of the main reasons for the low porosity and compactness of shale. In some cases, sheetlike clay minerals are bent and compacted under the overburden pressure (Figure 10b). In the early stages of deposition, many clay minerals are probably deformed, and the layer structures are tilted in FE-SEM images (Figure 10c). A portion of clay minerals are supported by brittle mineral particles (such as quartz, siderite, and pyrite), forming a stable structure with intergranular pores (Figure 10e). Probably due to opposite pressure from both sides, the vertically arranged clay minerals prevent the compaction or deformation of layered structures (Figure 10f). The deformation or even fracture of micron-scale clay minerals is more likely to create slit-shaped intergranular pores or microfractures (Figure 10f), which could provide enough space and channels for gas molecule adsorption and migration. Under the effects of overlying pressure, some flaky clay minerals are pressed into a U-shape (Figure 10h), and some are bent on opposite sides (Figure 10d). Some clay mineral particles intersect and support each other, forming a stable structure (Figure 10g) that prevents the complete compaction of shale, and some original pores are retained.
Clay minerals vary in their microstructure, leading to a strong heterogeneity of shale in the physical properties of the reservoir. Some pores present in clay are beneficial and improve the permeability of shale, such as silt porosity, microfractures, and microchannels, which can connect the interparticle pores and effectively improve the gas migration capacity in a regional area. Shale shows high permeability anisotropy [45]. Horizontal permeability is more common than vertical. The principal reason for this is that microfractures related to clay minerals are commonly subparallel with the bedding plane, which provides significant permeability pathways in the horizontal direction. However, multilayer flaky clay minerals are superimposed layer by layer in the vertical direction, resulting in poor seepage channels and low permeability.

4.2. The Role of Clay Mineral Cementation in Pore Development

Cementation plays an important role in the transformation of sediments into sedimentary rocks. During diagenesis, minerals precipitate out of the pore solution, forming loose sediment, and then become cemented and solidified [46]. Mudstone exhibits a high mineral content and small particle size. Being a terrigenous clastic rock, cementation is needed in the diagenetic process of mudstone as well. In sandstone, clay minerals are much smaller than sand particles, which can be easily distinguished from clastic minerals. In shale, clay minerals not only partially play the role of clastic particles, but also act as cement. With the development of diagenesis, the recrystallization and transformation of clay minerals increase, leading to a more complex pore structure in shale [5,40,41].
As evidenced by the above results, most samples only contain a small quantity of chlorite, and therefore cementation of chlorite has a very limited effect on the porosity of the TYS samples. The effects of kaolinite and illite on the porous structures of the TYS samples is discussed further.

4.2.1. Kaolinite

Kaolinite is commonly formed from the weathering or hydrothermal alteration of alumina-silicate minerals, which are mainly feldspar minerals. It is more likely, under acidic conditions, that the cations of feldspar, such as Na+, Mg, K, etc., are leached away during the weathering and alteration process. The sediments of TYS are rich in SiO2 and Al+, and their depositional environment has a weakly acidic reducing condition with low pH and high Eh, which is favorable for precipitation and the preservation of kaolinite. In this study, book-shaped and accordion-shaped kaolinite particles are found packed in intergranular pores or organic matter pores (Figure 7a), indicating they are authigenic mineral that is formed during diagenesis.
The cementation of kaolinite has multiple effects on shale pore development. On one hand, kaolinite precipitates from the pores and forms siliceous cementation, filling the primary intergranular pores and making the pore structure more complex. As the primary pore volume of shale decreases, the shales became denser. On the other hand, recrystallization produces nanoscale interlayered pores, and interlayered voids are developed in the kaolinite crystals, which not only can provide more space for the adsorption of methane gas molecules but can also prevent intergranular pores from being fully compacted. As a summary, the cementation of kaolinite has a negative effect on the development of shale pores.

4.2.2. Illite

The XRD results suggests that a large part of illite has a 1Md structure, which is evidence that illite results from the diagenetical conversion of other minerals. As mentioned above, K+ is comparatively abundant in TYS. It can provide the material source for the formation of authigenic illite. Illite is produced by the dehydration of montmorillonite under the combined action of pressure and temperature [38,39]. In the late period of diagenesis, free cation content increases, changing the pH value of the pore solution. Kaolinite begins to convert into illite via recrystallization [38,42], which commonly presents as thin sheets or curved feathery filling in pores and makes the intergranular pore volume smaller.

5. Conclusions

(1)
Clay minerals are dominant in the compositions of TYS. They mainly consist of kaolinite, illite, and chlorite. Most kaolinite is detrital in origin with a low crystallinity and low degree of ordering, while most illite is formed from diagenesis with 1Md polytype.
(2)
An XRF analysis suggests that shale is probably dominated by the strong chemical weathering of first-cycle deposits.
(3)
A considerable number of multisized, micro/nano pores are developed in clay minerals. Pores associated with clay minerals in TYS can be divided into interlayered pores, intergranular pores, and microfractures. Controlled by the crystalline structure and particle morphology of minerals, clay-related pores mostly present in a slitlike or irregular shape.
(4)
Mechanical compaction causes clay minerals to be arranged into multiple morphologies, including parallel, bent, tilted, and mutually supporting structures, etc., which is a key factor for the high permeability anisotropy of shale.
(5)
Compaction has a decisive effect on the pore structure and morphology of clay-related pores. Additionally, it is also the main reason for the strong heterogeneity, low porosity, and high permeability anisotropy of shale. The cementation of clay minerals has a limited influence on pore structure.

Supplementary Materials

The following supporting information can be downloaded at: https://www.mdpi.com/article/10.3390/en16093804/s1, Figure S1: Stratigraphic column of Taiyuan formation in study area and position of samples, (a) Well TL-01; (b) YS-01; (c) Well HS-01; Figure S2: Elemental concentrations of the average of samples VS. those of the PAAS (Taylor and McLennan 1985); Figure S3: FTIR standard spectra of main minerals in the TYS; Figure S4: EDS surface scanning images of TYS samples; Figure S5: Kaolinite coexist with organic matters and contains K element; Figure S6: Brittle minerals as rigid particles in the pores.

Author Contributions

Formal analysis, Y.Z. (Yuqiong Zhao); Investigation, S.K.; Data curation, M.A.; Writing—original draft, K.L.; Writing—review & editing, Y.L.; Supervision, Y.Z. (Yongfa Zhang). All authors have read and agreed to the published version of the manuscript.

Funding

This study is financially supported by the Shanxi Province Science Foundation for General Projects (Grant No. 20210302123426); opening Fund of Key Laboratory of Coal Science and Technology (Taiyuan University of Technology), Ministry of Education (Grant No. MKX202104); the Special Subsidy for Postdoctoral of Shanxi Province. All the editors and anonymous reviewers are gratefully acknowledged.

Data Availability Statement

Data are contained within the article.

Conflicts of Interest

The authors declare no conflict of interest.

References

  1. Xu, L.W.; Yang, K.; Wei, H.; Liu, L.; Li, X.; Chen, L.; Xu, T.; Wang, X. Full-Scale Pore Structure Characteristics and the Main Controlling Factors of Mesoproterozoic Xiamaling Shale in Zhangjiakou, Hebei, China. Nanomaterials 2021, 11, 527. [Google Scholar] [CrossRef] [PubMed]
  2. Gao, Z.; Fan, Y.; Xuan, Q.; Zheng, G. A review of shale pore structure evolution characteristics with increasing thermal maturities. Adv. Geo-Energy Res. 2020, 4, 247–259. [Google Scholar] [CrossRef]
  3. Ross, D.J.K.; Marc Bustin, R. The importance of shale composition and pore structure upon gas storage potential of shale gas reservoirs. Mar. Pet. Geol. 2009, 26, 916–927. [Google Scholar] [CrossRef]
  4. Cullers, R.L.; Podkovyrov, V.N. The source and origin of terrigenous sedimentary rocks in the Mesoproterozoic Ui group, southeastern Russia. Precambr. Res. 2002, 117, 157–183. [Google Scholar] [CrossRef]
  5. Jiang, S. Clay Minerals from the Perspective of Oil and Gas Exploration. In Clay Minerals in Nature—Their Characterization, Modification and Application; BoD—Books on Demand: Norderstedt, Germany, 2012. [Google Scholar]
  6. Chen, S.; Han, Y.; Fu, C.; Zhang, H.; Zhu, Y.; Zuo, Z. Micro and nano-size pores of clay minerals in shale reservoirs: Implication for the accumulation of shale gas. Sediment. Geol. 2016, 342, 180–190. [Google Scholar] [CrossRef]
  7. Han, M.; Han, C.; Han, Z.; Song, Z.; Zhong, W.; Li, H.; Xu, W. Mineral compositional controls on the porosity of black shales from the Wufeng and Longmaxi Formations (Southern Sichuan Basin and its surroundings) and insights into shale diagenesis. Energy Explor. Exploit. 2018, 36, 665–685. [Google Scholar] [CrossRef]
  8. Romero-Sarmiento, M.-F.; Rouzaud, J.-N.; Bernard, S.; Deldicque, D.; Thomas, M.; Littke, R. Evolution of Barnett Shale organic carbon structure and nanostructure with increasing maturation. Org. Geochem. 2014, 71, 7–16. [Google Scholar] [CrossRef]
  9. Wang, G.; Ju, Y. Organic shale micropore and mesopore structure characterization by ultra-low pressure N2 physisorption: Experimental procedure and interpretation model. J. Nat. Gas Sci. Eng. 2015, 27, 452–465. [Google Scholar] [CrossRef]
  10. Wang, Y.; Zhu, Y.; Liu, S.; Zhang, R. Pore characterization and its impact on methane adsorption capacity for organic-rich marine shales. Fuel 2016, 181, 227–237. [Google Scholar] [CrossRef]
  11. Hackley, P.C.; Jubb, A.M.; McAleer, R.J.; Valentine, B.J.; Birdwell, J.E. A review of spatially resolved techniques and applications of organic petrography in shale petroleum systems. Int. J. Coal Geol. 2021, 241, 103745. [Google Scholar] [CrossRef]
  12. Pan, L.; Xiao, X.; Tian, H.; Zhou, Q.; Chen, J.; Li, T.; Wei, Q. A preliminary study on the characterization and controlling factors of porosity and pore structure of the Permian shales in Lower Yangtze region, Eastern China. Int. J. Coal Geol. 2015, 146, 68–78. [Google Scholar] [CrossRef]
  13. Zhang, M.; Fu, X.; Zhang, Q.; Cheng, W. Research on the organic geochemical and mineral composition properties and its influence on pore structure of coal-measure shales in Yushe-Wuxiang Block, South Central Qinshui Basin, China. J. Pet. Sci. Eng. 2019, 173, 1065–1079. [Google Scholar] [CrossRef]
  14. Mukasa-Tebandeke, I.Z.; Ssebuwufu, P.J.M.; Nyanzi, S.A.; Schumann, A.; Nyakairu, G.W.A.; Ntale, M.; Lugolobi, F. The Elemental, Mineralogical, IR, DTA and XRD Analyses Characterized Clays and Clay Minerals of Central and Eastern Uganda. Adv. Mater. Phys. Chem. 2015, 5, 67–86. [Google Scholar] [CrossRef]
  15. Li, K.; Kong, S.; Xia, P.; Wang, X. Microstructural characterisation of organic matter pores in coal-measure shale. Adv. Geo-Energy Res. 2020, 4, 372–391. [Google Scholar] [CrossRef]
  16. Peltonen, C.; Marcussen, Ø.; Bjørlykke, K.; Jahren, J. Clay mineral diagenesis and quartz cementation in mudstones: The effects of smectite to illite reaction on rock properties. Mar. Pet. Geol. 2009, 26, 887–898. [Google Scholar] [CrossRef]
  17. Ural, N. The significance of scanning electron microscopy (SEM) analysis on the microstructure of improved clay: An overview. Open Geosci. 2021, 13, 197–218. [Google Scholar] [CrossRef]
  18. Sun, Y.; Ju, Y.; Zhou, W.; Qiao, P.; Tao, L.; Xiao, L. Nanoscale pore and crack evolution in shear thin layers of shales and the shale gas reservoir effect. Adv. Geo-Energy Res. 2022, 6, 221–229. [Google Scholar] [CrossRef]
  19. Xiong, J.; Liu, X.; Liang, L.; Wei, X.; Xu, P. Investigation of the factors influencing methane adsorption on illite. Energy Sci. Eng. 2019, 7, 3317–3331. [Google Scholar] [CrossRef]
  20. Zou, C.; Dong, D.; Wang, Y.; Li, X.; Huang, J.; Wang, S.; Guan, Q.; Zhang, C.; Wang, H.; Liu, H.; et al. Shale gas in China: Characteristics, challenges and prospects (I). Pet. Explor. Dev. 2015, 42, 753–767. [Google Scholar] [CrossRef]
  21. Zou, C.N.; Yang, Z.; Huang, S.P.; Ma, F.; Sun, Q.P.; Li, F.H.; Pan, S.Q.; Tian, W.G. Resource types, formation, distribution and prospects of coal-measure gas. Pet. Explor. Dev. 2019, 46, 451–462. [Google Scholar] [CrossRef]
  22. Li, K.J.; Zeng, F.G.; Cai, J.C.; Sheng, G.L.; Xia, P.; Zhang, K. Fractal Characteristics of Pores in Taiyuan Formation Shale from Hedong Coal Field, China. Fractals 2018, 26, 1840006. [Google Scholar] [CrossRef]
  23. Hazra, B.; Varma, A.K.; Bandopadhyay, A.K.; Chakravarty, S.; Buragohain, J.; Samad, S.K.; Prasad, A.K. FTIR, XRF, XRD and SEM characteristics of Permian shales, India. J. Nat. Gas Sci. Eng. 2016, 32, 239–255. [Google Scholar] [CrossRef]
  24. Liang, J.; Huang, W.; Wang, H.; Blum, M.J.; Chen, J.; Wei, X.; Yang, G. Organic geochemical and petrophysical characteristics of transitional coal-measure shale gas reservoirs and their relationships with sedimentary environments: A case study from the Carboniferous-Permian Qinshui Basin, China. J. Pet. Sci. Eng. 2020, 184, 106510. [Google Scholar] [CrossRef]
  25. Yin, L.; Guo, S. Full-Sized Pore Structure and Fractal Characteristics of Marine-Continental Transitional Shale: A Case Study in Qinshui Basin, North China. Acta Geol. Sin. Engl. Ed. 2019, 93, 675–691. [Google Scholar] [CrossRef]
  26. Shao, L.; Xiao, Z.; Lu, J.; He, Z.; Wang, H.; Zhang, P. Permo-Carboniferous coal measures in the Qinshui basin: Lithofacies paleogeography and its control on coal accumulation. Front. Earth Sci. China 2007, 1, 106–115. [Google Scholar] [CrossRef]
  27. Chinese Oil and Gas Industry Standard, SY/T 5368-2016; Identification of Rock Flakes. National Energy Administration: Beijing, China, 2016.
  28. Weaver, C.E. A Discussion on the Origin of Clay Minerals in Sedimentary Rocks. Clays Clay Miner. 1956, 5, 159–173. [Google Scholar] [CrossRef]
  29. Aparicio, P.; Emilio, G. Mineralogical Interference on Kaolinite Crystallinity Index Measurements. Clays Clay Miner. 1999, 47, 12–27. [Google Scholar] [CrossRef]
  30. Liu, Q.F.; Liang, X.H.; Zhang, P.F. Crystallinity difference for various origin of kaolinites in coal measures. J. China Coal Soc. 2000, 25, 576–580. [Google Scholar]
  31. Grathoff, G.H.; Moore, D.M. Illite Polytype Quantification Using Wildfire© Calculated X-ray Diffraction Patterns. Clays Clay Miner. 1996, 44, 835–842. [Google Scholar] [CrossRef]
  32. Taylor, S.R.; McLennan, S.M. The Continental Crust: Its Composition and Evolution. Blackwell 1985, 122, 349. [Google Scholar]
  33. Li, B.; Zhuang, X.; Liu, X.; Wu, C.; Zhou, J.; Ma, X. Mineralogical and geochemical composition of Middle Permian Lucaogou Formation in the southern Junggar Basin, China: Implications for paleoenvironment, provenance, and tectonic setting. Arab. J. Geosci. 2016, 9, 1–16. [Google Scholar] [CrossRef]
  34. Cox, R.; Lowe, D.R.; Cullers, R.L. The influence of sediment recycling and basement composition on evolution of mudrock chemistry in the southwestern United States. Geochim. Cosmochim. Acta 1995, 59, 2919–2940. [Google Scholar] [CrossRef]
  35. Cullers, R.L.; Podkovyrov, V.N. Geochemistry of the Mesoproterozoic Lakhanda shales in southeastern Yakutia, Russia: Implications for mineralogical and provenance control, and recycling. Precambr. Res. 2000, 104, 77–93. [Google Scholar] [CrossRef]
  36. Hayashi, K.I.; Fujisawa, H.; Holland, H.D.; Ohmoto, H. Geochemistry of approximately 1.9 Ga sedimentary rocks from northeastern Labrador, Canada. Geochim. Cosmochim. Acta 1997, 61, 4115–4137. [Google Scholar] [CrossRef]
  37. Fedo, C.M.; Wayne Nesbitt, H.; Young, G.M. Unraveling the effects of potassium metasomatism in sedimentary rocks and paleosols, with implications for paleoweathering conditions and provenance. Geology 1995, 23, 921–924. [Google Scholar] [CrossRef]
  38. Balan, E.; Lazzeri, M.; Saitta, A.M.; Allard, T.; Fuchs, Y.; Mauri, F. First-principles study of OH-stretching modes in kaolinite, dickite, and nacrite. Am. Mineral. 2005, 90, 50–60. [Google Scholar] [CrossRef]
  39. Khang, V.C.; Korovkin, M.V.; Ananyeva, L.G. Identification of clay minerals in reservoir rocks by FTIR spectroscopy. IOP Conf. Ser. Earth Environ. Sci. 2016, 43, 012004. [Google Scholar] [CrossRef]
  40. Chmielová, M.; Weiss, Z. Determination of structural disorder degree using an XRD profile fitting procedure: Application to Czech kaolins. Appl. Clay Sci. 2002, 22, 65–74. [Google Scholar] [CrossRef]
  41. Jiang, S.; Wang, H.; Cai, D.; Guo, H.; Zhu, G.; Zhu, X.; Hu, X. The Secondary Porosity and Permeability Characteristics of Tertiary Strata and Their Origins, Liaodong Bay Basin, China. Energy Explor. Exploit. 2010, 28, 207–222. [Google Scholar] [CrossRef]
  42. Dou, W.; Liu, L.; Wu, K.; Xu, Z.; Feng, X. Origin and significance of secondary porosity: A case study of upper Triassic tight sandstones of Yanchang Formation in Ordos basin, China. J. Pet. Sci. Eng. 2017, 149, 485–496. [Google Scholar] [CrossRef]
  43. Sposito, G. The Chemistry of Soils, 3rd ed.; Oxford University Press: Oxford, UK, 2016; pp. 96–104. [Google Scholar]
  44. Xiong, J.; Tang, J.; Zhou, X.; Liu, X.; Liang, L.; Hou, L. Molecular Dynamics Simulation and Experimental Studies of the Wettability Behaviors of Shales. Energy Fuels 2022, 36, 3526–3538. [Google Scholar] [CrossRef]
  45. Voltolini, M.; Wenk, H.R.; Mondol, N.H.; Bjørlykke, K.O.; Jahren, J.J.G. Anisotropy of experimentally compressed kaolinite-illite-quartz mixtures. Geophysics 2009, 74, D13–D23. [Google Scholar] [CrossRef]
  46. Daniels, E.J.; Altaner, S.P. Clay mineral authigenesis in coal and shale from the anthracite region, Pennsylvania. Am. Mineral. 1990, 75, 825–839. [Google Scholar]
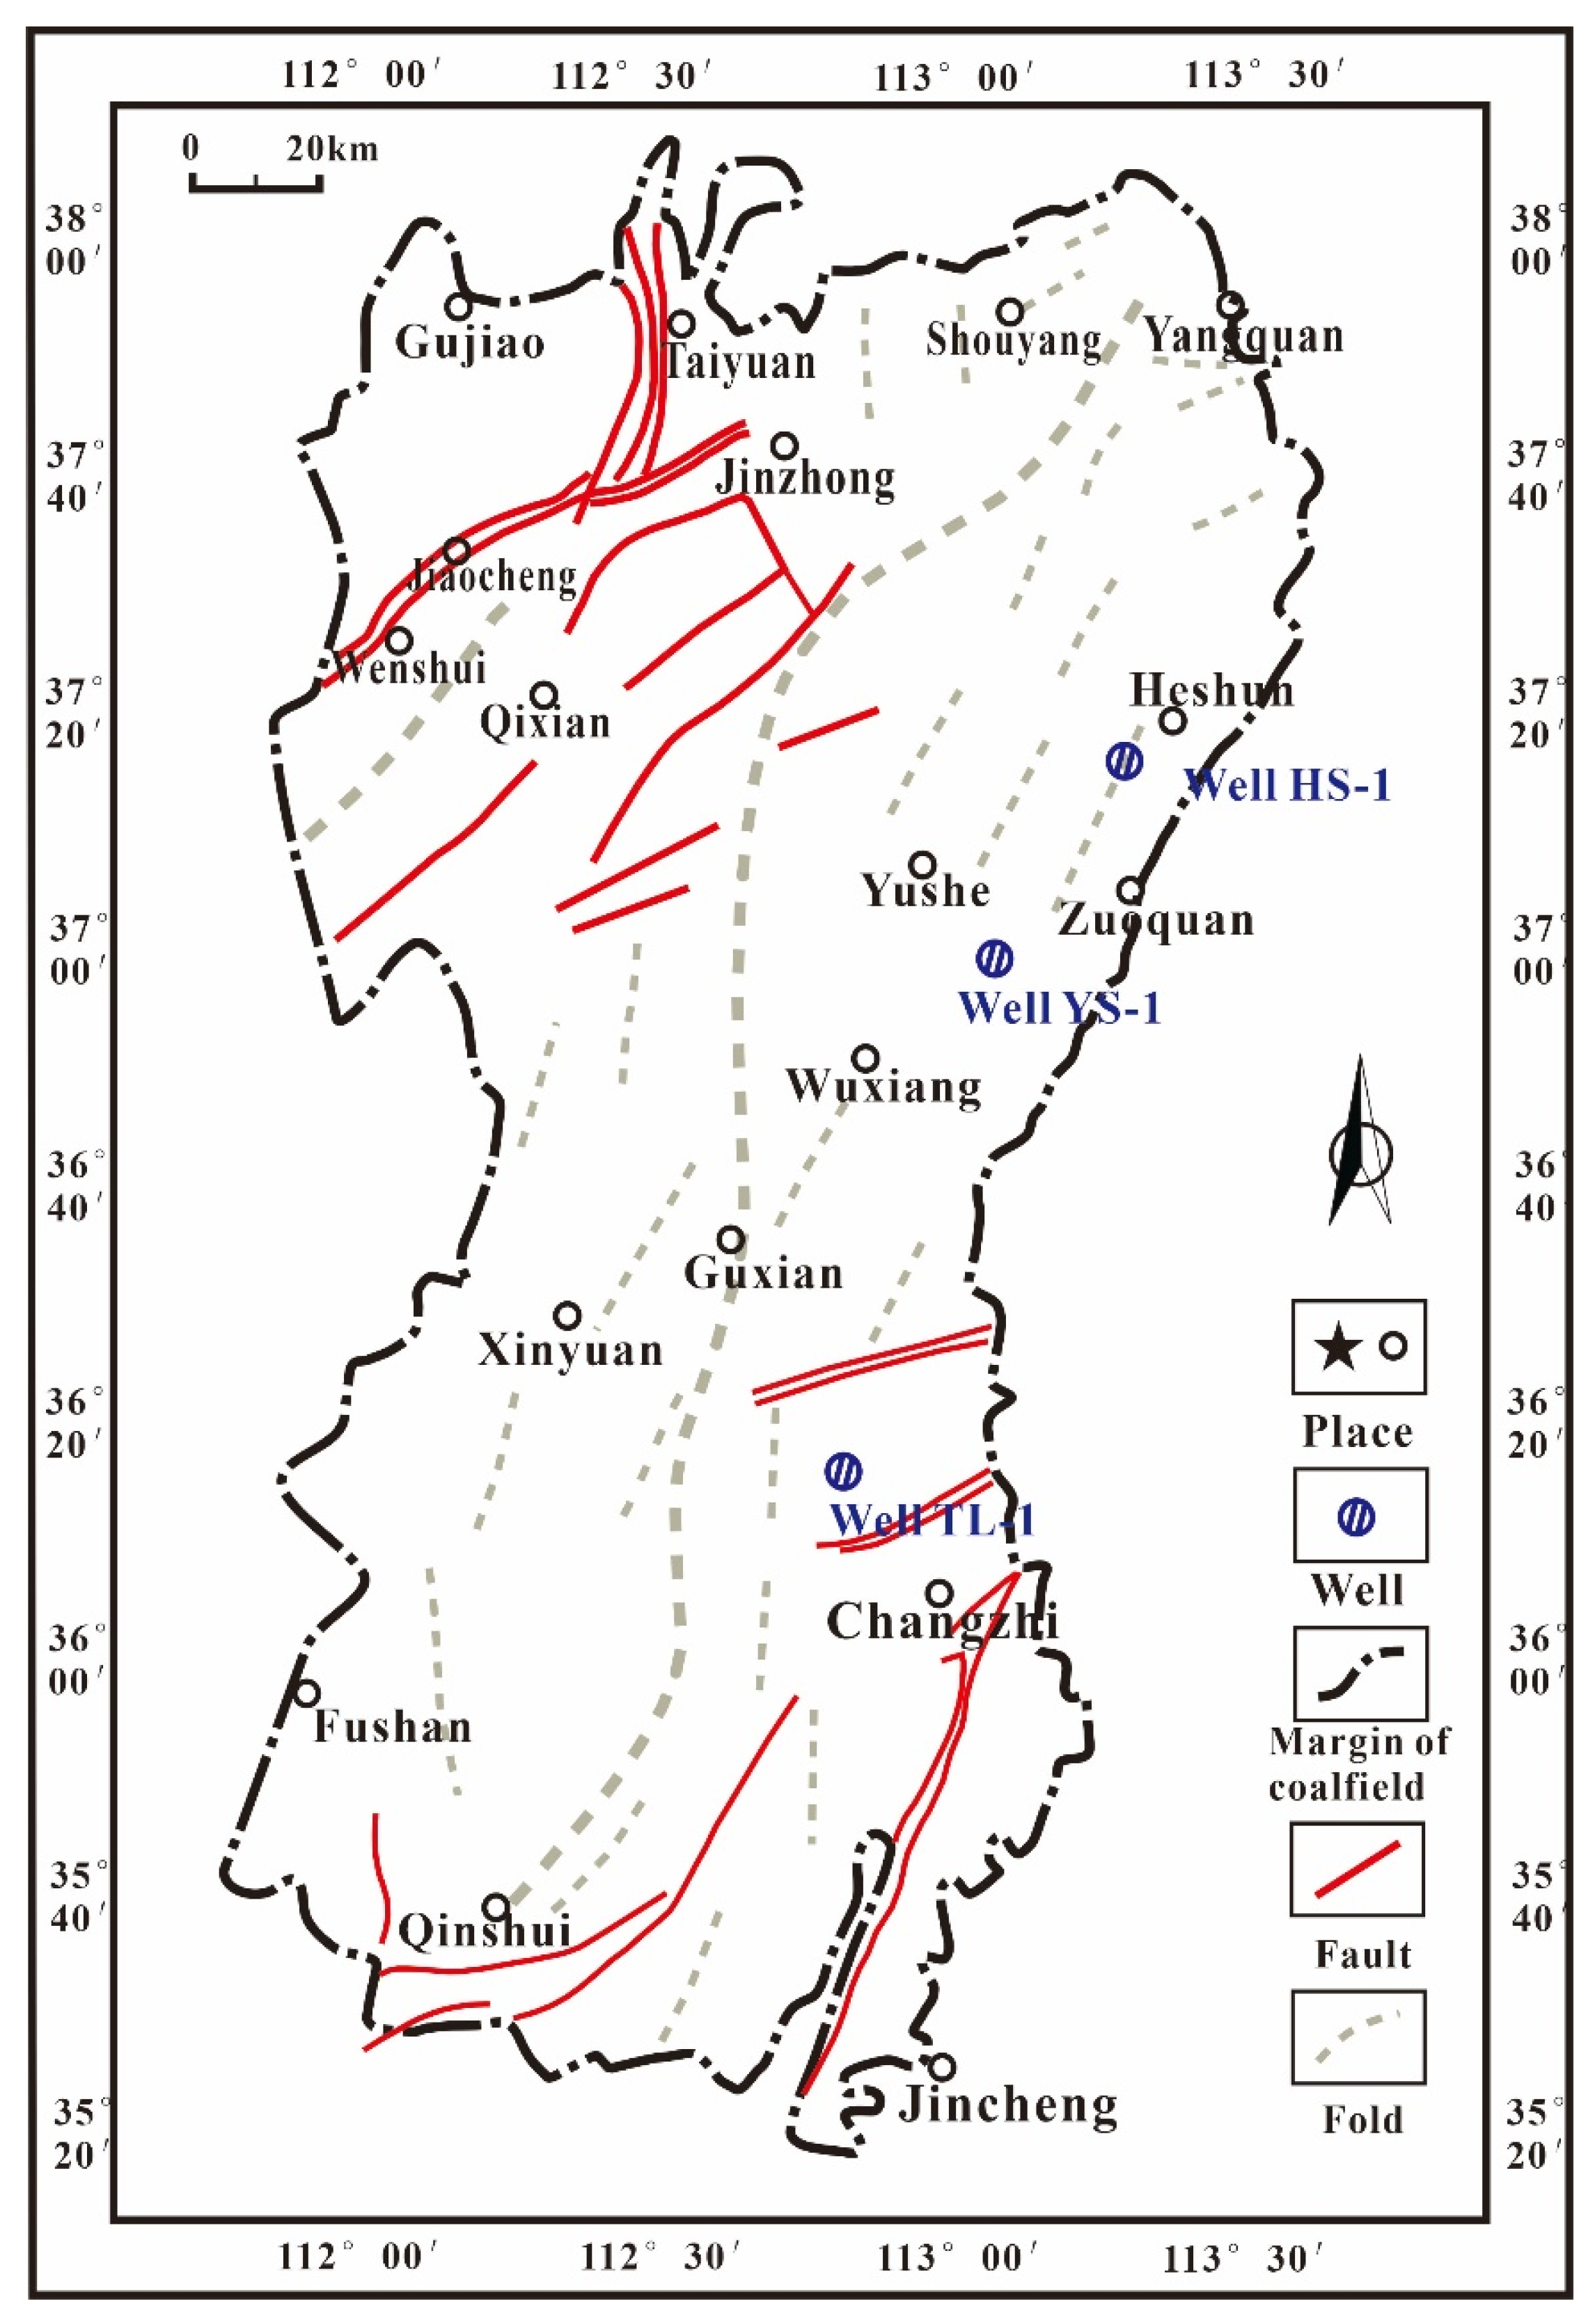
Figure 1. Location of study area and wells.
Energies 16 03804 g001
Figure 2. XRD spectrums of TYS samples. I—illite, K—kaolinite, Q—quartz.
Energies 16 03804 g002
Figure 3. FTIR spectra of TYS samples: I—illite, K—kaolinite, Q—quartz.
Energies 16 03804 g003
Figure 4. Images of thin section for TYS sample: (a,b) mudstones (TL-01); (c) silty mudstones (HS-01); (d) silt–sand mudstone (TL-04); and (e,f) pyrite rich sample (HS-04).
Energies 16 03804 g004
Figure 5. FE-SEM-EDS surface-scanning images of kaolinite (TL-03): (a): kaolinite in the FE-SEM images; (b) EDS elemental distribution map of kaolinite.
Energies 16 03804 g005
Figure 6. FE-SEM-EDS surface-scanning images of illite (YS-03): (a): illite in the FE-SEM images; (b) EDS elemental distribution map of illite.
Energies 16 03804 g006aEnergies 16 03804 g006b
Figure 7. Clay minerals in FE-SEM images: (a,b) kaolinite ((a): TL-02; (b): YS-02); (c,d) illite ((c): TL-01; (d): HS-01); and (e,f) chlorite ((e): TL-03; (f): HS-02).
Energies 16 03804 g007
Figure 8. Pore structures in clay minerals. (a,b) Interlayered pores in flaky clay minerals (TL-02); (c,d) intergranular pores between detrital minerals and clay minerals (YS-01); (e,f) microfractures in clay minerals (HS-03).
Energies 16 03804 g008
Figure 9. Morphology and arrangement of clay minerals by compaction in FE-SEM images: (a,f): HS-04; (b): TL-01; (c): YS-02; and (d): YS-03; (e): HS-2.
Energies 16 03804 g009
Figure 10. Different morphology and arrangement of clay particles: (a) clay minerals in parallel; (b) bent clay minerals; (c) tilted clay mineral; (d) inversely bent clay minerals; (e) supported by rigid particles; (f) deformed clay structure; (g) stable structure by mutual support of clay minerals; and (h) U-shaped clay minerals.
Energies 16 03804 g010
Table 1. XRD results of TYS samples.
SamplesQuartz
(%)
Pyrite
(%)
Siderite
(%)
Dolomite
(%)
Kaolinite
(%)
Illite
(%)
Chlorite
(%)
TL-0122.0 1.6 37.439.00.0
TL-0239.01.68.8 36.714.00.0
TL-0350.0 31.914.33.8
TL-0460.0 4.0 19.715.01.3
YS-0147.0 1.24.031.014.42.4
YS-0243.42.0 32.619.42.6
YS-0316.50.7 22.058.91.9
YS-0414.2 2.7 71.410.11.6
HS-0146.0 20.031.03.0
HS-0245.03.07.2 23.018.33.5
HS-0348.0 29.020.03.0
HS-0461.38.8 13.913.52.5
HS-0531.2 0.8 49.015.63.4
Table 2. XRF results of TYS samples.
SamplesSiO2
(%)
Al2O3
(%)
CaO
(%)
Fe2O3
(%)
K2O
(%)
MgO
(%)
Na2O
(%)
TiO2
(%)
MnO
(%)
P2O5
(%)
SiO2/
Al2O3
ICVK2O/
Al2O3
TiO2/
Al2O3
TL-0162.3026.420.464.143.551.141.300.530.090.082.360.420.130.02
TL-0258.7725.880.6210.082.001.160.750.540.200.042.270.590.080.02
TL-0368.0625.540.231.912.070.800.680.680.000.022.660.250.080.03
TL-0461.0128.000.265.872.900.550.420.800.000.042.180.390.100.03
YS-0160.9524.621.125.702.501.311.040.570.110.082.480.500.100.02
YS-0261.8826.320.595.553.440.780.580.770.060.042.350.450.130.03
YS-0361.5225.950.605.193.411.221.310.560.170.082.370.480.130.02
YS-0453.7337.520.294.791.560.570.530.890.090.041.430.230.040.02
HS-0158.6733.990.311.462.990.671.250.620.000.031.730.220.090.02
HS-0256.1326.740.6910.133.431.101.060.510.160.062.100.640.130.02
HS-0366.9122.580.463.484.120.901.020.430.040.062.960.460.180.02
HS-0459.3419.890.5414.893.160.830.790.420.070.072.981.040.160.02
HS-0562.7526.820.514.342.801.330.650.700.040.052.340.390.100.03
Disclaimer/Publisher’s Note: The statements, opinions and data contained in all publications are solely those of the individual author(s) and contributor(s) and not of MDPI and/or the editor(s). MDPI and/or the editor(s) disclaim responsibility for any injury to people or property resulting from any ideas, methods, instructions or products referred to in the content.