Abstract
The article concerns the verification of links between the energy intensity of public urban transport, regional economic development and urbanisation in the light of sustainable development challenges and club convergence processes. Three research questions were formulated in the article: (1) Does the regional economic development of voivodeships affect the energy intensity of public urban transport? (2) Does urbanisation shape energy consumption patterns in public urban transport (and are there agglomeration effects)? (3) Does the level of urbanisation of voivodeships depend on their regional level? The study covered 16 subregions of Poland from 2010 to 2020. A spatial dynamic exploration of the relationships between energy intensity patterns of public urban transport and the phenomenon of urbanisation and regional economic development was carried out. Panel models of vector autoregression and panel causality testing were used. The influence of the economic development of regions and the level of urbanisation on energy intensity patterns of public urban transport was confirmed. The link between economic development and the process of urbanisation was identified. An additional effect was noticed (novelty knowledge), i.e., there is a delayed club convergence between voivodeships in the area of energy intensity of public urban transport, regional economic development and urbanisation (polyconvergence).
1. Introduction
1.1. Presentations of Research Problems
The evolution of humanity in recent decades has caused adverse consequences in the form of climate change, natural disasters, armed conflicts and destabilisation of a political and socio-economic nature [1,2]. These and other human activities have also had an impact on the environment [3], threatening the survival of future generations and the intact condition of the planet’s resources [1,4]. The world, noticing these unfavourable changes, turned to rational and effective resource management, with less pressure on the exploitation of the environment and stronger protection of it [1,4,5]. Energy has been one of the most important development resources in the world for many decades [6,7]. Already in the 1970s, and then in the 1980s, the need to program long-term development was emphasised in such a way that the exploitation of resources would not reduce the needs of future generations [1,8]. Already at that time, the need to integrate different concepts of development (socio-economic development harmonised with the physical constraints of the environment), of needs (the need to redistribute resources to ensure quality for society) and of future generations (emphasising the use of resources in the long term without compromising future generations) was noticed at that time. The foundations of the concept of sustainable development come from the concept of the “triple bottom line”, i.e., harmony between three pillars: environmental, economic and social [1,9,10]. Sustainable development should be approached from several perspectives [8,11]. At the conceptualisation level, it should incorporate diverse avenues, including stage-based theories of development [11]. Sustainable transport is frequently described in terms of energy intensity (energy consumption patterns) and emissivity [9,12,13,14,15]. In the context of passenger transport demands, sustainable transport is also referred to as sustainable mobility [16,17,18] as an important component of the worldwide agenda [9]. In addition to these issues, there are convergence processes in terms of shaping economic development [19], the energy intensity of GDP [20] or the energy intensity of transport [21] (between countries or regions). They have a significant impact on the possibility of pursuing sustainable development.
Cities’ transport policies are primarily concerned with the issue of external costs of transport, such as energy use, air pollution, noise, traffic congestion and road accidents [22,23,24]. The dominance of individual transport in addressing the demands of urban dwellers contributes greatly to these costs [23]. Decision makers in the field of lowering the use of passenger automobiles in everyday transport must present an appealing alternative [23,25]. Satisfying the transport needs of the inhabitants through public urban transport is consistent with the sustainable development of cities [26,27,28], as the negative impact on the environment is reduced, for example, by minimising energy consumption in the entire transport sector, reducing transport emissions or lowering congestion [29].
Different studies presented various relationships between energy intensity, CO2 emissions, economic growth and urbanisation [30,31,32,33,34]. These dependencies were often presented using the environmental Kuznets curve (EKC), which refers not only to the macroeconomic level (countries) [35,36], but also to the mesoeconomic level—cities [37] and transport [38,39]. However, not all countries have been sufficiently researched in terms of the described relationships using the EKC. One such country is Poland. Recent studies [40,41] showed the EKC hypothesis, including Poland, but only in a wider scope as one of the Central European countries, and also for a long-term perspective. However, the relationships between the energy intensity of public urban transport and regional economic development and urbanisation, taking into account convergence processes, have not been studied so far at the subregional (voivodeships) level. The phenomenon of convergence of energy intensity in transport also has not been sufficiently investigated. This constitutes a cognitive gap that the authors undertook to investigate.
1.2. Organisation of the Paper
The article deals with the problem of exploring dynamic–spatial relationships between the energy intensity of public urban transport, regional economic development and urbanisation in light of the challenges of sustainable development and club convergence processes.
The research problem was presented in the form of three research questions:
- Does the regional economic development of voivodeships affect the energy intensity of public urban transport?
- Does urbanisation shape energy consumption patterns in public urban transport (and are there agglomeration effects)?
- Does the level of urbanisation of voivodeships depend on their regional level?
Two research hypotheses were formulated:
- The dominance of public transport in the leading cities in the urban complex causes the polarisation of subregions into more and less developed and more and less energy-intensive areas.
- The increase in the accessibility of public transport in leading areas causes agglomeration effects between neighbouring areas and a strong dependence of economic growth on energy consumption by public transport.
The article aims to identify the links between the energy intensity of public urban transport, regional economic development and urbanisation of subregions of Poland. The paper uses spatial dynamic panel data modelling and panel stationarity analysis to study convergence. The authors filled the research gap in the field of verification of energy consumption patterns in public urban transport under the influence of regional economic development, urbanisation and convergence processes between subregions. The presented study is a novelty in identifying the phenomenon of polyconvergence between subregions in terms of energy intensity of public urban transport, regional economic development and urbanisation, phenomena that are particularly important in the era of the need to become independent of energy imports.
The conducted research is original and up to date in the field of transport economics, transport policy, economics, management, energy economics and spatial econometrics. The results of the research indicate the factors shaping the energy intensity of this transport and the patterns in energy consumption, which result from the club convergence. The knowledge derived from these dependencies is important for formulating recommendations in the transport policy and programming this policy in line with the processes of regional economic development of subregions and urbanisation. This approach is particularly important when the need to implement the idea of sustainable transport development, based on the principle of minimising energy intensity (non-renewable resources) by shifting transport needs from individual transport to public transport, is emphasised.
The article is divided into six sections. It starts with the Introduction Section. In Section 2, a narrative literature review was conducted covering areas such as urbanisation, the linkage of economic growth and CO2 emissions (as a negative consequence of energy consumption); transport energy intensity factors; and the environmental Kuznets curve (EKC) problem. Section 3 describes the data and research methodology. Section 4 contains the findings of the empirical investigation along with a discussion of them. Conclusions are provided at the end of the paper.
2. Brief Literature Review
2.1. Characteristics of Urbanisation
Urbanisation is the process of altering the size, density and heterogeneity of cities. Population mobility, segregation and industrialisation are frequently associated with urbanisation [42,43,44]. Urbanisation is the process of cities forming and expanding (or contracting in size). Thus, the process of urbanisation is not based directly on the notion of urban, but rather on the dynamics of individual agglomeration. Although the rate of urbanisation is independent of population size, the population density of neighbouring areas may influence the rate of urbanisation. Urbanisation might involve the construction (or demolition) of new buildings or neighbourhoods, the development (or removal) of transit lines and the in-migration and out-migration of people, all of which affect the racial/ethnic mix of a city [42].
The hitherto analysis of the literature on urbanisation has shown that, despite numerous themes addressed there, it is possible to single out studies that focus on two cause-and-effect relations, i.e., the relation between progressing urbanisation and economic growth [45,46,47,48], and the one between progressing urbanisation and transport infrastructure [49,50,51,52] (transport [50,53,54,55,56]). They contribute to the further exploration of research directions.
The first stream of research that exposes the issue of the progressing urbanisation in connection with economic growth underlines the significance of relations found here and also singles out the interactions between urbanisation and the economy. Wang, Wang and Li used urbanisation as a threshold variable to examine the mechanism of the impact of economic growth on CO2 emissions and ecological footprint. Taking into account the heterogeneity of various regions, in their analyses, the authors focused on specifying the impact of urbanisation on economic growth and environmental quality [45].
L. Sun et al. emphasise in their studies that both the fast economic development and the accelerating urbanisation as well as the growing urban population have a significant impact on energy consumption [49]. Adams, Boateng and Acheampong [50] anticipate that the impact of urbanisation and energy consumption in transport on CO2 emissions may be considerably diversified. Thus, emissions rise as the energy consumption in transport increases, and they decrease with urbanisation; on the other hand, factors such as electric power consumption and population growth rate increase CO2 emissions, whereas the quality of regulations and direct foreign investments considerably reduce emissions in the region.
Most studies have shown that economic growth increases the ecological footprint. Research studies connected with urbanisation growth, conducted by Pita, Winyuchakrit and Limmeechokchai, have shown that population, living standard and purchasing power have an impact on an increase in energy consumption and GHG emissions, whereas measures—such as biofuels’ substitution in road transport, enhancement of energy performance and improvement of public transport systems—lead to a decrease in emissions [55]. For Muñiz and Galindo, the environmental, economic and social problems connected with mobility patterns in cities constitute the core of the debate on the possible impact of the urban form on mobility patterns [56]. Examining factors—such as population density, accessibility, suburbanisation patterns and social and economic factors—the authors attempt to specify the impact of the urban form on the ecological footprint in transport. The estimated variables in the studies completed by the said authors have shown that the ecological footprint increases with incomes and decreases with the number of jobs. Moreover, the suburbanisation pattern resulting from taking up outskirts with a low population density entails significant global ecological effects.
2.2. Economic Growth and CO2 Emissions
The past decades saw numerous publications (both theoretical and empirical) dedicated to long-term relations between GDP and carbon dioxide emissions. There are research studies that relate economic growth only to energy consumption and environmental pollution, particularly CO2 emissions [57]. Other publications to a larger extent focus on the connection with transport infrastructure.
The approach is limited to analysing the energy consumption connected only with economic growth and CO2 emissions most often refer to a concrete kind of energy (usually coal or electric power). From a broader perspective, the approach based on analysing the relationship between economic activity measured with GDP per capita growth and CO2 emissions per capita is connected with trade openness [58]. In addition to that, the authors’ findings in that area suggest that, to solve the environmental degradation problem, it is necessary to apply individualised policies in particular countries, assess whether there is a cause-and-effect relationship between CO2 emissions and GDP and also to specify the direction of this causality. Some interesting insights were provided by Chandran and Tang [57], who in their analyses pointed to the role of direct foreign investments and energy consumption in the transport sector and their total impact and consequences for the environment.
Another stream of research regarding the relations between economic growth and carbon dioxide emissions includes the evaluation of the impact of the transport infrastructure. Kharbach and Chfadi [38] discovered that the population increase and the growing number of vehicles were the main causes of CO2 emissions in the road transport sector. On the other hand, they provided evidence that economic growth may lead to a decrease in emissions in the transport sector and an increased rate of CO2 emissions’ reduction as a result of new technologies or promoting public transport. The research studies specified the quantitative share of the population growth, changes in vehicle properties, energy consumption per vehicle and the total emission factor in the road transport sector as well as their impact on changing CO2 emissions; secondly, the relationship between transport-related emissions, economic growth and energy consumption was analysed [38]. A strong relationship between transport infrastructure, economic growth, energy consumption in the transport sector and CO2 emissions was also identified in the study authored by Achour and Belloumi [59]. Based on a claim that transport is the second biggest sector (after industry) responsible for greenhouse gas emissions, the authors examined the connections between the road and rail infrastructure, the added value of transport, energy consumption related to roads and railways, gross accumulation and CO2 emissions in transport. Similar analyses were run by Arvin, Pradhan and Norman [60], who examined the relations between (air and passenger) transport intensity, urbanisation range, CO2 emissions and economic growth, as well as by Azlina, Law and Nik Mustapha [61], who conducted an analysis of economic interactions between energy consumption (in the transport sector), economic growth, pollution emissions, the economy’s structure and the use of renewable energy.
2.3. Environmental Kuznets Curve (EKC)
Economic growth plays a great role in the contribution of CO2 emission, which is why it is important to analyse and identify the determinants of environmental pollution and the direction of their influence [57]. Although, energy consumption and growth alone may not explain CO2 emissions [62].
Existing theory shows that, during the early stage of economic development, pressure on the environment is high, and over time, as the economy grows, this pressure eases and environmental quality grows and improves. This relationship has been termed the environmental Kuznets curve (EKC) [63]. The EKC might be shown as an inverted U-shaped relationship between different pollutants causing environmental degradation and economic growth (i.e., per capita income) [40,61,64]. Economic growth is in close relation to energy consumption, which is caused by higher economic development, which requires more energy consumption, and more efficient energy use also requires a higher level of economic development. In general, environmental quality deteriorates at the early stages of economic growth and subsequently improves at the later stages [40,65,66].
Although some studies suggest that the model of the EKC hypothesis still have some weak points, pointing out it is econometrically weak [57,67,68], many other use this hypothesis for different type of countries to show the impact of income growth on environmental quality. For sure, there is no agreement in the literature on the income level at which environmental degradation starts declining [40]. In many cases, there is a long-term relationship between energy consumption, GDP and CO2 emissions, especially in the case of developing countries [41].
The main aim of testing the relationship between environmental quality and economic growth is that it allows policymakers to assess the level of response of the environment to economic growth.
Narayan and Narayan tested the EKC hypothesis for 43 developing countries. The empirical analysis showed that if the long-term income elasticity is smaller than the short-term income elasticity, then it is evident that the country has reduced carbon dioxide emissions as its income has increased [61,63].
Against this backdrop, it is worth emphasising that the feasibility of in-depth awareness of the problem of the environmental Kuznets curve for transport energy intensity necessitates the identification of factors of this energy intensity.
2.4. Factors of Energy Intensity of Transport
Environmental resources, including energy, determine the development of the economy and its sectors: transport and tourism [54]. In the framework of sustainable development, the relationship between tourism and transport is particularly emphasised [9,54]. The COVID-19 pandemic, which ran from March 2020 to May 2022, altered travel patterns and cut tourism demand dramatically. Lockdowns forced the minimisation of domestic and international passenger traffic [9,69]. This influenced the creation of new patterns of mobility for residents and visitors, as well as new patterns of transport energy intensity [9]. The shortage of energy resources may limit socio-economic development [54]. Some researchers note that the fundamental factors for creating sustainable economic growth are rationalising energy consumption, improving energy efficiency and replacing conventional energy sources with renewable ones [70].
In the era of increasing energy intensity of transport, special attention is paid to other energy carriers. Among them, nuclear energy is increasingly referred to as a large-scale cost-effective, reliable and low-carbon alternative. An example of research in this trend is the analysis of dynamic relationships between nuclear energy, public transport, real income, technological innovation and CO2 emissions in the example of China in the years 1985–2018 [71]. Hassan et al. used the dynamic autoregressive distributive lag (ADRL) method and showed that nuclear power consumption mitigates environmental pollution, while public transport and per capita income are strongly associated with increasing environmental costs. The authors recommend the implementation of technological innovations in public transport to reduce energy consumption and environmental pollution [71].
In addition to this research trend, the discussion on the role of hydrogen in public transport is also developing. It is noted that renewable hydrogen has the potential for the decarbonisation of heavy transport, including buses [72]. The use of hydrogen positively affects the improvement of environmental parameters, but increases the economic costs of fuel, in contrast to the fleet of buses powered by diesel engines. Hydrogen obtained from wind and solar energy may also be important from the point of view of technical, economic and environmental uncertainties, which are strongly correlated with the uncertainty of diesel oil supply [72].
This is consistent with the idea of vehicle electrification. It is noted that taking into account a diverse range of EV technologies, such as hybrid, plug-in hybrid and battery electric vehicles, and taking into account different fuels including petrol, diesel, hydrogen, natural gas and biomass are more beneficial in planning a long-term transport policy in the context of electrification and energy consumption. It is emphasised that electric vehicles will be an important solution for the decarbonisation of cities. Therefore, the authors proposed a model that takes into account land use, transport and energy. Different energy profiles and transport patterns can be important tools for sustainable urban planning. Based on the land use, transport and energy, the amount of economic and social well-being in 2050 has been estimated due to technological improvements in the transport sector [73]. In the context of the need to electrify vehicles, it is considered that the role of the increase in fossil fuel energy prices in assessing the competitiveness of alternative fuel vehicles (AFV) [74]. The need to promote renewable energy is strongly emphasised for the long-term purpose of minimising the gap between the supply and demand for fossil fuels (striving to maintain balance). In addition, in the analysis of relationships between price, energy consumption and efficiency, there are relationships characteristic of rebound effects (e.g., Jevons paradox) [74,75].
A comprehensive approach in the form of the Irish Passenger Transport Emissions and Mobility (IPTEM) model was presented by O’Riordan et al. [76]. They deepened the possibility of analysing the policy of passenger transport, giving reasons to take into account the purpose of travel in consideration of the energy intensity of passenger transport. This model takes into account, in addition to the destination, transport occupancy and changes in energy consumption, but also modal shifts to reduce CO2 emissions [76]. Their research also expresses the idea of the shift paradigm [77] and decoupling [78,79]. A similar thesis about the decoupling paradigm is expressed by Wimbadi et al. about transport [80]. In their opinion, the transport sector faces the huge challenge of decoupling cities’ CO2 emissions from mobility. This is also particularly emphasised in the new transport policy of the European Union [81]. Branch shifts also significantly improve the energy intensity of passenger transport, but they mainly result from the behaviour of transport users and travel purposes [82].
A similar direction of research is presented by Bazzana et al. in a multidisciplinary approach to estimating the impact of COVID-19 on passenger transport and its energy intensity in Italy. They go from factors related to COVID-19, economic policy and green investments to the analysis of transport user behaviour (including travel) [83]. The behaviour of travellers and its impact on mobility in the agglomeration during COVID-19 was also studied by Kłos-Adamkiewicz et al. They showed the change of leading trends in passenger transport, which significantly affects the sustainable development of transport and the reconfiguration of transport policy towards pro-environmental goals [84].
The study of energy consumption factors in road passenger transport in Thailand was undertaken by Pita et al. It took into account five factors: population, the standard of living in the country, purchasing power, demand for the number of trips and unit energy consumption. He also identified how the economic crisis of 2007–2008 affected energy consumption. They pointed out that sedans, vans and taxis are the most energy-intensive vehicles [55].
In turn, Rith et al. studied the impact of energy consumption on transport due to insufficient public transport services. They took into account three scenarios: in the first—no passenger car in the household, in the second—one vehicle, in the third—two vehicles. They focused not only on quantitative, but also on qualitative factors shaping energy consumption: age of household head, education, number of working adults, monthly household income, population density, road density, length of roads for public transport and shortest distance to a railway station. They noticed that a higher density of roads, more people working in a household or more education increased the willingness to buy passenger cars and thus increased energy consumption [85].
Table 1 presents various approaches to research the energy intensity of transport: passenger, public or urban.

Table 1.
Factors in scientific research on energy consumption in passenger, public or urban transport.
The premises from the literature review made it possible to verify the research gap and identify the basic techniques and factors of energy consumption of public urban transport for the purposes of the author’s own research.
3. Materials and Methods
3.1. Data Explanation
The analysis used secondary data. They came from the databases listed in Table 2. The data covered the years 2010–2020 and referred to 16 subregions of Poland (NUTS2), which relate to voivodships (West Pomeranian, Pomeranian, Lubuskie, Greater Poland, Kuyavian-Pomeranian, Lower Silesian, Opolskie, Silesian, Lodzkie, Mazowieckie, Warmian-Masurian, Podlaskie, Lublin, Swietokrzyskie, Lesser Poland and Podkarpackie). The study referred to a total of 176 observations. The data were finally organised using panel data. Table 2 presents an explanation of the variables along with the abbreviation of the represented variable and the source of the data.
Table 2.
Panel data used in the research for 16 subregions of Poland in 2010–2020.
3.2. The Case of Poland
Poland is divided into 16 administrative provinces called voivodeships, covering an area of 312,696 km2 (120,733 sq mi). The total population in Poland in 2021 was 37.9 million people, where 59% of the population lived in urban areas and 41% in rural [91]. The total CO2 emission w thousands of tonnes in 2020 was 317,719 [92].
Polish administrative division based on administrative units—NUTS2, which relies on 16 voivodeships is shown in Figure 1. This level of administrative division will be the base for further analysis.
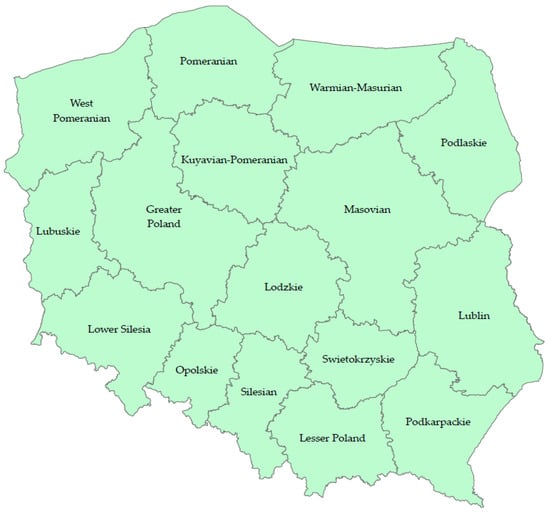
Figure 1.
Administrative classification in Poland—territorial units that stand for voivodships. Source: own elaboration based on data from Statistics Poland (Główny Urząd Statystyczny) [93].
As the analysis covered the years 2010–2020 it was important to show the use and operation of urban transport stock in Poland for the year 2020, as a key year (especially from point of view of COVID-19). The biggest volume of use of public transport vehicles (in vehicle-kilometres) was in Masovian voivodship for buses (76,920), in Pomeranian voivodship for trams (132,781) and Silesian voivodship for trolleybuses (71,111). The highest average distance for buses was in the Kuyavian-Pomeranian voivodship (221 km), for trams in the Pomeranian voivodship (364 km) and for trolleybuses in the Silesian voivodship (195 km). The biggest share in public transport in the field of total distance travelled was by buses—693,887 thousand vehicle-kilometres which stand for 81.2% of the urban transport stock share in Poland for the year 2020 [94].
The following maps (Figure 2) present energy consumption in public transport and also in detail, divided into three means of public transport: buses, trams, and trolleybuses. The total GJ (gigajoules) for individual provinces was shown, as the average values from 2010–2020.

Figure 2.
Average energy consumption of public urban transport and its modes [GJ] in the provinces of Poland in 2010–2020. Source: own elaboration based on data from BDL (Bank Danych Lokalnych) [89] and DBW (Dziedzinowa Baza Wiedzy) [90].
3.3. Methodology
Three research questions were posed to address the research problem:
- Does the regional economic development of voivodeships affect the energy intensity of public urban transport?
- Does urbanisation shape energy consumption patterns in public urban transport (and are there agglomeration effects)?
- Does the level of urbanisation of voivodeships depend on their regional level?
Two research hypotheses were put forward:
- The dominance of public transport in the leading cities in the urban complex causes the polarisation of subregions into more and less developed and more and less energy-intensive areas.
- The increase in the accessibility of public transport in leading areas causes agglomeration effects between neighbouring areas and a strong dependence of economic growth on energy consumption by public transport.
The objective of the article is to identify the links between the energy intensity of public urban transport, regional economic development and urbanisation of subregions of Poland.
To compute the energy intensity of public urban transport, the structure and size of the rolling stock, as well as the average mileage and energy efficiency, were all required. Three modes of transport were considered: buses, trams and trolleybuses. The index technique was used to calculate energy consumption for each mode. The total energy consumption of public urban transport was then calculated by aggregating these values. Then, the energy intensity of public urban transport was calculated using two indices of energy consumption for this type of transport and population. Finally, the energy intensity of public urban transport was employed in the research of convergence and the development of a relationship model.
The analysis mainly used methods in the field of econometrics and statistics, focusing on techniques dedicated to the analysis of panel data. An econometric model was built to study potential relationships between the energy intensity of public urban transport, the regional economic development of Polish provinces and their urbanisation. The occurrence of the EKC curve described by the following formula was tested:
where i means province and t means year, EI is the energy intensity of public urban transport (MJ/capita), GDPC is the gross domestic product per capita in current prices (PLN/capita), GDPC2—GDP2C is the gross domestic product per capita squared and UR is the urban ratio (%).
The econometric analysis procedure was based on 6 steps. In the first step, the stationarity of the variables under study was analysed using four tests:
- Levin, Lin and Chu t test, which assumes a common unit root process [95];
- Im, Pesaran and Shin W-stat, which assumes individual unit root process [96];
- Augmented Dickey–Fuller (ADF) and Fisher Chi-square, which assumes individual unit process [97,98]; and
- Phillips–Perron (PP) and Fisher Chi-square, which assumes individual unit process [99].
In the second step, cointegration testing was carried out using the Pedroni test [100,101], divided into two areas:
- Within-dimension; and
- Between dimension.
The third step consisted of the specification and estimation of the vector autoregression (VAR) model [102]. In the fourth step, the model was verified. It is an inseparable element of model construction.
In the fifth step, before starting the construction of the model, cause-and-effect relationships were examined using the Dumitrescu–Hurlin panel causality test [103,104].
The sixth step, on the other hand, presents the responses of the energy intensity of public urban transport to innovations in regional economic development and urbanisation.
Figure 3 presents the framework of the authors’ research procedure (methodology).
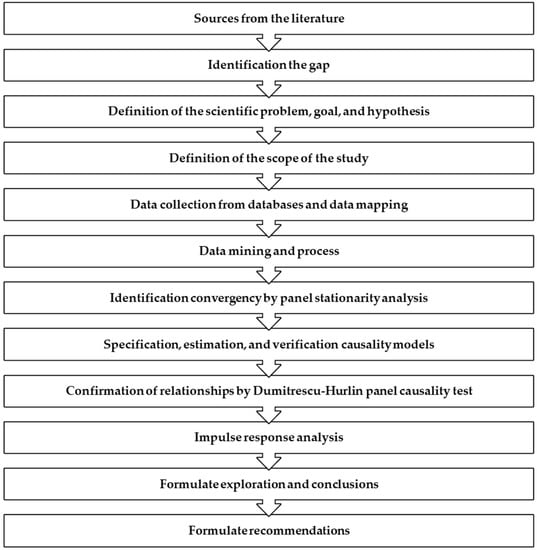
Figure 3.
The framework of the authors’ research procedure (methodology). Source: own elaboration.
4. Results and Discussion
4.1. Findings and Explanations
Table 3 contains selected descriptive statistics for these variables broken down by provinces in 2010–2020.
Table 3.
Selected descriptive statistics for Polish provinces in 2010–2020.
As shown in Table 3, Masovian, Silesian and Lodzkie were characterised by the highest average level of energy intensity in 2010–2020, while Opolskie, Podkarpackie and Warmian-Mazurian were the lowest. The situation is slightly different in the case of the variability of energy intensity of this transport in the analysed period. The coefficient of variation can be used to assess the contribution of the standard deviation to the mean. According to the calculations, the lowest coefficients of variation of energy intensity of this transport in the analysed period were recorded in West Pomeranian, Pomeranian and Kuyavian-Pomeranian, at 4.73%, 4.85% and 5.33%, respectively. The highest variability coefficients of energy intensity of this transport in the analysed period were recorded in Swietokrzyskie (20.39%), Warmian-Mazurian (10.18%) and Masovian (10%). It is noted that the observations for those provinces where the coefficient of variation was relatively high were not homogeneous.
In the case of the analysis of GDP per capita and its coefficient of variation, it is noted that they were relatively high in all provinces. The highest coefficients of variation were recorded in Lesser Poland (17.51%), Greater Poland (17.4%) and Lodzkie (17.31%), and the lowest in provinces such as Silesian (14.69%), Swietokrzyskie (14.62%) and Warmian-Mazurian (14.87%). As regards GDP per capita in 2010–2020, the highest average level was recorded in Mazurian, Lower Silesian and Greater Poland provinces, and the lowest average level was recorded in Lublin, Podkarpackie and Warmian-Mazurian provinces.
Unlike other variables, the urbanisation rate is characterised by the lowest level of variability, oscillating between 0.21% and 1.43%. The highest volatility of this indicator was visible in Pomeranian, Lubuskie and Greater Poland, and the lowest in Mazovian, West Pomeranian and Podkarpackie. However, the highest average annual level of urbanisation was recorded in Silesian, Lower Silesian and West Pomeranian, while the lowest was in Podkarpackie, Swietokrzyskie and Lubelskie. The above analysis illustrates that the surveyed provinces are differentiated in terms of the analysed statistical features.
Table 4 presents an unconventional approach to convergence identification, based on stationarity analysis. Stationarity tests (also called the unit root occurrence test) are also used to test the properties of variables to construct the vector autoregression model (VAR).
Table 4.
Panel unit root tests for convergence verification.
Based on stationarity tests, it was possible to identify lagged club convergence for all variables (1st difference): energy intensity of public urban transport, regional economic development and urbanisation. This means that the differences between the subregions in the increase of energy consumption by public transport, in shaping regional economic growth or in urbanisation processes are becoming blurred. It can be assumed that the subregions are becoming similar to each other (at different rates).
In long-term equilibrium relations (element of convergence—convergence point), the stage of examining the degree of cointegration is important. Cointegration tests are also beneficial from the point of view of analysing the properties of variables for the construction of the VAR model (Table 5).
Table 5.
Pedroni residual cointegration test.
The results of the PP-Statistics panel and the ADF-Statistics panel allow us to reject the hypothesis about the lack of within-dimension cointegration, i.e., the assumption that cointegration exists. On the other hand, the v-Statistics panel test and the rho-Statistics panel give opposite results, indicating the lack of cointegration. In the case of individual analysis (between-dimension), the results of the group PP-Statistic and group ADF-Statistic tests suggest that there is cointegration, in contrast to the results of the group rho-Statistic test.
Table 6 presents VAR estimates for all possible relationships between variables. The first column represents the environmental Kuznets curve in a non-isolated feedback system. On this basis, it can be assessed that there is feedback between the examined features (multi-directional dependencies with delays). The remaining columns describe dependencies in other directions and constitute the background for the entire described system.
Table 6.
Vector autoregression estimates.
These results were extended by a causal analysis (Table 7). As shown in Table 7, the factors shaping the energy intensity of public urban transport are GDP per capita, the square of GDP per capita, and the urbanisation rate. At the same time, feedback was noticed between the energy intensity of this transport and GDP per capita and the square of this indicator. The causality between the urbanisation rate and GDP was confirmed, i.e., the impact of GDP per capita on the urbanisation rate and the effect of the square of GDP per capita on the urbanisation rate. This test also allowed for the identification of multidirectional dependencies and feedback, more broadly than can be recognised by the environmental Kuznets curve (EKC). These results allow for the evaluation of values isolated from the system. That is why the turning point is also shaped by multiplying cointegrating dependencies. The graphical presentation of these links is shown in Figure 4.
Table 7.
Dumitrescu–Hurlin panel causality test: individual coefficients.

Figure 4.
The linkage model. Source: own elaboration based on data Table 7.
The confirmation of the above conclusions is the analysis of the impulse response to the shock (innovation) of GDP per capita, the square of GDP per capita and the ratio of urbanisation in a 10-year horizon (Figure 5). The black line marks the optimal scenario, the red line the optimistic scenario (decrease in energy intensity) and the red line the pessimistic scenario (increase in energy intensity). GDP per capita innovations (shocks) will cause a decrease in the energy intensity of public urban transport and this impulse will deepen. As for the square of GDP per capita, there is a minimal reaction to this shock; it will fade and stabilise. The same applies to the urbanisation ratio. Urbanisation as a process will not be able to achieve reductions in the energy consumption of public urban transport. The morphology of cities and urban complexes is already shaped in such a way that even in the event of a shock, it will not bring a significant improvement in terms of reducing the energy intensity of public urban transport.
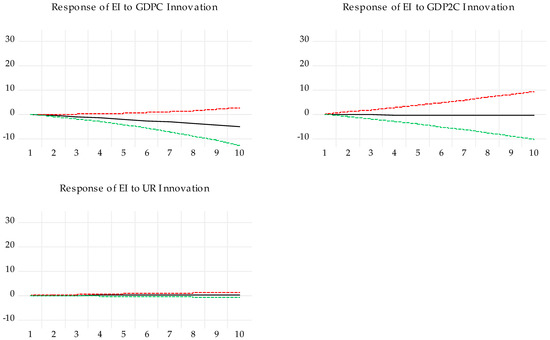
Figure 5.
Impulse–Response Graph. Note: horizon length: 10; response standard errors—method: Monte Carlo with 100 replications; decomposition method: Cholesky—dof adjusted (with Cholesky ordering EI, GDPC, GDP2C, UR). The green line is the optimistic path, the black one is the optimal path, and the red one is the pessimistic one. Source: own elaboration based on data from databases listed in Table 2.
4.2. Polemic Discourse on Relationships between the Energy Intensity of Public Urban Transport, Regional Economic Growth and Urbanisation
The research and analyses carried out in the paper were aimed at testing the relationship between the energy intensity of public urban transport and regional economic growth and urbanisation. The authors, filling the research gap in the assessment of the level of response of the environment to economic growth in regional terms, attempted to explain the nexus between environmental quality and economic growth which, in emphasising the factors in regional terms, constitutes a new formula for verifying the EKC hypothesis (for various degradation factors). Thus, referring to the research conducted in this field, initiated since the early 1990s, which unfortunately cannot be attributed to unequivocal conclusiveness concerning various economies at different levels of development, they present new data and current conclusions.
The obtained analyses complement the extensive research on the relationship between the level of economic development and environmental degradation presented by [41,62,68] cited in the literature review, who classified the countries under study based on different levels of economic development, as well as [40], who focused on Poland. The results obtained and presented in the paper indicate the existing statistical relationships and dependencies between the energy intensity of public urban transport and GDP per capita in various regions of Poland. Interestingly, the relationship defined by the hypothesis of the Kuznets curve (an inverted U-shaped) is confirmed, which allows us to conclude that for each value of GDP per capita, the energy intensity of public urban transport will decrease anyway, and thus by increasing the GDP per capita, the energy intensity of public urban transport will improve. This is also confirmed by the causal analysis carried out in the paper, which additionally takes into account urbanisation indicators. The assessment of the relationship between the energy intensity of public urban transport and regional economic growth and urbanisation allows decision makers to take specific steps to improve the energy efficiency of transport, in particular by investing in new technologies. In particular, the recommended course should be actions to reduce the transport intensity of the economy, i.e., the demand for passenger transport, as well as actions to better organise transport services (e.g., the degree of use of logistics and smart technologies), which is of particular importance in the context of the increase in the urbanisation rate. Chang et al. [88] present two ways to reduce energy consumption and emissions during travel. First, choosing green travel modes is imperative, so public transport is the answer. Second, there is a need to optimise urban space layout and reduce people’s travel needs, thereby reducing travel energy consumption and emissions. Introducing alternative transport energy and automobiles is also an important means to reduce carbon emissions, ensure energy security and improve air quality. Moreover, they warn that cities cannot expand the area without optimised spatial density. The promotion of the development of public urban transport is the priority of the government. Another study [59] highlights the role of the government; to minimise CO2 emissions and reach the target of decarbonisation in urban transport, policymakers should encourage research and development on bio-fuel technologies and also tighten vehicle standards. The development of transport systems should focus on improving service efficiency for current users and making transport services available to potential users that do not currently have wide access.
According to research results undertaken in this paper, the wealth of society increases, there will either be an outflow towards private transport or there will be an improvement in energy efficiency by investing in technologies for buses, trams and trolleybuses. Such a relationship also suggests that every zloty (PLN) of GDP will allow residents to use public transport more efficiently due to energy consumption.
The obtained research results indicate that, with the increase in the urbanisation rate of regions, a decrease in the energy intensity of public urban transport can be expected. This may mean that suburbanisation allows for better use of public transport for travel purposes and its fuller use in improving energy efficiency (lower consumption per capita).
The literature review confirms that the positive effect of agglomeration is through transport investments. The examples are reduction in travel times and the cost of travel. Some transport investments will have their greatest impact on business trips, others on commuting, and others perhaps on freight trips [105]. The great role of transport investments is also confirmed by Zubair [106]. The agglomeration benefit is linked with the transport infrastructure investment and improvement of it. Transport infrastructure helps to access workplaces for labour. A well-developed transport network reduces travel times and costs of travel. The transport investment can also help access other areas and change an area’s urban density. Based on the cost–benefit analysis, transport improvement benefits can be categorised into direct user benefits and wider economic impacts. The first one is due to changes in the quality of services. The better transport quality, the more people and companies will attract. The second one, wider economic impacts are related to agglomeration economies. Studies show [53,107] that transport infrastructure exerts positive effects on urbanisation. The other way it caused a negative effect. To improve the level of urbanisation, there must be a rational allocation of transport resources. It will be helpful through government investment and regional integration. Urbanisation will promote the development of transport, while short-term traffic infrastructure investment can effectively improve the transfer of population to urban regions.
As for side effects of agglomeration, transport congestion and crowding are mentioned. Reference [108] shows that transport congestion reduces efficiency and thus reduces the profits made by individual entities.
The most significant difficulties at the intersection of transport and cities are [109,110] as follows:
- Urban transport is heavily reliant on fossil fuels;
- The car’s dominant position in urban travel;
- The increasing extension of metropolitan areas, resulting in ongoing reliance on the passenger automobile and a rise in the distance between traffic sources and destinations;
- The impact of the transport sector on climate change; and
- Externalities (among others: pollution in cities, intensive road traffic and its noise and traffic safety).
The implementation of the concept of sustainable development will be impacted by the following developments in public urban transport [109]:
- Integrating public transport in agglomerations, which will enable passengers to flexibly use various means of transport;
- Shortening travel time by public transport;
- Inducing a change during the journey, when it is done in a non-intrusive manner and ensures the shortening of door-to-door travel time;
- Maintaining an attractive tariff offer in such a way that the cost of travelling by public urban transport is much lower than by car;
- High spatial accessibility of public urban transport and transfer points;
- Easy access to information on timetables and transfer points; and
- Increasing the level of passenger comfort in public urban transport.
In conclusion, it should be noted that this paper is part of the undoubtedly current trend of research combining transport policy, urbanisation, environmental degradation and economic growth. Although the number of publications covering the countries of Central and Eastern Europe is constantly growing, it is still necessary to convince political circles to constantly take decisive and new actions in the field of improving energy efficiency, as well as to create individualised policies in individual countries.
5. Conclusions
The presented research allowed us to identify the cause-and-effect relationships between the energy consumption of public urban transport, regional economic development and the urbanisation process in the light of sustainable development challenges. The presence of a delayed process of club convergence was also identified for all the statistical features studied (polyconvergence). This means that the convergence process is spatial and dynamic in nature. The occurrence of delayed convergence is tantamount to the existence of a delayed process of disappearance of differences between subregions in terms of energy consumption patterns by public urban transport, the process of urbanisation and the process of regional economic development. The model also shows that, in the studied system of variables, there is a delayed club convergence, which is superimposed on cointegration (long-term equilibrium relationships). In addition, in the identification of relationships between the studied economic categories (based on the model and the Dumitrescu–Hurlin causality panel test), feedback (a bidirectional linkage) was noticed, which is reflected in the formation of innovations and shocks.
There is a feedback loop between the energy intensity of public urban transport and regional economic development. Therefore, regional economic development may create energy consumption patterns in public transport, while changing these patterns (by shifting the needs of society from individual transport to public transport or vice versa, as it happened during the COVID-19 pandemic) will significantly affect the level of regional economic development (inappropriate decisions may, for example, inhibit it). A unidirectional dependence of the impact of regional economic development on the level of urbanisation and the urbanisation process on shaping energy intensity patterns of public urban transport was also noted. Such a conclusion is quite important when programming urban transport policy, as it provides information on the multidimensional causality of public transport energy intensity and regional development. This analysis is important for programming sustainable development because it draws attention to all dimensions of this development.
The research clearly shows that an appropriate economic and transport policy (introducing innovations) can cause increasing reductions in the energy intensity of public urban transport, which is probably due to the actions taken by the European Transport Policy for Sustainable Development (European Green Deal [111,112]), but also the introduced technical evolutions. The study also shows that, although public urban transport is a less energy-intensive option than individual transport, it increases positive effects in minimising its energy intensity. Therefore, it is also information that promoting the shift paradigm can be successful from the point of view of a sustainable transport policy.
Based on the research results, several key recommendations for transport practice and policy can be formulated, the implementation of which may bring economies of scale:
- Raise the vehicle emission standards, both for individual cars and public transport vehicles as well as for new vehicles, and phase out aged and high-emission vehicles.
- Implementation of transport service integration via MaaS [113,114]—Mobility as a Service concept.
- The creation of transport policy should have its origins in the policy of sustainable development (including energy). There should be a relationship in the basis for creating an economic policy with its environmental and energy policy objectives.
- Development of pricing policy and strategy in public transport, which gives the opportunity of commuters to choose the more effective way of transport, especially when commuting from suburban areas.
- The necessity to create an efficient way of promoting environmentally friendly policies and optimisation of energy use for mobility in suburban areas.
- There is a need for investment in urban infrastructure in order to keep energy efficient transport system.
Research hypotheses were verified, and the aim of the article was achieved. Complete answers to research questions were also obtained. The research results prove that the area of research is worth deepening and expanding with other means of transport, including rail transport.
The limitations of this study result from its assumptions and the data used. The data in 2020 may have been affected by the global COVID-19 pandemic and lockdown decisions that limited the movement of people and the spread of the coronavirus. This has slightly changed consumption patterns in public urban transport, also in terms of vehicle occupancy. The energy intensity of this transport could also be influenced by other variables not included in the model, i.e., the structure and sources of transport needs, psychological factors, travel flexibility, the offer of carriers, the availability of public urban transport, available alternatives to travel and the number of jobs in the region or factors price, as well as structural, political and economic factors. They were not quantified and included in the study due to the need to meet the assumptions of the methods used, to meet the condition of the desired properties of the variables or to obtain a sufficient number of degrees of freedom. In future research directions, it is worth expanding the study with the analysis of additional statistical features, also deepening the time range of the study and the level of data granulation (monthly, or quarterly data to identify seasonality). At the same time, in future directions, it is also worth considering e-mobility due to the most common directions of movement. A valuable contribution to future research is the development of a transport model integrated with smart urban services and transfer points; then, spatial autocorrelation and minimum spanning tree analysis can be included in the study.
The research presented in the article is innovative and fills the cognitive gap in science. In the analysed literature, connections at a similar level have not been studied so far. No attempt was made to assess the club (space–time) convergence of energy intensity of public urban transport, regional economic development of subregions and the urbanisation process in the light of the challenges of sustainable transport and the need to become independent of energy imports in the era of increasing external conflicts. The research is interdisciplinary and deals with issues in the field of management, economics, socio-economic geography, econometrics, transport economics, transport policy and energy economics. The results of the research can be useful for urban transport policy programming and for economic practice and scientists.
Author Contributions
Conceptualisation, Z.K.-A., E.S., A.G. and M.K.-J.; methodology, Z.K.-A. and E.S.; validation, Z.K.-A., E.S., A.G. and M.K.-J.; formal analysis, Z.K.-A. and E.S.; investigation, Z.K.-A., E.S., A.G. and M.K.-J.; resources, A.G. and M.K.-J.; writing—original draft preparation, Z.K.-A., E.S., A.G. and M.K.-J.; writing—review and editing, Z.K.-A., E.S., A.G. and M.K.-J.; visualisation, Z.K.-A., E.S., A.G. and M.K.-J.; supervision, Z.K.-A., E.S., A.G. and M.K.-J.; project administration, Z.K.-A., E.S., A.G. and M.K.-J.; funding acquisition, A.G. and M.K.-J. All authors have read and agreed to the published version of the manuscript.
Funding
The project is financed within the framework of the program of the Minister of Science and Higher Education under the name ‘Regional Excellence Initiative’ in the years 2019–2022; project number 001/RID/2018/19 and RID/IZ/2022/1/108; the amount of financing PLN 10,684,000.00.
Data Availability Statement
Data are contained within the article. To estimate the analysed results, the authors used raw data from the databases included in the references listed as [89,90].
Conflicts of Interest
The authors declare no conflict of interest.
References
- Klarin, T. The Concept of Sustainable Development: From Its Beginning to the Contemporary Issues. Zagreb Int. Rev. Econ. Bus. 2018, 21, 67–94. [Google Scholar] [CrossRef]
- Mączyńska, E. Civilization at the Turning Point. Economic and Social Dilemmas. In Proceedings of the Congress of Political Economists International (COPE), 19th Annual Meeting, New Delhi, India, 12–19 July 2008. [Google Scholar]
- Szmelter-Jarosz, A.; Suchanek, M. Mobility Patterns of Students: Evidence from Tricity Area, Poland. Appl. Sci. 2021, 11, 522. [Google Scholar] [CrossRef]
- Szopik-Depczyńska, K.; Kędzierska-Szczepaniak, A.; Szczepaniak, K.; Cheba, K.; Gajda, W.; Ioppolo, G. Innovation in Sustainable Development: An Investigation of the EU Context Using 2030 Agenda Indicators. Land Use Policy 2018, 79, 251–262. [Google Scholar] [CrossRef]
- Dembińska, I.; Kauf, S.; Tłuczak, A.; Szopik-Depczyńska, K.; Marzantowicz, Ł.; Ioppolo, G. The Impact of Space Development Structure on the Level of Ecological Footprint—Shift Share Analysis for European Union Countries. Sci. Total Environ. 2022, 851, 157936. [Google Scholar] [CrossRef]
- Piwowarski, M.; Borawski, M.; Nermend, K. The Problem of Non-Typical Objects in the Multidimensional Comparative Analysis of the Level of Renewable Energy Development. Energies 2021, 14, 5803. [Google Scholar] [CrossRef]
- Singh, U.S.; Rutkowska, M.; Bartoszczuk, P. Renewable Energy Decision Criteria on Green Consumer Values Comparing Poland and India Aligned with Environment Policy for Sustainable Development. Energies 2022, 15, 5046. [Google Scholar] [CrossRef]
- Piwowarski, M.; Miłaszewicz, D.; Łatuszyńska, M.; Borawski, M.; Nermend, K. Application of the Vector Measure Construction Method and Technique for Order Preference by Similarity Ideal Solution for the Analysis of the Dynamics of Changes in the Poverty Levels in the European Union Countries. Sustainability 2018, 10, 2858. [Google Scholar] [CrossRef]
- Więckowski, M. Will the Consequences of COVID-19 Trigger a Redefining of the Role of Transport in the Development of Sustainable Tourism? Sustainability 2021, 13, 1887. [Google Scholar] [CrossRef]
- Sulich, A.; Rutkowska, M.; Singh, U.S. Decision Towards Green Careers and Sustainable Development. Procedia Comput. Sci. 2021, 192, 2291–2300. [Google Scholar] [CrossRef]
- Manioudis, M.; Meramveliotakis, G. Broad Strokes towards a Grand Theory in the Analysis of Sustainable Development: A Return to the Classical Political Economy. New Political Econ. 2022, 27, 866–878. [Google Scholar] [CrossRef]
- Szaruga, E.; Załoga, E. Sustainable Development Programming of Airports by Identification of Non-Efficient Units. Energies 2022, 15, 932. [Google Scholar] [CrossRef]
- Wołek, M.; Szmelter-Jarosz, A.; Koniak, M.; Golejewska, A. Transformation of Trolleybus Transport in Poland. Does In-Motion Charging (Technology) Matter? Sustainability 2020, 12, 9744. [Google Scholar] [CrossRef]
- Szaruga, E.; Załoga, E. Qualitative-Quantitative Warning Modeling of Energy Consumption Processes in Inland Waterway Freight Transport on River Sections for Environmental Management. Energies 2022, 15, 4660. [Google Scholar] [CrossRef]
- Wołek, M.; Jagiełło, A.; Wolański, M. Multi-Criteria Analysis in the Decision-Making Process on the Electrification of Public Transport in Cities in Poland: A Case Study Analysis. Energies 2021, 14, 6391. [Google Scholar] [CrossRef]
- Suchanek, M.; Szmelter-Jarosz, A. Environmental Aspects of Generation Y’s Sustainable Mobility. Sustainability 2019, 11, 3204. [Google Scholar] [CrossRef]
- Servou, E.; Behrendt, F.; Horst, M. Data, AI and Governance in MaaS—Leading to Sustainable Mobility? Transp. Res. Interdiscip. Perspect. 2023, 19, 100806. [Google Scholar] [CrossRef]
- Chatziioannou, I.; Nikitas, A.; Tzouras, P.G.; Bakogiannis, E.; Alvarez-Icaza, L.; Chias-Becerril, L.; Karolemeas, C.; Tsigdinos, S.; Wallgren, P.; Rexfelt, O. Ranking Sustainable Urban Mobility Indicators and Their Matching Transport Policies to Support Liveable City Futures: A MICMAC Approach. Transp. Res. Interdiscip. Perspect. 2023, 18, 100788. [Google Scholar] [CrossRef]
- Lis, C. Wartość Dodana Brutto i Jej Znaczenie w Procesie Akumulacji Kapitału w Świetle Teorii Wzrostu i Konwergencji: Podejście Taksonomiczne; Volumina.pl Daniel Krzanowski: Szczecin, Poland, 2013. [Google Scholar]
- Bello, M.O.; Ch’ng, K.S. Convergence in Energy Intensity of GDP: Evidence from West African Countries. Energy 2022, 254, 124217. [Google Scholar] [CrossRef]
- Hajko, V. The Energy Intensity Convergence in the Transport Sector. Procedia Econ. Financ. 2014, 12, 199–205. [Google Scholar] [CrossRef]
- Bieliński, T.; Dopierała, Ł.; Tarkowski, M.; Ważna, A. Lessons from Implementing a Metropolitan Electric Bike Sharing System. Energies 2020, 13, 6240. [Google Scholar] [CrossRef]
- Suchanek, M.; Jagiełło, A.; Suchanek, J. Substitutability and Complementarity of Municipal Electric Bike Sharing Systems against Other Forms of Urban Transport. Appl. Sci. 2021, 11, 6702. [Google Scholar] [CrossRef]
- Barbet, T.; Nacer-Weill, A.; Yang, C.; Raimbault, J. An Agent-Based Model for Modal Shift in Public Transport. Transp. Res. Procedia 2022, 62, 711–718. [Google Scholar] [CrossRef]
- Anwar, A.H.M.M.; Yang, J. Examining the Effects of Transport Policy on Modal Shift from Private Car to Public Bus. Procedia Eng. 2017, 180, 1413–1422. [Google Scholar] [CrossRef]
- Bespalyy, S.; Petrenko, A. Impact of Urban Transport on City Development in the Context of Sustainable Development. Transp. Res. Procedia 2023, 68, 534–538. [Google Scholar] [CrossRef]
- Lindkvist, H.; Melander, L. How Sustainable Are Urban Transport Services? A Comparison of MaaS and UCC. Res. Transp. Bus. Manag. 2022, 43, 100829. [Google Scholar] [CrossRef]
- Yanar, T. Understanding the Choice for Sustainable Modes of Transport in Commuting Trips with a Comparative Case Study. Case Stud. Transp. Policy 2023, 11, 100964. [Google Scholar] [CrossRef]
- Urbanek, A. Potential of Modal Shift from Private Cars to Public Transport: A Survey on the Commuters’ Attitudes and Willingness to Switch—A Case Study of Silesia Province, Poland. Res. Transp. Econ. 2021, 85, 101008. [Google Scholar] [CrossRef]
- Awan, A.; Alnour, M.; Jahanger, A.; Onwe, J.C. Do Technological Innovation and Urbanization Mitigate Carbon Dioxide Emissions from the Transport Sector? Technol. Soc. 2022, 71, 102128. [Google Scholar] [CrossRef]
- Rehman, E.; Rehman, S. Modeling the Nexus between Carbon Emissions, Urbanization, Population Growth, Energy Consumption, and Economic Development in Asia: Evidence from Grey Relational Analysis. Energy Rep. 2022, 8, 5430–5442. [Google Scholar] [CrossRef]
- Wei, H.; Lahiri, R. Urbanization, Energy-Use Intensity and Emissions: A Sectoral Approach. Econ. Anal. Policy 2022, 76, 667–684. [Google Scholar] [CrossRef]
- Chen, J.; Zhou, C.; Wang, S.; Li, S. Impacts of Energy Consumption Structure, Energy Intensity, Economic Growth, Urbanization on PM2.5 Concentrations in Countries Globally. Appl. Energy 2018, 230, 94–105. [Google Scholar] [CrossRef]
- Armeanu, D.S.; Joldes, C.C.; Gherghina, S.C.; Andrei, J.V. Understanding the Multidimensional Linkages among Renewable Energy, Pollution, Economic Growth and Urbanization in Contemporary Economies: Quantitative Assessments across Different Income Countries’ Groups. Renew. Sustain. Energy Rev. 2021, 142, 110818. [Google Scholar] [CrossRef]
- Balsalobre-Lorente, D.; Driha, O.M.; Leitão, N.C.; Murshed, M. The Carbon Dioxide Neutralizing Effect of Energy Innovation on International Tourism in EU-5 Countries under the Prism of the EKC Hypothesis. J. Environ. Manage. 2021, 298, 113513. [Google Scholar] [CrossRef] [PubMed]
- Wang, Q.; Yang, T.; Li, R. Does Income Inequality Reshape the Environmental Kuznets Curve (EKC) Hypothesis? A Nonlinear Panel Data Analysis. Environ. Res. 2023, 216, 114575. [Google Scholar] [CrossRef]
- Han, C.; Gu, Z.; Yang, H. EKC Test of the Relationship between Nitrogen Dioxide Pollution and Economic Growth—A Spatial Econometric Analysis Based on Chinese City Data. Int. J. Environ. Res. Public Health 2021, 18, 9697. [Google Scholar] [CrossRef]
- Kharbach, M.; Chfadi, T. CO2 Emissions in Moroccan Road Transport Sector: Divisia, Cointegration, and EKC Analyses. Sustain. Cities Soc. 2017, 35, 396–401. [Google Scholar] [CrossRef]
- Erdogan, S.; Fatai Adedoyin, F.; Victor Bekun, F.; Asumadu Sarkodie, S. Testing the Transport-Induced Environmental Kuznets Curve Hypothesis: The Role of Air and Railway Transport. J. Air Transp. Manag. 2020, 89, 101935. [Google Scholar] [CrossRef]
- Dinda, S. Environmental Kuznets Curve Hypothesis: A Survey. Ecol. Econ. 2004, 49, 431–455. [Google Scholar] [CrossRef]
- Niu, S.; Ding, Y.; Niu, Y.; Li, Y.; Luo, G. Economic Growth, Energy Conservation and Emissions Reduction: A Comparative Analysis Based on Panel Data for 8 Asian-Pacific Countries. Energy Policy 2011, 39, 2121–2131. [Google Scholar] [CrossRef]
- Vlahov, D.; Galea, S. Urbanization, urbanicity, and health. J. Urban Health 2002, 79, S1–S12. [Google Scholar] [CrossRef]
- Leviton, L.C.; Snell, E.; McGinnis, M. Urban Issues in Health Promotion Strategies. Am. J. Public Health 2000, 90, 863–866. [Google Scholar] [CrossRef] [PubMed]
- Marsella, A.J. Urbanization, Mental Health, and Social Deviancy. A Review of Issues and Research. Am. Psychol. 1998, 53, 624–634. [Google Scholar] [CrossRef] [PubMed]
- Wang, Q.; Wang, X.; Li, R. Does Urbanization Redefine the Environmental Kuznets Curve? An Empirical Analysis of 134 Countries. Sustain. Cities Soc. 2022, 76, 103382. [Google Scholar] [CrossRef]
- Awan, A.; Sadiq, M.; Hassan, S.T.; Khan, I.; Khan, N.H. Combined Nonlinear Effects of Urbanization and Economic Growth on CO2 Emissions in Malaysia. An Application of QARDL and KRLS. Urban Clim. 2022, 46, 101342. [Google Scholar] [CrossRef]
- Raihan, A.; Muhtasim, D.A.; Farhana, S.; Pavel, M.I.; Faruk, O.; Rahman, M.; Mahmood, A. Nexus between Carbon Emissions, Economic Growth, Renewable Energy Use, Urbanization, Industrialization, Technological Innovation, and Forest Area towards Achieving Environmental Sustainability in Bangladesh. Energy Clim. Chang. 2022, 3, 100080. [Google Scholar] [CrossRef]
- Tang, Y.; Zhu, H.; Yang, J. The Asymmetric Effects of Economic Growth, Urbanization and Deindustrialization on Carbon Emissions: Evidence from China. Energy Rep. 2022, 8, 513–521. [Google Scholar] [CrossRef]
- Sun, L.; Zhang, T.; Liu, S.; Wang, K.; Rogers, T.; Yao, L.; Zhao, P. Reducing Energy Consumption and Pollution in the Urban Transport Sector: A Review of Policies and Regulations in Beijing. J. Clean. Prod. 2021, 285, 125339. [Google Scholar] [CrossRef]
- Adams, S.; Boateng, E.; Acheampong, A.O. Transport Energy Consumption and Environmental Quality: Does Urbanization Matter? Sci. Total Environ. 2020, 744, 140617. [Google Scholar] [CrossRef]
- Pradhan, R.P.; Arvin, M.B.; Nair, M. Urbanization, Transport Infrastructure, ICT, and Economic Growth: A Temporal Causal Analysis. Cities 2021, 115, 103213. [Google Scholar] [CrossRef]
- Miatto, A.; Dawson, D.; Nguyen, P.D.; Kanaoka, K.S.; Tanikawa, H. The Urbanisation-Environment Conflict: Insights from Material Stock and Productivity of Transport Infrastructure in Hanoi, Vietnam. J. Environ. Manag. 2021, 294, 113007. [Google Scholar] [CrossRef]
- Liu, T.Y.; Su, C.W.; Qin, M.; Zhang, X.Y. What Came First, Transport or Urbanization? Singap. Econ. Rev. 2020. [Google Scholar] [CrossRef]
- Zhang, Z.; Li, L.; Guo, Q. The Interactive Relationships between the Tourism-Transport-Ecological Environment System of Provinces along the ‘Silk Road Economic Belt’ in China. Sustainability 2022, 14, 3050. [Google Scholar] [CrossRef]
- Pita, P.; Winyuchakrit, P.; Limmeechokchai, B. Analysis of Factors Affecting Energy Consumption and CO2 Emissions in Thailand’s Road Passenger Transport. Heliyon 2020, 6, e05112. [Google Scholar] [CrossRef] [PubMed]
- Muñiz, I.; Galindo, A. Urban Form and the Ecological Footprint of Commuting. The Case of Barcelona. Ecol. Econ. 2005, 55, 499–514. [Google Scholar] [CrossRef]
- Chandran, V.G.R.; Tang, C.F. The Impacts of Transport Energy Consumption, Foreign Direct Investment and Income on CO2 Emissions in ASEAN-5 Economies. Renew. Sustain. Energy Rev. 2013, 24, 445–453. [Google Scholar] [CrossRef]
- Jóźwik, B.; Gavryshkiv, A.-V.; Kyophilavong, P.; Gruszecki, L.E. Revisiting the Environmental Kuznets Curve Hypothesis: A Case of Central Europe. Energies 2021, 14, 3415. [Google Scholar] [CrossRef]
- Achour, H.; Belloumi, M. Investigating the Causal Relationship between Transport Infrastructure, Transport Energy Consumption and Economic Growth in Tunisia. Renew. Sustain. Energy Rev. 2016, 56, 988–998. [Google Scholar] [CrossRef]
- Arvin, M.B.; Pradhan, R.P.; Norman, N.R. Transport Intensity, Urbanization, Economic Growth, and CO2 Emissions in the G-20 Countries. Util. Policy 2015, 35, 50–66. [Google Scholar] [CrossRef]
- Azlina, A.A.; Law, S.H.; Nik Mustapha, N.H. Dynamic Linkages among Transport Energy Consumption, Income and CO2 Emission in Malaysia. Energy Policy 2014, 73, 598–606. [Google Scholar] [CrossRef]
- Zhang, Y.J. The Impact of Financial Development on Carbon Emissions: An Empirical Analysis in China. Energy Policy 2011, 39, 2197–2203. [Google Scholar] [CrossRef]
- Narayan, P.K.; Narayan, S. Carbon Dioxide Emissions and Economic Growth: Panel Data Evidence from Developing Countries. Energy Policy 2010, 38, 661–666. [Google Scholar] [CrossRef]
- Piłatowska, M.; Włodarczyk, A.; Zawada, M. The Environmental Kuznets Curve in Poland—Evidence from Threshold Cointegration Analysis. Dyn. Econom. Model. 2015, 14, 51. [Google Scholar] [CrossRef]
- Halicioglu, F. An Econometric Study of CO2 Emissions, Energy Consumption, Income and Foreign Trade in Turkey. Energy Policy 2009, 37, 1156–1164. [Google Scholar] [CrossRef]
- Azlina, A.A.; Mustapha, N.H.N. Energy, Economic Growth and Pollutant Emissions Nexus: The Case of Malaysia. Procedia Soc. Behav. Sci. 2012, 65, 1–7. [Google Scholar] [CrossRef]
- Perman, R.; Stern, D.I. Evidence from Panel Unit Root and Cointegration Tests That the Environmental Kuznets Curve Does Not Exist. Aust. J. Agric. Resour. Econ. 2003, 47, 325–347. [Google Scholar] [CrossRef]
- Galeotti, M.; Lanza, A.; Pauli, F. Reassessing the Environmental Kuznets Curve for CO2 Emissions: A Robustness Exercise. Ecol. Econ. 2006, 57, 152–163. [Google Scholar] [CrossRef]
- Patlins, A. Development of System Solution for Public Transport System Sustainability and Adapting It to the Challenge of COVID-19. Transp. Res. Procedia 2021, 55, 1407–1414. [Google Scholar] [CrossRef]
- Simionescu, M.; Wojciechowski, A.; Tomczyk, A.; Rabe, M. Revised Environmental Kuznets Curve for V4 Countries and Baltic States. Energies 2021, 14, 3302. [Google Scholar] [CrossRef]
- Hassan, S.T.; Khan, D.; Zhu, B.; Batool, B. Is Public Service Transport Increase Environmental Contamination in China? The Role of Nuclear Energy Consumption and Technological Change. Energy 2022, 238, 121890. [Google Scholar] [CrossRef]
- Coppitters, D.; Verleysen, K.; De Paepe, W.; Contino, F. How Can Renewable Hydrogen Compete with Diesel in Public Transport? Robust Design Optimization of a Hydrogen Refueling Station under Techno-Economic and Environmental Uncertainty. Appl. Energy 2022, 312, 118694. [Google Scholar] [CrossRef]
- Zhang, R.; Zhang, J.; Long, Y.; Wu, W.; Liu, J.; Jiang, Y. Long-Term Implications of Electric Vehicle Penetration in Urban Decarbonization Scenarios: An Integrated Land Use–Transport–Energy Model. Sustain. Cities Soc. 2021, 68, 102800. [Google Scholar] [CrossRef]
- Du, H.; Li, Q.; Liu, X.; Peng, B.; Southworth, F. Costs and Potentials of Reducing CO2 Emissions in China’s Transport Sector: Findings from an Energy System Analysis. Energy 2021, 234, 121163. [Google Scholar] [CrossRef]
- Szaruga, E. Racjonalizacja Energochłonności Transportu Samochodowego: Wyzwanie XXI Wieku; Wydawnictwo edu-Libri: Kraków, Poland; Legionowo, Poland, 2018; ISBN 9788365648815. [Google Scholar]
- O’Riordan, V.; Rogan, F.; Ó Gallachóir, B.; Mac Uidhir, T.; Daly, H. How and Why We Travel—Mobility Demand and Emissions from Passenger Transport. Transp. Res. Part D Transp. Environ. 2022, 104, 103195. [Google Scholar] [CrossRef]
- Maduekwe, M.; Akpan, U.; Isihak, S. Road Transport Energy Consumption and Vehicular Emissions in Lagos, Nigeria: An Application of the LEAP Model. Transp. Res. Interdiscip. Perspect. 2020, 6, 100172. [Google Scholar] [CrossRef]
- Szaruga, E.; Załoga, E. Machine Learning in Exploration the Decoupling Paradigm in Transport. Procedia Comput. Sci. 2022, 207, 3904–3914. [Google Scholar] [CrossRef]
- Szaruga, E.; Kłos-Adamkiewicz, Z.; Gozdek, A.; Załoga, E. Linkages between Energy Delivery and Economic Growth from the Point of View of Sustainable Development and Seaports. Energies 2021, 14, 4255. [Google Scholar] [CrossRef]
- Wimbadi, R.W.; Djalante, R.; Mori, A. Urban Experiments with Public Transport for Low Carbon Mobility Transitions in Cities: A Systematic Literature Review (1990–2020). Sustain. Cities Soc. 2021, 72, 103023. [Google Scholar] [CrossRef]
- Załoga, E. Nowa Polityka Transportowa Unii Europejskiej. In Transport. Tendencje zmian; Wojewódzka-Król, K., Załoga, E., Eds.; Wydawnictwo Naukowe PWN: Warszawa, Poland, 2022; ISBN 978-83-01-22033-4. [Google Scholar]
- Jain, D.; Tiwari, G. How the Present Would Have Looked like? Impact of Non-Motorized Transport and Public Transport Infrastructure on Travel Behavior, Energy Consumption and CO2 Emissions—Delhi, Pune and Patna. Sustain. Cities Soc. 2016, 22, 1–10. [Google Scholar] [CrossRef]
- Bazzana, D.; Cohen, J.J.; Golinucci, N.; Hafner, M.; Noussan, M.; Reichl, J.; Rocco, M.V.; Sciullo, A.; Vergalli, S. A Multi-Disciplinary Approach to Estimate the Medium-Term Impact of COVID-19 on Transport and Energy: A Case Study for Italy. Energy 2022, 238, 122015. [Google Scholar] [CrossRef]
- Kłos-Adamkiewicz, Z.; Gutowski, P. The Outbreak of COVID-19 Pandemic in Relation to Sense of Safety and Mobility Changes in Public Transport Using the Example of Warsaw. Sustainability 2022, 14, 1780. [Google Scholar] [CrossRef]
- Rith, M.; Fillone, A.; Biona, J.B.M. The Impact of Socioeconomic Characteristics and Land Use Patterns on Household Vehicle Ownership and Energy Consumption in an Urban Area with Insufficient Public Transport Service—A Case Study of Metro Manila. J. Transp. Geogr. 2019, 79, 102484. [Google Scholar] [CrossRef]
- Noussan, M.; Tagliapietra, S. The Effect of Digitalization in the Energy Consumption of Passenger Transport: An Analysis of Future Scenarios for Europe. J. Clean. Prod. 2020, 258, 120926. [Google Scholar] [CrossRef]
- Ovaere, M.; Proost, S. Cost-Effective Reduction of Fossil Energy Use in the European Transport Sector: An Assessment of the Fit for 55 Package. Energy Policy 2022, 168, 113085. [Google Scholar] [CrossRef]
- Chang, X.; Ma, T.; Wu, R. Impact of Urban Development on Residents’ Public Transport Travel Energy Consumption in China: An Analysis of Hydrogen Fuel Cell Vehicles Alternatives. Int. J. Hydrogen Energy 2019, 44, 16015–16027. [Google Scholar] [CrossRef]
- GUS—Bank Danych Lokalnych. Available online: https://bdl.stat.gov.pl/bdl/dane/podgrup/temat (accessed on 6 December 2022).
- Dziedzinowe Bazy Wiedzy (DBW). Available online: http://swaid.stat.gov.pl/SitePages/StronaGlownaDBW.aspx (accessed on 6 December 2022).
- Statistics Poland/Topics/Population/Population/Infant Death. Available online: https://stat.gov.pl/en/topics/population/population/population-size-and-structure-and-vital-statistics-in-poland-by-territorial-division-in-2021-as-of-31-december,3,31.html (accessed on 12 March 2023).
- Główny Urząd Statystyczny/Podstawowe Dane. Available online: https://stat.gov.pl/podstawowe-dane/ (accessed on 12 March 2023).
- Statistics Poland/Regional Statistics/Classification of Territorial Units/Classification of Territorial Units for Statistics (NUTS)/The NUTS Classification in Poland. Available online: https://stat.gov.pl/en/regional-statistics/classification-of-territorial-units/classification-of-territorial-units-for-statistics-nuts/the-nuts-classification-in-poland/ (accessed on 13 March 2023).
- Główny Urząd Statystyczny/Obszary Tematyczne/Transport i Łączność/Transport/Przewozy Ładunków i Pasażerów w 2012 R. Available online: https://stat.gov.pl/obszary-tematyczne/transport-i-lacznosc/transport/transport-wyniki-dzialalnosci-w-2020-roku,9,20.html (accessed on 12 March 2023).
- Levin, A.; Lin, C.F.; Chu, C.S.J. Unit Root Tests in Panel Data: Asymptotic and Finite-Sample Properties. J. Econom. 2002, 108, 1–24. [Google Scholar] [CrossRef]
- Im, K.S.; Pesaran, M.H.; Shin, Y. Testing for Unit Roots in Heterogeneous Panels. J. Econom. 2003, 115, 53–74. [Google Scholar] [CrossRef]
- Szaruga, E.; Załoga, E. Environmental Management from the Point of View of the Energy Intensity of Road Freight Transport and Shocks. Int. J. Environ. Res. Public Health 2022, 19, 14417. [Google Scholar] [CrossRef]
- Choi, I. Unit Root Tests for Panel Data. J. Int. Money Financ. 2001, 20, 249–272. [Google Scholar] [CrossRef]
- Zoundi, Z. CO2 Emissions, Renewable Energy and the Environmental Kuznets Curve, a Panel Cointegration Approach. Renew. Sustain. Energy Rev. 2017, 72, 1067–1075. [Google Scholar] [CrossRef]
- Pedroni, P. Panel Cointegration: Asymptotic and Finite Sample Properties of Pooled Time Series Tests with an Application to the PPP Hypothesis. Econom. Theory 2004, 20, 597–625. [Google Scholar] [CrossRef]
- Pedroni, P. Purchasing Power Parity Tests in Cointegrated Panels. Rev. Econ. Stat. 2001, 83, 727–731. [Google Scholar] [CrossRef]
- Szaruga, E. Rationalization of the Energy Consumption of Road Transport for Sustainable Development. Zesz. Nauk. Akad. Mor. W Szczec. 2020, 62, 36–42. [Google Scholar] [CrossRef]
- Dumitrescu, E.I.; Hurlin, C. Testing for Granger Non-Causality in Heterogeneous Panels. Econ. Model. 2012, 29, 1450–1460. [Google Scholar] [CrossRef]
- Saidi, S.; Shahbaz, M.; Akhtar, P. The Long-Run Relationships between Transport Energy Consumption, Transport Infrastructure, and Economic Growth in MENA Countries. Transp. Res. Part A Policy Pract. 2018, 111, 78–95. [Google Scholar] [CrossRef]
- Graham, D.J.; Graham, D. Agglomeration Economies and Transport Investment. In The Wider Economic Benefits of Transport: Macro-, Meso- and Micro-Economic Transport Planning and Investment Tools; OECD Publishing: Paris, France, 2007. [Google Scholar]
- Zubair, H. Agglomeration Benefits of Transport Investment: A Brief Review. COJ Tech. Sci. Res. 2022, 3, 000572. [Google Scholar]
- Liu, T.Y.; Su, C.W. Is Transport Improving Urbanization in China? Socioecon. Plann. Sci. 2021, 77, 101034. [Google Scholar] [CrossRef]
- Harasimowicz, A. Efekty Aglomeracji-Czynnik Czy Bariera Rozwoju Miast? Analiza Wybranych Aspektów w Świetle Literatury Przedmiotu. Agglomeration Effects-Factor or a Barrier to Urban Development? Analysis of Some Aspects in the Light of Lit. Stud. Miej. 2015, 20, 23–34. [Google Scholar] [CrossRef]
- Wyszomirski, O. Transport Miejski. In Transport. Nowe Wyzwania; Wojewódzka-Król, K., Załoga, E., Eds.; Wydawnictwo Naukowe PWN: Warszawa, Poland, 2016. [Google Scholar]
- Wołek, M. SUMP (Sustainable Urban Mobility Plan) Jako Narzędzie Kształtowania Zrównoważonej Mobilności Miejskiej. Logistyka 2014, 2, 389–398. [Google Scholar]
- European Commission. Communication from the Commission. The European Green Deal; COM(2019) 640 Final; European Commission: Brussels, Belgium, 2019.
- Paprocki, W. Virtual Airport Hub—A New Business Model to Reduce GHG Emissions in Continental Air Transport. Sustainability 2021, 13, 5076. [Google Scholar] [CrossRef]
- Koźlak, A.; Pawłowska, B. Mobility-as-a-Service for Improving Mobility in Smart Cities—A Comparative Analysis of Selected Cities. Prace Nauk. Uniw. Ekon. We Wrocławiu 2019, 63, 31–46. [Google Scholar] [CrossRef]
- Mitropoulos, L.; Kortsari, A.; Mizaras, V.; Ayfantopoulou, G. Mobility as a Service (MaaS) Planning and Implementation: Challenges and Lessons Learned. Futur. Transp. 2023, 3, 498–518. [Google Scholar] [CrossRef]
Disclaimer/Publisher’s Note: The statements, opinions and data contained in all publications are solely those of the individual author(s) and contributor(s) and not of MDPI and/or the editor(s). MDPI and/or the editor(s) disclaim responsibility for any injury to people or property resulting from any ideas, methods, instructions or products referred to in the content. |
© 2023 by the authors. Licensee MDPI, Basel, Switzerland. This article is an open access article distributed under the terms and conditions of the Creative Commons Attribution (CC BY) license (https://creativecommons.org/licenses/by/4.0/).