Abstract
This paper deals with the simulation and the experimental confirmation of electromagnetic events that could interfere with the successful formation of the restoration path during the power system restoration procedure. The studied phenomena are more relevant for bulk power systems characterized by a low short circuit power as the restoration backbone. In particular, two case studies have been simulated and analyzed: one related to a transformer energization during the formation of the restoration path, and the other one occurred after the de-energization of some transmission lines and one autotransformer belonging to the restoration path. From the simulation results, it emerged that such events are related to the resonant effects between the supplying transformer and the restored network. Such resonances could have negative effects on the restoration if they are not effectively managed. In order to evaluate the impact of such phenomena in real networks, the measurement recordings of on-field tests were compared with the simulation results. It is worth noting that the performed analyses require the knowledge of several parameters that were not always available in practice. Hence, the exact magnitude of the described resonant phenomena was not easy to foresee for the restoration of real networks. The performed comparison confirms the preliminary simulation results and highlights that detailed electromagnetic models are particularly important to support the power system restoration management, in particular the planning of recovery procedures.
1. Introduction
1.1. Motivations
The possibility of restoring power systems after an extended outage constitutes an important point towards increasing the resilience of electrical networks, especially in recent years. In fact, the ever-growing penetration of Distributed Energy Resources (DERs) in worldwide networks is resulting in an increase in the complexity of grid management and a decrease in the network regulating energy. These conditions make blackout events more likely to occur. Moreover, such a scenario increases the occurrence of outages related to environmental disasters due to climatic changes. These issues are pushing power system operation close to the design limits, which could lead to cascading events and eventually to partial or total blackout.
For these reasons, performing black start mock drills is very important for the Transmission System Operators (TSOs), together with the definition of proper black start standards, such as [1,2]. These mock drills allow for the testing of all the power system equipment and the restoration strategies to guarantee a fast recovery in case of extended outages [3,4].
1.2. Literature Review
In technical literature, several contributions discuss and analyze power system restoration tests by exploiting both on-field tests [5,6,7,8,9] and simulations [10,11,12,13,14]. In particular, in [5,6], the Italian TSO performs an on-field test campaign to check its restoration plan and discusses the lessons learned and the adopted procedures. In [8], a novel approach to assess the frequency behavior during a restoration test is presented. In [10], an electromagnetic phenomenon that occurred during a restoration test is analyzed and simulated. In the last years, several contributions have proposed to include the Distribution Networks (DNs) in such a way as to allow it to become an active part during the restoration process. More specifically, in [15], the capabilities and factors that large industrial consumers should consider when looking to participate in the system restoration process are analyzed. In [16], a pruning algorithm is proposed to perform the black start of terminal DNs. In [17], a distributed black start optimization method for a global transmission and distribution network is proposed and validated by applying the proposed approach to such a network. In [18], the vehicle-to-grid approach is considered as a possibility to support the restoration of electrical networks. In [19], the black start services offered by several energy storage technologies, including electrochemical, thermal, and electromechanical resources, are compared.
In this context, it is worth noting that the bulk power system of a restoration backbone is characterized by a low, three-phase fault level, since the number of interconnected generators is always limited. In this configuration, the system is weak and every switching maneuver is potentially harmful for the system stability. From an electromagnetic point of view, in those weak systems, the frequency-spanned network impedance can be characterized by a resonance, even at low frequencies [20]. The harmonic content originated by the transient phenomenon that occurs during the restoration process could be amplified if the frequency is close to the resonant frequency of the system. Consequently, these harmonic components may induce a parallel resonance if their harmonic order is close to the resonant frequency of the network [21]. For example, [22] discusses the control of Transient Overvoltages (TOVs) caused by resonant phenomena observed after an autotransformer energization. The effect of this type of resonance is the rise of sustained overvoltages that can last from 1 to 10 s [23].
The typical example of this maneuver is the autotransformer energization during the backbone formation. This transient phenomenon triggers the circulation of a distorted high magnetizing current, the so-called inrush current. The way to control the harmonic overvoltage consists of the suppression of the transformer inrush current. Its amplitude mainly depends on the voltage phase shift at the energization instant, on the residual magnetic flux in the magnetic core, and on the B-H curve of the magnetic core [24]. In some cases, the overvoltage caused by the transformer energization in resonant conditions leads to the voltage divergence and to the protection intervention, in order to avoid damage to the power system equipment [25].
Some popular solutions to limit inrush currents are:
- increasing the tap of the transformer on-load tap changer;
- monitoring the de-energization instant to limit the residual flux;
- adding a dead load to the transformer to avoid the no-load energization; and
- adopting a delta-connection for the HV-winding.
Another way to avoid the resonant phenomena is to move the resonant frequency of the system to higher frequencies. The frequency-spanned system impedance mainly depends on the short-circuit capacity, on the presence of capacitor banks, on the transmission line impedance, and on the load characteristic.
A system with high short-circuit capacity exhibits a lower harmonic voltage distortion, retaining the harmonic current source applied. The capacitor banks and the transmission lines in parallel may cause resonant conditions that increase the harmonic distortion [26].
1.3. Contribution
The identification of electromagnetic resonant phenomena that could happen during the restoration of a power system is of significant importance for the planning stage of the optimal restoration path.
With this aim, in [1], the authors share with the scientific community the peculiar electromagnetic phenomena observed in a simulation environment during the planning operations of a restoration test, but without obtaining an experimental confirmation.
However, the main issue in such simulations is that the exact parameters of the electrical devices involved in the restoration test are extremely difficult to derive and, consequently, it is not easy to exactly represent the real restoration process. In particular, the most difficult parameters to determine are related to the magnetic characteristics of transformers and to the control parameters of generators.
In this paper, the evidence obtained from the simulations reported in [1] are compared with the on-field measurements performed during real restoration tests, so as to better investigate and explain the causes of such electromagnetic events. Moreover, an additional electromagnetic phenomenon that could occur during the formation of a restoration backbone was studied and modelled. More specifically, this paper shows two peculiar electromagnetic events. The first is a sustained transient overvoltage that occurs when the restoration backbone energizes a portion of the Transmission Network (TN) consisting of an Autotransformer (ATR) and some transmission lines at no load. The second occurs when a part of the grid is disconnected from the National Transmission Grid (NTG) [1]. This event results in a significant current circulation on the ATR High Voltage (HV) winding once it is disconnected from the NTG. Such current increase could lead to the intervention of the ATR differential protection, which is set to preserve the ATR from overcurrent phenomena, such as the inrush one.
These types of electromagnetic phenomena must be known in order to avoid the failure of the recovery procedure due to the intervention of the protection systems of the involved assets and to avoid dangerous component failures during black start operations. The simulation results were compared with on-field measurements to support the evidence obtained from the simulations.
In fact, comparing simulations with on-field measurements is one of the most important ways to comprehend the dynamic power systems behavior.
1.4. Structure of the Paper
The paper is structured as follows:
- Section 2 describes the two power system black start processes during which the two above cited electromagnetic phenomena have been observed;
- Section 3 presents the electrical models adopted for the simulations;
- Section 4 shows the comparison between simulations and on-field measurements; and
- Section 5 proposes different solutions to avoid the relay intervention following the occurrence of such resonant phenomena.
2. Description of the Analyzed Case Studies
This section aims at presenting two transient phenomena that occurred during two different power system restoration tests (referred to as Case A and Case B henceforth) performed on portions of the Italian NTG.
Restoration tests are performed when the rest of the NTG is operating in safety conditions. For this reason, it is necessary to electrically isolate the part of the grid of interest, with the goal of minimizing the impact on the consumer supply. The process used to de-energize the parts of the grid of interest and re-connect them to the rest of the restoration path involves several switching maneuvers in a time frame of up to one minute for each maneuver. The on-field tests are carried out while guarantying the safety of both the tested network and the connected utilities.
2.1. Case A
The first analyzed event is an electromagnetic transient that originated when the restoration backbone energized a portion of the NTG. It is important to study these contingencies, since they could stress the electrical components involved in the restoration process, and in some cases, this could trigger the protection relay intervention. Consequently, the restoration could fail.
Figure 1 shows a single-line scheme of the restoration path related to the restoration test A, where:
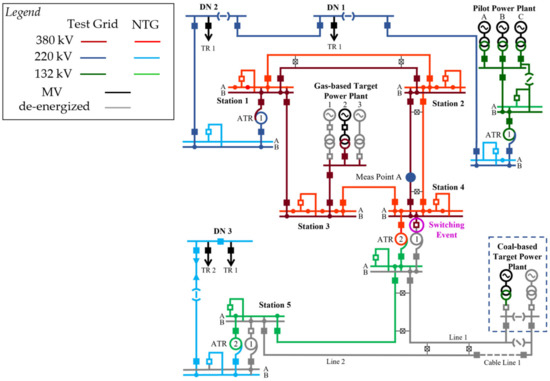
Figure 1.
Simplified single-line scheme of the restoration path of Case A.
- Extra High Voltage (EHV) level (380 kV) is indicated with red lines;
- HV transmission level (220 kV) is indicated with green lines;
- HV subtransmission level (132 kV) is indicated with blue lines;
- medium voltage levels (15 kV and 20 kV) are indicated with black lines; and
- non-energized network portions are indicated with gray lines.
The light color lines refer to the elements supplied by the NTG, and the dark color lines refer to elements supplied by the restoration path. The restoration path consists of:
- The pilot power plant equipped with three hydroelectric generators;
- Two target thermoelectric power plants;
- Sections of HV and EHV TN: 380 kV, 220 kV, and 132 kV Over Head Lines (OHLs) and cables; and
- Sections of DNs.
The restoration test starts with the black start of the pilot power plant, by means of the three 15 kV, 75 MVA power units named GRA, GRB, and GRC. Then, the backbone is supplied, step by step, through the TN path. During this stage, the ballast load and the related DNs are also supplied. The restored DNs are, in sequence, DN1, DN2, and DN3. The auxiliary equipment of the gas-based target power unit is supplied by the restoration backbone after the supply of DN2 to allow the power unit to execute the cold load start-up. Furthermore, the coal-based target power unit executes a load-rejection maneuver and supplies its auxiliary equipment once it has electrically synchronized with the rest of the restoration backbone. The final operation is the integration of the restoration island with the NTG.
The event analyzed in this paper is the electromagnetic transient that follows the energization of the ATR1 of Station 4. Figure 1 represents the network configuration at the time of this event. Up to that moment, the DN1, the DN2, the gas-based power unit, and the HV TN portions of Station 4 were supplied. The closure of the switch on the HV side of the ATR1 supplies the ATR itself, Line 1, Cable Line 1, and Line 2.
2.2. Case B
Figure 2 shows the single-line scheme of the restoration path related to Case B, where the line colors hold the same meaning of the Case A scheme. The restoration path consists of:
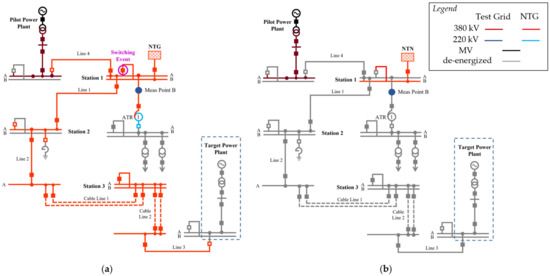
Figure 2.
Simplified single-line scheme of the restoration path of Case B before (a) and after (b) the switching event.
- The pilot hydroelectric power plant;
- The target thermoelectric power plant;
- Portions of HV TN: 380 kV, 220 kV, and 132 kV OHLs and cables; and
- Portions of DNs.
The first step of the restoration test is the black start of the pilot power plant. Then, the restoration backbone is supplied, step by step, through the TN path. In this phase, the load under the restored DNs is also supplied. The ATR of Station 1 supplies the restored DNs. The restoration backbone, after the energization of the DNs, supplies the auxiliary equipment of the gas-based power unit to ensure the correct execution of the cold load start-up, and then the electric parallels with the rest of the restoration backbone. Eventually, the restoration backbone is synchronized with the NTG.
The event of interest, in this case, is the electromagnetic transient that follows the opening of the switch between busbar A and busbar B of Station 1. This event causes the disconnection of the ATR1, Line 1, Line 2, Line 3, Cable Line 1, and Cable Line 2 from the NTG, as shown in Figure 2b. This maneuver is part of the operations needed to build the restoration backbone.
3. Electrical Modelling
To simulate the electromagnetic transients during a black start restoration process with a good approximation, it is of great importance to choose accurate models for both the transformers and the lines involved in the restoration. Such models have to correctly characterize the device behaviors in the time and frequency domains. In this paper, the more detailed electromagnetic models of the DIgSILENT PowerFactory environment are adopted.
The data of the studied ATRs are reported in Table 1. The ATR of Case A contains an auxiliary tertiary delta winding. Table 1 reports the zero sequence circuit parameters set on the transformer and their saturation curves, with details on the magnetizing reactances. Moreover, the residual flux of the ATR of the Case A was deduced from the on-field recordings and, consequently, it was properly set in the three transformer windings. The lines were modelled by means of a uniformly distributed parameter approach [27,28,29]. The method adopted follows the approach of J. Marti by considering constant parameters as a function of frequency. The frequency range was set to [0.1 Hz, 1000 Hz] according to the typical time range of the switching events [30]. The main parameters of the lines involved in the restoration backbone are reported in Table 2, and the data of the pilot power plants are reported in Table 3 and Table 4.

Table 1.
ATR parameters.

Table 2.
Line parameters.

Table 3.
Pilot power plant transformer parameters.

Table 4.
Pilot power plant generator parameters.
4. Simulation Results and Comparisons with On-Field Measurements
In this section, the simulations of the two events presented in Section 2 are compared with the measurement recordings of the real on-field restoration tests.
As regards Case A, the entire restoration backbone was modelled using the real electrical and geometrical parameters provided by the Italian TSO that were presented in the previous section. The modelling also takes into account the electromagnetic coupling between the lines belonging to the restoration backbone and the lines operating for the NTG during the restoration test installed on the same tower [10]. The accuracy of the electromechanical model for this restoration test was already proven by some of the authors in [31].
Figure 3 and Figure 4 show the simulation results related to Case A. In particular, Figure 3 shows the instantaneous values of the transient currents that originated from the ATR energizing event, as seen from Point A of Figure 1, for each phase, together with the harmonic content. Analogously, Figure 4 shows the instantaneous transient voltage behaviors for each phase, together with the harmonic content. In Figure 3, a sustained transient overvoltage following the energizing event is clearly visible.
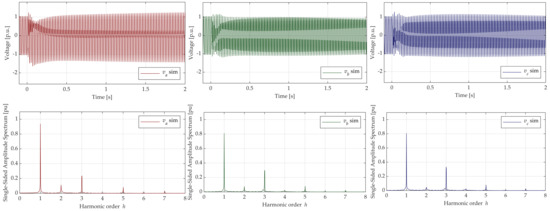
Figure 3.
Simulation results for the line to ground instantaneous voltages and the corresponding harmonic content related to Case A.
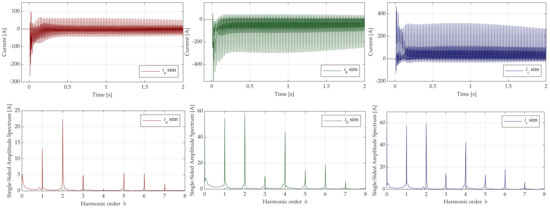
Figure 4.
Simulation results for the line instantaneous currents and the corresponding harmonic content related to Case A.
It is possible to observe a non-negligible third harmonic component in the voltage signals and extremely high second and fourth harmonic components in the current signals. The second harmonic current is typically related to the behavior of the inrush phenomenon [32], but in this case, a further analysis is required; this is because the amplitude of this component is even higher than that of the fundamental frequency current components.
Thus, to investigate the cause behind this strong harmonic content, it was worth analyzing the network impedance as a function of the harmonic order, as shown in Figure 5.
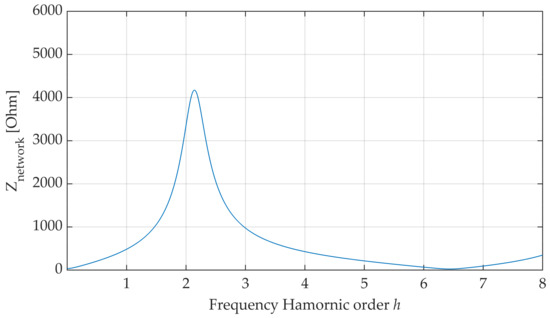
Figure 5.
Network impedance spanned over harmonic frequencies for Case A.
As one can observe from Figure 5, the network resonant frequency is close to 100 Hz, i.e., the second-order harmonic component.
Hence, it is possible to infer that the persistent overvoltage is related to a parallel resonant effect. In fact, the strong harmonic current components generated by the energization transient are sustained due to the high impedance of the network at the resonant frequency, resulting in a sustained TOV.
The parallel resonant effect can be explained by means of the simplified scheme illustrated in Figure 6. Figure 6a represents the simplified circuit scheme of the network involved in the restoration process.
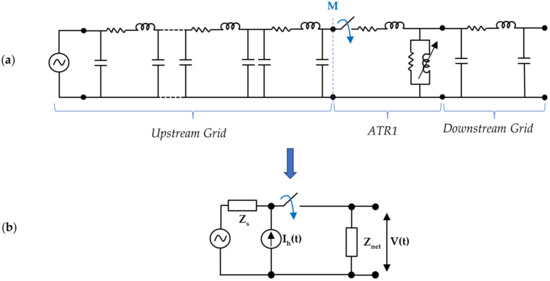
Figure 6.
Simplified equivalent circuit to explain the resonance effect.
The ATR in Figure 6b and the downstream grid in Figure 6a were replaced by the network impedance Znet and the upstream grid was replaced by the source impedance Zs. In Figure 6b, Ih(t) represents the harmonic content generated during the energization operation; V(t) is the voltage seen from the bus where the equivalent impedance is derived (point M); and Vs(t) is the source voltage.
Due to the vast number of parameters involved in the described process, it is difficult to foresee the exact magnitude and duration of the transient phenomena during restoration processes. The following on-field measurements obtained during real restoration tests confirm the simulation results.
The recordings performed during the test show that the simulated event could happen with a non-negligible magnitude. Figure 7 shows the comparison between the recordings and the simulated currents and voltages for the first 100 ms. The comparisons of Figure 7 show a good agreement between the simulation results and the recorded signals, and the phenomena is qualitatively estimated. The displacement between the real measurements and the simulation results in the peak values of the voltage signals can be attributed to the non-perfect estimation of the transformer saturation curve. In fact, the exact shape of the magnetic core saturation curve is not always available in practice, unless a specific test is performed on the machine. For this reason, in this study, the saturation curve was estimated by means of a polynomial function whose parameters are reported in Table 1. Figure 8 shows the simulated voltage behavior obtained by varying the saturation exponent Sexp. From Figure 8, it is possible to infer that the peak value increases with the value of Sexp for phases b and c, and it decreases for phase a.
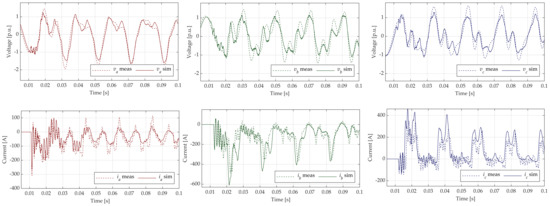
Figure 7.
Line to ground instantaneous voltage and current transients following the switching closure of restoration test A: comparison between real recordings and simulation results for the first 100 ms.

Figure 8.
Line to ground instantaneous voltage transients following the switching closure of restoration test A: comparison between real recordings and simulation results by varying the saturation exponent of the saturation curve Sexp.
As shown in Figure 9, the harmonic components resulting from the simulation environment are also in tune with the ones measured during the restoration test.
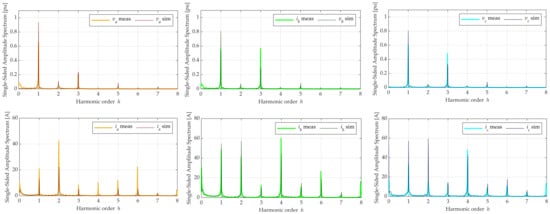
Figure 9.
Comparison between the harmonic content of the voltage and current signals of the recordings and of the simulation results for phase c for the first 100 ms.
As regards Case B, the entire restoration backbone was modelled adopting the real geometrical and electrical parameters provided by the Italian TSO. The NTG is represented by an external grid model and by setting the real three-phase fault level of the corresponding connection bus in the real network.
Figure 10 shows the results of the simulation of the electromagnetic phenomenon in terms of voltage and current behaviors.

Figure 10.
Line to ground instantaneous voltages and currents simulated for the event of the Case B.
After the switch opening, the de-energized transformer is still connected with the remaining portion of the network, i.e., Lines 1, 2, 3, 4 and Cable Lines 1 and 2. The electric transient that follows the switch opening causes the intervention of the differential protection of the ATR1 which, in real networks, is set to preserve transformers and generators from potential damages. In fact, the high current circulating on the HV side of the transformer is not measured on the LV windings (since the LV side of the autotransformer has already been opened). The unexpected intervention of the differential protection of the ATR1 causes the opening of the switch on both sides of the ATR1, as is possible to observe from Figure 2.
Figure 11 reports the network impedance characteristic as a function of the frequency of the system, and Figure 12 reports the harmonic content of the current and voltage signals.
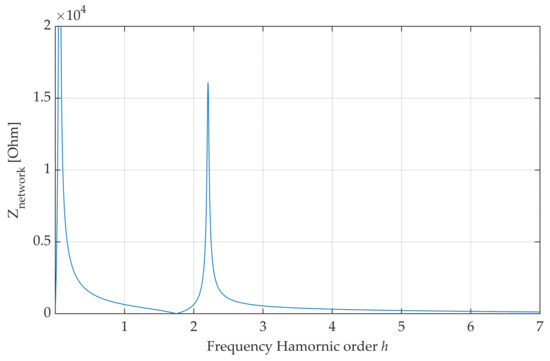
Figure 11.
Net impedance spanned over harmonic frequencies for the restoration backbone of Case B.

Figure 12.
Simulated harmonic content of the current and the voltage signals following the transient of Case B for the three phases.
The residual current components in the transformer around 32 Hz and around 120 Hz are sustained after the switching opening by the high network impedance around that frequency.
In particular, the subharmonic components at 32 Hz and at 120 Hz are particularly high (see Figure 12), meaning that they trigger the intervention of the differential protection, since the second harmonic component is not high enough to block the intervention of the transformer protection. In fact, the intervention of the differential protection is normally inhibited when high values of the second harmonic component are detected (typically when the second harmonic exceeds the 15% of the total signal amplitude) to prevent its undesirable intervention during the transformer energization.
Similarly to Case A, the parallel resonant effect can be explained by means of the simplified scheme shown in Figure 13.
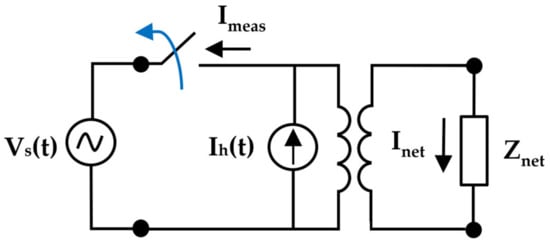
Figure 13.
Simplified equivalent circuit to represent the resonance effect between the ATR and the de-energized network.
In Figure 13, the network impedance Znet represents the parallel between the ATR and the downstream grid; Ih(t) represents the current harmonic content injected in the equivalent circuit due to the residual magnetization; and Vs(t) is the source voltage. The current harmonics for which the network presents a low impedance are drained by the network itself (Inet), whereas the ones for which the network presents a huge impedance flow through the transformer high-voltage winding (Imeas).
It is worth noting that in this case, in contrast to Case A, there are no sinusoidal sources that impose the fundamental frequency. Hence, the harmonic spectrum is more distorted.
Moreover, the magnitude of the phenomenon was also analyzed by means of a real on-field test in this case. The recordings of the restoration test confirm the evidence obtained from the simulations, as shown in Figure 14. The figure shows the comparison between the simulation results and the on-field recordings of the current and voltage transients, respectively, for the two switching events of Case B. The model is able to qualitatively reproduce the electromagnetic transient of current and voltage behaviors. The high harmonic content of the signals makes their correct qualitative estimation very difficult due to the complexity of the real network with respect to the simulation model. Nevertheless, the presence of a persistent and wide transient of the current and voltage behaviors was also correctly detected in the simulation environment.

Figure 14.
Line to ground instantaneous voltage and current transient following the switching event of restoration test B: comparison between real recordings and simulation results.
5. Proposed Solutions
By considering Case A, it was demonstrated that a low resonant frequency of the network may cause a significant harmonic content in the ATR voltage and current during its energization. A possible solution to avoid such phenomenon is the disconnection of the ATR downstream network before carrying out the ATR energization. This procedure was simulated, and the results are reported in Figure 15. In the figure, it is possible to see the significant reduction in the current and voltage harmonic contents, which demonstrates the effectiveness of this solution. Another possible solution is to control the switch closure instant separately by monitoring the voltage level. In this way, each phase is separately closed to minimize the flux flowing through the magnetic core, thereby minimizing the severity of the inrush phenomenon.

Figure 15.
Comparison between the on-field measured harmonic content and the simulated one for Case A. The ATR and the network were separately energized in the simulation.
The same approach of disconnecting the ATR and network separately during the black start operation has also proven to be effective to avoid the transient phenomenon related to Case B. Figure 16 shows the simulated ATR voltage and current behaviors for Case B obtained by first disconnecting the ATR and then the downstream network. It is possible to see that the high circulating currents observed in Figure 14 are not present when implementing such a solution.
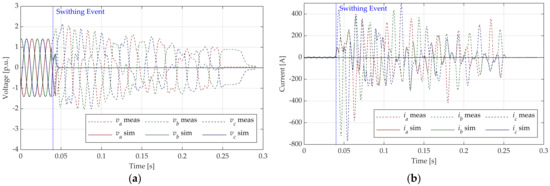
Figure 16.
Comparison between the on-field measured phase voltage (a) and current (b) and the simulated ones for Case B. The ATR and the network were separately energized in the simulation.
6. Conclusions
This work analyzed two electromagnetic phenomena that occurred during the restoration of two electrical networks after a black out. These phenomena were investigated by exploiting both on-field measurements and simulations. The electromagnetic model developed for this study can correctly predict the behavior of the distorted high currents and voltages recorded after the switching transients, despite the high number of parameters needed to run the simulations. The results of this work demonstrate that the analyzed resonant phenomena can happen during the restoration of power systems from a black out, since the restoration backbone typically presents low short-circuit power. This implies that the network impedance could present resonances at low frequencies. In particular, for Case A, the transient overvoltage was caused by the high harmonic distortion following the transformer energization and was amplified by a parallel resonant effect around 100 Hz. For Case B, the transient following the de-energization of a part of HV network gave rise to unexpectedly high current circulations, with an amplitude of up to 600 A, caused by two sub-harmonic resonances, at 32 Hz and 120 Hz. These events could trigger the intervention of the network relays to avoid damages to the electrical equipment, leading to the failure of the restoration process. The paper also proposed simple yet effective solutions to avoid the occurrence of dangerous resonant phenomena during the restoration process; these consisted of the rescheduling of the switching sequence or the switching technologies. Hence, the experimental evidence obtained and the analyses carried out in this paper could be useful to assess optimal restoration plans for the TSOs in order to increase the resilience of the electrical networks.
Author Contributions
Conceptualization, G.M.G. and R.B.; methodology, C.P. and M.P.; software, F.S.; validation, F.S.; formal analysis, F.S. and S.D.S.; investigation, F.S. and S.D.S.; resources, C.P., G.M.G. and M.P.; data curation, F.S. and M.P.; writing—original draft preparation, S.D.S.; writing—review and editing, F.S., R.B. and S.D.S.; visualization, S.D.S. and F.S.; supervision, R.B. and G.M.G.; project administration, R.B. and G.M.G.; funding acquisition, C.P., G.M.G. and M.P. and S.D.S. All authors have read and agreed to the published version of the manuscript.
Funding
This project is funded under the BIRD 2022 program promoted by the University of Padova, grant number DAMB_BIRD2222_01, and by Terna S.p.A. by means of the “Consorzio Interuniversitario Nazionale Energia e Sistemi Elettrici” (ENSIEL) under Grant DSC016.
Data Availability Statement
Restrictions apply to the availability of these data. Data was obtained from Terna S.p.A. and are available from the authors with the permission of Terna S.p.A.
Conflicts of Interest
The authors declare no conflict of interest.
References
- Benato, R.; Sessa, S.D.; Giannuzzi, G.M.; Pisani, C.; Poli, M.; Sanniti, F. Transformer Resonant Phenomena during Power System Restoration Tests. In Proceedings of the 114th AEIT International Annual Conference, Rome, Italy, 3–5 October 2022. [Google Scholar]
- ENTSO-E. Current Practices in Europe on Emergency and Restoration; ENTSO-E: Brussels, Belgium, 2014. [Google Scholar]
- Liu, Y.; Fan, R.; Terzija, V. Power System Restoration: A Literature Review from 2006 to 2016. J. Mod. Power Syst. Clean Energy 2016, 4, 332–341. [Google Scholar] [CrossRef]
- Khoshkhoo, H.; Khalilifar, M.; Shahrtash, S.M. Survey of Power System Restoration Documents Issued from 2016 to 2021. Int. Trans. Electr. Energy Syst. 2022, 2022, e1754013. [Google Scholar] [CrossRef]
- Mtariani, E.; Mastroianni, F.; Romuano, V. Field Experiences in Reenergization of Electrical Networks from Thermal and Hydro Units. IEEE Trans. Power Appar. Syst. 1984, PAS-103, 1707–1713. [Google Scholar] [CrossRef]
- Sforna, M.; Bertanza, V.C. Restoration Testing and Training in Italian ISO. IEEE Trans. Power Syst. 2002, 17, 1258–1264. [Google Scholar] [CrossRef]
- Delfino, B.; Denegri, G.B.; Invernizzi, M.; Morini, A.; Cima Bonini, E.; Marconato, R.; Scarpellini, P. Black-Start and Restoration of a Part of the Italian HV Network: Modelling and Simulation of a Field Test. IEEE Trans. Power Syst. 1996, 11, 1371–1379. [Google Scholar] [CrossRef]
- Benato, R.; Bruno, G.; Sessa, S.D.; Giannuzzi, G.M.; Ortolano, L.; Pedrazzoli, G.; Poli, M.; Sanniti, F.; Zaottini, R. A Novel Modeling for Assessing Frequency Behavior during a Hydro-to-Thermal Plant Black Start Restoration Test. IEEE Access 2019, 7, 47317–47328. [Google Scholar] [CrossRef]
- Benato, R.; Giannuzzi, G.M.; Poli, M.; Sanniti, F.; Zaottini, R. The Italian Procedural Approach for Assessing Frequency and Voltage Behavior during a Bottom-up Restoration Strategy. In Proceedings of the 2020 IEEE International Conference on Environment and Electrical Engineering and 2020 IEEE Industrial and Commercial Power Systems Europe, EEEIC/I and CPS Europe, Madrid, Spain, 9–12 June 2020. [Google Scholar]
- Benato, R.; Giannuzzi, G.M.; Masiero, S.; Pisani, C.; Poli, M.; Sanniti, F.; Talomo, S.; Zaottini, R. Analysis of Low Frequency Oscillations Observed during a Power System Restoration Test. In Proceedings of the 113th AEIT International Annual Conference, Milan, Italy, 4–8 October 2021. [Google Scholar]
- Hachmann, C.; Becker, H.; Haack, J.; Braun, M. Improving the Resilience of Power System Operation—Contribution of Renewable Energies in Power System Restoration. In Proceedings of the NEIS 2019, Conference on Sustainable Energy Supply and Energy Storage Systems, Hamburg, Germany, 19–20 September 2019; pp. 1–6. [Google Scholar]
- Li, X.; Liu, C.; Lou, Y. Start-up and Recovery Method with LCC–HVDC Systems Participation during AC/DC System Black-Starts. IET Gener. Transm. Distrib. 2020, 14, 362–367. [Google Scholar] [CrossRef]
- Bahrman, M.; Bjorklund, P.-E. The New Black Start: System Restoration with Help from Voltage-Sourced Converters. IEEE Power Energy Mag. 2014, 12, 44–53. [Google Scholar] [CrossRef]
- Liu, W.; Sun, L.; Lin, Z.; Wen, F.; Xue, Y. Multi-Objective Restoration Optimisation of Power Systems with Battery Energy Storage Systems. IET Gener. Transm. Distrib. 2016, 10, 1749–1757. [Google Scholar] [CrossRef]
- Abeynayake, G.; Cipcigan, L.; Ding, X. Black Start Capability from Large Industrial Consumers. Energies 2022, 15, 7262. [Google Scholar] [CrossRef]
- Zhu, Y.; Zhou, Y.; Wang, Z.; Zhou, C.; Gao, B. A Terminal Distribution Network Black-Start Optimization Method Based on Pruning Algorithm Considering Distributed Generators. Energy Rep. 2022, 8, 237–244. [Google Scholar] [CrossRef]
- Zhao, J.; Zhang, Q.; LIU, Z.; WU, X. A Distributed Black-Start Optimization Method for Global Transmission and Distribution Network. IEEE Trans. Power Syst. 2021, 36, 4471–4481. [Google Scholar] [CrossRef]
- Aguilar-Dominguez, D.; Ejeh, J.; Brown, S.F.; Dunbar, A.D.F. Exploring the Possibility to Provide Black Start Services by Using Vehicle-to-Grid. Energy Rep. 2022, 8, 74–82. [Google Scholar] [CrossRef]
- Zhao, Y.; Zhang, T.; Sun, L.; Zhao, X.; Tong, L.; Wang, L.; Ding, J.; Ding, Y. Energy Storage for Black Start Services: A Review. Int. J. Min. Met. Mater. 2022, 29, 691–704. [Google Scholar] [CrossRef]
- Jensvoll, E.L. Transients during Energization of Unloaded Generator Step-Up Transformers. Master’s Thesis, NTNU (Norwegian University of Science and Technology), Trondheim, Norway, 2019. [Google Scholar]
- Toki, A. Power Quality Problems Due to Transformer Inrush Current. Available online: https://www.semanticscholar.org/paper/Power-Quality-Problems-Due-to-Transformer-Inrush-Toki/630f7ebf77880b76a27517cd85cadd134c5af9c1 (accessed on 26 July 2022).
- Lee, H.J.; Lee, K.S.; Park, S.M.; Bae, J.C.; Song, I.J. Analysis of the Harmonic Resonance during Energizing the Primary Restorative Transmission Systems. In Proceedings of the 2005 IEEE Russia Power Tech, St. Petersburg, Russia, 27–30 June 2005; pp. 1–5. [Google Scholar]
- Povh, D.; Schultz, W. Analysis of Overvoltages Caused by Transformer Magnetizing Inrush Current. IEEE Trans. Power Appar. Syst. 1978, PAS-97, 1355–1365. [Google Scholar] [CrossRef]
- Kulkarni, S.V.; Khaparde, S.A. Transformer Engineering Design and Practice; Marcel Dekker, Inc.: New York, NY, USA; Basel, Switzerland, 2004. [Google Scholar]
- Yoon, M.; Yu, W.; Oh, J.; Lee, H. A Study on the Harmonic Resonance during Energizing Primary Restorative Transmission Systems: Korean Power System Case. Energies 2022, 15, 290. [Google Scholar] [CrossRef]
- Ketabi, A.; Ranjbar, A.M.; Feuillet, R. Analysis and Control of Temporary Overvoltages for Automated Restoration Planning. IEEE Trans. Power Deliv. 2002, 17, 1121–1127. [Google Scholar] [CrossRef]
- Marti, J.R. Accurate Modelling of Frequency-Dependent Transmission Lines in Electromagnetic Transient Simulations. IEEE Trans. Power Appar. Syst. 1982, PAS-101, 147–157. [Google Scholar] [CrossRef]
- Dommel, H.W. EMTP Theory Book; Boneville Power Administration: Portland, OR, USA, 1986. [Google Scholar]
- Benato, R.; Sessa, S.D.; Gardan, G.; Palone, F.; Sanniti, F. Experimental Harmonic Validation of 3D Multiconductor Cell Analysis: Measurements on the 100 km Long Sicily-Malta 220 kV Three-Core Armoured Cable. IEEE Trans. Power Deliv. 2022, 37, 573–581. [Google Scholar] [CrossRef]
- DIgSILENT. PowerFactory Technical Reference: Overhead Line Models 2020; DIgSILENT GmbH: Gomaringen, Germany, 2020. [Google Scholar]
- Benato, R.; Dambone Sessa, S.; Sanniti, F. Lessons Learnt from Modelling and Simulating the Bottom-Up Power System Restoration Processes. Energies 2022, 15, 4145. [Google Scholar] [CrossRef]
- Bertagnolli, G. Short-Circuit Duty of Power Transformers; ABB Trasformatori: Zurich, Switzerland, 1996. [Google Scholar]
Disclaimer/Publisher’s Note: The statements, opinions and data contained in all publications are solely those of the individual author(s) and contributor(s) and not of MDPI and/or the editor(s). MDPI and/or the editor(s) disclaim responsibility for any injury to people or property resulting from any ideas, methods, instructions or products referred to in the content. |
© 2023 by the authors. Licensee MDPI, Basel, Switzerland. This article is an open access article distributed under the terms and conditions of the Creative Commons Attribution (CC BY) license (https://creativecommons.org/licenses/by/4.0/).