Article

Experimental Investigation of the Influence of NO on a PEM Fuel Cell System and Voltage Recovery Strategies

by
Peter Reithuber
1,*,
Florian Poimer
2,
Stefan Brandstätter
2,
Eberhard Schutting
1,
Simon Buchberger
1,
Alexander Trattner
1,2 and
Helmut Eichlseder
1
1
Institute of Thermodynamics and Sustainable Propulsion Systems, Graz University of Technology, Inffeldgasse 19, 8010 Graz, Austria
2
HyCentA Research GmbH, Inffeldgasse 15, 8010 Graz, Austria
*
Author to whom correspondence should be addressed.
Energies 2023, 16(9), 3720; https://doi.org/10.3390/en16093720
Submission received: 21 March 2023 / Revised: 19 April 2023 / Accepted: 23 April 2023 / Published: 26 April 2023

Abstract

:
Air contaminants can have detrimental effects on the performance and durability of proton exchange membrane (PEM) fuel cell vehicles. This research focuses on the experimental investigation of the effect of nitrogen monoxide (NO) in the cathode gas stream, which provokes a cell voltage decrease due to the partially reversible adsorption of NO on the platinum catalyst. The concentration and exposure time of NO in the cathode gas stream are varied at selected constant current densities and load ramps to assess the effects throughout the fuel cell system operating range. The results show the cell voltage loss in the presence of NO and reveal a near-catalyst saturation with increased injected NO mass. Additionally, several voltage recovery and mitigation strategies are introduced and discussed by presenting conclusions about the general effect of NO on a fuel cell system in operation. The most promising recovery strategy for fuel cell systems is identified, and the overall system degradation is discussed. All experiments are performed in a test bed environment on a 25 kW low-temperature fuel cell system via controlled injection of NO into the cathode gas stream.

1. Introduction

Green hydrogen (H2) can play a major role in reducing greenhouse gas emissions by replacing fossil fuels in several sectors of society [1], and it can serve as a storage medium for renewable energies, helping to overcome temporary energy shortages [2]. A PEM fuel cell powered by green hydrogen is therefore a key technology for the decarburization of the mobility sector [3]. These fuel cells are, however, sensitive to reactant pollutants. Well-defined standards have been established to ensure an appropriate hydrogen purity to fulfill the required fuel cell endurance. In contrast, the quality of the cathode air depends on the ambient conditions in which the fuel cell is operated. Dedicated air filters can be installed to prevent the most harmful impurities to enter the cathode [4,5], but this also increases system costs and causes pressure losses. Therefore, depending on the ambient condition and the design of the cathode gas path, air impurities can pose a risk to the fuel cell’s performance and lifetime. Impurities can be gaseous or in the form of particles, such as sodium chloride (NaCl), which is present on roads as a deicer or in coastal regions [6]. Several gaseous air impurities with a negative impact on fuel cell operation were identified, such as sulfur oxides (SOx), nitrogen oxides (NOx), carbon monoxide (CO), carbon dioxide (CO2) [7], hydrogen sulfide (H2S), ammonia (NH3) [8], and benzene (C6H6) [9]. Additionally, toluene (C6H5CH3) and ethane (C2H6) [10] and gas mixtures such as propene (C3H6), acetonitrile (CH3CN), and bromomethane (CH3Br) are reported to have a harmful influence when present in the fuel cell cathode gas stream [11]. Sulfur compounds are considered to have the most significant negative effect on fuel cell operation and lifetime [8]. In this research, the focus lies on NO, which is—together with nitrogen dioxide (NO2)—a component of NOx. Combustion engines are the main source of NOx in road traffic, thereby exposing fuel cell vehicles to the harmful gas mixture.
On-road measurements performed in [12] report an average concentration of 241 ppb NO on an Austrian highway, with a temporary maximum of 3.2 ppm NO on the highway due to a passing vehicle and 1 ppm NO in a highway tunnel. The samples were taken close to the front number plate of the test vehicle. Reference [13] also refers to on-road concentration measurements performed on a German highway, stating that a fuel cell vehicle would be exposed to concentrations of 219 ppb in urban areas and up to 2 ppm in traffic jams or tunnels. Reference [12] derived a NO-to-NO2 ratio during the on-road tests of 5:1. When fuel cells are operated in special locations, such as mines, the NO concentrations can exceed the road measurements and reach up to 25 ppm [14].
The presence of NO and NO2 in the fuel cell causes catalyst poisoning and a decrease in oxygen reduction reaction (ORR) kinetics [15]. Reference [16] furthermore states that NO adsorbs on the platinum of the catalyst and reduces the electrochemically active surface area. In a galvanostatic mode of fuel cell operation, the reduction of electrochemically active surface area results in a decrease in cell voltage. In the presence of the platinum catalyst, NO2 is split up into NO and oxygen (O), resulting in the adsorption of NO on the catalyst surface [17]. Therefore, NOx has the same effect as pure NO in the fuel cell, supporting the focus of this research on NO rather than on NOx.
The influence of NO on the cathode catalyst is considered to be recoverable or partly recoverable [4,5]. The desorption of NO can be accelerated by a reduction and by an oxidation process [15]. Reference [18] performed studies on the reduction of NO adsorbed on platinum and deduced that hydroxylamine (NH3OH+) and ammonium (NH4+) can be formed at cell potentials of 0–0.2 V. The reason for the reduction of adsorbed NO to ammonium and hydroxylamine at low potentials is considered to lie in the low hydrogen surface coverage on the catalyst at these potentials [18]. The ammonium cations reduce the protonic conductivity of Nafion™ [19] and therefore contribute to fuel cell degradation. Hence, operating the fuel cell at low cell potentials (<0.3 V) is a suitable voltage recovery strategy but has the drawback of introducing the membrane-degrading by-product ammonium since lower potentials facilitate the reduction of NOx [15]. The oxidation of NO occurs above 0.75 V and results in the formation of nitrate [18]. The cell potential for oxidation indicates possible suitability for the application in fuel cell systems since the cell potential is within the normal operating range. The nitrate anions are soluble in water and are considered to have no degrading effect in the fuel cell [15]. According to [15], no poisoning of the membrane takes place in the presence of NO and NO2. Therefore, NOx-related membrane degradation is caused by the aforementioned by-products.
Reference [17] performed experiments on single cells and a ten-cell stack with NO, NO2, and NH3. The injection of 10 ppm NO into a single cell at constant current density over 50 min showed an initially fast voltage decrease followed by a long period of low voltage gradient. The experiments with the ten-cell stack revealed that the cell voltage distribution over the stack was not much different compared to an operation without contaminants but on a lower voltage level. Single-cell experiments with NOx (with NO:NO2 of 9:1) concentrations of 10 ppm, 140 ppm, and 1480 ppm were performed in [20]. The cell voltage sharply decreased at the beginning of the 1 h 1480 ppm NOx injection and then declined more slowly, followed by a 7 h operation with synthetic air and 9 h of purging the cathode with nitrogen to regain the cell voltage. Reference [21] discovered in single-cell experiments that negative effects on the cell voltage start from a concentration of 150 ppb NO, and concentrations up to 5 ppm were investigated. Further discoveries were that NOx peaks on top of a continuous injection have a stronger effect on the cell voltage than the continuous injections alone at a comparable injected NOx amount. The suggested voltage recovery process is to operate the fuel cell at potentials below 0.3 V in addition to continuing time-consuming operation with clean air. Reference [22] performed different voltage recovery strategies after a 100 ppm NO2 exposure of the cathode. Different air flow rates, current densities, and polarization curves were evaluated for voltage recovery, whereas the polarization curves turned out to be the most effective. Reference [16] concludes that a full cell voltage recovery can only be achieved by oxidation removal of NO in contrast to reduction removal. A 36-cell stack with an active cell area of 21 cm² was exposed to propene in [23], which reported a significant influence of the contaminant on the cell voltage distribution of the stack and the role of varying temperature, air flow, and cell water management. These experiments show that exposing a fuel cell stack to a contaminant is worth examining since factors such as reactant distribution, pressures, and temperatures vary more strongly with an increasing number of cells in a stack.
The aforementioned experiments with the contaminants NO and NO2 were performed with single cells and short stacks. To better understand the effect of NO on fuel cell vehicles, however, it is necessary to perform investigations on the system level. These investigations are, to the knowledge of the authors, still missing, and this paper contributes to closing this gap. The focus of this research lies in assessing the short-term effects of NO and voltage recovery procedures over a wide range of current densities, contaminant concentrations, and exposure times. Therefore, an accelerated testing approach was chosen in which the injected NO concentrations far exceed the concentrations detected in traffic. This magnifies the effect on the fuel cell voltage, the recovery procedures, and the overall system degradation, thereby providing a broader understanding of the response of a fuel cell system exposed to NO. Although the results from this approach cannot be directly transferred to the service life of an automotive fuel cell due to the accelerated testing character, they can serve as a basis for decision-making in fuel cell system design and application. For the task of voltage recovery, the requirements of fuel cell systems have to be considered, since certain operating parameters, such as a minimum cell voltage, must not be violated to avoid rapid fuel cell degradation. The approach in this study is, therefore, to find a suitable operating strategy for the fuel cell system to achieve voltage recovery. This could, in the future, be implemented into the fuel cell control unit of a vehicle and performed whenever an otherwise unexplainable voltage drop occurs.

2. Materials and Methods

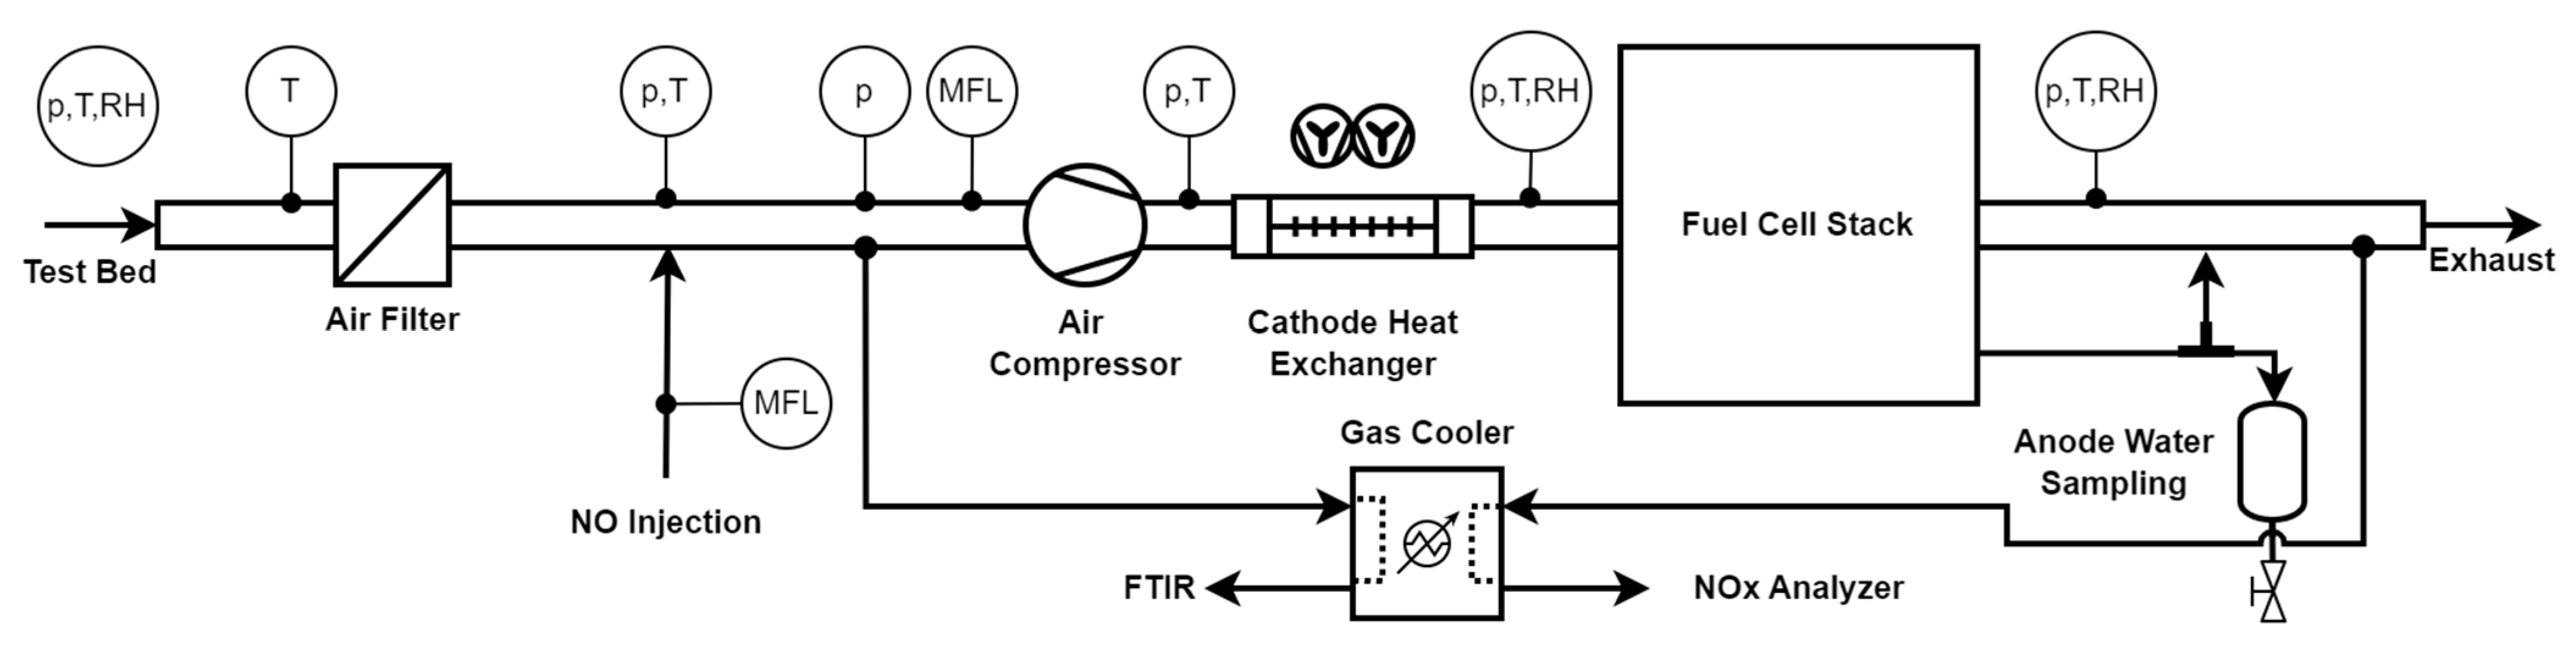
2.1. Experimental Setup

The fuel cell system used in the experiments is a 25 kW range extender system designed for application in public transport buses. The system is, however, built upon a framework for laboratory use, which allowed access to the individual components of the system and the installation of measurement equipment. The main focus of this paper is on the cathode gas path, which is composed of an air filter, a flow sensor, and an air compressor followed by an air cooler before the stack entry. There is no external humidification of the cathode gas. A detailed analysis of the effect of cathode gas humidification on the PEM fuel cell behavior is shown in [24]. The study describes that fuel cell systems without external reactant humidification have the advantages of lower complexity, better cold-start behavior, and lower packaging space requirements. On the other hand, the operating temperature is lower than in externally humidified systems since drying out the membrane has to be avoided [24]. The range of operating parameters of the system is listed in Table 1. In the exhaust of the system under test, a backpressure and shut-off valve is installed. The cathode exhaust gas is fed, together with the anode purge and drain pipes, to the ventilation system of the test bed. Integrated into the system are, apart from several other sensors, a cell voltage measurement (CVM) unit and stack current measurement.
A vital part of the NO experiments is the flow-controlled injection of NO into the cathode gas stream. This was performed between the air filter and the compressor, as can be seen in Figure 1, allowing for proper mixing of the ambient air with the injected pollutant. For monitoring and evaluating the NO experiments, gas samples are taken from the cathode inlet and outlet side and fed through a gas cooler to the analyzers. The injected NO concentration is measured with a Fourier-transform infrared (FTIR) spectroscope between the NO injection point and air compressor (AVL SESAM i60 FT, FTIR spectrum range: 650–4500 cm−1, spectrum resolution 0.5 cm−1, spectra processed by the equipment and displayed as concentrations). In the combined cathode and anode (purge and drain) exhaust, the NO and NO2 concentrations are measured with a chemiluminescence detector (CLD) NOx analyzer (AVL AMA i60, CLD reproducibility ≤5% of full scale; measuring ranges 0–250 ppm and 0–2400 ppm). The materials used in the gas pipes are polytetrafluoroethylene (PTFE) and stainless steel. These inert materials prevent undesired reactions between H2 and NO, which are reported to occur in the presence of a catalyst [25]. The cathode gas stream is furthermore equipped with pressure (p), temperature (T), mass flow (MFL), and relative humidity (RH) sensors. The anode drain water is sampled in a stainless steel flask for further chemical analysis. All further fluid circuits, measurement equipment, and test bed infrastructure are excluded from Figure 1 for better visibility.
The gases used at the test bed are hydrogen (H2, 99.999% purity), ambient air, NO (99.5% purity), nitrogen (N2, 99.999% purity), and argon (Ar, 99.996% purity). Furthermore, multipoint calibrations were performed on all gas analyzers daily.
The fuel cell system has a nominal operating range from 0.32 A/cm2 to 1.22 A/cm2. In the experiments, the lower limit was decreased to 0.04 A/cm2. To avoid drying out the membrane due to the increased cathode stoichiometry, the low current densities were only chosen for characterization purposes and for a limited number of experiments.

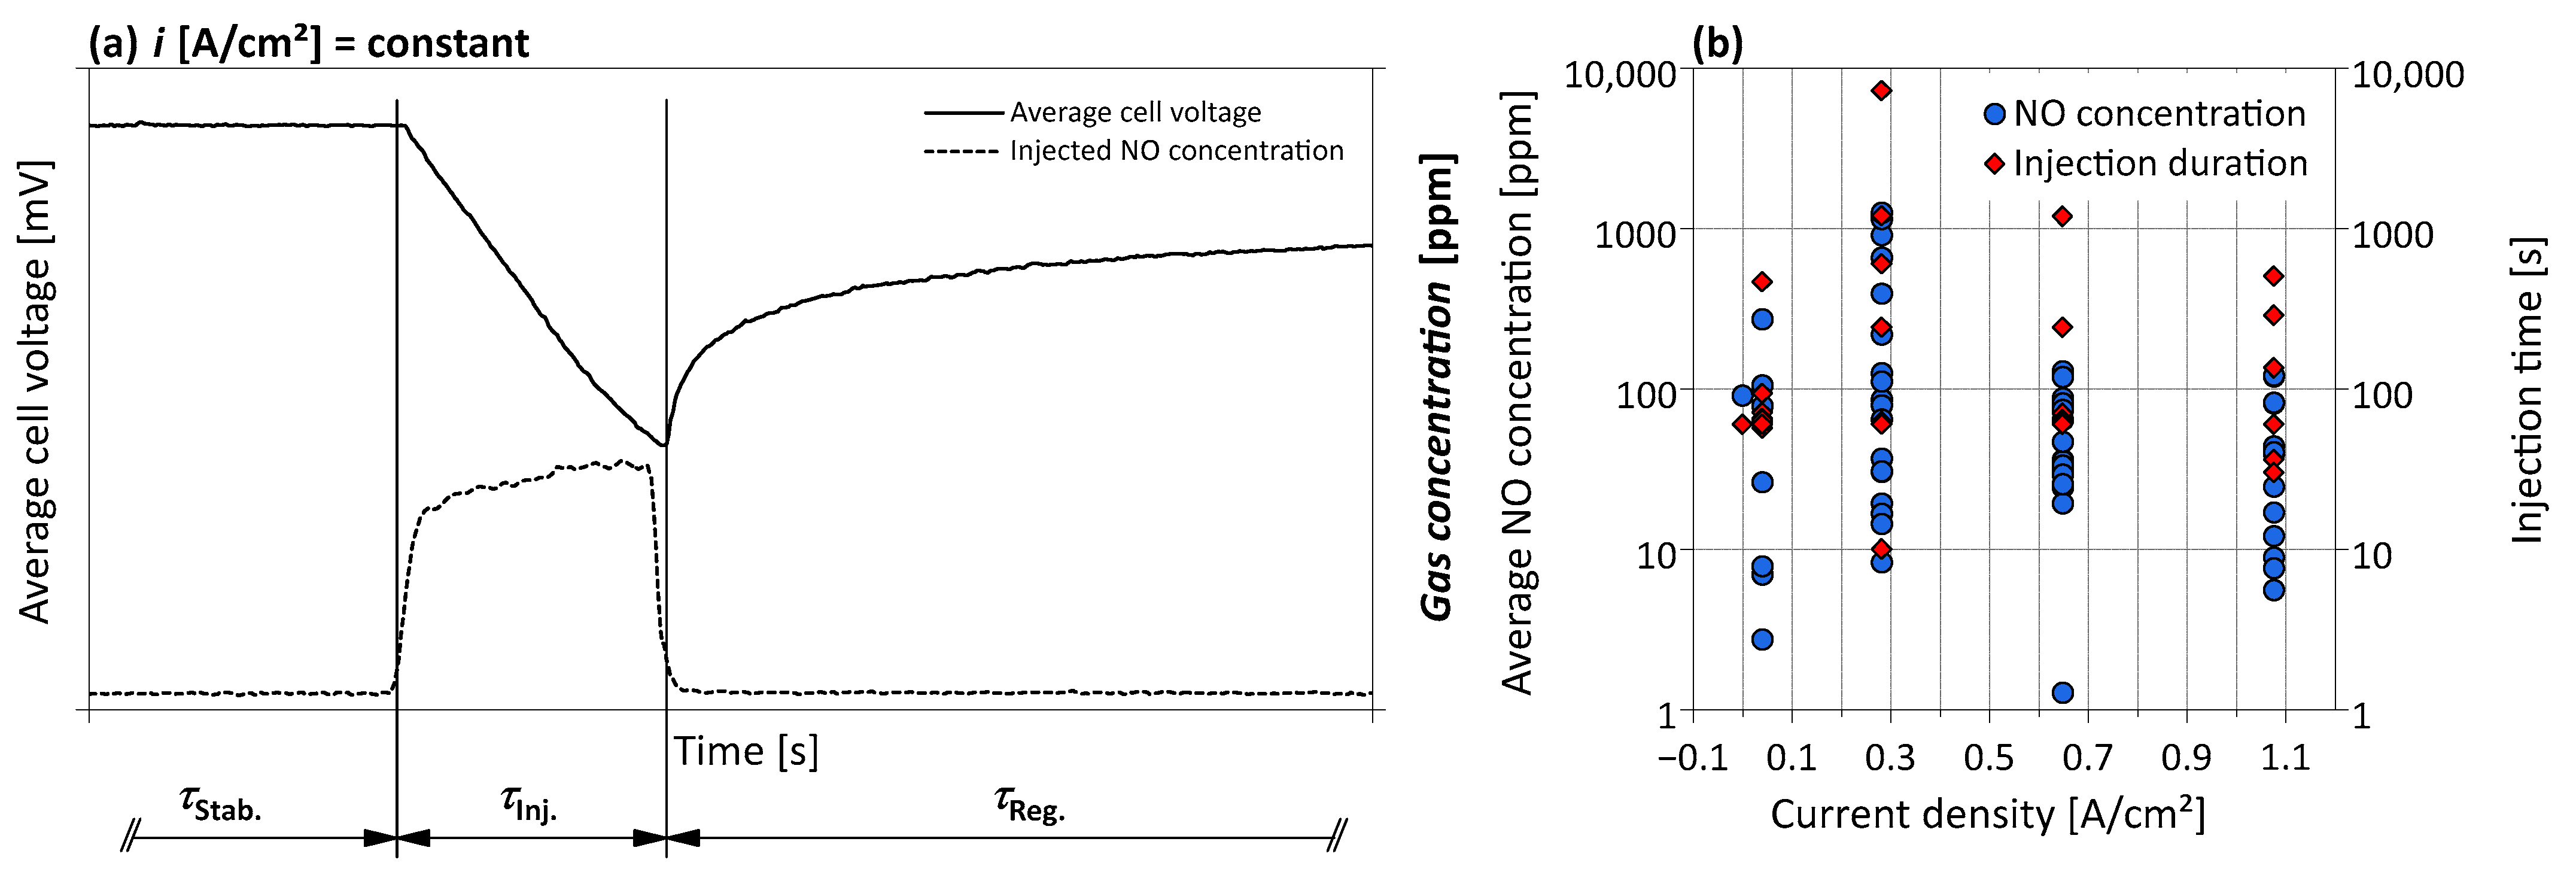
2.2. NO Injection Procedure

This research aimed to investigate the effect of NO within the operating range of the fuel cell system. Figure 2a shows a schematic depiction of a representative NO injection. The average stack voltage is calculated as the arithmetic average of all cell voltage signals provided by the CVM. This average voltage represents the most important parameter for evaluating the effect of NO in this paper since NO has a direct influence on cell voltage. The dashed line in Figure 2a shows the NO concentration measured before the cathode inlet. The cell voltage decreases when the NO injection starts and increases again after the injection is turned off. In this schematic depiction, the current density is constant. Therefore, the change in fuel cell voltage comes solely from the NO injection. Three parameters are included in Figure 2a which distinguish the NO experiments: the current density i, the injection time τ Inj . , and the injected gas concentration. The current density i is either kept constant during the experiment or changed in the form of an increasing and decreasing load ramp with a slope of 1 A/s. Several different constant current densities were tested, three of which lie within or close to the nominal fuel cell operating range at 0.28 A/cm², 0.65 A/cm², and 1.08 A/cm². The scope of the variables can be seen in Table 2 and Figure 2b, in which the injected NO concentrations and the injection times are displayed over the constant current density references. The plotted injection durations show that intermediate time intervals were sometimes chosen, which is not explicitly described in Table 2.
The stabilization time τ Stab . before the NO injection was equal for all experiments performed at a constant current density. A stabilized cell voltage is vital for evaluating the NO experiment since it is the main reference for the voltage drop caused by the NO injection. Before the stabilization time, the system preconditioning is performed, which ensures that the stack temperature and the membrane water content are comparable between the experiments.
A core aspect of the NO experiments is the injection time τ Inj . , which defines the amount of NO that goes into the fuel cell at a given concentration. Short-time injections of up to 60 s were performed with higher NO concentrations compared to the lower concentrations used in long-time injection experiments. This way, questions regarding the relationship between voltage drop and injected amount of NO and the adsorption and desorption rate of NO on the cathode catalyst are addressed. Therefore, the results will be discussed, differentiating between short-time and long-time injection.
As Figure 2a shows, the injected NO concentration does not resemble a rectangular shape but increases gradually to the desired value. This behavior is caused by the pressure and flow conditions in the cathode gas stream. The average and maximum values of this concentration curve depend on its shape and are therefore not suitable for comparisons between the experiments. Instead, the total injected amount of NO is calculated and used for the evaluation.
The described parameters were defined and set in advance of the experiment, and then, the entire test run was performed automatically by the system test bed under the supervision of the test bed operator. This process should ensure comparable and repeatable experiments.

2.3. Voltage Recovery Procedure

The catalyst poisoning caused by NO is considered to be reversible, which in turn means that the decrease in fuel cell voltage should be recoverable. The desorption of NO was observed to take place right after the injection ended and was expressed as an immediate increase in cell voltage. In this paper, seven recovery procedures with and without fuel cell operation are tested and discussed.

2.3.1. Voltage Recovery during Fuel Cell Operation

A proven method for recovering the fuel cell voltage is to operate the cathode with non-contaminated air [20]. In the case of the present research, the fuel cell was operated with ambient air under varying operating conditions to find the most effective recovery procedure.
The first applied recovery strategy was to operate the fuel cell with ambient air at the same constant current density as during the NO injection, as can be seen in Figure 2a. The advantage of this procedure is that the recovery of the cell voltage can be compared directly with the stack voltage before the injection. The measure is, however, time-consuming. Table 2 lists the performed air recovery durations. To advance voltage recovery, four procedures were developed in the course of this research in which the fuel cell is operated at varying conditions.
One method is to intentionally decrease the air stoichiometry of the stack to force the cell voltages close to 0.3 V. As suggested in [18], the reduction of NO takes place below this cell potential. To avoid severe damage to the fuel cell stack, lower voltage levels were avoided, and the air stoichiometry was kept above one to exclude reactant starvation. The procedure was performed at a constant current density of 0.49 A/cm2 following the NO injection.
A method with less danger for the fuel cell system is high-load recovery, in which the current density is increased to the system maximum of 1.22 A/cm2 and kept constant for a few seconds. At this high-load point, a low cell potential, but still higher than during the air stoichiometry recovery, is reached. A further aspect of the high-load recovery is the increased flow of product water, which can support the purging of the cathode from harmful by-products formed during the NO injection. Furthermore, the increased cathode pressure and temperature could play a role in the desorption of NO from the catalyst.
To increase the liquid water formation in the cell and to support the flushing-out, a further high load recovery procedure was defined. During the load ramp to the high load point, the stack coolant inlet temperature is decreased by a few degrees to advance condensation in the fuel cell. When the load point of 1.22 A/cm2 is reached, the cathode stoichiometry is gradually increased above the required stoichiometry for a short time and decreased again to cause an air purge. These measures are expected to support an advanced voltage recovery.
The fourth method makes use of the current density range of the system in the shape of an increasing and decreasing load ramp, performed from 0.04 A/cm2 to 1.08 A/cm2 and back down to 0.04 A/cm2 with a slope of 1 A/s. This sweep of current density covers a wide range of cell potentials, including high potentials which are considered to cause NO oxidation and therefore voltage recovery, as described in [18].
Some of the mentioned recovery procedures were performed both individually and in combination.

2.3.2. Voltage Recovery without Fuel Cell Operation

A method of recovering the fuel cell voltage when the fuel cell is not in operation is purging the cathode with nitrogen, as performed by [20]. Therefore, a few experiments were dedicated to investigating this effect on the fuel cell system. In the process, the cathode was purged with dry nitrogen for ten minutes after the fuel cell shutdown. A longer purging period was not considered appropriate due to the dry nitrogen feed and the danger of drying out the cell components. In one experiment, argon as a noble gas was used instead of N2 to provide comparison. The method of purging the cathode with gas to recover the fuel cell voltage is not considered applicable for use in vehicles since pure nitrogen is not available in the car. Therefore, another strategy was conceived which is based on the idea that hydrogen replaces NO on the platinum catalyst. After the voltage bleeding procedure during fuel cell shutdown, the cathode was closed and the anode pressurized with hydrogen, provoking a hydrogen crossover to the cathode. Since the remaining oxygen on the cathode was consumed during the voltage bleeding process, the now present hydrogen could help to replace NO on the catalyst.

2.3.3. Recovery Cycle

In addition to the dedicated voltage recovery strategies, a recovery cycle was performed after an NO injection experiment to regain the fuel cell voltage in case the recovery strategy was not sufficient. The cycle was performed regularly, with the exception of a few experiments in which no or a reduced recovery was performed intentionally. The cycle itself is composed of the preconditioning period, followed by three consecutive increasing and decreasing load ramps from 0.04 A/cm2 to 1.08 A/cm2 and back down to 0.04 A/cm2 with a slope of 1 A/s. Since the cycle was performed identically and repeatedly, it can be used to evaluate the fuel cell state of health over the whole experimental period.

2.3.4. Evaluation Strategy

A crucial question regarding voltage recovery is choosing an appropriate reference operating point for evaluating the effectiveness of the recovery procedure. In the case of air recovery at constant load, the highest average stack voltage at the end of the recovery period can be compared with the average stack voltage at the end of the stabilization time before the injection takes place. The difference represents the non-recovered cell voltage. This comparison is possible because the current density was kept constant throughout the experiment. In the case of other air recovery procedures performed at different current densities than the NO injection, another reference must be found. The automated current profile used throughout the experiments includes several possible reference points, but only one reference point at 0.04 A/cm2 was included in every relevant experiment and was performed at comparable system conditions. This reference point lies between the preconditioning phase and the NO experiment. It was repeated after the voltage recovery procedure as well and can therefore be used for evaluating the effectiveness of the strategy. Since the reference point was always approached with a comparable decreasing load ramp, the average stack voltage at the moment of reaching the desired load is used for comparison.
In the case of the recovery procedures without fuel cell operation, the same reference point at 0.04 A/cm2 is used. After the recovery procedure without fuel cell operation, the system is started and preconditioned before the voltage reference point is reached. This approach comes with the disadvantage of a considerable fuel cell operation after the recovery procedure, which allows no isolated evaluation of the method itself. It is, however, necessary to use reference points at which the fuel cell is conditioned to enable comparability.

3. Results and Discussion

In total, 69 NO injection experiments with accompanying recovery strategies were performed and evaluated. In this section, the results for the different NO injection and recovery procedures are presented and discussed, as were the influence on the fuel cell system and the overall degradation after the experimental series.

3.1. NO Injection Experiments

3.1.1. Effect on the Fuel Cell Stack

Due to the lack of comparable investigations in the literature, the effect of NO on the individual cells in a stack of this size was unknown. Since the differences between the cell voltages of the stack were within an expected range during normal fuel cell operation, a significant change caused by the NO injection was not expected. For example, at the constant current density point of 0.65 A/cm2 before the NO injection, the difference between the highest and lowest measured cell voltage was at a maximum of 72 mV and 67.8 mV averaged over the 60 s dwell time. During the following 60 s injection of 144.7 mg NO, the difference between the maximum and minimum stack cell voltages reaches a peak value of 72 mV at the beginning of the injection and an average of 61.7 mV over the whole injection time. This example shows that the cell voltage uniformity of the stack is not influenced negatively by the presence of NO and that the pollutant is distributed evenly over all cells of the stack. This contradicts the findings in [17], in which NO caused a slight deterioration of the short-stack cell voltage distribution, and [23] reports a strong influence of the contaminant propene on the cell voltage uniformity.
The repeatability of the experiments based on automated test cycles was tested by performing an identical experiment twice. The injected NO mass showed a difference of 1.4 mg—3.4%, and the resulting cell voltage drop differed by 0.8 mV—2.2%. These results show acceptable repeatability, confirming the suitability of the test bed setup.
Due to the space conditions on the fuel cell system test bed, the gas analyzers were positioned in a different room, which required gas pipes of several meters. Oxygen in the air can form NO2 together with NO, which causes detectable NO2 values in the gas analyzer at the cathode inlet. Due to the short piping between the NO injection point and the cathode inlet, the formation of NO2 is considered to occur mainly in the gas pipes to the analyzer. Therefore, the measured NO2 at the cathode inlet is calculated back to NO and O, which slightly increases the measured injected amount of NO. Furthermore, NO2 is expected to split up into NO and O on the cathode catalyst, as described in [17], supporting the approach of treating the measured NO2 concentration as NO. On the other hand, [20] states that NO2 can be formed inside the fuel cell in the presence of platinum, but this could not be confirmed by the exhaust gas measurements in our experiments since the measured concentrations were always significantly lower than the NO2 values measured at the cathode inlet.
The focus of this research is on the cathode side of the fuel cell stack. Although the anode pressure was kept higher than the cathode pressure at all times, a crossover of NO to the anode cannot be excluded. The possible quantities are, however, considered to be small compared to the amount on the cathode and are therefore not further discussed.
Electrochemical measuring techniques, such as impedance spectroscopy or cyclic voltammetry, were not available for these experiments, which limits mechanistic insight. The results are, therefore, presented on a more macroscopic level based on the performed measurements and discussed including the findings of related research in the field of fuel cell contaminants.

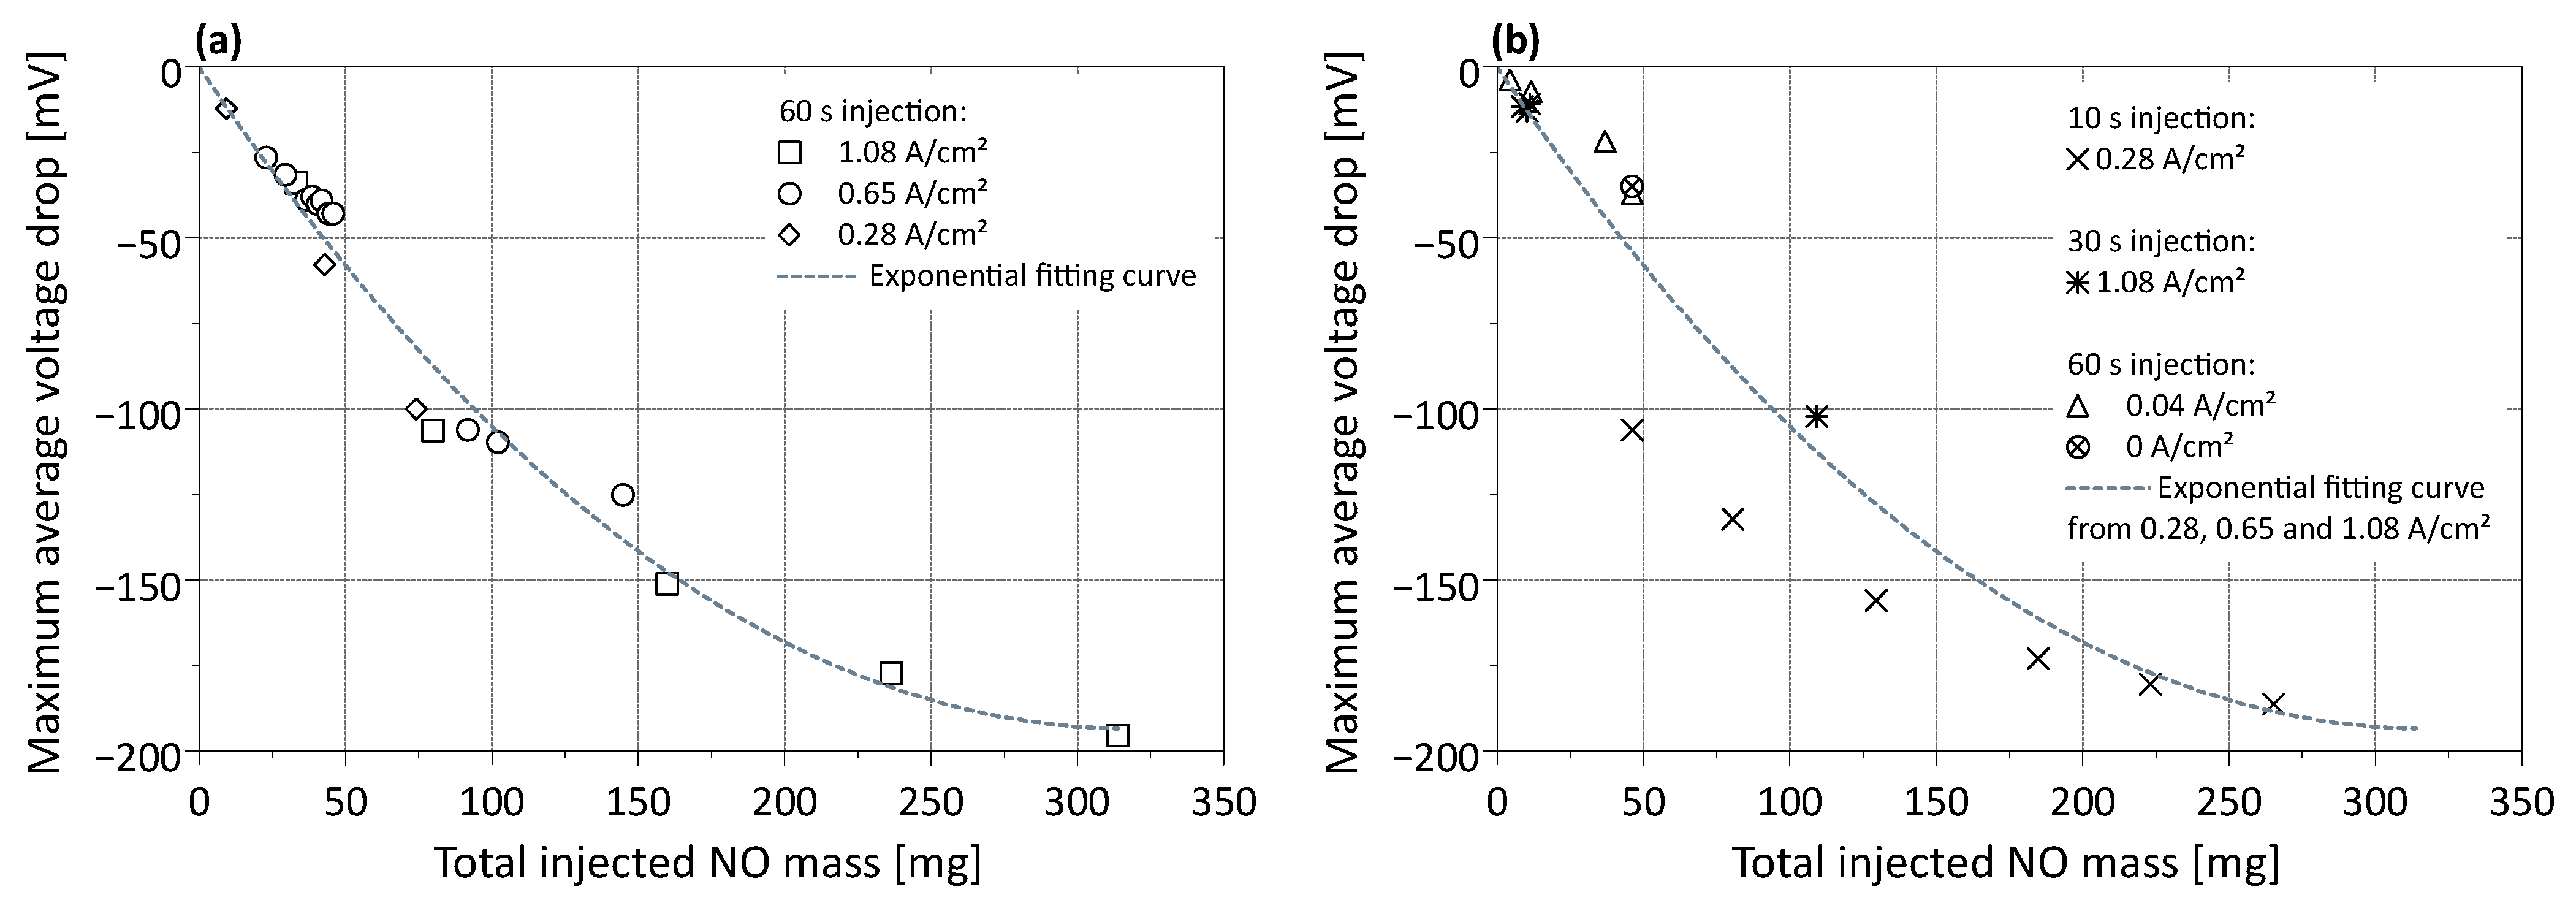
3.1.2. Short Time Injection

A series of experiments with an injection time of 60 s was performed at the three current density reference points of 0.28 A/cm2, 0.65 A/cm2, and 1.08 A/cm2, the results of which are depicted in Figure 3a,b. The results in Figure 3a suggest that the current density at which NO was injected plays a secondary role. This is based on the observation that comparable voltage drops are caused by a total injected NO mass at different current densities and within stack average cell potentials below 700 mV and above 360 mV, excluding the previously described NO desorption mechanisms of reduction and oxidation. Furthermore, this implies that the operating conditions of the fuel cell regarding flow rates, pressures, temperatures, and reactant relative humidity have no significant influence on the effect of NO in the fuel cell. The voltage drop does, however, not linearly decrease with increasing injected NO mass as indicated by the exponential fitting curve in Figure 3a, which was created based on the displayed measurement points and is only valid within this range. In addition to the 60 s injections, experiments with 10 s injections at 0.28 A/cm2 and 30 s injections at 1.08 A/cm2 were performed, as displayed in Figure 3b. Furthermore, 60 s injections were performed at 0.04 A/cm2 and with an extended open circuit voltage (OCV) phase of 0 A/cm2 during fuel cell start-up. The latter experiment was performed differently than all others included in Figure 3a,b, because it lacks the preconditioning phase. Nevertheless, the resulting voltage drop is comparable to the 60 s injections at 0.04 A/cm2, probably due to the preceding fuel cell operation, which partly compensates for the missing preconditioning phase. Figure 3b shows the results of these experiments, including the dashed exponential curve from Figure 3a as a reference. Note that the injected NO concentration needs to be significantly higher for a 10 s or 30 s injection than for a 60 s injection to reach comparable injected masses.
This results in concentrations of several hundred ppm, reaching up to a maximum of 3000 ppm in the experiments. Figure 3b shows the voltage drops for 10 s injections at 0.28 A/cm2, which are higher compared to those from the 60 s injections in Figure 3a at the same current density and at low injected NO masses. At these lower injected NO masses, the main cause for this increased voltage drop is considered to be the difference in the adsorption and desorption rates of NO on the platinum catalyst. As stated in [21], the kinetics of adsorption are higher than those of desorption. The differences in voltage drops between the 60 s and 10 s injection are, however, less pronounced with increasing injected NO mass, indicating that the slower desorption is not the main cause here. The observation leads to the assumption that a certain saturation of the cathode catalyst with NO takes place, which prevents all catalyst sites are affected by NO and hence reduces the cell voltage decrease. A catalyst saturation would also explain why the voltage drop in Figure 3a does not increase linearly with the increasing amount of injected NO.
Regarding the 30 s NO injections in Figure 3b at 1.08 A/cm2, the voltage drops are comparable to the 60 s injections, which leads to the conclusion that the adsorption and desorption similarly take place at the two injection times.
The results for the experiments conducted at 0 A/cm2 and 0.04 A/cm2 depicted in Figure 3b lie slightly above the results from the 60 s injections at higher current densities. This would imply that the effect of a certain amount of NO is lower at these current densities. The cathode stoichiometry in these low-load points is, however, up to three times higher than at the other load points in the experiments. This increased stoichiometric ratio could influence the NO adsorption on the catalyst, which would describe the lower effect on the cell voltage at comparable injected amounts. Furthermore, the stack average cell potentials in these low current density experiments are all above 770 mV, placing them in the cell potential region in which NO oxidation (>750 mV) occurs [18]. This desorption mechanism could be another reason for the lower voltage drop compared to injections at higher current densities. However, the low number of experiments conducted at 0 A/cm2 and 0.04 A/cm2 does not offer a solid base for general conclusions about the effect of NO at these current densities, and the differences could come from the variability of the results at higher current densities.

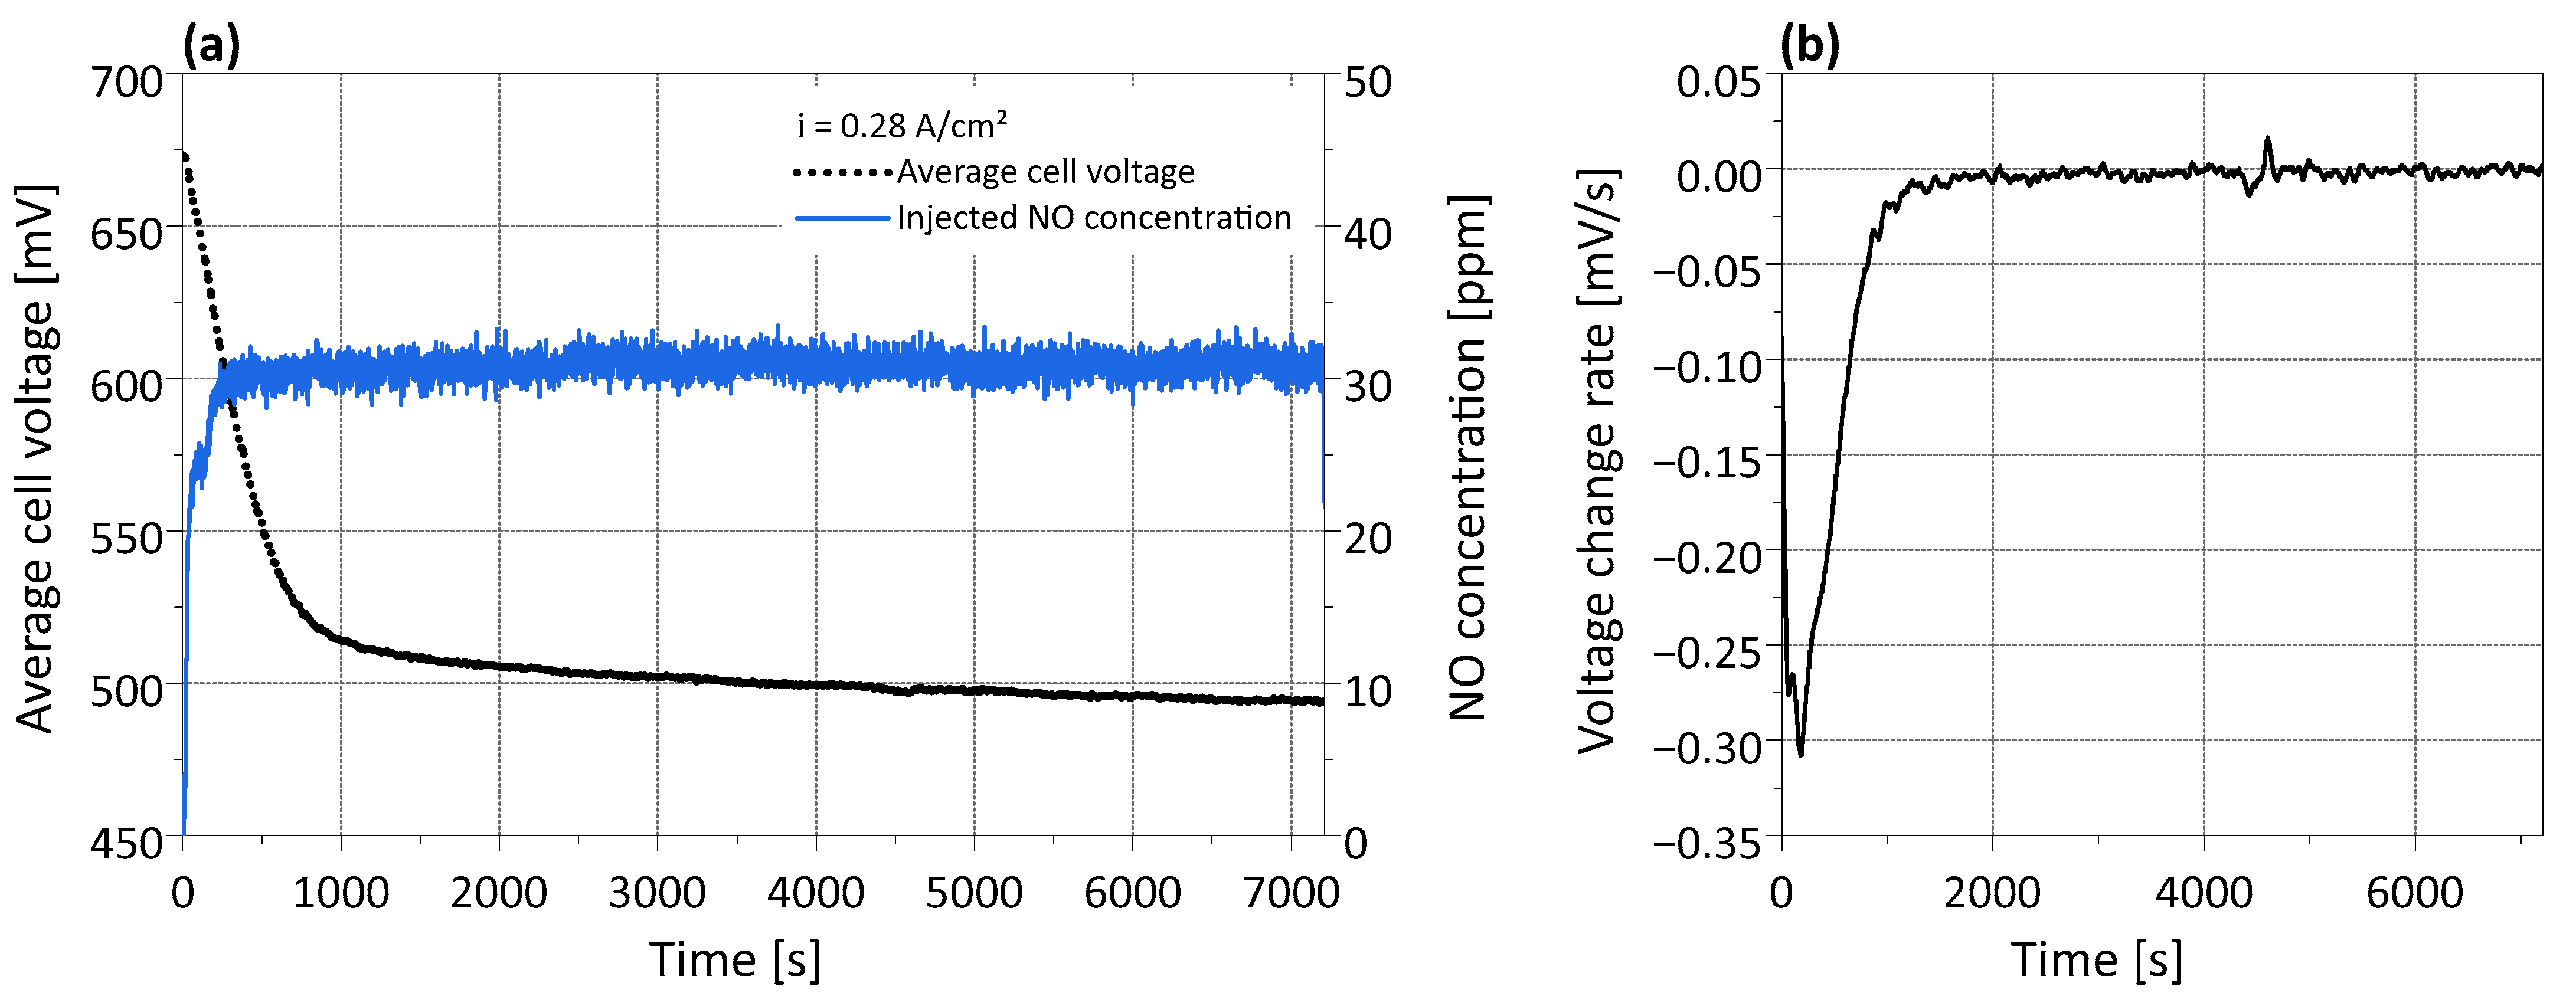
3.1.3. Long Time Injection

The trend of a decreasing voltage drop with increasing injected NO mass and the role of the injection duration are further assessed based on the long-time injection results.
The long-time injection experiment depicted in Figure 4a was performed at the constant current density of 0.28 A/cm2, and the injection lasted for two hours, making it the longest injection of the experimental series. The stack average cell voltage in Figure 4a shows the initially high cell voltage decrease, followed by a phase of low voltage drop. The voltage change rate, derived from the average cell voltage, is depicted in Figure 4b, which shows that after a spike in the beginning, the change rate decreases gradually until it reaches levels close to zero. Both the voltage curve in Figure 4a and the voltage change rate in Figure 4b indicate that a voltage plateau is not reached, even after the two-hour injection and a total injected NO mass of 1987 mg. This indicates that not a near-saturation of the catalyst is reached rather than a full saturation. Derived from the results in Figure 4a,b, the point of near saturation for this specific experiment is chosen when the voltage change rate reaches values above −0.025 mV/s, which occurs after 960 s, and amounts to an injected NO mass of 245 mg. The latter value can be compared to the results in Figure 3a,b because it lies in the region in which the saturation effect was observed for the short-time injections. Since only a near saturation is reached, the voltage drop rate does not reach zero, indicating that desorption and adsorption processes are still taking place at different rates, although to a far lesser extent than before the near-saturation.
Apart from the cell voltage decrease, the fuel cell system experiences a significant power loss and an increased demand for heat rejection caused by the lower efficiency during NO injection. In the case of the experiment depicted in Figure 4a, the total power loss amounted to 1.9 kW, the stack coolant outlet temperature increased by 0.9 °C, and the cathode exhaust gas temperature increased by 1.2 °C. The decrease in stack power equals a 26% loss compared to the stabilization phase before the NO injection. The highest absolute power loss of 6.45 kW was recorded during a 280 s injection of 25 ppm (in total 218 mg NO) at 1.08 A/cm2, which equals a power reduction of 28%. This increased the stack coolant outlet temperature by 3.5 °C.

3.1.4. Comparison of Short- and Long-Time Injections

The results of the short- and long-time experimental series both indicated a saturation effect of the cathode catalyst towards higher injected amounts of NO. Figure 5 shows the combined results of the NO injections at constant current density with respect to their different injection times. No differentiation is made in Figure 5 regarding the current densities at which the experiments were performed. This is based on the observation from the short-time injection results that the current density plays a minor role regarding the effect of NO.
In contrast to previous figures, the voltage drop is shown as a percentage of the average stack voltage during the stabilization time before the injection. It can be seen that no more than 35% cell voltage loss occurred in all experiments. This is particularly interesting since it is valid for both short-time and long-time injections. This supports the previously drawn conclusions that the difference in adsorption and desorption kinetics is only significant for cases with very short injection time and comparably low injected NO masses. With increasing injected NO amount, the voltage drop decreases due to a saturation effect of the catalyst regardless of the timeframe in which the amount is injected. This effect can also be described by the reduced catalyst activity in the presence of NO, which increases the activation losses of the fuel cell. The results in Figure 5 indicate that the maximum expectable voltage drop of the fuel cell system under test and at the described operating conditions is equal to or above −35%, which is valid for injected NO amounts up to 1987 mg. Knowledge about the saturation effect can be a piece of vital information in the design phase of fuel cell systems for application in NO-rich operating environments.

3.1.5. Variable Load Injection

The results presented so far were all achieved by injecting NO at a constant current density, and the results were discussed by comparing injections at different current density levels. Building on this, the results of NO injections during changing loads are presented in Figure 6. Although Figure 3a already indicates that the effect of NO has a low dependency on the current density, the experiments with changing load represent a more vehicle-related fuel cell operation than the constant current density profiles. Based on the assumption of a constant ambient NO concentration to which a potential fuel cell vehicle is exposed, a constant NO concentration is injected during the variable load experiments. Note that the NO mass flow changes during the injection due to the change in air mass flow.
The voltage curves shown in Figure 6 were recorded during an increasing load ramp from 0.04 A/cm2 up to 1.08 A/cm2, resembling the range in which the short- and long-time injections were performed and resulting in an injection time of 438 s. The results of these experiments once again highlight the influence of the injection time and the resulting injected NO amount on the cell voltage. At the beginning of the injection between 0.04 A/cm2 and 0.3 A/cm2, the voltage curves of 13 ppm and 23 ppm are close to the reference curve performed with ambient air. This is due to the small total injected amount of NO, indicating that short-term exposure of a fuel cell system to such concentration levels over a short period of time results in an insignificant voltage reduction. With increasing injection time during the experiment, the catalyst poisoning increases and the voltage curves deviate stronger from the reference. In the case of the 48 ppm injection, the deviation from the voltage curve performed with ambient air is noticeable even at the beginning of the injection, in contrast to the lower concentrations discussed before. The shapes of the voltage curves in Figure 6 with 13 ppm and 23 ppm NO injection show an increased voltage decline towards higher current densities, above 0.66 A/cm2 and 0.62 A/cm2, respectively. This reminds of the characteristic shape of polarization curves at increased current densities when kinetic and mass transport resistances are the main cause of voltage losses. This effect was described in [26,27], which concluded that the presence of contaminants on the cathode side results in increased O2 reduction kinetic and mass transfer losses, derived from impedance spectroscopy measurements and measured O2 mass transfer coefficients, respectively. Although neither [26,27] performed experiments with NO, the shapes of the curves with 13 ppm and 23 ppm NO injection in Figure 6 indicate that a similar effect occurs in the presence of NO.
Figure 6 includes dots of 60 s injections at concentration levels that are comparable to the load ramp injections. At the lower current density range of the load ramp, the short-time injections yielded results comparable to the load ramp injections. With increasing injection time and the resulting increased amount of total injected NO, the differences increase. These results should emphasize that it is not sufficient to only consider the NO concentration to which the fuel cell stack is exposed but that the exposure time and the resulting total amount of NO are significant for the resulting voltage reduction. This consideration is vital for assessing the application of fuel cells in environments with elevated NO concentrations.

3.2. Voltage Recovery Experiments

The nature of the NO injection experiments was quite heterogeneous in terms of the injected amount of NO and exposure time. This also affects the effectiveness of the voltage recovery strategies. Nevertheless, a comparison of the strategies is made based on the described evaluation criteria.
The non-recovered fuel cell voltage in Figure 7a is the result of the constant current density ambient air recovery as evaluated at the 0.04 A/cm2 reference point immediately after air recovery. A tendency of reduced voltage recovery towards increasing injected NO amount is visual. Interestingly, a seven-minute recovery after an experiment with 314 mg injected NO yields comparable recovery results compared to the 20 min recoveries. This indicates that most of the voltage recovery takes place in the first minutes. An effect can also be seen in Figure 2a, in which the cell voltage rises fast at the beginning of the recovery phase, followed by a period of lower recovery rate.
The recovery strategies depicted in Figure 7b make use of enhancing the voltage recovery through a change in operating conditions, such as current density, air stoichiometry, and coolant temperature. All the results are gained from the 0.04 A/cm2 reference point. The experiments can be subdivided into individual and consecutive recovery strategies. The individual ones are the procedures of high load, air stoichiometry, load ramp, and high load with air purge. The consecutive voltage recovery procedures were performed in the same experiment and are a combination of constant load and high load or load ramp and high load. In the case of the latter experiment, a reference point lies between the measures, which allows for an isolated evaluation of the consecutive strategies. The order in which they were performed is indicated by the numbers and the arrow in Figure 7b. The results of all these strategies show a slightly better voltage recovery potential than the singular measure of constant load ambient air recovery in Figure 7a. A clear dependency regarding the effectiveness of these strategies with respect to the injected NO amount cannot be derived. It is noticeable that the consecutive recovery strategy of load ramp and high load shows a significant difference between the two strategies. The load ramp alone would have resulted in comparably poor voltage recovery. The high load recovery, however, yields good recovery results over the whole range of injected NO.
The air stoichiometry recovery strategy shows no advantage over the other strategies performed at comparable amounts of injected NO. Since lowering the cathode air stoichiometry poses a risk to fuel cell durability, the strategy is not suggested for application in fuel cell systems.
The recovery strategies without fuel cell operation can be seen in Figure 7c. All strategies show a good voltage recovery. As described in the evaluation procedure for recovery strategies, a certain fuel cell operation takes place between the recovery measure and the reference point. Therefore, the results are influenced by the fuel cell shutdown, the start-up procedure, and the preconditioning phase. The high cell potentials during the shutdown and start-up process of the system may have advanced the cell voltage recovery since the oxidation of NO takes place at cell potentials above 0.75 V [18]. Furthermore, these facts make it impossible to directly compare the results of Figure 7c with those from Figure 7a,b. As an attempt to set the results of the recovery strategy without fuel cell operation into relation, reference values of experiments without NO and one performed without recovery are displayed in Figure 7c. The recovery strategies show better results compared to the NO experiment without recovery. The reference values gained from experiments without NO show, however, that the results of the recovery strategies without fuel cell operation lie within the range of cell voltage deviation between the experiments. Therefore, no final conclusion regarding the effectiveness of these recovery procedures can be drawn.
In order to ensure a certain degree of voltage recovery between the NO experiments, the recovery cycle was performed in between the NO experiments. Figure 7d shows the results for the voltage recovery in the same reference point of 0.04 A/cm2, and it was used for evaluating all other recovery strategies. The voltage recovery is close to 100%, which fulfills the required recovery between experiments. The three consecutive load ramps in the reference cycle are of the same kind as the aforementioned load ramp recovery procedure, which explains the good recovery potential of this cycle. A certain fluctuation range of the cell voltage deviations between the experiments can be seen, which substantiates the observation made in Figure 7c, stating that the results lie within the expectable range of cell voltages between experiments. Despite the use of automated test cycles and dedicated fuel cell preconditioning, a small difference between the experiments cannot be avoided.
In terms of duration, the recovery cycle is the longest, taking almost 100 min. The constant load voltage recovery was performed for 7 and 20 min, which covers a similar time range as the high-load recovery (14.5 min), the load ramp recovery (15 min), and the high-load with air purge recovery (15.8 min). The shortest recovery procedure during fuel cell operation is the air stoichiometry procedure, which takes only 2.25 min. Although the constant load voltage recovery procedure is in a similar range of duration as the other methods, it is considered unsuitable for vehicle applications since a hybrid system might not allow a long period of constant current operation when dynamic load changes are required. Additionally, it possesses lower voltage recovery effectiveness compared to the other methods. Therefore, the methods with load changes show higher potential for a vehicle application when being performed with steeper load ramps in order to reduce the duration. The recovery procedures without fuel cell operation range between 7 and 10 min, with the anode hydrogen pressurization being the shortest of the three methods.

3.3. Overall System Degradation

Although the catalyst poisoning caused by NO is considered reversible, and dedicated procedures were performed to recover the cell voltage, significant degradation of the fuel cell stack was observed.
The results in Figure 8 were obtained by decreasing load ramps between 1.08 A/cm² and 0.04 A/cm² with a slope of 1 A/s in the early phase of the experiments and at the end. The stack voltage was recovered in advance of the measurements to exclude a direct influence of remaining NO in the cells.
A cause for the membrane degradation can be the presence of ammonium, which is a possible by-product of the NO experiments. The effect of ammonium ions in the fuel cell is linked to the reduction of the proton conductivity of perfluorinated sulfonic acid (PFSA) ionomers, which is a common membrane material and is also part of the catalyst layer [19,28]. This reduction of membrane and catalyst conductivity results in increased ohmic losses of the fuel cell. Samples of the anode product water were analyzed regarding hydroxylamine and ammonium, but no detectable concentrations were found. Unfortunately, reliable sampling of the cathode product water was not possible at the time of the experiments, which would have provided a more direct conclusion regarding the processes on the cathode.
Furthermore, the nature of the NO experiments and the recovery procedures represent stressful operating scenarios for the fuel cell, e.g., the operation at low cell voltages and increased temperatures. Reference [17] observed that the membrane electrode assembly (MEA) is stressed unevenly during NOx experiments, which is another possible source for the degradation presented in Figure 8.
In total, 13.878 g NO was injected into the cathode air of the fuel cell over the course of the experiments, with a total NO injection time of 6.7 h. The fuel cell was operated for 231.9 h between the two measurements, as shown in Figure 8. Based on the cell voltage loss of 49.5 mV at 1.08 A/cm², the remarkably high overall irreversible degradation rate of 213.5 µV/h can be derived, which contradicts the assumption that the effect of NO on the fuel cell is reversible. Although the values of non-recovered voltages between the experiments presented in Figure 7 are low, Figure 8 shows that the impact over the whole testing period is significant. Therefore, the effect of NO on the fuel cell system cannot be described as reversible. Based on these observations, the long-term effect of NO on a fuel cell system and possible accelerated catalyst degradation caused by dissolution or agglomeration is not negligible and should be the topic of future research in this field. A similar approach for the contamination with NO on long-term degradation of single cells to that in [28], which determined the long-term degradation effects caused by acetonitrile in a PEM fuel cell, could be pursued.

4. Conclusions

The experiments show the effect of NO on a fuel cell system at various operating points and at a wide range of injected NO masses. The cell voltage is mostly influenced by the injected amount of NO, which is based on the NO concentration the system is exposed to and the duration of the injection, rather than on the magnitude of the concentration alone. This conclusion was confirmed by experiments performed at constant and varying current densities. After a certain NO exposure time, the cell voltage drop rate decreases, indicating a saturation of the catalyst with NO. Although the cell voltage level is considerably influenced by NO, the cell voltage uniformity of the fuel cell stack is not affected noticeably. Furthermore, the effect of NO is comparable over the whole current density range of the experiments, implying that the accompanying change in operating conditions, such as air flow, pressure, temperature, and relative humidity, does not have a significant influence.
Seven different voltage recovery procedures are introduced and discussed based on their effectiveness in the experiments. Constant-load ambient air recovery, which is a strategy very frequently discussed in the literature, shows the lowest recovery potential of all methods performed during fuel cell operation. Other individual or consecutive experiments, such as the high-load and load ramp recovery and combinations or variations of them, were developed in the course of this research and show promising results. These methods are considered suitable for application in fuel cell systems. The recovery method of applying a lower air stoichiometry is, however, not recommended for fuel cell applications since it might pose a risk of irreversible cell degradation. In the proposed strategies, the desorption mechanism of NO is considered to be based on an oxidation process, and the membrane degrading by-product ammonium is not expected, in contrast to a reduction process. The aforementioned by-product and hydroxylamine were not detected by the ex situ anode effluent water analysis. Recovery strategies without fuel cell operation, namely the nitrogen and argon purging of the cathode and the anode hydrogen pressurization, bear limited suitability for vehicle applications. This is based on the necessity of additional gas bottles in the case of nitrogen and argon purging and on the fact that comparable results can be achieved with the recovery strategies during operation.
Despite the performed voltage recovery procedures and the reversibility of the catalyst poisoning by NO, a significant system degradation has been observed, most likely caused by the formation of by-products and due to the high injected cumulative NO masses. The influence of NO on the performance of a fuel cell system therefore cannot be considered reversible, and the long-term effects should be further investigated.
The presented results are valid for the fuel cell system under test. Other systems might respond differently to the exposure to NO since the influence of parameters such as, e.g., the cell and stack design, cathode stoichiometry, or reactant humidification was not evaluated in this research. Reference [27] states, that the platinum loading of the cathode catalyst affects the magnitude of the voltage drop in the presence of contaminants. Therefore, a different MEA setup could already influence the response of the system to NO. However, results from single-cell and short-stack experiments show comparable trends and effects regarding the exposure of the cathode catalyst to NO [17,20,22]. Furthermore, the observation that the effect of NO in the fuel cell is independent of the current density, and hence, the operating conditions could mean that the system configuration does not play a major role in this aspect.

Author Contributions

Conceptualization, methodology and investigation, P.R. and F.P.; validation, P.R., F.P., S.B. (Stefan Brandstätter) and E.S.; resources, S.B. (Simon Buchberger); data curation, formal analysis, visualization and writing—original draft preparation, P.R.; writing—review and editing, F.P., S.B. (Stefan Brandstätter), E.S., S.B. (Simon Buchberger), A.T. and H.E.; supervision, A.T. and H.E.; project administration and funding acquisition, S.B. (Stefan Brandstätter) and E.S. All authors have read and agreed to the published version of the manuscript.

Funding

This research was accomplished in the framework of the COMET Project HyTechonomy in the sub-project HyLife. HyTechonomy is a COMET Project within the COMET–Competence Centers for Excellent Technologies Programme and funded by BMK, BMDW, Province of Styria and Province of Upper Austria. The COMET Programme is managed by FFG (Austrian Research Promotion Agency). FFG grant number 882510.

Data Availability Statement

The data supporting the findings are included in the article. The raw data are not publicly available due to project confidentiality.

Acknowledgments

Open Access Funding by the Graz University of Technology.

Conflicts of Interest

The authors declare no conflict of interest. The funders had no role in the design of the study; in the collection, analyses, or interpretation of data; in the writing of the manuscript; or in the decision to publish the results.

References

  1. Trattner, A.; Klell, M.; Radner, F. Sustainable hydrogen society—Vision, findings and development of a hydrogen economy using the example of Austria. Int. J. Hydrogen Energy 2022, 47, 2059–2079. [Google Scholar] [CrossRef]
  2. Maggio, G.; Squadrito, G.; Nicita, A. Hydrogen and medical oxygen by renewable energy based electrolysis: A green and economically viable route. Appl. Energy 2022, 306, 117993. [Google Scholar] [CrossRef]
  3. Klell, M.; Eichlseder, H.; Trattner, A. Hydrogen in Automotive Engineering: Production, Storage, Application, 1st ed.; Springer Fachmedien Wiesbaden: Wiesbaden, Germany, 2023; pp. 10–20. [Google Scholar]
  4. Shabani, B.; Hafttananian, M.; Khamani, S.; Ramiar, A.; Ranjbar, A.A. Poisoning of proton exchange membrane fuel cells by contaminants and impurities: Review of mechanisms, effects, and mitigation strategies. J. Power Sources 2019, 427, 21–48. [Google Scholar] [CrossRef]
  5. Yang, D.-J.; Ma, X.-W.; Lv, H.; Li, B.; Zhang, C.-M. NO adsorption and temperature programmed desorption on K2CO3 modified activated carbons. J. Central South Univ. 2018, 25, 2339–2348. [Google Scholar] [CrossRef]
  6. Mikkola, M.S.; Rockward, T.; Uribe, F.A.; Pivovar, B.S. The Effect of NaCl in the Cathode Air Stream on PEMFC Performance. Fuel Cells 2007, 7, 153–158. [Google Scholar] [CrossRef]
  7. Cheng, X.; Shi, Z.; Glass, N.; Zhang, L.; Zhang, J.; Song, D.; Liu, Z.-S.; Wang, H.; Shen, J. A review of PEM hydrogen fuel cell contamination: Impacts, mechanisms, and mitigation. J. Power Sources 2007, 165, 739–756. [Google Scholar] [CrossRef]
  8. Nagahara, Y.; Sugawara, S.; Shinohara, K. The impact of air contaminants on PEMFC performance and durability. J. Power Sources 2008, 182, 422–428. [Google Scholar] [CrossRef]
  9. St-Pierre, J.; Zhai, Y.; Angelo, M.S. Effect of Selected Airborne Contaminants on PEMFC Performance. J. Electrochem. Soc. 2014, 161, F280–F290. [Google Scholar] [CrossRef]
  10. Misz, U.; Talke, A.; Heinzel, A.; Konrad, G. Sensitivity Analyses on the Impact of Air Contaminants on Automotive Fuel Cells. Fuel Cells 2016, 16, 444–462. [Google Scholar] [CrossRef]
  11. Qi, J.; Zhai, Y.; St-Pierre, J. Effect of contaminant mixtures in air on proton exchange membrane fuel cell performance. J. Power Sources 2019, 413, 86–97. [Google Scholar] [CrossRef]
  12. Lechner, B.; Schruth, R.; Fischbacher, B.; Cajic, A.; Ahamer, C. Cathodic Gaseous Analysis for Fuel Cell Vehicles in Real Driving Conditions. In Proceedings of the 43rd International Vienna Motor Symposium 2022, Wien, Austria, 27–29 April 2022. [Google Scholar]
  13. Talke, A.; Misz, U.; Konrad, G.; Heinzel, A.; Klemp, D.; Wegener, R. Influence of urban air on proton exchange membrane fuel cell vehicles—Long term effects of air contaminants in an authentic driving cycle. J. Power Sources 2018, 400, 556–565. [Google Scholar] [CrossRef]
  14. Bétournay, M.C.; Bonnell, G.; Edwardson, E.; Paktunc, D.; Kaufman, A.; Lomma, A. The effects of mine conditions on the performance of a PEM fuel cell. J. Power Sources 2004, 134, 80–87. [Google Scholar] [CrossRef]
  15. Mitzel, J.; Zhang, Q.; Gazdzicki, P.; Friedrich, K.A. Review on mechanisms and recovery procedures for reversible performance losses in polymer electrolyte membrane fuel cells. J. Power Sources 2021, 488, 229375. [Google Scholar] [CrossRef]
  16. Chen, M.; Du, C.; Zhang, J.; Wang, P.; Zhu, T. Effect, mechanism and recovery of nitrogen oxides poisoning on oxygen reduction reaction at Pt/C catalysts. J. Power Sources 2011, 196, 620–626. [Google Scholar] [CrossRef]
  17. Talke, A.; Misz, U.; Konrad, G.; Heinzel, A. Influence of Nitrogen Compounds on PEMFC: A Comparative Study. J. Electrochem. Soc. 2018, 165, F3111–F3117. [Google Scholar] [CrossRef]
  18. de Vooys, A.; Beltramo, G.; van Riet, B.; van Veen, J.; Koper, M. Mechanisms of electrochemical reduction and oxidation of nitric oxide. Electrochim. Acta 2004, 49, 1307–1314. [Google Scholar] [CrossRef]
  19. Uribe, F.A.; Gottesfeld, S.; Zawodzinski, T.A. Effect of Ammonia as Potential Fuel Impurity on Proton Exchange Membrane Fuel Cell Performance. J. Electrochem. Soc. 2002, 149, A293–A296. [Google Scholar] [CrossRef]
  20. Yang, D.; Ma, J.; Xu, L.; Wu, M.; Wang, H. The effect of nitrogen oxides in air on the performance of proton exchange membrane fuel cell. Electrochim. Acta 2006, 51, 4039–4044. [Google Scholar] [CrossRef]
  21. Misz, U.; Talke, A.; Heinzel, A.; Beckhaus, P. Effects, Damage Characteristics and Recovery Potential of Traffic-induced Nitric Oxide Emissions in PEM Fuel Cells under Variable Operating Conditions. Fuel Cells 2018, 18, 594–601. [Google Scholar] [CrossRef]
  22. Gomez, Y.A.; Lindbergh, G.; Lagergren, C. Performance Recovery after Contamination with Nitrogen Dioxide in a PEM Fuel Cell. Molecules 2020, 25, 1115. [Google Scholar] [CrossRef]
  23. St-Pierre, J.; Virji, M.B.V. Cell performance distribution in a low-temperature proton exchange membrane fuel cell stack during propene contamination. J. Appl. Electrochem. 2016, 46, 169–181. [Google Scholar] [CrossRef]
  24. Wallnöfer-Ogris, E.; Pertl, P.; Trattner, A. Quasi-stationary UI-characteristic model of a PEM fuel cell–Evaluating the option of self-humidifying operation. Int. J. Hydrogen Energy 2020, 45, 32464–32477. [Google Scholar] [CrossRef]
  25. Farberow, C.A.; Dumesic, J.A.; Mavrikakis, M. Density Functional Theory Calculations and Analysis of Reaction Pathways for Reduction of Nitric Oxide by Hydrogen on Pt(111). ACS Catal. 2014, 4, 3307–3319. [Google Scholar] [CrossRef]
  26. Bethune, K.; St-Pierre, J.; LaManna, J.M.; Hussey, D.S.; Jacobson, D.L. Contamination Mechanisms of Proton Exchange Membrane Fuel Cells—Mass Transfer Overpotential Origin. J. Phys. Chem. C 2020, 124, 24052–24065. [Google Scholar] [CrossRef]
  27. St-Pierre, J.; Zhai, Y. Impact of the Cathode Pt Loading on PEMFC Contamination by Several Airborne Contaminants. Molecules 2020, 25, 1060. [Google Scholar] [CrossRef]
  28. Zhai, Y.; Ge, J.; Qi, J.; St-Pierre, J. Effect of Acetonitrile Contamination on Long-Term Degradation of Proton Exchange Membrane Fuel Cells. J. Electrochem. Soc. 2018, 165, F3191–F3199. [Google Scholar] [CrossRef]
Figure 1. Detail of the cathode gas path on the fuel cell system test bed.
Energies 16 03720 g001
Figure 2. (a) Schematic depiction of a NO injection experiment; (b) overview of injected concentrations and injection durations.
Energies 16 03720 g002
Figure 3. (a) Average stack voltage drop for 60 s injection over the injected NO mass; (b) average stack voltage drop for 10 s, 30 s, and 60 s injections over the injected NO mass, including the exponential fitting curve from (a).
Energies 16 03720 g003
Figure 4. (a) Time-based average stack voltage and injected NO concentration; (b) voltage drop rate during the NO injection.
Energies 16 03720 g004
Figure 5. Voltage drop, in percent, of the initial cell voltage at different injection times.
Energies 16 03720 g005
Figure 6. Average stack cell voltage over the current density as a result of continuous NO injection during a load ramp.
Energies 16 03720 g006
Figure 7. Non-recovered average stack cell voltage at (a) constant load ambient air recovery; (b) single and combined ambient air recovery strategies at varying operating points; (c) recovery strategies without fuel cell operation; (d) system recovery after the recovery cycle.
Energies 16 03720 g007
Figure 8. Reference load ramps in an early phase of the experimental series and at the end.
Energies 16 03720 g008
Table 1. Operating parameter ranges of the fuel cell stack.
Current Density Range: 0.04–1.08 [A/cm2]
Cathode AnodeCoolant
Flow rate6–30 [g/s]Flow rate0.05–1.65 [kg/h]Flow rate40–45 [L/min]
Pressure1.1–1.5 [barabs]Pressure1.8 [barabs]Temperature49 [°C] at Stack inlet
Stoichiometry11–1.9 [-]Stoichiometry1.73–1.03 [-]
Table 2. Range of parameters for the experiment variables.
Current Density
i [A/cm2]
Stabilization Time
τ S t a b . [s]
Injection Time
τ I n j . [s]
NO Concentration [ppm]Air Recovery Time τ R e g . [s]
0.060010Short time
injection
5 to 3000420
0.04 30 1200
0.28 60 7200
0.65 280 to 600Long time
injection
1.08 1200
0.04 to 1.08 to 0.04 7200
Disclaimer/Publisher’s Note: The statements, opinions and data contained in all publications are solely those of the individual author(s) and contributor(s) and not of MDPI and/or the editor(s). MDPI and/or the editor(s) disclaim responsibility for any injury to people or property resulting from any ideas, methods, instructions or products referred to in the content.

