Article

Impact of Waste Fry Biofuel on Diesel Engine Performance and Emissions

1
Department of Drone-Robot Engineering, Pai Chai University, Daejeon 35345, Republic of Korea
2
Department of Mechanical Engineering, Kongju National University, Cheonan 31080, Republic of Korea
*
Author to whom correspondence should be addressed.
Energies 2023, 16(9), 3711; https://doi.org/10.3390/en16093711
Submission received: 31 March 2023 / Revised: 21 April 2023 / Accepted: 24 April 2023 / Published: 26 April 2023
(This article belongs to the Section A: Sustainable Energy)

Abstract

:
Energy is primarily obtained from fossil fuels and with the use of fossil fuels, we are increasing the emissions and greenhouse gases. It takes constant effort to meet the energy need from environmentally acceptable and renewable fuels. In order to find a replacement for depleting fossil fuel energy, a range of oxygenated fuels was investigated based on their accessibility and geographic areas. This work assessed the transesterification process’s feasibility of turning used fry oil into biodiesel fuel and its physiochemical characteristics. The performances of a diesel engine operating on biodiesel and diesel fuel were assessed and compared. Four different types of fry oils were utilized for the research on a diesel agricultural engine with indirect injection. The first fry, second fry, third fry, and restaurant fry were the various sorts of fry oil. Five different types of biodiesels and their blends were investigated for their engine efficiency and emission metrics. B40 (biodiesel 40% and diesel 60%) and B80 (biodiesel 80% and diesel 20%) biodiesel blends were tested in different engine speed conditions under 50% and 100% engine loads. While the brake thermal efficiency (BTE) decreased as the engine rpm increased, it was found that the brake-specific fuel consumption (BSFC) increased. Due to the poor air–fuel ratio at higher engine speeds, the BTE decreased. NOx (nitrogen oxides) emissions were higher for all the biodiesel blends because of the higher oxygen content in the biodiesel blends. The smoke opacity in both blends decreased with rising rpm under both load situations and was lower than in pure diesel. Because of the larger cetane number and lower heating value, the exhaust gas temperature (EGT) dropped. It was determined that prolonging the fry time altered the engine performance and emission metrics. The use of sustainable fuel is essential; waste fry cooking oil as a substitute for fossil diesel could be a prospective replacement in the agricultural engine and transportation sector.

1. Introduction

Fossil fuel has been a significant source of energy and is used in the internal combustion engine (IC engine). When used in the automobile engine, these fuels produce a lot of emissions (hydrocarbon (HC), nitric oxide, carbon monoxide (CO), greenhouse gases, and smoke). Greenhouse gases are responsible for global warming, which involves increasing the planet’s temperature and is the reason for climate change [1,2,3]. While having many advantages, fossil fuel has a lot of disadvantages, such as being costly and the major reason for climate change; therefore, researchers are looking for alternative sources of fuel. To date, the focus of research for alternative fuels to use in diesel engines [4,5,6] is on compressed natural gas (CNG), vegetable oils, biodiesel, liquefied petroleum gas (LPG), ethanol, and hydrogen [7,8,9]. With the gradual increase in energy demand, researchers have been focusing on alternative sources of energy that are renewable and can replace conventional fuels [10,11,12]. Biofuel has been a research focus because it is a renewable source of energy and has cleaner emissions. One of the substitute fuels that can be utilized in an IC engine is biodiesel [13,14,15]. Biodiesel fuel has many advantages, such as being non-explosive, environmentally friendly, low in aroma, and low in sulfur [16,17]. To synthesize biodiesel, edible oil, vegetable oil, used cooking oil from restaurants, and used animal fats are used. It was observed that using biodiesel engine emissions reduces carbon monoxide (CO), hydrocarbon (HC), and particulate matter. However, NOx (nitrogen oxides) emissions are on the rise due to biodiesel’s increased oxygen concentration [18,19,20]. Studies focusing on the use of biodiesel produced from organic fat and vegetable oil were conducted (simulation and experimentation). Soya bean has been popular, as it is renewable, has a low-grade oil factor, and is reasonable [21,22].
In comparison to standard fossil diesel, fresh soya bean cooking oil is now more expensive; therefore, the production cost of biodiesel from fresh soya bean increased the overall cost of biodiesel; 75–90% of the cost of biodiesel fuel is accounted for by fresh cooking oil [23,24]. Using fresh cooking oil for the production of biodiesel will be a reason for the rise in the cost of the food chain. Therefore, it becomes necessary to use waste cooking oil or used cooking oil to make renewable and cost-effective biodiesel. In many household kitchens and restaurants, the used cooking oils or waste oil is thrown away in the drainage system [25,26], leading to the blockage and foul smell of the drainage system and degrading the groundwater. Many countries have imposed pollution taxes on the disposing of waste oils in the environment [27].
It has become increasingly challenging to maintain biodiesel standards because large amounts of leftover fry oil and biodiesel fuels are available from multiple sources. The attributes of biodiesel oil’s physical and chemical compositions have an impact on fuel injection and combustion. As a consequence of biodiesel’s increased cetane number as opposed to diesel fuel, ignition delays are minimized by using it. Biodiesel has a high viscosity and boiling point. These two properties of biodiesel affect the atomization and spray, leading to an extended combustion phase and slow burning [24]. In accordance with this reasoning, research on biodiesel fuel should emphasize inexhaustible sources while assessing its influence on engine performance and combustion characteristics, as well as engine emissions. The application of used cooking oil as biodiesel and its blending with petrodiesel has been investigated by researchers.
Yunhua et al. [28] investigated waste cooking oil biodiesel in urban buses under different driving conditions. The buses were equipped with DOC and CDPF after-treatment systems. The buses were fuelled with commercial diesel, B10 (biodiesel 10% and diesel 90%), and B20 (biodiesel 20% and diesel 80%). Biodiesel used as fuel was produced using a two-step transesterification of waste cooking oil. D100 was reported to generate more CO than the B10 and B20 biodiesel fuel blends according to investigations. B20 had the lowest CO emissions out of the three. The total hydrocarbon content of biodiesel is less than that of diesel. Meanwhile, for NOx emissions, it was observed that diesel fuel had the lowest. CO2 emissions were higher for biodiesel blends (B20, B10). The particulate number and particulate matter were lower for the biodiesel blends than for diesel fuel in all speed conditions. Mehmet Akcay et al. [29] researched using a diesel and waste cooking oil biodiesel blend fuel with a hydrogen-assisted intake. A B25 blend (biodiesel 25% and diesel 75%) was used as the primary fuel. It was found that with the use of the B25 blend, the cylinder pressure was lower, but at the same time, the addition of hydrogen in the intake manifold increased the cylinder pressure. A slightly higher cumulative heat release was experienced with the B25 blend, though with the hydrogen-assisted intake, the cumulative heat release was lower.
Babu et al. [30] synthesized biodiesel from waste cooking oil (palm oil and sunflower oil). Cauliflower, Chinese broccoli, and napa cabbage were used to synthesize biocatalysts. Using the wet impregnation method, a potassium-hydroxide-impregnated biocatalyst was synthesized. The process parameters employed in the synthesis of biodiesel were optimized using artificial neural networks and the RSM approach. The experimental results were compared with ANN and RSM models. A yield of 94.7% was achieved by employing a biocatalyst impregnated with KOH at 60 °C for a 120 min duration, using a stirring speed of 900 rpm and a 7 wt% catalyst loading. This showed that the use of waste cooking oil and using a biocatalyst impregnated with KOH achieved a maximum yield of biodiesel. Vikas et al. [31] researched the use of waste cooking oil in internal combustion engines used for power generation by generators and the transportation sector. The use of graphene has raised interest in many fields, including enhancing the combustion characteristics of biofuel. The influence of graphite nanoparticle additives and few-layered graphene on combustion and engine emissions was compared with neat biodiesel and conventional diesel fuel. Biodiesel was produced using a transesterification process from waste cooking oil, and biodiesel blends with diesel or butanol with few-layered graphene and nanoparticles were made. The biodiesel blend with graphene and graphite nanoparticles showed 0.5–2.5% higher in-cylinder pressure and 1–4% lower HRR under 100% load conditions. NOx emissions were reduced by 0.7 to 5% compared with conventional diesel fuel. The BTE was improved by 8–10% when 100 ppm graphene and graphite nanoparticles were used.
Ahmed et al. [32] researched substituting diesel fuel in CI engines with biodiesel made from used frying oil. Fuel additives were used to reduce the NOx emissions of the biodiesel. A functional multi-walled carbon nanotube is considered a promising additive in the case of conventional diesel. Nitrogen-doped multi-walled and amino-functionalized multi-walled carbon nanotubes are excellent catalysts and can be used in a diesel engine because of their good properties. A CI engine was used at a constant speed at different load conditions to study a WCO (waste cooking oil) biodiesel–decanol blend on engine performance. B80 + 20% n-decanol by volume with 50–75 ppm MWCNTs was used. The results of the engine performance were close to conventional diesel fuel. Exhaust emissions were reduced compared with diesel. NOx, CO, and soot were reduced by 35%, 61% and 44% respectively. The BTE was reduced by 10% and the BSFC was increased by 15%. From the literature review, it is clear that the use of waste edible oil and its blend in the CI engine was examined for performance and emission characteristics. However, there is a research gap on the use of different soya bean waste fry oil depending on their frying time (one time, two times, three times, and restaurant-used fry oil) in a CI engine with its performance and emission characteristics.
In the present study, the investigation of diesel and used cooking oil (first fry, second fry, third fry, and restaurant fry) blends and their effects on the performance and emission characteristics under different load and speed conditions were analyzed. The ratios of waste fry cooking biodiesel to diesel used to create the blends were B40 (biodiesel 40% and diesel 60%) and B80 (biodiesel 80% and diesel 20%). In two separate load conditions, namely, 50% and 100%, the engine speed was incremented by 200 rpm between 1200 rpm to 1800 rpm. The test fuel’s numerous performance and emission metrics were assessed, and the results were contrasted with diesel.

2. Biodiesel Manufacturing and Characteristics

Soya oil is accessible globally (Argentina, Brazil, China, USA, India, and others) as an oil for daily cooking in a household kitchen. The oil that is used for the experiment originated from soya bean seeds with a light golden color. Frying in the kitchen was accomplished using fresh soya bean oil purchased from a nearby supermarket. The procedure used to prepare the sample oils in terms of attributes such as fry time and fry food stayed the same. Fresh soya bean oil was used for frying raw potatoes of specific weight for 1 h, which was labeled as first fry oil. Then, after storing a fixed amount of first fry oil for making biodiesel, the leftover first fry oil was used again to fry fresh raw potatoes with the same weight for 1 h again, which was labeled as second fry oil. After storing some of the second fry oil for making biodiesel, the leftover second fry oil was again used for frying the same amount of fresh potatoes again for 1 h, which was labeled as third fry oil. The frying attributes for the oil were kept constant. The restaurant oil was procured from a potato wedges restaurant. The fried oils and restaurant fried oils were filtered to remove the food matter and labeled as first fry oil, second fry oil, third fry oil, and restaurant fry oil. Transesterification was carried out in the university experimental laboratory to produce biodiesel. Potassium hydroxide flakes and methanol alcohol (99.9%) were acquired from Sigma Aldrich, South Korea, and used to transesterify the cooking oil to produce biodiesel. One-stage alkaline transesterification was utilized to generate biodiesel from the fried leftover soya bean oil. A total of 500 mL of waste fry oil was combined with a solution of methanol and potassium and was mixed for 2 h at 55 °C [1]. The fry oil was categorized into four types of biodiesel fuel, namely, first fry waste cooking oil biodiesel (1FWCOB), second fry waste cooking oil biodiesel (2FWCOB), third fry waste cooking oil biodiesel (3FWCOB), and restaurant fry waste cooking oil biodiesel (RFWCOB). Furthermore, biodiesel from fresh soya bean cooking oil was produced, namely, fresh soya bean biodiesel.
By correlating the qualities of the biodiesel using the fry oil and conventional diesel using ASTM-D6751, the standard for biodiesel was ensured. The biodiesel produced for experimentation was within the appropriate range. The ASTM standards and limits are listed in Table 1, and numerous physiochemical characteristics of the biodiesel were assessed. The physicochemical properties of the different fuels are mentioned in Table 2. The experiments were executed with conventional diesel and biodiesel blends. Blends in the ratio of 20% biodiesel and 80% diesel (B20), 40% biodiesel and 60% diesel (B40), 60% biodiesel and 40% diesel (B60), and 80% biodiesel and 20% diesel (B80) were produced from fresh soya bean biodiesel, 1FWCOB, 2FWCOB, 3FWCOB, and RFWCOB; these were then compared with one another and standard diesel.

3. Experimental Setup

A single-cylinder agricultural, water-cooled diesel engine with a power rating of 7.4 kW was used for experimentation, and the experimental setup is shown in Figure 1. Daedong Ltd. was the maker of the CI engine. The fuel injection system was mechanically controlled, with the indirect injection having an injection pressure of 135 kg/cm2. Fuel and air were premixed in a premixing chamber just outside the cylinder. The experiment was conducted at the Automotive Engine Combustion and Alternative Energy Lab at Kongju National University, Cheonan campus. The study took place under two different load conditions (50% and 100%), with the engine speed between 1200 rpm to 1800 rpm with 200 rpm increments. Table 3 illustrates the engine specifications used in the study. The power rating of the engine was measured using an eddy-current dynamometer. Fuel was measured using a load cell, and the measurements were confirmed with the help of a U-tube manometer.
The thermal efficiency and brake-specific fuel consumption were calculated to measure the performance of the engine. The gas analyzer Hephzibah (HG-550RT, South Korea) was used for measuring the emission parameters. The probe of the gas analyzer was placed in the exhaust manifold of the engine, and digital emission readings were obtained. A smoke analyzer was used to measure the smoke emissions. A k-type thermocouple was used to measure the temperature of the exhaust gas. The uncertainty was computed in order to lower the parapraxis in the data. Calibration of the equipment was necessary to obtain accurate experimental data. To obtain accurate data during experimentation, the readings were collected more than thrice, and the arithmetic mean was computed. Table 4 provides information on the smoke measurement equipment and gas analyzer’s range and resolution.

4. Results and Discussion

4.1. Effect on the Brake Thermal Efficiency

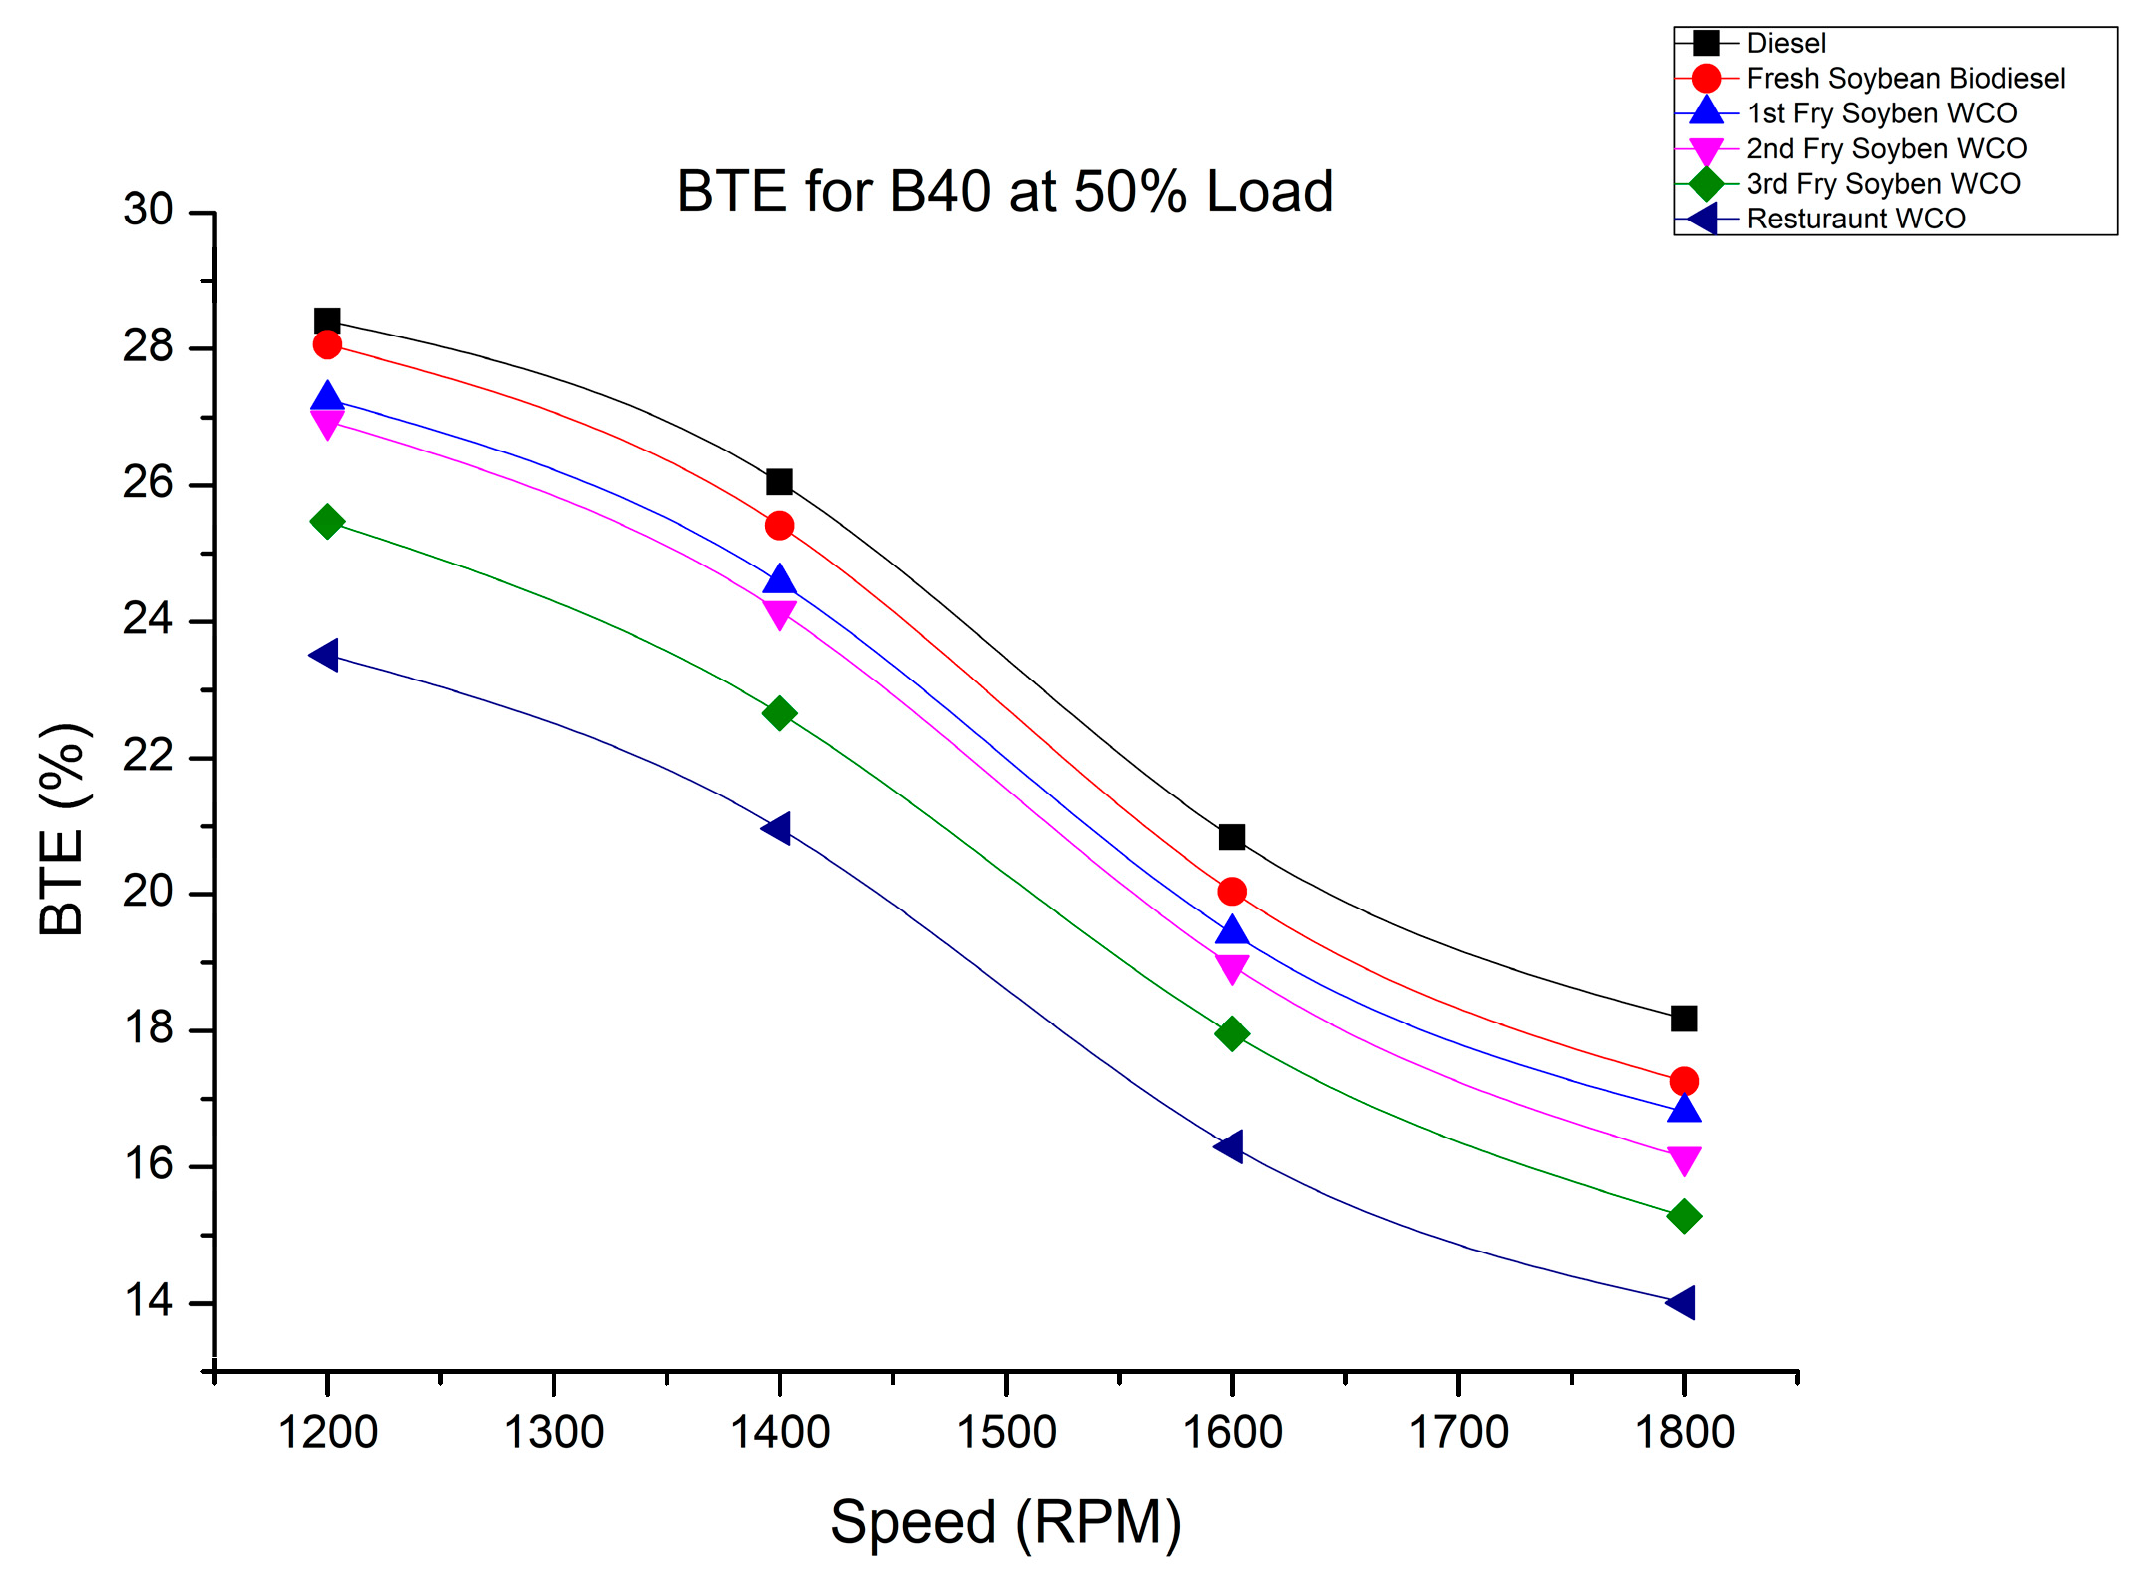
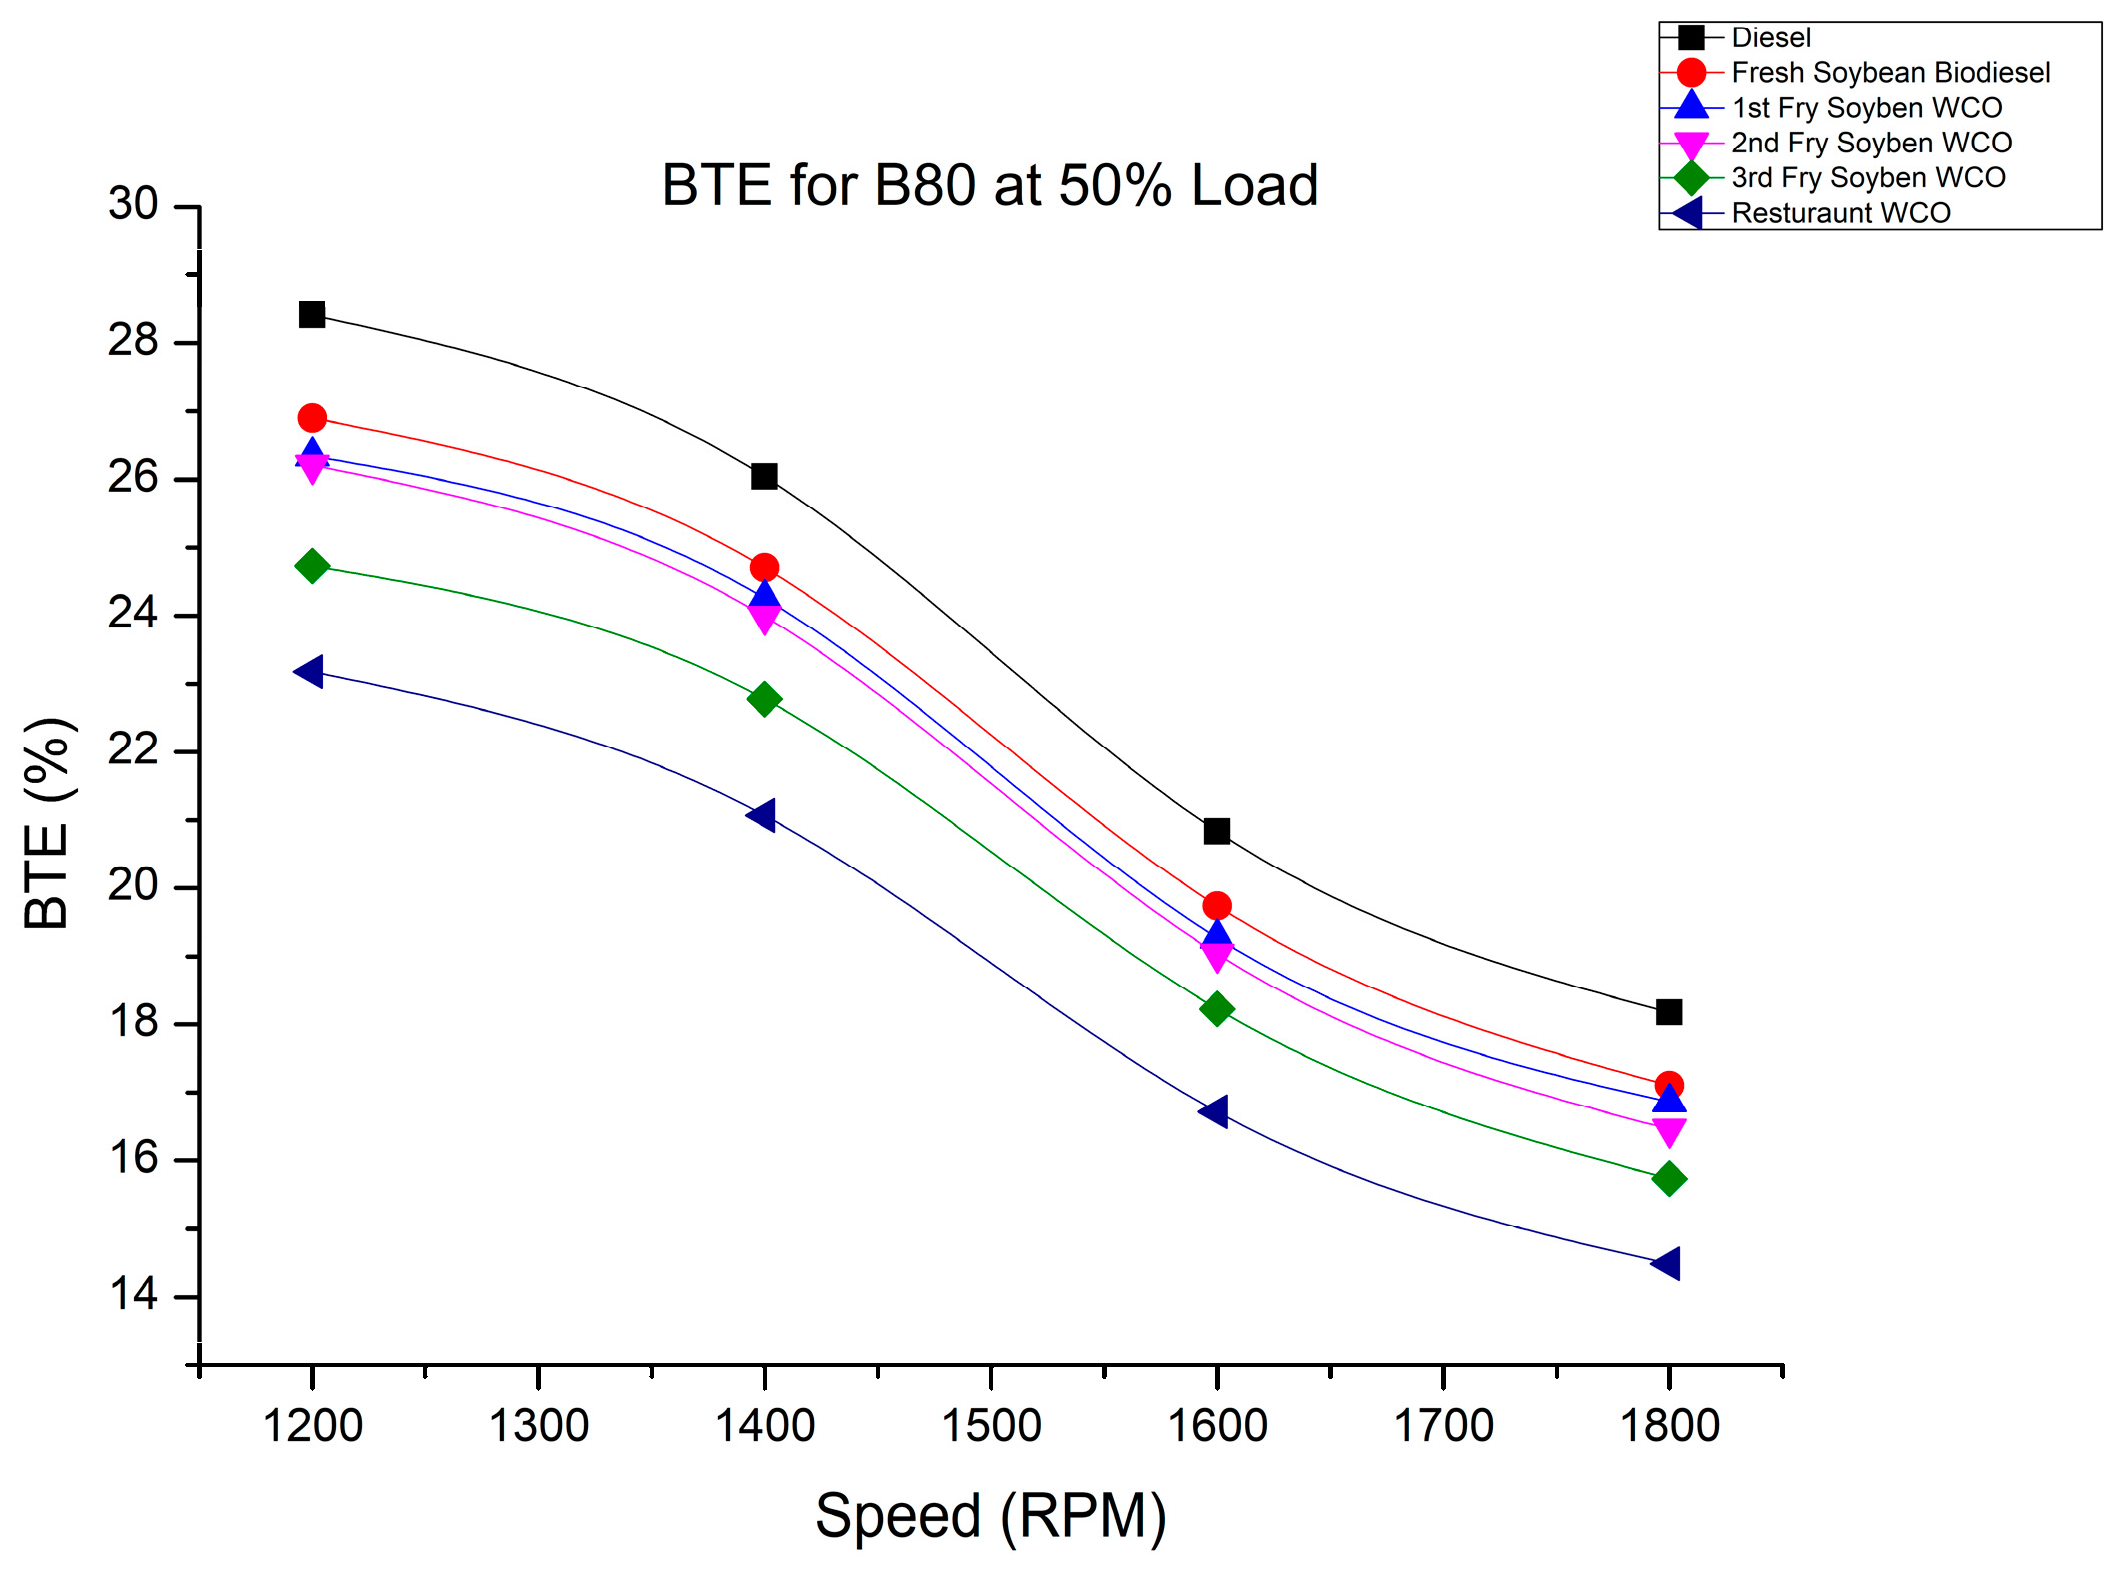
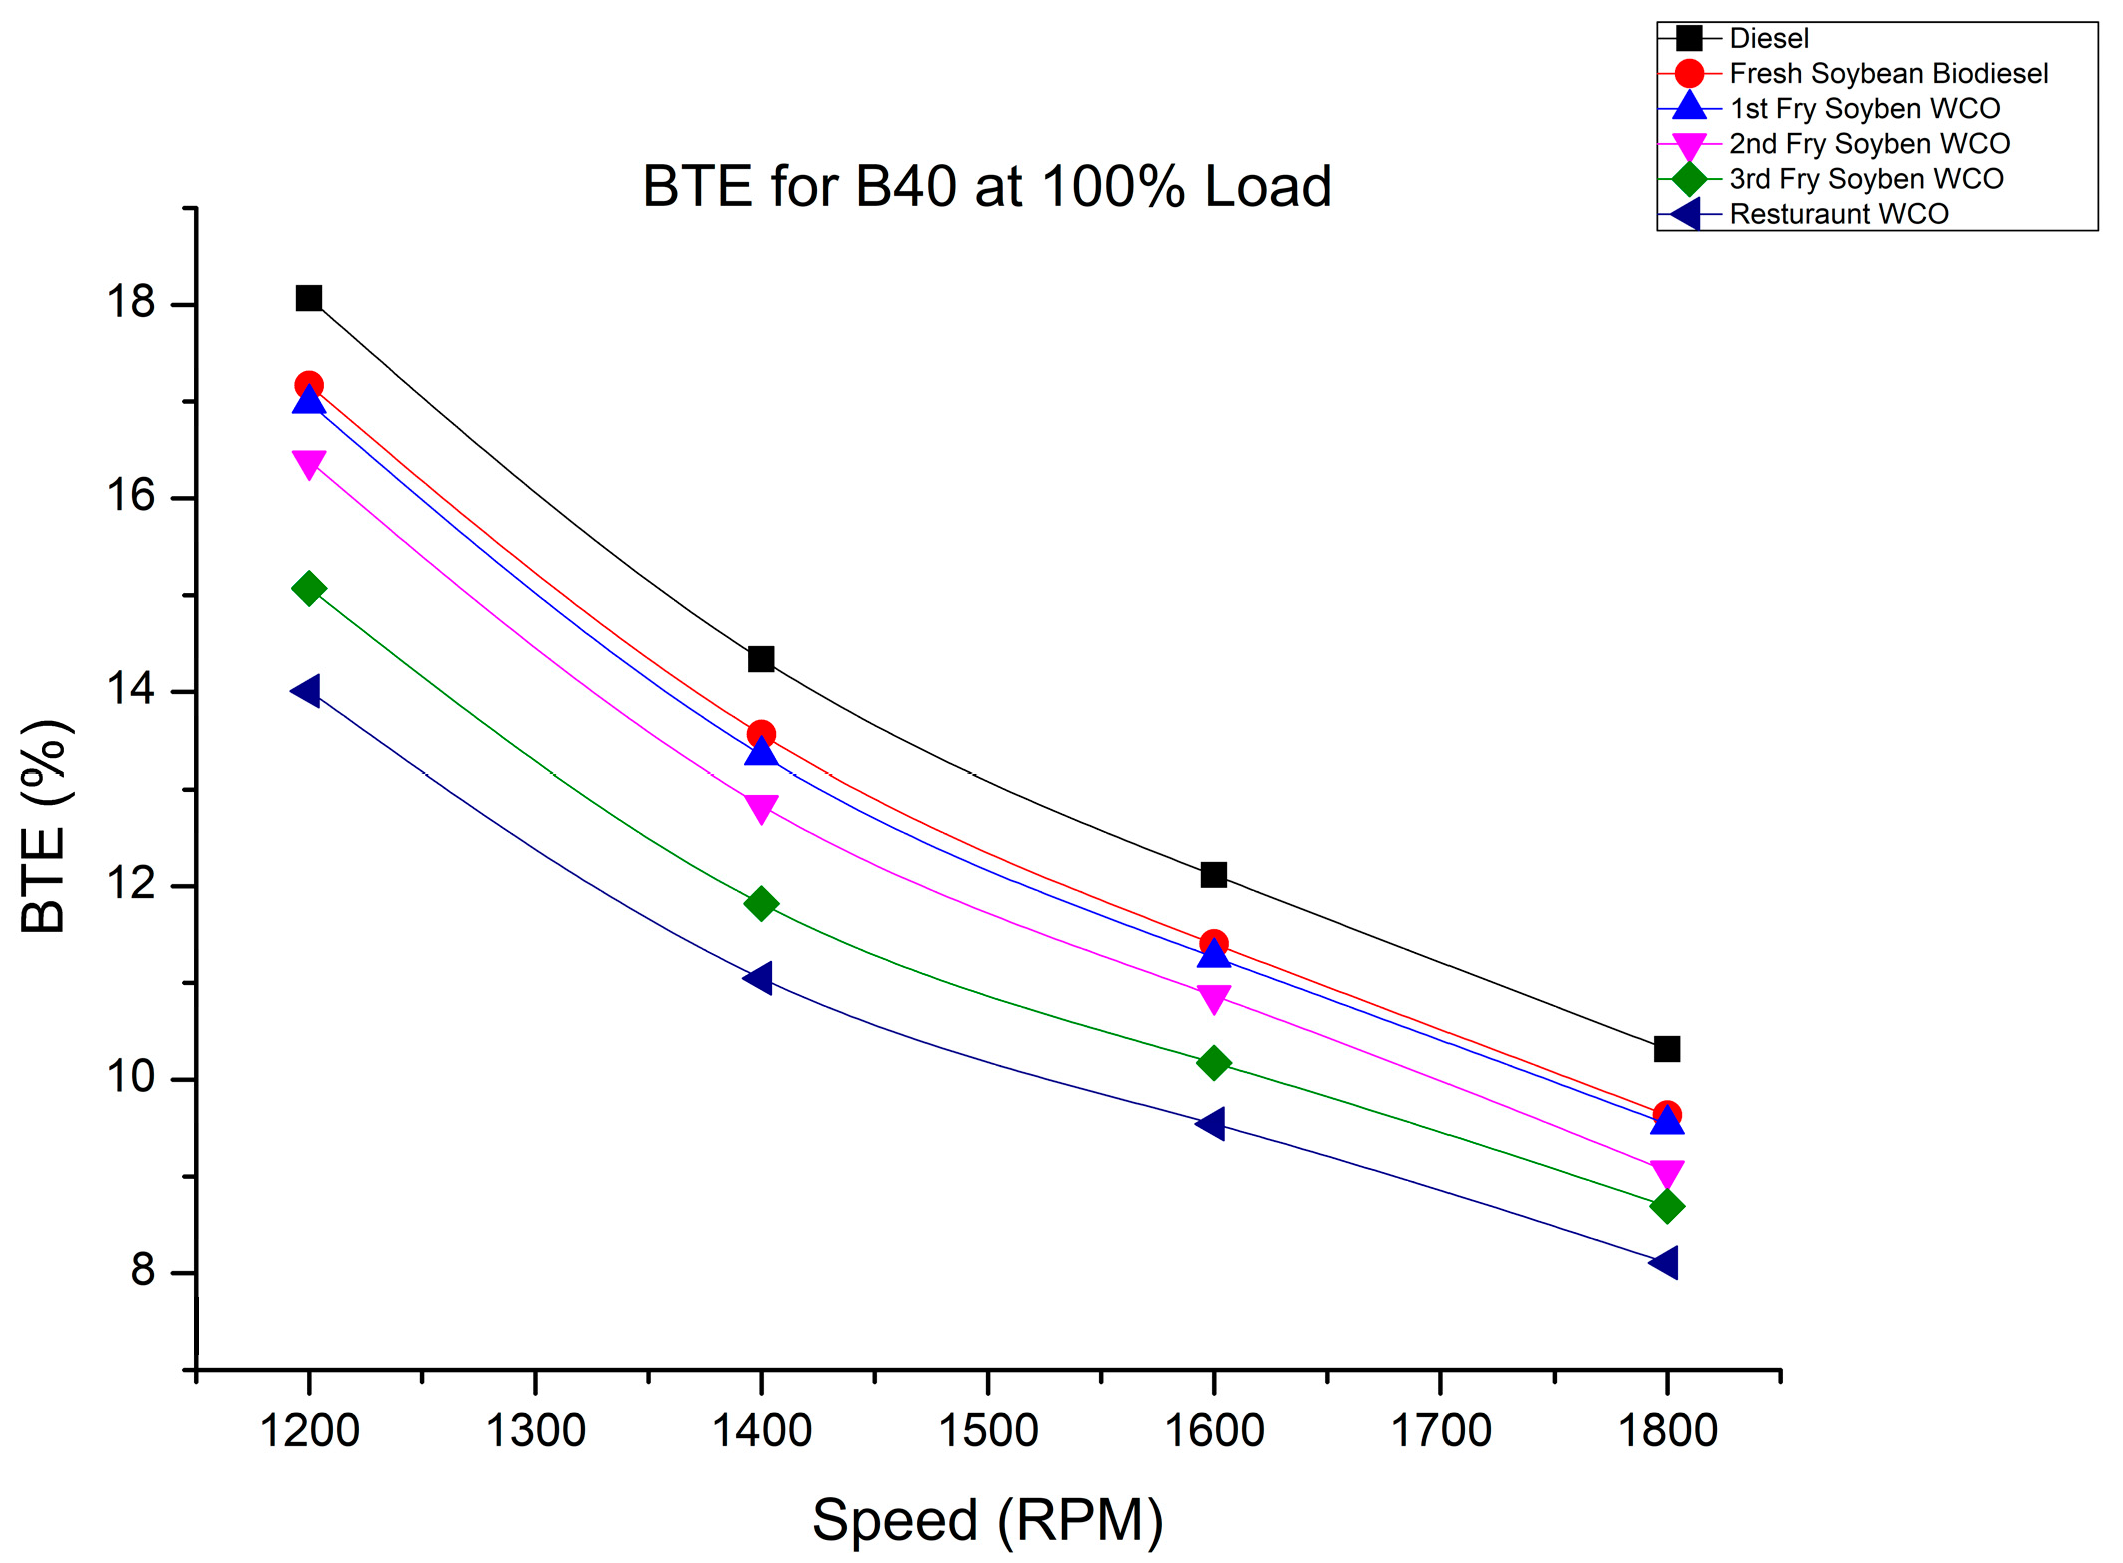
The ratio of brake power to fuel energy is known as brake thermal efficiency [33,34]. It can also be defined as the efficiency of converting the chemical energy of the fuel to useful work. The BTE also expresses the quality of combustion in the engine. Figure 2, Figure 3, Figure 4 and Figure 5 show the variation in the brake thermal efficiency of the B40 and B80 fuel blends under 50% and 100% load conditions. From the different experimental results, it was observed that diesel fuel had the highest value of the BTE at different speed and load conditions compared with other test fuels and was lower for SOB, 1FWCOB, 2FWCOB, 3FWCOB, and RFWCOB. The reason for the low BTE was the higher density and viscosity, which was followed by low atomization and vaporization of the fuel [35,36,37]. At higher speeds, the time lag after the combustion phase was due to a change in the valve timing after the opening of the exhaust valve; therefore, the combustion time was shortened to produce high power, and thus, poor combustion efficiency occurred at higher loads. At higher engine speeds, the air–fuel ratio was poor, resulting in a low combustion rate for the test fry biodiesel fuels, thus decreasing the BTE with increasing engine speed [38].
From Figure 2, Figure 3, Figure 4 and Figure 5, it was noted that the BTE was correlated with the engine rpm for all fuel blends at 50% and 100% engine loads. Similar trends were also observed by Bhuiya Muhammad et al. [39], Abul Kalam et al. [40], and S. Imtenan et al. [41]. It was observed that the BTE decreased with increasing the frying time of the waste cooking oil used in the biodiesel. The reason for the reduction in the BTE was the density and viscosity of the fuel changed with increased frying time, which, in turn, affected the atomization and vaporization of the fuel. Diesel had the highest BTE in the 50% load condition. Figure 2 shows the BTE variation for the B40 fuel blends in the 50% load condition. SOB varied from 28.06% to 17.26%, 1FWCOB varied from 27.26% to 16.81%, 2FWCOB varied from 26.94% to 16.14%, 3FWCOB varied from 25.47% to 15.28%, and RFWCOB varied from 23.51% to 14.01% at 1200 rpm to 1800 rpm, respectively. Figure 3 shows the BTE variation for the B80 fuel blends in the 50% load condition. SOB varied from 26.90% to 24.72%, 1FWCOB varied from 26.34% to 16.86%, 2FWCOB varied from 26.21% to 16.46%, 3FWCOB varied from 24.73% to 16.74%, and RFWCOB varied from 23.18 to 14.48% at 1200 rpm to 1800 rpm, respectively.
Figure 4 shows the BTE variation for the B40 fuel blends in the 100% load condition. SOB varied from 17.17% to 9.63%, 1FWCOB varied from 16.98% to 9.54%, 2FWCOB varied from 16.38% to 9.06%, 3FWCOB varied from 15.07% to 8.69%, and RFWCOB varied from 14.01% to 8.11% at 1200 rpm to 1800 rpm, respectively. Figure 5 shows the BTE variation for the B80 fuel blends in the 100% load condition. SOB varied from 17.10% to 9.14%, 1-FWCOB varied from 16.86% to 8.87%, 2-FWCOB varied from 16.22% to 8.63%, 3-FWCOB varied from 14.73% to 8.15%, and RFWCOB varied from 13.63% to 7.81% at 1200 rpm to 1800 rpm, respectively. On increasing the biodiesel blending, the BTE declined because of the higher density and viscosity [34,42].

4.2. Effect on the BSFC (Brake-Specific Fuel Consumption)

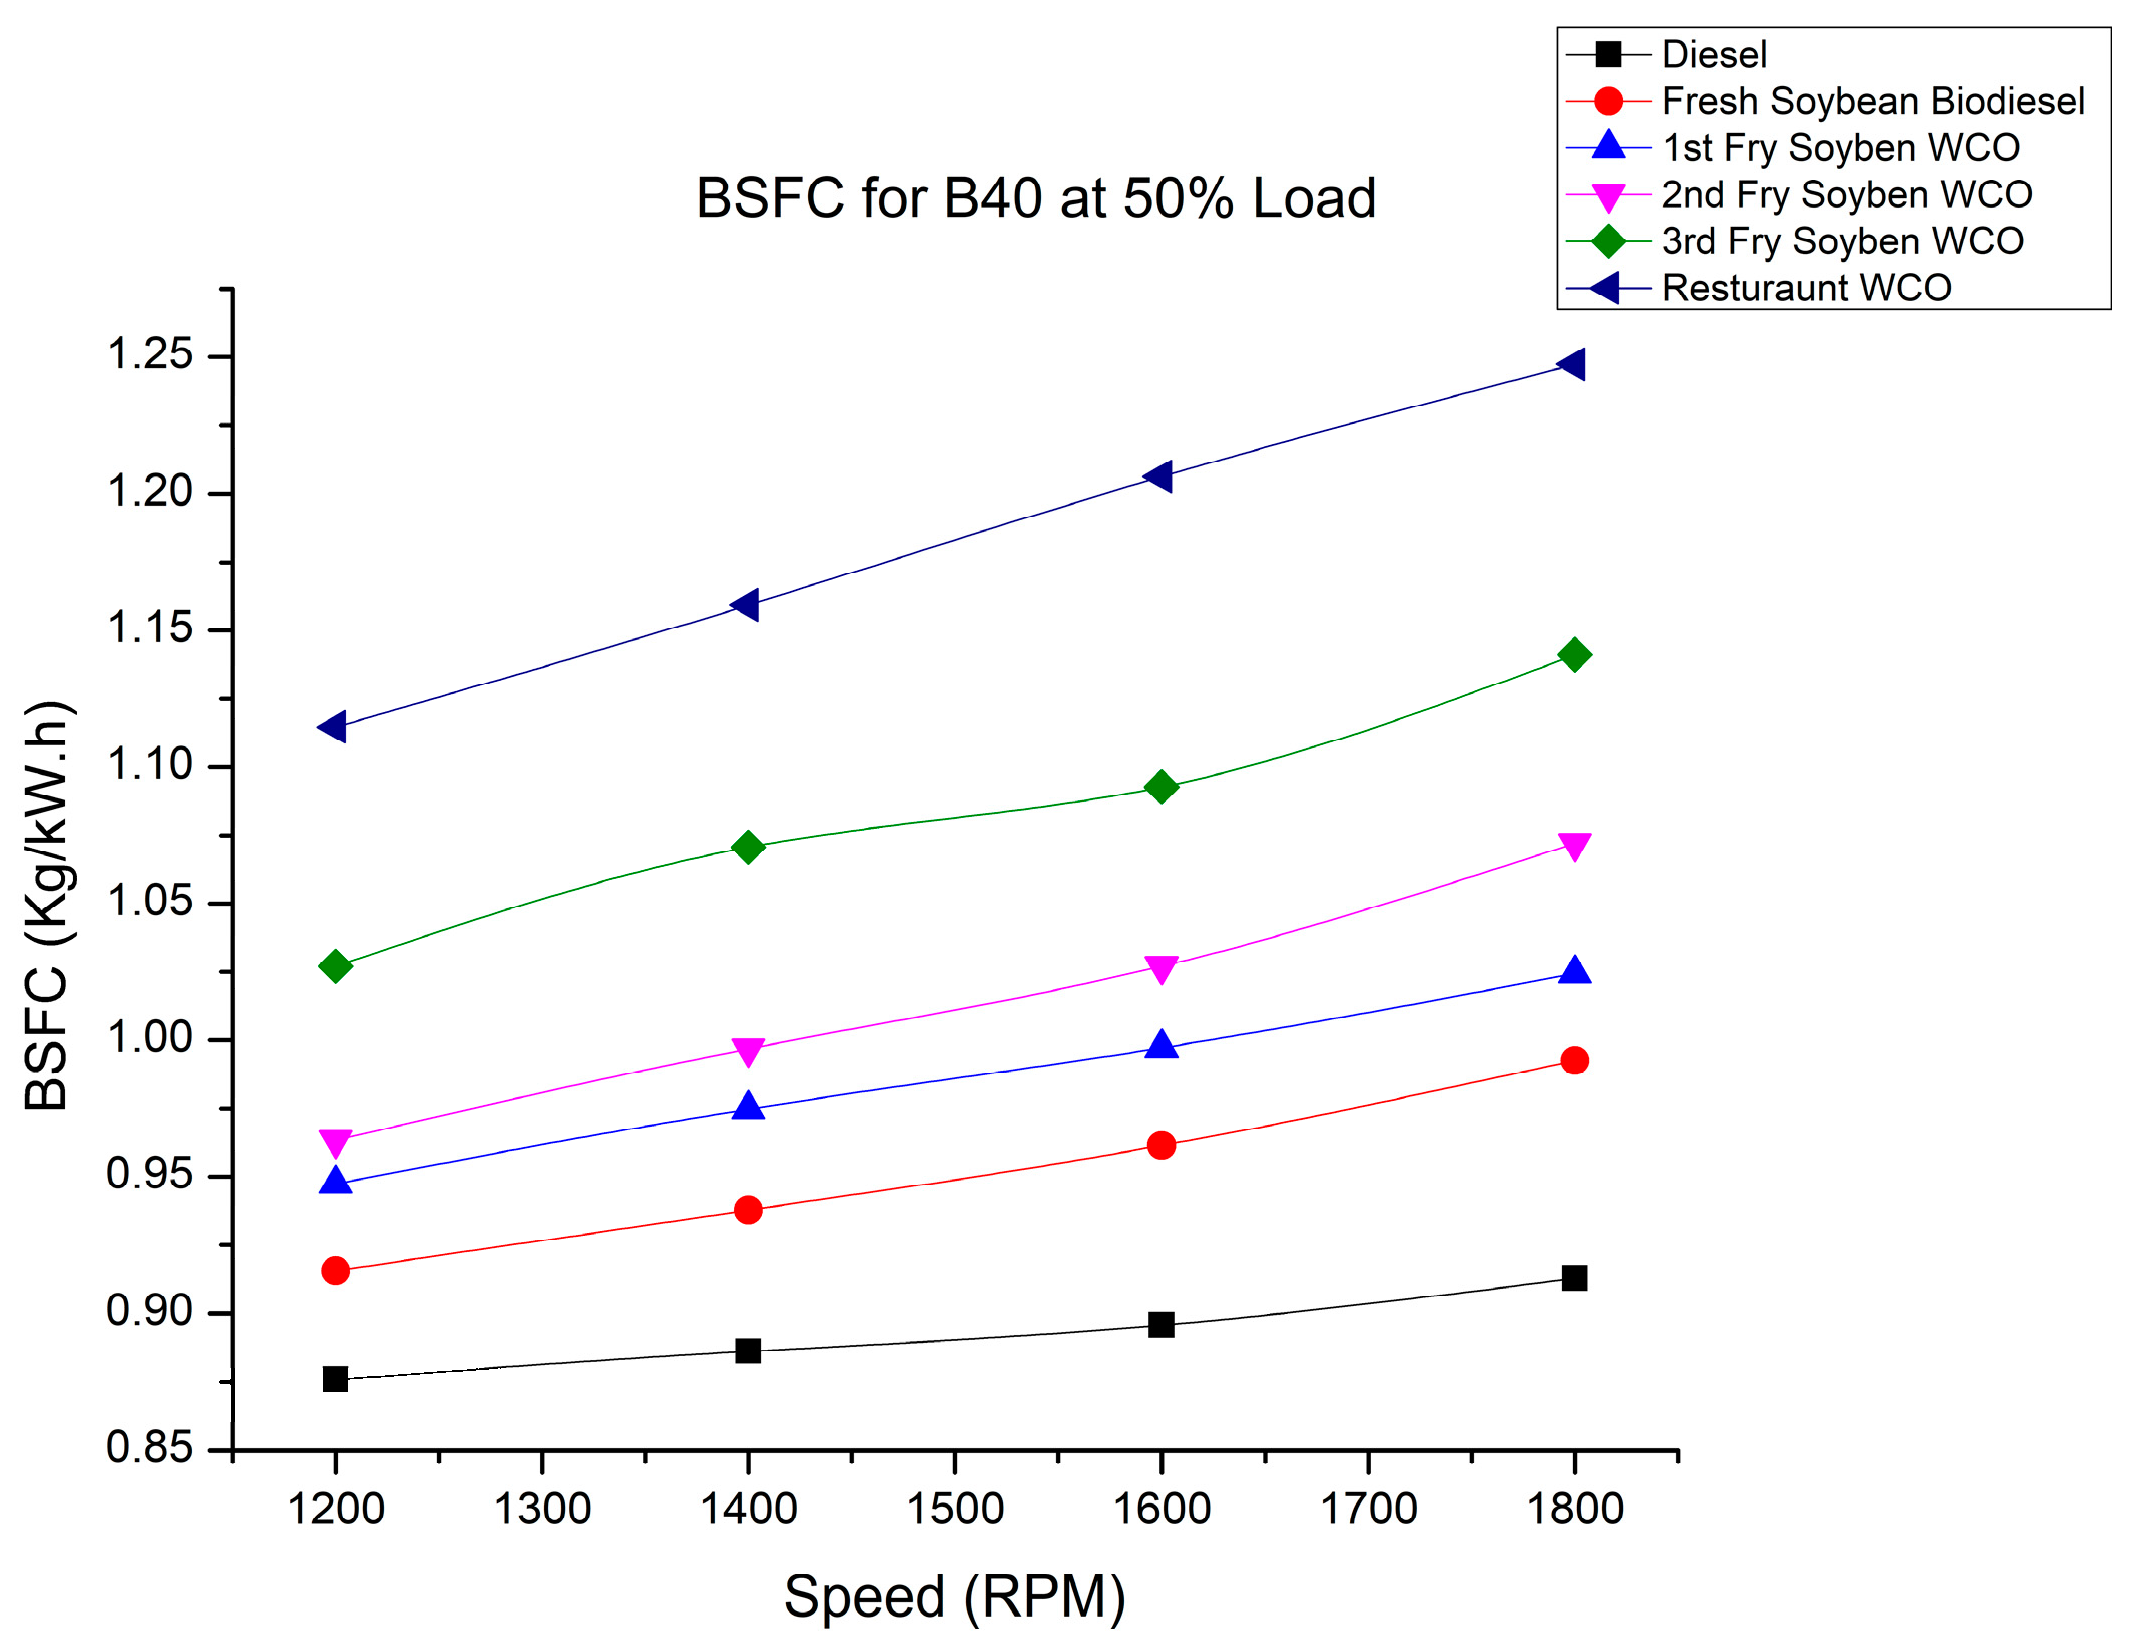
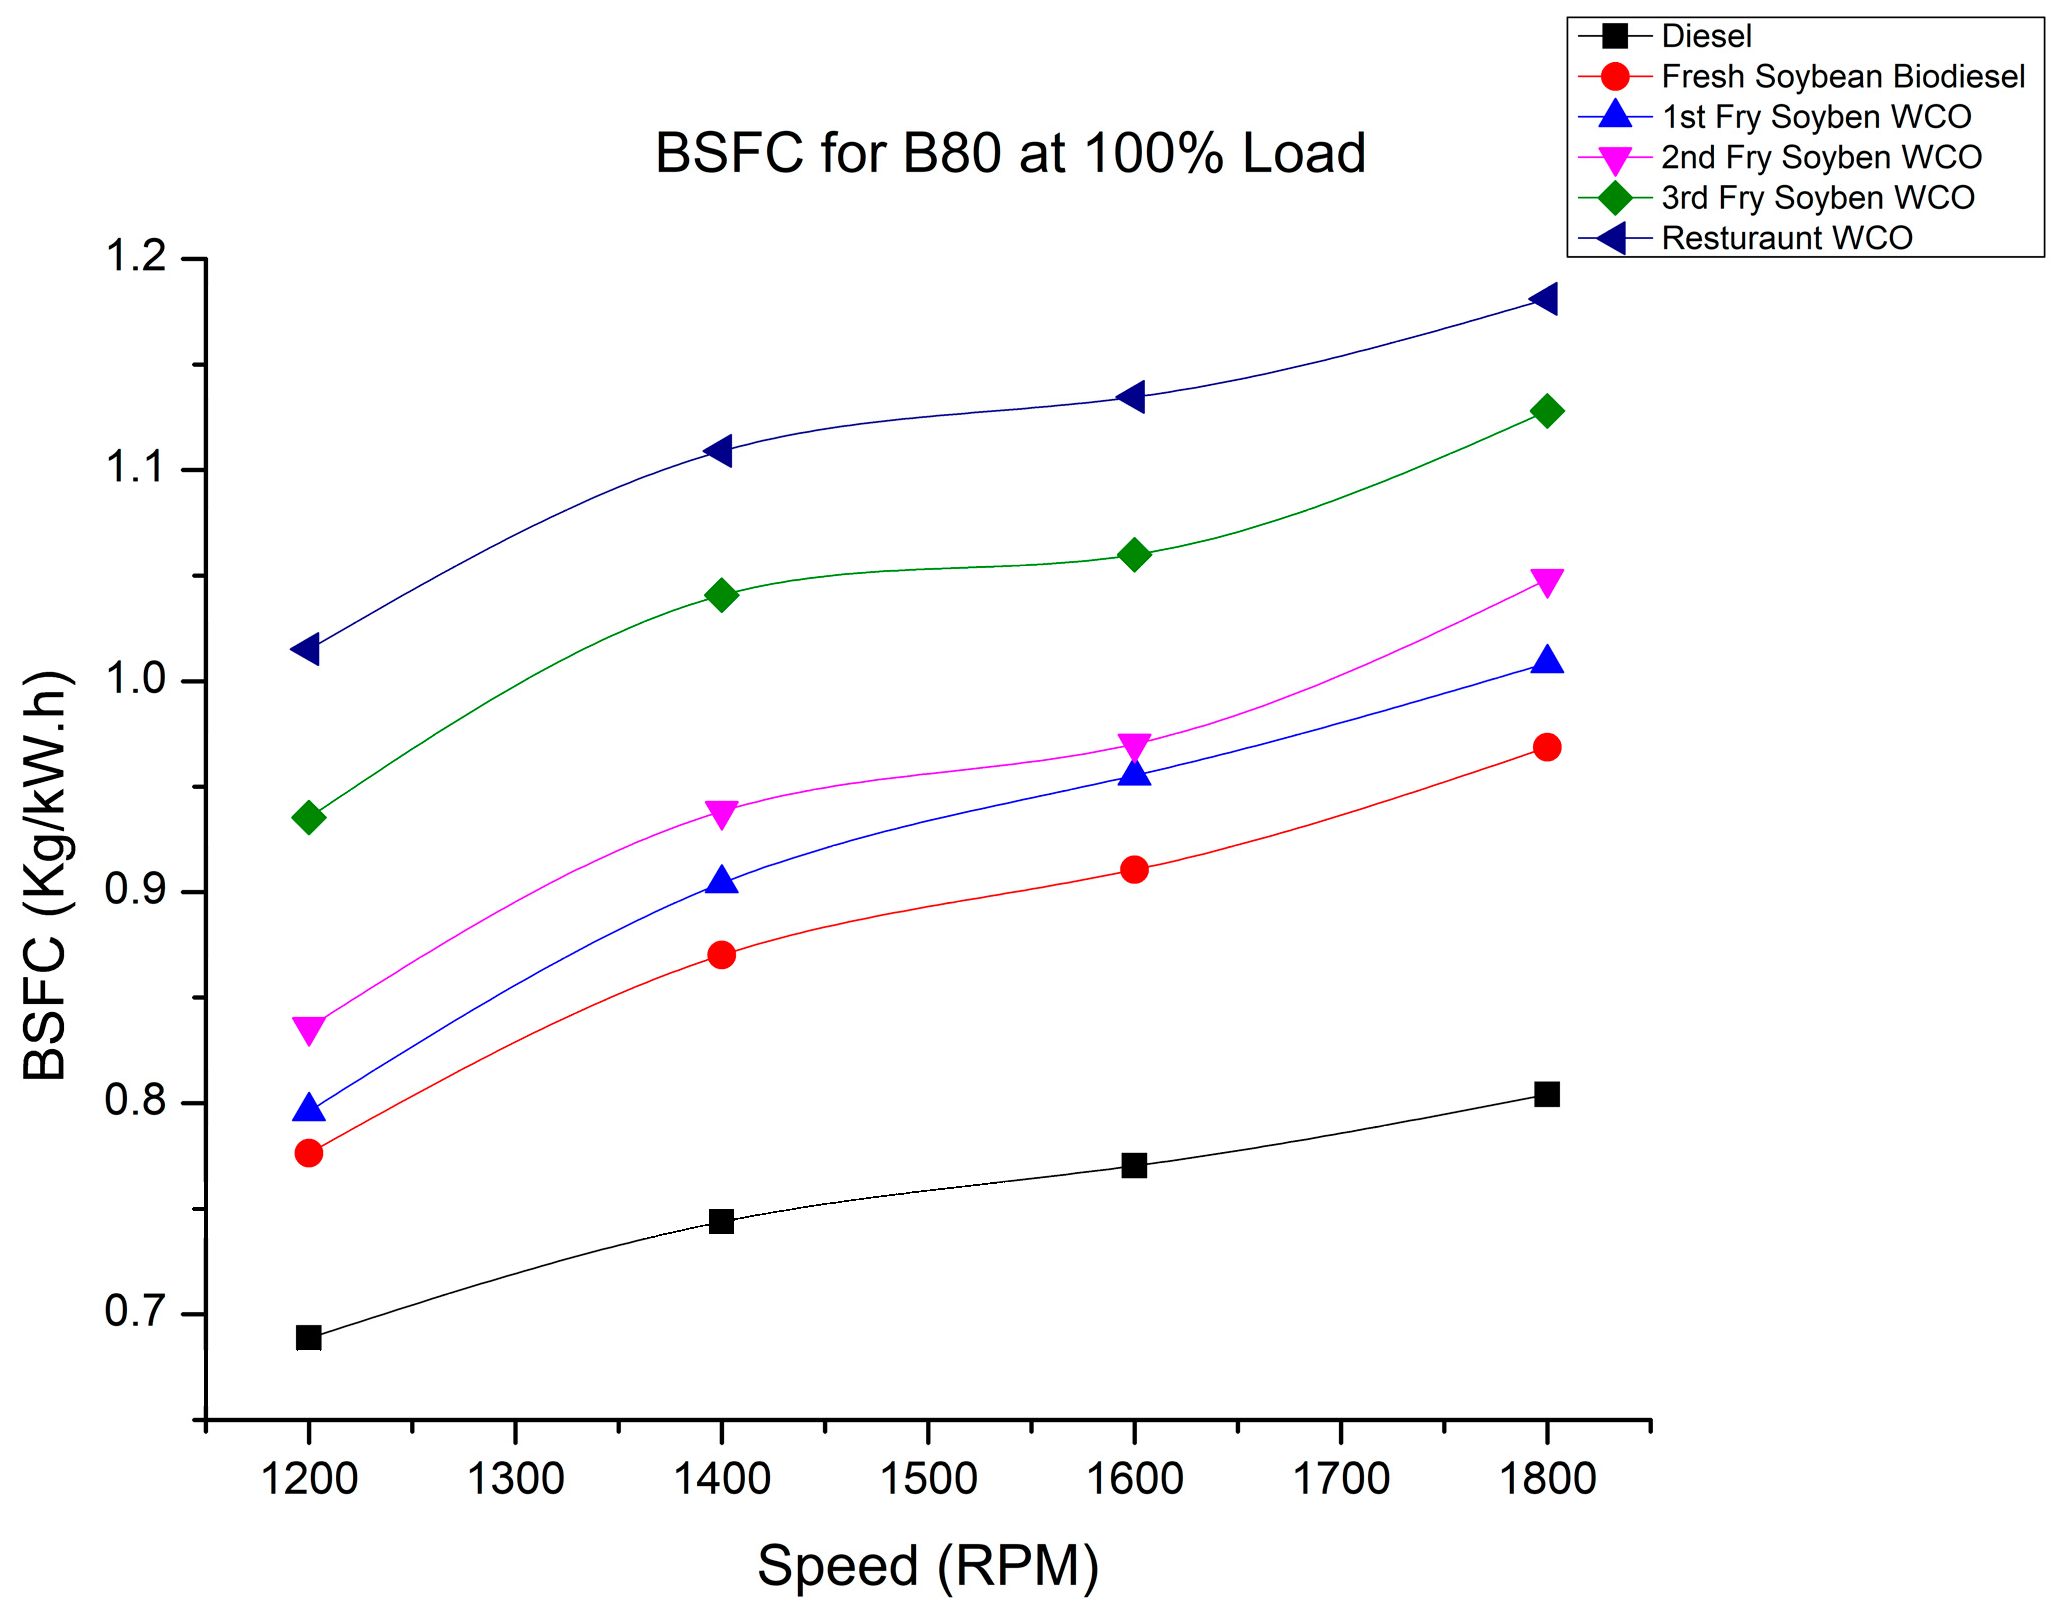
An analysis of the fuel that an engine uses shows that brake-specific fuel consumption is a crucial component in determining how well an engine performs. Fresh cooking oil and fry oil with varying frying numbers, namely, SOB, 1-FWCOB, 2-FWCOB, 3-FWCOB, and R-FWCOB, were used in the engine. The fluctuations of the BSFC for SOB, 1-FWCOB, 2-FWCOB, 3-FWCOB, R-FWCOB for B40 and B80 blends, along with conventional diesel, under 50% and 100% loads are shown in Figure 6, Figure 7, Figure 8 and Figure 9.
Figure 6 and Figure 7 show the BSFC variation with the engine speed for the B40 and B80 blends at 50% load. Figure 8 and Figure 9 show the BSFC variation for the B40 and B80 blends with the engine speed in the 100% load condition. It is evident from the results that the BSFC rose with increasing rpm under various load conditions. The BSFC for RFWCOB was the highest in all conditions compared with other fuels. The BSFC was low at 1200 rpm (low speed) because of the low fuel consumption; with an increase in the rpm at the same load, the BSFC increased due to the higher fuel consumption to develop higher power. Biodiesel has low heating and high viscosity characteristics; more biodiesel is consequently needed to produce the same amount of power. As the frying time increased, the density of the biodiesel increased. Therefore, the BSFC for RFWCOB B80 blend in the 50% and 100% load conditions had the highest values due to high density causing a viscosity increase. As a result, during the combustion stage, more fuel must be burned to provide the same power. Due to the increased density of the B80 blend compared with the B40 blend, the fuel injection pump may discharge more fuel for the same plunger displacement, increasing the BSFC [22,33].

4.3. Effect on CO2 Emissions with Engine Rpm

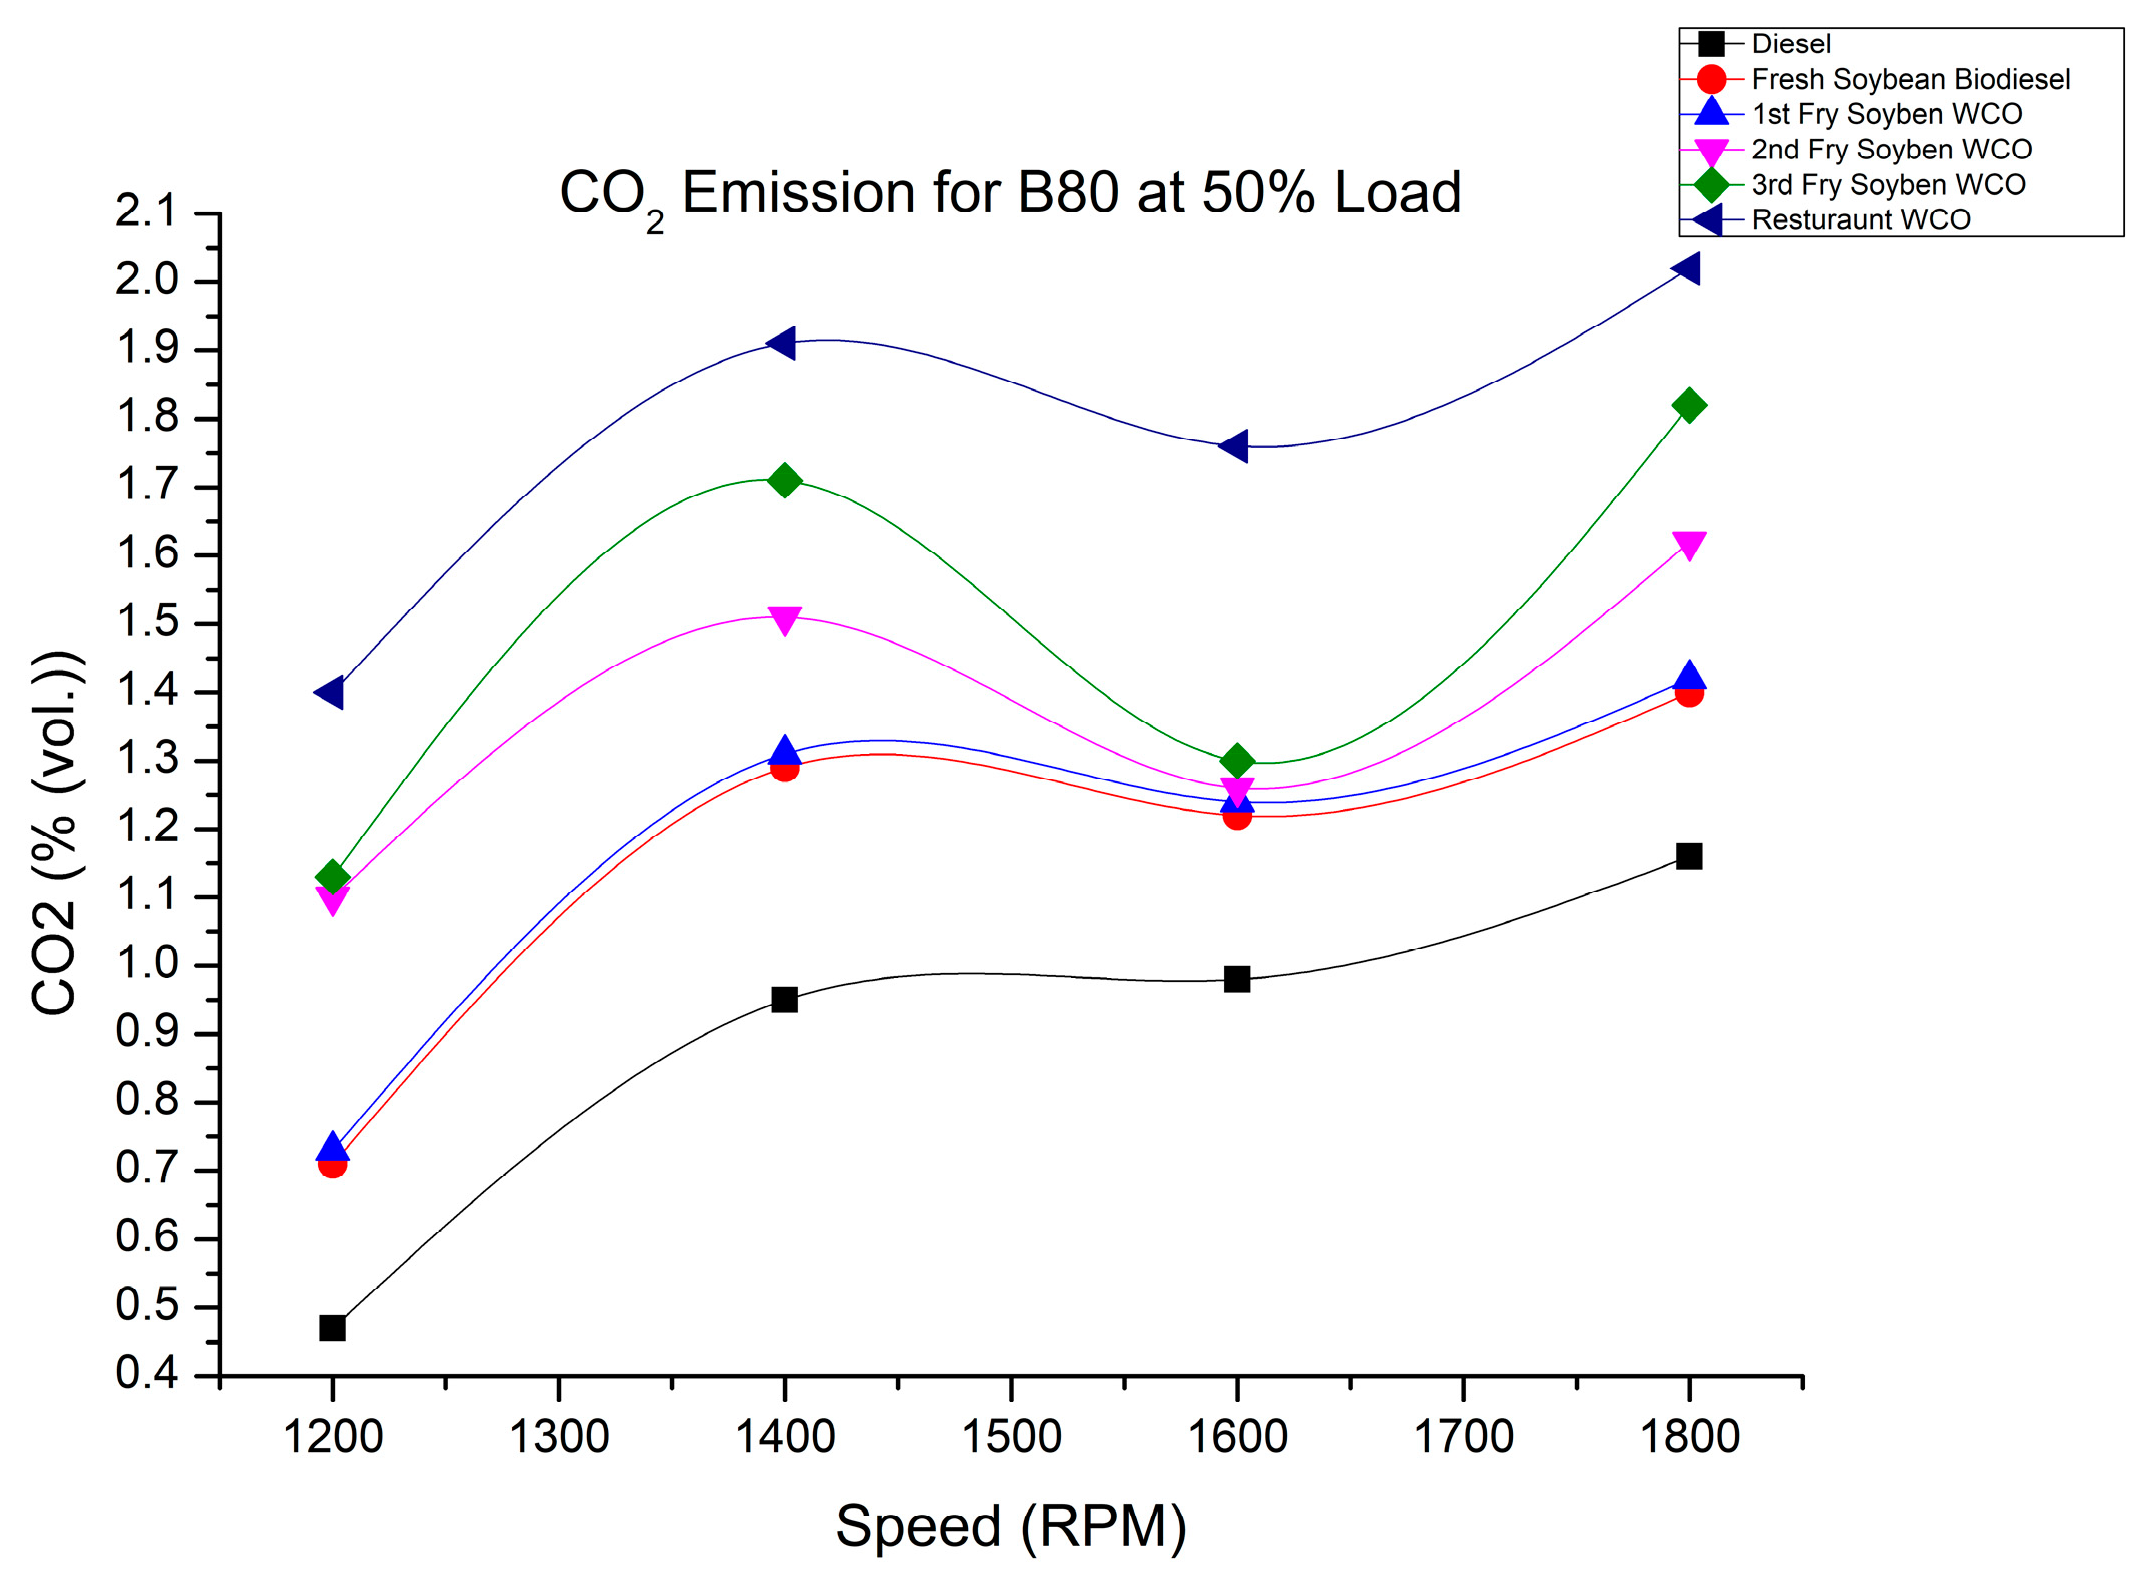
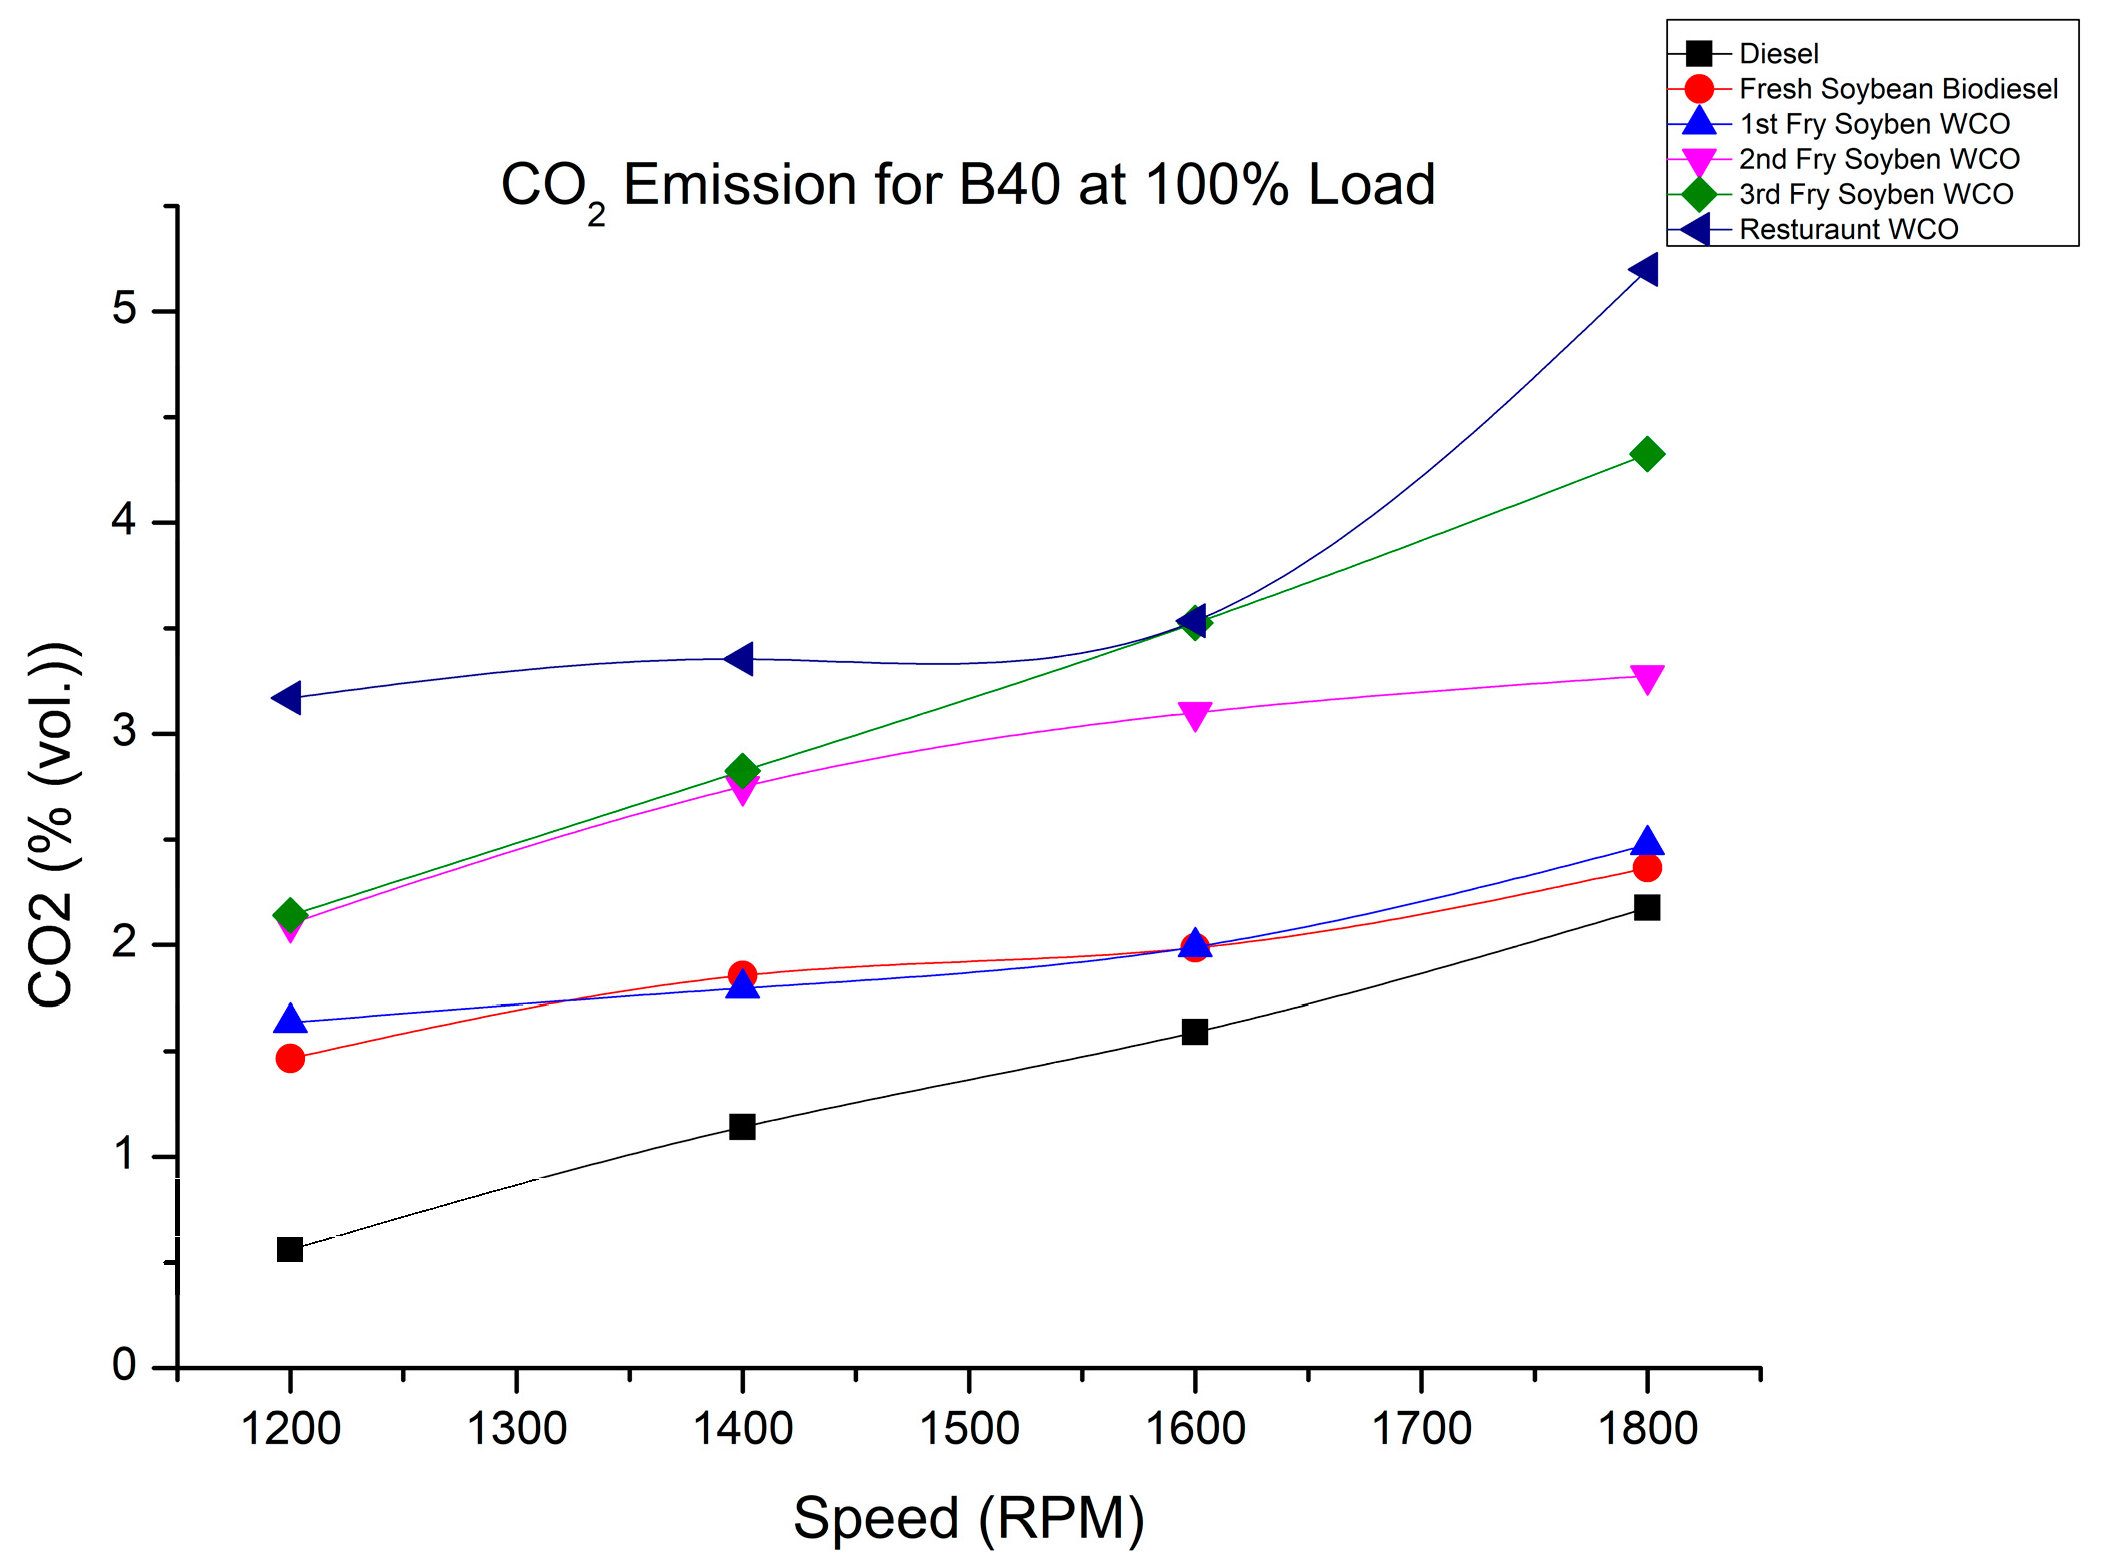
Figure 10 shows the results of the B40 blend at 1200 rpm when using SOB, 1FWCOB, 2FWCOB, 3FWCOB, and RFWCOB, where 0.56%vol., 0.58%vol., 0.95%vol., 0.69%vol., and 0.9%vol., respectively, were measured for the 50% load. The B80 blend’s CO2 emissions are shown in Figure 11, where at 1200 rpm, 0.71%vol., 0.73%vol., 1.1%vol., 1.13%vol., and 1.4%vol. were measured for SOB, 1FWCOB, 2FWCOB, 3FWCOB, and RFWCOB, respectively. Figure 12 shows the CO2 emissions at 1200 rpm for the B40 blend, which were 1.46%vol., 1.63%vol., 2.1%vol., 2.14%vol., and 3.17%vol., while at 1800 rpm, they were 2.36%vol., 2.47%vol., 3.27%vol., 4.32%vol., and 5.2%vol. for the SOB, 1FWCOB, 2FWCOB, 3FWCOB, and RFWCOB blends, respectively, for 100% engine load. Figure 13 shows the CO2 variation for the B80 blends at 100% engine load. CO2 emissions at 1200 rpm were 0.9%vol., 1.6%vol., 0.97%vol., 3.2%vol., and 4.1%vol., while at 1800 rpm, they were 2.6%vol., 3.96%vol., 2.4%vol., 7.2%vol., and 9.1%vol. for the SOB, 1FWCOB, 2FWCOB, 3FWCOB, and RFWCOB blends, respectively.
It was observed that there was a rising trend for CO2 emissions. Diesel recorded the lowest CO2 emissions compared with biodiesel fuel. Considering that biodiesel contains higher oxygen than conventional diesel, the relationship of higher CO2 with this fuel could have been a possible reason. During combustion, oxygen interacts with the unburned carbon atoms, causing more CO2 to be produced. As the frying time of the oil increased, CO2 emissions also rose. This was due to the fuel’s higher density and heating value, which relied on the mixing ratio and the frying number of the oil. Due to the fuel’s incomplete burning at a faster rate, it generated higher CO2 emissions [33,43].

4.4. Variation of NOx Emissions with Engine Rpm

Nitrogen oxides emissions are the consequence of the reaction between oxygen and nitrogen particles present in the air, which react at high temperatures and pressure in the combustion chamber of the engine. NOx formation can be explained using the following formulas from Zeldovich [44]:
N 2 + [ O ] NO + [ N ]
[ N ] + [ O 2 ] NO + [ O ]
N + [ OH ] NO + [ H ]
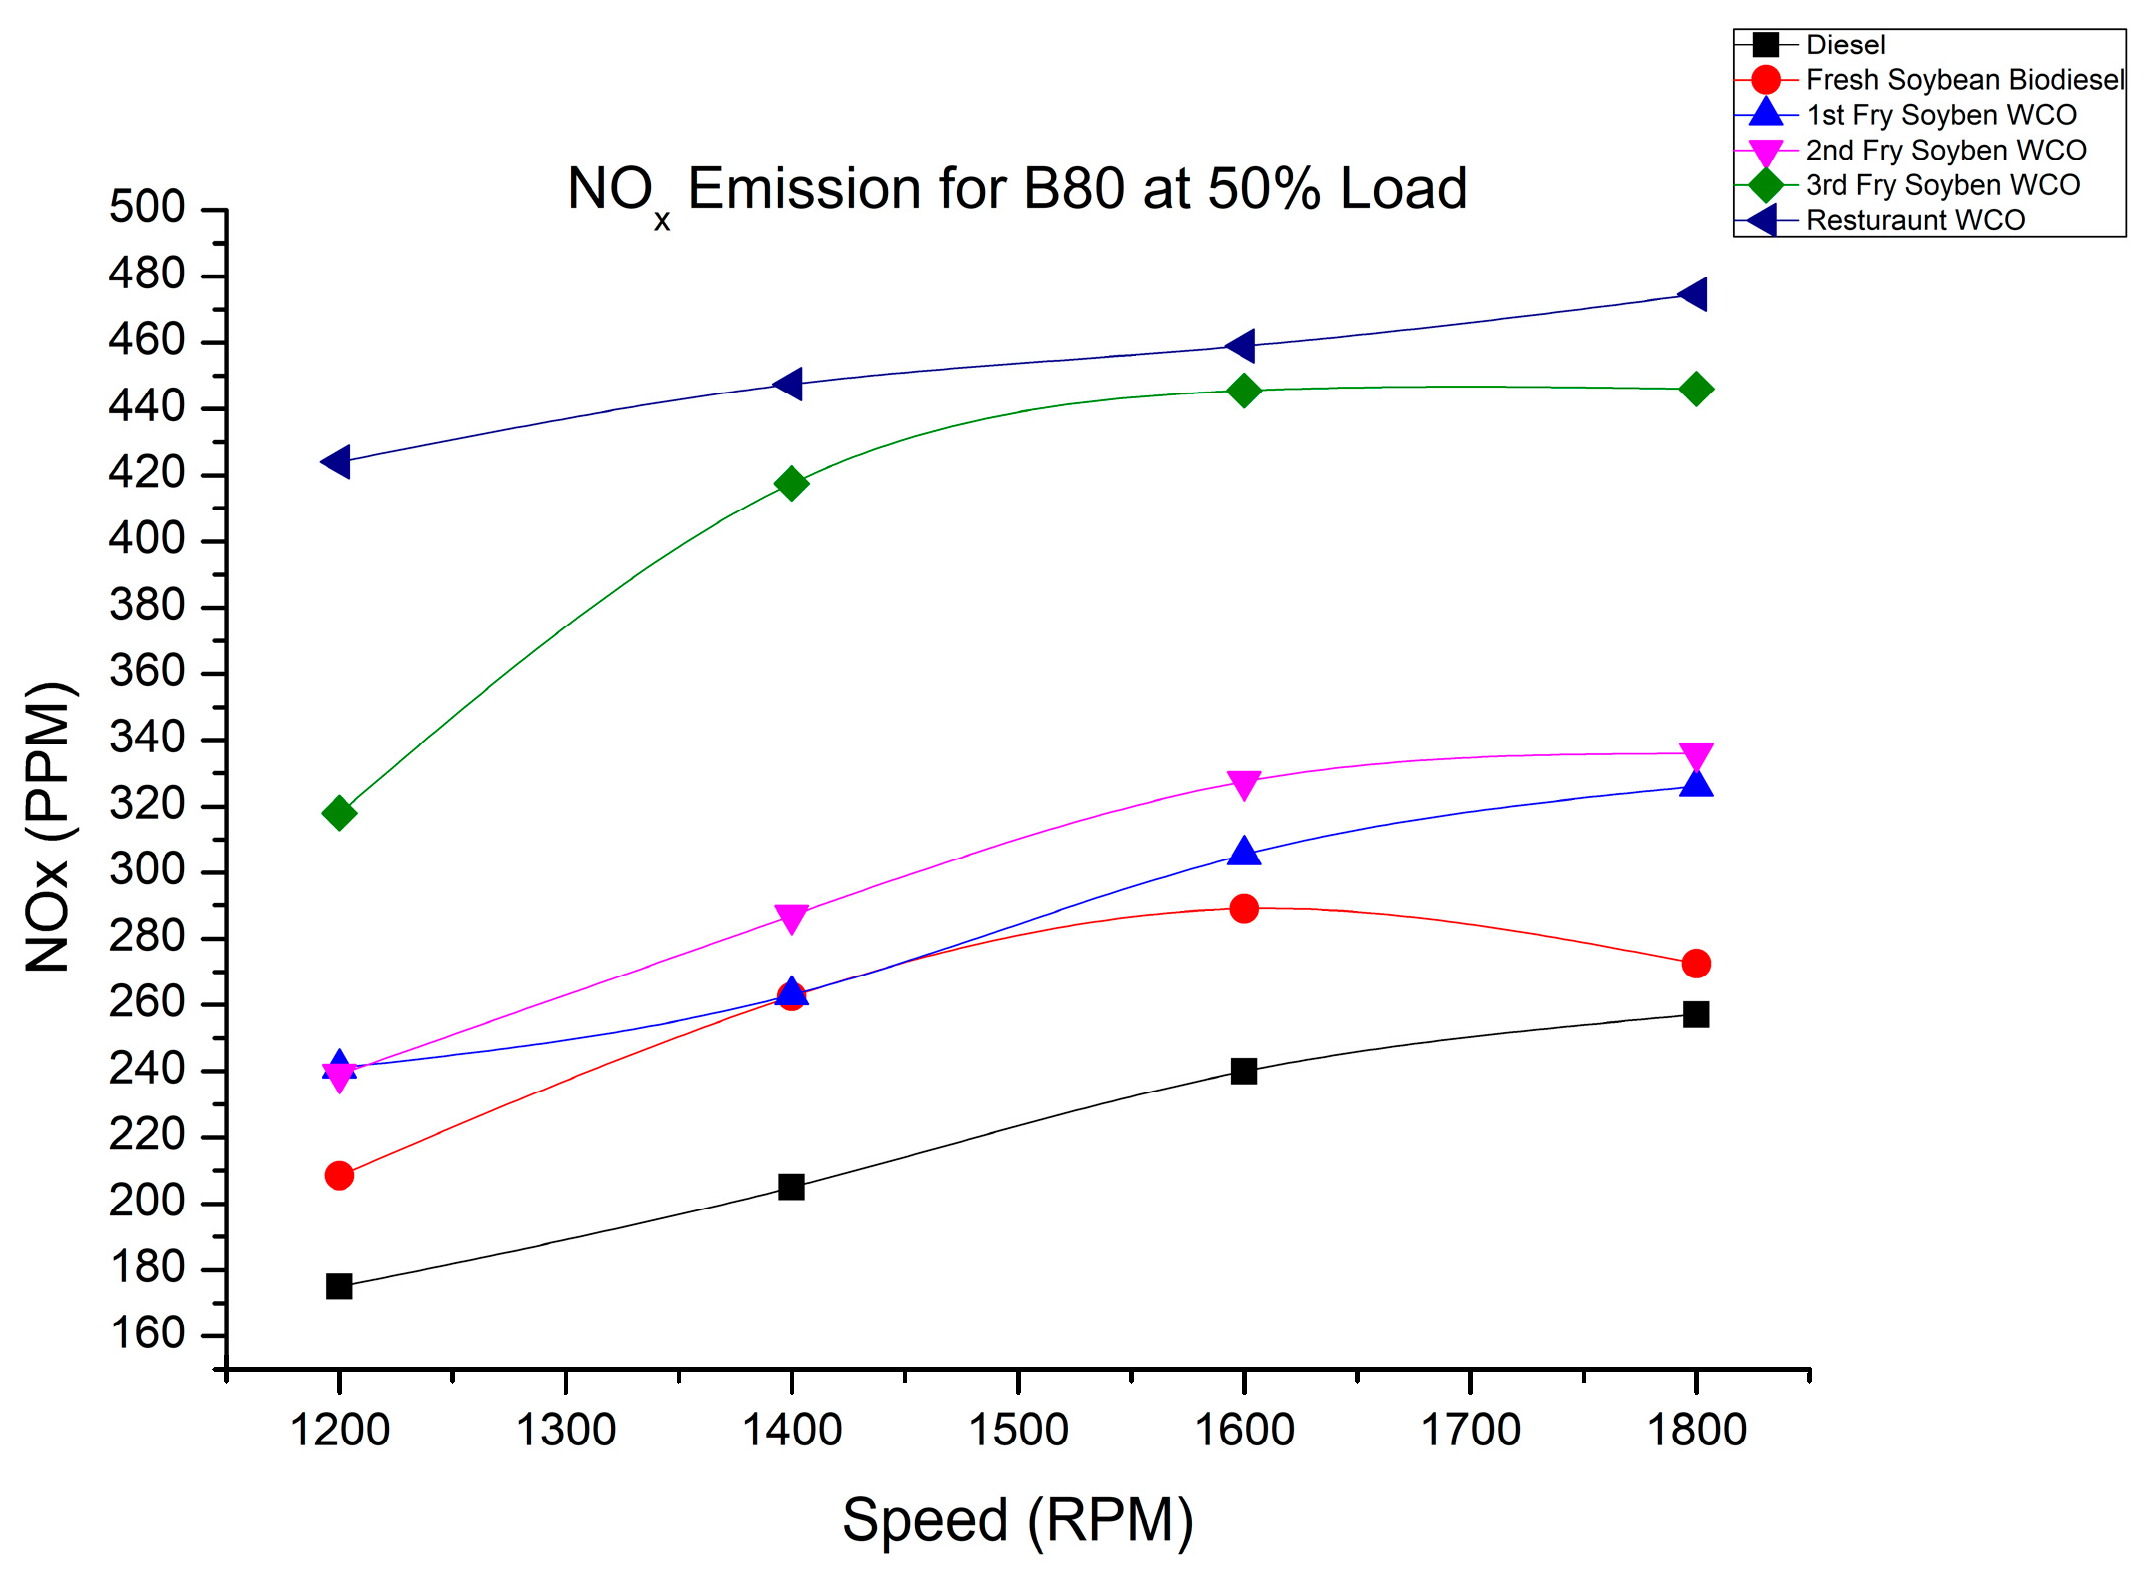
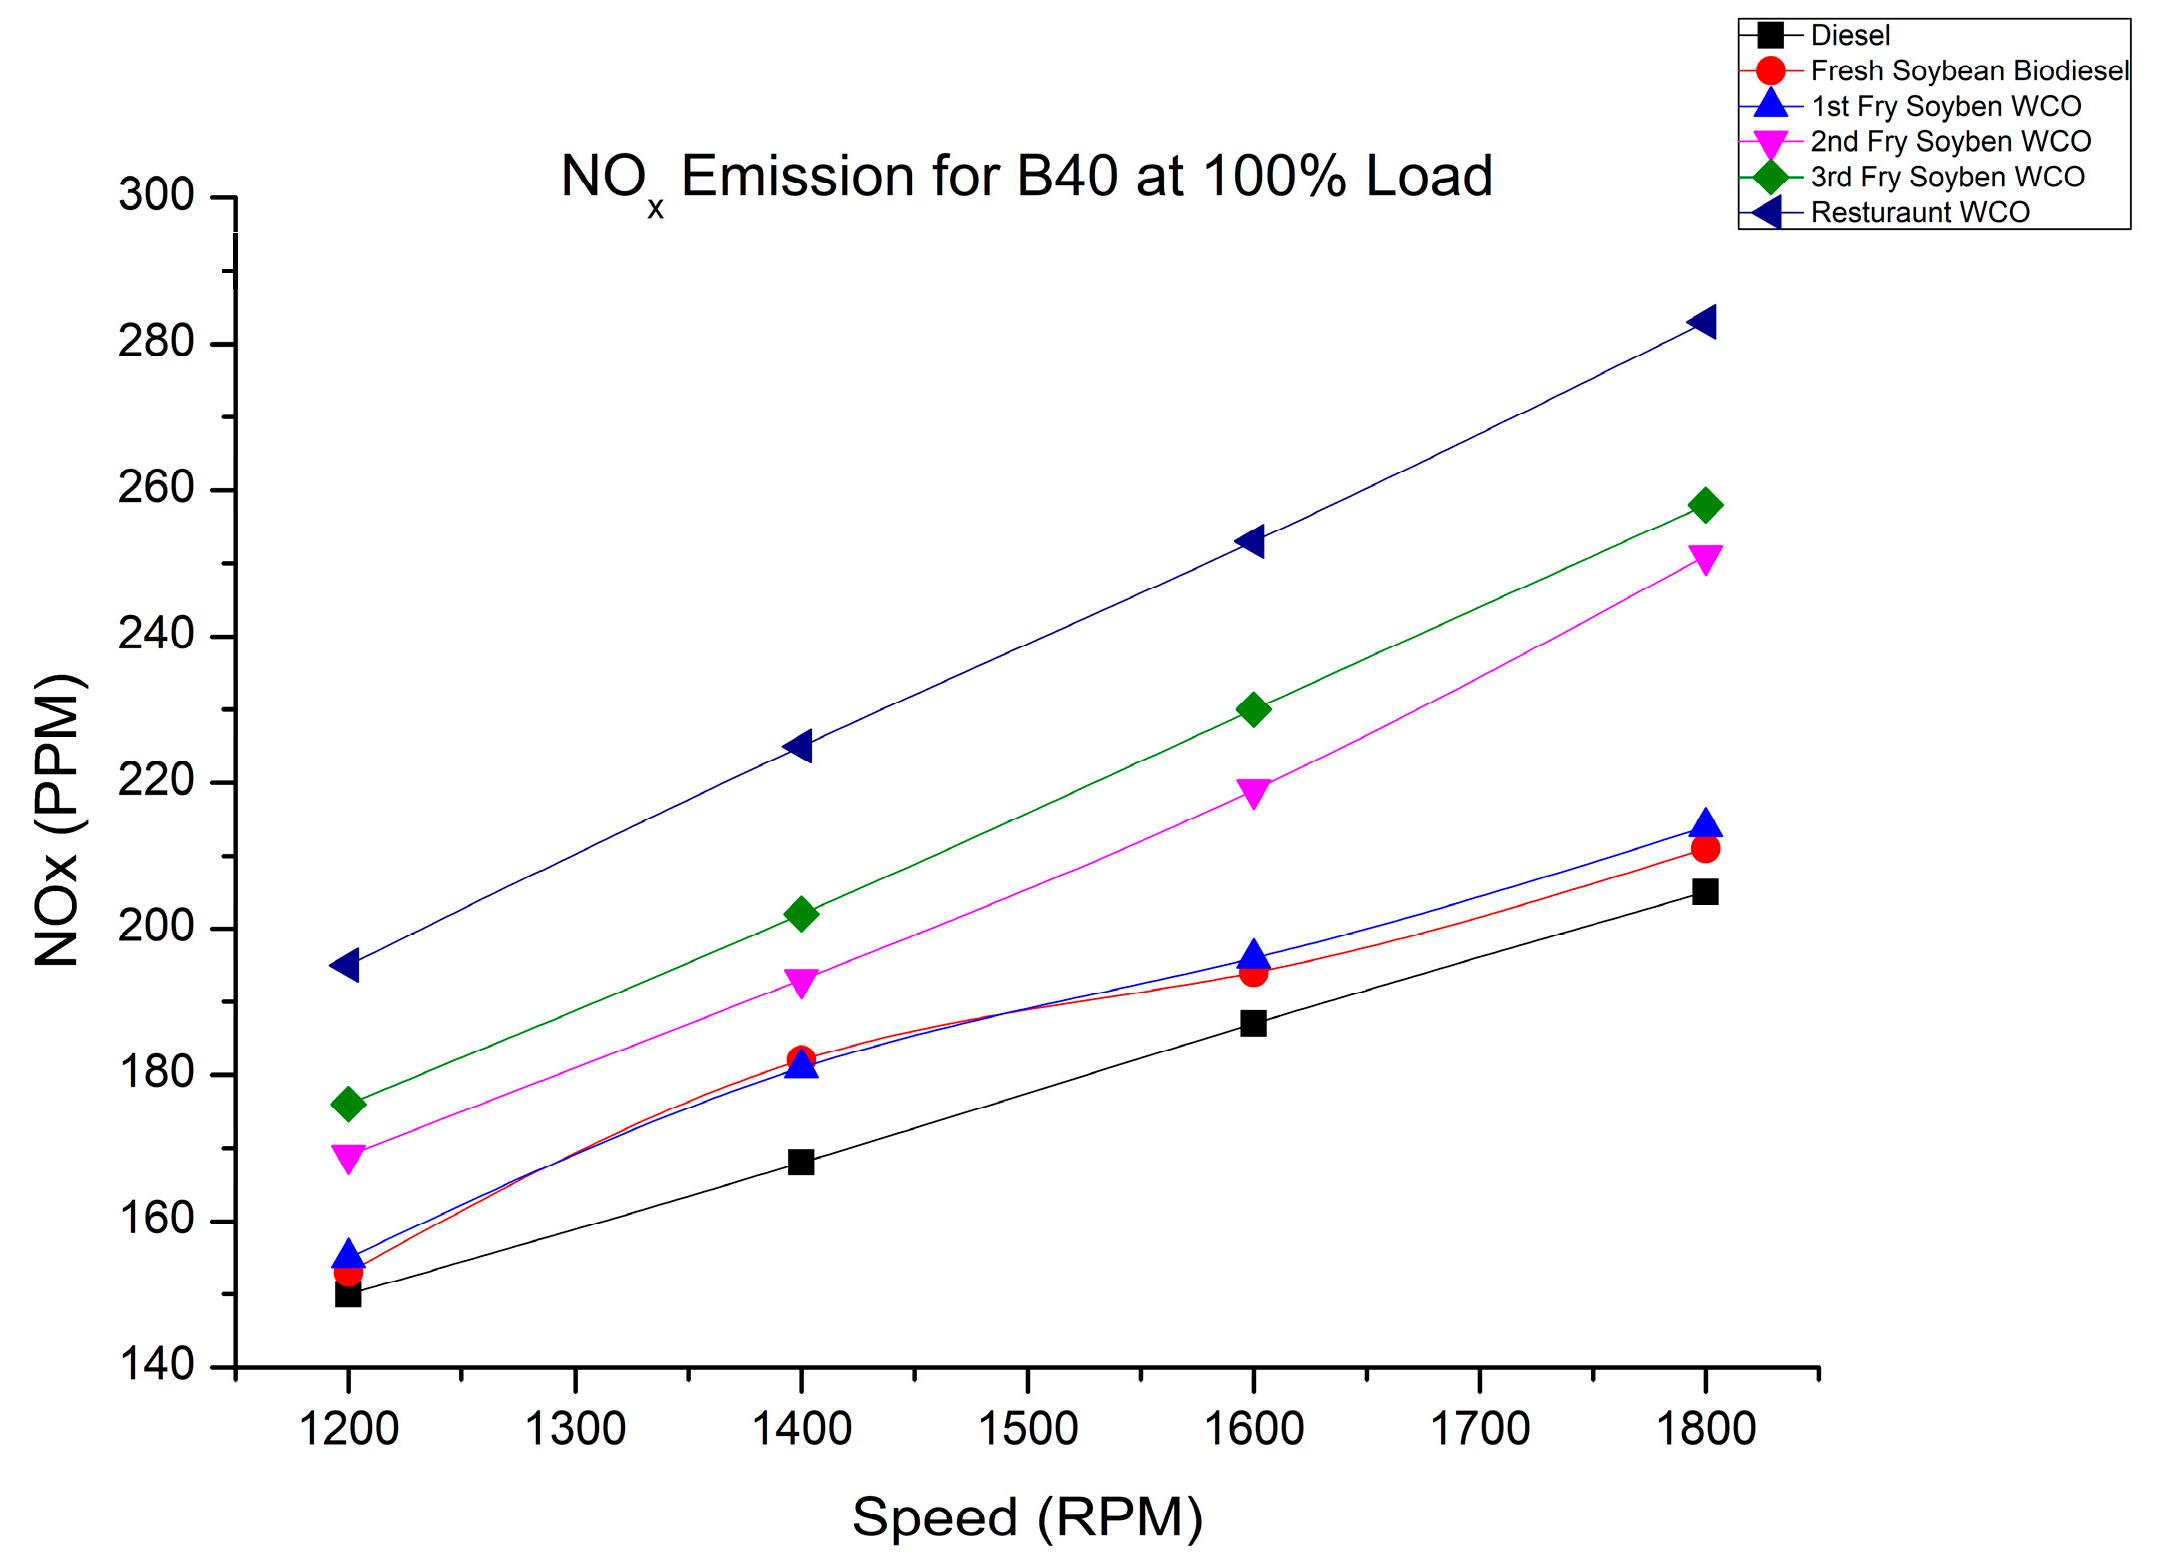
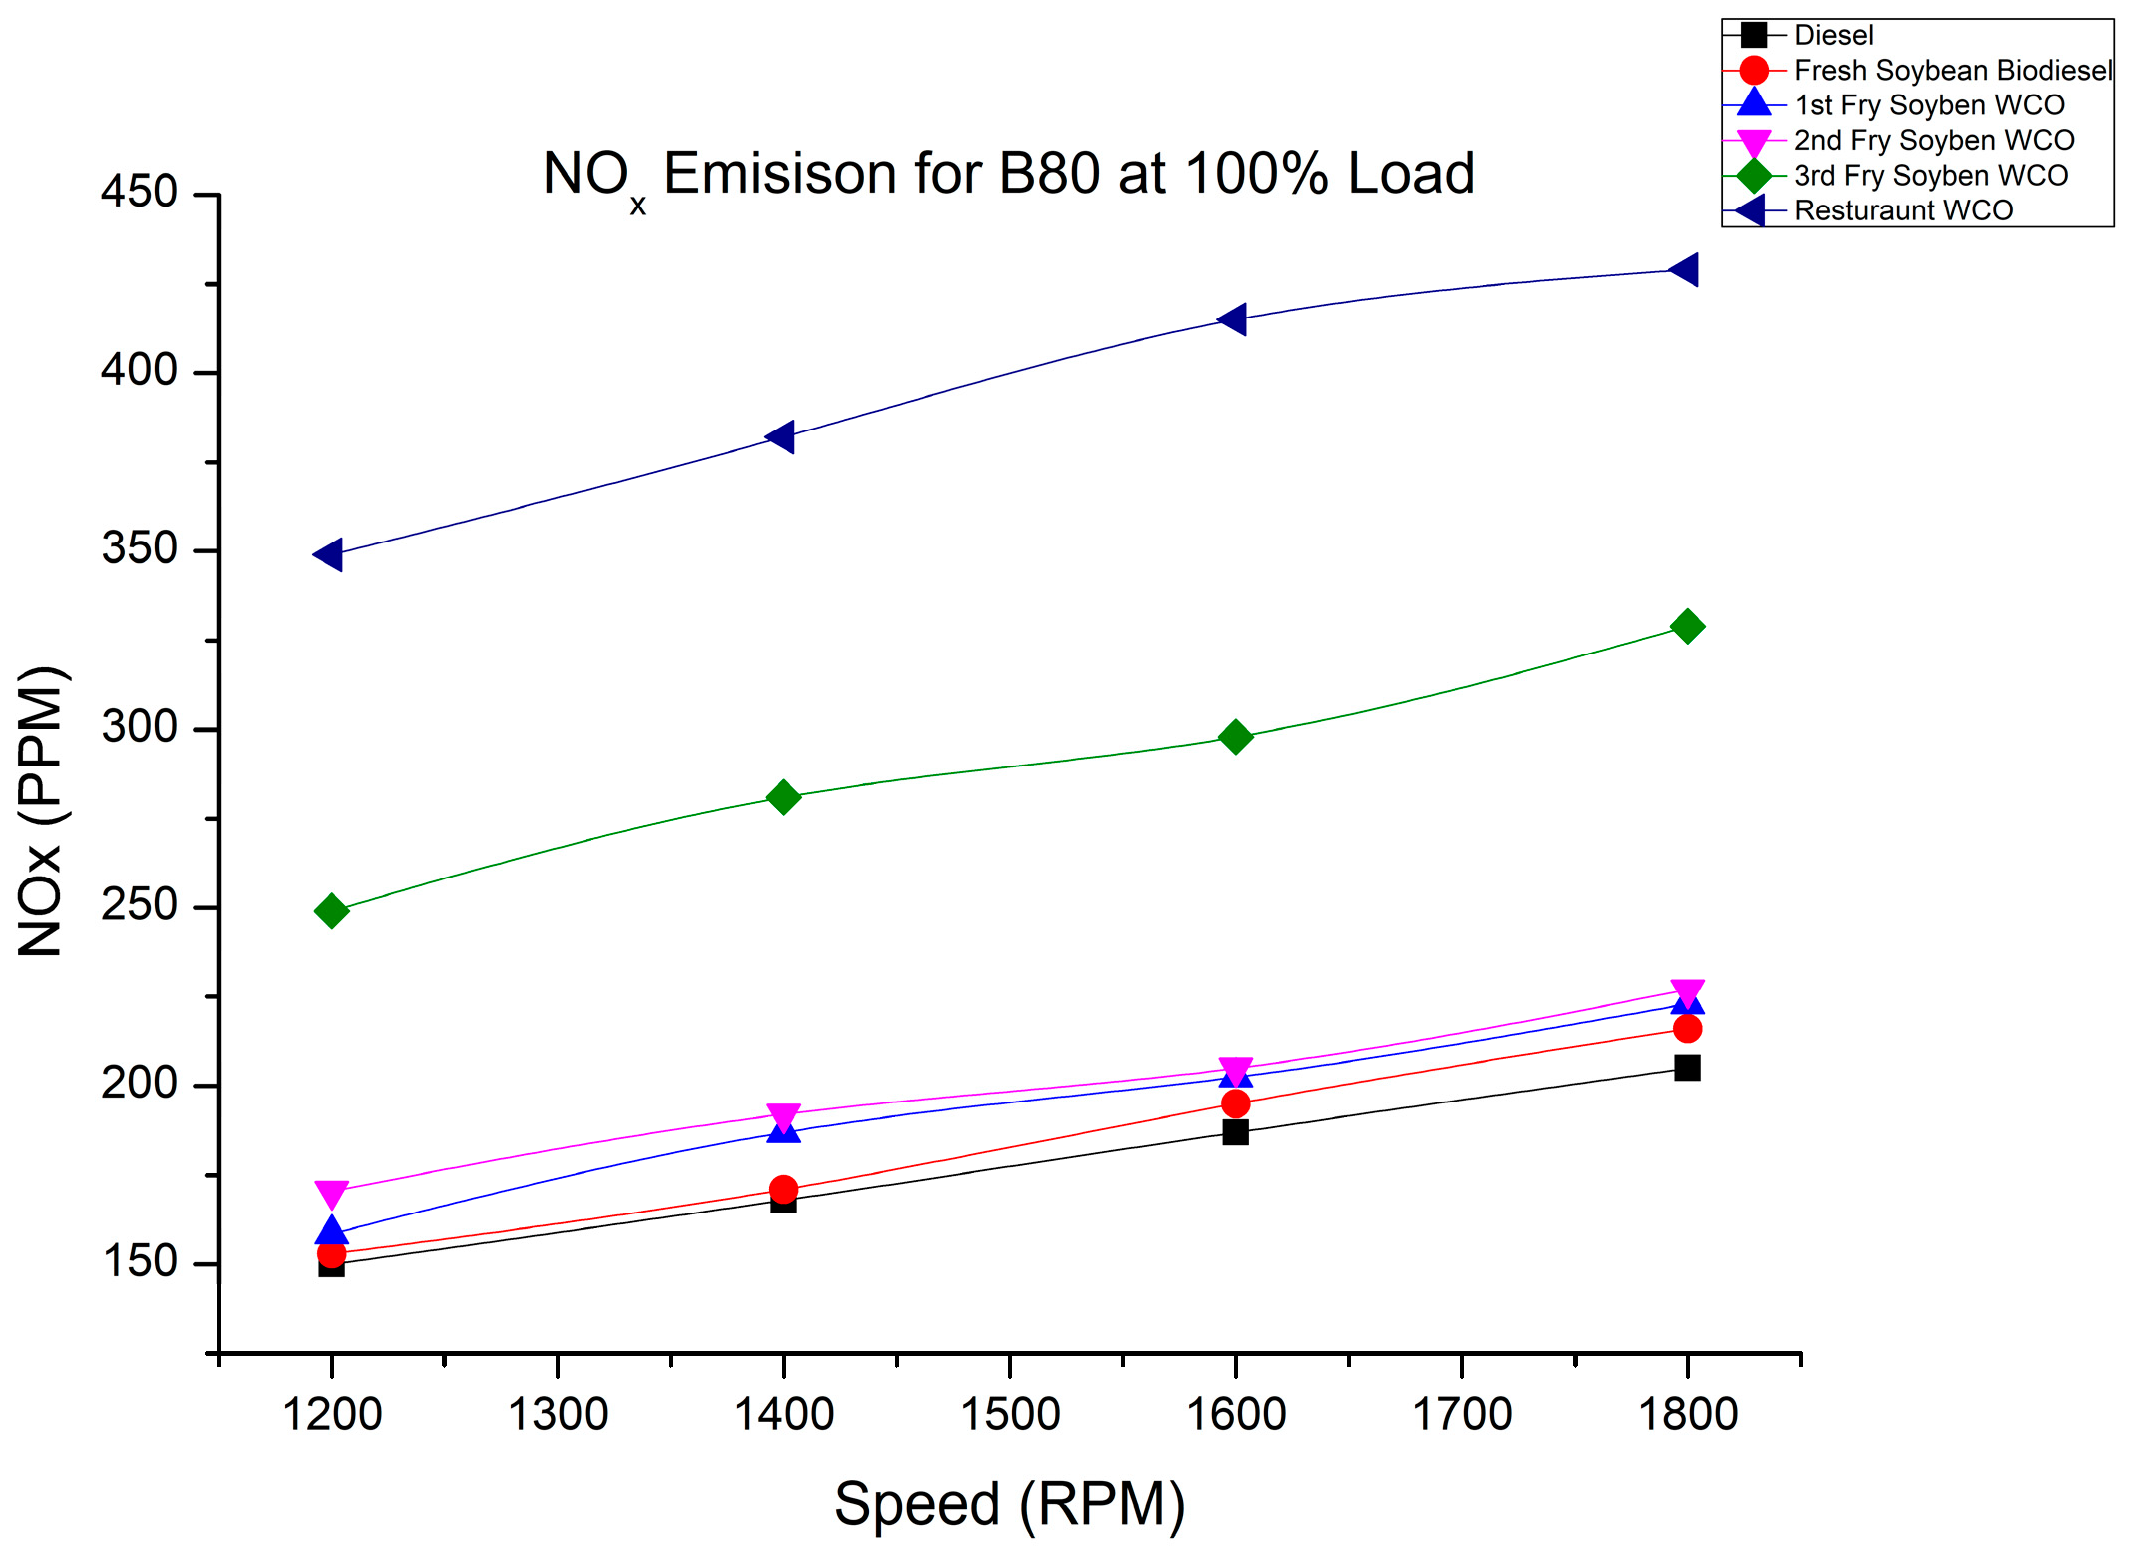
Figure 14, Figure 15, Figure 16 and Figure 17 show the variation in NOx emissions with engine speed for different biodiesel blends under the 50% and 100% load conditions. As shown in Figure 14, for the B40 fuel blend at 1200 rpm and under 50% engine load, the NOx emissions were 205 ppm, 227 ppm, 231 ppm, 249.5 ppm, and 283 ppm for SOB, 1FWCOB, 2FWCOB, 3FWCOB, and RFWCOB, respectively. As shown in Figure 16, for the B80 fuel blends at 1200 rpm and under 100% engine load, the NOx emissions were 153 ppm, 155 ppm, 169 ppm, 176 ppm, and 195 ppm for SOB, 1FWCOB, 2FWCOB, 3FWCOB, and RFWCOB, respectively. As shown in Figure 17, for the B80 fuel blends at 1800 rpm and 100% engine load, the NOx emissions were 261 ppm, 223 ppm, 227 ppm, 329 ppm, and 429 ppm for SOB, 1FWCOB, 2FWCOB, 3FWCOB, and RFWCOB, respectively.
As biodiesel fuel burns at a higher temperature than diesel, biodiesel blends have increased NOx emissions. The greater temperature of burning causes oxygen and nitrogen to interact with one another quickly. SOB and 1FWCOB showed reduced NOx emissions compared with RFWCOB, which had higher NOx emissions under the same speed and load conditions. Because biodiesel fuel has a high density, the shorter ignition delay was the reason for the higher amount of fuel going to the premix combustion, resulting in a higher temperature and cylinder pressure. Consequently, more fuel was consumed for the same injection, and higher NOx emissions were produced. This is because there was more oxygen in the combustion chamber [34,42]. The bulk modulus rose with increasing biodiesel density, resulting in advanced injection, which was another factor that contributed to the greater NOx emissions trend with higher density (degree of unsaturation) [45,46].

4.5. Variation in CO Emissions

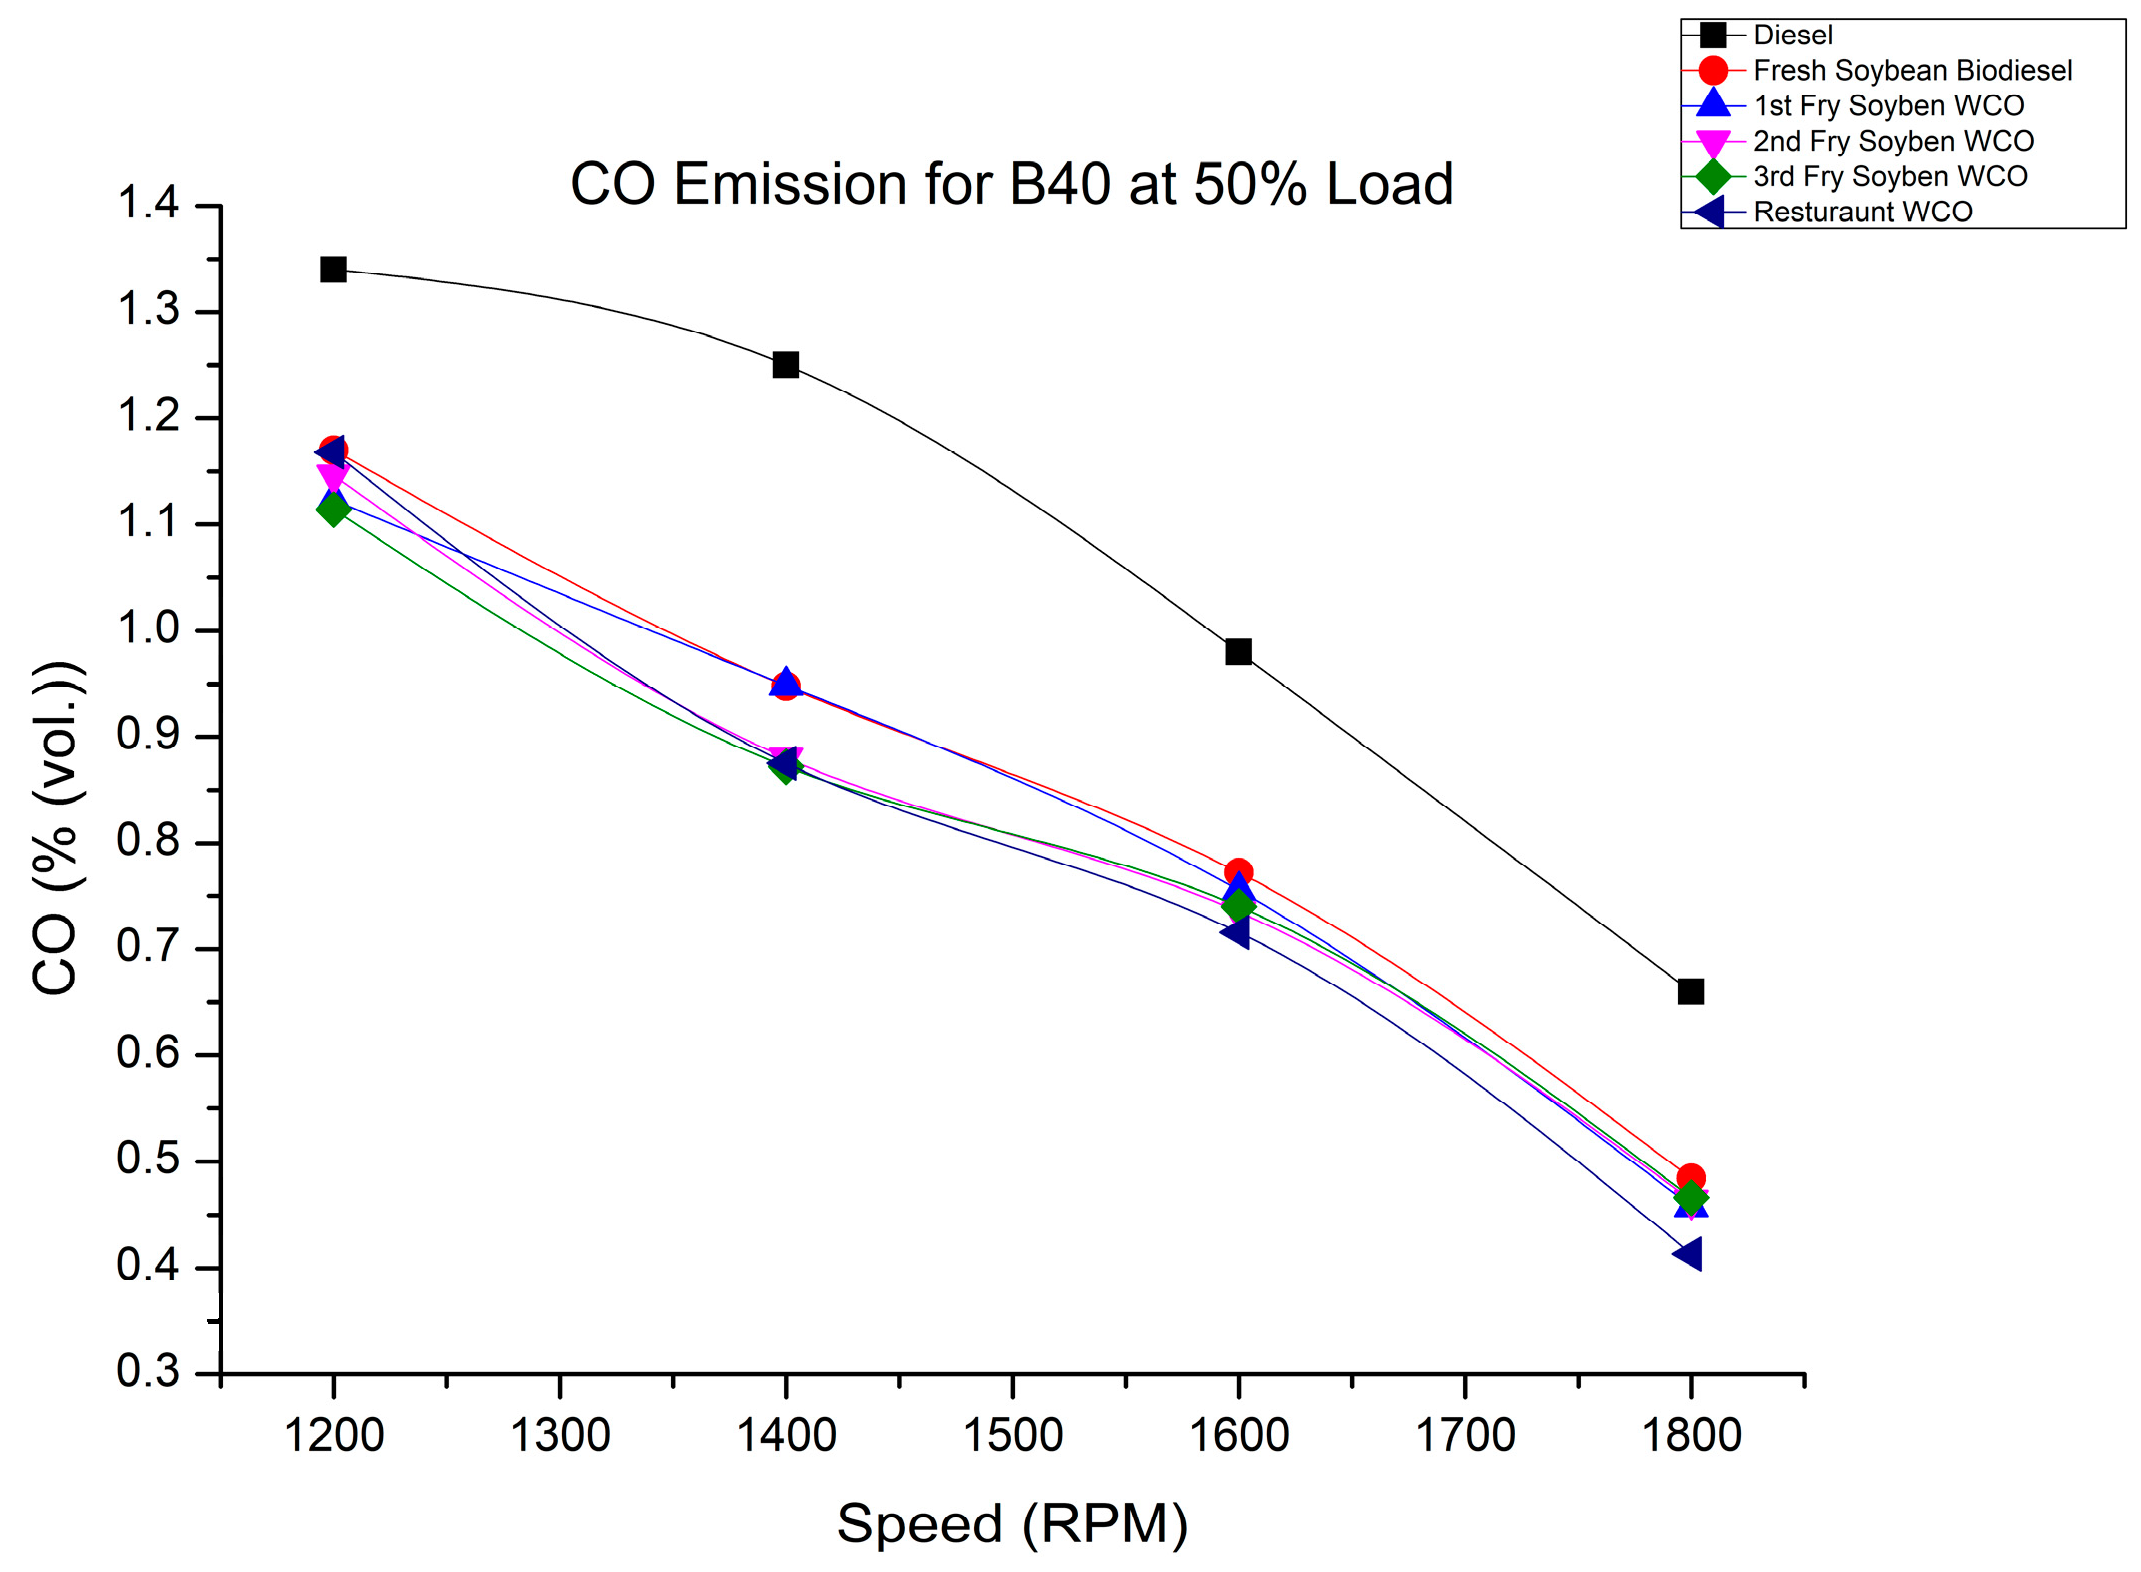
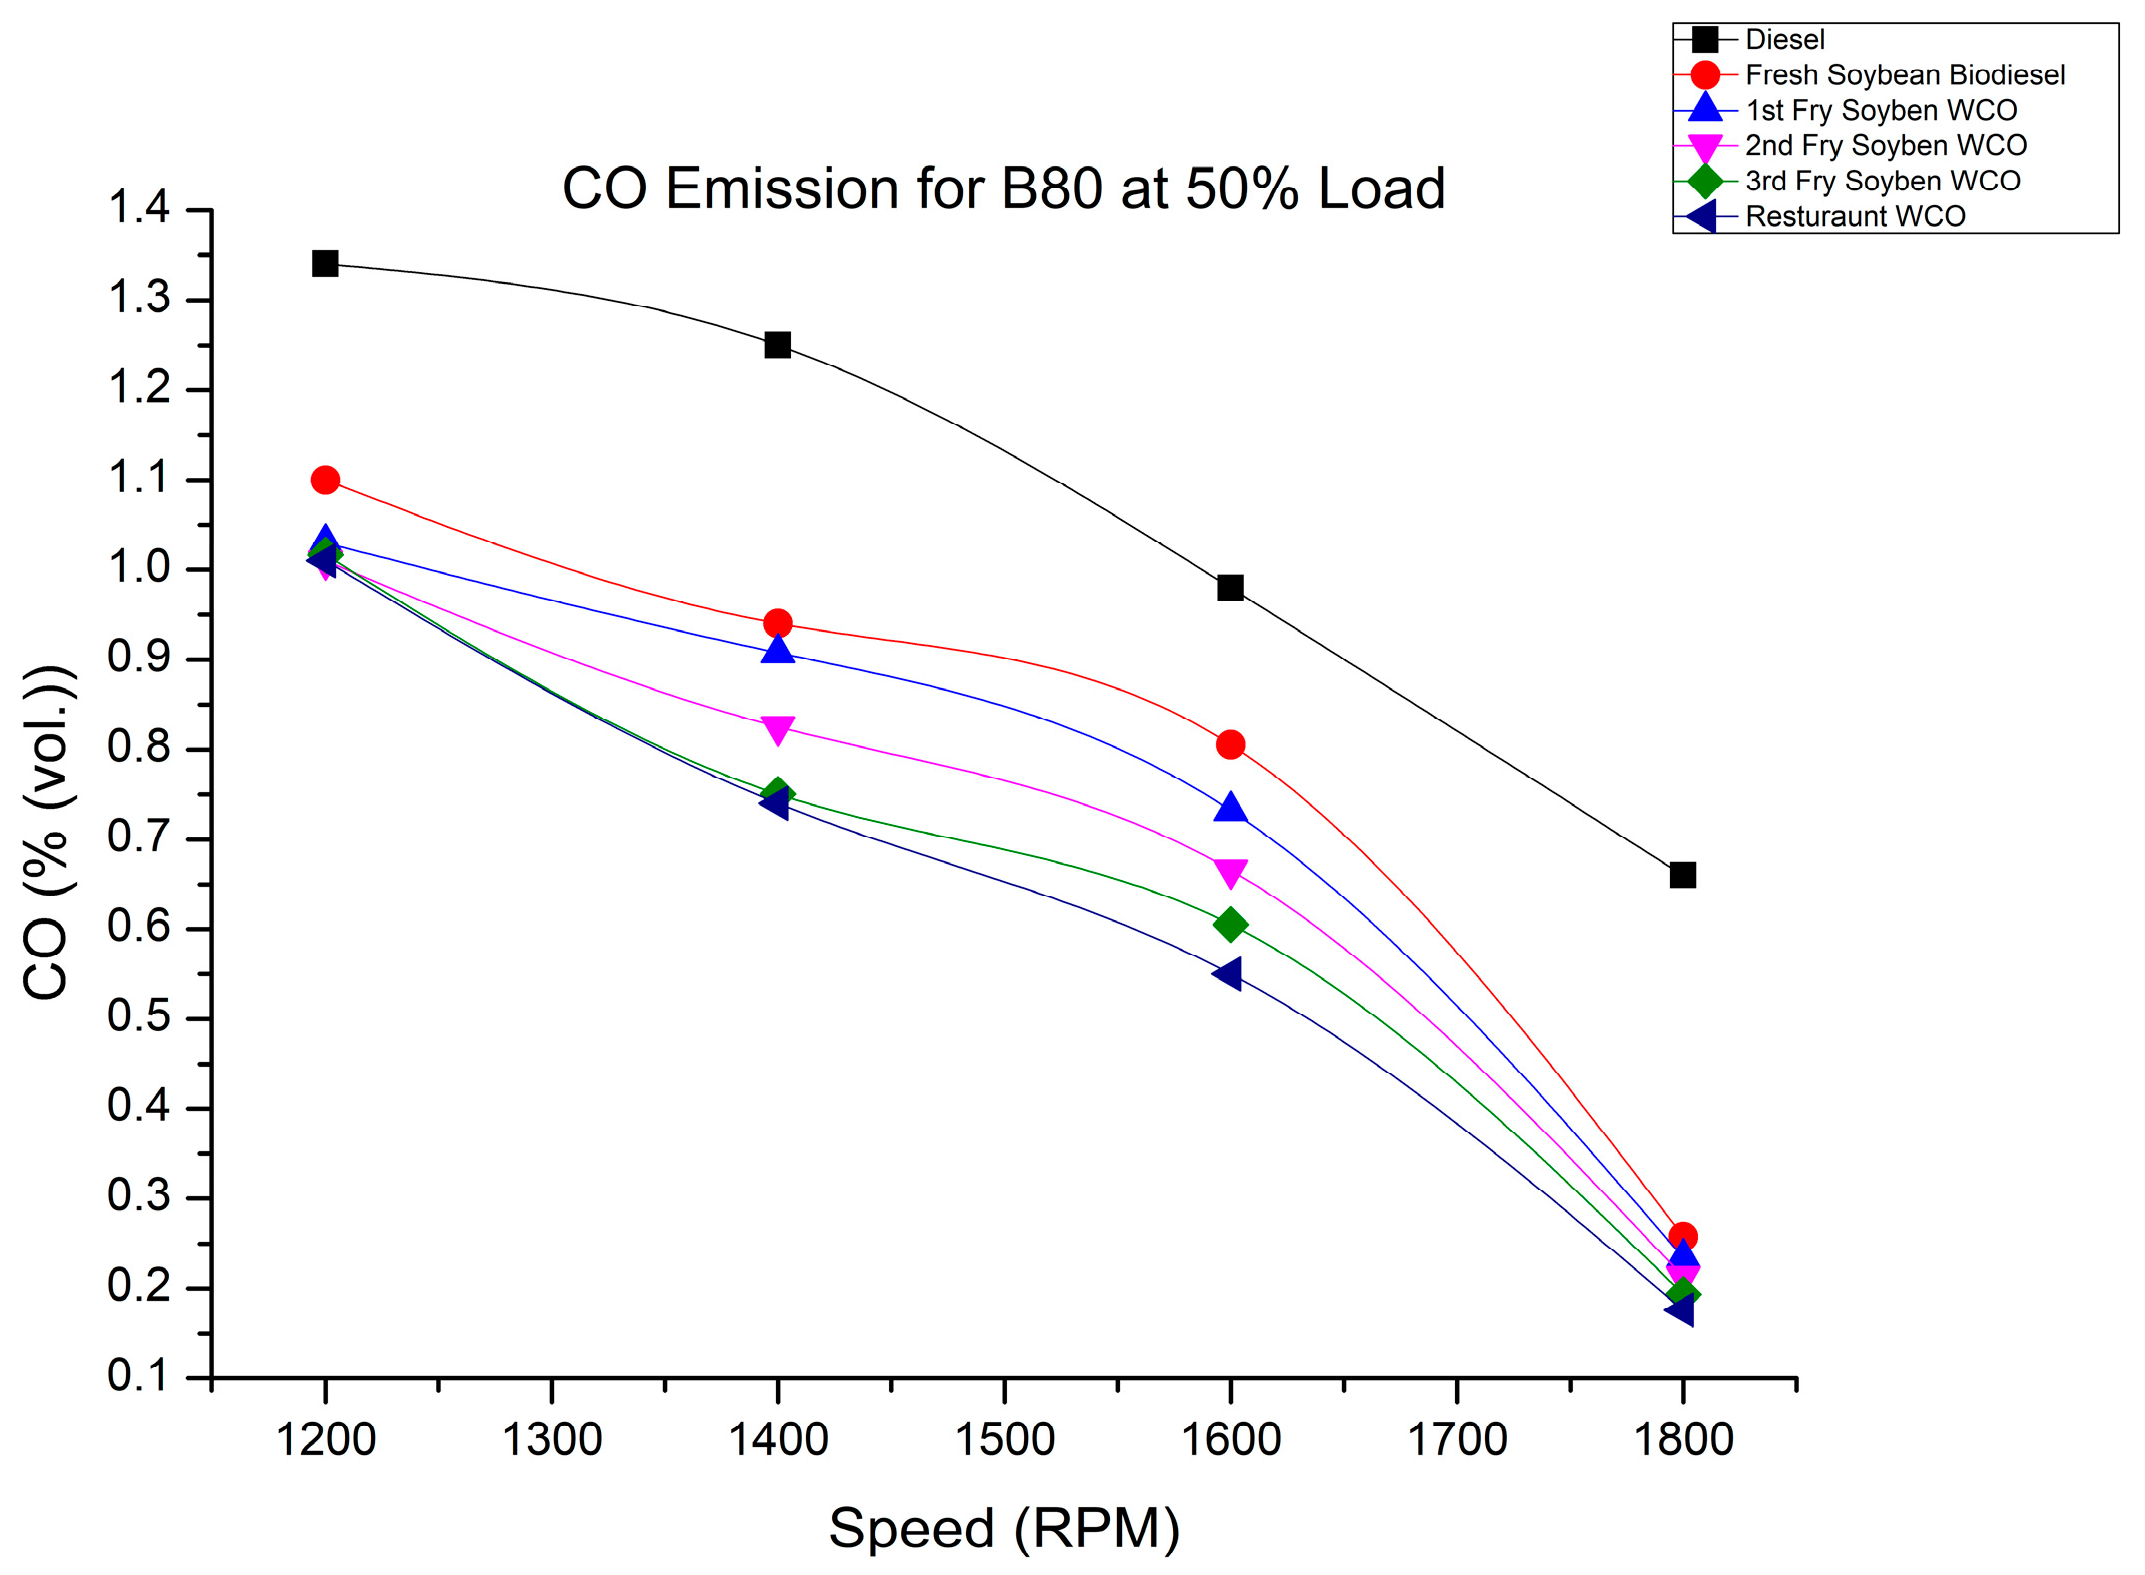
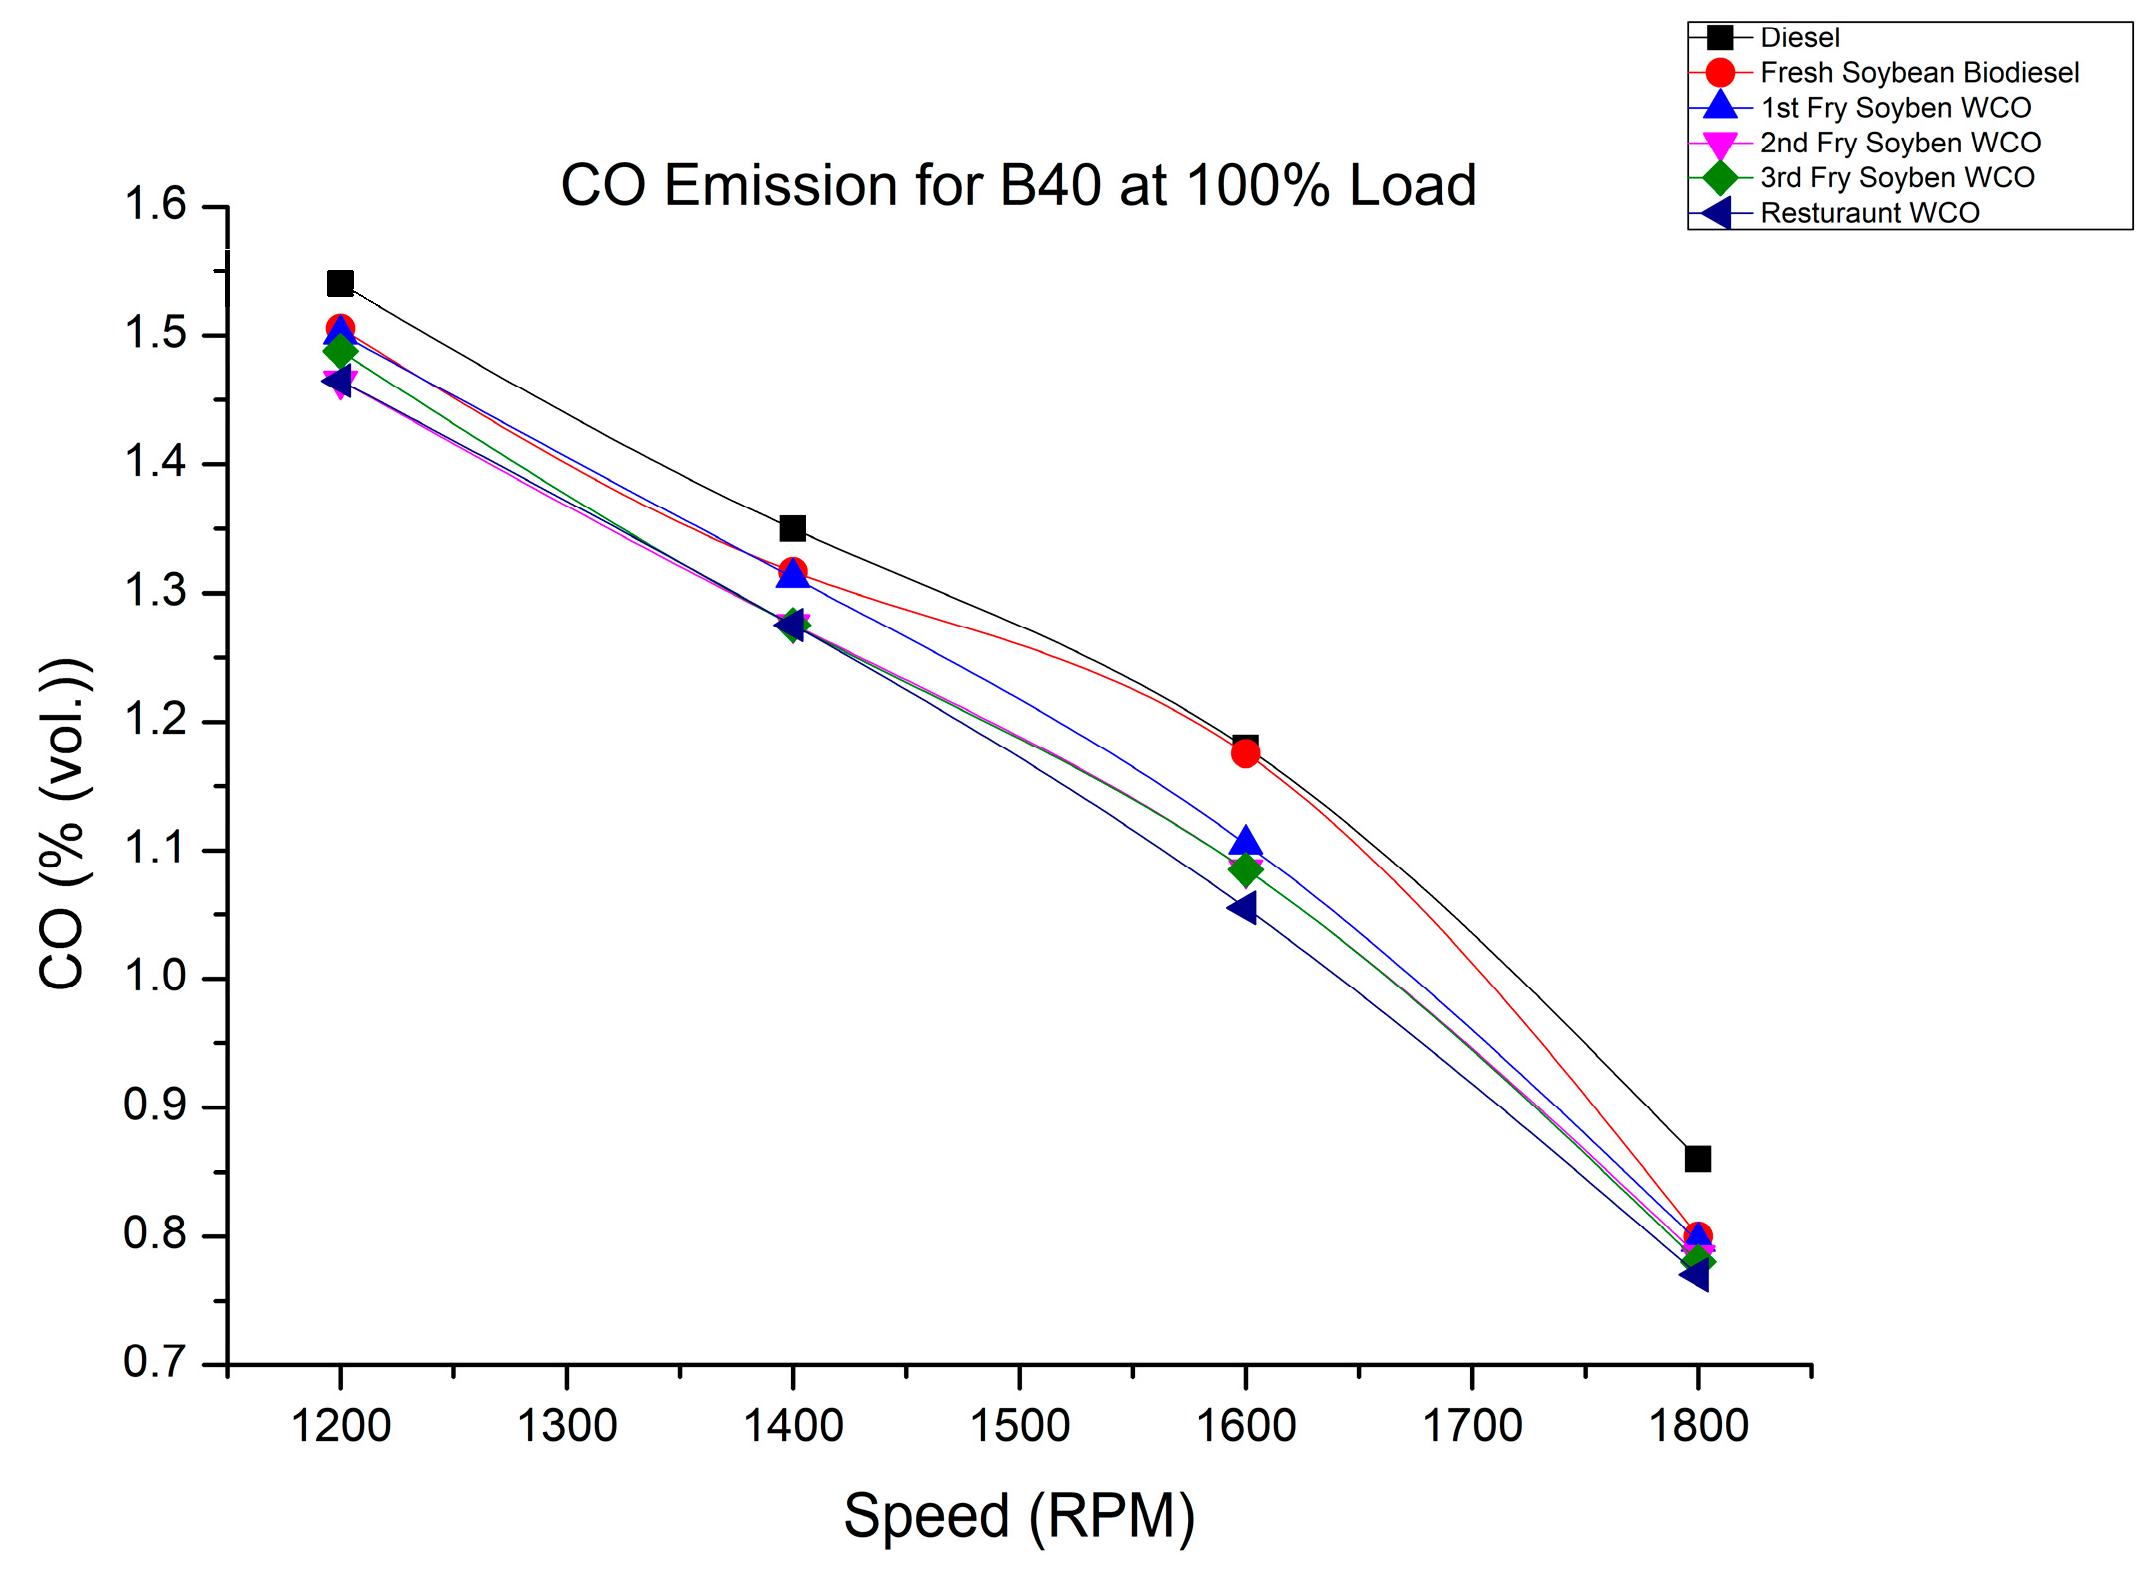
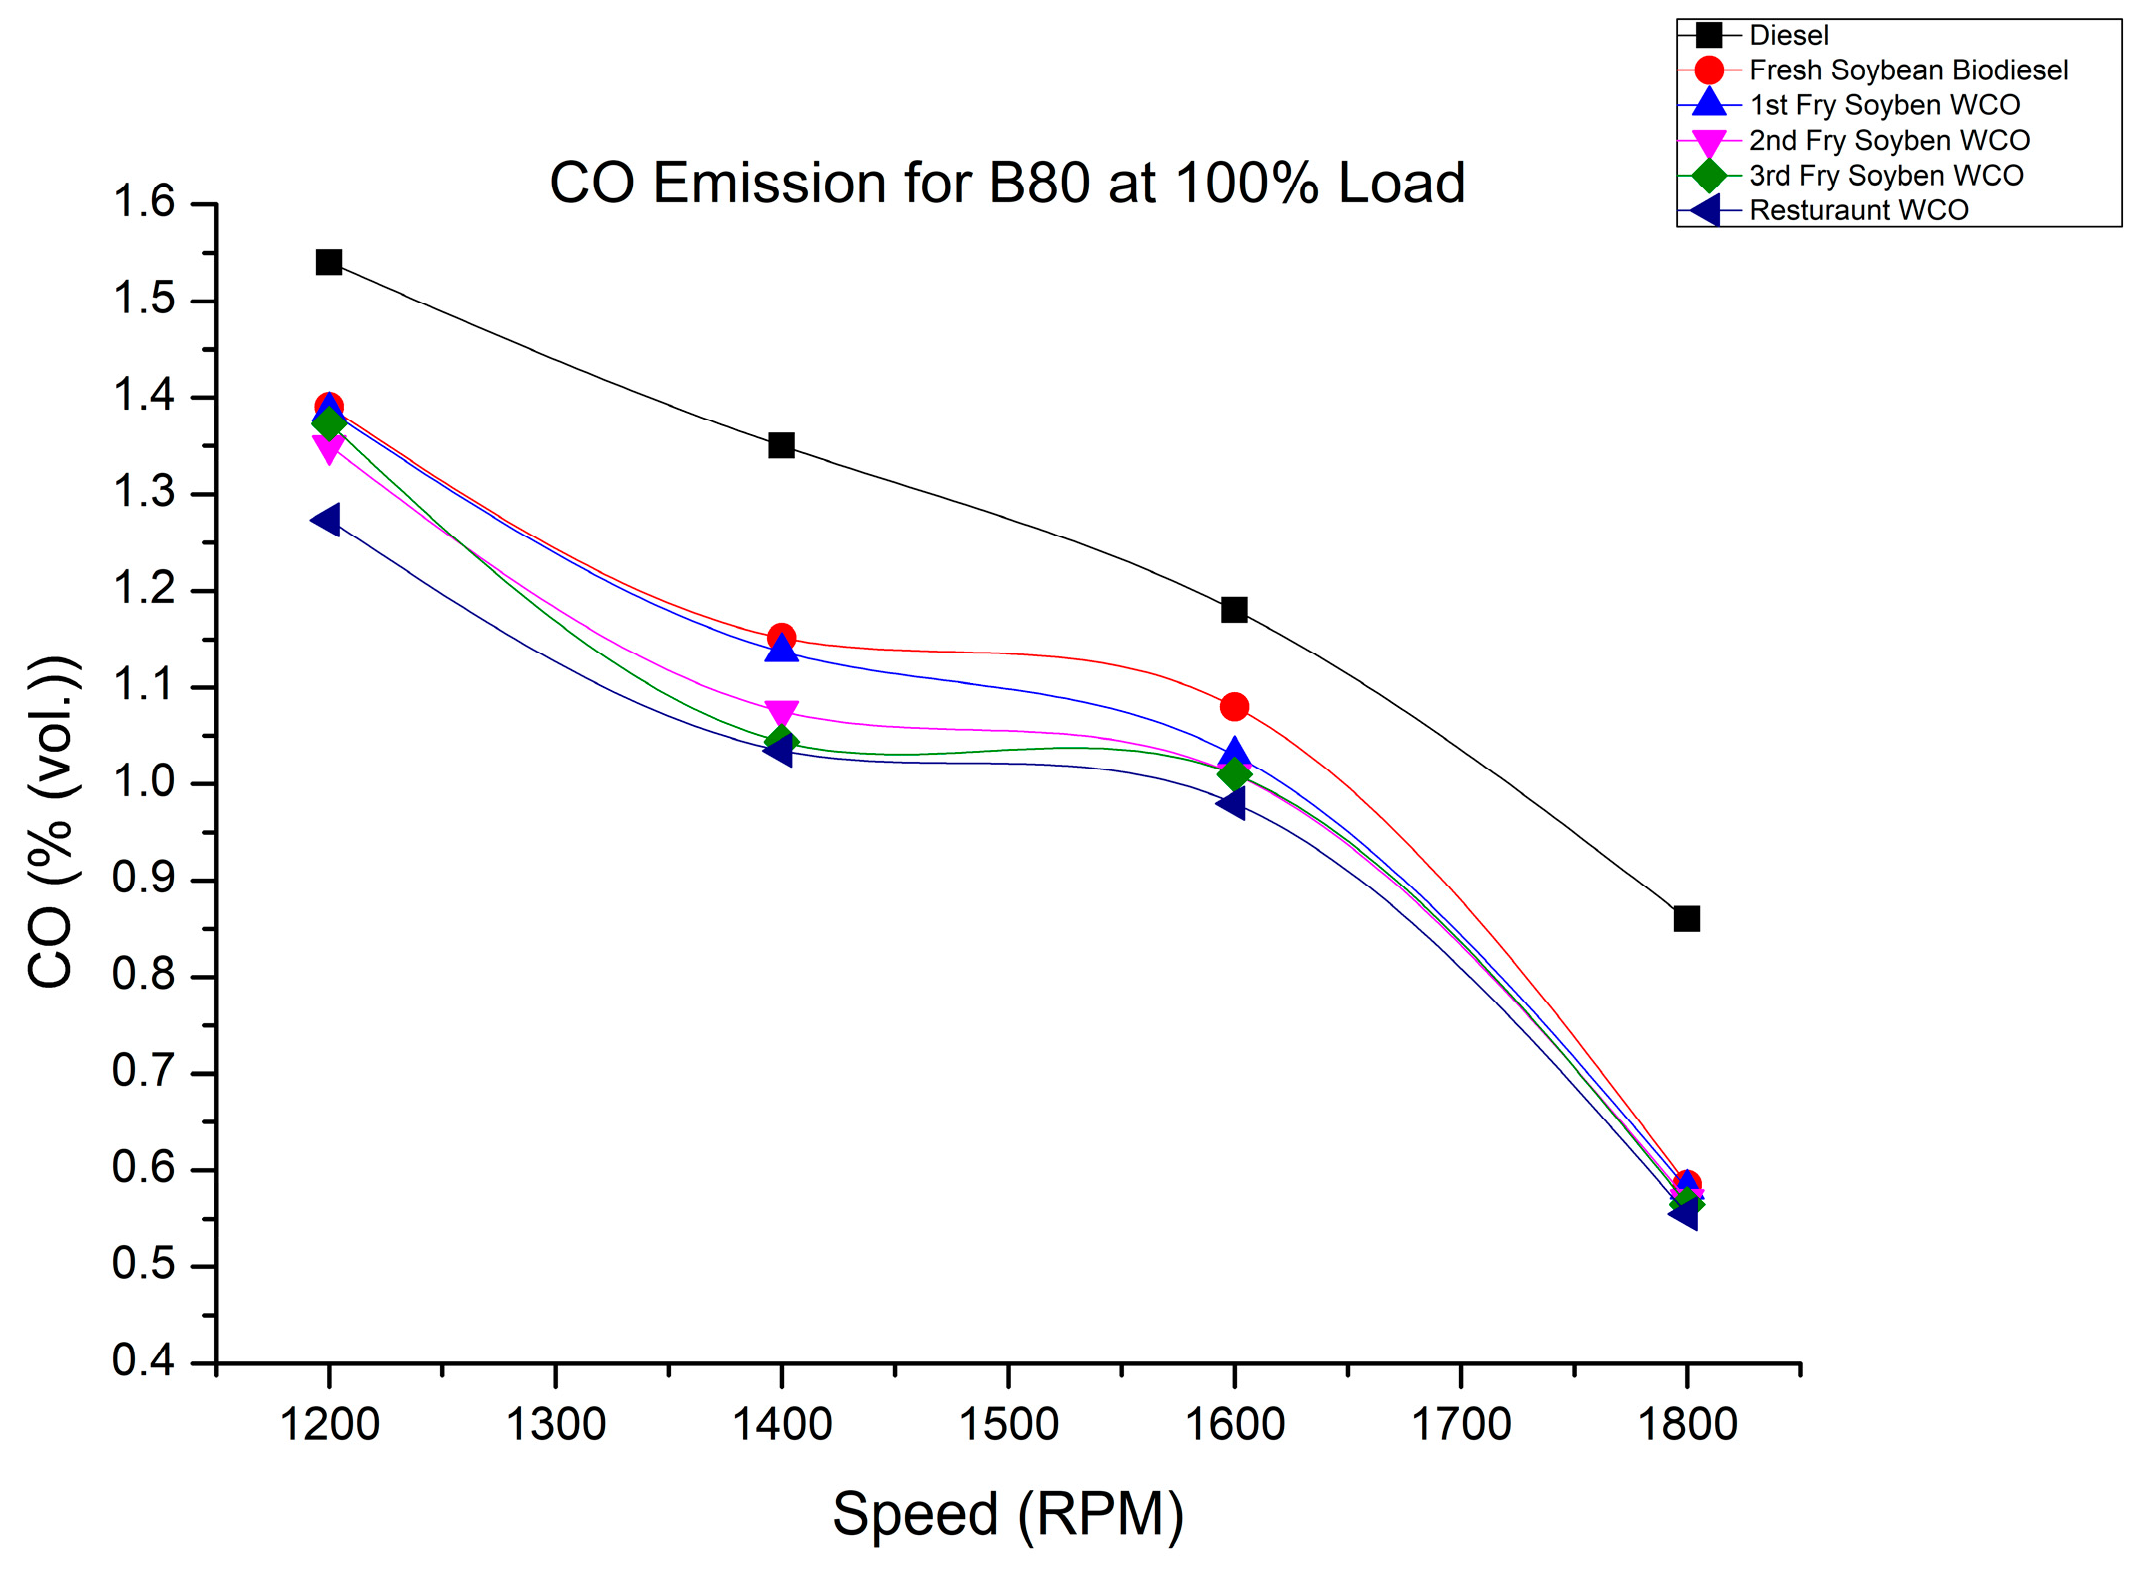
Carbon monoxide emissions are the result of the incomplete combustion of hydrocarbon available in the fuel. Figure 18 shows that the CO emission for the B40 biofuel blends at 50% load were 1.34%, 1.16%, 1.12%, 1.14%, 1.11%, and 1.16% for SOB, 1FWCOB, 2FWCOB, 3FWCOB, and RFWCOB, respectively, at 1200 rpm. Figure 19 shows that the CO emissions for B80 biofuel blends at 50% load were 1.34%, 1.1%, 1.02%, 1.01%, 1.01%, and 1.01% for SOB, 1FWCOB, 2FWCOB, 3FWCOB, and RFWCOB, respectively, for 1200 rpm. Figure 20 and Figure 21 show the CO emissions for the B40 and B80 biofuel blends at 100% load. Figure 21 shows the same trend of decreasing CO with increasing engine speed. All biodiesel fuels had lower CO emissions compared with diesel fue.
The lower CO emissions of biodiesel blends were because of the higher oxygen content of biodiesel, which, in turn, helped with the complete combustion of the fuel. As such, the CO emissions decreased when using the biodiesel blends [33,34].

4.6. Variation in HC Emissions

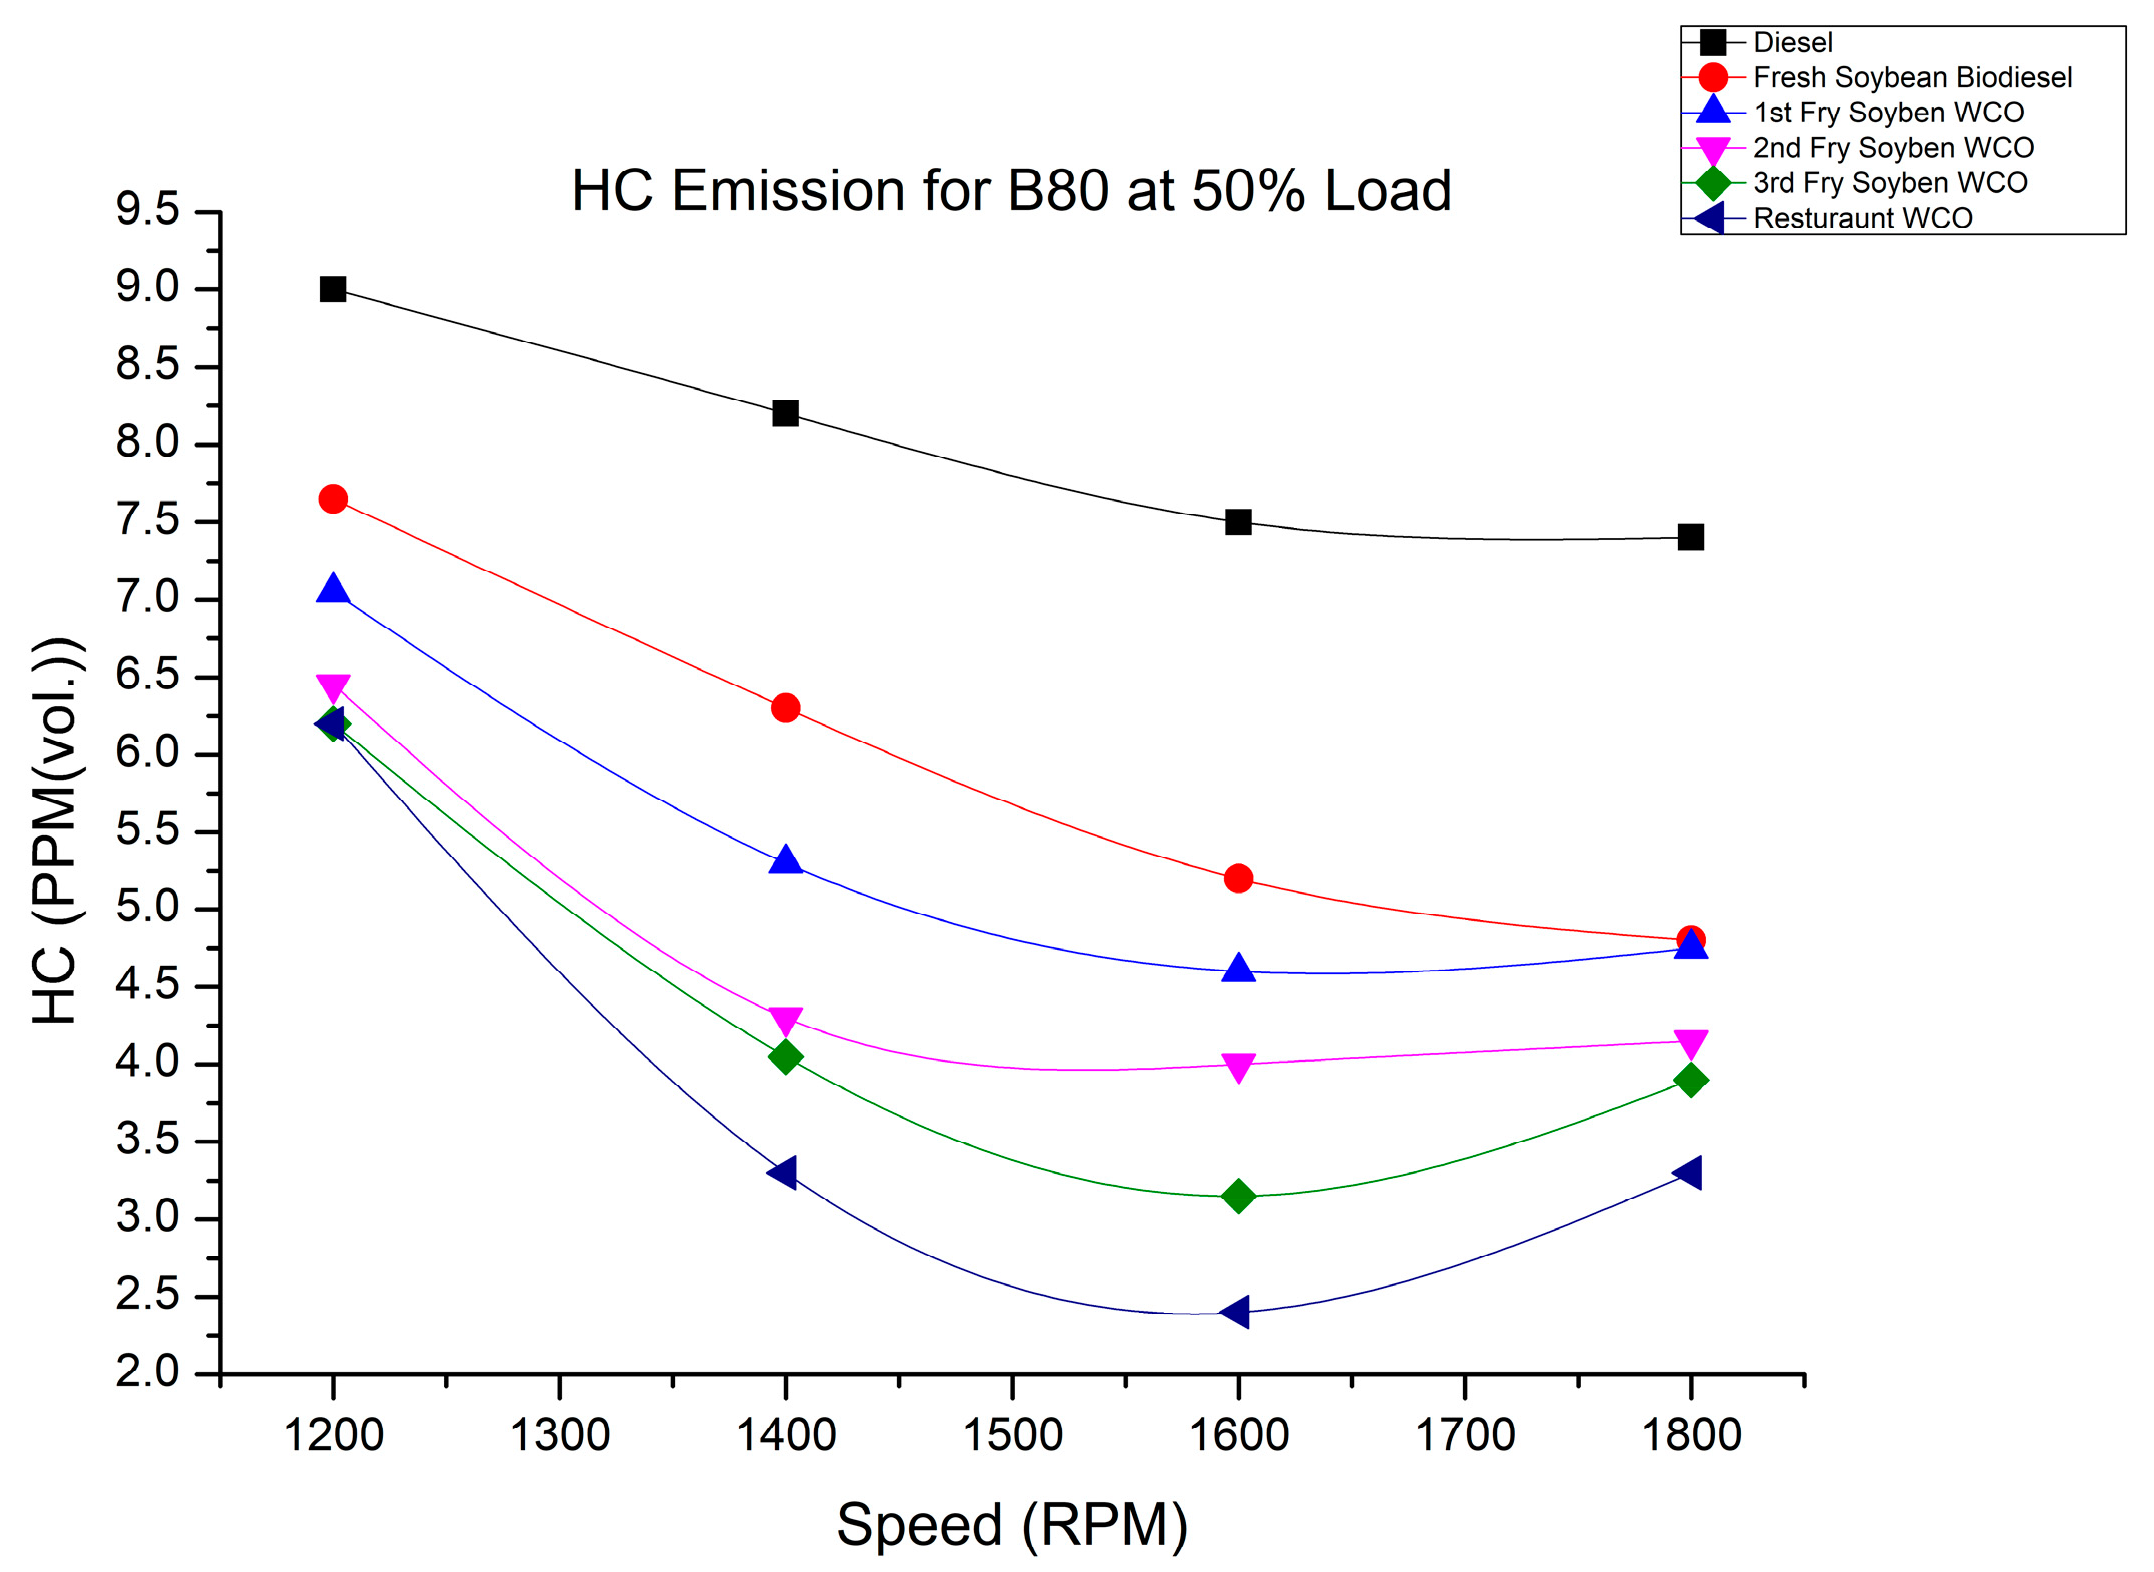
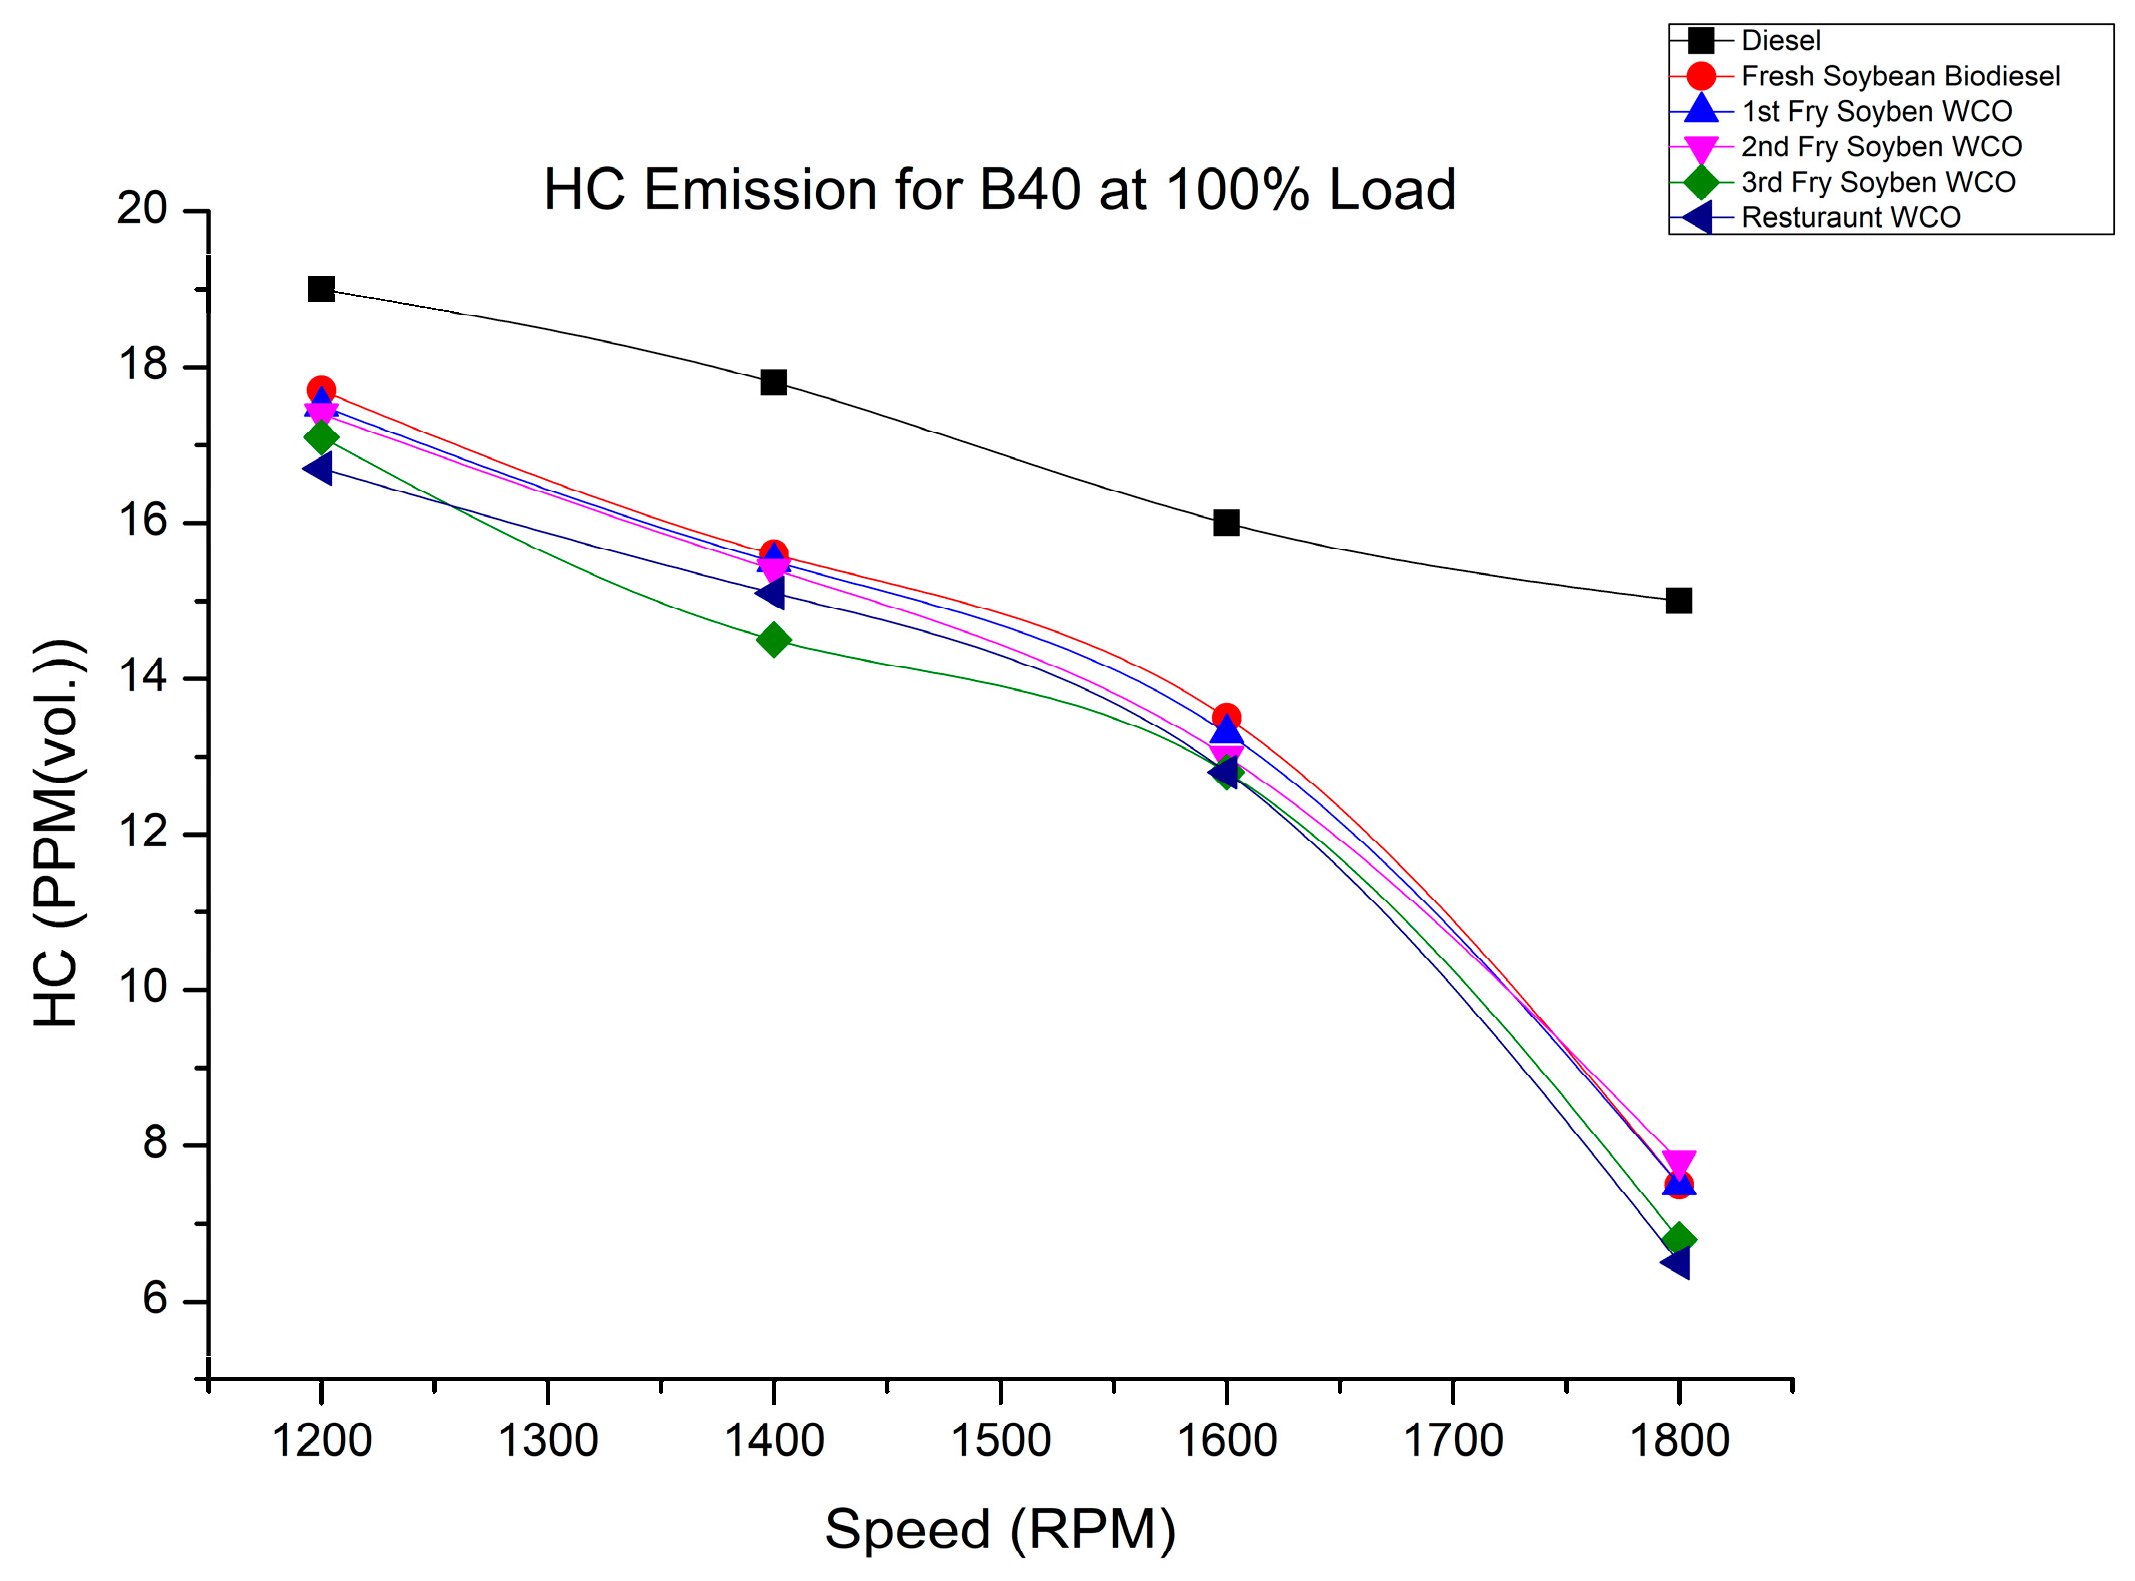
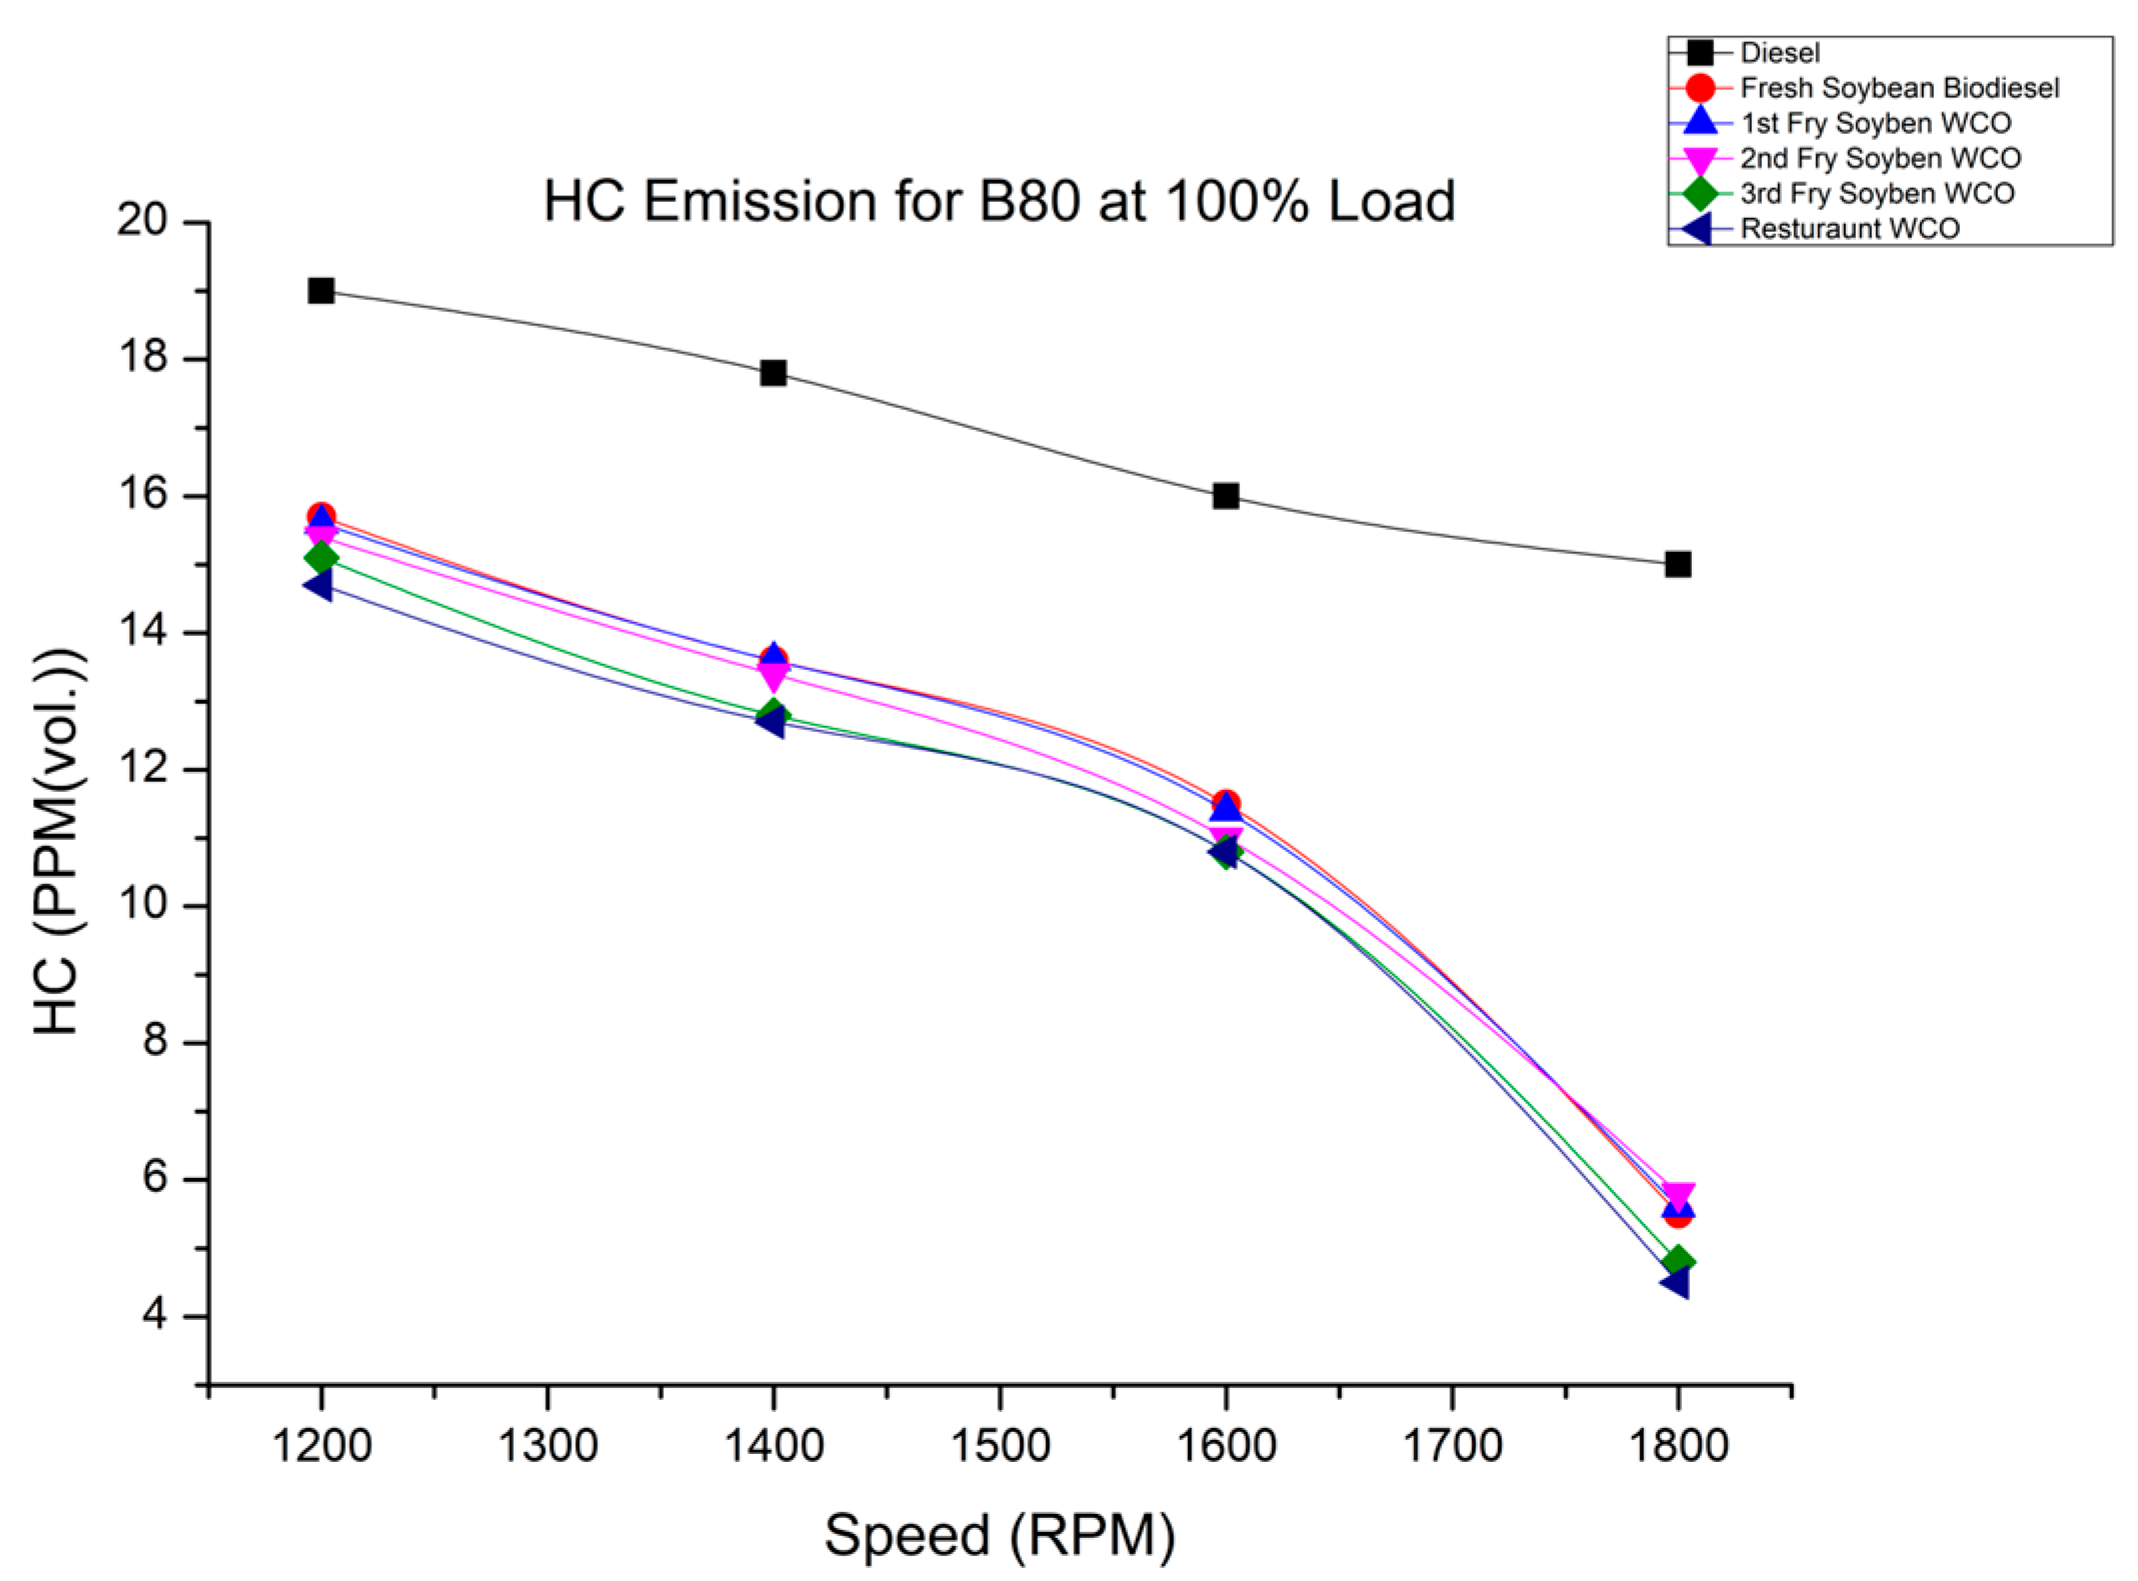
Hydrocarbon emissions are the outcome of the partial combustion of fuel inside the combustion chamber. Figure 22 shows the results for the B40 blends, where the measured values at 1200 rpm were 8.4 ppm, 8.1 ppm, 7.65 ppm, 7.7 ppm, and 7.5 ppm for SOB, 1FWCOB, 2FWCOB, 3FWCOB, and RFWCOB, respectively, at 50% load. Figure 23 shows the results for the B80 blends, where the measured values at 1200 rpm were 7.65 ppm, 7.05 ppm, 6.45 ppm, 6.2 ppm, and 6.2 ppm for SOB, 1FWCOB, 2FWCOB, 3FWCOB, and RFWCOB, respectively, at 50% load. Figure 24 and Figure 25 show the HC emissions for the B40 and B80 blends at 100% load; a similar trend was observed. Diesel fuel had higher HC emissions compared with the test biodiesel fuel.
The reason for higher HC emissions can be correlated with the short ignition delay due to the higher cetane number of biodiesel compared with other biodiesel fuels. The observed HC emissions had a lowering trend relative to diesel fuel, which was because of the higher oxygen content in the biodiesel fuel blends. A higher oxygen content leads to lower HC [22,33].

4.7. Variation in the Smoke Opacity with Engine Rpm

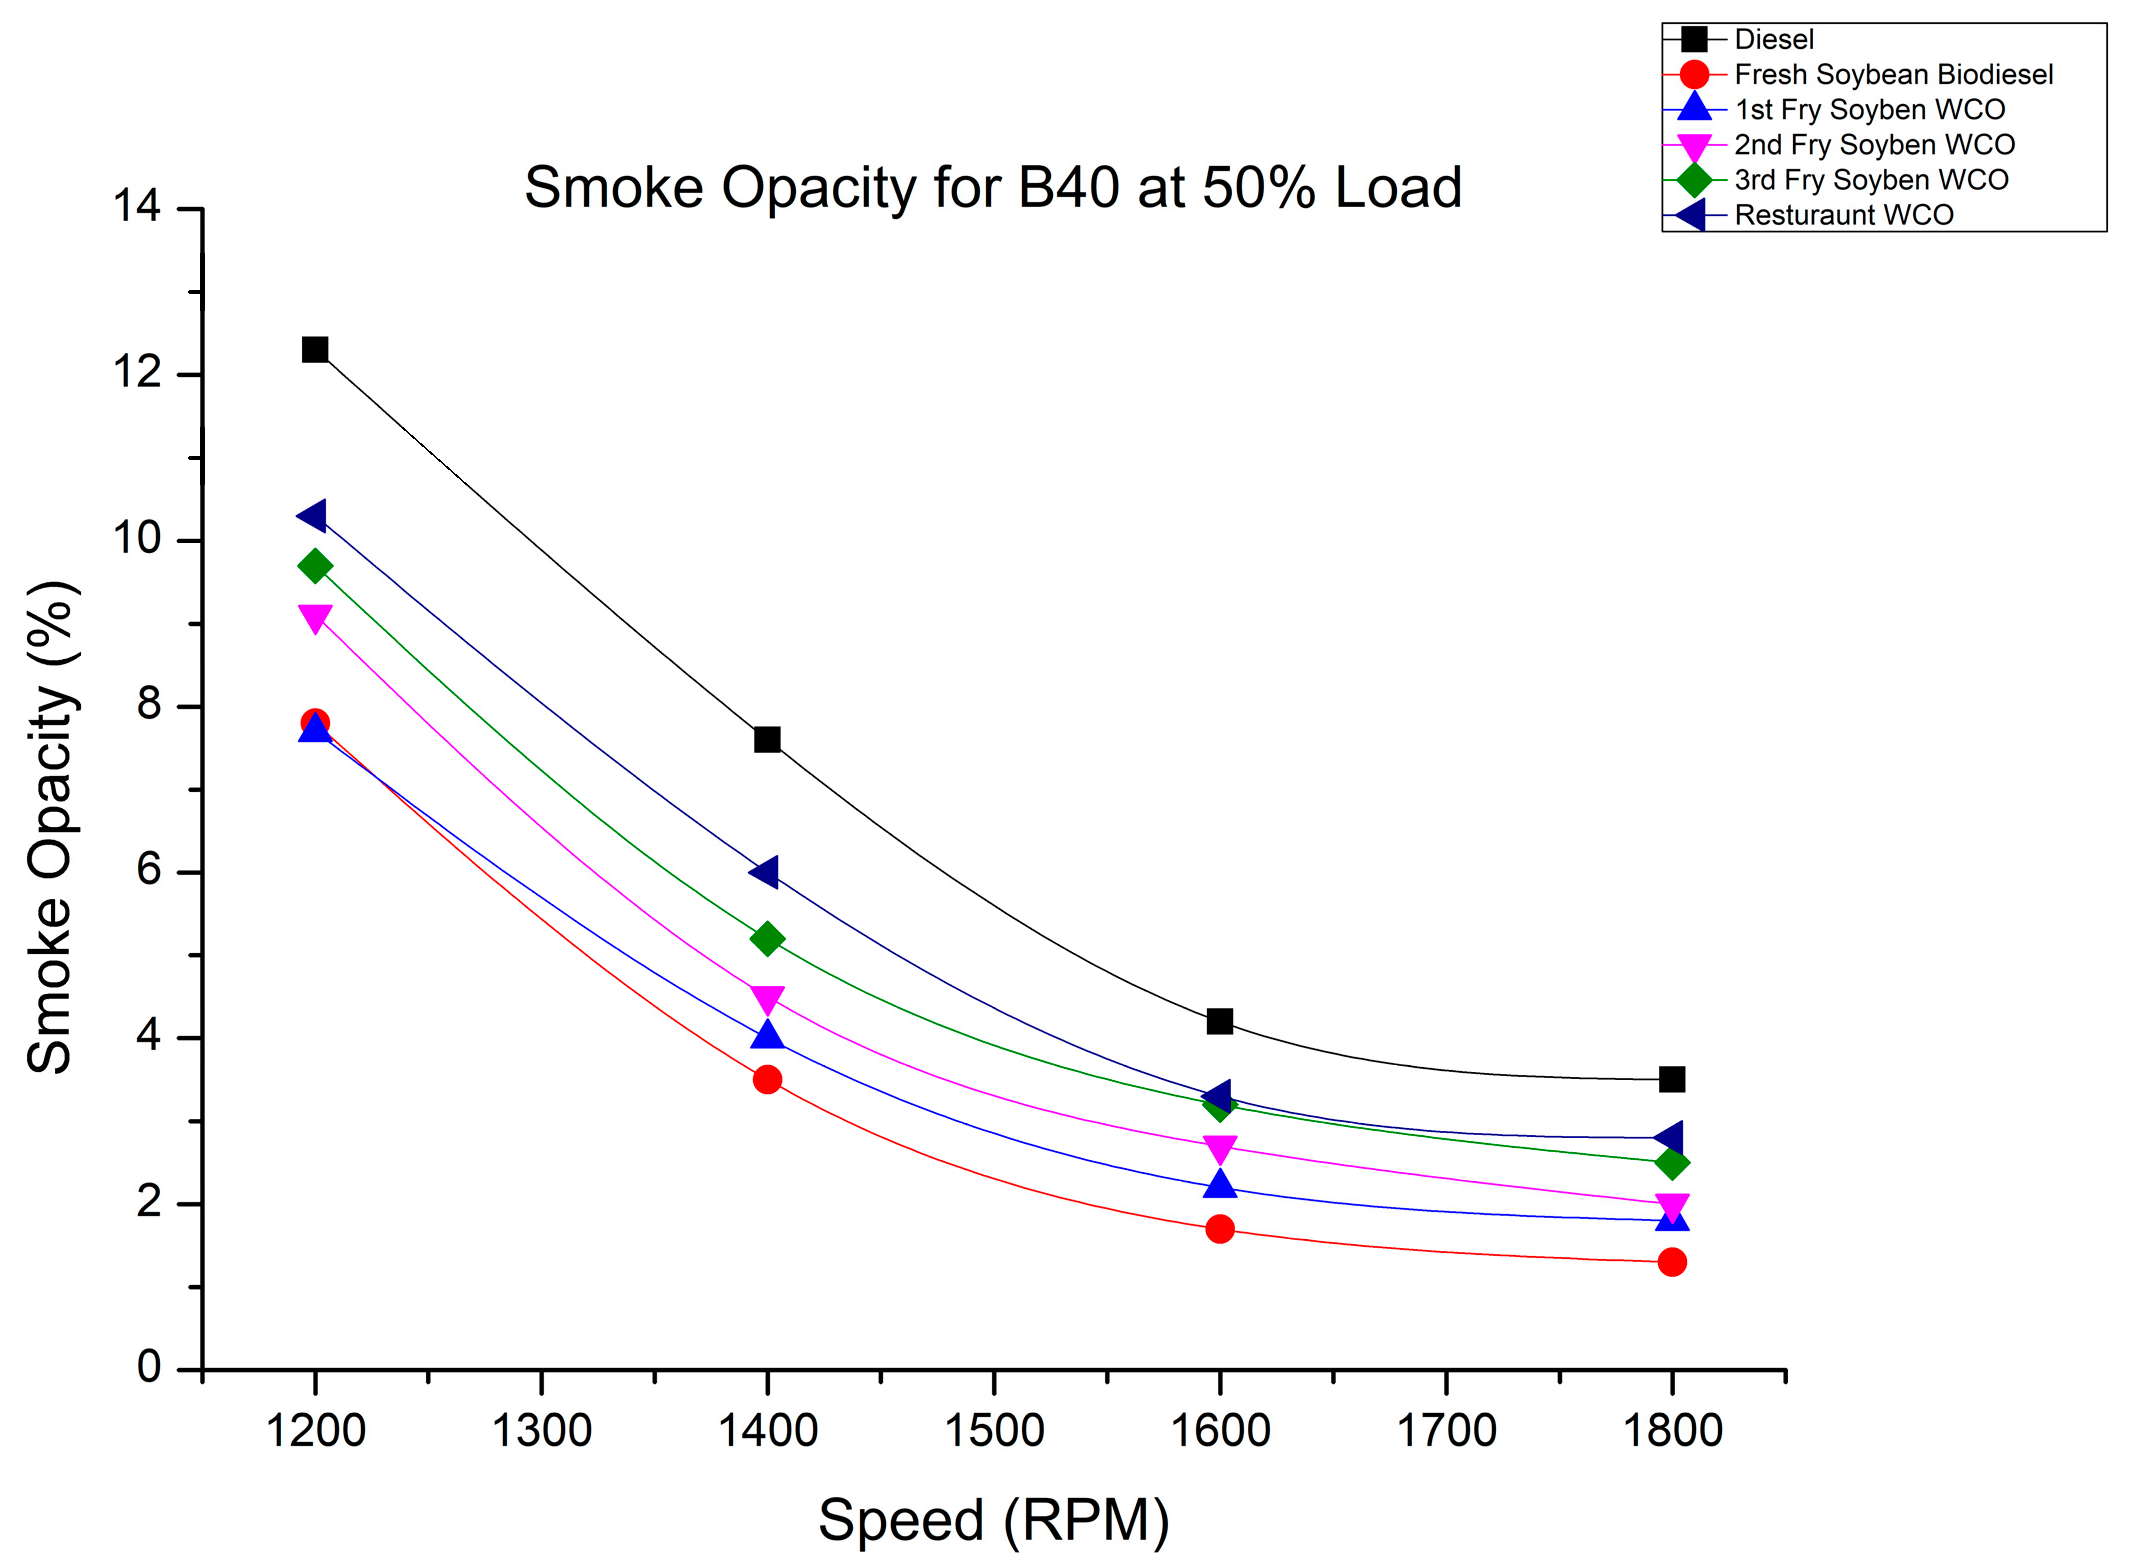
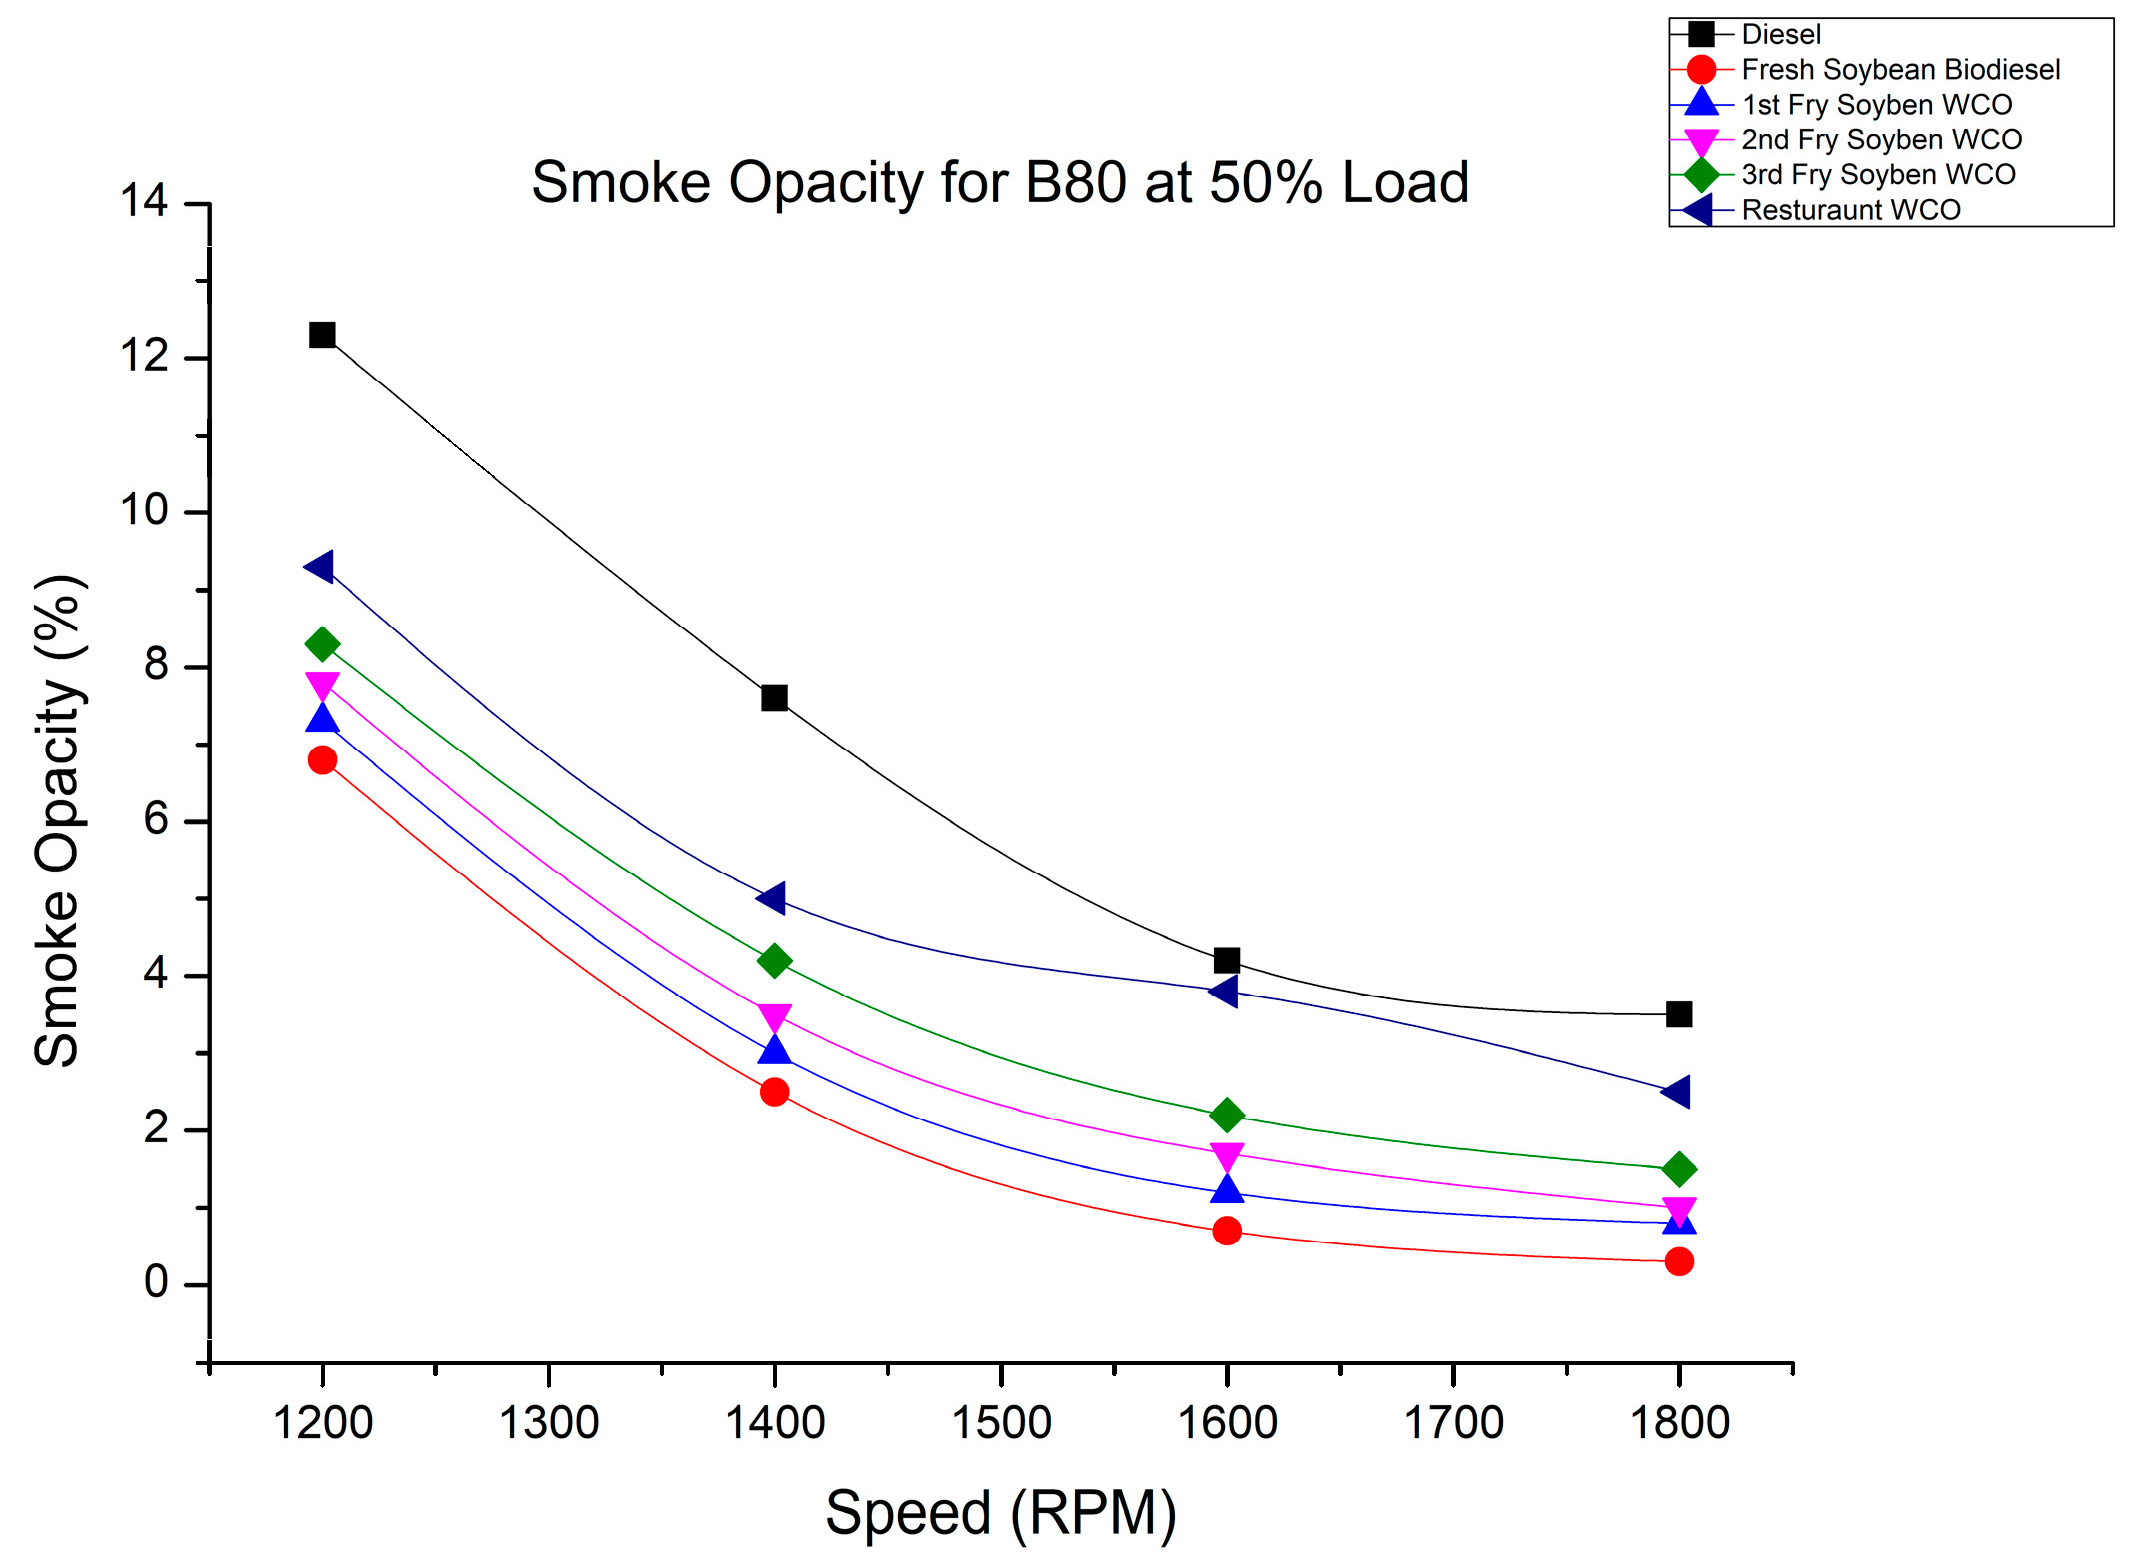
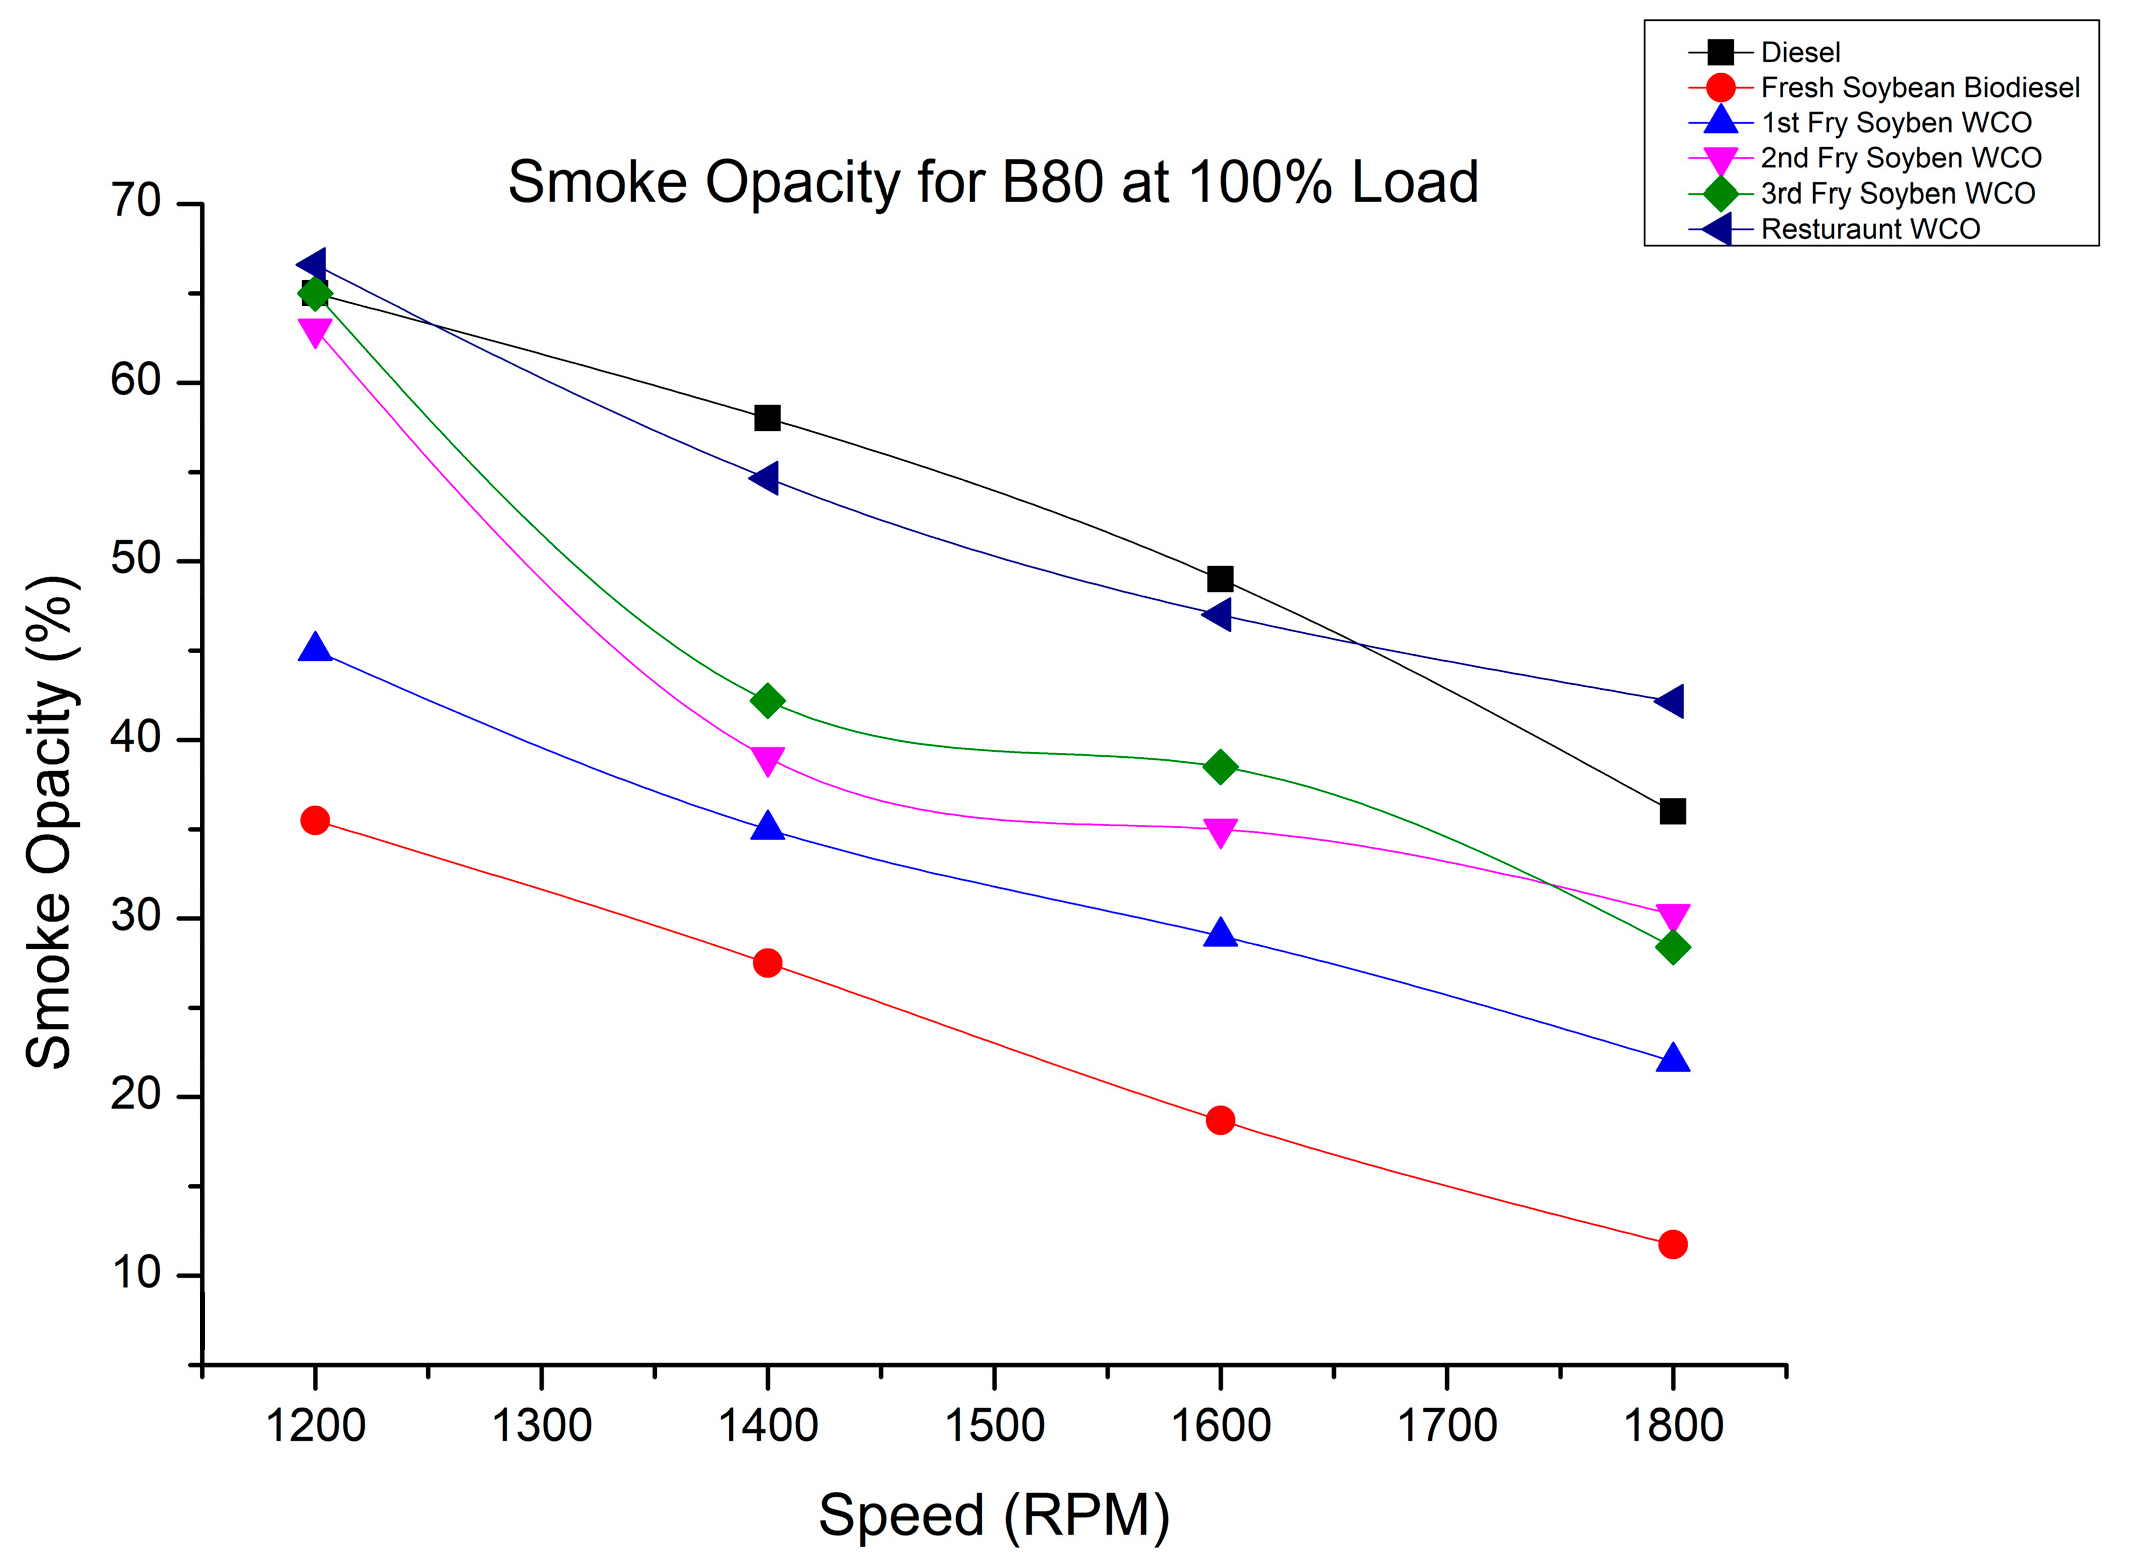
Smoke is the cause of incomplete combustion of fuel in the combustion chamber. Figure 26, Figure 27, Figure 28 and Figure 29 show the trend of lower smoke emissions when using biodiesel fuel (SOB, 1FWCOB, 2FWCOB, 3FWCOB, and RFWCOB) under 50% and 100% load conditions at varying speeds of the engine. From the results, it can be observed that the smoke opacity for biodiesel blends and diesel fuel decreased with an increase in speed under different load conditions. The biodiesel blends show lower smoke opacity trends than diesel fuel because of the lower hydrocarbon presence. The combustion of biodiesel fuel was aided by its higher oxygen content (around 10%) and high cetane index, which reduced the smoke opacity. Having more oxygen in the fuel caused it to burn completely. As biodiesel is rich in oxygen content, biodiesel blend fuels show lower smoke compared with conventional diesel fuel [47,48].

4.8. Variation of the Exhaust Temperature with Engine Rpm

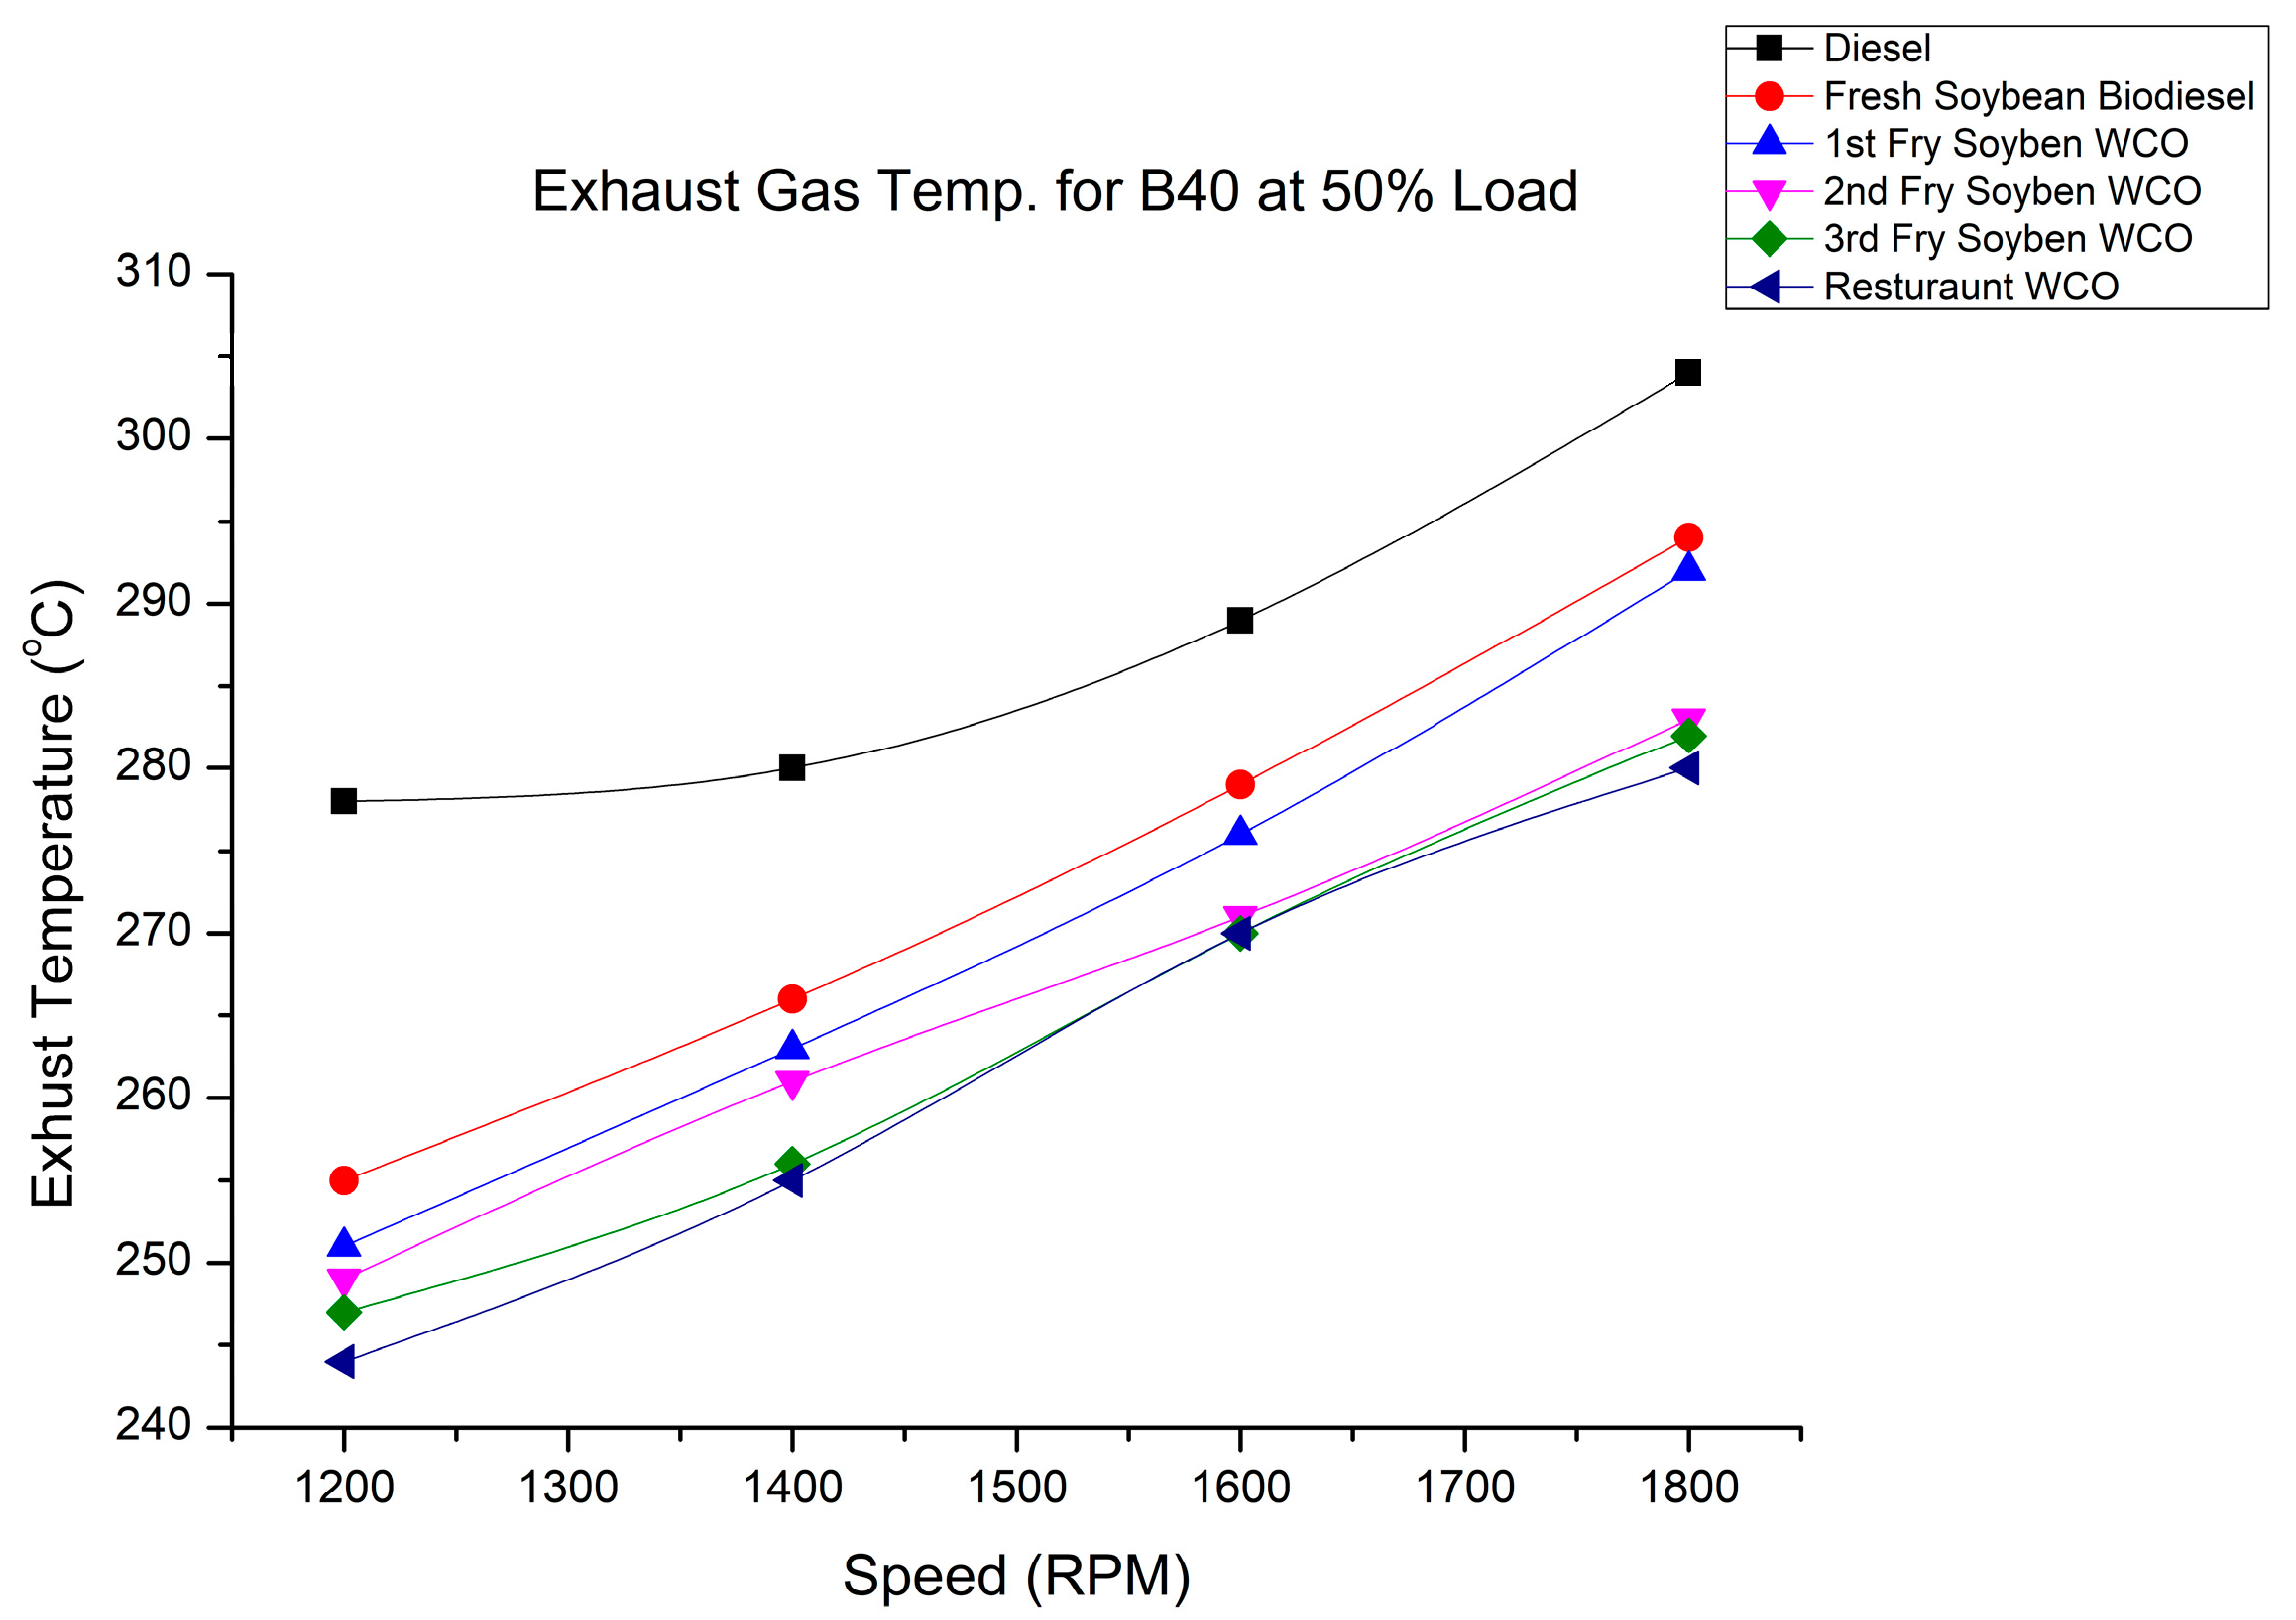
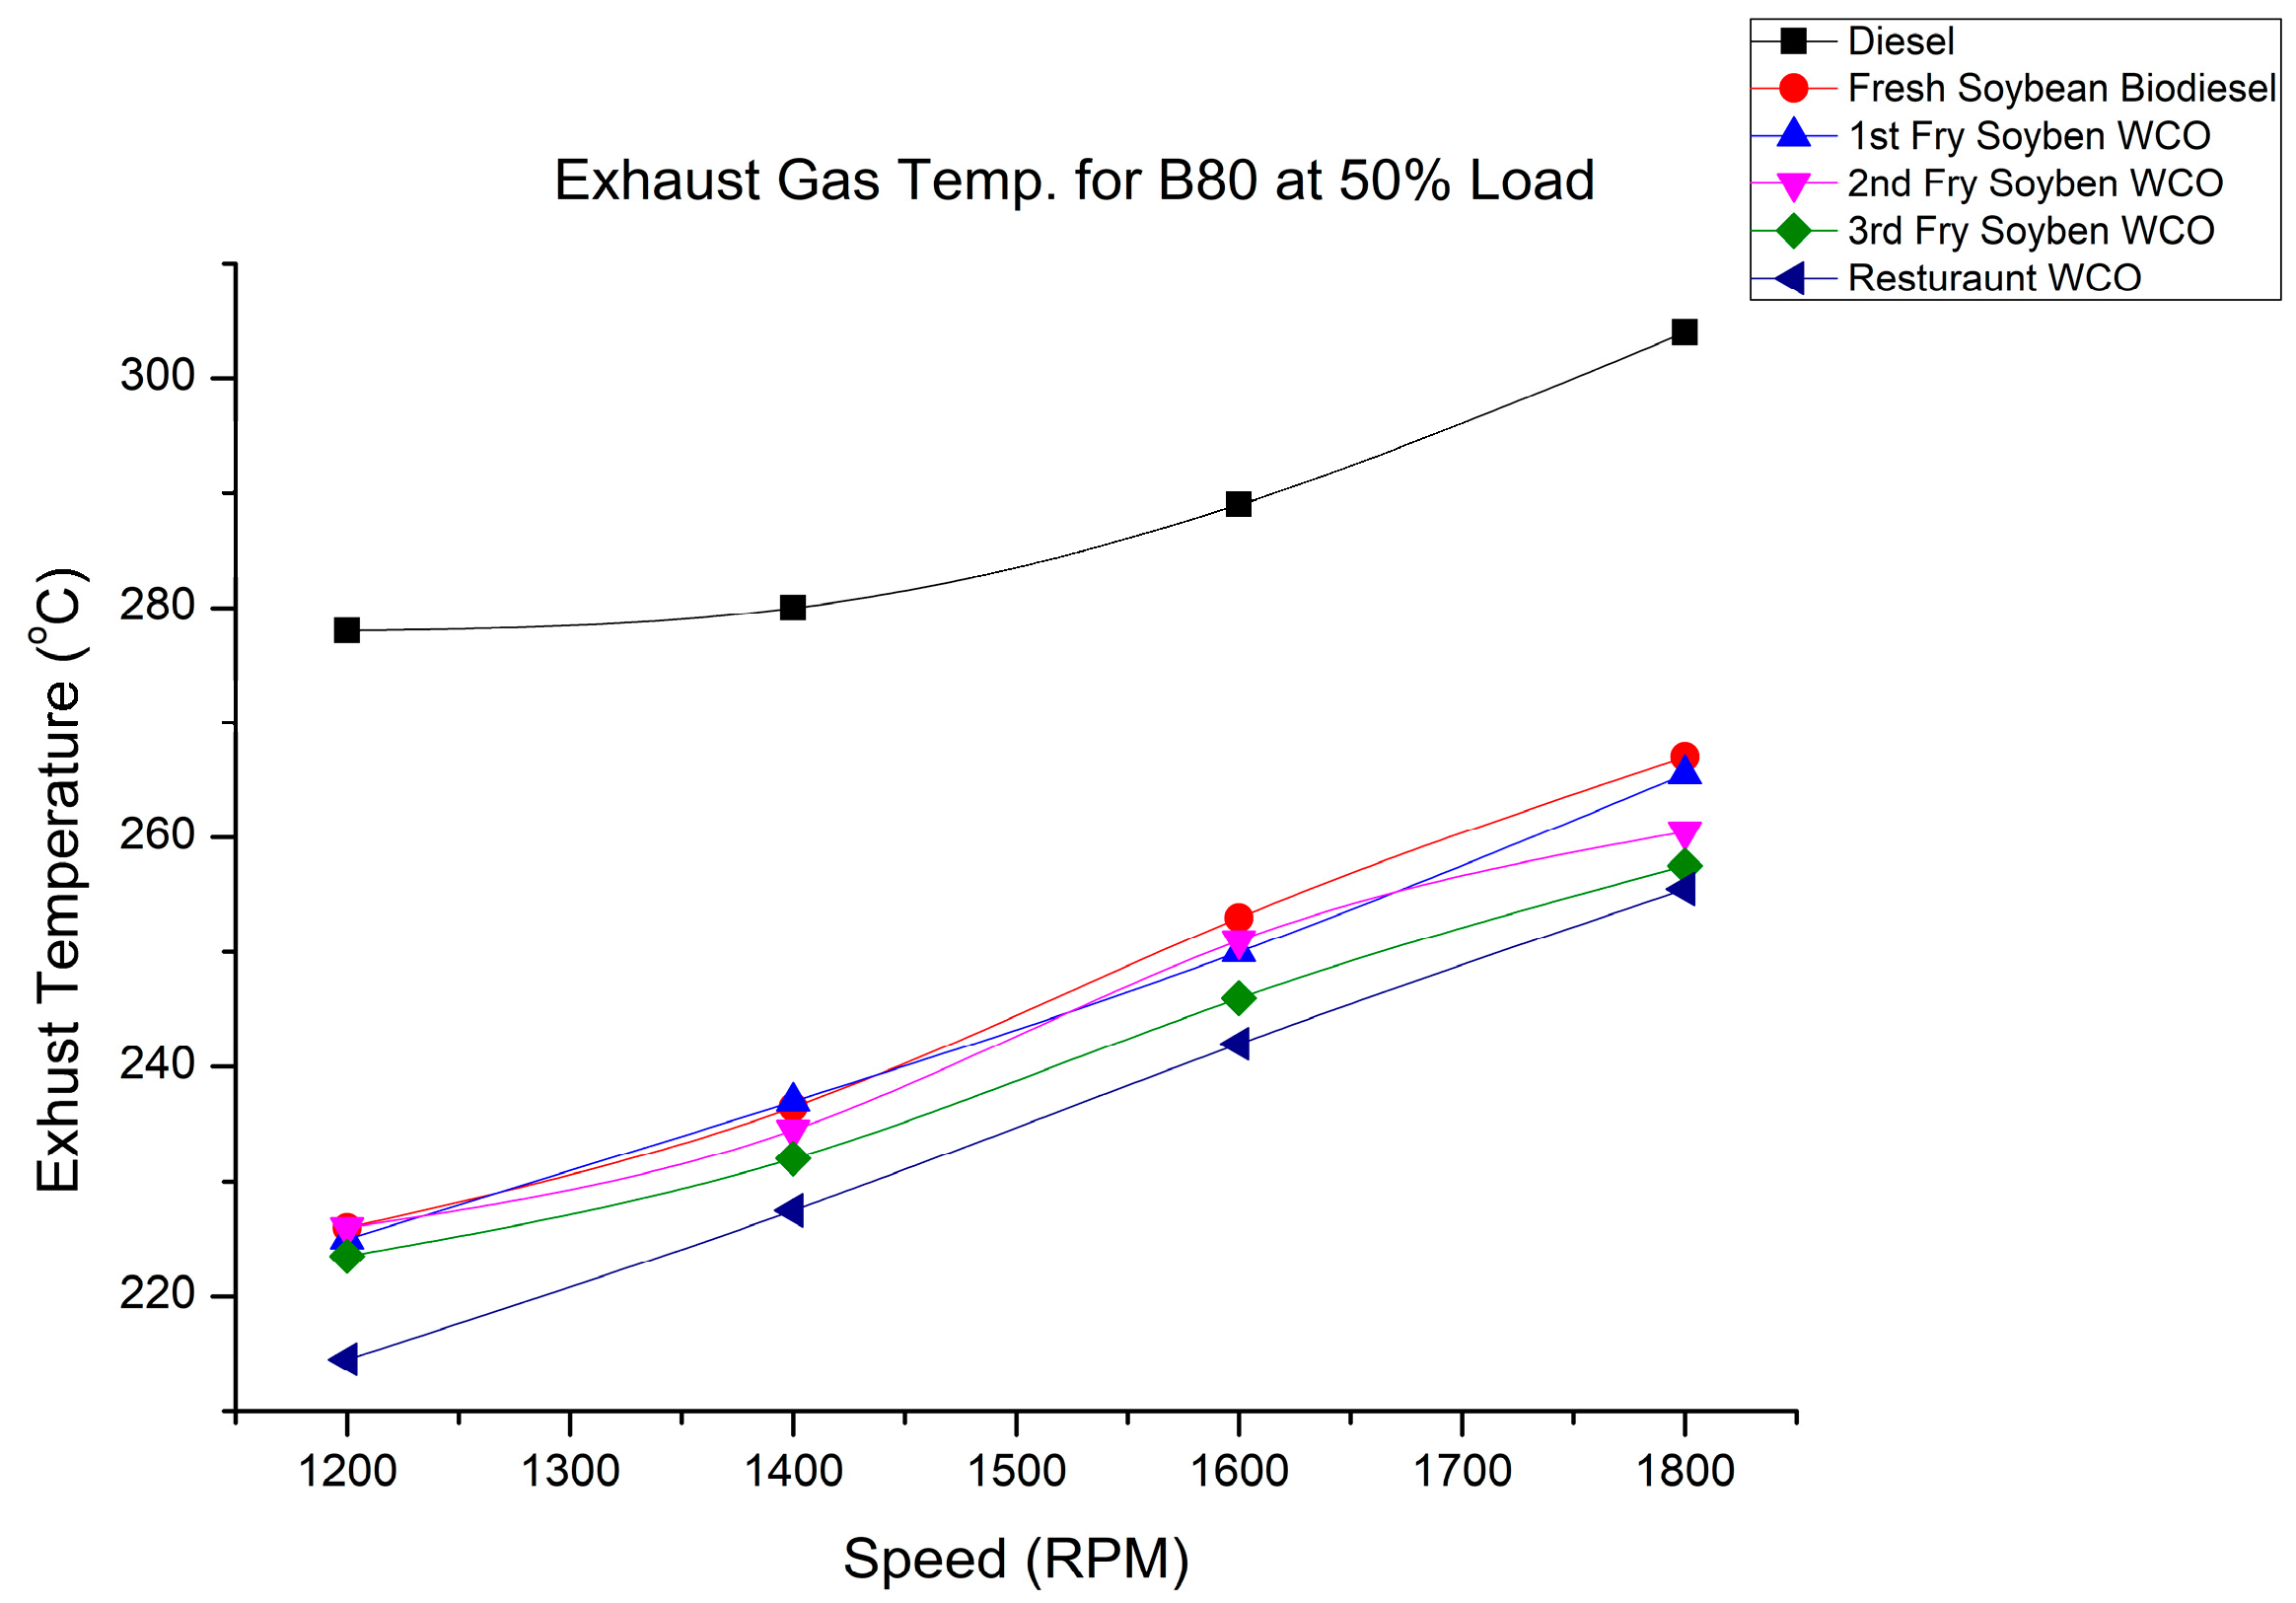
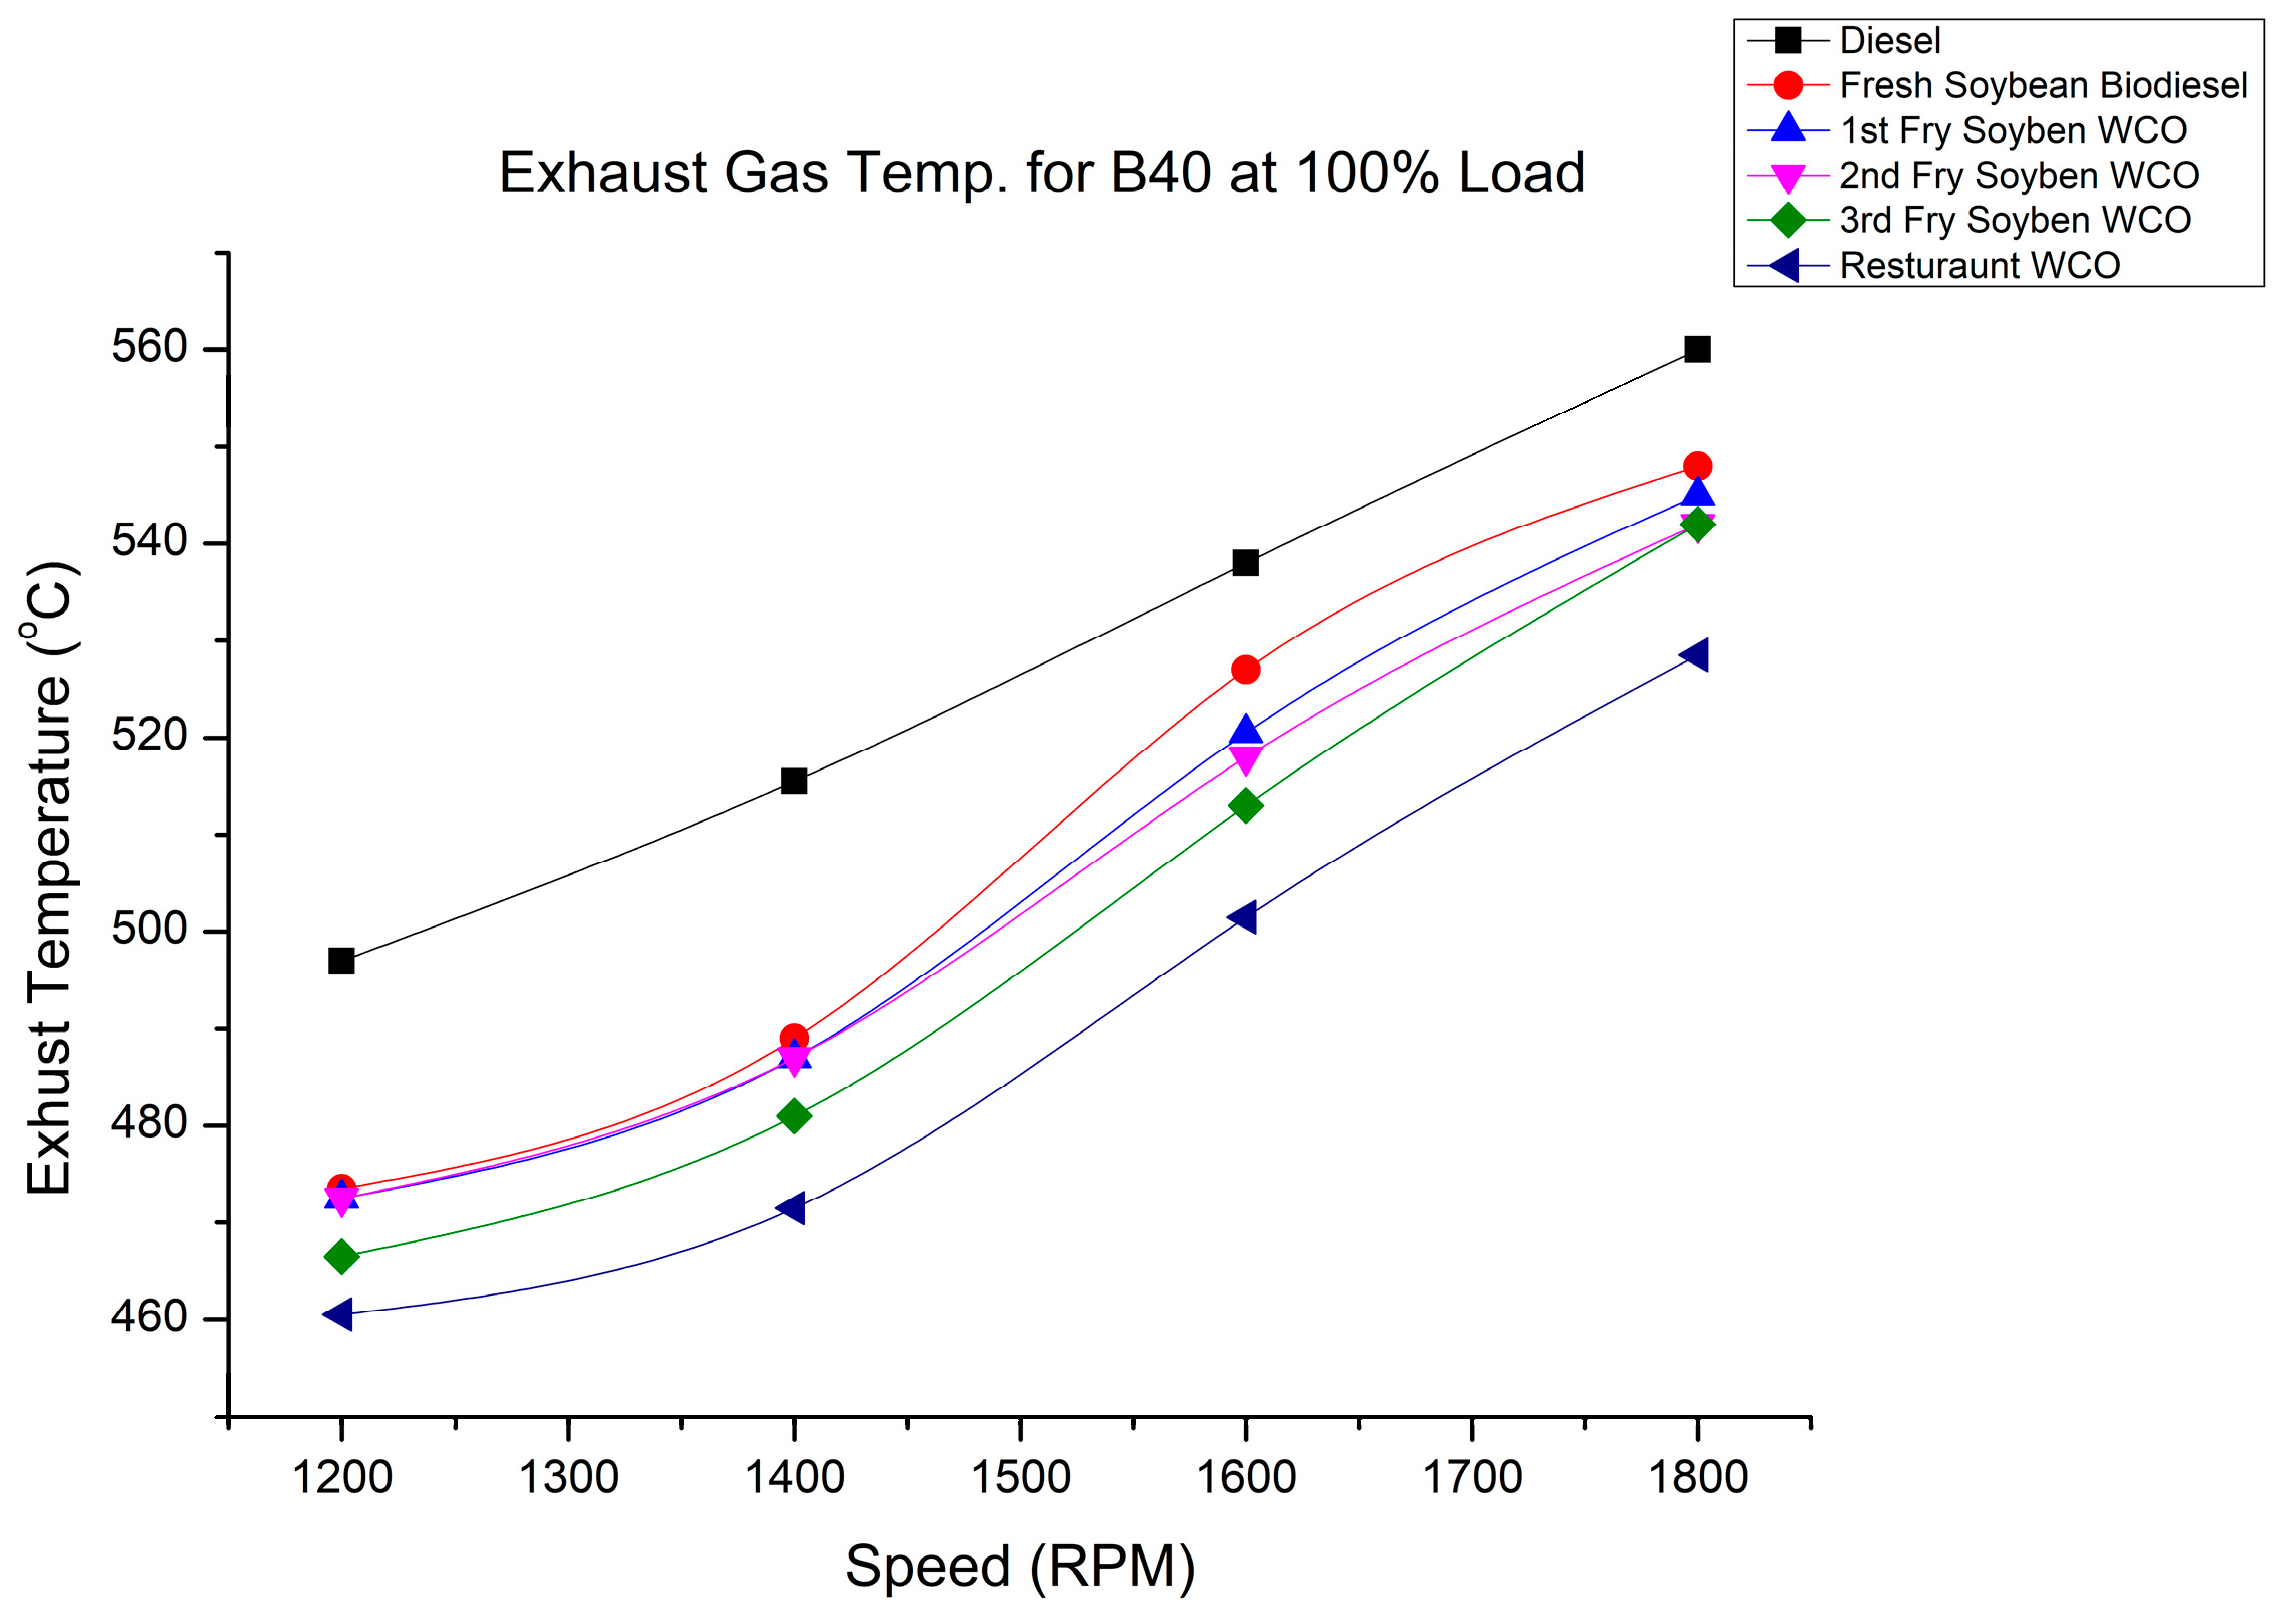
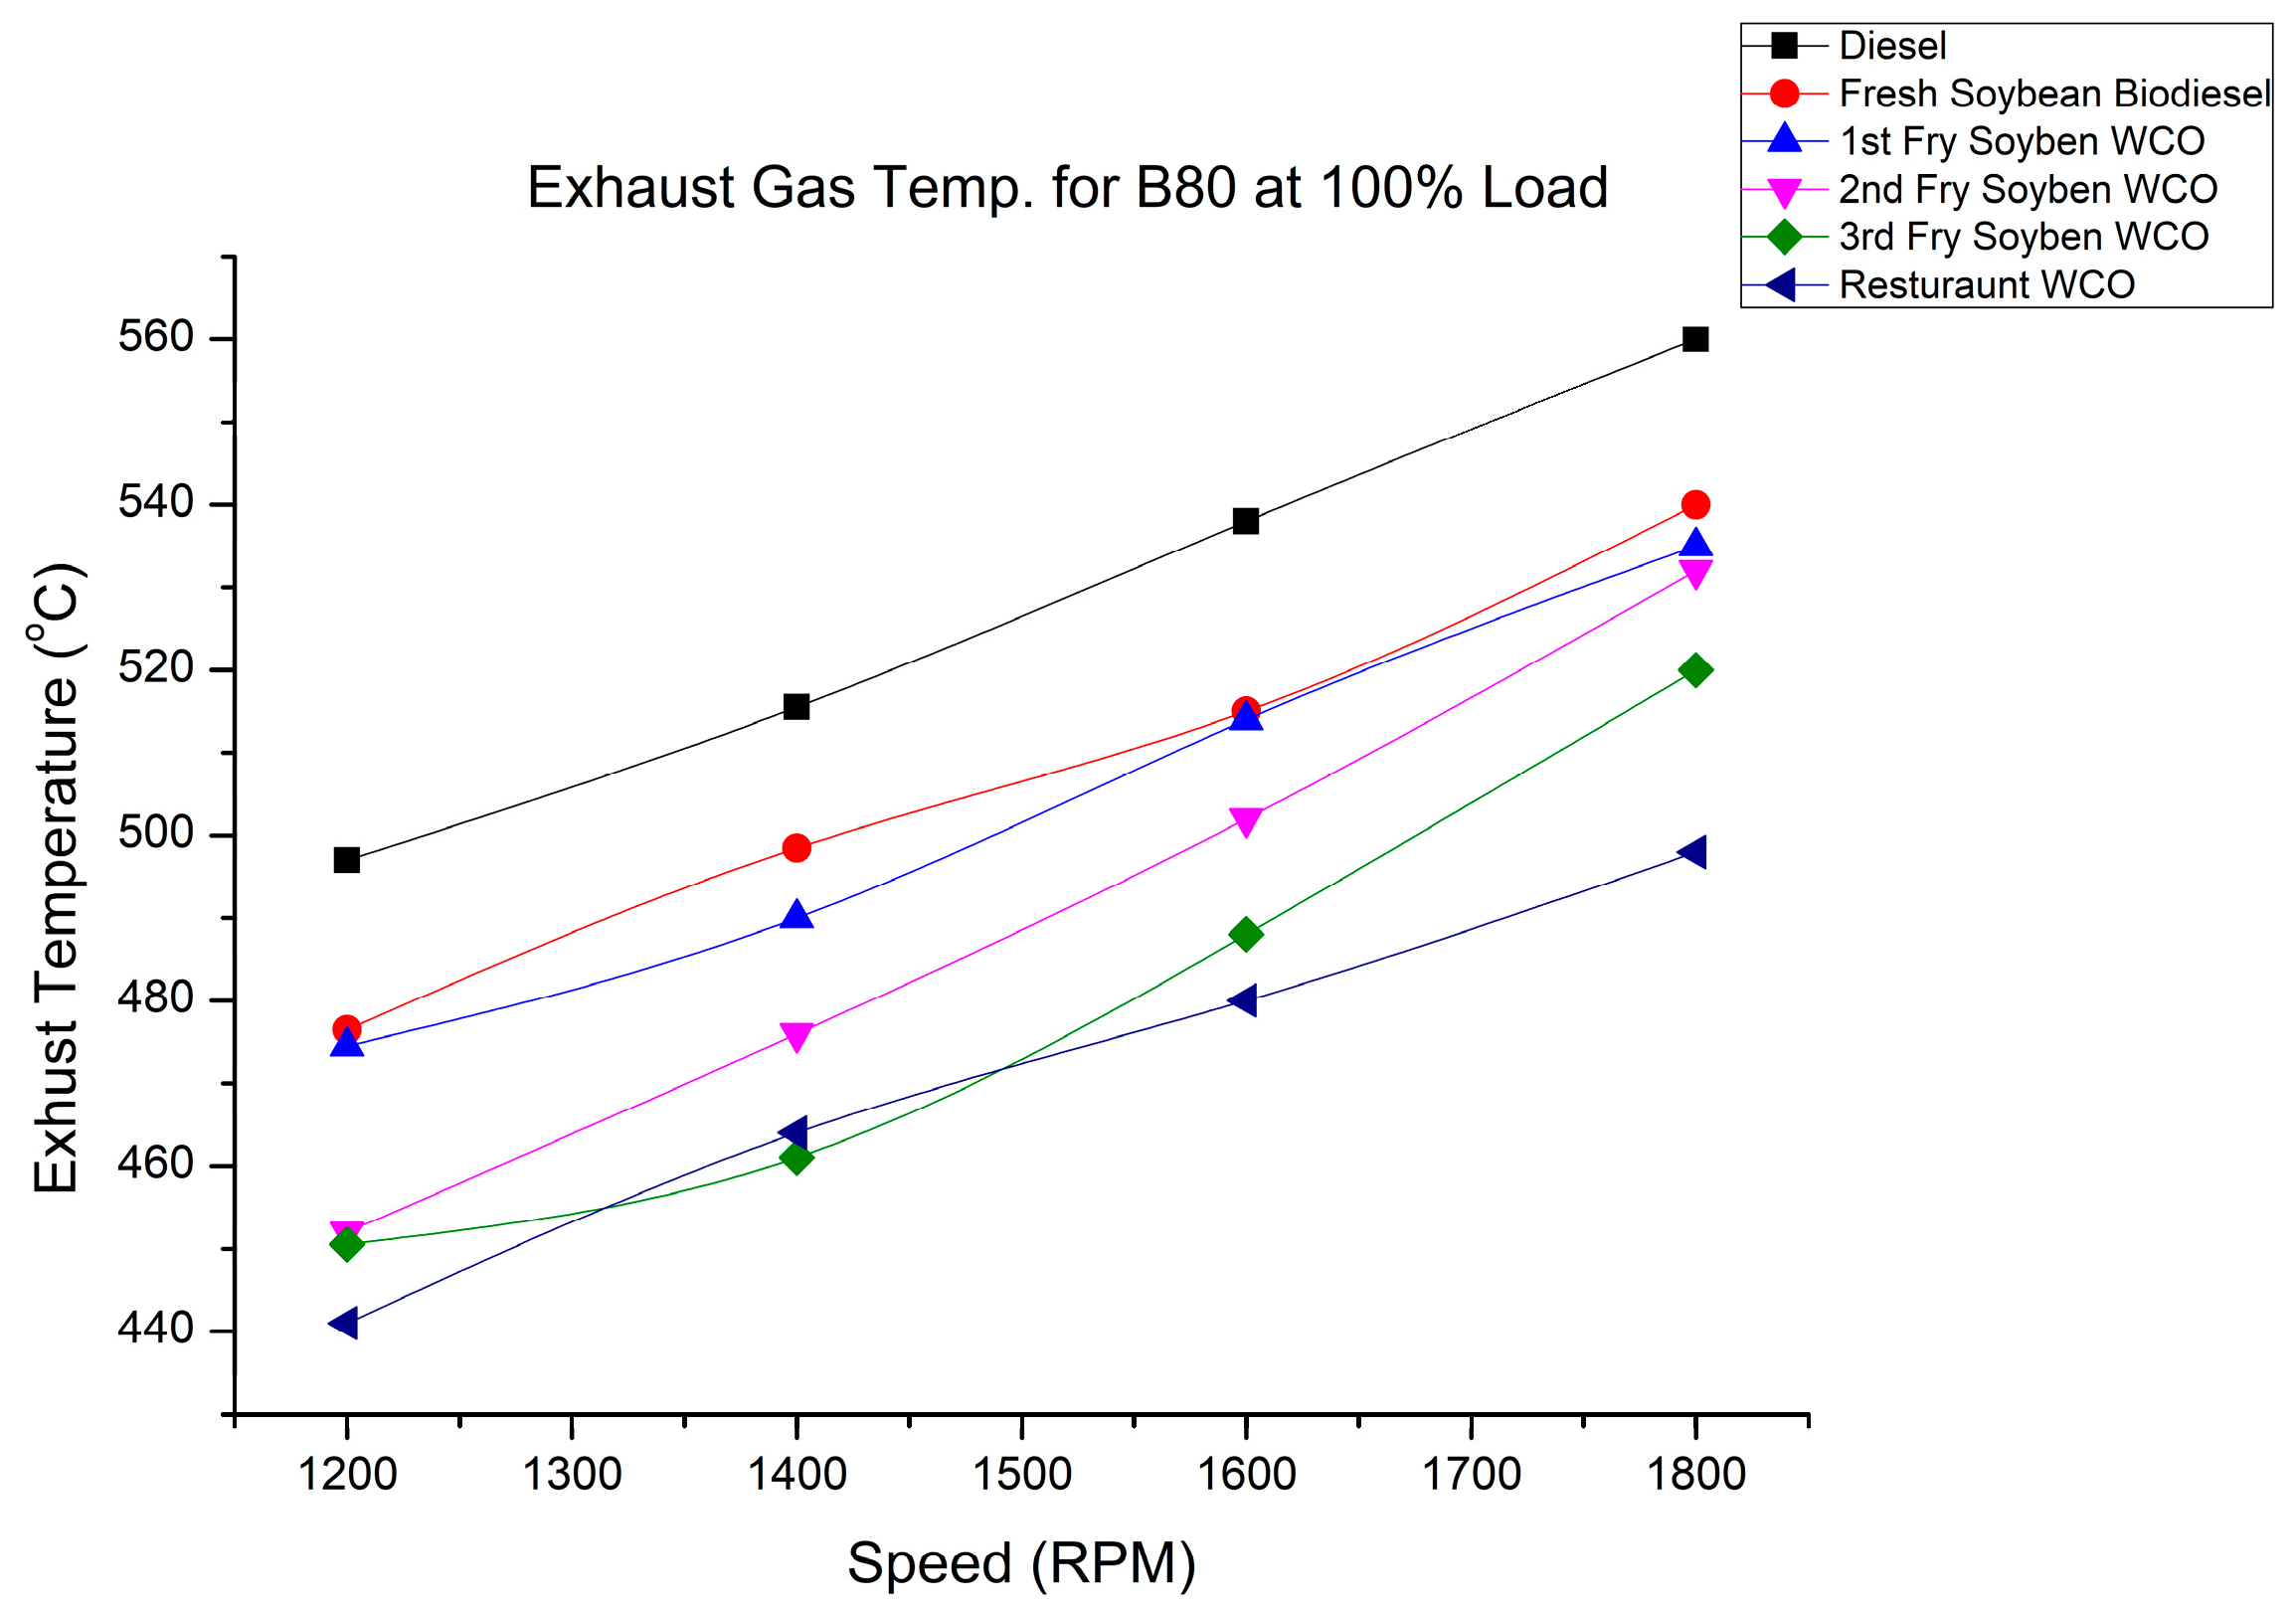
Figure 30 shows the EGT results of the B40 fuel blends at 50% load and 1200 rpm, where the smoke was measured at 255 °C, 251 °C, 249 °C, 247 °C, and 244 °C for SOB, 1FWCOB, 2FWCOB, 3FWCOB, and RFWCOB, respectively. Figure 31 shows the EGT results of the B80 fuel blends at 50% load and 1200 rpm, where the smoke was measured at 226 °C, 225 °C, 226 °C, 223.5 °C, and 214 °C for SOB, 1FWCOB, 2FWCOB, 3FWCOB, and RFWCOB, respectively. Figure 32 shows the EGT results of the B40 fuel blends at 100% load and 1200 rpm, where the smoke was measured at 473 °C, 472.5 °C, 472.5 °C, 466.5 °C, and 460.5 °C for SOB, 1FWCOB, 2FWCOB, 3FWCOB, and RFWCOB, respectively. Figure 33 shows the EGT results of the B80 fuel blends at 100% load and 1200 rpm, where the smoke was measured at 476.5 °C, 474.5 °C, 452 °C, 450.5 °C, and 441 °C for SOB, 1FWCOB, 2FWCOB, 3FWCOB, and RFWCOB, respectively. For 1800 rpm, the EGT was measured to be 540 °C, 535 °C, 532 °C, 520 °C, and 498 °C for SOB, 1FWCOB, 2FWCOB, 3FWCOB, and RFWCOB, respectively.
Ignition delay affects the EGT, which is a result of delayed combustion brought on by a prolonged ignition delay. The duration of the ignition delay increases as the cetane number drops [49]. However, EGT was lower for the SOB, 1FWCOB, 2FWCOB, and RFWCOB blends (B40 and B80) due to a higher cetane number and decreased heating value. In addition, a higher cetane number led to ignition delay. Consequently, the lower cetane number was the factor for increased EGT and was the cause of the increased ignition delay. This led to a prolonged duration of power in the combustion chamber [50,51].

5. Conclusions

In the experimental investigation, an agricultural, water-cooled diesel engine was used. Biodiesel generated from waste soya bean cooking fry oil was used for the investigation. The biodiesel oils were classified based on the fry time as SOB, 1FWCOB, 2FWCOB, 3FWCOB, and RFWCOB. There was a discernible change in the oil’s physiochemical characteristics as the frying time increased. This study compared new soya bean biodiesel fry oil blends at B40 and B80 ratios were compared with each other and conventional diesel. By varying the engine rpm and load conditions, the emissions and performance of the test fuels were evaluated. Experimental outcomes showed that the BSFC rose as the speed changed from 1200 rpm to 1800 rpm. It was clearly visible that the BSFC increased with an increase in speed with different load conditions. The BSFC for RFWCOB was the highest in all conditions compared with other fuels. At low speed (1200 rpm), the BSFC was low because of the low fuel efficiency, but at increased rpm, the BSFC increased due to the increased consumption of fuel to produce higher power. Diesel fuel had the highest value of BTE at different speeds and load conditions compared with other test fuels, i.e., the BTE was lower for SOB, 1FWCOB, 2FWCOB, 3FWCOB, and RFWCOB. As biodiesel has a higher calorific value and higher fuel consumption, this was the major reason for the reduction in BTE.
CO2 emissions for all the biodiesel blends were higher than diesel fuel because of the higher density and heating value, which depended on the frying time of the fuel and the blending ratio. The NOx emissions were higher for all the biodiesel blends because of the high combustion temperature of the biodiesel. SOB had the lowest NOx emissions, whereas when increasing the fry time, RFWCOB had the highest NOx. The smoke opacity for both the blends (B40 and B80) at different load conditions showed a declining trend. The EGT dropped because of the biodiesel bends’ increased cetane number and lower heating value. From the results of the experiment, it was determined that the frying time of the oil altered the performance and emission characteristics. Among all the waste oils, 1FWCOB performed better with engine performance and emission results. It was determined that prolonging the fry time altered the engine performance and emission metrics. The use of sustainable fuel is essential; waste fry cooking oil as a substitute for fossil diesel could be a prospective replacement in the agricultural engine and transportation sector.

Author Contributions

Conceptualization, A.M. and H.C.; methodology, A.M.; software, A.M.; validation, D.C. and H.C.; formal analysis, D.C.; investigation, A.M.; resources, H.C.; data curation, D.C.; writing—original draft preparation, A.M. and D.C; writing—review and editing, D.C.; visualization, A.M.; supervision, H.C.; project administration, D.C.; funding acquisition, D.C. All authors read and agreed to the published version of the manuscript.

Funding

This research was supported by the MSIT (Ministry of Science and ICT), Korea, under the Innovative Human Resource Development for Local Intellectualization support program (IITP-2022-00156334) supervised by the IITP (Institute for Information and Communications Technology Planning and Evaluation).

Data Availability Statement

The first author gathered the data that are provided in this publication by conducting experiments in the lab.

Conflicts of Interest

The authors declare no conflict of interest.

Nomenclature

BSFCBrake-specific fuel consumption
BTEBrake thermal efficiency
CICompression ignition
COCarbon monoxide
FWCOBFry waste cooking oil biodiesel
HCHydrocarbon
HRRHeat release rate
ICInternal combustion
NOxNitrogen oxide
WCOWaste cooking oil

References

  1. Montgomery, H. Preventing the Progression of Climate Change: One Drug or Polypill? Biofuel Res. J. 2017, 4, 536. [Google Scholar] [CrossRef]
  2. Thiyagarajan, S.; Edwin Geo, V.; Martin, L.J.; Nagalingam, B. Comparative Analysis of Various Methods to Reduce CO2 Emission in a Biodiesel Fueled CI Engine. Fuel 2019, 253, 146–158. [Google Scholar] [CrossRef]
  3. Feng, R.; Hu, X.; Li, G.; Sun, Z.; Deng, B. A Comparative Investigation between Particle Oxidation Catalyst (POC) and Diesel Particulate Filter (DPF) Coupling Aftertreatment System on Emission Reduction of a Non-Road Diesel Engine. Ecotoxicol. Environ. Saf. 2022, 238, 113576. [Google Scholar] [CrossRef]
  4. Simsek, S. Effects of Biodiesel Obtained from Canola, Sefflower Oils and Waste Oils on the Engine Performance and Exhaust Emissions. Fuel 2020, 265, 117026. [Google Scholar] [CrossRef]
  5. Yontar, A.A.; Doğu, Y. Investigation of the Effects of Gasoline and CNG Fuels on a Dual Sequential Ignition Engine at Low and High Load Conditions. Fuel 2018, 232, 114–123. [Google Scholar] [CrossRef]
  6. Musthafa, M.M. A Comparative Study on Coated and Uncoated Diesel Engine Performance and Emissions Running on Dual Fuel (LPG—Biodiesel) with and without Additive. Ind. Crops Prod. 2019, 128, 194–198. [Google Scholar] [CrossRef]
  7. Juknelevicius, R.; Szwaja, S.; Pyrc, M.; Gruca, M. Influence of Hydrogen Co-Combustion with Diesel Fuel on Performance, Smoke and Combustion Phases in the Compression Ignition Engine. Int. J. Hydrogen Energy 2019, 44, 19026–19034. [Google Scholar] [CrossRef]
  8. Emiroğlu, A.O.; Şen, M. Combustion, Performance and Emission Characteristics of Various Alcohol Blends in a Single Cylinder Diesel Engine. Fuel 2018, 212, 34–40. [Google Scholar] [CrossRef]
  9. Sidibe, S.; Blin, J.; Daho, T.; Vaitilingom, G.; Koulidiati, J. Comparative Study of Three Ways of Using Jatropha Curcas Vegetable Oil in a Direct Injection Diesel Engine. Sci. Afr. 2020, 7, e00290. [Google Scholar] [CrossRef]
  10. Rakopoulos, D.C. Heat Release Analysis of Combustion in Heavy-Duty Turbocharged Diesel Engine Operating on Blends of Diesel Fuel with Cottonseed or Sunflower Oils and Their Bio-Diesel. Fuel 2012, 96, 524–534. [Google Scholar] [CrossRef]
  11. Feng, R.; Li, G.; Sun, Z.; Hu, X.; Deng, B.; Fu, J. Potential of Emission Reduction of a Turbo-Charged Non-Road Diesel Engine without Aftertreatment under Multiple Operating Scenarios. Energy 2023, 263, 125832. [Google Scholar] [CrossRef]
  12. Feng, R.; Hu, X.; Li, G.; Sun, Z.; Ye, M.; Deng, B. Exploration on the Emissions and Catalytic Reactors Interactions of a Non-Road Diesel Engine through Experiment and System Level Simulation. Fuel 2023, 342, 127746. [Google Scholar] [CrossRef]
  13. Aydin, H. Combined Effects of Thermal Barrier Coating and Blending with Diesel Fuel on Usability of Vegetable Oils in Diesel Engines. Appl. Therm. Eng. 2013, 51, 623–629. [Google Scholar] [CrossRef]
  14. Lapuerta, M.; Armas, O.; Herreros, J.M. Emissions from a Diesel–Bioethanol Blend in an Automotive Diesel Engine. Fuel 2008, 87, 25–31. [Google Scholar] [CrossRef]
  15. Canakci, M. Combustion Characteristics of a Turbocharged DI Compression Ignition Engine Fueled with Petroleum Diesel Fuels and Biodiesel. Bioresour. Technol. 2007, 98, 1167–1175. [Google Scholar] [CrossRef]
  16. Qi, D.H.; Chen, H.; Geng, L.M.; Bian, Y.Z. Effect of Diethyl Ether and Ethanol Additives on the Combustion and Emission Characteristics of Biodiesel-Diesel Blended Fuel Engine. Renew. Energy 2011, 36, 1252–1258. [Google Scholar] [CrossRef]
  17. Oni, B.A.; Oluwatosin, D. Emission Characteristics and Performance of Neem Seed (Azadirachta Indica) and Camelina (Camelina Sativa) Based Biodiesel in Diesel Engine. Renew. Energy 2020, 149, 725–734. [Google Scholar] [CrossRef]
  18. Lapuerta, M.; Armas, O.; Rodriguez-Fernandez, J. Effect of Biodiesel Fuels on Diesel Engine Emissions. Prog. Energy Combust. Sci. 2008, 34, 198–223. [Google Scholar] [CrossRef]
  19. Aydin, H.; İlkılıç, C. Effect of Ethanol Blending with Biodiesel on Engine Performance and Exhaust Emissions in a CI Engine. Appl. Therm. Eng. 2010, 30, 1199–1204. [Google Scholar] [CrossRef]
  20. Graboski, M.S.; McCormick, R.L. Combustion of Fat and Vegetable Oil Derived Fuels in Diesel Engines. Prog. Energy Combust. Sci. 1998, 24, 125–164. [Google Scholar] [CrossRef]
  21. Mandal, A.; Cho, H.; Chauhan, B.S. Experimental Investigation of Multiple Fry Waste Soya Bean Oil in an Agricultural CI Engine. Energies 2022, 15, 3209. [Google Scholar] [CrossRef]
  22. Chauhan, B.S.; Kumar, N.; Du Jun, Y.; Lee, K.B. Performance and Emission Study of Preheated Jatropha Oil on Medium Capacity Diesel Engine. Energy 2010, 35, 2484–2492. [Google Scholar] [CrossRef]
  23. Kulkarni, M.G.; Dalai, A.K. Waste Cooking Oil an Economical Source for Biodiesel: A Review. Ind. Eng. Chem. Res. 2006, 45, 2901–2913. [Google Scholar] [CrossRef]
  24. Can, Ö. Combustion Characteristics, Performance and Exhaust Emissions of a Diesel Engine Fueled with a Waste Cooking Oil Biodiesel Mixture. Energy Convers. Manag. 2014, 87, 676–686. [Google Scholar] [CrossRef]
  25. Gui, M.M.; Lee, K.T.; Bhatia, S. Feasibility of Edible Oil vs. Non-Edible Oil vs. Waste Edible Oil as Biodiesel Feedstock. Energy 2008, 33, 1646–1653. [Google Scholar] [CrossRef]
  26. Canakci, M. The Potential of Restaurant Waste Lipids as Biodiesel Feedstocks. Bioresour. Technol. 2007, 98, 183–190. [Google Scholar] [CrossRef]
  27. Dorado, M.P.; Ballesteros, E.; de Almeida, J.A.; Schellert, C.; Löhrlein, H.P.; Krause, R. An Alkali-Catalyzed Transesterification Process for High Free Fatty Acid Waste Oils. Trans. ASAE 2002, 45, 525–529. [Google Scholar] [CrossRef]
  28. Zhang, Y.; Lou, D.; Tan, P.; Hu, Z.; Fang, L. Effects of Waste-Cooking-Oil Biodiesel Blends on Diesel Vehicle Emissions and Their Reducing Characteristics with Exhaust after-Treatment System. J. Clean. Prod. 2022, 381, 135190. [Google Scholar] [CrossRef]
  29. Akcay, M.; Yilmaz, I.T.; Feyzioglu, A. The Influence of Hydrogen Addition on the Combustion Characteristics of a Common-Rail CI Engine Fueled with Waste Cooking Oil Biodiesel/Diesel Blends. Fuel Process. Technol. 2021, 223, 106999. [Google Scholar] [CrossRef]
  30. Dharmalingam, B.; Balamurugan, S.; Wetwatana, U.; Tongnan, V.; Sekhar, C.; Paramasivam, B.; Cheenkachorn, K.; Tawai, A.; Sriariyanun, M. Comparison of Neural Network and Response Surface Methodology Techniques on Optimization of Biodiesel Production from Mixed Waste Cooking Oil Using Heterogeneous Biocatalyst. Fuel 2023, 340, 127503. [Google Scholar] [CrossRef]
  31. Sharma, V.; Kalam Hossain, A.; Ahmed, A.; Rezk, A. Study on Using Graphene and Graphite Nanoparticles as Fuel Additives in Waste Cooking Oil Biodiesel. Fuel 2022, 328, 125270. [Google Scholar] [CrossRef]
  32. EL-Seesy, A.I.; Waly, M.S.; El-Batsh, H.M.; El-Zoheiry, R.M. Enhancement of the Waste Cooking Oil Biodiesel Usability in the Diesel Engine by Using N-Decanol, Nitrogen-Doped, and Amino-Functionalized Multi-Walled Carbon Nanotube. Energy Convers. Manag. 2023, 277, 116646. [Google Scholar] [CrossRef]
  33. Chauhan, B.S.; Kumar, N.; Cho, H.M. A Study on the Performance and Emission of a Diesel Engine Fueled with Jatropha Biodiesel Oil and Its Blends. Energy 2012, 37, 616–622. [Google Scholar] [CrossRef]
  34. Mahla, S.K.; Safieddin Ardebili, S.M.; Mostafaei, M.; Dhir, A.; Goga, G.; Chauhan, B.S. Multi-Objective Optimization of Performance and Emissions Characteristics of a Variable Compression Ratio Diesel Engine Running with Biogas-Diesel Fuel Using Response Surface Techniques. Energy Sources Part A Recover. Util. Environ. Eff. 2020, 1–18. [Google Scholar] [CrossRef]
  35. Bhuiya, M.; Rasul, M.; Khan, M.; Ashwath, N. Performance and Emission Characteristics of Binary Mixture of Poppy and Waste Cooking Biodiesel. Energy Procedia 2017, 110, 523–528. [Google Scholar] [CrossRef]
  36. Verma, P.; Sharma, M.P.; Dwivedi, G. Potential Use of Eucalyptus Biodiesel in Compressed Ignition Engine. Egypt. J. Pet. 2016, 25, 91–95. [Google Scholar] [CrossRef]
  37. Qi, D.H.; Chen, H.; Geng, L.M.; Bian, Y.Z. Experimental Studies on the Combustion Characteristics and Performance of a Direct Injection Engine Fueled with Biodiesel/Diesel Blends. Energy Convers. Manag. 2010, 51, 2985–2992. [Google Scholar] [CrossRef]
  38. Singh, A.; Maurya, R.K. Effects of Intake Charge Temperature and Relative Air-Fuel Ratio on the Deterministic Characteristics of Cyclic Combustion Dynamics of a HCCI Engine. Int. J. Engine Res. 2022, 24, 146808742211065. [Google Scholar] [CrossRef]
  39. Azad, A.K.; Rasul, M.; Khan, M.M.; Sharma, S. Macadamia Biodiesel as a Sustainable and Alternative Transport Fuel in Australia. Energy Procedia 2017, 110, 543–548. [Google Scholar] [CrossRef]
  40. Imtenan, S.; Masjuki, H.H.; Varman, M.; Kalam, M.A.; Arbab, M.I.; Sajjad, H.; Ashrafur Rahman, S.M. Impact of Oxygenated Additives to Palm and Jatropha Biodiesel Blends in the Context of Performance and Emissions Characteristics of a Light-Duty Diesel Engine. Energy Convers. Manag. 2014, 83, 149–158. [Google Scholar] [CrossRef]
  41. Mahla, S.K.; Singla, V.; Sandhu, S.S.; Dhir, A. Studies on Biogas-Fuelled Compression Ignition Engine under Dual Fuel Mode. Environ. Sci. Pollut. Res. 2018, 25, 9722–9729. [Google Scholar] [CrossRef] [PubMed]
  42. Mahla, S.K.; Parmar, K.S.; Singh, J.; Dhir, A.; Sandhu, S.S.; Chauhan, B.S. Trend and Time Series Analysis by ARIMA Model to Predict the Emissions and Performance Characteristics of Biogas Fueled Compression Ignition Engine. Energy Sources Part A Recover. Util. Environ. Eff. 2019, 1–12. [Google Scholar] [CrossRef]
  43. Mahla, S.K.; Goga, G.; Cho, H.M.; Dhir, A.; Chauhan, B.S. Separate Effect of Biodiesel, n-Butanol, and Biogas on Performance and Emission Characteristics of Diesel Engine: A Review. Biomass Convers. Biorefinery 2023, 13, 447–469. [Google Scholar] [CrossRef]
  44. Liaquat, A.M.; Masjuki, H.H.; Kalam, M.A.; Fattah, I.M.R.; Hazrat, M.A.; Varman, M.; Mofijur, M.; Shahabuddin, M. Effect of Coconut Biodiesel Blended Fuels on Engine Performance and Emission Characteristics. Procedia Eng. 2013, 56, 583–590. [Google Scholar] [CrossRef]
  45. Palash, S.M.; Masjuki, H.H.; Kalam, M.A.; Masum, B.M.; Sanjid, A.; Abedin, M.J. State of the Art of NOx Mitigation Technologies and Their Effect on the Performance and Emission Characteristics of Biodiesel-Fueled Compression Ignition Engines. Energy Convers. Manag. 2013, 76, 400–420. [Google Scholar] [CrossRef]
  46. Mahalingam, A.; Munuswamy, D.B.; Devarajan, Y.; Radhakrishnan, S. Emission and Performance Analysis on the Effect of Exhaust Gas Recirculation in Alcohol-Biodiesel Aspirated Research Diesel Engine. Environ. Sci. Pollut. Res. 2018, 25, 12641–12647. [Google Scholar] [CrossRef]
  47. Zhihao, M.; Xiaoyu, Z.; Junfa, D.; Xin, W.; Bin, X.; Jian, W. Study on Emissions of a DI Diesel Engine Fuelled with Pistacia Chinensis Bunge Seed Biodiesel-Diesel Blends. Procedia Environ. Sci. 2011, 11, 1078–1083. [Google Scholar] [CrossRef]
  48. Abed, K.A.; El Morsi, A.K.; Sayed, M.M.; El Shaib, A.A.; Gad, M.S. Effect of Waste Cooking-Oil Biodiesel on Performance and Exhaust Emissions of a Diesel Engine. Egypt. J. Pet. 2018, 27, 985–989. [Google Scholar] [CrossRef]
  49. Buyukkaya, E. Effects of Biodiesel on a DI Diesel Engine Performance, Emission and Combustion Characteristics. Fuel 2010, 89, 3099–3105. [Google Scholar] [CrossRef]
  50. Utlu, Z.; Koçak, M.S. The Effect of Biodiesel Fuel Obtained from Waste Frying Oil on Direct Injection Diesel Engine Performance and Exhaust Emissions. Renew. Energy 2008, 33, 1936–1941. [Google Scholar] [CrossRef]
  51. Altaie, M.A.H.; Janius, R.B.; Rashid, U.; Taufiq-Yap, Y.H.; Yunus, R.; Zakaria, R.; Adam, N.M. Performance and Exhaust Emission Characteristics of Direct-Injection Diesel Engine Fueled with Enriched Biodiesel. Energy Convers. Manag. 2015, 106, 365–372. [Google Scholar] [CrossRef]
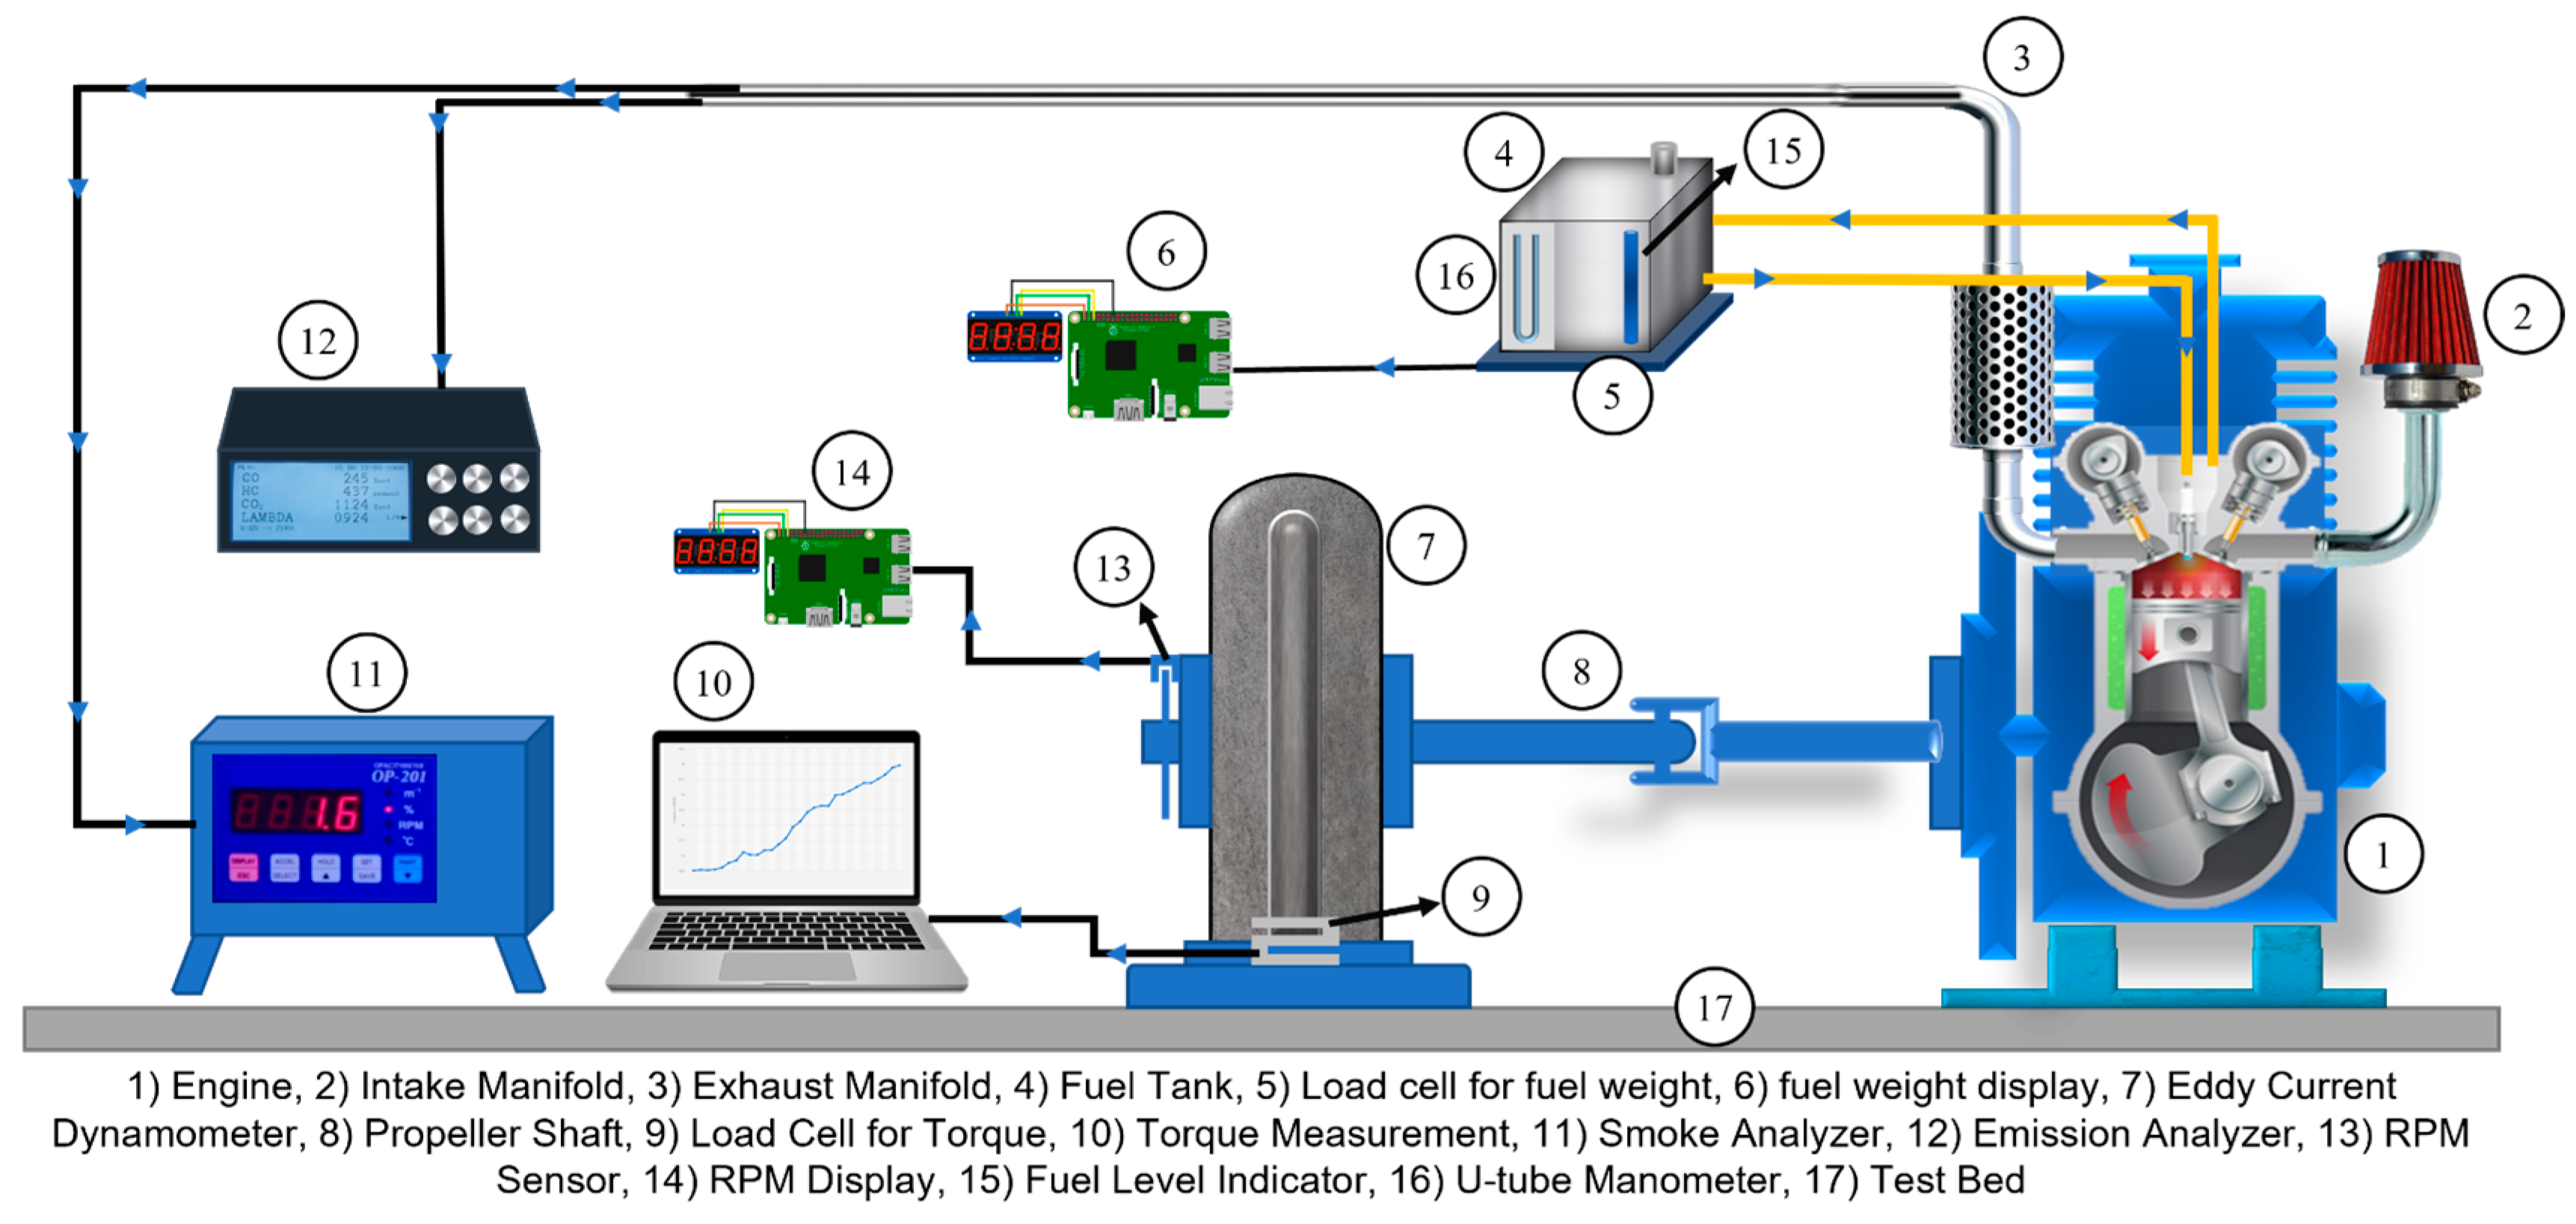
Figure 1. Experimental setup.
Energies 16 03711 g001
Figure 2. BTE of fry biodiesel B40 blends at various speeds at 50% load.
Energies 16 03711 g002
Figure 3. BTE of fry biodiesel B80 blends at various speeds at 50% load.
Energies 16 03711 g003
Figure 4. BTE of fry biodiesel B40 blends at various speeds at 100% load.
Energies 16 03711 g004
Figure 5. BTE of fry biodiesel B80 blends at various speeds at 100% load.
Energies 16 03711 g005
Figure 6. BSFC of fry biodiesel B40 blends at various speeds at 50% load.
Energies 16 03711 g006
Figure 7. BSFC of fry biodiesel B80 blends at various speeds at 50% load.
Energies 16 03711 g007
Figure 8. BSFC of fry biodiesel B40 blends at various speeds at 100% load.
Energies 16 03711 g008
Figure 9. BSFC of fry biodiesel B80 blends at various speeds at 100% load.
Energies 16 03711 g009
Figure 10. CO2 of fry biodiesel B40 blends at various speeds at 50% load.
Energies 16 03711 g010
Figure 11. CO2 of fry biodiesel B80 blends at various speeds at 50% load.
Energies 16 03711 g011
Figure 12. CO2 of fry biodiesel B40 blends at various speeds at 100% load.
Energies 16 03711 g012
Figure 13. CO2 of fry biodiesel B40 blends at various speeds at 100% load.
Energies 16 03711 g013
Figure 14. NOx emission of fry biodiesel B40 blends at various speeds at 50% load.
Energies 16 03711 g014
Figure 15. NOx emission of fry biodiesel B80 blends at various speeds at 50% load.
Energies 16 03711 g015
Figure 16. NOx emission of fry biodiesel B40 blends at various speeds at 100% load.
Energies 16 03711 g016
Figure 17. NOx emission of fry biodiesel B80 blends at various speeds at 100% load.
Energies 16 03711 g017
Figure 18. CO variation of fry biodiesel B40 blends at various speeds at 50% load.
Energies 16 03711 g018
Figure 19. CO variation of fry biodiesel B80 blends at various speeds at 50% load.
Energies 16 03711 g019
Figure 20. CO variation of fry biodiesel B40 blends at various speeds at 100% load.
Energies 16 03711 g020
Figure 21. CO variation of fry biodiesel B80 blends at various speeds at 100% load.
Energies 16 03711 g021
Figure 22. HC variation of fry biodiesel B40 blends at various speed at 50% load.
Energies 16 03711 g022
Figure 23. HC variation of fry biodiesel B80 blends at various speeds at 50% load.
Energies 16 03711 g023
Figure 24. HC variation of fry biodiesel B40 blends at various speeds at 100% load.
Energies 16 03711 g024
Figure 25. HC variation of fry biodiesel B80 blends at various speeds at 100% load.
Energies 16 03711 g025
Figure 26. Smoke variation of fry biodiesel B40 blends at various speeds at 50% load.
Energies 16 03711 g026
Figure 27. Smoke variation of fry biodiesel B80 blends at various speeds at 50% load.
Energies 16 03711 g027
Figure 28. Smoke variation of fry biodiesel B40 blends at various speeds at 100% load.
Energies 16 03711 g028
Figure 29. Smoke variation of fry biodiesel B80 blends at various speeds at 100% load.
Energies 16 03711 g029
Figure 30. Exhaust temperature variation of fry biodiesel B40 blends at various speeds at 50% load.
Energies 16 03711 g030
Figure 31. Exhaust temperature variation of fry biodiesel B80 blends at various speeds at 50% load.
Energies 16 03711 g031
Figure 32. Exhaust temperature variation of fry biodiesel B40 blends at various speeds at 100% load.
Energies 16 03711 g032
Figure 33. Exhaust temperature variation of fry biodiesel B80 blends at various speeds at 100% load.
Energies 16 03711 g033
Table 1. ASTM standards for fuel.
S. NoTestASTM TestASTM Limits
1Kinematic viscosity, mm2/sD 4451.9–4.1
2Cloud point, °CD 2500-
3Pour point, °CD 974.4–5.5 °C
4Flashpoint, °CD 9352 °C min
5Sulfur by weight, %D 1290.5% max
6Cetane numberD 61340 min
7DensityD 500215–35 °C
Table 2. Physicochemical properties of different biodiesels and diesel.
PropertyUnitStandard (ASTM)DieselSOB1FWCOB2FWCOB3FWCOBRFWCOB
Densitykg m3900833837841858871886
Viscositymm2/s1.9–62.723.954.414.664.794.91
Calorific valuekJ kg−1>33,00043,40039,69139,43538,91538,12138,012
Cloud point°C−2 to 12−8−6−6−6−5−4
Flashpoint°C>13078 67737784
Pour point°C−15 to 10−6−11−11−9−8
Cetane numberCN 55.325149474443
Sulfur content% 0.0480.160.0140.0120.0120.011
Table 3. Engine specification [18].
ParametersUnitDescription
Manufacturer-Daedong Korea
Engine stroke-4-stroke
Engine layout-Horizontal
Displacementcc673
Cooling-Water-cooled
Number of cylinders-1
Compression ratio-21
Boremm95
Stroke lengthmm95
Rated power outputkW7.4
Injection pressurekg cm−2135
Table 4. Specifications of the emissions analyzer and smoke meter [18].
Emission GasesResolutionRange
NOx1 ppm0–5000 ppm
CO0.001%0–9.999%
HC1 ppm0–10,000 ppm
Smoke0.05%0–100%
Disclaimer/Publisher’s Note: The statements, opinions and data contained in all publications are solely those of the individual author(s) and contributor(s) and not of MDPI and/or the editor(s). MDPI and/or the editor(s) disclaim responsibility for any injury to people or property resulting from any ideas, methods, instructions or products referred to in the content.