1. Introduction
The use of electricity in rural areas in southern Brazil is directed largely to the activity of irrigation on rice farms through hydraulic pumping systems used by customers usually called “irrigators”. Typically, these customers have very significant energy consumption, high levels of demand, and sharp variations in daily load during limited periods of the year. These particularities can cause problems of excessive loading, undervoltage, and transients at various times of the day in the distribution networks that involve this type of consumer. In the southern region of Brazil, these systems are called “rural feeders” and are extremely important to the power utilities.
Appendix A presents a more specific detailing of the context of irrigator consumers.
In this context, it becomes essential to study and develop alternatives based on adjustments in the daily load curves of rural feeders in order to reduce the loading of these feeders and thus avoid the occurrence of possible problems in the power grid equipment and in the continuity of the electricity supply service to these customers. An alternative that can be proposed in this context is the use of a demand-side management methodology applied to customer groups that present high load variation and represent a significant portion of the demand profile of rural feeders, in this case, customers in rural areas that use electricity for irrigation activities.
The concept of demand-side management (DSM) was introduced in 1985 by Clark Gellins as “the planning, implementation, and monitoring of utility activities to influence customer electricity use in ways that produce desired changes in the power utility’s load curve, i.e., changes in the timing pattern and magnitude of a power utility’s load” [
1,
2,
3]. DSM is a set of techniques used to improve and regulate an electric system in the aspect of electric energy management, being essential in the relationship between demand and energy supply to users [
4,
5]. The DSM concept can be employed to reduce or shift the electricity consumption of certain sets of users in order to reduce the load on the electrical system, especially at critical times of the day [
3]. The methodologies applied to the demand side basically aim to address actions related to energy efficiency, operational cost, self-production of electricity, and load management [
3,
6]. An effective DSM methodology provides desirable changes in customer load profiles and alters the maximum demand on the distribution network, regulating the customer’s electricity usage patterns, which can lead to lower energy tariffs in some cases [
4,
7].
Included within the DSM concept is demand response (DR), conceptualized as changes in electricity use by end users from their normal consumption patterns in response to changes in the price of electricity over time, or to encourage payments for less electricity use in times of high market prices or when system reliability is at risk, such as when feeders are overloaded, for example [
6,
8,
9]. DR strategies can increase the flexibility of a power system, minimize operating costs, increase system efficiency, control power market participation risks, reduce peak prices, and compensate for intermittence from renewable generators [
10]. In addition, DR programs are considered in long-term peak demand forecasting projects, with the objective of postponing investments in power grid expansions [
3,
11].
One of the DR-specific programs and the main contributor to demand-side management is load shifting, which can be understood as the shifting of demand on certain loads from peak periods to off-peak periods, with the objective of reducing the demand of feeders and substations during this interval, influencing the load curve behavior and reducing energy costs, as well as improving system reliability [
12,
13,
14]. The load shifting method can be implemented from controllable load adjustments on the customer side, in some cases without changing the electricity consumption [
13].
In rural feeders with the specific presence of irrigator customers, the load shifting strategy can be employed during off-peak demand periods, since loading problems in the lines and equipment of these types of feeders are identified more frequently during this period when compared to the traditional peak hour period. Thus, the application of demand-side management methodologies based on load shifting to this type of customer is essential to ensure the efficiency and reliability of the distribution system, especially during the harvest period of irrigated rice, where the highest levels of electric energy demand are registered.
The following subsections present, respectively, the proposed objectives and contributions of this article, a literature review of works employing load shifting strategies, and the structure of the article.
1.1. Objectives and Contributions
This article presents a methodology for demand-side management in rural feeders in southern Brazil with the presence of customers with high daily load variation, known as “irrigators”. The general objective of this study is to propose an alternative to reduce or mitigate the impacts caused by these customers in the operational aspects of distribution networks (overload, excessive loading, and transient problems), mainly during the period of the irrigated rice harvest. Thus, the proposed DSM model employs the load shifting strategy to reduce the maximum loading and the variation of the daily load curve of rural feeders in these regions.
In order to meet the general objective, this article has the following specific objectives:
Analyze and understand the characteristics of electricity use by irrigator customers;
Analyze and understand the behavior of the daily load profile of rural feeders during the periods of the irrigated rice harvest;
Define typical typologies of daily load to all customer classes of rural feeders;
Perform and analyze the power flow in rural feeders, from the elaboration of a power grid model that considers all the structural characteristics of these electrical systems, such as loads, lines, transformers, regulators, and switches;
Apply the load shifting strategy on irrigator customers to model the daily load curves of the rural feeders with a more uniform profile, with a more balanced load distribution throughout the day;
Define a mathematical optimization model for the load shifting strategy of irrigator customers;
Apply this model to a set of three rural feeders of a substation for the validation of the proposed DSM model;
Propose simulation scenarios considering weekdays, Saturdays, and Sundays of a given month of the year that comprises the irrigated rice harvest season.
The realization of the study was motivated by the relevance of irrigator customers in the distribution systems in southern Brazil. Thus, this paper makes the following contributions:
This paper presents an approach involving a type of customer that has been little studied in the literature. Specific studies involving customers who use electricity for irrigation activities in rice crops are found in the literature on a small scale. The main topics studied for these customers are related to energy efficiency and non-technical losses. In this context, our paper presents an innovative study involving this class of customer, where we develop a demand-side management methodology based on a load shifting strategy to mitigate problems of excessive loading and load variations in distribution systems located in rural areas for restricted periods of the year;
This paper presents a practical case study of innovative character involving distribution networks present in rural areas in southern Brazil. In the literature, in general, there are not many methodologies that involve studies related to this type of power system. Thus, this research contributes to the understanding and illustration of the characteristic behavior of the load profiles of distribution networks in rural areas for situations with high load concentration caused by irrigator customers. Another important aspect that will be evidenced in this study concerns the modeling of rural feeders for simulations in the load management model. The methodology proposed in this paper presents a network model developed in a computational platform based on real data regarding the main electrical characteristics of each distribution system, such as: loads, electrical equipment, lines, and typical load profiles of each customer.
The objective function associated with the optimization model applied to the load shifting strategy is authored by the authors. We used linear programming to formulate the problem. The optimization model involved demand data obtained by power flow calculation in the rural feeders and consisted in minimizing differences between the average loading of the distribution networks and the allocated demand in a given hour. The approach proposed in this study can correct the accentuated load variations of irrigator customers through a more balanced control and distribution of demand throughout the hours of the day, in order to maintain the load required by them;
The load management model proposed in this article can mitigate possible power supply interruptions in rural feeders due to the high demand and load concentration of irrigator customers. The load distribution of these customers during all hours of the day, as a result of the load shifting strategy, can guarantee the continuity of service in the electric system, benefiting both the irrigator customers, who will always have their demand satisfied, and the power utility, which will reduce costs with fines for unscheduled outages in the distribution networks.
The following section presents some works found in the literature related to load shifting strategies in the context of demand-side management and demand response.
1.2. Related Work
This section aims to present some relevant works found in the literature on studies of load shifting strategies inserted as part of demand-side management programs. The bibliographical research emphasized approaches used to solve or circumvent different operational problems in electrical systems, mainly during peak periods or with critical loading levels. Some studies also present proposals for minimizing the prices of energy tariffs in conjunction with the reduction in peak load levels in power systems, however, this topic will not be discussed in this paper. It is important to emphasize that, as a keyword in the search for related works in the literature, the concept of shifting demand was also considered as a specific DR program.
Thus, a brief contextualization of each work that makes up this literature review section will be presented, portraying the main topics and methods employed to perform the load shifting of a given case study. The load management methodologies discussed in this section are employed both in traditional electric systems and in the smart grid concept.
An approach to demand shifting of flexible residential loads is developed in [
15]. The proposed load management model takes into account the effect of the ordering of flexible loads to be shifted from the peak period to the off-peak period (lower demands to higher demands) from a simple mathematical formulation.
In [
16] a load shifting method represented in the form of an optimization problem to reduce peak demand and peak electricity cost in three microgrids is presented. The proposed DSM model is formulated by the hybrid particle swarm optimization algorithm with sinusoidal and cosine acceleration coefficient (H-PSO-SCAC), considering different individualized load typologies and distributed generation (DG) insertion. The model results indicated significant reductions in energy demand and cost during peak. Another load shifting model applied to smart grids is developed in [
17]. The load shifting strategy is performed by the backtracking search algorithm (BSA), and the methodology is applied to residential, commercial, and industrial customer groups, seeking to reduce the demand and the cost of energy during the peak period.
In [
18] a distributed algorithm is developed for the load shifting strategy in demand-side management in smart residential appliances. Game theoretic models are used to solve a residential load management problem and the Newton method employed to accelerate the convergence rate of the Nash equilibrium. The results obtained by the proposed DSM model pointed to reductions in energy consumption costs and daily peak demand. In addition, customer discomfort decreased significantly with the pattern of convergence to Nash equilibrium.
An approach involving storage systems is presented in [
19]. In this study, an optimization method is developed for storage systems to assist in the load shifting strategy in an electric system. The objective of the method is to reduce peak demand by dispatching the energy stored in the batteries. The results obtained by the model indicate the adequate shifting of the peak load of the system to periods with lower load. In [
20], a model for optimal dispatch of storage stations is proposed considering the peak load shifting strategy to improve voltage levels in a distribution network. The methodology is developed using a mixed integer linear programming (MILP) algorithm. The load management model provided a considerable reduction between peak demand and valley demand of a test system, and consequent improvements in the voltage level.
In [
21] a decentralized demand management approach is proposed to reduce peak demand and power cost in an industrial park by considering the integrated demand response of combined heat and power (CHP) units and thermal storage. The demand management model was formulated with an optimal power flow problem and solved in a distributed manner by the alternate direction method of multipliers (ADMM) algorithm. The results pointed to a significant reduction in both the industrial park’s peak demand and the energy purchased from the power utility.
In [
22] a load shifting model developed from the price elasticity technique in electric energy demand is presented. The methodology proposes tariff structures applied in real time in peak and off-peak periods. The results indicated a significant reduction in peak demand in a feeder with a predominantly residential profile in weekday and weekend conditions. An optimization method for load shifting considering the participation of load aggregators on a typical residential feeder with more than 25,000 customers is presented in [
23]. The load aggregators are modeled considering load dispatch and costs per capacity, electric power, and fines, and as constraints associated with the optimization problem, the characteristics of the residential loads are considered. The proposed optimization strategy reduced the peak demand of the feeder.
Table 1 gives an overall summary of the works covered in this literature review section.
Based on the information presented in
Table 1 and the thorough review of the studies covered in this section, it is highlighted that different load shifting methodologies have been developed. Currently, most of these works address the application of these strategies to reduce peak demand in power systems and electricity costs. It is important to note that the purpose of this article is not to assess the impacts on electricity tariff prices in the first instance, but only the application of a DSM model to circumvent the problems of excessive loading in rural feeders. A study considering the impacts on tariff structures is planned for a future article. Even though the papers mentioned in this section present electrical systems with different peak load periods in relation to the approach proposed in this research, the same demand adjustment concept of the load shifting strategy can be employed in the context of irrigator customers.
Still on the works found in the literature, one notices a great diversity of mathematical methods employed for the development of load shifting models, from simpler algorithms, involving only modeling and adjustments in the demand of electrical equipment, to more robust methods, involving optimization methods. As in this paper, some studies found in the literature have used optimization method approaches developed by the authors themselves. These are the cases of the methodologies developed in [
19,
23], largely applied to mitigate operational problems in power systems, especially during peak hours.
Another aspect in the literature review is the use of energy storage system resources in participating in load management models in some works, as presented in [
19,
20,
21]. However, this concept at the moment does not apply to the type of consumers evaluated by our study. Currently, the vast majority of irrigator customers present in the southern region of Brazil are not yet supplied or managed by energy storage devices. This may be related to a number of subsidies provided to this type of customer in their energy tariffs. In Brazil, customers who direct the use of electricity for irrigation activity during the dawn period receive discounts ranging from 60% to 90% of the total cost of energy tariffs and use of the distribution system [
24]. In addition, the high cost of batteries in Brazil is still a factor that hinders the adoption of energy storage systems by irrigator customers. However, a more significant presence of electrical energy storage systems for these consumers is expected in the near future, due to the sharp growth in the installation of photovoltaic plants to provide electrical energy to hydraulic pumping systems.
This article presents some points that differentiate it from the other approaches cited in this section. This study consists in the evaluation of a load shifting model in distribution networks composed of numerous high-demand customers in rural areas, who direct their electric energy to irrigation activities in restricted periods of the year. The papers found in the literature largely involve the analysis of load shifting of residential customers, in some cases in conjunction with other customer types or smart grid concepts.
Another aspect that differentiates this article from other works is related to the conduction of the load shifting strategy process. The idea of reducing peak demand and distributing this load to the other points of the feeder load curve is similar to the studied methodologies, however, at different time intervals. The rural feeders in southern Brazil have low peak hour consumption and demand during the irrigated rice harvest, due to the fact that peak tariffs are much higher than those in the off-peak period. Thus, the load profile of these feeders presents valleys during the peak hours of the electrical system and high demand during the other hours of the day, unlike a predominantly residential power grid.
1.3. Article Structure
This article is structured in four sections, as described below.
Section 1 covers a general introduction to the theme, as well as a review of the literature regarding studies of load shifting strategies inserted as part of DSM programs employed for analysis in several segments of the electric systems.
Section 2 describes the methodology proposed for demand-side management of rural feeders, describing all the steps involved in the respective model.
Section 3 presents the case studies and the results obtained by the proposed methodology. Finally,
Section 4 presents the final considerations about the study, as well as proposals for future works.
2. Methodology
As mentioned in the previous section, the demand-side management model proposed in this study consists in applying a load shifting strategy in rural feeders in the southern region of Brazil. The methodology will be employed specifically to customers that direct the use of electricity for irrigation activities in some months of the year, known as “irrigators”. The central objective of this model is to reduce or mitigate some impacts caused by these customers in the electrical systems during the harvest season, such as the maximum demand on distribution networks and the high demand variations in the daily load profiles of these feeders. Thus, with the application of this demand management model, it is intended to model the daily load curve of the rural feeders with a more uniform profile, with a more balanced load distribution throughout the hours of the day. These results can collaborate to reduce the distribution network load levels in more critical periods and mitigate the variation of the daily load curve.
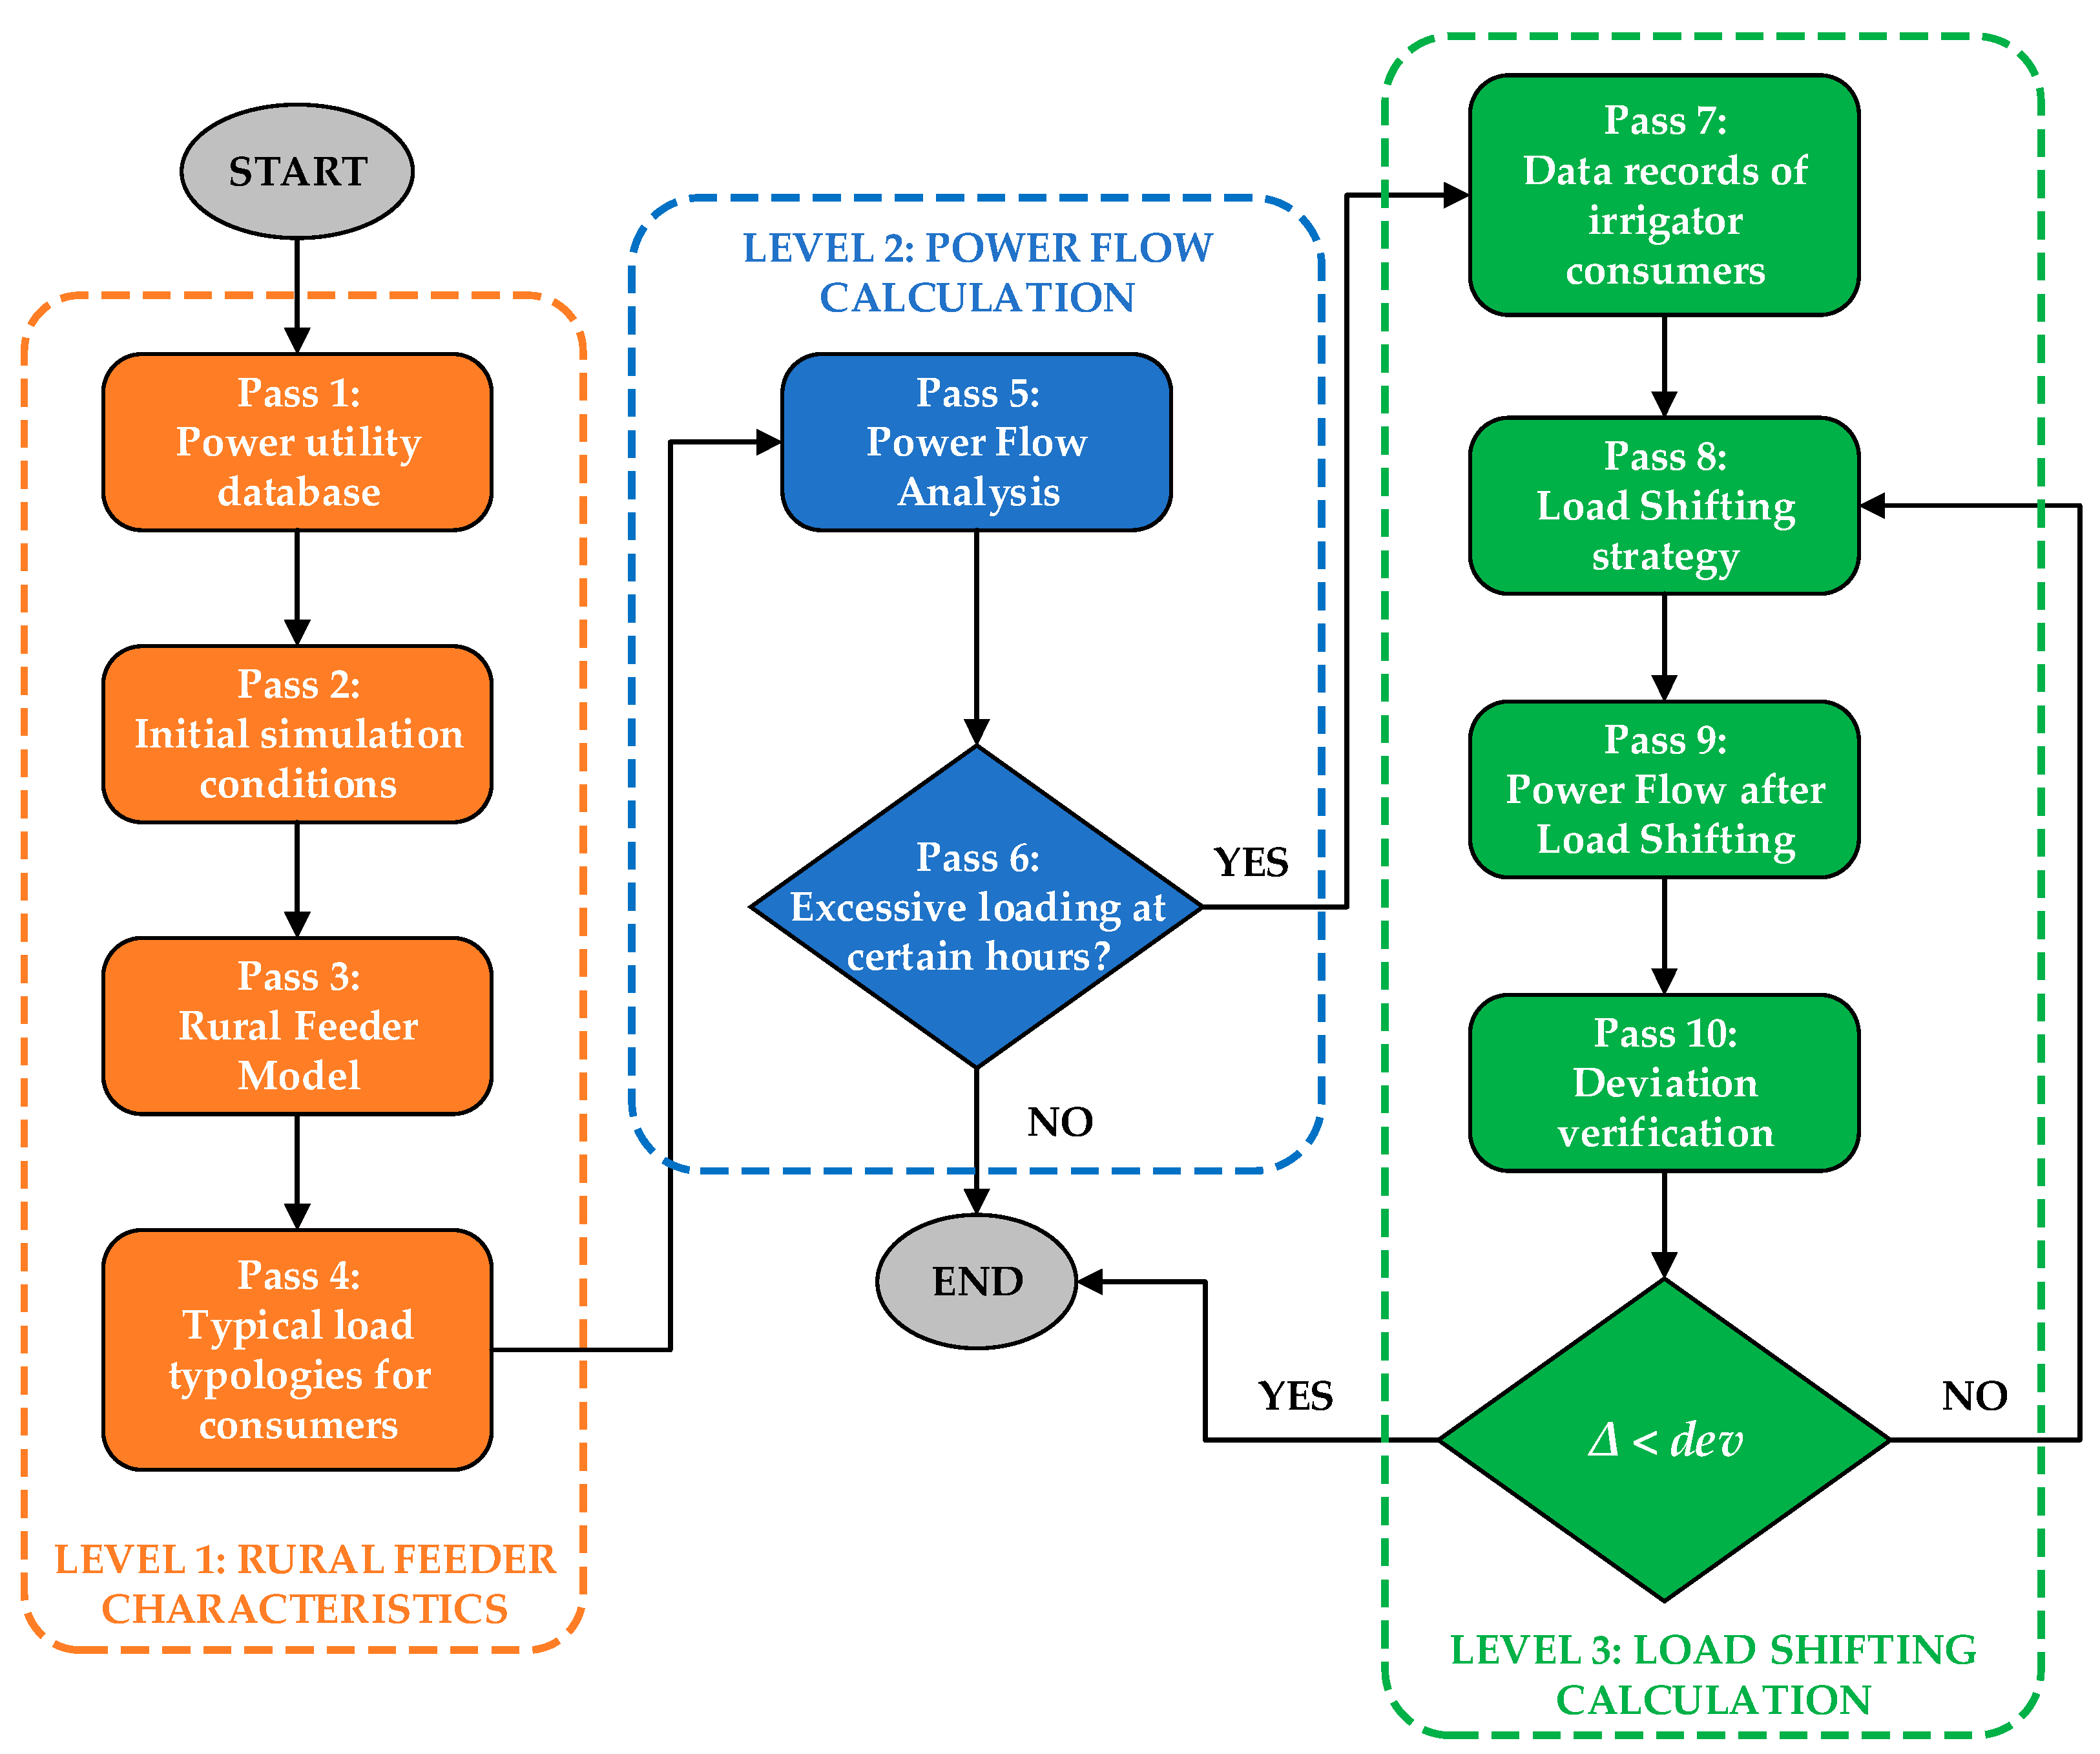
The demand management methodology illustrated in
Figure 1 is structured in three hierarchical levels: (i) rural feeder characteristics; (ii) power flow calculation; and (iii) load shifting calculation. Each hierarchical level involves a set of steps or stages that function sequentially in the execution of the methodological process.
The DSM model proposed in this study requires, as input data, information regarding the composition of rural feeders, such as network structures, equipment, and installed loads. The methodology is developed from an algorithm written in Python 3.10, idealized in a computational tool characterized as an integrated development environment (IDE), where the model’s input data are processed to execute a sequential architecture divided into a certain number of steps to execute the load shifting strategy in the rural feeders.
Figure 2 presents a flowchart containing the structural architecture of the proposed demand management methodology and its respective steps.
The detailed power flow studies (Level 2), because they are real power grid data, are too extensive to be reported in the article in the form of numerical examples. “Level 1” indicates the result of pre-processing the initial conditions of the rural feeders. The numerical results of “Level 3” are presented in aggregate in
Section 3, which deals with the case studies and results obtained from the research.
Step 1 consists in reading the power utility’s database, from which the main electrical information of the rural feeders to be evaluated by the DSM model will be extracted, such as buses, low-voltage loads, medium-voltage loads, lines, transformers, and regulators. Step 2 is the definition of the initial conditions for simulating the rural feeder. In this step, the following model simulation intervals will be established: monthly (January to December) and daily (weekday, Saturday, or Sunday). Step 3 is the construction of the power grid model based on the information extracted from the database in Step 1 and the simulation intervals defined in Step 2. Step 4 aims at defining the typical load typologies for each customer present at the rural feeder, based on the consumption classes defined in the power utility’s database. These steps comprise Level 1 of the methodology, called “Characteristics of the rural feeder”.
Level 2 is initiated by Step 5, where the power flow calculation is performed on the rural feeder to check the load conditions and obtain the resulting daily load profile of this system. Step 6 checks the load levels in all hourly intervals of the result obtained by Step 5. If the rural feeder shows excessive load at certain hours, the methodology goes to the next step, where the load shifting calculation procedures are started on this feeder. Otherwise, the algorithm is terminated.
Level 3, which represents the structure of load shifting calculation in the rural feeder, is initiated by Step 7, where all the information regarding the total demand of the irrigator customers in the distribution network is extracted. Step 8 consists in applying the load shifting strategy to the irrigator customers defined by the previous step, where the resulting total demand will be shifted at different times of the day through a mathematical optimization formulation devised by a linear programming (LP) algorithm. In Step 9 the power flow on the rural feeder will be executed again after the applicability of the load shifting strategy on the irrigator customers proposed by Step 8. Finally, in Step 10, the total demand deviation resulting from Steps 8 and 9 will be evaluated. If the deviation is greater than the maximum load delta (Δ), the algorithm is finished, and thus the final DSM model response for the evaluated rural feeder is set. Otherwise, the algorithm returns to Step 8, and a new load shifting calculation is performed on the distribution network, modifying its boundary conditions.
The problem that was addressed in this methodology has characteristics that require adaptation of classical approaches in the literature regarding load shifting strategy. Most traditional methodologies address the problem of load shifting on specific electrical equipment or small sets of loads at certain time intervals. The approach proposed in this paper is employed for customers with high levels of extremely concentrated demand, the irrigator customers, throughout all hours of the day. Furthermore, since this research is on a load flow problem and at the same time a consumption increase redesignation problem (load shifting), this needed to be carried out based on a hybrid approach, that is, this approach is not only based on load flow or optimization, but a tool that needs the two stages to work together, since the results obtained with power flow in rural feeders are needed as input data for the load shifting strategy for irrigator customers.
In the following subsections, the three hierarchical levels of the demand-side management methodology applied to rural feeders will be contextualized.
2.1. Level 1: Rural Feeder Characteristics
The definition of the rural feeder characteristics is fundamental for the execution of the DSM model’s upper levels. This information is essential to determine the power flow of the distribution network and thus verify time intervals with possible occurrences of overloads in the feeder. If affirmative, the DSM model will apply the load shifting strategy to irrigator customers, in order to circumvent these problems with a more balanced distribution in the demand of these loads in all hourly intervals of a day.
Thus, for a better understanding of the steps involved in the process of defining the rural feeder characteristics, a complete description of each step will be presented in this subsection, except for the initial conditions stage, which consists only in defining the monthly and daily simulation periods.
2.1.1. Power Utility’s Database
The input data for the DSM model were extracted from a georeferenced database of a power utility in southern Brazil. This set of information is called, by ANEEL, the Power Utilities Geographic Database (Base de Dados Geográfica da Distribuidora (BDGD) in Portuguese) and includes several references about the electrical characteristics of each substation managed by a specific power company [
25].
From a previous visualization of this information, it can be stated that the elements of the database can be divided into two groups: primary and secondary. The primary data correspond to the physical elements of the distribution network (lines, electrical equipment, and loads), while the secondary data are the attributes linked to the primary data, that is, the set of technical information of each element. Examples of primary data are the loads connected to the feeder, which comprise secondary data, the demand and consumption records for a 12-month period, total installed active power, load model, number of phases, among others. The electrical parameters present in the power utility’s database refer to the year 2020.
Table 2 presents the primary data and their respective secondary data selected for the analyses in the DSM model.
2.1.2. Rural Feeder Model and Typical Load Typologies for Customers
The rural feeder model is idealized from the transformation of the information of the elements extracted from the power utility’s database into structured files in standardized lines of code in the Open Distribution System Simulator (OpenDSS). This platform is an important tool for analysis and simulation of distribution systems on a permanent basis. The extension of the modeled files for the feeder is in the standard “DSS”. The conversion process of the model data is performed in an IDE environment developed in the Python language.
Figure 2 illustrates the electrical data modeling process of the rural feeder for the OpenDSS platform.
Some parameters required by OpenDSS were not in the power utility’s database. In the case of transformers, there was no reference about the transformer’s TAP adjustment, so a unitary value was assigned for each equipment. For loads, the attributes of minimum (Vminpu) and maximum (Vmaxpu) voltage per unit value were defined according to the Electricity Distribution Procedures in the Brazilian Electricity System (Procedimentos de Distribuição de Energia Elétrica (PRODIST) in Portuguese), which establishes that voltage levels must remain between 93% and 105% of the system’s reference voltage (220 V) [
26]. Thus, the attributes of Vminpu and Vmaxpu were parameterized with values of 0.93 and 1.05, respectively. The power factor was taken as 0.92 for all the loads of the feeder.
The daily load curves associated with each customer type were developed based on studies conducted on the behavior of consumption and demand of electricity for each customer class. In addition, information obtained from the power utility would assist in the elaboration of these typical typologies. In
Figure 3,
Figure 4,
Figure 5,
Figure 6 and
Figure 7 are presented the typologies of the typical daily profile for residential, commercial, industrial, public lighting, and rural irrigators customers, under weekday, Saturday, and Sunday conditions.
With the definition of the typical typologies for each customer, the maximum daily demand of these customers can be calculated. For this, the reference month of the analysis must be considered, as well as the load factor and the interval of hours of the month. The value of the load factor is obtained by the average between the values per unit of the typology associated with each customer. The equation that describes the maximum demand of a customer is presented below. The original expression is shown in [
27].
where:
Dem: Maximum customer demand;
Cons: Energy consumption of the user during the reference month;
LF: Load factor;
h: Number of hours in a month (730 h considering a 30-day period).
It is important to note that, even though the focus of this study is on irrigator customers, all the information related to the other customers is needed to calculate the load flow in the distribution network. Thus, after defining all the parameters of the power grid model, the next step is to calculate the power flow on the rural feeder.
2.2. Level 2: Power Flow Calculation
OpenDSS is designed to calculate power flow specifically for distribution systems, employing both a complete and simplified positive-sequence multiphase circuit model [
28]. For this study, the full multiphase model is considered, where each circuit element is represented with a vector of a matrix [
29].
Power flow can be run by OpenDSS in various solution modes, including the standard single Snapshot mode, Daily mode, Dutycycle mode, Monte Carlo mode, and various modes where the load varies with time [
28]. The solution mode adopted by this methodology is Daily mode, where the distribution network circuit is solved following a daily load. In this simulation mode, the loads are modified by annual growth, time of day, and global load multiplier. The standardized simulation step is 1 h over an interval of
n hours (in this case, 24 h).
The power flow solution by OpenDSS is performed iteratively, considering the loads of the electrical system as sources of active and reactive power injection. The iterative power flow algorithm adopted for the simulations of this study is the “Normal” mode of current injection. This algorithm is a simple fixed-point method with accurate answers for solving power flow in distribution systems, and is as robust as the traditional Newton [
28].
Once the mode and iterative simulation algorithm are defined, the power flow in the rural feeder will be calculated by OpenDSS, from a program developed in Python, idealized by an IDE. After that, the loading conditions and behavior of the resulting daily load curve will be observed to verify if it is necessary to apply the load shifting strategy in this feeder.
The criterion for the application of the load shifting strategy on the rural feeder is based on the value of the loading of this distribution system at certain hours (usually at times considered critical). If the value of the load is greater than 65% of the excess load limit in the distribution network at any given time, the methodology changes the level of load shifting calculation at the rural feeder. Otherwise, the process is finished, and the daily load profile of the distribution network obtained by the load flow calculation is maintained as the final answer. The parameterization of the maximum loading limit will be employed only in this step, and will not be used in the later steps of the methodology. The percent tolerance for overload condition is a personal choice of the authors.
2.3. Level 3: Load Shifting Calculation
The initial step in the load shifting calculation for the rural feeder consists in extracting the information regarding the contribution of irrigator customers to the total demand of the distribution system. In this way, the daily load curve and the individualized demand values for rural irrigator customers at each hour of the day can be defined, and then the load shifting strategy can be applied to the rural feeder.
The objective function associated with the optimization model employed in the load shifting strategy for irrigator customers is the authors’ own work, however, the optimization applied to it is a simple computational tool. The proposed optimization problem establishes a load control design for these consumers, guaranteeing that their demand is met, even with the changes imposed by the model in their load patterns, contributing to better loading conditions in the power grids. The main difference of this model in relation to other articles found in the literature is in the area of study, as it works with a type of consumer that has been little studied, i.e., irrigator customers. In this case, the problem is not only the displacement of equipment with small loads, such as household appliances or residential heating systems, but a set of loads with high levels of extremely concentrated demand, such as in the irrigation systems. Thus, this process changes the load patterns not only from the customer’s point of view, but also for the entire distribution system in general.
The proposed load shifting model is a linear programming problem, where the objective is to minimize differences between the average load of the feeder and the allocated demand at a given hour of the day. The respective optimization problem is inherently multiobjective, since it seeks to develop the load shifting in a way that limits the scope to affect as few customers as possible.
The optimization model applied to the load shifting strategy seeks to adjust the profile of electrical energy demand of irrigator customers as close as possible to the average demand. For this, allocations will be made in the individual demand of irrigator customers, aiming to make the distribution of these loads more balanced on the feeder during 24 h. This mathematical model considers as inputs, the average of the existing load curve of the irrigator customers presents in the rural feeder, the total demand of each customer in a 24 h period, the set of irrigator customers, and the set of hours in a day.
The optimization model was solved with the GNU Linear Programming Kit (GLKP), a public domain solver for large-scale linear programming problems. Model input data were aggregated with the equations (constraints) through Python programming and invoked to solve the optimization model based on the Python interface with the GLKP solver. In this way, the target load curves are obtained and returned to the consumers to have a daily load control schedule. The objective function (
z) and the respective constraints that describe the proposed linear programming problem for load shifting of rural irrigator customers in the DSM model are described below.
z: Objective function;
MED: Mean value of feeder load curve;
DEMch: Customer demand c at hour h;
C: Customer group, c ∈ C;
H: Number of hours in a day, “h” ∈ H;
ach: Variable to define the demand allocation of customer c at hour h;
dh: Total demand allocated in hour h;
difgh: Difference between total demand allocated in hour h and MED;
diflh: Difference between the MED and the total demand allocated in hour h;
dergch: Deviation between the demand allocated to customer c at hour h and the current demand;
derlch: Deviation between current demand from customer c at hour h and allocated demand;
α: Weighting between deviation and adjustment, α ∈ [0, 1].
The weighting between the deviation and the demand adjustment of irrigator customers (α) is one of the mechanisms that accounts for the multiobjective nature of the optimization problem. Moreover, the weighting index is essential to the final answer of the load shifting mathematical model. The optimization model proposed for this methodology presents, as a final answer, the new hourly demand resulting from the load shifting process in the rural feeder from each irrigator customer.
The next step is to calculate again the power flow in the rural feeder. For this, the maximum demands and the daily load curves for each irrigator customer present in the distribution network will be adjusted, according to the new daily demands obtained by the load shifting model. It is important to emphasize that there will be no changes in the other loads and equipment present in the rural feeder. The demand alterations occur only in the loads classified as “irrigators”.
The last step involved in the load shifting process for irrigator customers concerns the verification of the demand deviation at the rural feeder. The deviation indicates the total value between the absolute difference between the real demand and the allocated demand at the feeder, considering the 24 h period. For the analysis to be valid, and the process to be terminated, the deviation must be greater than a load delta (Δ), which is related to the absolute difference in the feeder load between the value calculated by the load flow and the value calculated after the load shift optimization process over all 24 h. The central idea of this condition is to guarantee convergence in the case where the same irrigator customers are always chosen for the demand shifting. If this condition is not satisfied, the methodology performs a new load shifting calculation with modification in its boundary conditions. The following equation describes the demand deviation verification of the rural feeder.
where:
dev: Demand deviations in the rural feeder;
Δ: Rural feeder load delta;
SIPFh: Initial power flow of the rural feeder at hour h;
SLSPFh: Load shifting power flow of the rural feeder at hour h.
If the condition presented in Equation (12) is satisfied, the process is finalized and the DSM model presents the final result of the power flow in the rural feeder with the application of the load shifting strategy in irrigator customers.
In the following section, the case studies and results obtained in a set of distribution networks from the application of the demand management methodology proposed by this study will be demonstrated.
3. Case Studies and Results
The case studies were conducted on three rural feeders located in a city in southern Brazil. These distribution networks belong to the same substation, and have a significant number of customers that direct their electricity use to agricultural production, mainly for irrigation of rice crops in some months of the year. For the case studies, the three distribution systems are named Rural Feeder A, Rural Feeder B, and Rural Feeder C, respectively.
Figure 8 shows the circuits of each rural feeder, and
Table 3 presents the technical features of each distribution network.
According to the characteristics presented in
Table 3, it can be seen that rural feeders are robust and extensive networks, with numerous customers and electrical equipment.
The case study simulations were performed in three different daily periods: weekday, Saturday, and Sunday. The monthly period adopted for the analyses was January, because this month presents the most representative demand values during the irrigated rice harvest season. With the simulation conditions set, the power flow on the rural feeders can be run.
In addition, the definition of maximum load limits for each rural feeder is an important aspect of the power flow analysis. The maximum load limits on each distribution network were defined based on the nominal power rating of the substation’s transformer and the total power flow at the substation under nominal load conditions. According to the power utility’s database, this substation contains a transformer with a nominal apparent power rating of 25,000 kVA. In turn, the total power flow of the substation is determined by the sum of the individual flows at each feeder. The substation is composed of three more distribution systems, in addition to the three rural feeders chosen for the case studies in this study. With this, it is possible to determine the percentage representativeness of the power flows of each distribution system in relation to the total substation load and thus determine the maximum apparent power capacity that the power transformer has to serve each feeder and the maximum limits for the overload condition of the distribution networks.
It is important to mention that these load conditions vary according to the time interval, i.e., feeders have different load limits according to the hour of the day. As mentioned in
Section 2, the feeder is considered to be overloaded when this value is greater than 65% of the maximum capacity allowed by this electrical system.
Figure 9 demonstrates the maximum daily limit curves for the excessive load condition on the rural feeders employed as a case study in this study for the periods of (a) weekday, (b) Saturday, and (c) Sunday.
The reason for the excess loading limit of the Rural Feeder C being higher than the distribution networks A and B during the interval from 18:00 to 22:00 is related to the load proportion of this feeder in relation to the total substation loading, especially in weekday conditions. The Rural Feeder C has a higher load representation between 18:00 and 22:00 in relation to the other two feeders, and therefore a higher availability of the substation transformer to meet its load demand. On the other hand, the Rural Feeder C has lower substation load percentages compared to power systems A and B in the other hourly intervals, and therefore much lower excess loading limits. These circumstances explain the difference in the behavior of the excessive loading limits curve of Feeder C compared to the other distribution networks, especially in the hourly interval between 18:00 and 22:00.
As mentioned before, the definition of the maximum daily limits for establishing the condition of excessive loading on rural feeders is essential for the structure of the DSM model, because it is for the evaluation of this parameter that it is necessary to apply the load shifting strategy on irrigator customers in the distribution network. In all scenarios, a weighting index of 80% (α = 0.8) will be considered for the load shifting strategy. The definition of this percentage is a personal choice of the authors.
In this context, the following subsections present the analysis and results for each of the rural feeders.
3.1. Case 1: Rural Feeder A
The first case study refers to the application of the DSM model at the Rural Feeder A, whose technical characteristics are described in
Table 3.
Figure 10 presents the result of the daily loading of the distribution network obtained by the power flow calculation for the periods of (a) weekdays, (b) Saturdays, and (c) Sundays during the month of January. In addition,
Figure 11 also illustrates the excess loading limits for the feeder for the different daily periods.
From the results presented in
Figure 10, it can be seen that the load profile of the Rural Feeder A is extremely influenced by the particularities in the use of electric energy by irrigator customers. For the weekday period, there are valleys during the traditional peak hours of the electric system and higher load levels during the other hours, mainly in the interval between 8:00 and 17:00. For the other daily periods evaluated, the feeder load profile follows the behavior of the load typologies of irrigator customers, presented in
Figure 7.
Evaluating the loading conditions of the Rural Feeder A, it is possible to verify that in the weekday period excessive loading limit violations occurred in some intervals. The other daily periods did not present transgressions. Thus, according to the criterion defined by the methodology, the load shifting strategy for irrigator customers will be employed only in the weekday condition.
Table 4 describes the violations presented in the excessive load limits for the Rural Feeder A.
The excessive loads presented in this distribution network are directly related to the high demand required by irrigator customers. Normally, intensive irrigation on rice crops comprises the morning and afternoon hours. Thus, it is understandable that the rural feeder presents some points with excessive loading during this interval.
Figure 11 illustrates the load distribution between irrigator customers and other customer types (low-voltage loads, public lighting loads, and others) for each hourly interval of the daily load curve of the Rural Feeder A during weekday periods.
From
Figure 11, it is possible to observe the high contribution of irrigator customers compared to the other loads in the composition of the apparent power profile of this rural feeder at all hours. These results confirm the relevance of this type of customer for the power utilities, especially during the months that make up the harvest interval of irrigated rice, where the highest values of loading on the rural distribution network are registered.
As presented in
Section 3, which deals with the methodology proposed for this study, the initial step in applying the load shifting strategy to irrigator customers is to determine the total demand profile of these customers in the distribution system. In order to visualize this information,
Figure 12 presents the daily total demand profile for the set of irrigator customers present at the Rural Feeder A.
The Rural Feeder A comprises a total of 54 irrigator customers. The daily demand profile of the irrigator group is very similar to the feeder load curve. This result was expected due to the daily load of irrigator customers being much higher compared to the other loads, as shown in
Figure 11. In addition to the demand profile,
Figure 12 presents the average demand value (2415.64 kW) of the irrigator customer group for the 24 h. This variable is essential for the allocation of demand from irrigator customers during the optimization process of the load shifting strategy in the rural feeder.
Figure 13 presents the result of the demand profile of the Rural Feeder A irrigator customers obtained with the application of the load shifting optimization model.
Figure 14 illustrates a comparison between the original and the shifted demand profiles.
From the results presented in
Figure 13, it can be seen that the demand resulting from the load shifting in irrigator customers was close to the value of the average demand (2415.64 kW) in practically all hourly intervals. In addition, when compared to the original profile (
Figure 14), the load shifting made the demand distribution of the irrigator customers more balanced on the feeder, considerably reducing the maximum demand during more critical hours and performing compensations in periods with low load utilization. The total demand shift for the 24 h at the Rural Feeder A was 12,875.11 kW.
Through the results obtained by the load shifting optimization model, the maximum demands and the load typologies of each irrigator customer of the Rural Feeder A were adjusted, and from that, the new power flow in this distribution system was calculated. Thus,
Figure 15 presents the daily load in the Rural Feeder A before and after the load shifting in the irrigator customers for the weekday period in January.
Based on the results presented by
Figure 15, the load shift in irrigator customers provided a reduction in the maximum apparent power of this rural distribution network, besides decreasing the load at various hours. Another important aspect to be considered is the significant reduction in the variation of the daily load curve in relation to the previous profile.
Table 5 presents a summary of load shifting application for the Rural Feeder A case study.
According to the information presented in
Table 5, the load shifting optimization model for irrigator customers met the demand deviation criterion for Rural Feeder A, presenting a load delta of 6348.82 kVA. Thus, the daily loading presented in
Figure 15 indicates the final consolidated response of the DSM model for Rural Feeder A.
3.2. Case 2: Rural Feeder B
The second case study proposed consists in applying the DSM model to the Rural Feeder B.
Figure 16 illustrates the initial loading of the feeder during the month of January for the conditions of (a) weekdays, (b) Saturdays, and (c) Sundays. In addition,
Figure 16 also presents the excess loading limits on this distribution network for the different daily periods.
As in the previous case study, this feeder is also influenced by the irrigator customers’ particularities, presenting a high variation in its load profile, mainly for the weekday period. Observing the feeder loading, it is noted that there were violations of the excessive load limits only in the weekday period. Thus, in a manner equivalent to the Feeder A case study, the load shifting strategy was employed only in the weekday condition for this distribution network.
Table 6 reports the transgressions presented in the excessive load limits for the Rural Feeder B.
As mentioned before, excessive loadings presented in this rural feeder are directly related to the high demand of irrigator customers.
Figure 17 presents the load distribution between irrigator customers and other types of customers (low-voltage loads, public lighting loads, among others) for each hour interval of the load curve of the Rural Feeder B during weekday periods.
From the results presented in
Figure 17, it is possible to observe the significant contribution of irrigator customers in the composition of the daily load of the Rural Feeder B. When compared to the previous case study, the apparent power resulting from irrigation customers is slightly higher, since this distribution system presents a larger number of irrigator customers and a much smaller number of low-voltage loads.
Figure 18 presents the daily total demand profile for the set of irrigator customers present at the Rural Feeder B.
The Rural Feeder B comprises a total of 57 irrigator customers. As expected, the daily demand profile of the irrigator customer group is very similar to the feeder load curve due to the conditions presented in
Figure 17. In addition to the demand profile,
Figure 18 presents the average demand value (2364.03 kW) of the irrigator customer group for the 24 h. As previously mentioned, this variable is fundamental for the allocation of the demand of irrigator customers during the optimization process of the load shifting strategy in the rural distribution network.
Figure 19 presents the demand profile of the irrigator customers from the Rural Feeder B obtained with application of the load shifting optimization model.
Figure 20 presents a comparison between the original and shifted demand profiles.
The results presented in
Figure 19 indicate that the demand profile resulting from the optimization process of the load shifting strategy for irrigator customers was below the average demand (2364.03 kW) at all points. Another important aspect to be emphasized is the presence of small valleys in the shifting demand profile at 2:00 and 23:00. The presence of the valleys in the shifted demand profile can be explained as the way the optimization process found to guarantee the level of load for all irrigator customers considering the defined simulation horizon and the demand allocation constraints established in the proposed load shifting optimization model.
The comparison between the two profiles (
Figure 20) corroborates that the load shifting strategy made the demand distribution more balanced on the feeder, considerably reducing the maximum demand during more critical hours and performing compensations in periods with low load utilization. The total demand deviation shift for the 24 h at the Rural Feeder B was 10,429.28 kW.
Figure 21 presents the daily loading at the Rural Feeder B before and after the application of the load shifting strategy for the irrigator customers for the weekday period in January.
As in the previous case study, the load shifting for irrigator customers provided a reduction in the maximum apparent power of this rural feeder, besides reducing the loading for several hours. As for the behavior of the network load profile after the load shifting, a uniform condition is observed throughout the daily period.
Table 7 presents a summary of load shifting application for the Rural Feeder B case study.
According to the information presented in
Table 6, the load shifting optimization model met the deviation demand criterion for the Rural Feeder B, presenting a load delta of 236.71 kVA. Thus, the daily load shown in
Figure 21 indicates the final consolidated response of the DSM model for the respective feeder.
3.3. Case 3: Rural Feeder C
The third and last case study consists in the application of the methodology in Rural Feeder C.
Figure 22 presents the initial loading of the feeder during the month of January for (a) weekday, (b) Saturday, and (c) Sunday conditions. The excessive loading limits on this rural feeder for the different daily periods are also shown in
Figure 22.
As in the previous case studies, the Rural Feeder C also has a load profile based on the particularities of irrigator customers, presenting a high load variation and more accentuated loading levels in some hours of the day, mainly during the weekday period. According to the results presented in
Figure 22, it can be seen that there were violations of the excessive loading limits only in the weekday period. Thus, as in the previous case studies, the load shifting strategy will be applied only in the weekday condition for this distribution network.
Table 8 describes the transgressions of the excessive loading limits for the Rural Feeder C.
The excessive loads presented in this rural feeder are directly related to the excessive demand of irrigator customers.
Figure 23 shows the load distribution between irrigator customers and other types of customers (low-voltage loads, public lighting loads, among others) for each hour interval of the load curve of Rural Feeder C during weekday periods.
From the results presented in
Figure 23, one can notice the excessive contribution of irrigator customers in the composition of the daily load of the Rural Feeder B for the weekday period in January. It is important to highlight that this distribution system presented a higher contribution for low-voltage loads compared to the previous systems, mainly during the traditional peak hours period.
Figure 24 shows the daily total demand profile for the set of irrigator customers present at the Rural Feeder C.
The Rural Feeder B has 54 irrigator customers. As in the previous case studies, the daily demand profile of the irrigator customers is very similar to the feeder load curve due to the conditions presented in
Figure 23. In addition to the demand profile,
Figure 24 presents the average demand value (2106.56 kW) of the irrigator customer group for the 24 h. As mentioned in the previous subsections, this variable is fundamental for the demand allocation of the irrigator customers during the optimization process of the load shifting strategy in the rural feeder.
Figure 25 presents the result of the demand profile of irrigation customers with the application of the load shifting optimization model in the Rural Feeder C.
Figure 26 presents a comparison between the original and shifted demand profiles.
From the results presented in
Figure 25, it is possible to observe that the demand resulting from load shifting of irrigator customers was approximate to the average demand (2106.56 kW) in all hourly intervals. In addition, when compared to the original profile (
Figure 26), the load shifting strategy provided a more balanced demand distribution for irrigation customers, considerably reducing the maximum demand during critical hours and compensating for low load utilization periods. The total demand deviation shift for the 24 h at the Rural Feeder C was 6090.38 kW.
With the adjustments in the maximum demands and the load typologies of each irrigator customer of the Rural Feeder C, the new power flow was calculated.
Figure 27 shows the daily loading on the Rural Feeder C before and after the application of the load shifting strategy for the irrigator customers for the weekday period in January.
As in the previous case studies, the load shifting for the irrigator customers provided a reduction in the maximum apparent power of this rural feeder and the power grid loading at various hours. In addition, the variation of the daily load curve was markedly reduced compared to the initial profile. However, one can notice the presence of a peak load between 19:00 and 21:00, and consequently a change in the feeder’s load curve behavior to a more residential profile. This variation in the load profile occurs due to the very high number of low-voltage customers connected to this distribution network.
Table 9 presents a summary of load shifting application for the Rural Feeder C case study.
Based on the information presented in
Table 9, the load shifting optimization model met the demand deviation criterion for Rural Feeder C, presenting a load delta of 121.84 kVA. Thus, the daily loading presented in
Figure 27 indicates the final consolidated response of the DSM model for the respective rural distribution network.
4. Conclusions
This article presented a study of demand-side management in three rural feeders located in southern Brazil, employing the load shifting strategy exclusively for irrigator customers. The purpose of developing the demand response model proposed by this article was to reduce the maximum load on the distribution networks and the variations in the daily load profile of rural feeders. The study was motivated by the importance of this type of customer in the distribution systems present in this region.
The load shifting strategy was mathematically modeled by a linear programming function. This optimization algorithm was preferred due to the large number of restrictive conditions involved in this problem, and because it is an easy method to implement and has an efficient answer. Besides this, the objective function proposed for the load shifting strategy is innovative.
The article covered an interesting topic regarding loading conditions in distribution systems. In this study, maximum limits were established for excessive load conditions in rural feeders based on total load and substation load availability for each hour of the day. The results obtained through this reliably demonstrated the difference in behavior in each distribution network according to the load conditions established at a given hour. This parameter was used to define the need to use a load shifting strategy for irrigator customers. The excess load limits were violated only in weekday conditions. In the other daily periods, there were no violations of the excessive load limits on the three feeders. The reason for these distribution systems not presenting excessive load conditions on Saturdays and Sundays may be related to the reduction of intensive irrigation and lower demand loads during the weekends.
The results achieved with the application of the DSM model in rural feeders were satisfactory. For the three case studies, there was a reduction in the maximum loading of the distribution networks, as well as the attenuation of the variability of the daily load profile of the electrical systems and a more balanced distribution of the demand of irrigator customers for all hours of the day. In addition, in all scenarios, the demand deviation criteria were met, without the need to modify the boundary conditions of the load shifting strategy for irrigator customers.
The rural feeders evaluated as case studies in this methodology present the same particularities in the use of electricity, especially in the months that comprise the period of the irrigated rice harvest in the southern region of Brazil. With this, the three rural feeders ended up presenting very similar results in their load profiles, due to the relevance of irrigator customers in relation to other customers. This characteristic is very common in distribution systems present in rural areas of these regions. In addition, the analyses were restricted only to the weekday period, since in the other periods there were no violations of the excessive load criteria established by the proposed load management model for irrigator customers, contributing to the lack of diversity in the load profiles on the rural feeders for the three case studies. However, these conditions do not compromise the relevance and importance of this study, because the proposed DSM model presented significant reductions in the maximum demand and daily load variations of the rural feeders in weekday periods for the three scenarios studied.
From this study, we can state that the main benefit that this DSM model can provide to irrigator customers, in the first instance, concerns the conservation of adequate power supply quality standards under conditions of high load concentration on the distribution networks, especially during the rice harvesting season in this region. The distribution system needs to involve a load balance, because it may not have sufficient capacity to meet all the demand involved in situations with high levels of load intensity, since irrigator customers represent volatile, aggregated, highly concentrated loads with large demand peaks. Due to this, the distribution of this load throughout the day is extremely important to ensure that the power supply is not interrupted due to possible overload problems in the networks. Thus, the changes in load patterns proposed by this DSM model can benefit the irrigator customer in this respect.
The initial results generated by the DSM model proposed in this study may in the future support the power utilities regarding the problems of daily load variations and excessive loading present in rural feeders in some periods of the year, especially at the time of intensive irrigation activity of rice crops. Of course, this methodology needs some improvement, but the initial results presented in this article are promising for future analyses involving these types of customers.
Future studies are expected to consider the impact of energy tariffs on irrigator customers with the application of the load shifting strategy, evaluate the compliance of these customers in adhering to the demand management model, provide other simulation scenarios with the percentage variation of the load shifting weighting index, and apply this methodology to other rural feeders. All these topics can take into consideration the proposal to reduce the maximum loading of rural feeders and minimize the sharp daily load variations provided by irrigator customers. In addition, we intend to consider approaches involving artificial intelligence.


 ,
, 


