
Performance Monitoring Algorithm for Detection of Encapsulation Failures and Cell Corrosion in PV Modules

Abstract
:1. Introduction
1.1. Photovoltaic Monitoring and Diagnostic Mechanism for Predictive Fault Detection
1.2. Fault Detection Mechanisms
2. Methodology
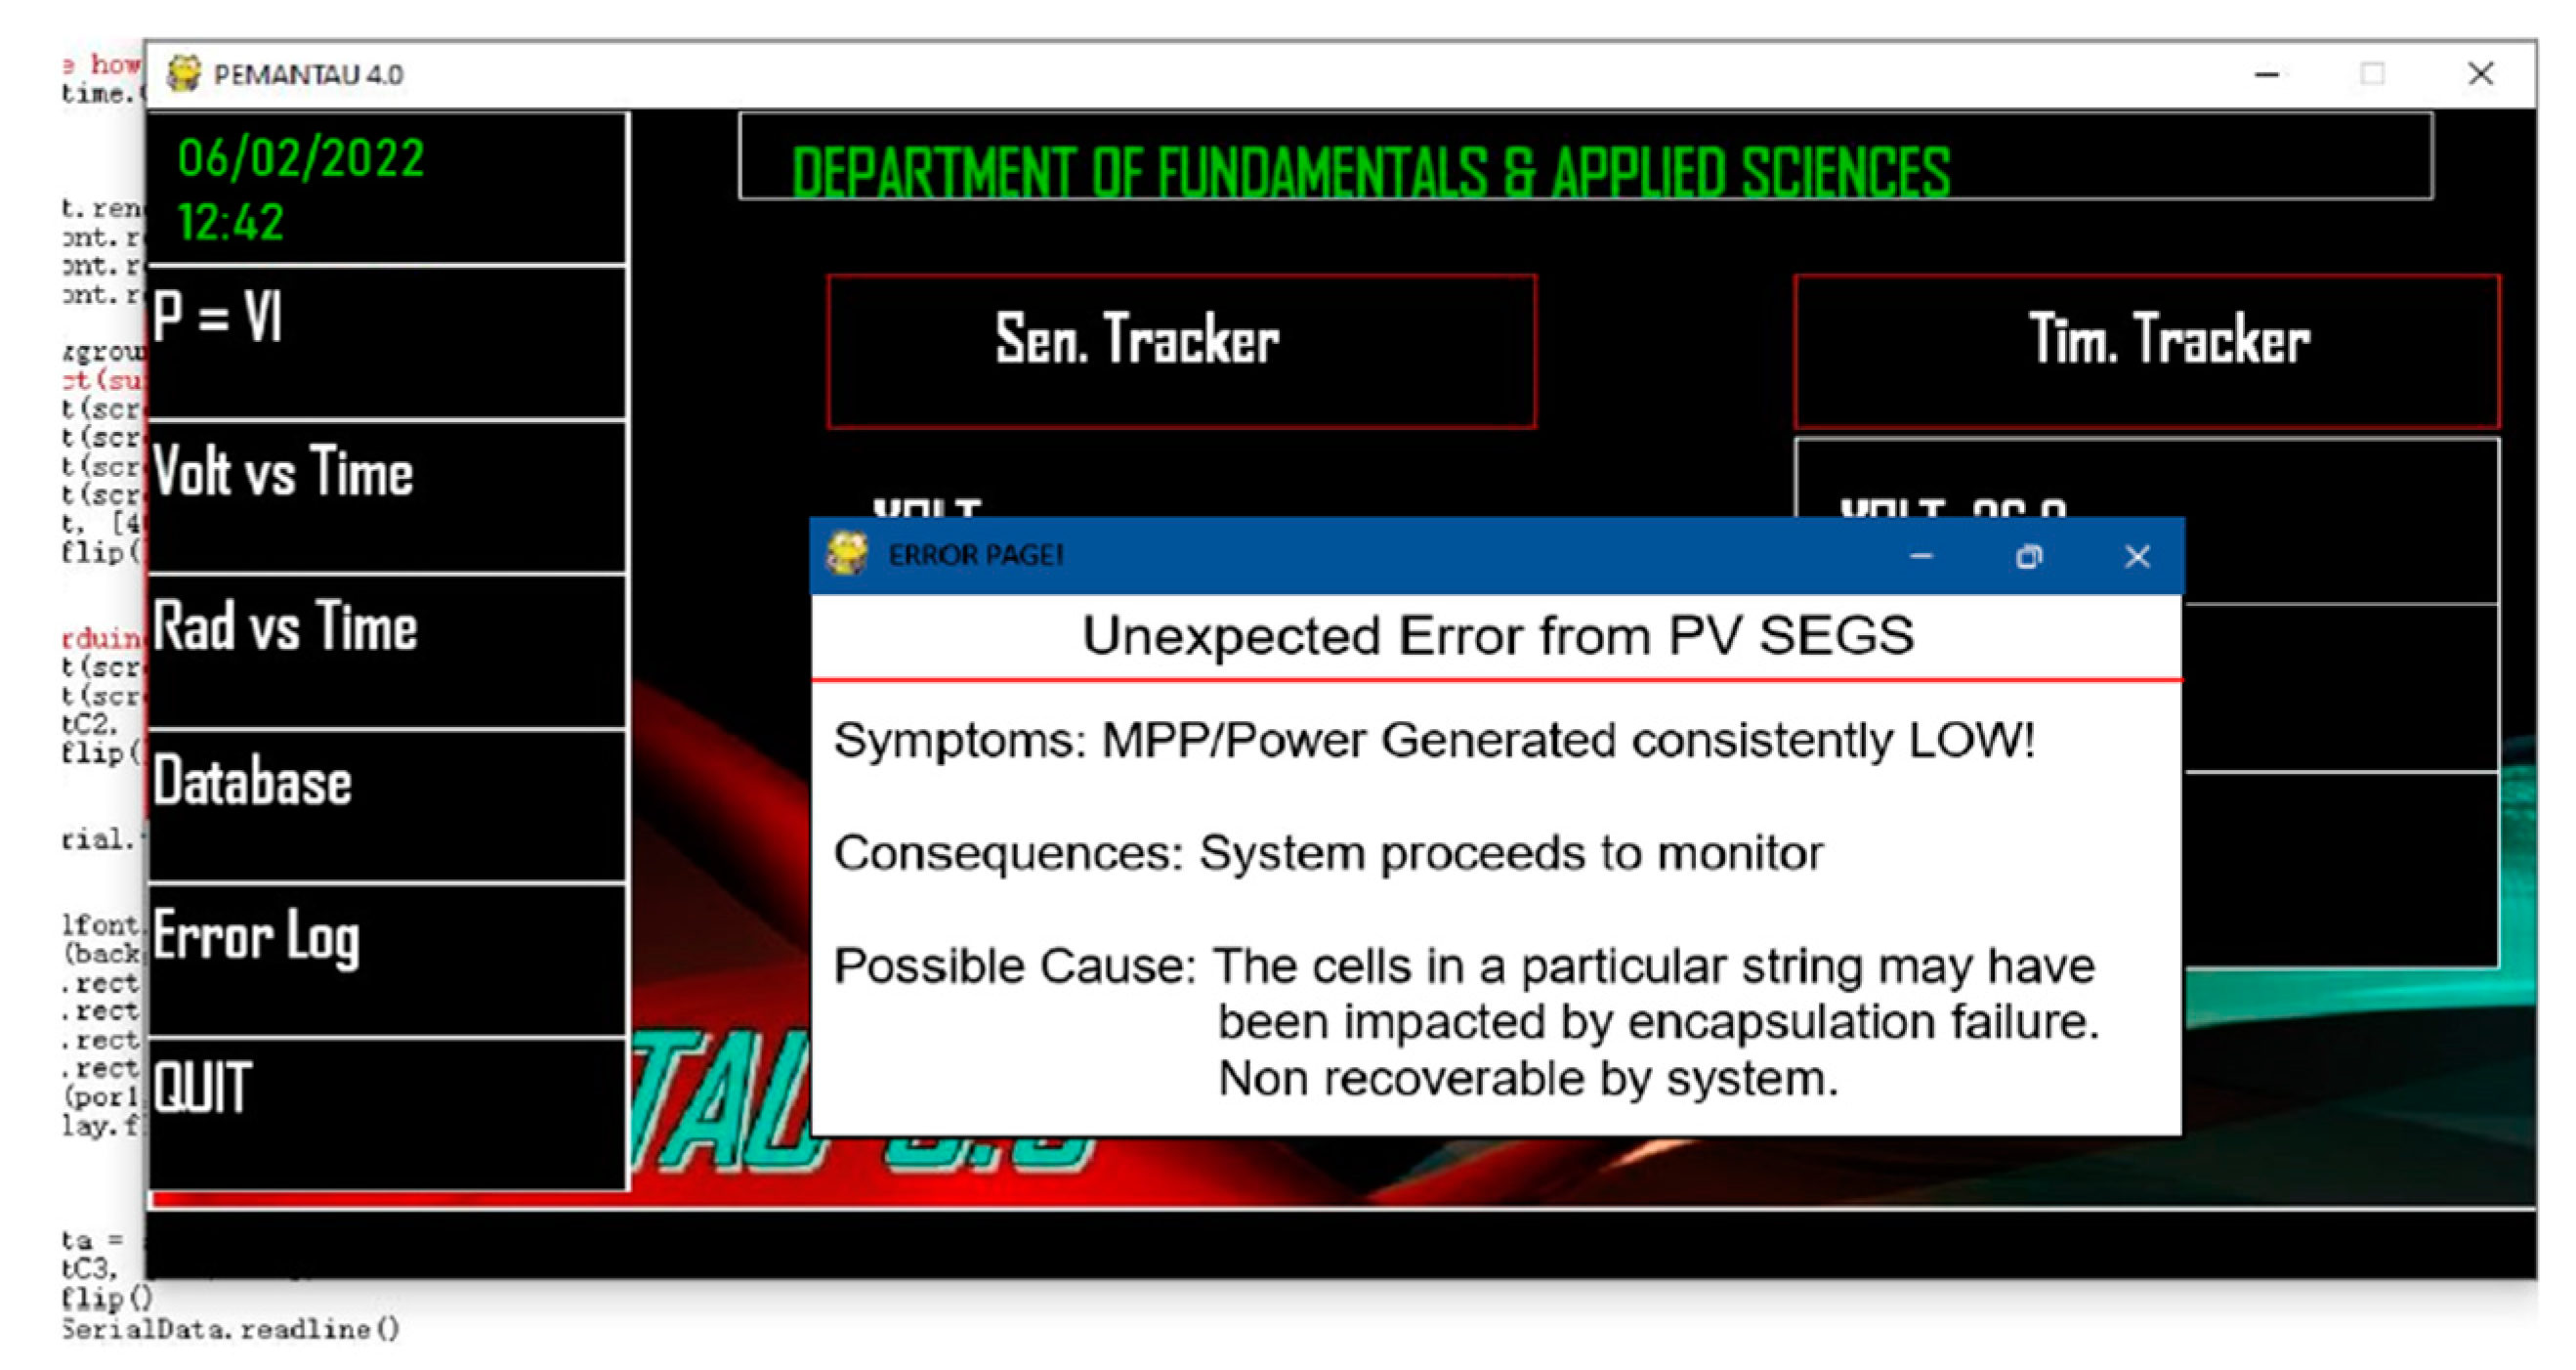
2.1. Monitoring and Data Acquisition Unit
2.2. Fault Detection Unit
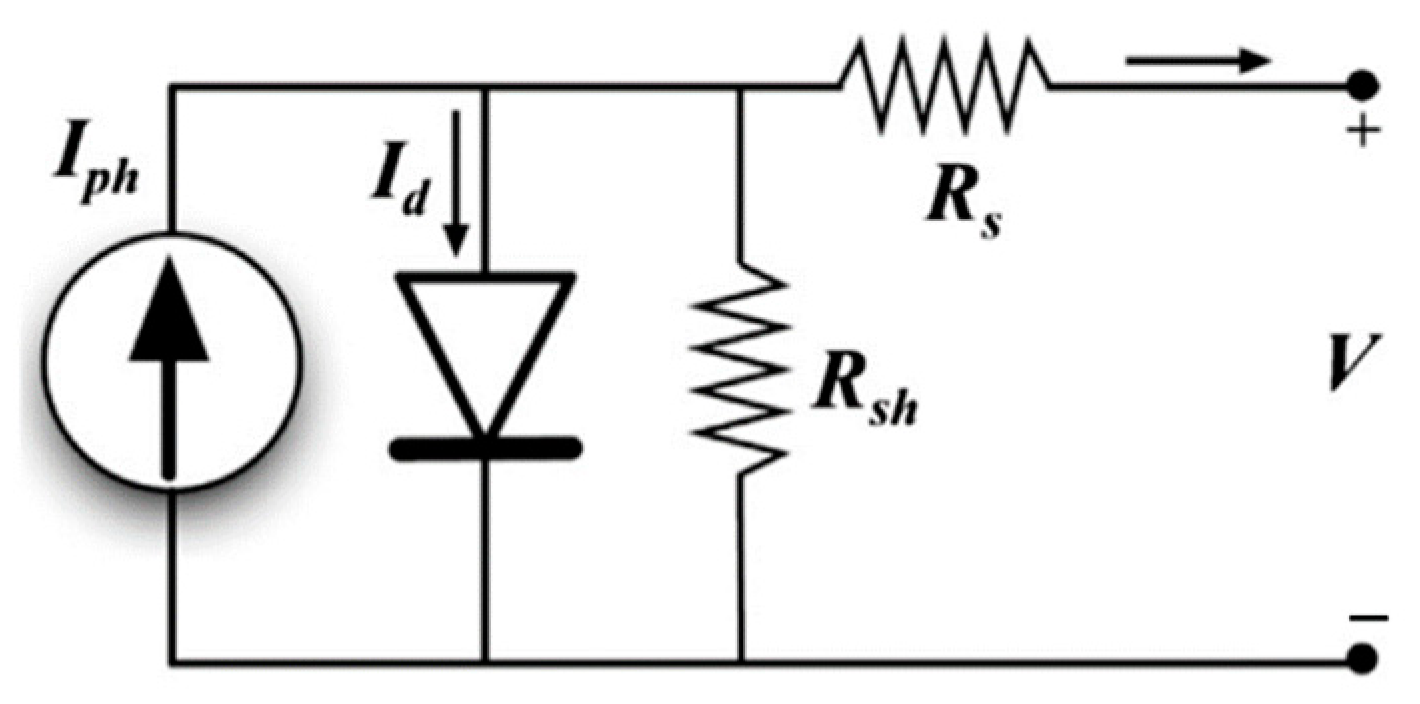
2.2.1. One-Diode Model
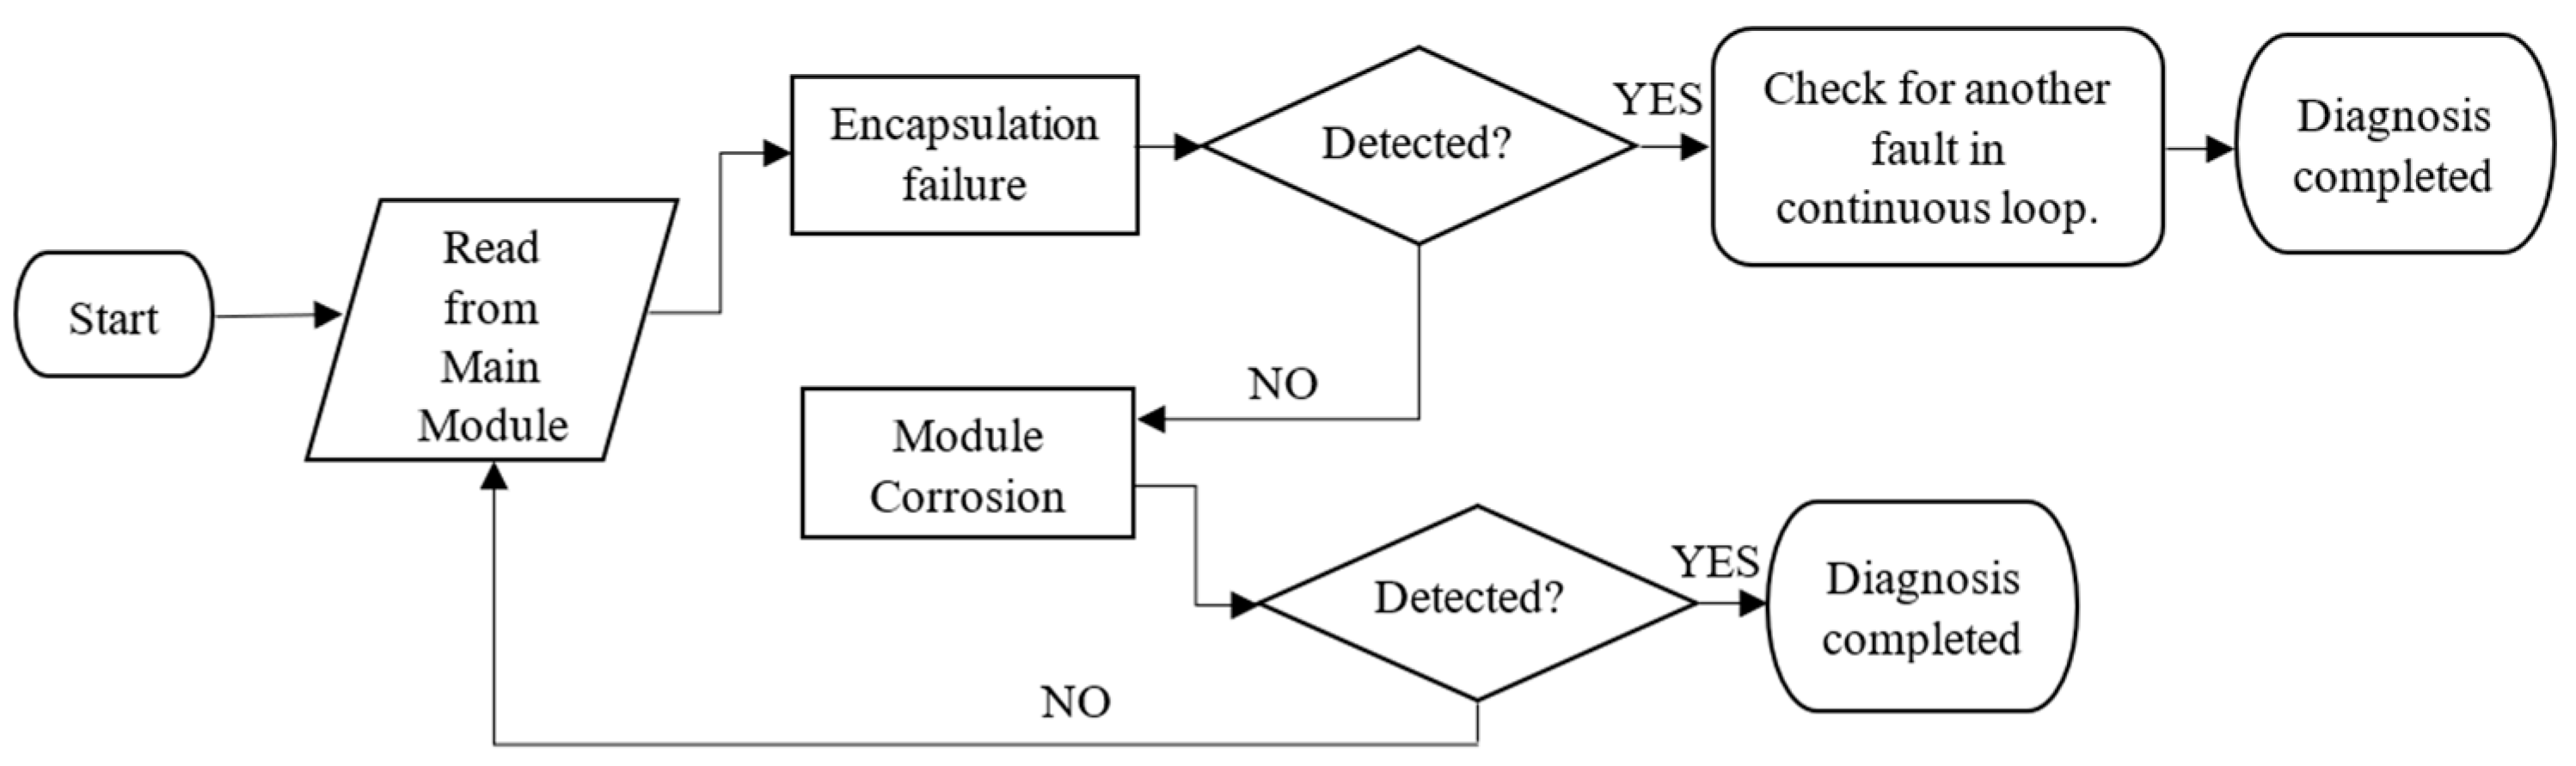
2.2.2. The Diagnostic Algorithm
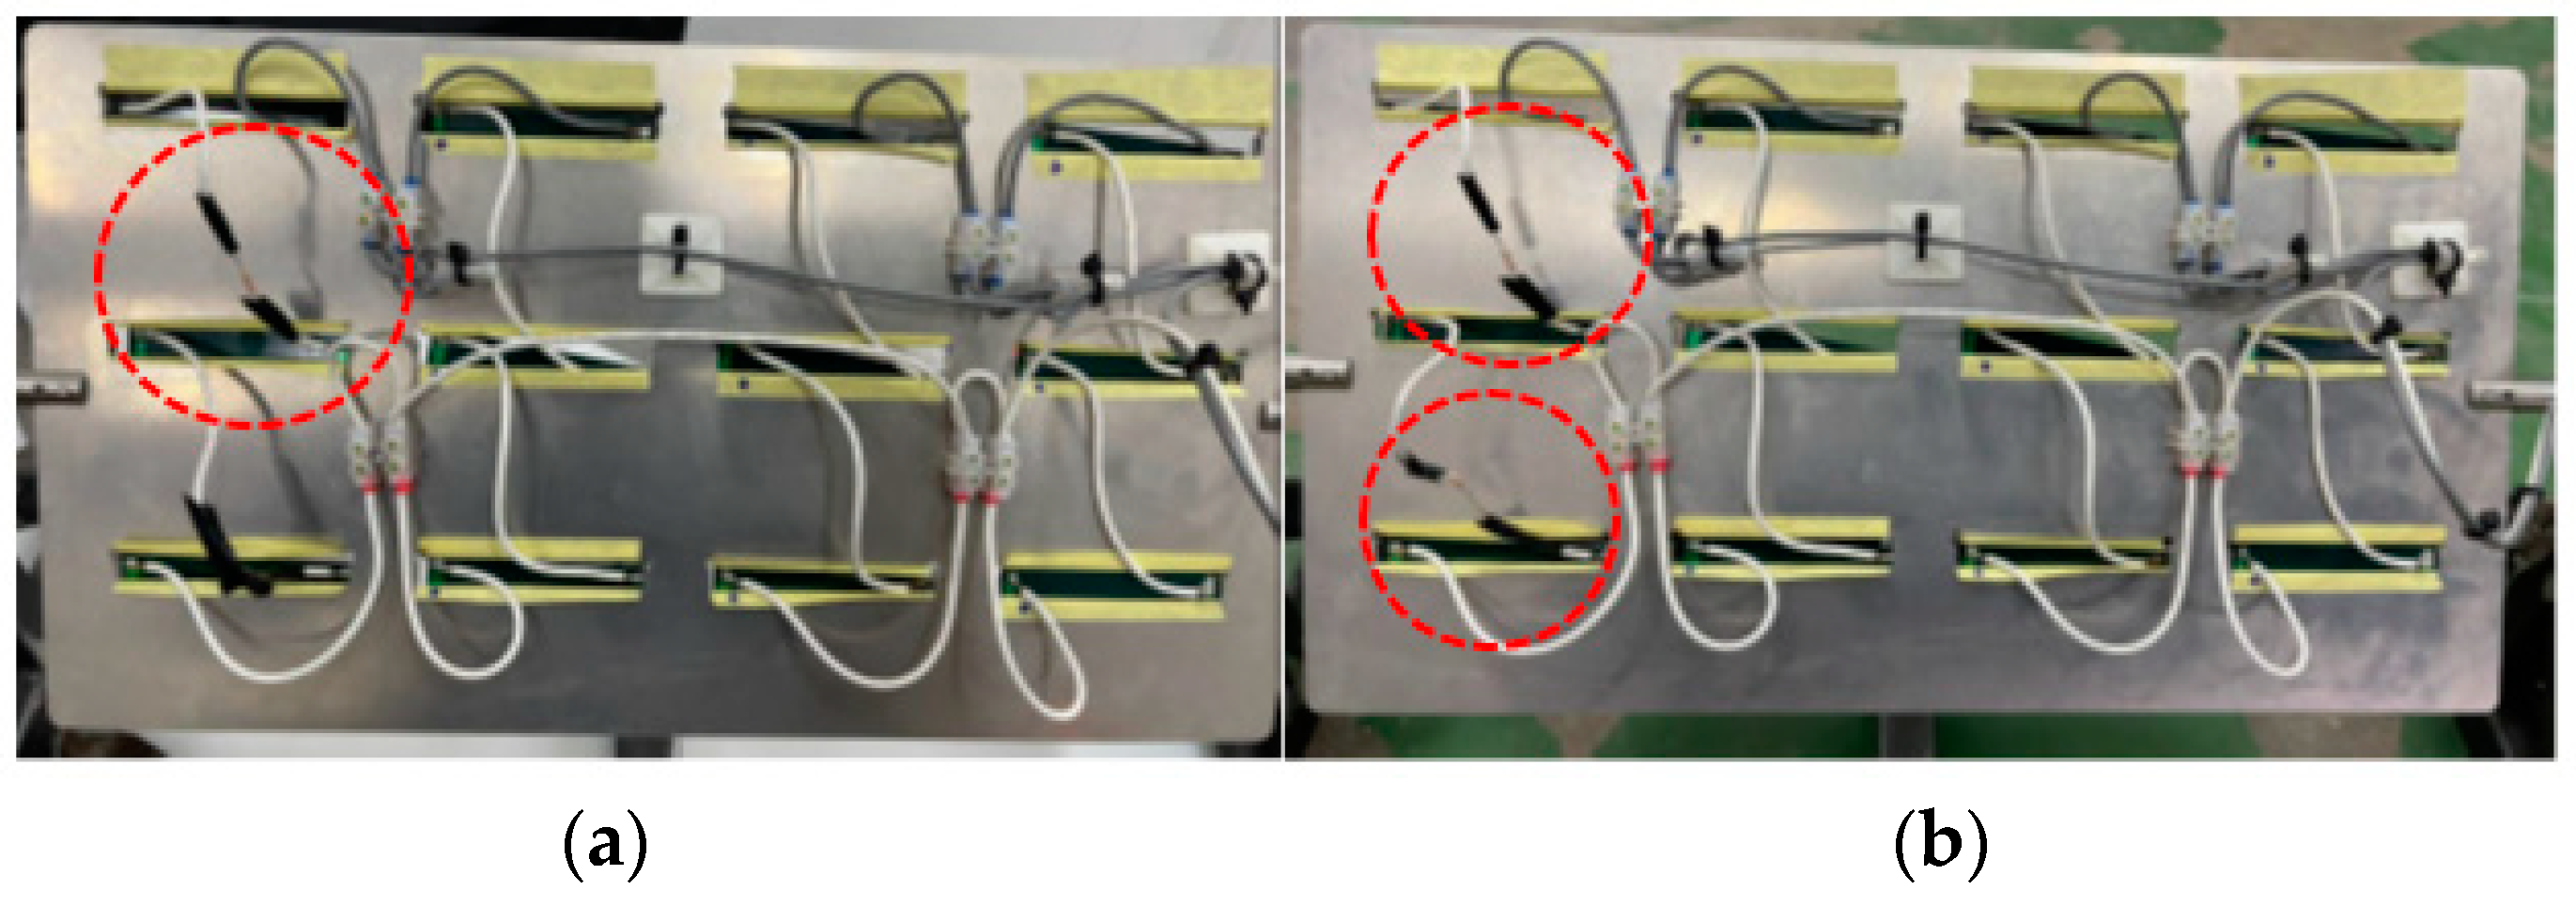
2.2.3. Encapsulation Failure and Module Corrosion
3. Results and Discussions
3.1. Characterization of Encapsulation Failure
3.2. Characterization of Module Corrosion
4. Conclusions
Author Contributions
Funding
Conflicts of Interest
References
- Armaroli, N.; Balzani, V. The Future of Energy Supply: Challenges and Opportunities. Angew. Chem. Int. Ed. 2007, 46, 52–66. [Google Scholar] [CrossRef] [PubMed]
- Mekhilef, S.; Safari, A.; Mustaffa, W.; Saidur, R.; Omar, R.; Younis, M.A. Solar energy in Malaysia: Current state and prospects. Renew. Sustain. Energy Rev. 2012, 16, 386–396. [Google Scholar] [CrossRef]
- Mellit, A.; Tina, G.M.; Kalogirou, S.A. Fault detection and diagnosis methods for photovoltaic systems: A review. Renew. Sustain. Energy Rev. 2018, 91, 1–17. [Google Scholar] [CrossRef]
- Catelani, M.; Ciani, L.; Cristaldi, L.; Faifer, M.; Lazzaroni, M. Electrical performances optimization of Photovoltaic Modules with FMECA approach. Measurement 2013, 46, 3898–3909. [Google Scholar] [CrossRef]
- Davarifar, M.; Rabhi, A.; El-Hajjaji, A.; Dahmane, M. Real-time model base fault diagnosis of PV panels using statistical signal processing. In Proceedings of the 2013 International Conference on Renewable Energy Research and Applications (ICRERA), Madrid, Spain, 20–23 October 2013. [Google Scholar]
- Lazzaroni, M.; Ferrari, S.; Piuri, V.; Salman, A.; Cristaldi, L.; Faifer, M. Models for solar radiation prediction based on different measurement sites. Measurement 2015, 63, 346–363. [Google Scholar] [CrossRef]
- Park, N.; Jeong, J.; Kang, B.; Kim, D. The effect of encapsulant discoloration and delamination on the electrical characteristics of photovoltaic module. Microelectron. Reliab. 2013, 53, 1818–1822. [Google Scholar] [CrossRef]
- Sharma, V.; Chandel, S. Performance and degradation analysis for long term reliability of solar photovoltaic systems: A review. Renew. Sustain. Energy Rev. 2013, 27, 753–767. [Google Scholar] [CrossRef]
- Dhoke, A.; Sharma, R.; Saha, T.K. An approach for fault detection and location in solar PV systems. Sol. Energy 2019, 194, 197–208. [Google Scholar] [CrossRef]
- Gagliarducci, M.; Lampasi, D.; Podestà, L. GSM-based monitoring and control of photovoltaic power generation. Measurement 2007, 40, 314–321. [Google Scholar] [CrossRef]
- Hazarika, K.; Choudhury, P.K. Automatic monitoring of solar photovoltaic (SPV) module. Mater. Today Proc. 2017, 4, 12606–12609. [Google Scholar] [CrossRef]
- Chouder, A.; Silvestre, S. Automatic supervision and fault detection of PV systems based on power losses analysis. Energy Convers. Manag. 2010, 51, 1929–1937. [Google Scholar] [CrossRef]
- Silvestre, S.; Chouder, A.; Karatepe, E. Automatic fault detection in grid connected PV systems. Sol. Energy 2013, 94, 119–127. [Google Scholar] [CrossRef]
- Stauffer, Y.; Ferrario, D.; Onillon, E.; Hutter, A. Power monitoring based photovoltaic installation fault detection. In Proceedings of the 2015 International Conference on Renewable Energy Research and Applications (ICRERA), Palermo, Italy, 22–25 November 2015. [Google Scholar]
- Shimakage, T.; Nishioka, K.; Yamane, H.; Nagura, M.; Kudo, M. Development of fault detection system in PV system. In Proceedings of the 2011 IEEE 33rd International Telecommunications Energy Conference (INTELEC), Amsterdam, The Netherlands, 9–13 October 2011. [Google Scholar]
- Cristaldi, L.; Faifer, M.; Lazzaroni, M.; Khalil, M.M.A.F.; Catelani, M.; Ciani, L. Diagnostic architecture: A procedure based on the analysis of the failure causes applied to photovoltaic plants. Measurement 2015, 67, 99–107. [Google Scholar] [CrossRef]
- Gokmen, N.; Karatepe, E.; Celik, B.; Silvestre, S. Simple diagnostic approach for determining of faulted PV modules in string based PV arrays. Sol. Energy 2012, 86, 3364–3377. [Google Scholar] [CrossRef]
- Triki-Lahiani, A.; Abdelghani, A.B.-B.; Slama-Belkhodja, I. Fault detection and monitoring systems for photovoltaic installations: A review. Renew. Sustain. Energy Rev. 2018, 82, 2680–2692. [Google Scholar] [CrossRef]
- Rahman, M.; Selvaraj, J.; Rahim, N.; Hasanuzzaman, M. Global modern monitoring systems for PV based power generation: A review. Renew. Sustain. Energy Rev. 2018, 82, 4142–4158. [Google Scholar] [CrossRef]
- Suman; Sharma, P.; Goyal, P. Analysing the effects of solar insolation and temperature on PV cell characteristics. Mater. Today Proc. 2021, 45, 5539–5543. [Google Scholar] [CrossRef]
- Vengatesh, R.P.; Rajan, S.E. Investigation of cloudless solar radiation with PV module employing Matlab–Simulink. Sol. Energy 2011, 85, 1727–1734. [Google Scholar] [CrossRef]
- Hong, Y.-Y.; Pula, R.A. Methods of photovoltaic fault detection and classification: A review. Energy Rep. 2022, 8, 5898–5929. [Google Scholar] [CrossRef]
- Sangpongsanont, Y.; Chenvidhya, D.; Chuangchote, S.; Kirtikara, K. Corrosion growth of solar cells in modules after 15 years of operation. Sol. Energy 2020, 205, 409–431. [Google Scholar] [CrossRef]
- Ndiaye, A.; Charki, A.; Kobi, A.; Kébé, C.M.; Ndiaye, P.A.; Sambou, V. Degradations of silicon photovoltaic modules: A literature review. Sol. Energy 2013, 96, 140–151. [Google Scholar] [CrossRef]


| No. | Controlling Factor | Sensor | Description |
|---|---|---|---|
| 1 | Solar Radiation (W/m2) | PV Cell 6 VDC rating | Using a reference cell to mimic a pyranometer by measuring the output DC voltage of the reference cell and a given pyranometer reading. |
| 2 | Output DC voltage (VDC) | Voltage divider circuit | The output voltage of the solar PV is much higher than that of what any controller can process. A voltage divider can parse the total voltage and make a portion of it smaller and thus readable. |
| 3 | Output DC Current (Amp) | ACS712 hall effect sensor | The sensor can measure up to 30 Amps and is a hall effect sensor thus making the electrical circuitry less invasive and modular. |
| 4 | Time (GMT+8) | DS1302 real-time clock module | This sensor is a clock chip that has an uninterrupted power supply in the form of a lithium cell thus being able to track time even when the power is switched off. |
| 5 | Light intensity (0~1023) | Light-dependent resistor (LDR) | This is the simplest and lowest costing light sensor that varies its resistance concerning the light intensity. |
| 6 | PV incline angle (°) | Potentiometer | Potentiometer or rheostat is a device with a rotating pot that at different positions provides different resistance values thus enabling the position to be controlled. |
| 7 | Temperature (°C) | DHT11 temperature and humidity sensor | This circuit uses a temperature and humidity sensor multiplexed together to form the DHT11. The sensor returns 5 V data that requires a special library to process. |
| Humidity (%) |
| Symbol | Name | Value |
|---|---|---|
| ki | Short-circuit current of a cell | 0.0032 |
| T | Operating temperature (K) | T |
| Tn | Nominal temperature (K) | 298 |
| G | Solar irradiance (W/m2) | 1000 |
| q | Electron charge (C) | 1.6 × 10⁻¹⁹ |
| n | The ideality factor of the diode | 1.3 |
| K | Boltzmann’s constant (J/K) | 1.38 × 10⁻²³ |
| Eg | Band gap of semiconductor (eV) | 1.1 |
| Rs | Series resistance (Ω) | 0.538 |
| Rsh | Shunt resistance (Ω) | 24.18 |
| Symbol | Name | Value |
|---|---|---|
| Isc | Short circuit current (A) | 0.6 A |
| Voc | Open circuit voltage (V) | 5 Vdc |
| Pmax | Rated power (W) | 3.6 W |
| Ns | Number of cells in series | 3 |
| Np | Number of PV modules in parallel | 4 |
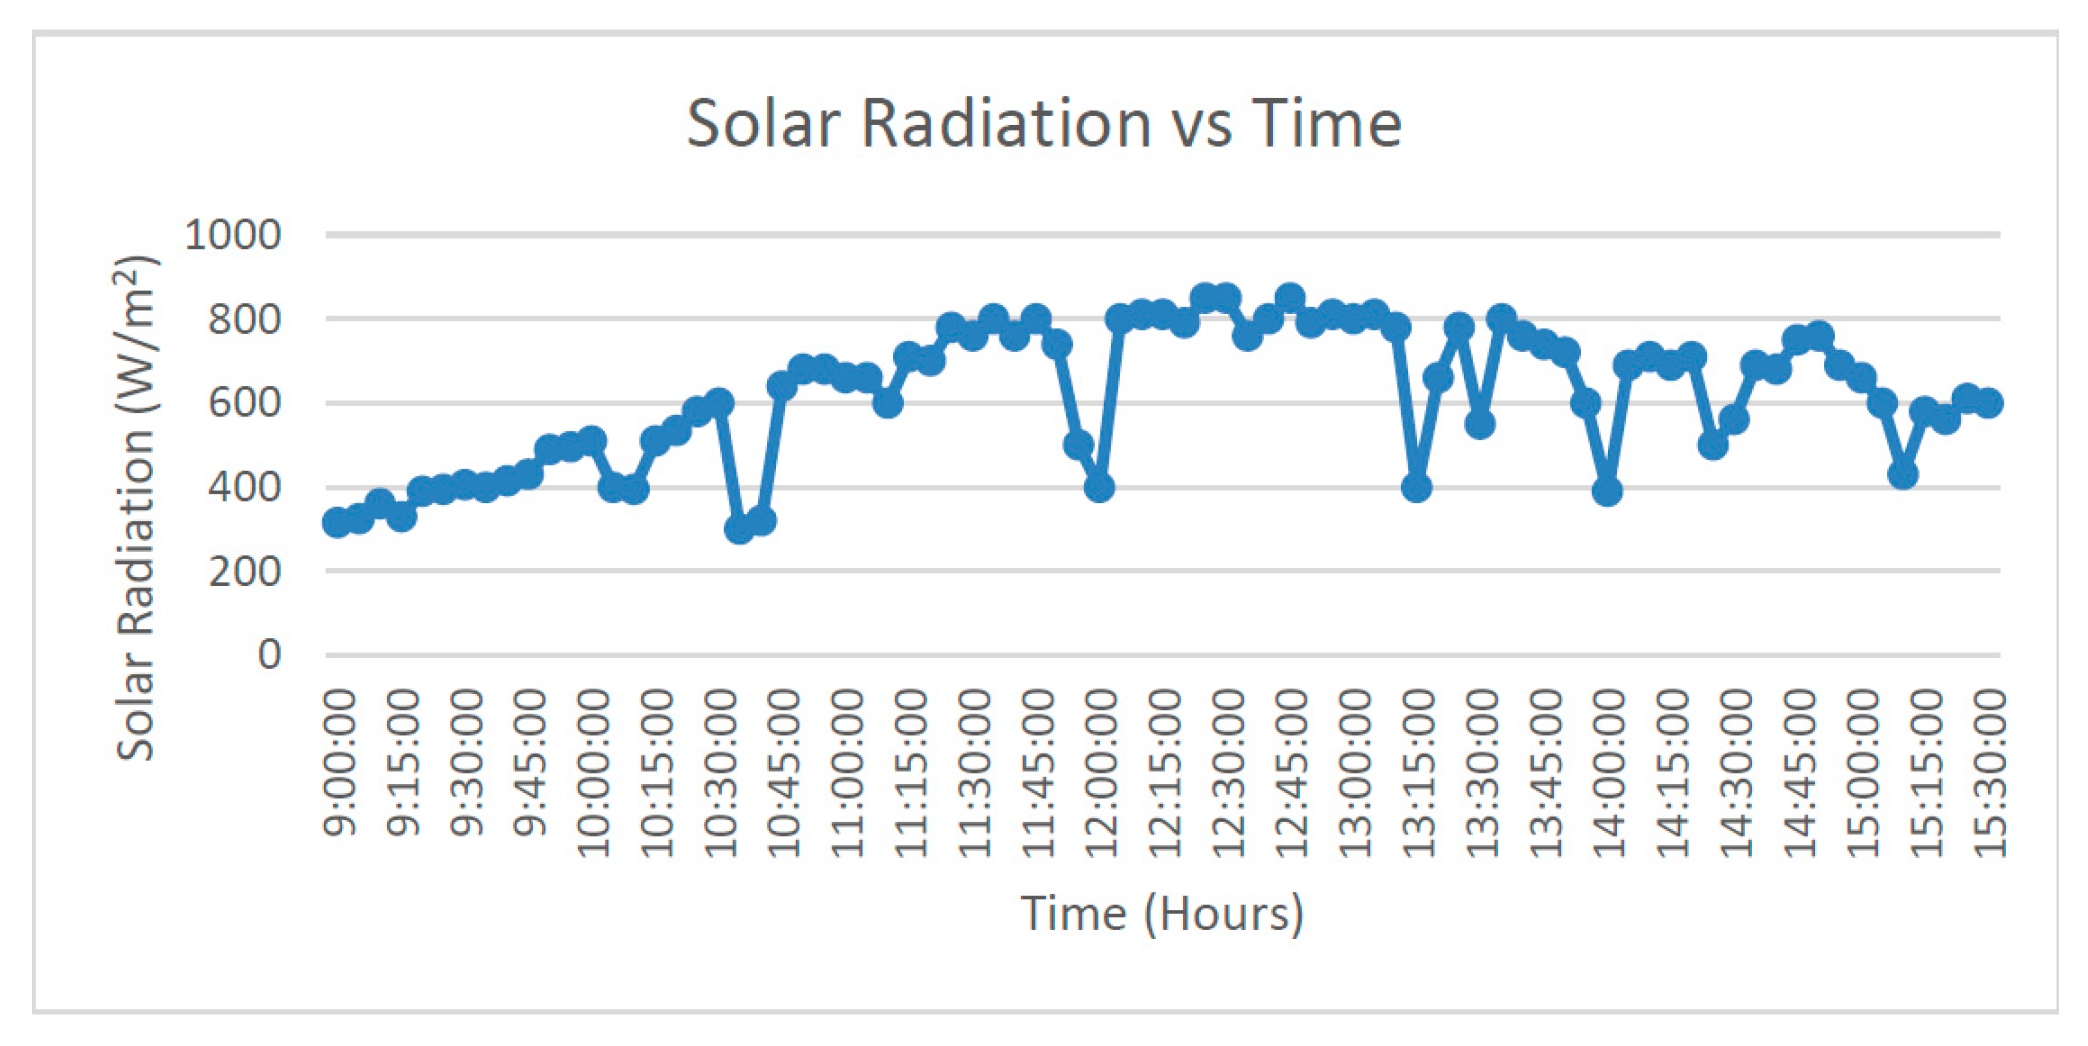
| Experiment | Time | Solar Radiation (W/m2) | Voltage (V) |
|---|---|---|---|
| Controlled state | 10:25 | 580 | 8.06 |
| 15:20 | 580 | 8.27 | |
| Case 1 | 11:10 | 660 | 8.84 |
| 15:05 | 660 | 8.71 | |
| Case 2 | 11:20 | 612 | 7.43 |
| 13:15 | 612 | 7.75 |
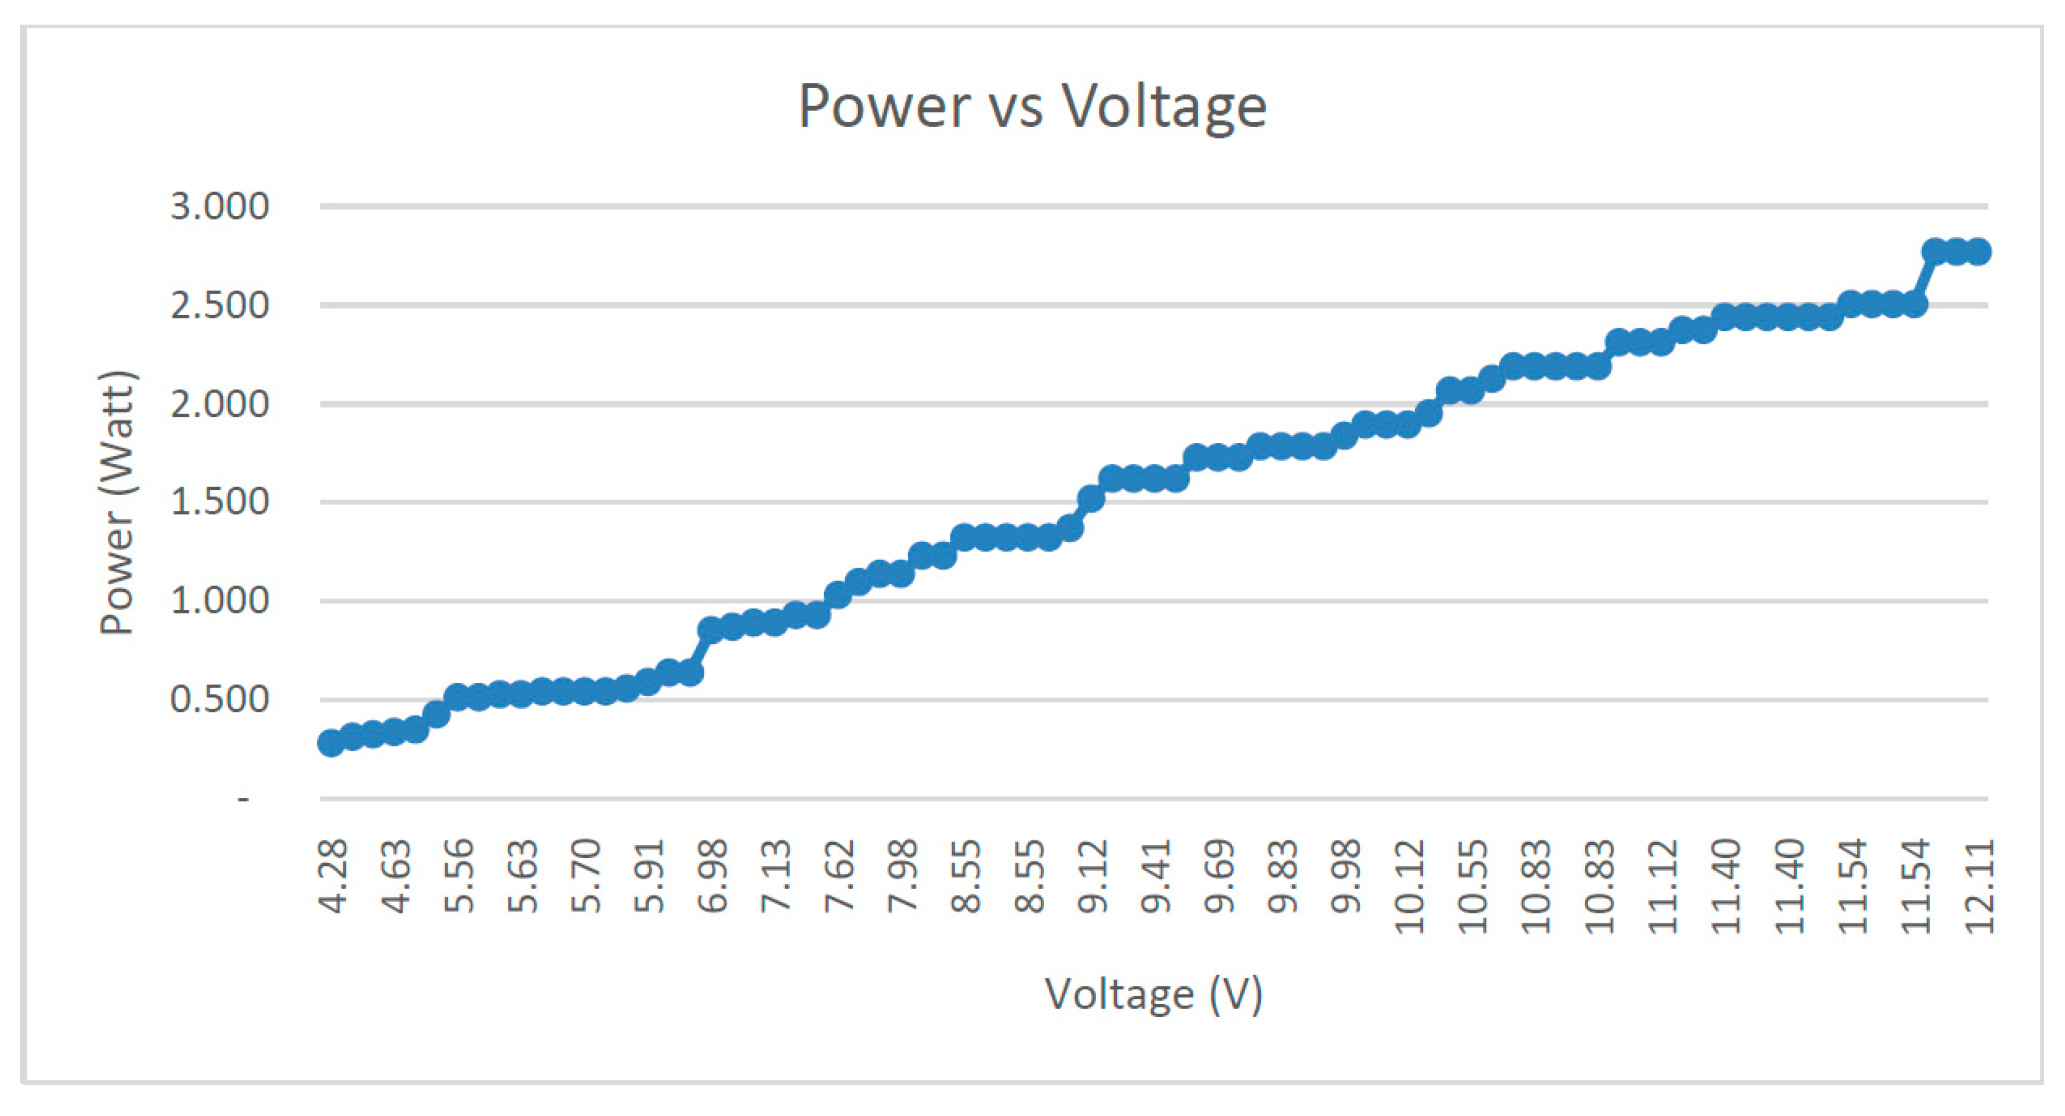
| Solar Radiation (W/m2) | Controlled State | Case 1 | Case 2 | |||
|---|---|---|---|---|---|---|
| Current (A) | Power (W) | Current (A) | Power (W) | Current (A) | Power (W) | |
| 510 | 0.211 | 1.056 | 0.192 | 0.959 | 0.182 | 0.910 |
| 600 | 0.300 | 1.520 | 0.281 | 1.404 | 0.269 | 1.345 |
| 700 | 0.414 | 2.069 | 0.387 | 1.934 | 0.373 | 1.864 |
| 790 | 0.527 | 2.635 | 0.497 | 2.483 | 0.481 | 2.403 |
| 810 | 0.554 | 2.770 | 0.523 | 2.614 | 0.506 | 2.532 |
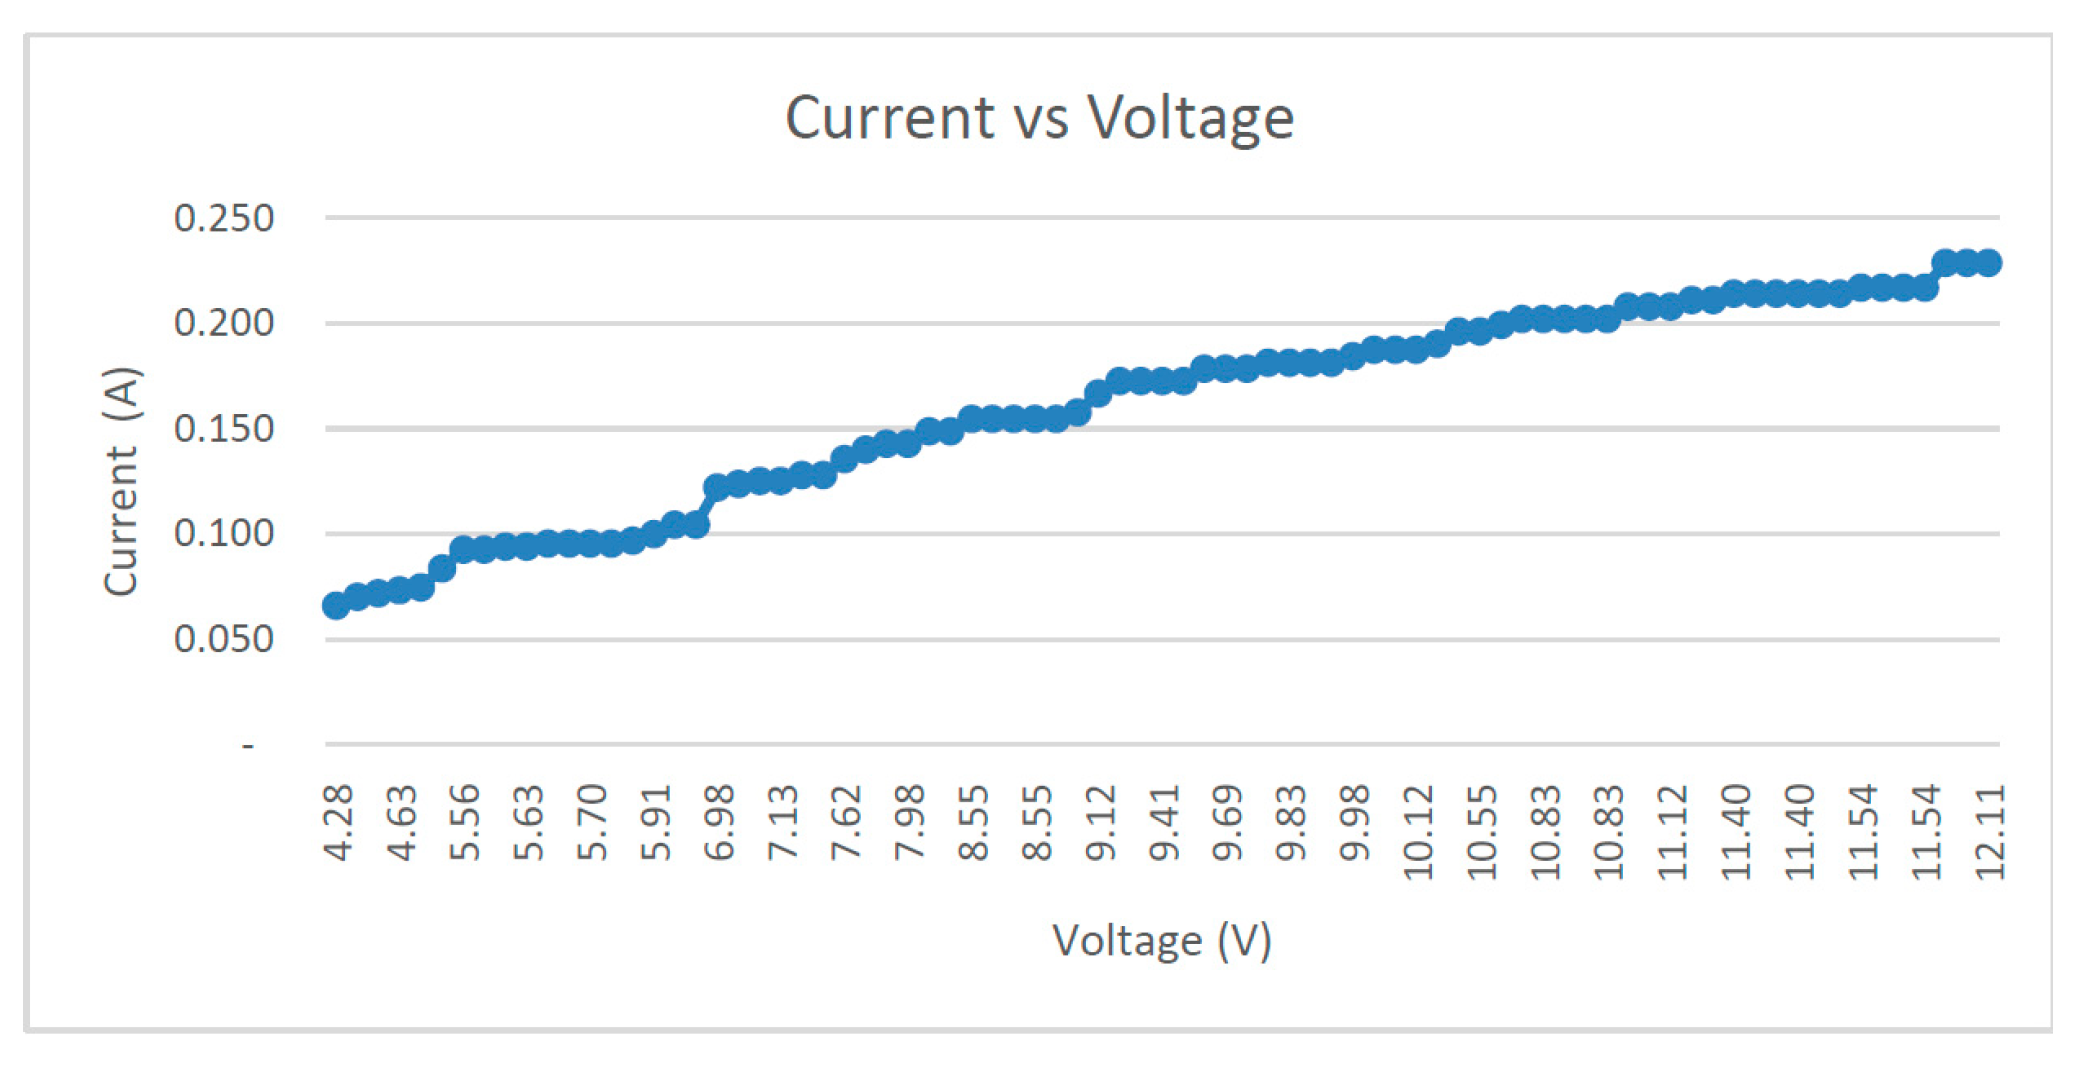
| Solar Radiation (W/m2) | Controlled State Current (A) | Case 3 Current (A) | Case 4 Current (A) |
|---|---|---|---|
| 500 | 0.125 | 0.121 | 0.113 |
| 560 | 0.146 | 0.139 | 0.131 |
| 600 | 0.159 | 0.151 | 0.143 |
| 710 | 0.210 | 0.183 | 0.175 |
| 800 | 0.214 | 0.210 | 0.202 |
Disclaimer/Publisher’s Note: The statements, opinions and data contained in all publications are solely those of the individual author(s) and contributor(s) and not of MDPI and/or the editor(s). MDPI and/or the editor(s) disclaim responsibility for any injury to people or property resulting from any ideas, methods, instructions or products referred to in the content. |
© 2023 by the authors. Licensee MDPI, Basel, Switzerland. This article is an open access article distributed under the terms and conditions of the Creative Commons Attribution (CC BY) license (https://creativecommons.org/licenses/by/4.0/).
Share and Cite
Joseph, E.; Vijaya Kumar, P.M.; Mahinder Singh, B.S.; Ching, D.L.C. Performance Monitoring Algorithm for Detection of Encapsulation Failures and Cell Corrosion in PV Modules. Energies 2023, 16, 3391. https://doi.org/10.3390/en16083391
Joseph E, Vijaya Kumar PM, Mahinder Singh BS, Ching DLC. Performance Monitoring Algorithm for Detection of Encapsulation Failures and Cell Corrosion in PV Modules. Energies. 2023; 16(8):3391. https://doi.org/10.3390/en16083391
Chicago/Turabian StyleJoseph, Easter, Pradeep Menon Vijaya Kumar, Balbir Singh Mahinder Singh, and Dennis Ling Chuan Ching. 2023. "Performance Monitoring Algorithm for Detection of Encapsulation Failures and Cell Corrosion in PV Modules" Energies 16, no. 8: 3391. https://doi.org/10.3390/en16083391
APA StyleJoseph, E., Vijaya Kumar, P. M., Mahinder Singh, B. S., & Ching, D. L. C. (2023). Performance Monitoring Algorithm for Detection of Encapsulation Failures and Cell Corrosion in PV Modules. Energies, 16(8), 3391. https://doi.org/10.3390/en16083391