Article

Comprehensive Thermodynamic Analysis of He–Xe in Microchannels with Different Structures

School of Energy Science and Engineering, Harbin Institute of Technology, Harbin 150001, China
*
Author to whom correspondence should be addressed.
Energies 2023, 16(8), 3322; https://doi.org/10.3390/en16083322
Submission received: 13 March 2023 / Revised: 2 April 2023 / Accepted: 6 April 2023 / Published: 8 April 2023

Abstract

:
He–Xe, with a 40 g/mol molar mass, is considered one of the most promising working media in a space-confined Brayton cycle. The thermodynamic performance of He–Xe in different configuration channels is investigated in this paper to provide a basis for the optimal design of printed circuit board plate heat exchanger (PCHE). In this paper, the factors affecting the temperature distribution of the He–Xe flow field are analyzed based on the flow heat transfer mechanism. It is found that the flow patterns in the logarithmic and outer zones determine the temperature distribution pattern of the flow field. A series of numerical simulations verify the above conclusions, and it is found that reasonable channel structure and operating conditions can significantly improve the thermodynamic performance of the He–Xe flow. Based on the above findings, the Zig channel is optimized, obtaining Sine and Serpentine channels with different structural characteristics. Comprehensive thermodynamic comparisons of the helium–xenon flow domains inside channels are performed, and the Serpentine channel with a shape factor of tan 52.5° is found with the best performance. This work aims to improve the understanding of the thermodynamic performance of He–Xe in microchannels and provide theoretical support for further optimization of PCHE employing He–Xe.

1. Introduction

Compared with the dependence of solar energy on light energy and the cost of chemical energy transportation, nuclear power, with its high energy density, is a better energy source for human deep space exploration [1,2,3]. High-power nuclear thermoelectric conversion research is becoming the focus of current research with the diversification of space missions. Among the existing proposals for nuclear power in space, the gas-cooled reactor plus closed Brayton cycle is the most promising technological solution with high efficiency and stability [4,5,6]. Currently, the main concept design of the ultra-high temperature gas-cooled reactor is helium, whose reactor outlet temperature reaches about 1240 K [7]. However, the size of presently designed helium turbines is too large for space missions with strict size constraints [8]. To solve the size problem faced by space missions, adding heavy inert gas to helium is one of the effective technical solutions [9]. The helium–xenon gas mixture is considered one of the most favorable working mediums in the space Brayton cycle. Because of the xenon mixture, turbomachinery using helium–xenon as a coolant can have a smaller turbine geometry with the same work output [10,11,12,13]. A comparison of the performance of helium–xenon Brayton systems with different ratios of helium and xenon has been carried out, and a mixture with a molar mass of 40 g/mol, the composition of which is 29% Xe and 71% He, is the optimum working medium [11,14]. This working medium maintains heat transfer performance similar to helium while reducing the mechanical turbine size to one-tenth of its original size at this ratio [11,15]. Many factors affect the performance of the helium–xenon Brayton, such as compressor efficiency, core inlet temperature, regenerator performance, etc. According to the study conducted by Hu et al. focusing on the factors affecting the helium–xenon Brayton system, the regenerator has the most significant impact on the performance indicators of the helium–xenon Brayton system. As an example, the thermal efficiency of the system varies by up to 42.3% as the heat return varies [16]. Considering the advantages of the helium–xenon working medium in space missions, it is necessary to analyze the thermodynamic performances of helium–xenon flow in terms of heat transfer. The performance and tendency of helium–xenon convective heat transfer in the channels directly determine the design criteria of equipment related to helium–xenon heat exchangers. In the case of the reheater mentioned above, a suitable He–Xe heat exchanger should maintain a high degree of compactness while maintaining a high heat transfer efficiency to reduce the mass of the heat exchanger. This requires designers to understand the helium–xenon heat transfer-flow characteristics inside the microchannel. A printed circuit plate heat exchanger (PCHE) is a highly compact heat exchanger. A large heat transfer surface can be obtained in PCHE within a small volume through diffusion welding processing [17]. Due to this advantage, the PCHE is ideally suited to the technical requirements of space nuclear power systems. The heat transfer performance of the PCHE depends on the convective heat transfer capacity inside the unit channels. Kim et al. investigated the helium flow’s transfer capacity with different fin angles through experimental research and CFD simulation [18]. According to his study, the heat transfer capacity inside the Zig channel is much stronger than inside the straight tube due to vortices at the corners. However, the heat transfer capacity inside the Zig channel does not increase with the increase of the fin angle but reaches an extreme value at 32.5°. Yipeng et al. investigated the heat transfer capacity and friction losses inside the microchannel at different incidence angles using water as the working medium. They concluded that the heat transfer capacity inside the Zig channel reaches a maximum at the incidence angle of 30° [19]. Kim investigated the heat transfer capacity inside the Zig channel at different fin angles for SCO2 to study the heat transfer capacity and friction losses inside the microchannels. It turns out that the heat transfer capacity inside the Zig channel with a fin angle of 40° was better than that of the pipe with a fin angle of 32.5° [20]. This comparison shows that the heat transfer characteristics of flow channels of the same structure significantly vary with the flowing medium. Therefore, it is necessary to investigate the heat transfer characteristics of helium–xenon flow in differently shaped flow channels.
Currently, most studies focusing on He–Xe convective heat transfer capacity are experimental. The earliest study on the He–Xe flow pattern was the experiment by Taylor [21]. Taylor pointed out that the Dittus–Boelter correlation [22] overestimated the heat transfer capacity of fluids with low Prandtl (Pr) numbers and organized the Nu correlation presented by Picket [23] into the following form.
N u = ξ / 8 R e P r K 1 ( ξ ) + K 2 ( P r ) ξ 8 P r 2 / 3 1
ξ = 1.82 lg R e 1.64 2
K 1 ξ = 1 + 3.4 ξ
K 2 P r = 11.7 + 1.8 P r 1 3
It needs to be noted that this empirical correlation only applies to 104 < Re < 5 × 10⁶ and 0.5 < Pr < 200. The Kays correlation [24] is as follows.
N u = 0.022 R e 0.8 P r 0.6
The correlation applies to Re > 104, and 0.5 < Pr < 200. To obtain more accurate empirical correlations, Hao qin et al. [25] modified the Kays relation formula based on experiments, obtaining new correlations for predicting He–Xe heat transfer capacity as follows:
N u = 2.072 R e 1.15 P r 5.69 4000 < R e < 10,000
N u = 0.016 R e 0.85 P r 0.77 R e > 10,000
The above correlation can accurately predict the Nu of He–Xe flows in pipes with an inner diameter of 9 mm. However, the discussion still needs to further predict the heat transfer capacity of He–Xe flow in tubes with other diameters. Vitovsky et al. investigated the heat distribution of the He–Xe flow domain, the molar mass of which is 40 g/mol, within the fuel rod spacing [26]. The characteristics of turbulent flow development of He–Xe in triangular channels are investigated in their research, and the empirical correlations of the Nu inside triangular channels are modified. Vitovsky [27,28] also explored the He–Xe heat transfer characteristics inside channels with different cross-section shapes, further broadening the universality of their modified correlations. However, the long cycle of experimental study and the high cost of utilizing xenon make it challenging to carry out experiments on the He–Xe flow pattern on a large scale. These make it difficult to systematically recognize the characteristics of helium–xenon convective heat transfer in different flow configurations. Additionally, obtaining the flow details inside the flow domain is challenging by the experimental observation method of flow heat transfer. As a modern research method, numerical simulation can accurately calculate the velocity–temperature distribution in the flow pattern, obtaining the flow field’s heat transfer capacity. Qin et al. [29] explored the heat transfer characteristics of helium–xenon in the uniformly heated circular channel and tri-lobe channel based on the SST k-ω model through numerical simulation. Qin et al. found a large temperature gradient in the channels’ corner thanks to the simulation’s ability to capture the flow domain’s detail. However, current numerical simulation studies on He–Xe flow focus more on optimizing turbulence models with low Pr numbers, and the heat transfer performance of the helium–xenon flow itself is rarely paid attention to [30,31]. It is worth pointing out that previous experimental and numerical studies on heat transfer capacity have analyzed the characteristics of the He–Xe flow domain inside channels with different cross sections and have yet to analyze the influence of the channel structural elements on the flow domain. Previous studies on the He–Xe flow mainly focused on the first law of thermodynamics. The analysis of irreversibility loss in the heat transfer process is also essential. Bejan et al. proposed the concept of entropy generation and used it to analyze the irreversibility loss distribution in heat exchangers [32]. Hesselgreaves proposed the idea of dimensionless irreversibility number and employed it in optimizing heat exchangers [33]. Jiyu et al. studied the entropy generation in the spray atomization process, analyzing the irreversibility of heat and mass transfer during the phase transition [34]. Thus, based on its outstanding performance, the entropy generation analysis will be employed to analyze the performance of the second law of thermodynamics of He–Xe in the heat transfer process inside different flow channels.
In this paper, the thermodynamic performance of He–Xe in pipes of different configurations is studied by numerical simulation. Firstly, the mathematical models of He–Xe properties were obtained from Tournier (2018) [11] and compiled into UDF for Fluent to call. Meanwhile, the entropy generation model was established using UDF based on Fluent to analyze the second law of thermodynamic performance of the He–Xe in pipes. Then, the flow channels with different shapes were selected to analyze the performance of He–Xe inside them under control variables. This work aims to improve the understanding of the thermodynamic performance of He–Xe flow in the microchannels and to provide some theoretical support for the further optimization of PCHE employing He–Xe.

2. Numerical Model

2.1. Geometry and Boundary Conditions

Three kinds of pipes with different structures are established to study the thermodynamic performance of He–Xe. All models are set with a 30 mm adiabatic section behind the velocity inlet to eliminate the influence of the inlet. The middle passage of geometries is heating walls with a constant heating flux whose length is 75 mm. The flow section of all the pipes with different configurations is a semicircle with a hydraulic diameter of 1.22 mm. One inlet pattern can be obtained at the inlet of the heating section under the condition of the same mass flow because the hydraulic diameter of all pipes keeps constant. The shapes of the three types of flow channels and the mesh details are shown in Figure 1.
As shown in the Figure 1, the channel structures studied in this paper include the Zig, Sine, and Serpentine channels. The structure shape factor is defined as the ratio of the height of a single cycle, H, to the length of half a cycle, c, in establishing the channel model. The structure shape factor is shown as follows:
A = c H
The length of one cycle is set as 10 mm to analyze the influence of different configurations on the thermodynamic performance of the working medium. Different flow channel configurations are established depending on various shape factors as follows (Figure 2):
The single period of the Serpentine channel is formed by the same four arcs tangent at the junction α in Figure 2 as the arc’s central angle, and the r is the radius of the arch. According to simple geometry, it can be obtained:
r = c 2 4 H + H 4
s i n ( α ) = c 2 r
Different models are built based on shape factors to explore channel configuration’s influence on He–Xe flows. The shape factors analyzed in this paper range from tan 45 ° to tan 67.5 ° . Aside from the adiabatic wall and the constant heat flux wall, the velocity inlet and pressure outlet are adopted for numerical simulation. Re ranges from 2000 to 6000. The wall was heated with different heat fluxes. The details of the simulation are given in Table 1. The Reynolds numbers at the inlet range from 2500 to 6000. The details of the simulation are given in Table 1.

2.2. Grid Independence and Experimental Verification

The finite volume method (FVM) was employed to simulate the physical domains inside different pipes, and the simulations were performed on Fluent 2019. The mass equation, energy equation, and momentum equation describing the physical domain can be expressed as follows:
ρ t + · ρ U = 0
ρ U t + · ρ U U = · ( μ + μ t ) U + ρ f p
ρ c p T t + · ρ c p U T = · λ + λ t ) T + S T
In Equations (11)–(13), f is the volume force vector of the fluid, and U is the velocity vector. Its expression is as follows:
U = u i + v j + w k
Additionally, μ t is turbulent viscosity and λ t is the turbulent thermal conductivity. This paper utilizes the Reynolds-Averaged Navier–Stokes (RANS) method to average the N–S equations. The He–Xe studied in this paper has a low Pr of 0.21~0.23, which differs from the conventional coolant. A low Pr number makes the flow heat transfer performance of He–Xe different from other fluids, and the most crucial parameter is the turbulent Pr number. The RNG k-ε model is a standard k-ε model based on the renormalization group theory. Unlike the standard k-ε model, which adopts a fixed Prt, the RNG k-ε model provides an analytical formula for the Prt and is suitable for fluids with Pr between 0.01 and 103 [35]. Therefore, applying the RNG k-ε model for He–Xe convective heat transfer guarantees the accuracy of the simulation results. The transport equations of turbulent kinetic energy k and dissipation rate ε in RNG k-ε turbulence model are shown as follows:
ρ k t + ρ k u i x i = x j α k μ e f f k x j + G k + G b ρ ε Y M + S k
ρ ε t + ρ ε u i x i = x j α ε μ e f f ε x j + C 1 ε ε k ( G k + C 3 ε G b ) C 2 ε ρ ε 2 k R ε + S ε
Here, G k represents the turbulent kinetic energy introduced by the average velocity gradient, and G b represents the turbulent kinetic energy introduced by buoyancy. Y M represents the dissipation introduced by expansion waves during compressible flows and need not be considered in this paper. Assessing the accuracy requirement of the RNG k-ε turbulence model, y+ at the near-wall grid is no more than 2.
The second-order upwind scheme is utilized to discretize the convection and diffusion terms in the governing equations to ensure the accuracy of the equation-solving process in all the simulation processes. The SIMPLE scheme is employed to couple the velocity and pressure. Tournier et al. [11] studied the physical parameters of a gas mixture with different inert properties in the pressure range of 0.1~20 MPa and the temperature range of 0~1400 K. The physical profiles of the He–Xe are established by UDF based on the research of Tournier et al. [11], as shown in Figure 3.
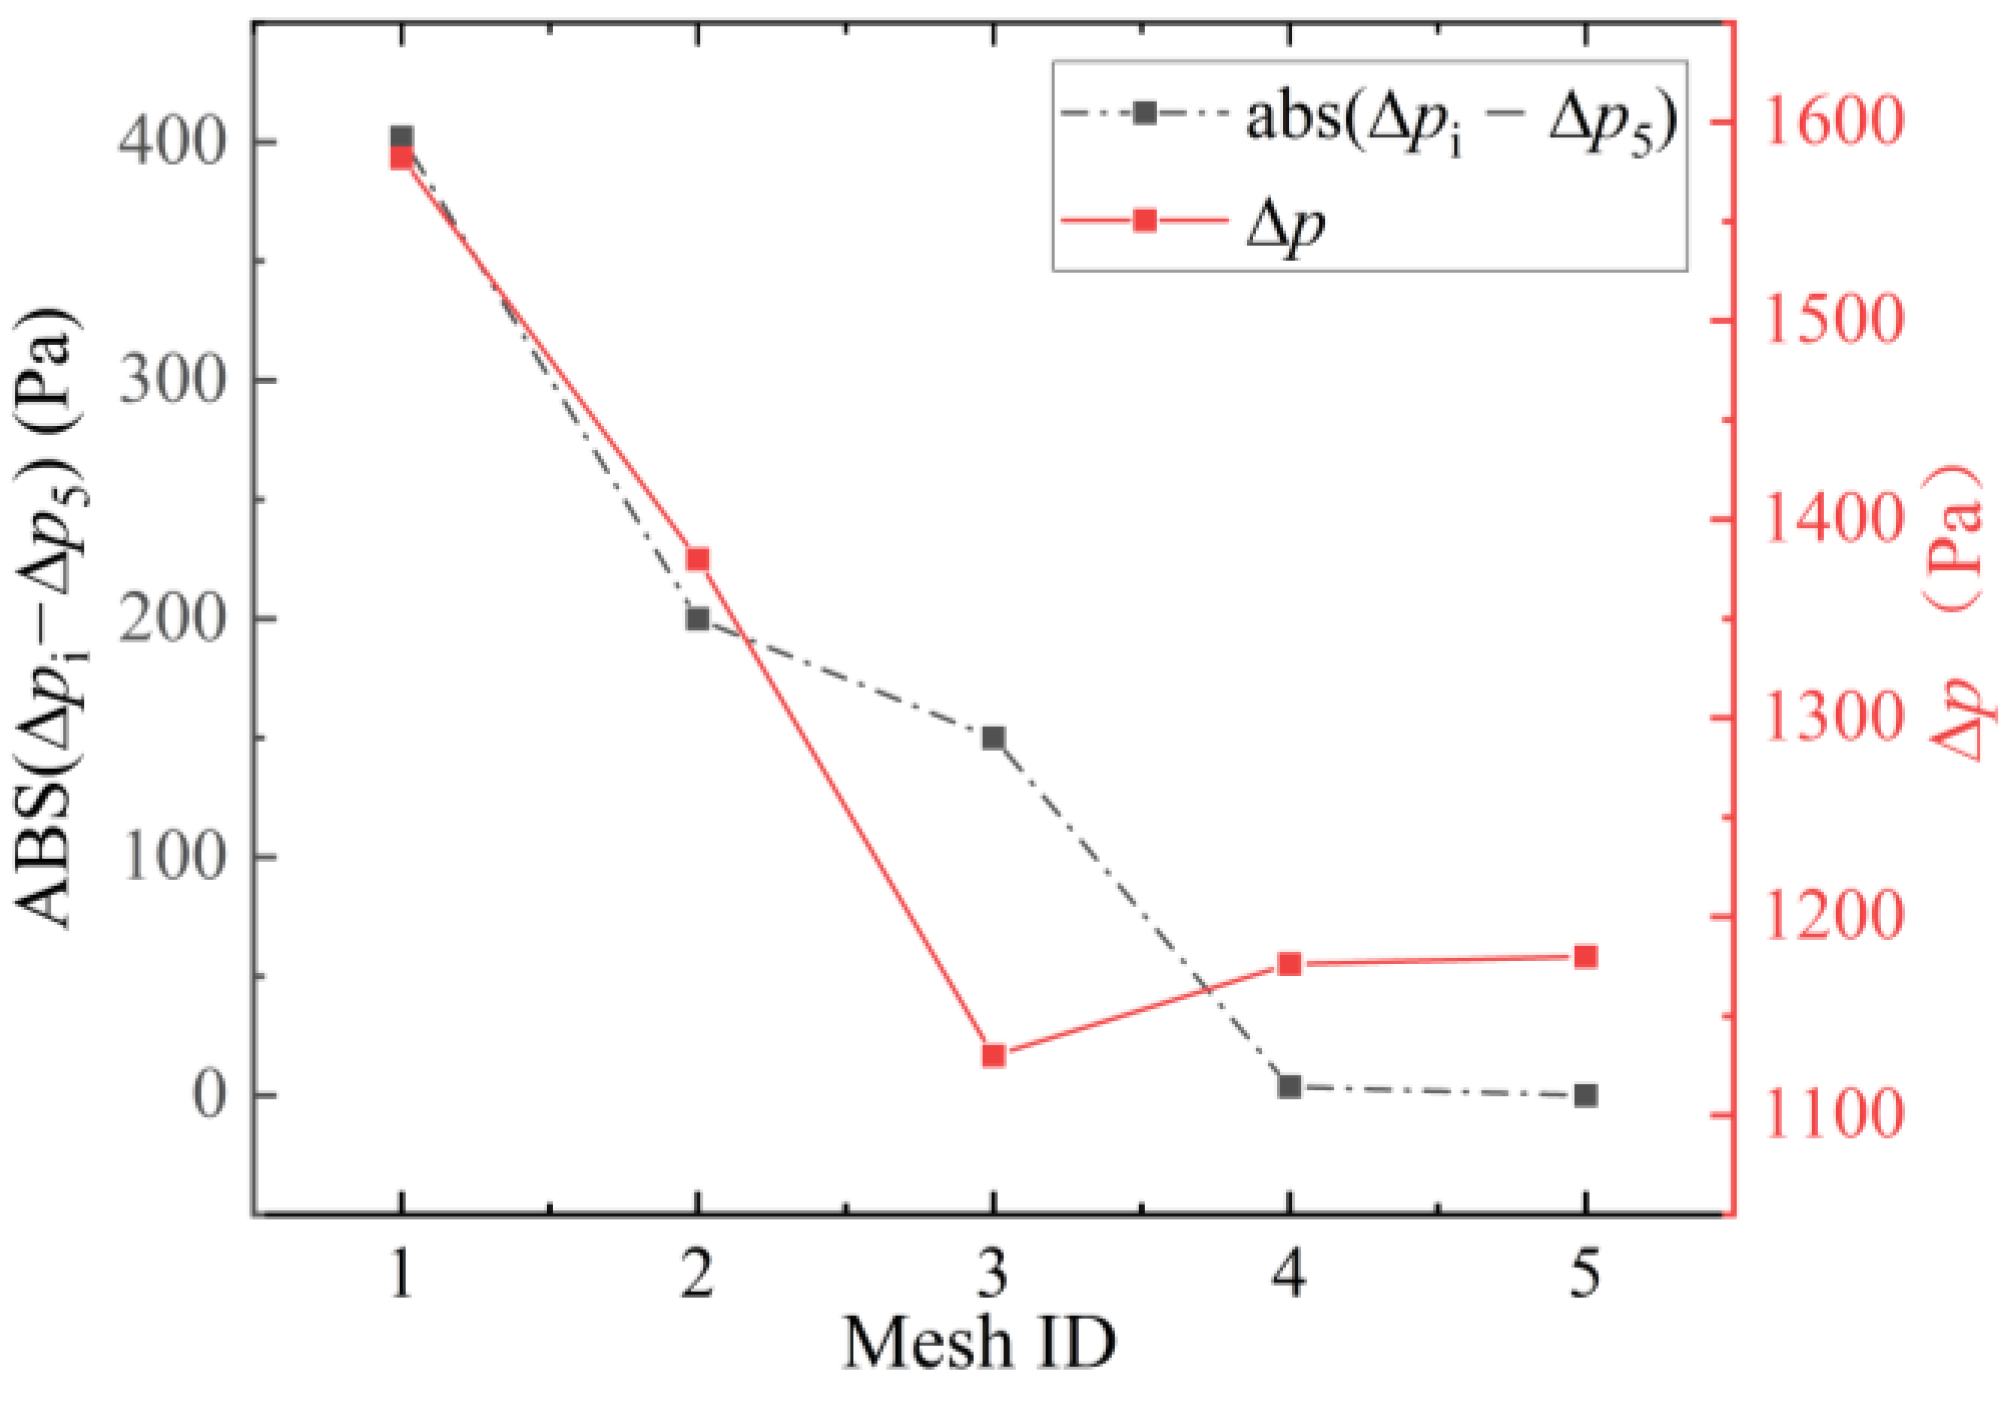
The convergence standard of the continuity and momentum equation is set as 10−5. The convergence standard of the energy equation is set as 10−8 in the simulation process. Five different size meshes are taken to simulate Case1 to guarantee that the results obtained by the numerical simulation are not affected by the influence of the grid. The labels and parameters of the grid are shown in Table 2. It can be observed from Figure 4 that the pressure drops between the inlet and outlet and almost remain unchanged with Mesh 4 and Mesh 5. Considering the calculation cost and accuracy, this paper adopts Mesh 4 for calculation.
As few experiments on helium–xenon have been conducted, a combination of experimental research and the empirical formula is employed in this paper to verify the proposed simulation method and the results, respectively.
A quasi-triangular channel experiment [26] with a similar hydraulic diameter to the studied object in this paper is employed to verify the reliability of the simulation method in this paper for the lack of experimental studies on the flow of helium–xenon in semicircular channels. The channel in the empirical research is shown in Figure 5.
The hydraulic diameter of the channels studied in this paper is 1.22 mm, which is 85.9% of the hydraulic diameter of the channel in the experimental study [26]. The working medium employed in the empirical research is consistent with that studied in this paper. Therefore, it can be considered that the numerical simulation methods utilized for the flows share a high degree of consistency. The local convective heat transfer coefficients are obtained by simulating with Re numbers 5060 and 6760. The turbulence model and wall function employed in this numerical simulation are consistent with that studied in this paper. The local convective heat transfer coefficients are obtained at Re numbers 5060 and 6760. The turbulence model and wall function adopted in the numerical simulations are consistent with this paper’s numerical simulation with a semicircular channel. The comparison between simulations and experiments is presented in Figure 6.
The local convective heat transfer coefficient at 0.2L of the experimental channel is lower than that at the mainstream for the undeveloped turbulent flow at the channel’s entrance. The local convective heat transfer coefficient at the outlet of the channel is higher than that at the mainstream for the influence of the outlet. The maximum uncertainty of the average local convective heat transfer is 9.25% at the Re number of 6760 between 0.3L and 0.8L of the channel. The increase in velocity before the outlet increases the local convective heat transfer coefficient, introducing uncertainty. Different from the flow field in the experiments, the flow domain in the numerical simulation is not affected by the outer space of the channel. This indicates that the convective heat transfer coefficient obtained by the numerical simulation will not vary under the influence of the inlet and outlet as in the experimental research. Additionally, the temperature rise of the fluid along the path is maintained at a low value in experiments and numerical simulations, which results in a very limited influence caused by physical property changes on the heat transfer capacity of He–Xe. The above factors contribute to the phenomenon that the local convective heat transfer coefficient obtained by numerical analysis keeps almost constant. Therefore, this paper’s numerical simulation method predicts helium–xenon’s flow heat transfer capacity in the channel with a hydraulic radius of 1.44 mm within an acceptable uncertainty. It indicates that it can accurately simulate helium–xenon’s flow heat transfer capacity in the pipeline with a similar hydraulic diameter.
Because previous studies were primarily based on straight pipes, the forward extension section of the entrance section of the Zig pipeline is compared with those of previous studies. Dragunov et al. [36] conducted an experimental study on the Petukhov correlation optimized by Sleicher and Rouse [37] and verified its reliability in predicting He–Xe’s flow heat transfer performance. The Petukhov correlation is shown as follows:
N u = N u 0 T w T b n , n = 0.25 · lg T w a l l T b u l k + 0.3
N u 0 = ξ / 8 R e P r 1.07 + 12.7 ξ 8 P r 2 / 3 1
ξ = 0.316 R e 0.25
The above correlations apply to predicting the heat transfer capacity of the flow of He–Xe in tubes under turbulent conditions. The comparison between numerical simulation results and correlation predictions is shown in Figure 7.
It can be concluded from Figure 7 that the CFD simulation results agree with these correlation predictions. The most significant uncertainty occurs when the Re number is 6000, which is 9.8%. Therefore, the turbulence model and mesh employed in this paper are suitable for simulating He–Xe’s convection heat transfer phenomena in channels.
In summary, empirical correlations are employed to verify the accuracy of the obtained results, and experimental studies are used to verify the reliability of the proposed method. It can be inferred from the comparisons that the numerical simulation method utilized in this paper can obtain the flow heat transfer characteristics of helium–xenon in the channel within an acceptable uncertainty.

3. Results and Discussion

3.1. Analysis of Factors Determining He–Xe Heat Transfer in Channel

3.1.1. Theoretical Analysis

The current study on Zig channels described above has concluded that the channels with a shape factor of tan 57.5 ° have a specific advantage when the working medium is He [18]. In this section, the heat transfer capacity of He–Xe inside Zig channels with a shape factor of tan 57.5 ° will be discussed, providing theoretical guidance for the structural optimization of the channel. As a fluid with a specific low Pr Prandtl number, He–Xe fundamentally differs from liquid metals with low Pr numbers. For liquid metals, their low Pr numbers are due to their excellent thermal conductivity [38]. On the other hand, He–Xe is caused by the change of thermophysical parameters caused by different mixing ratios, as shown in Figure 8.
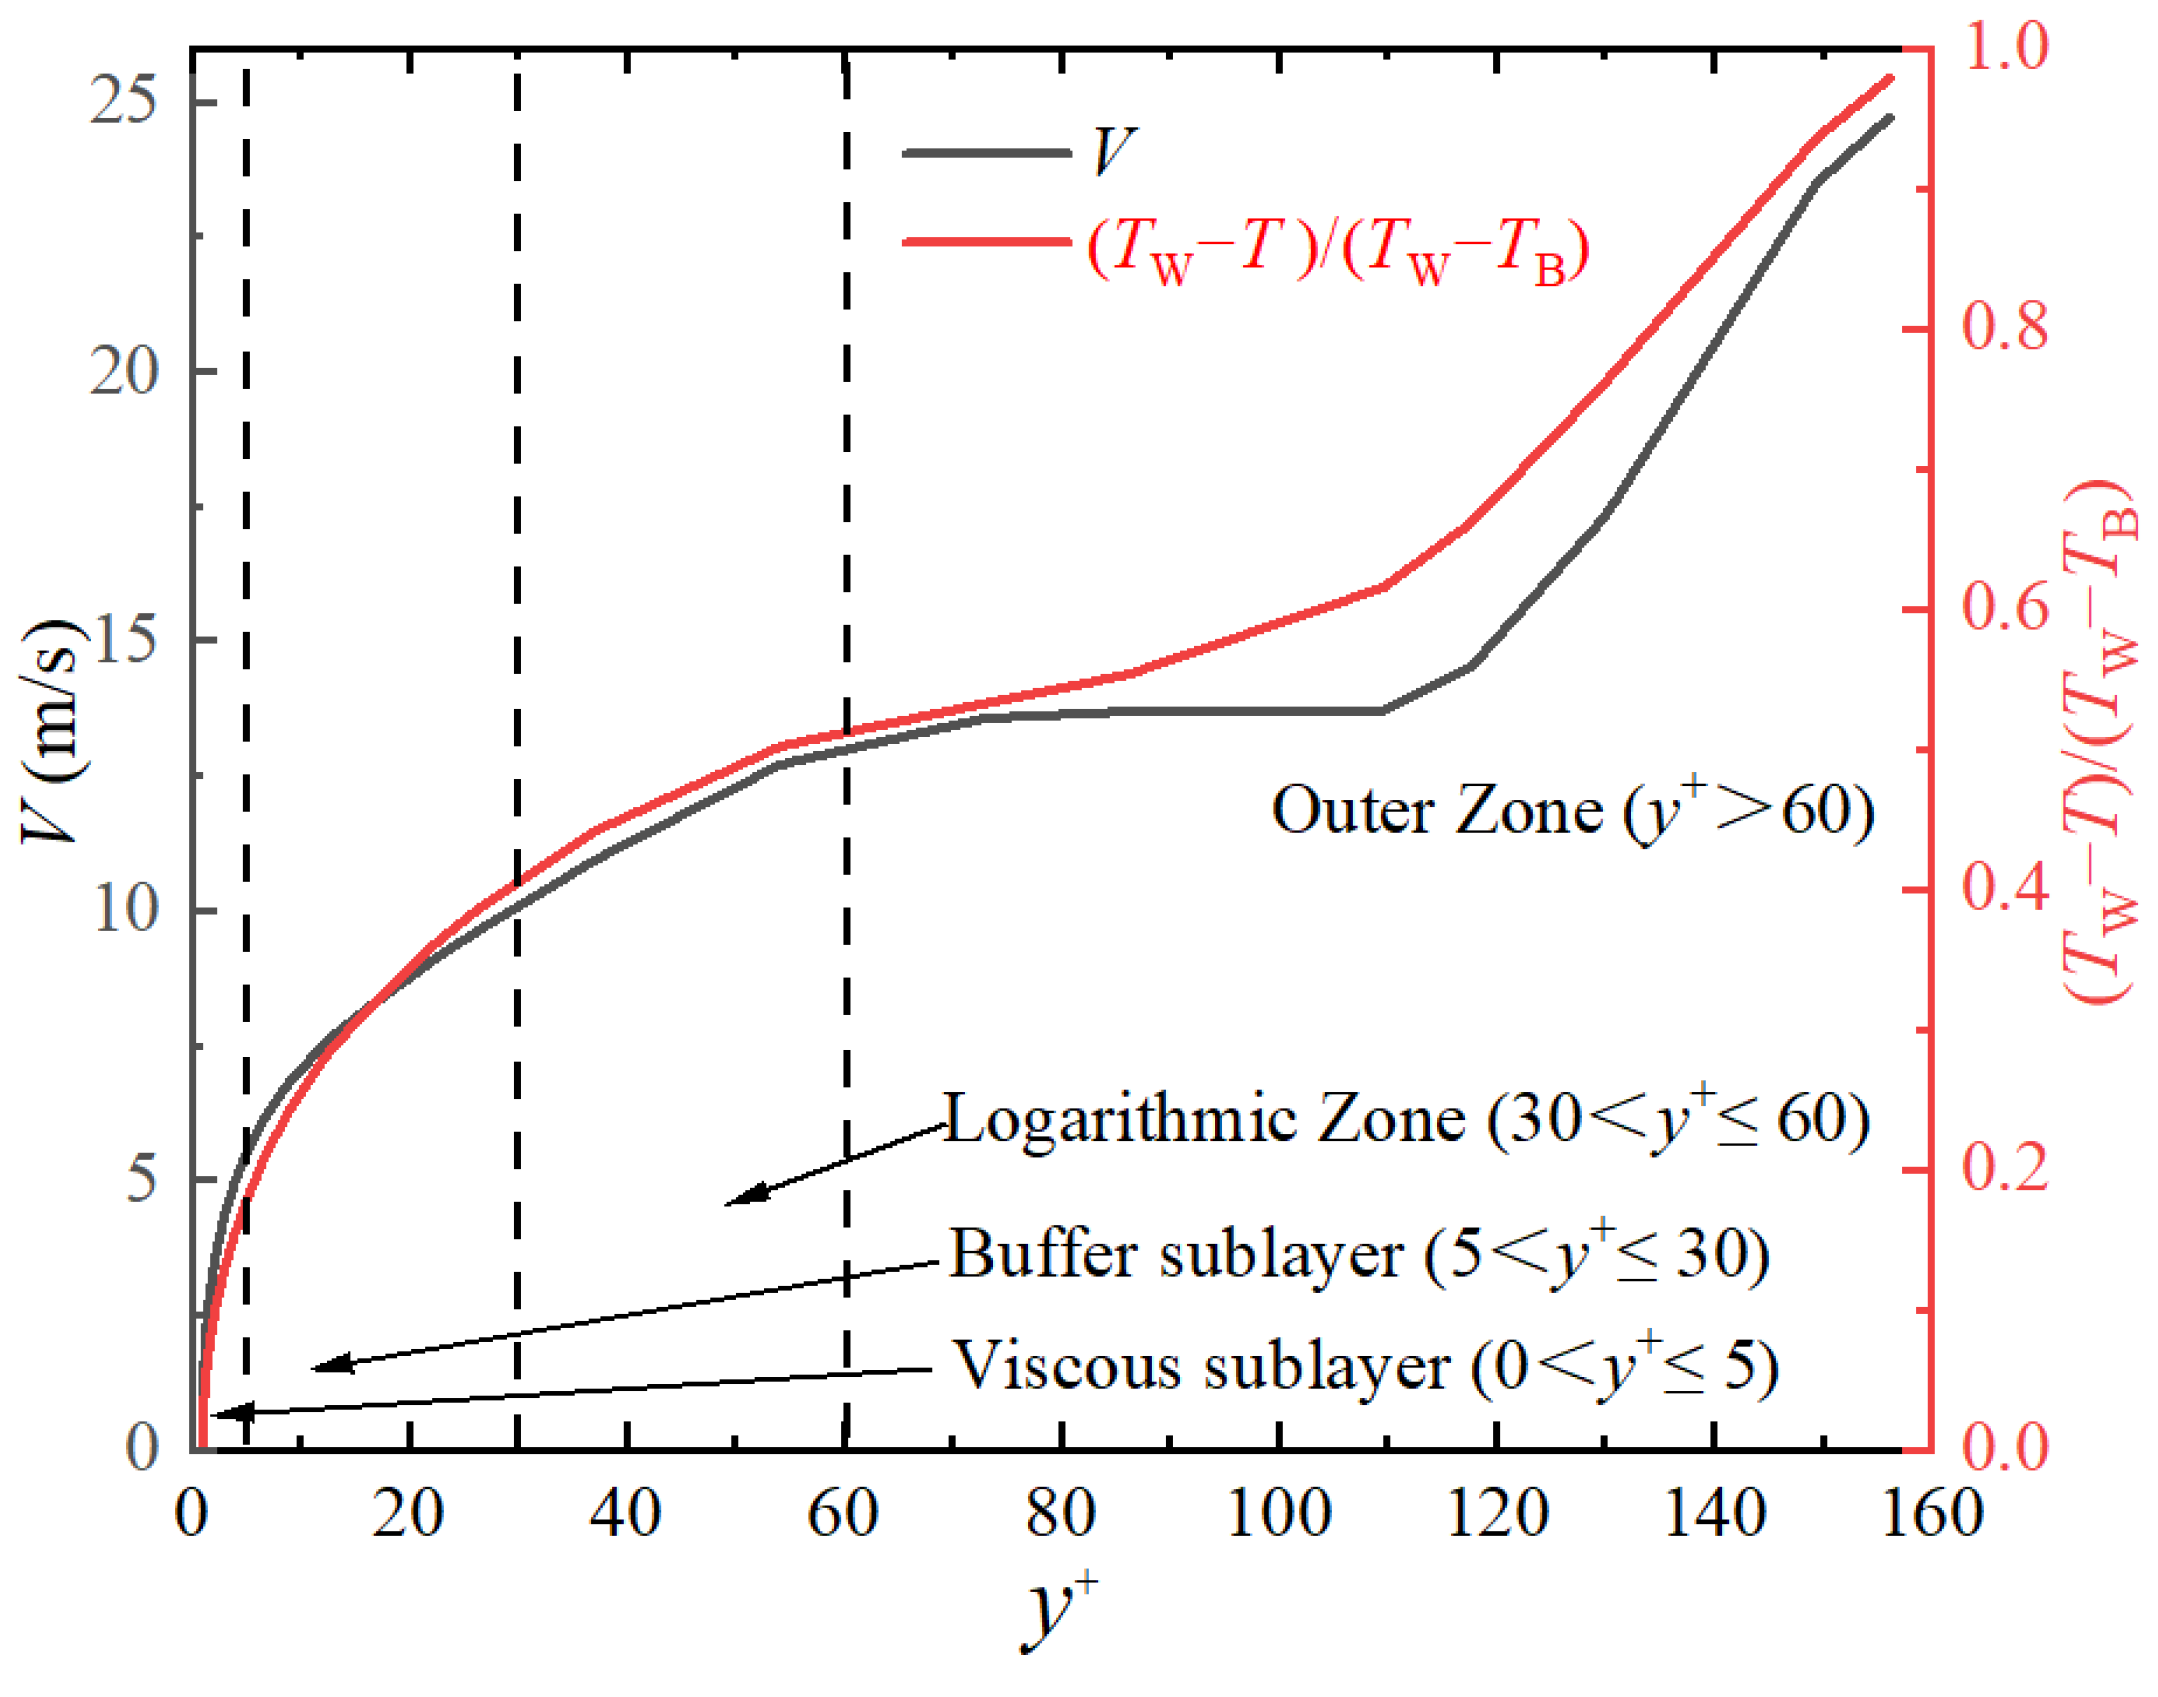
The physical properties make the heat transfer process of He–Xe in turbulence flow significantly different from that of liquid metal and air [39]. Figure 9 shows the radial velocity and temperature distribution of He–Xe, the composition of which is 29% Xe and 71% He, near the wall in a channel under the condition that the heat flux is 1 kW/m2 and the inlet Re is 2500.
It can be observed from Figure 9 that the temperature distribution of He–Xe inside the pipe presents different tendencies with the increase of y+. The difference of y+ of the flow layer (sublayers) means that the main contribution of flow stress in each flow layer is different [40].
It can be found from Figure 9 and Figure 10 that the velocity and temperature of the He–Xe flow field are linearly distributed with the increase of y+ under the influence of viscous force in the Viscous layer (y+ < 5). Meanwhile, the effect of Reynolds stress in the flow domain gradually appears in the Buffer sublayer (5 < y+ ≤ 30), where the velocity and temperature distribution no longer linearly increase with the increase of y+. However, the temperature distribution presents a different profile in and outside the Logarithmic zone (y+ > 30). Reynolds stress gradually becomes the main contributor to total flow stress in this zone, which indicates that the turbulence feature determines the temperature distribution of the He–Xe flow field in this zone. In turbulence flow, the heat flux introduced by the presence of vortices is defined as follows:
v T = λ t T y
where λ t is defined as turbulent thermal diffusivity, which is used to characterize the heat transfer capacity of turbulence [41]. Schlichting et al. [42] pointed out that the convective heat transfer capacity and thermal conductivity capacity at the bottom layer of the boundary layer are of the same order of magnitude. The heat flux near the wall of the helium–xenon flow field in the channel can be expressed as follows:
q = Q ˙ M = T B T W r ln ( r r 1 ) λ v , e f f + ln ( r 1 r 2 ) λ b , e f f + ln ( r 2 r 3 ) λ l , e f f
q = Q ˙ M = T B T W δ v λ v , e f f + δ b λ b , e f f + δ l λ l , e f f
where r is the radius of the arc, r1= r δ v , r2= r1 − ( δ b + δ v ), and r3 = r2 − ( δ b + δ v + δ l ). The equivalent thermal diffusivity is composed of thermal diffusivity and turbulent thermal diffusivity, as shown below.
λ e f f = λ + λ t
The physical processes of Equations (21) and (22) are shown in Figure 11, respectively.
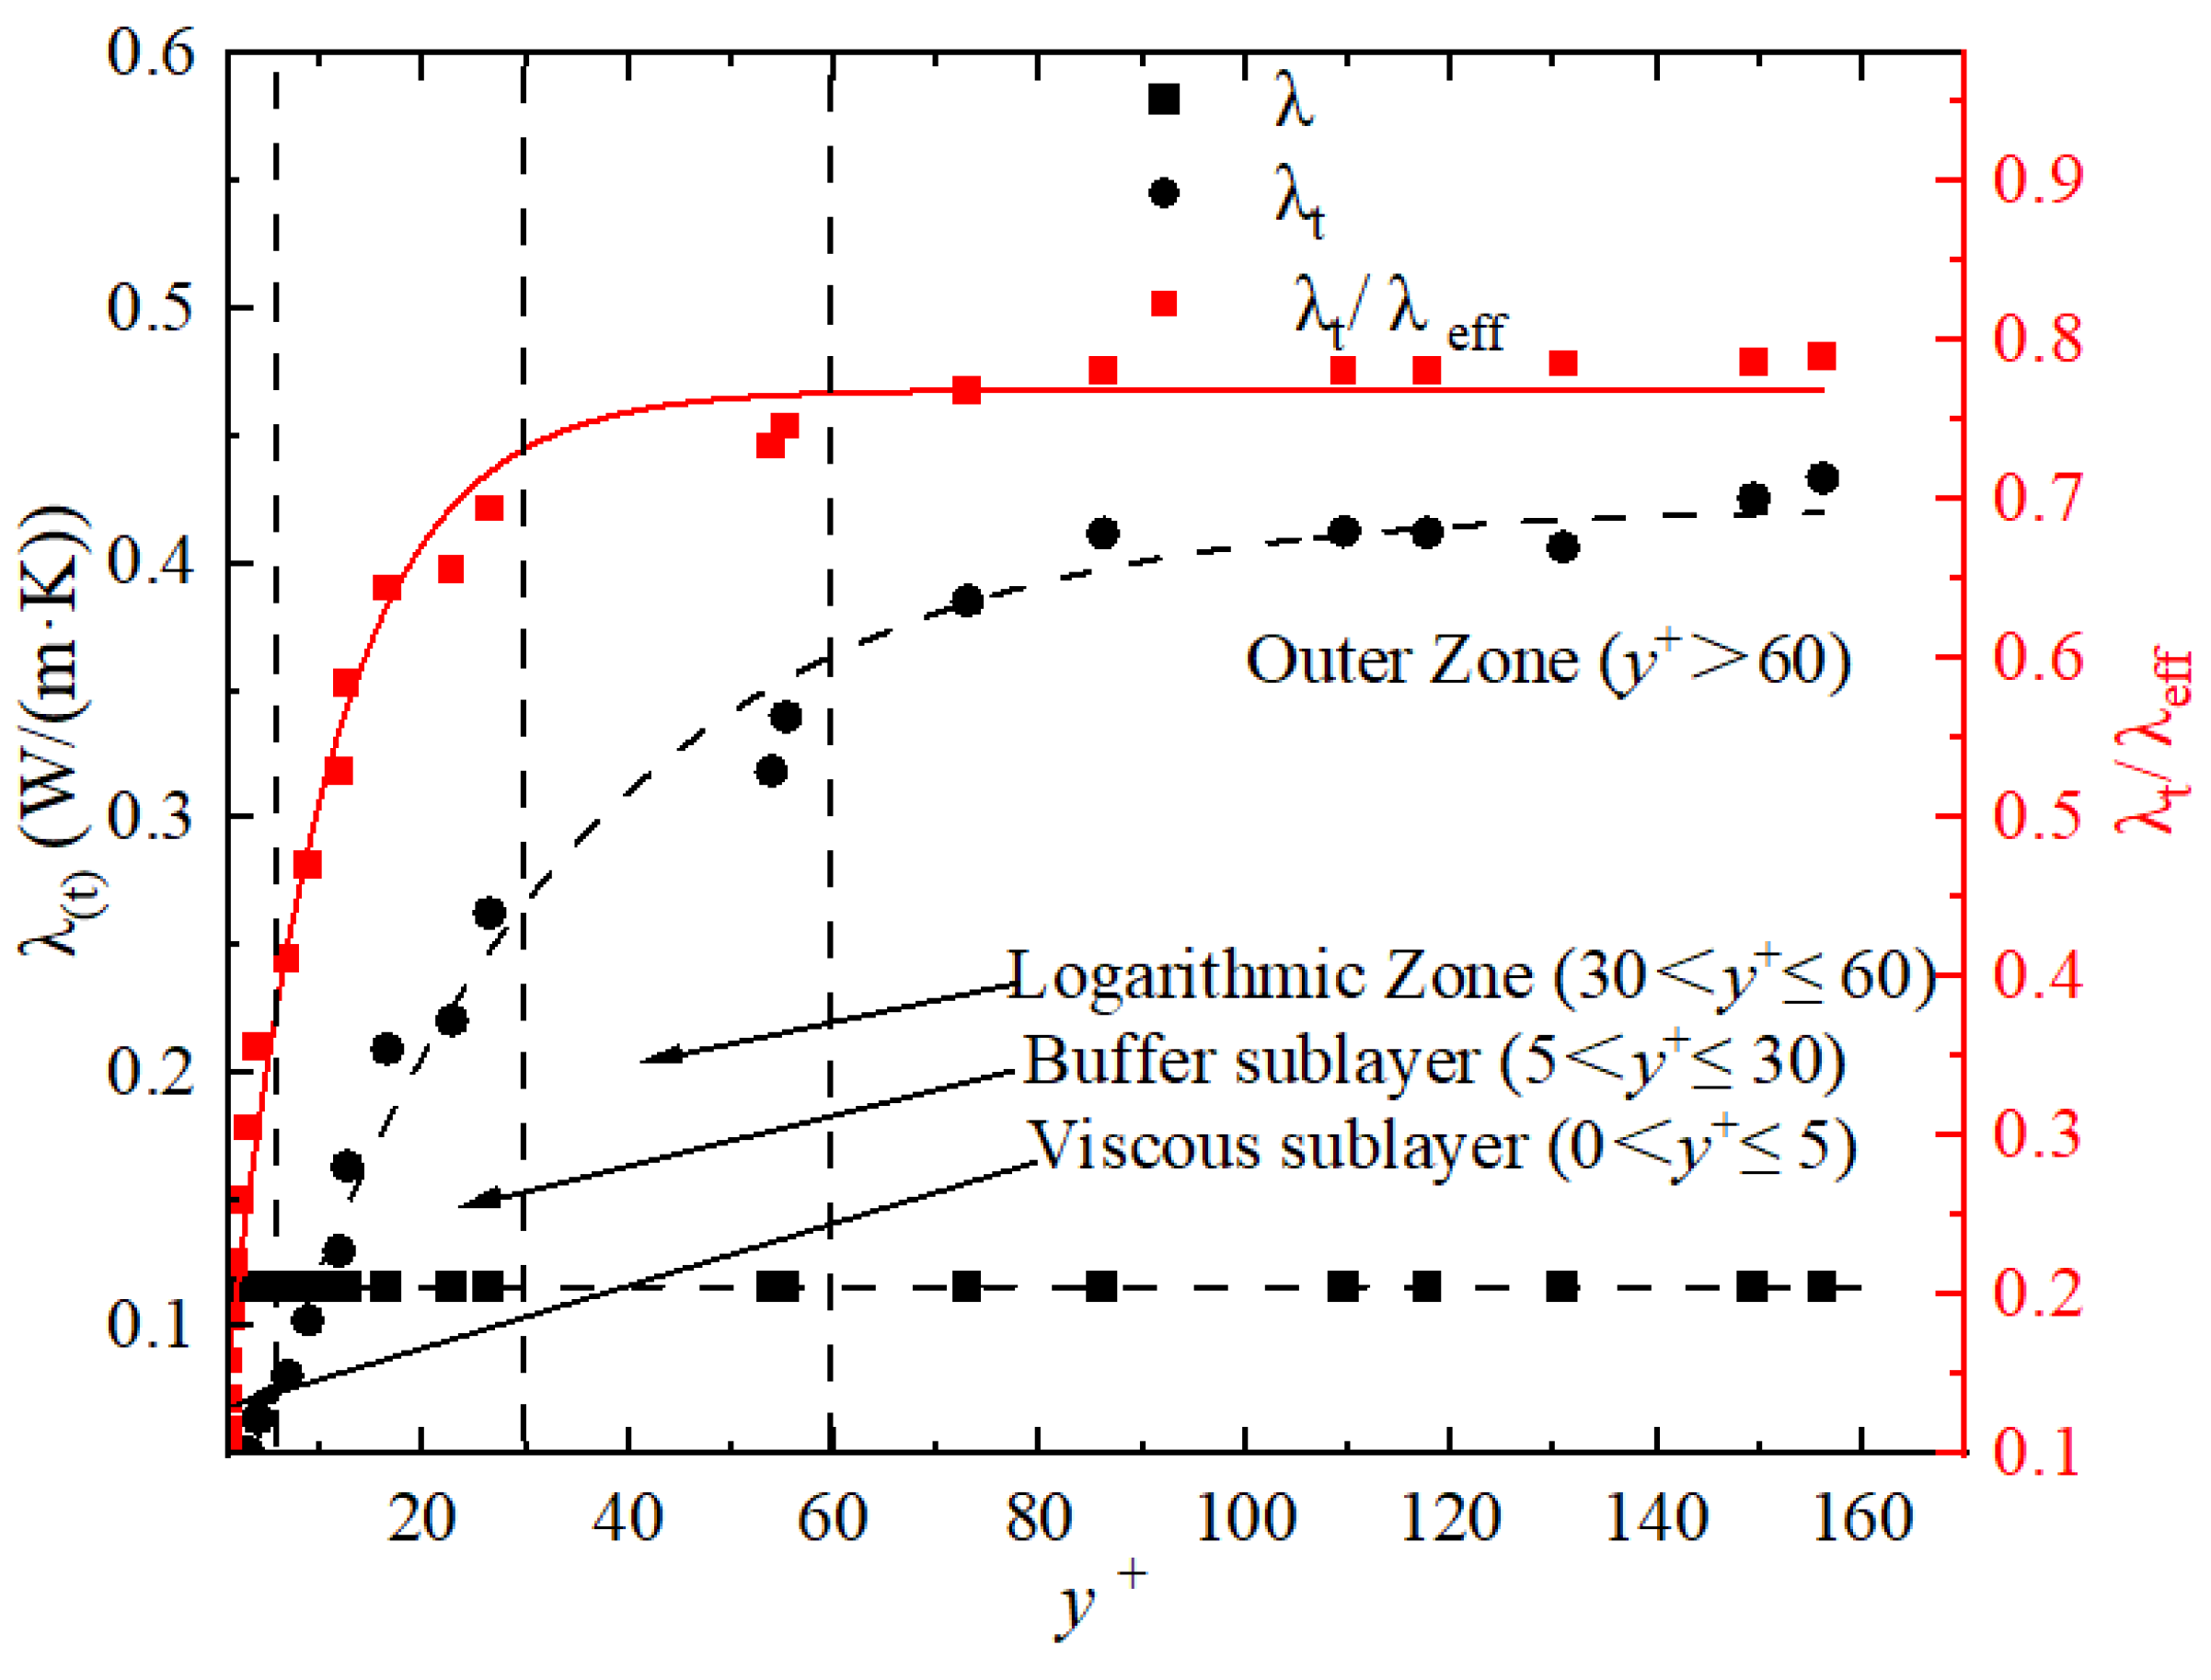
The contribution of λ and λ t to λ e f f , along with y+ in one local section, is shown in Figure 12.
It can be found that the turbulent thermal diffusivity outside the Buffer sublayer dramatically contributes to the equivalent thermal diffusivity. The turbulent thermal diffusivity almost accounts for more than 80% outside the logarithmic region. Therefore, it can be inferred that when He–Xe flows in the channels for heat transfer, the flow characteristics in and outside the logarithmic zone of the flow field play a decisive role in the local heat transfer capacity. Furthermore, the flow structure and the flow field state determine He–Xe’s local heat transfer capacity.

3.1.2. Numerical Verification

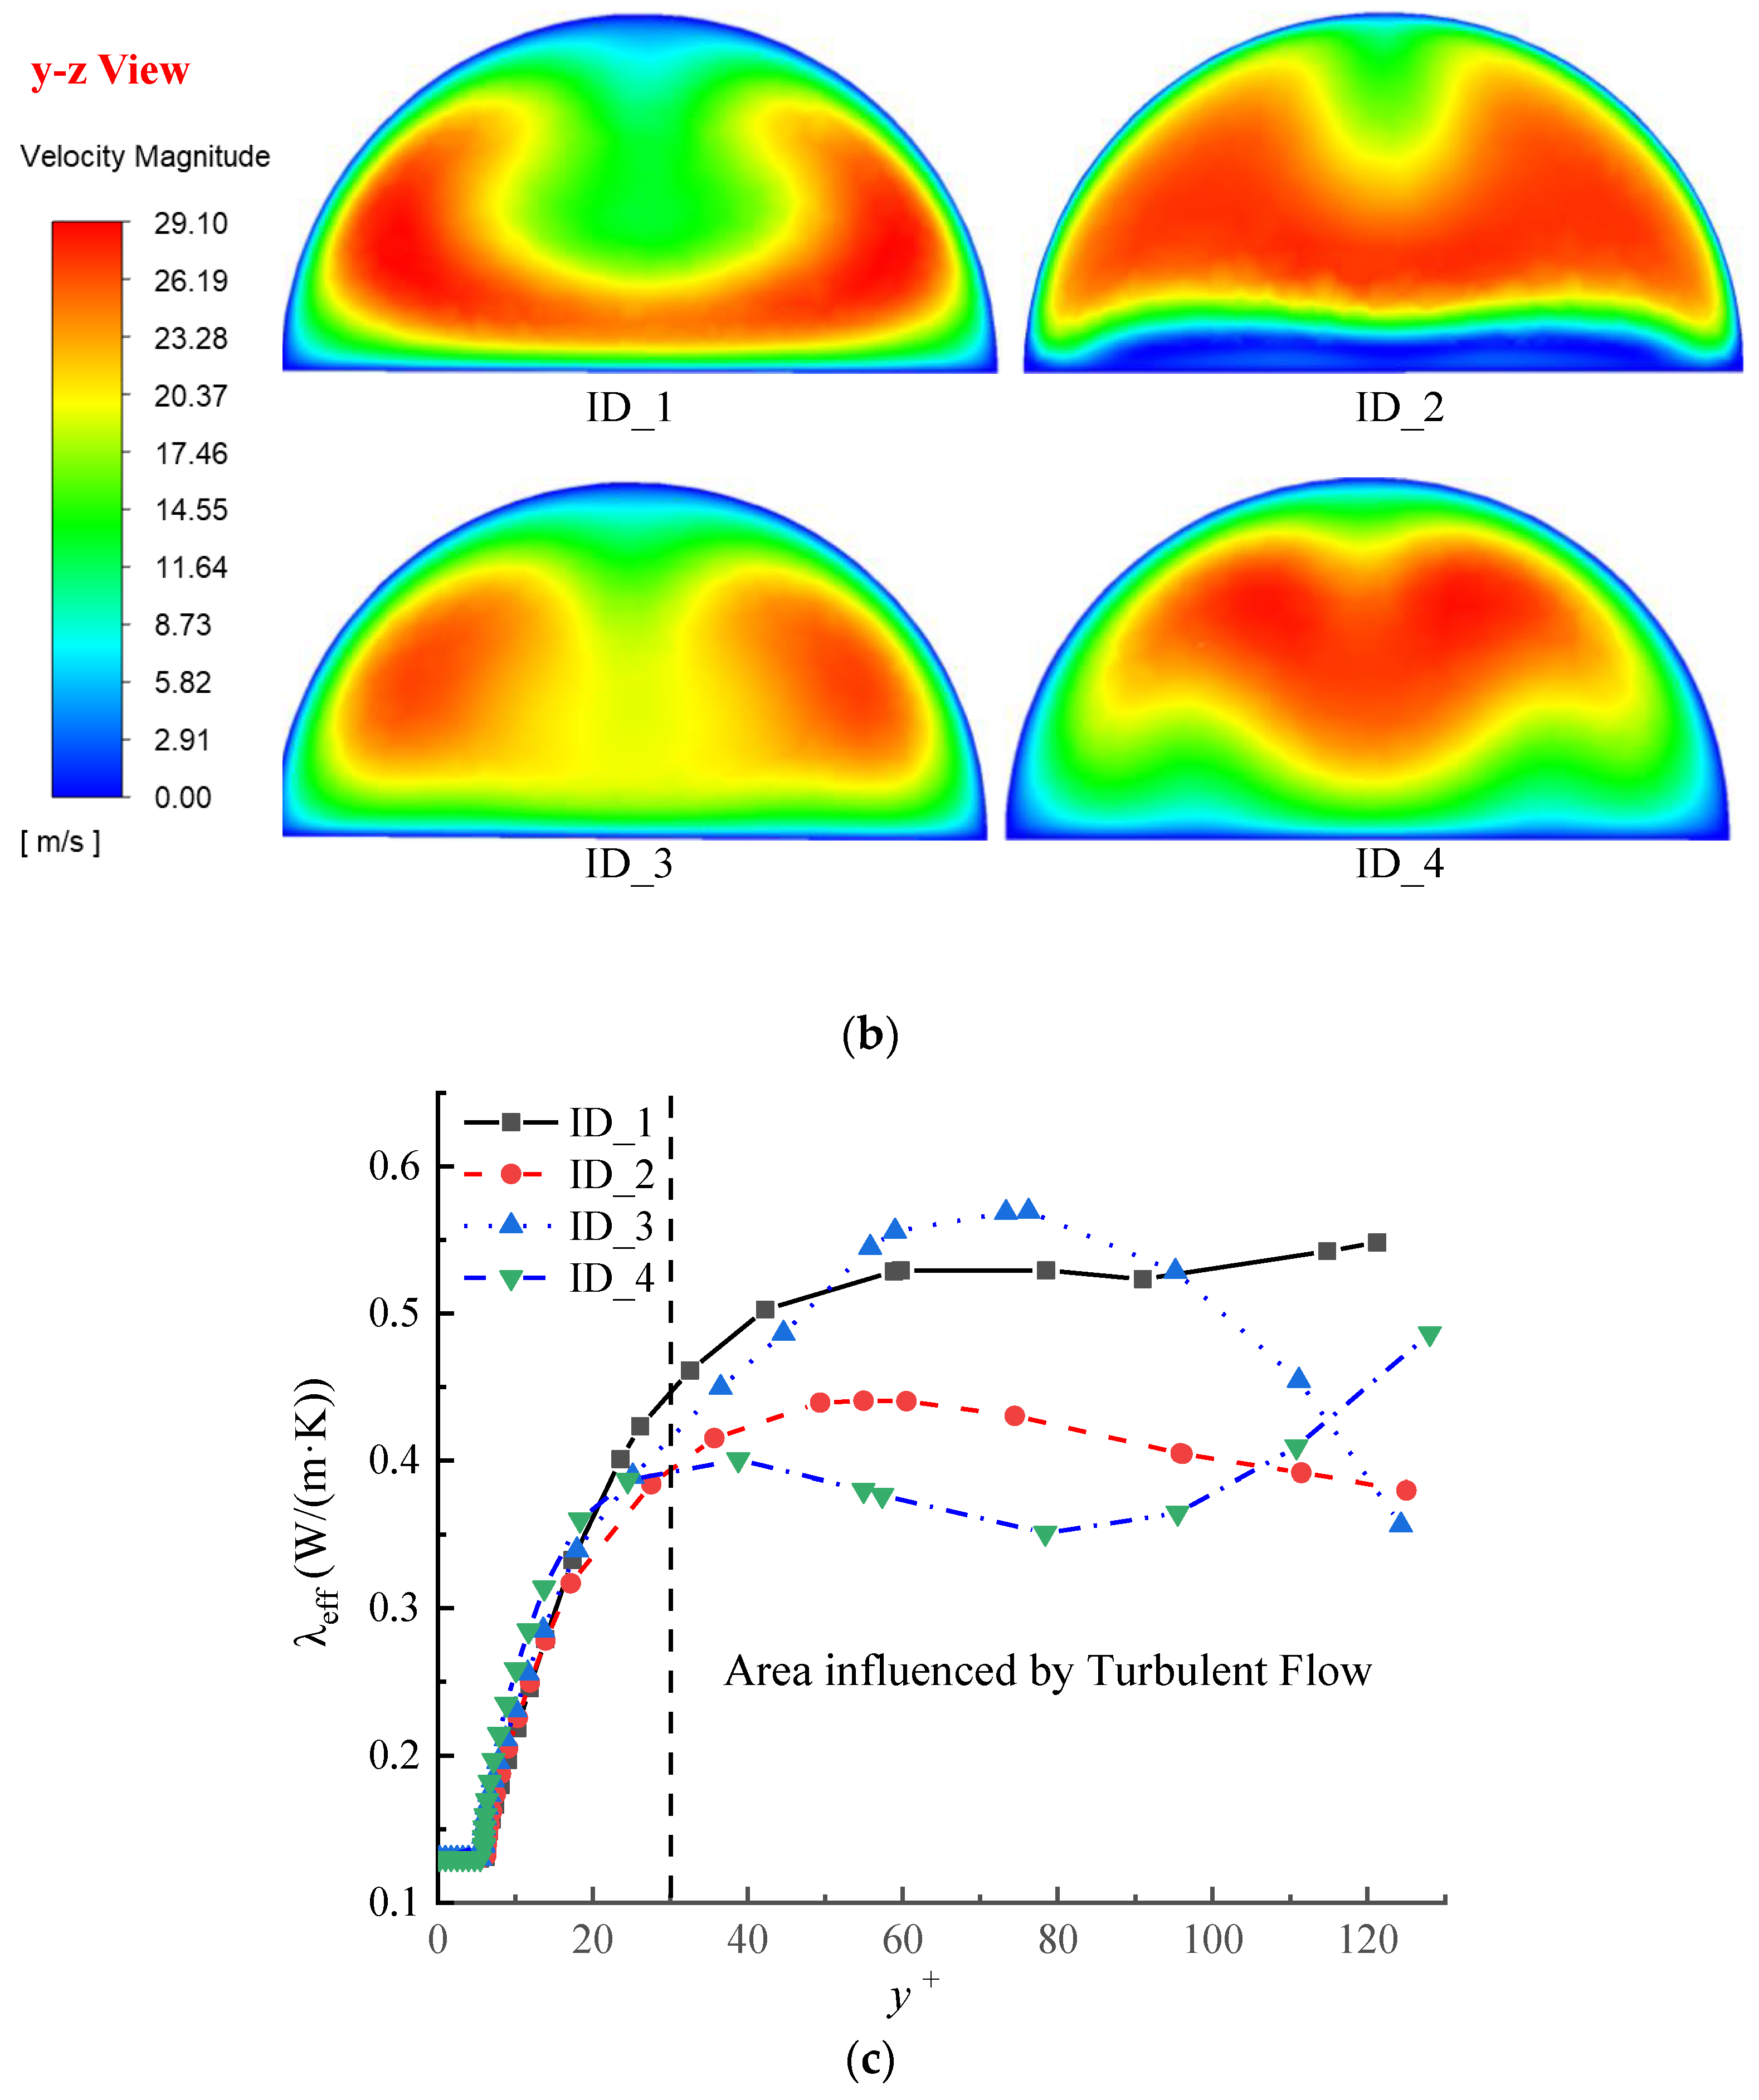
Some numerical simulations are further analyzed and discussed to verify the above analysis of the factors affecting He–Xe’s local heat transfer capacity in the channels. Figure 13 shows the velocity distributions of different sections and λ e f f distributions in a single period of a Zig channel with a Re of 2500 at the inlet.
The influence of flow channel configuration on the flow field can be obtained from the velocity distributions inside the flow channel. A dead flow zone with low velocity can be found around the corner due to the presence of the corner. Meanwhile, the velocity distribution of He–Xe in the channels also changes under the influence of the corner. The He–Xe flow detaches at the corner and induces a vortex at cross-section ID_3. The existence of the vortex transfers the velocity distribution pattern of the flow domain. It can be found that the velocity in the central region of the flow domain gradually decreases, and the velocity distribution in the section is flattened as well. Under the influence of velocity distribution, the equivalent thermal conductivity of cross-section ID_3 increases first and then gradually decreases with the increase of y+. In conclusion, the corner, inducing a vortex, transforms the velocity distribution characteristics of the flow domain, contributing to the tendency of the equivalent thermal conductivity of section ID_3 in Figure 13c. According to the analysis, the configuration has little effect on the heat transfer diffusivity of He–Xe near the wall, which is verified by the fact that the equivalent thermal conductivity of different sections is highly consistent in the viscous bottom and transition zone. In the region where y+ ≤ 30, all sections’ equivalent heat transfer coefficients linearly increase with the increase of y+. In and outside the logarithmic region (y+ > 30), the Reynolds stress dominates the stress region of the flow field. The effect of configuration on the local heat transfer capacity of He–Xe is reflected in the equivalent heat transfer diffusivity. The local equivalent heat transfer diffusivity presents different tendencies due to the different flow patterns in different sections. The phenomenon indicates that the heat transfer capacity of different sections is determined by the flow pattern of the local section.
The above numerical analysis verifies the previous analysis of He–Xe’s local heat transfer mechanism. It can be concluded that the flow pattern in the channel determines the heat transfer capacity of He–Xe. A dead flow zone and a low-velocity zone can be found inside the Zig channel from Figure 13a, which can also be found in other Zig channels. According to the conclusion above, the dead flow zone and low-velocity zone inevitably lead to the deterioration of the Zig channels’ local convective heat transfer capacity of He–Xe. The local convective heat transfer capacity (Nulocal) can be obtained as follows:
h l o c a l = q T w a l l T b u l k
N u l o c a l = h l o c a l D T λ
where T w a l l is the average temperature of the heating wall, and D T is the characteristic size of the channels. The N u l of the four cross-sections taken above are shown in Figure 14 as follows.
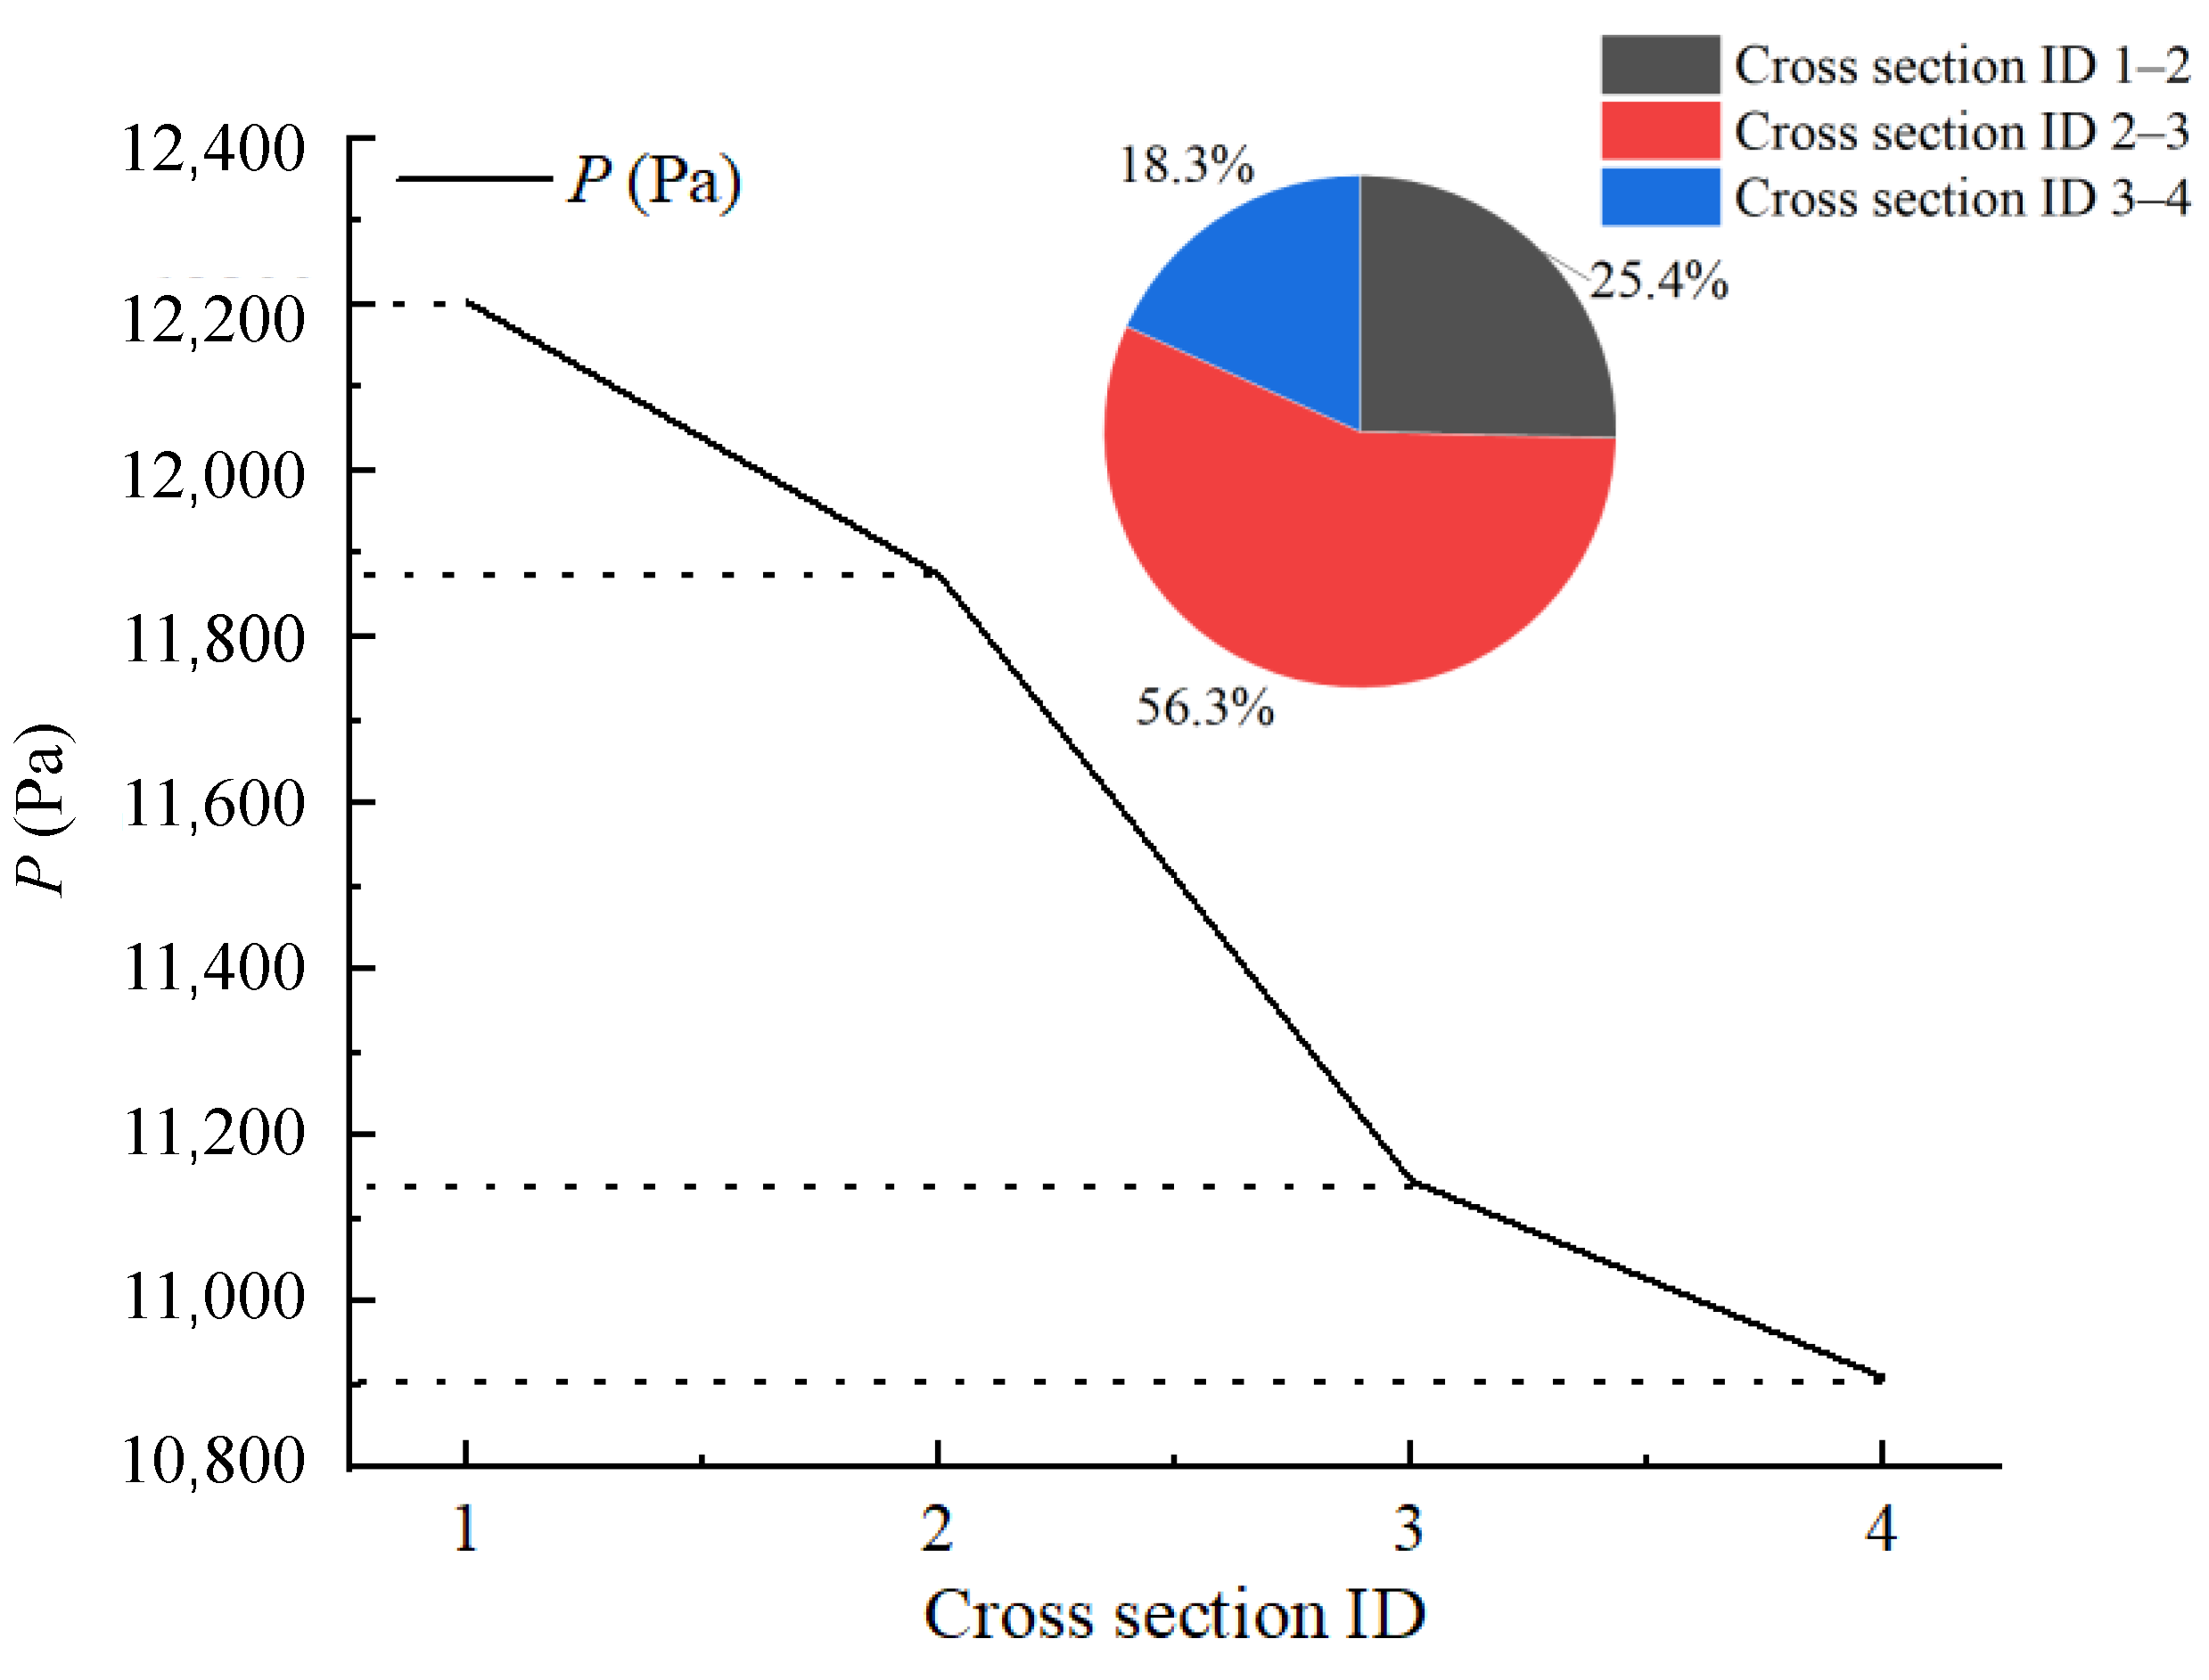
The local convective heat transfer capacity behind the flow dead zone is lower than that before the corner under the influence of the flow dead zone and low-velocity zone. Cross-section 1 is located in the straight channel before the corner with the highest Nulocal of 14.23. The influence of the flow dead zone on the heat transfer capacity in the channel has been shown in cross-section 2. The Nulocal of cross-section 2 is 13.69, lower than that of cross-section 1. Cross-section 3 is simultaneously affected by the flow dead zone and low-speed zone, obtaining the lowest Nulocal of 12.26. The heat transfer capacity of cross-section 4 is only affected by the low-speed zone, which turns out that the Nulocal (which is 12.6) of cross-section 4 is higher than that of cross-section 3. The presence of corners will worsen the local heat transfer capacity of He–Xe flow by analyzing the heat transfer capacity of different sections within a single period. The presence of corners also significantly affects the flow energy loss of the He–Xe flow inside the channel. The pressure drop between the four sections is presented in Figure 15 with an analysis of the contribution of the flow pressure drop between different sections to the total flow pressure drop between cross-sections 1–4. The details of pressure drops between different cross sections are displayed in Table 3.
It can be obtained from Figure 15 that the corner makes the pressure drop from Cross-section 2 to Cross-section 3 steep, contributing 56.3% of the total pressure loss between Plane 1 and Plane 4. The pressure drops between Cross-section 2 and Cross-section 3 only account for 27.3% of the total pressure drop in a single period. It can be found that the dead flow zone exacerbates the pressure loss inside the channel.
This chapter generally analyzes the flow heat mechanism of He–Xe flow, verifying that the channel’s central flow zone determines the flow’s heat transfer capacity. Optimizing the channel structures can improve the performance of the He–Xe flow in the Zig channel.

3.2. Configuration Comparison

Sine and Serpentine configurations are employed to reduce the influence of the dead flow zone. Channels with different shape factors are employed for numerical study under an inlet Re number of 2500 and a heating flux of 1 kW/m2. The flow pattern inside channels also shows a periodicity because of the structure periodicity.
As shown in Figure 16, the influence of the heating section inlet disappears in the third period and becomes evident periodicity in the subsequent flow channels. The fourth cycle is selected as the analysis object in this paper to guarantee that the analyzed flow pattern is not influenced by the entrance segment. A dimensionless criteria number based on the combination of the first and second laws of thermodynamics will be employed to elevate the thermodynamic performance of He–Xe inside different channels.
For the convenience of the analysis, N u a v e is obtained by replacing h l o c a l with h a v e and replacing λ with λ a v e in Equation (25) in a single period to characterize the forced convection heat transfer capacity of He–Xe in the channels within a single period. Several slices perpendicular to the heating wall are established to obtain the local heat transfer coefficient and local physical parameters in a single period. The average heat transfer coefficient of a single period channel can be obtained as follows:
h a v e = i = 1 n h l o c a l , i n
where h l o c a l , i is the local heat transfer coefficient of the ith cross-section. The λ a v e and N u a v e can be obtained as follows:
λ a v e = i = 1 n λ l o c a l , i n
N u a v e = i = 1 n N u l o c a l , i n
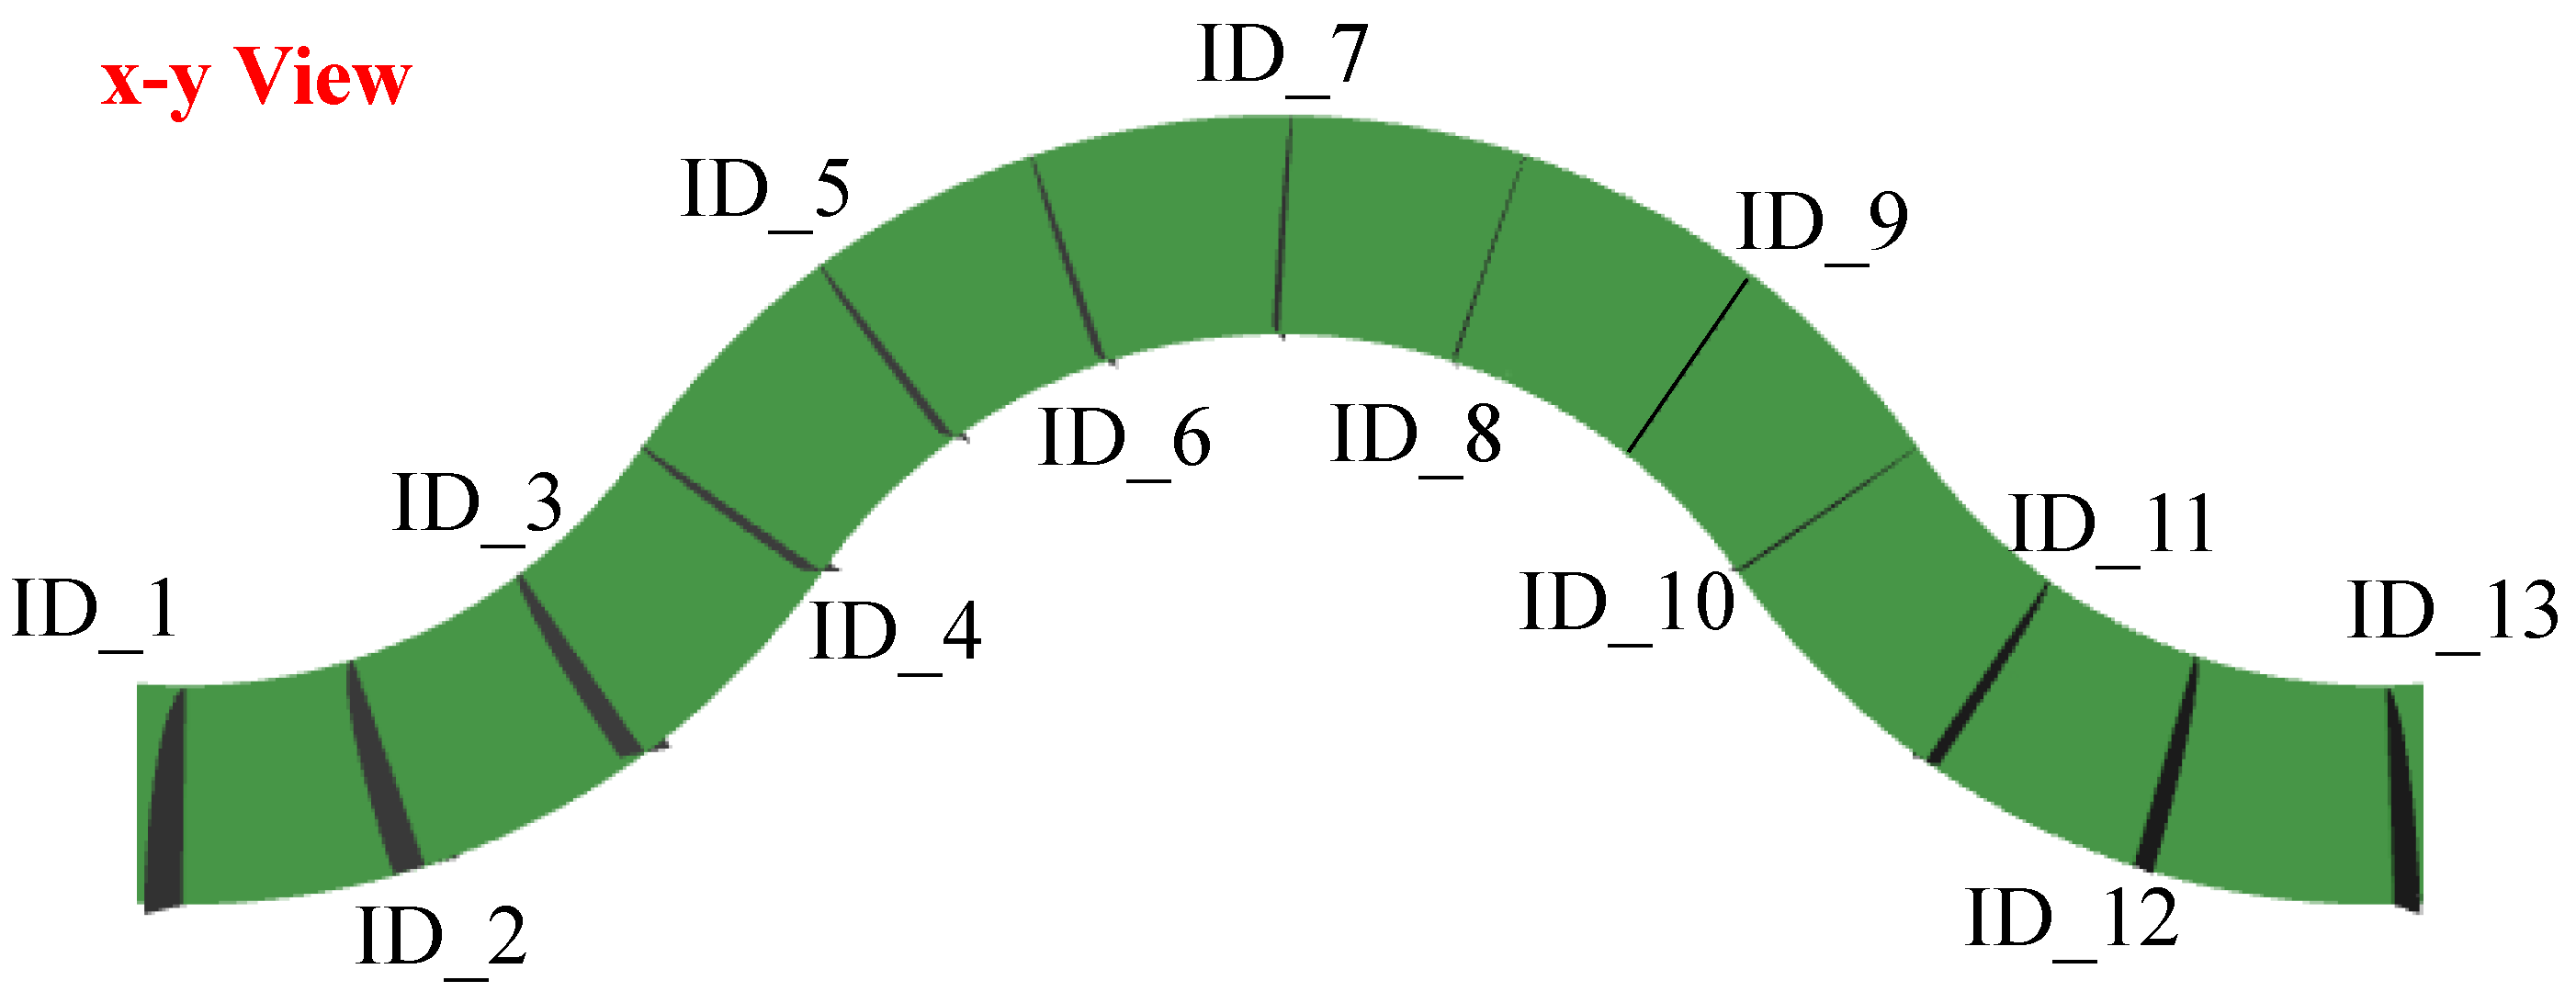
The cross-section, taking the Serpentine channel as an example, is displayed in Figure 17 as follows.
According to the study of Bejan [32], entropy generation can represent the irreversibility loss in the physical domain and the dissipation intensity of the flow domain from the second law of thermodynamics. The local entropy generation of the He–Xe flow heat transferring process in channels is shown as follows [34,43]:
S ˙ g e n = λ e f f T 2 T 2 h e a t t r a n s f e r + μ T 2 u i x i 2 + u i x j + u j x i 2 + ρ ε T D i s s i p a t i o n i n f l o w
The dimensionless Hesselgreaves number representing the irreversibility loss degree can be obtained as follows [34,43]:
N s = V S ˙ g e n d V Q ˙ T i n

3.2.1. Influence of the He–Xe Property

It is necessary to analyze the influence of the working-medium property on the heat transfer capacity of the flow pattern considering the characteristics of a low Pr number of He–Xe. The influence of the He–Xe property on heat transfer in the flow field in the Serpentine channel will be analyzed in this section. According to previous studies, Nu is a correlation function of Re, A, and Pr [25,26,27].
N u = f R e , A , P r
It should be pointed out that the existence of Pr in Equation (31) is to analyze the influence on heat transfer capacity of flow pattern introduced by the change of thermal physical properties of He–He with temperature. The characteristics of the flow pattern under different heating conditions are analyzed under the condition of the same shape factor and Rein to investigate the influence of the properties of He–Xe on the heat transfer capacity of the flow field in channels in Figure 18.
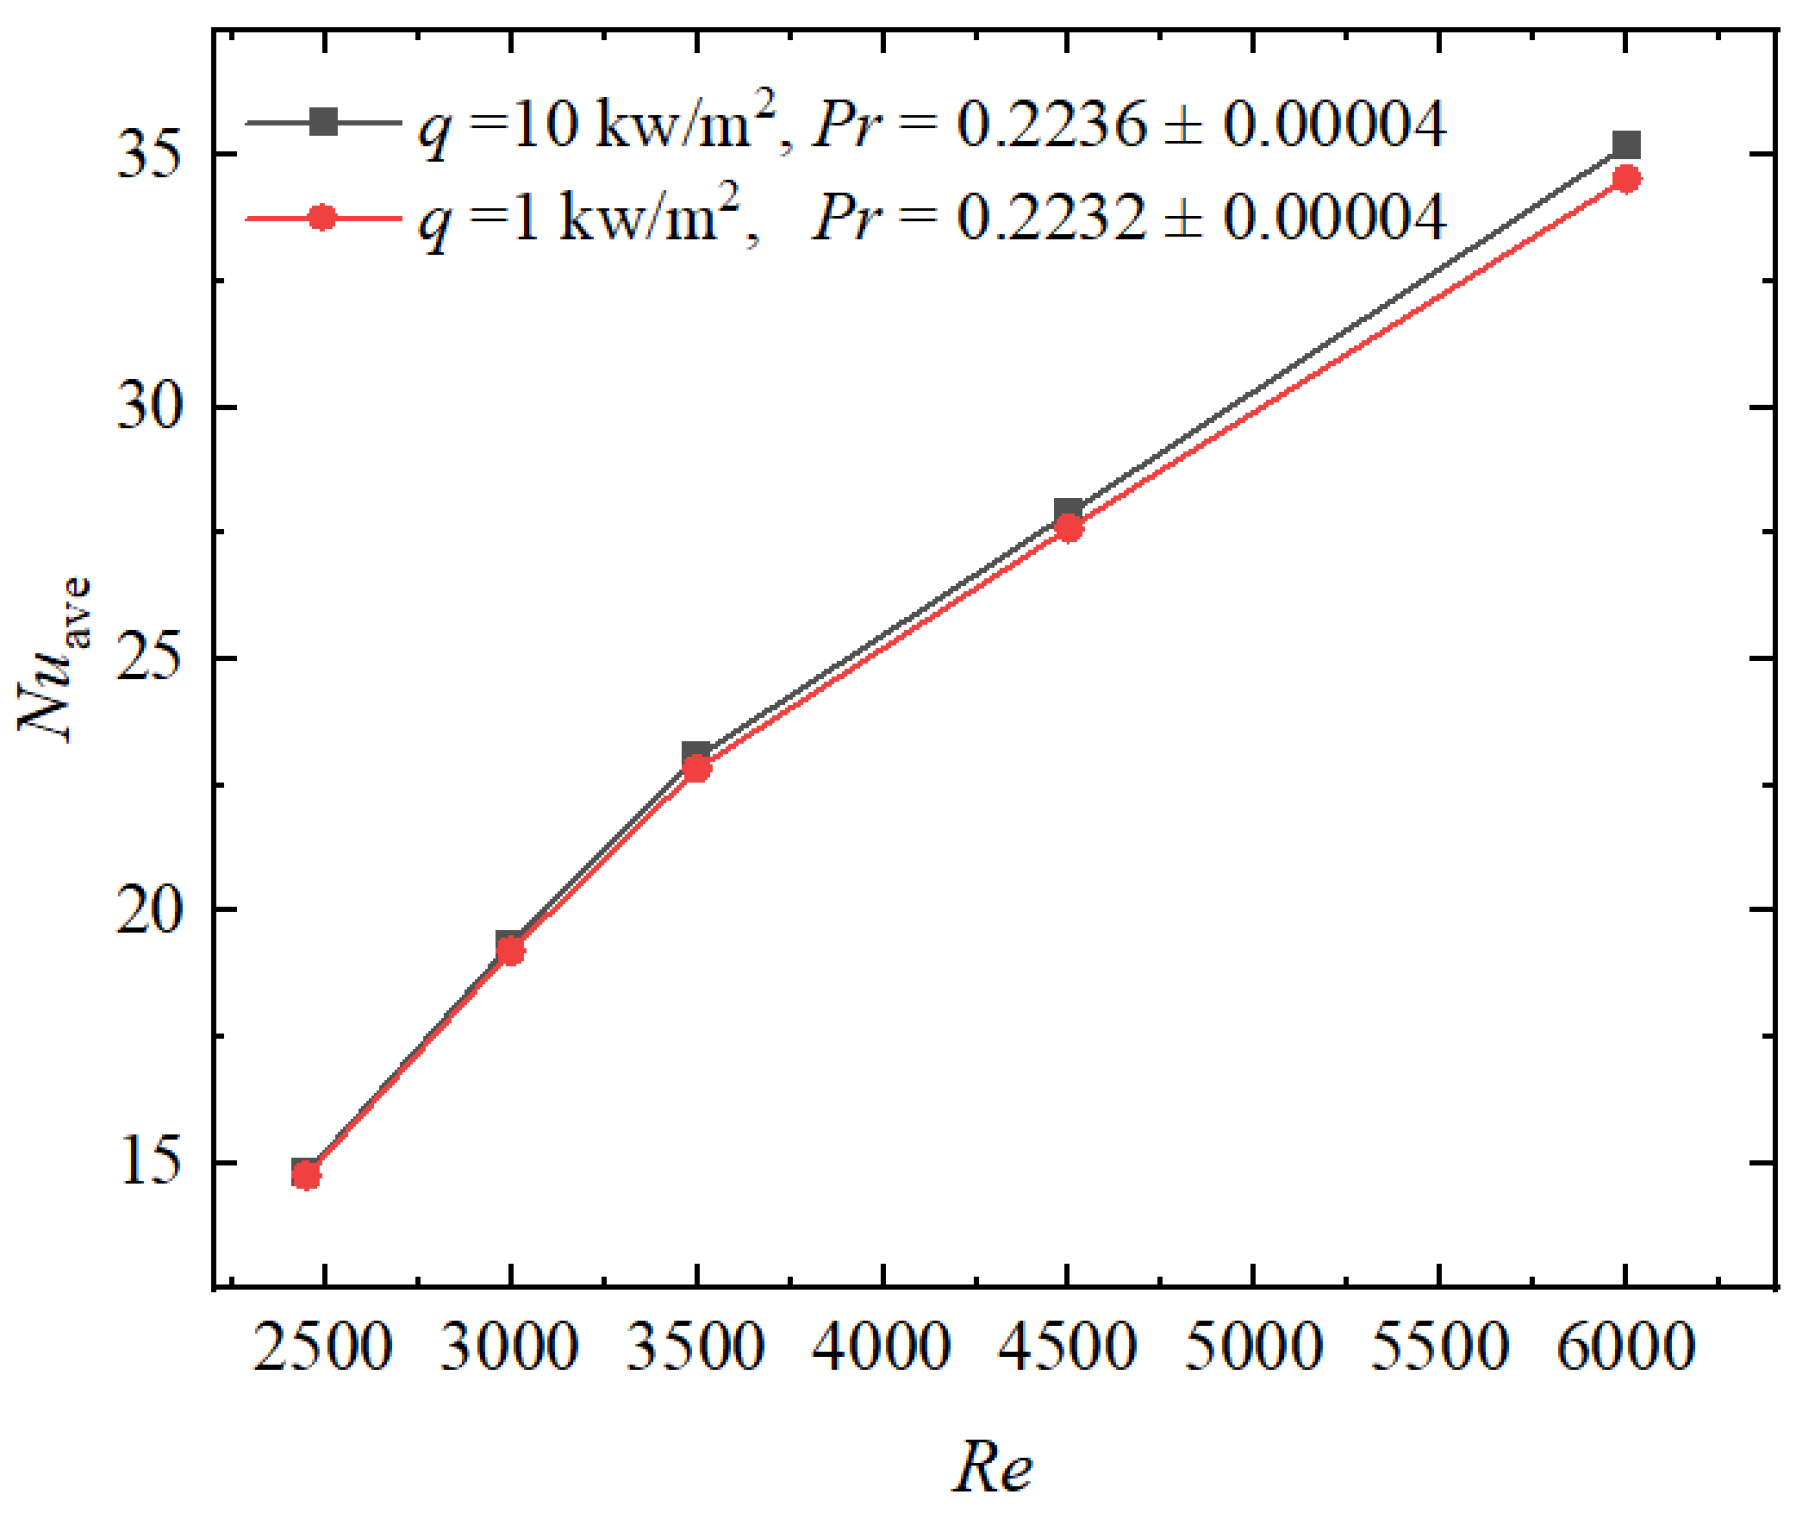
As shown in Figure 18 Pr increases with the increase of He–Xe temperature in the flow field. N u a v e increases as well. Figure 19 discusses the heat transfer capacity of He–Xe with fixed Pr under different Re numbers in a specific shape factor to further analyze the contribution of properties of He–Xe to the heat transfer capacity of He–Xe in a specified configuration.
It can be obtained from Figure 19 that the Nuave has a positive relationship with Pr. It is worth noting that the Nuave with a Pr of 0.2236 is gradually higher than that with a Pr of 0.2232 with the increase of Re. The difference in Nuave profiles indicates that the influence of properties of He–Xe on the heat transfer capacity of the flow field is stronger than that of the change of Re. The contributions of He–Xe’s physical property and Re to the shift of Nuave can be quantified as follows:
I f P r = P r i / P r j N u a v e , i / N u a v e , j
I f R e = R e i / R e j N u a v e , i / N u a v e , j
i and j stand for different working conditions. i stands for the working conditions with a constant Re of 2500, while j stands for the working conditions with a constant Re of 6000 in Equation (32). However, i stands for the working conditions with a constant Pr of 0.2232, while j stands for the working conditions with a constant Pr of 0.2236 in Equation (33). The larger the influence factor is, the more significant the corresponding feature cost of the flow field is in the process of N u a v e increasing. The larger the cost of the corresponding flow field characteristics, the more limited the influence of the flow field characteristics on the heat transfer capacity of He–Xe. The influence factor of Re, taking Pr equaling 0.2236 as an example, increases from 2500 to 6000 and is 1.045 under a fixed Pr. The influence factor is more significant than 1.0, which implies that the Re of the He–Xe flow inside channels needs to be increased by 1.045 times when N u a v e is doubled. However, the influence factor of Pr, taking Re equaling 6000 as an example, increases from 0.2232 to 0.2236 is 0.983 under a fixed Re. The influence factor is less than 1.0, which implies that the Pr of the He–Xe flow inside channels needs to be increased by 0.983 times when N u a v e is doubled.
In conclusion, the influence of the physical properties of He–Xe on the heat transfer capacity in channels is more remarkable than the Re of the flow pattern. It indicates that the higher the temperature of the He–Xe temperature, the stronger the heat transfer capacity of He–Xe obtained inside the channel, which provides a reference for optimizing the PCHE research employing He–Xe as a working medium.

3.2.2. Flow Heat Transfer Analysis in Different Configurations

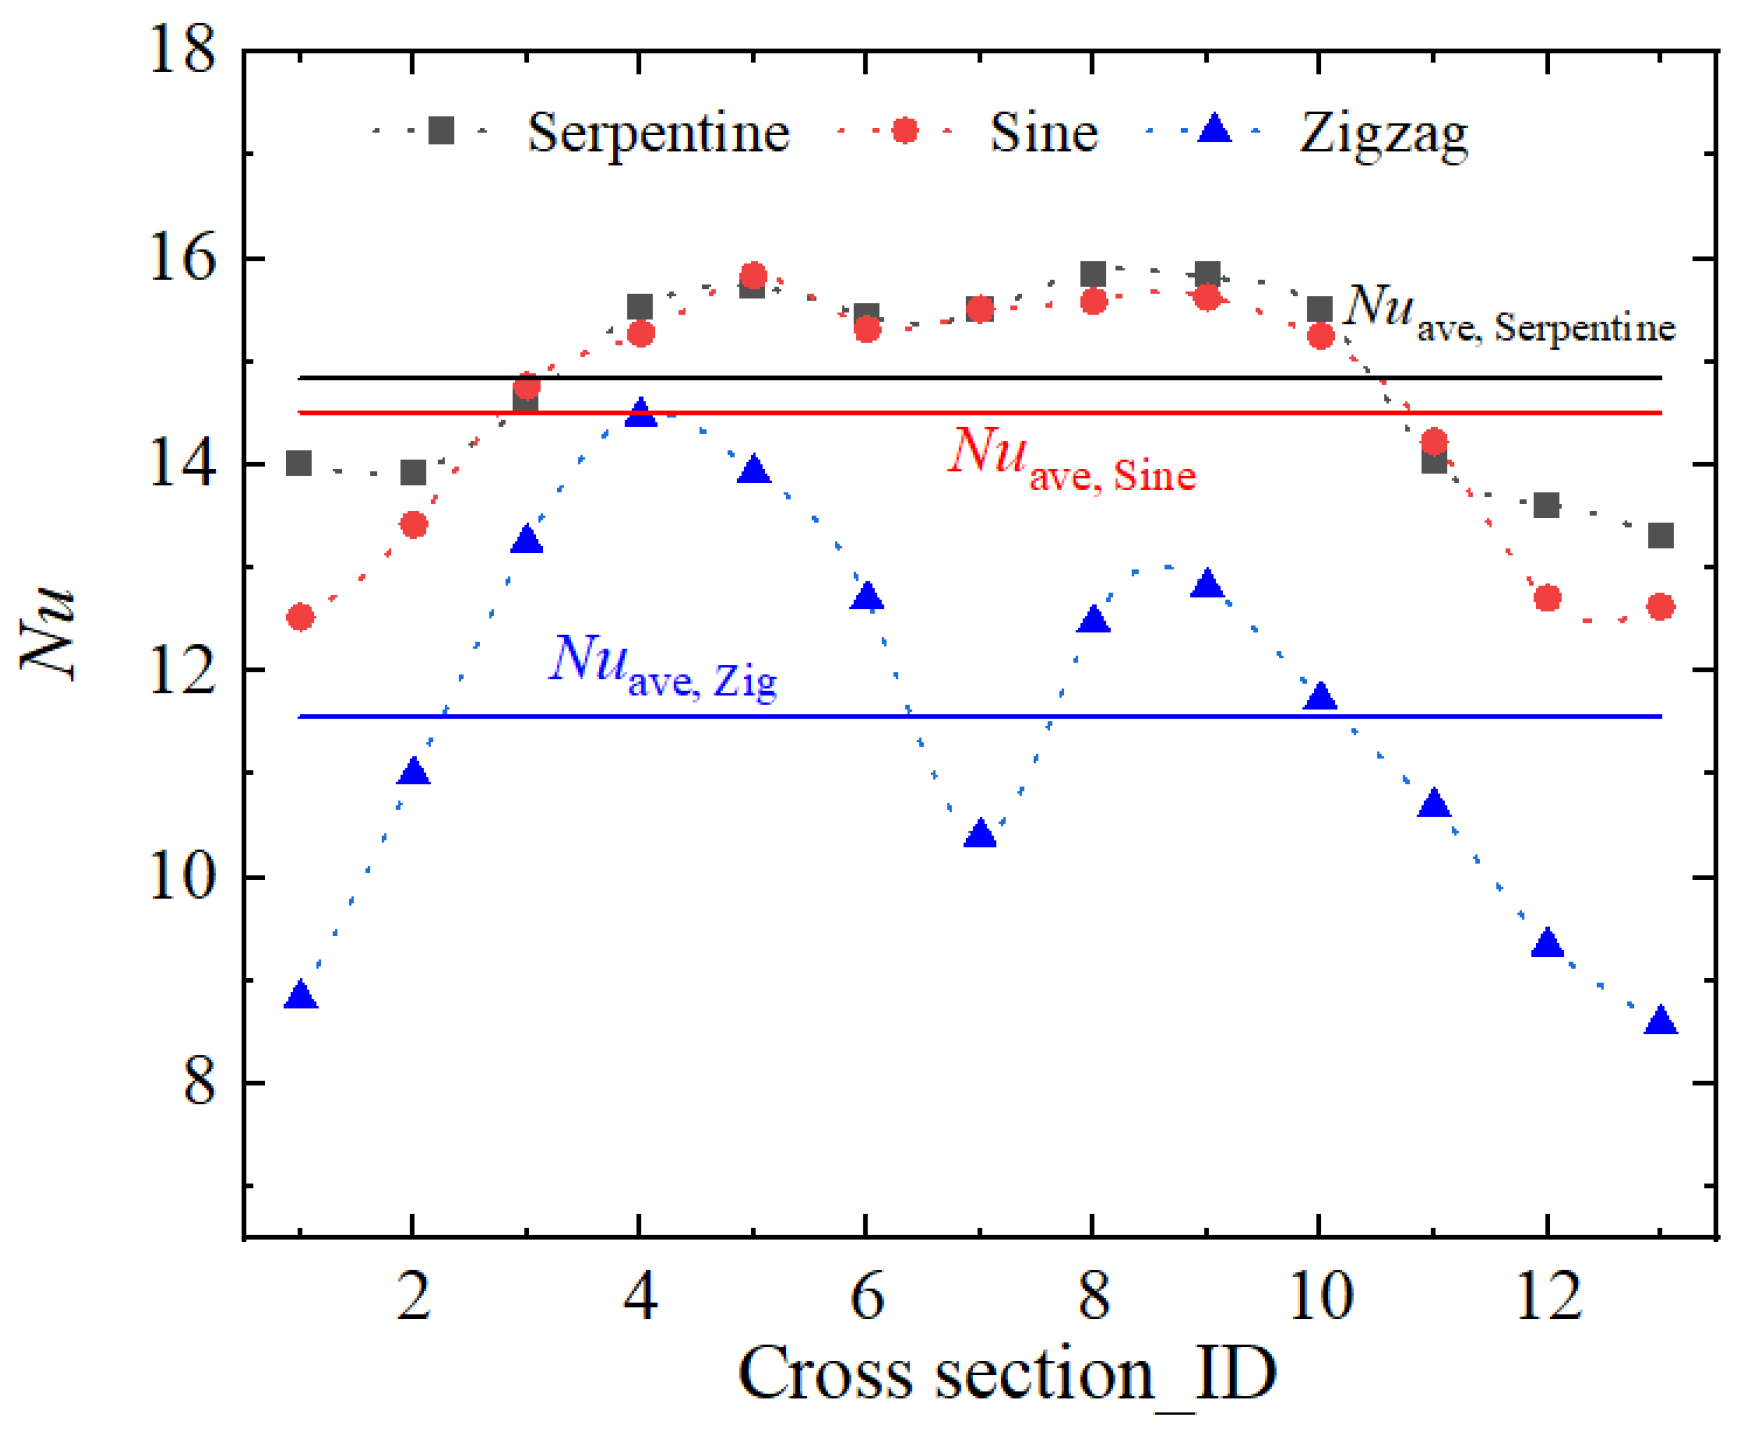
The N u a v e and N u l o c a l in a single period inside different configurations under the same working condition are as follows (Figure 20).
It can be obtained through comparison from Figure 20 that the heat transfer capacity of the three configurations presents different tendencies in a single period. The local Nu of the Zig channel is lower than that of the Sine and Serpentine channels everywhere in a single period. The Zig channel is featured with the lowest N u l o c a l among three configurations, which equals 11.5. The peak of the local Nu of the Sine channel and the Serpentine channel is similar in a single period: the local Nu peak value of the Sine channel is 15.8, and the local Nu peak value of the Serpentine channel is 15.78. The valley of local Nu, different from the peak value of local Nu, shows different phenomena between Sine and Serpentine channels in a single period. Specifically, the local Nu valley of the Sine channel is 12.5, while that of the Serpentine channel is 14.0. As a result, the N u l o c a l of the Serpentine channel is 14.84, slightly higher than that of the Sine channel. Notably, the Nu profile in the Serpentine channel is more evenly distributed during a period than that in the Sine channel. Therefore, the flow characteristics inside the pipeline should be analyzed as well.
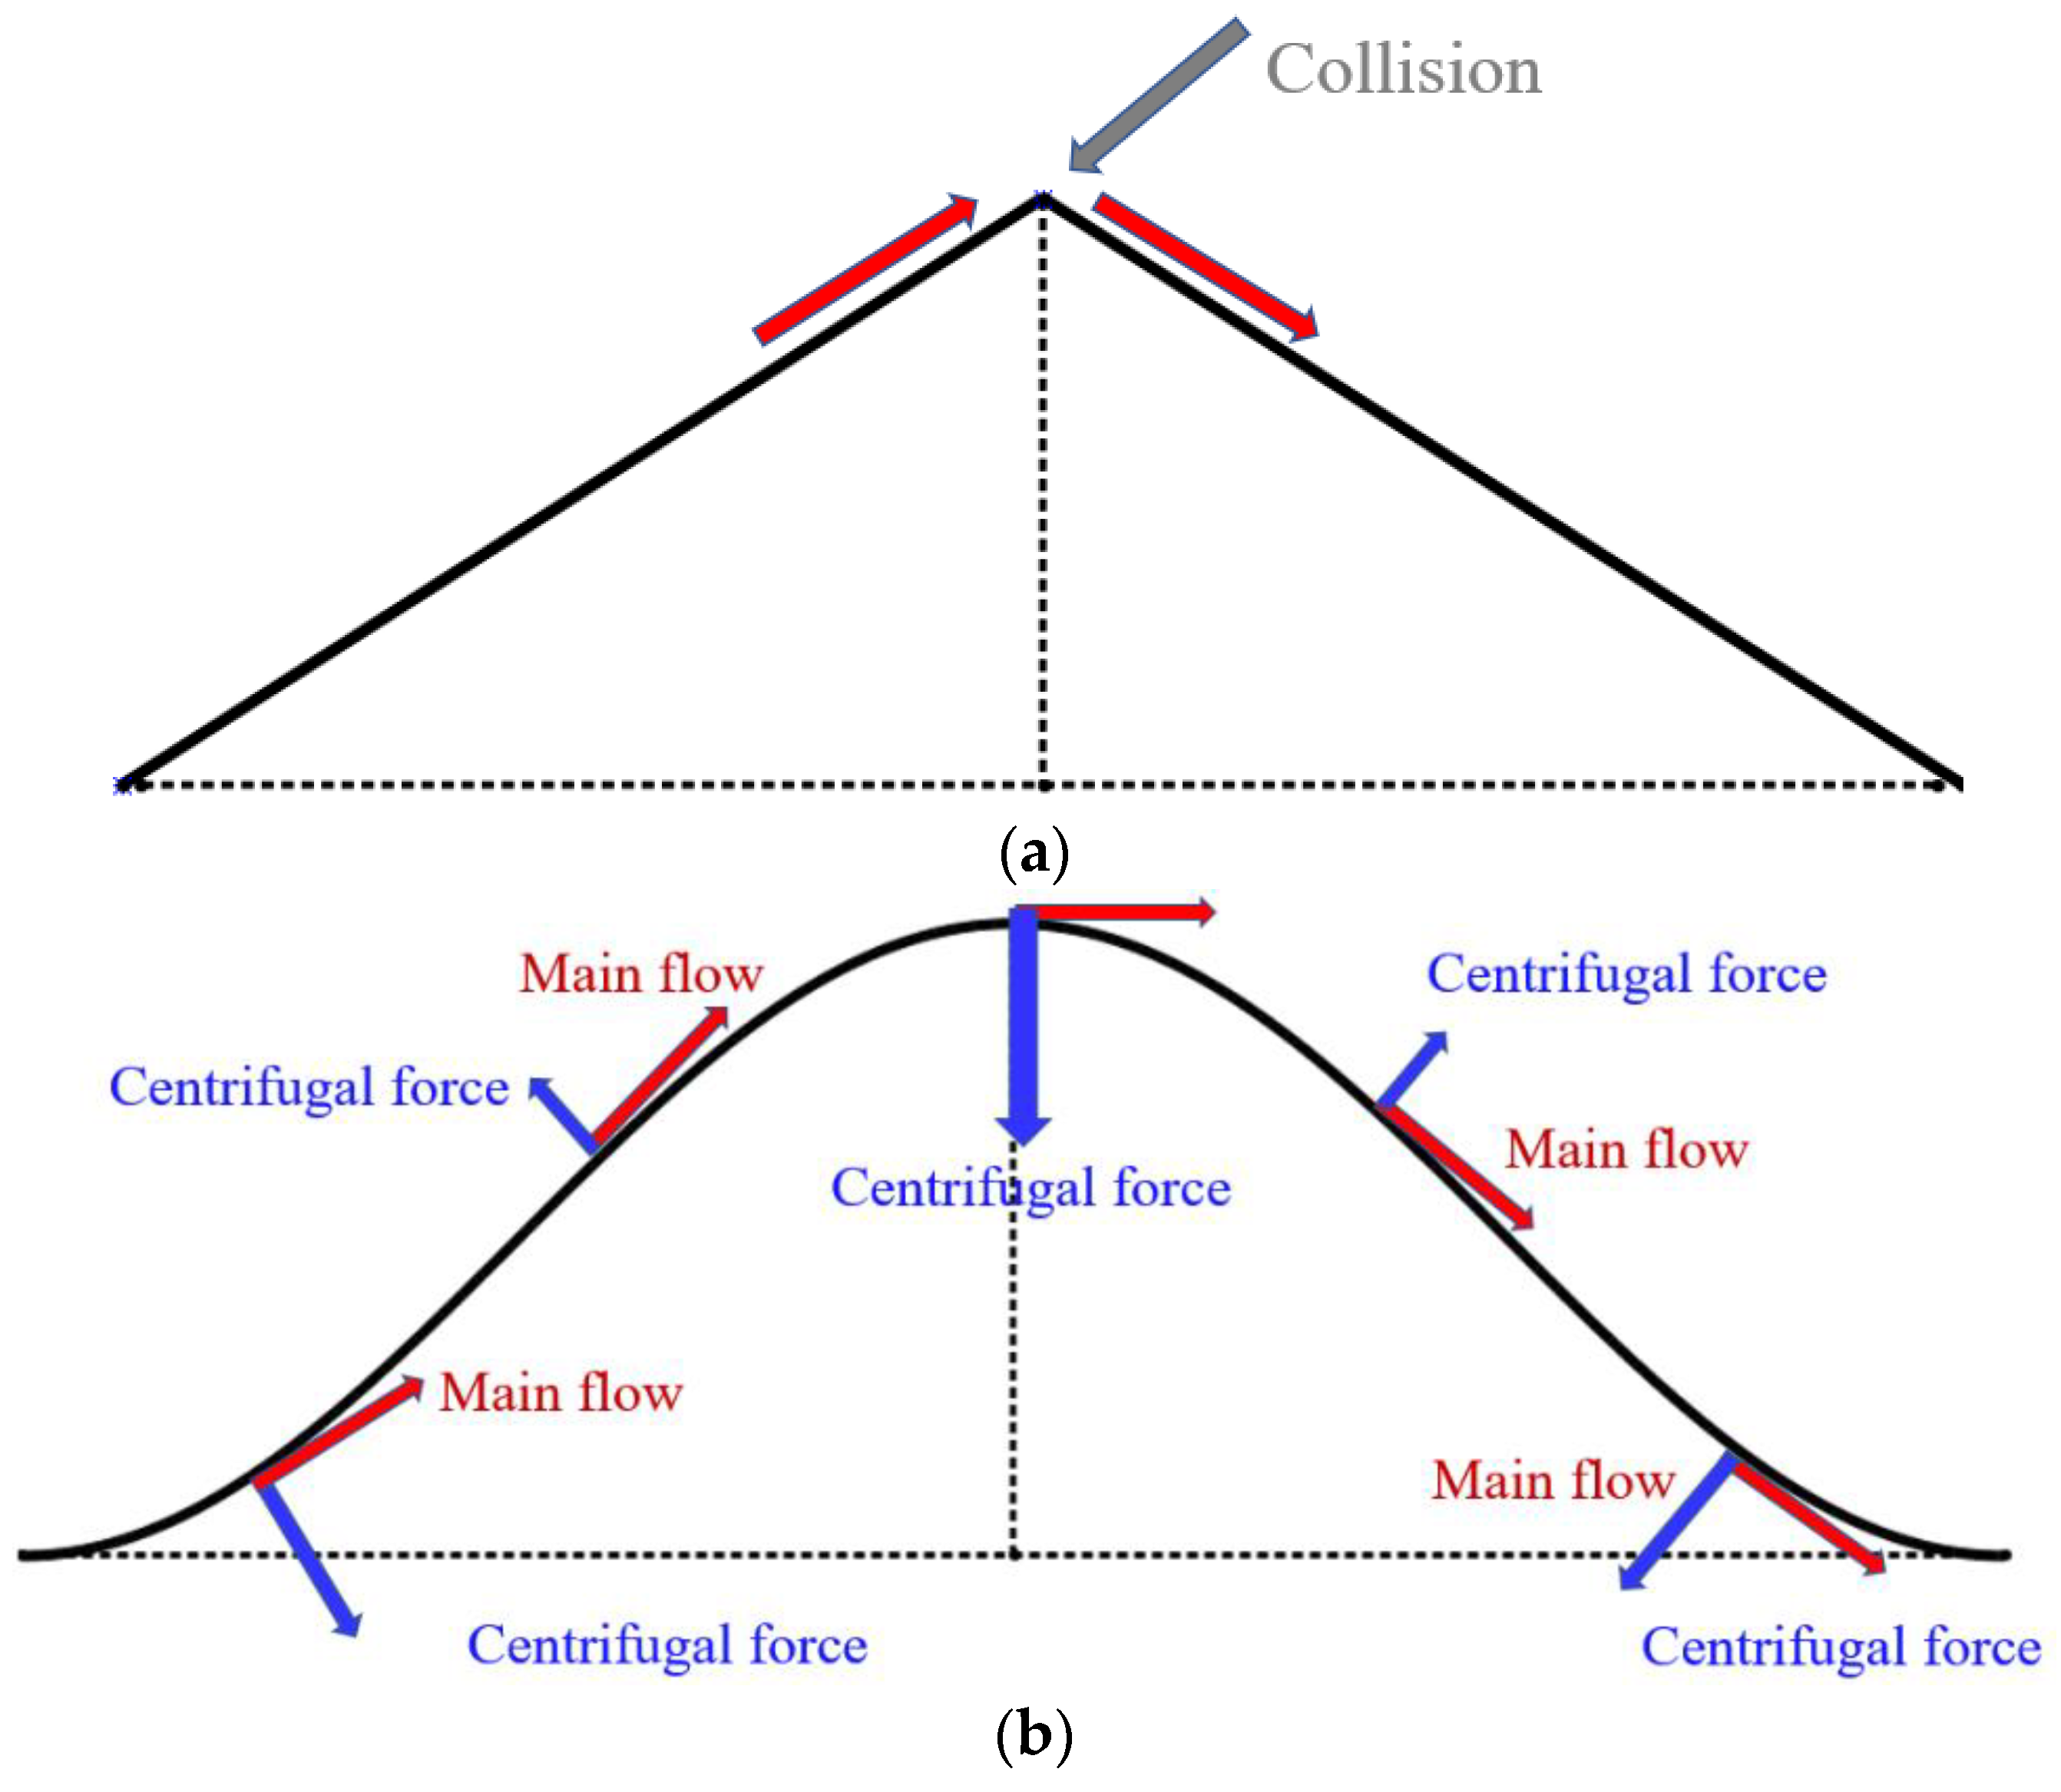
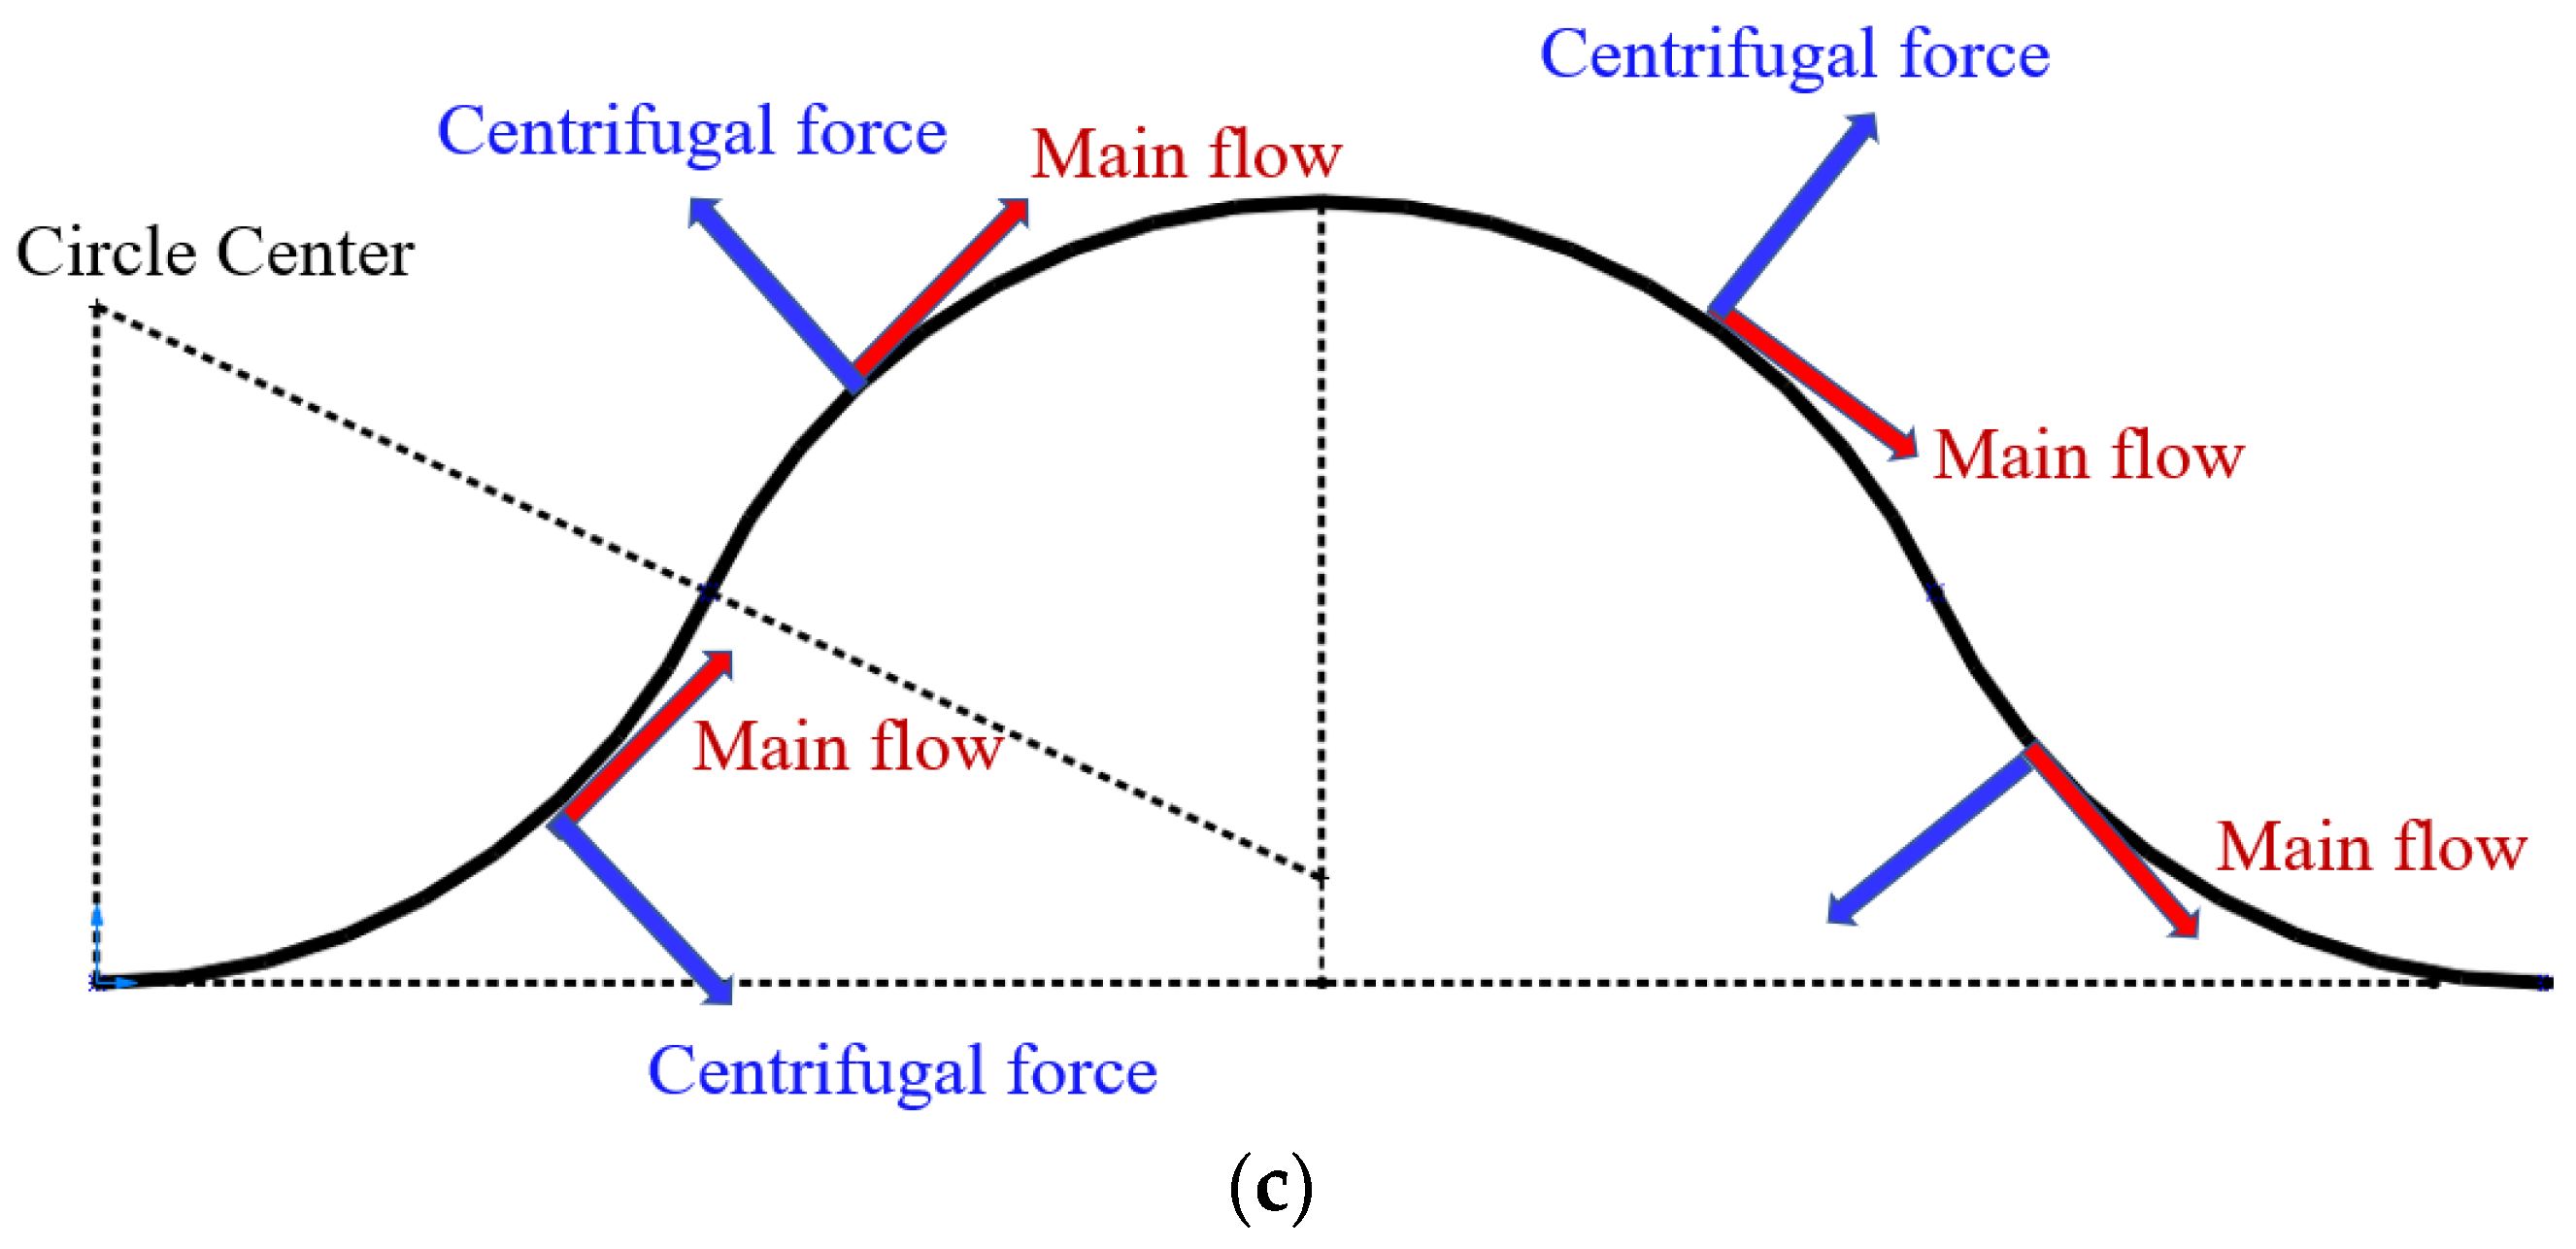
It can be concluded from Figure 21 that the forces on He–Xe in the different configurations of the channels are significantly different. He–Xe is only influenced by the driving force caused by the pressure drop in the Zig channel; meanwhile, in addition to the driving force generated by the pressure drop, He–Xe is also influenced by centrifugal force in the Sine and Serpentine channels. However, the mode of centrifugal force differs in the Sine and Serpentine channels. It is well known that the expression of centrifugal force is as follows:
F c e n t r i f u g a l = m v 2 r
where r is the radius of rotation, which has different characteristics in the Sine and Serpentine channels. r is the same with the radius of curvature in the Sine channel as follows:
r S i n e = 1 + ( M ω cos ω x + φ 2 ) 3 2 A ω 2 sin ω x + φ
m and v in Equation (34) can be regarded as constants because the mass flow rate is the same everywhere, and the density of He–Xe does not significantly change in the channel. By combining Equations (33) and (34), it can be inferred that the magnitude and direction of centrifugal force on He–Xe inside the Sine channel are functions of the X-axis coordinate. Different from the Sine pipe, the radius of rotation of the Serpentine channel is equal to the radius of the structure with a constant value.
K S e r p e n t i n e = c o n s t a n t
The centrifugal force on He–Xe in the Serpentine channel changes only in the direction with the X-axis coordinate variation because of the constant rotation radius of the Serpentine channel with a constant magnitude. The difference in force on He–Xe makes the flow and heat transfer characteristics in channels significantly different.
(1)
Comparison of flow heat transfer in passage section
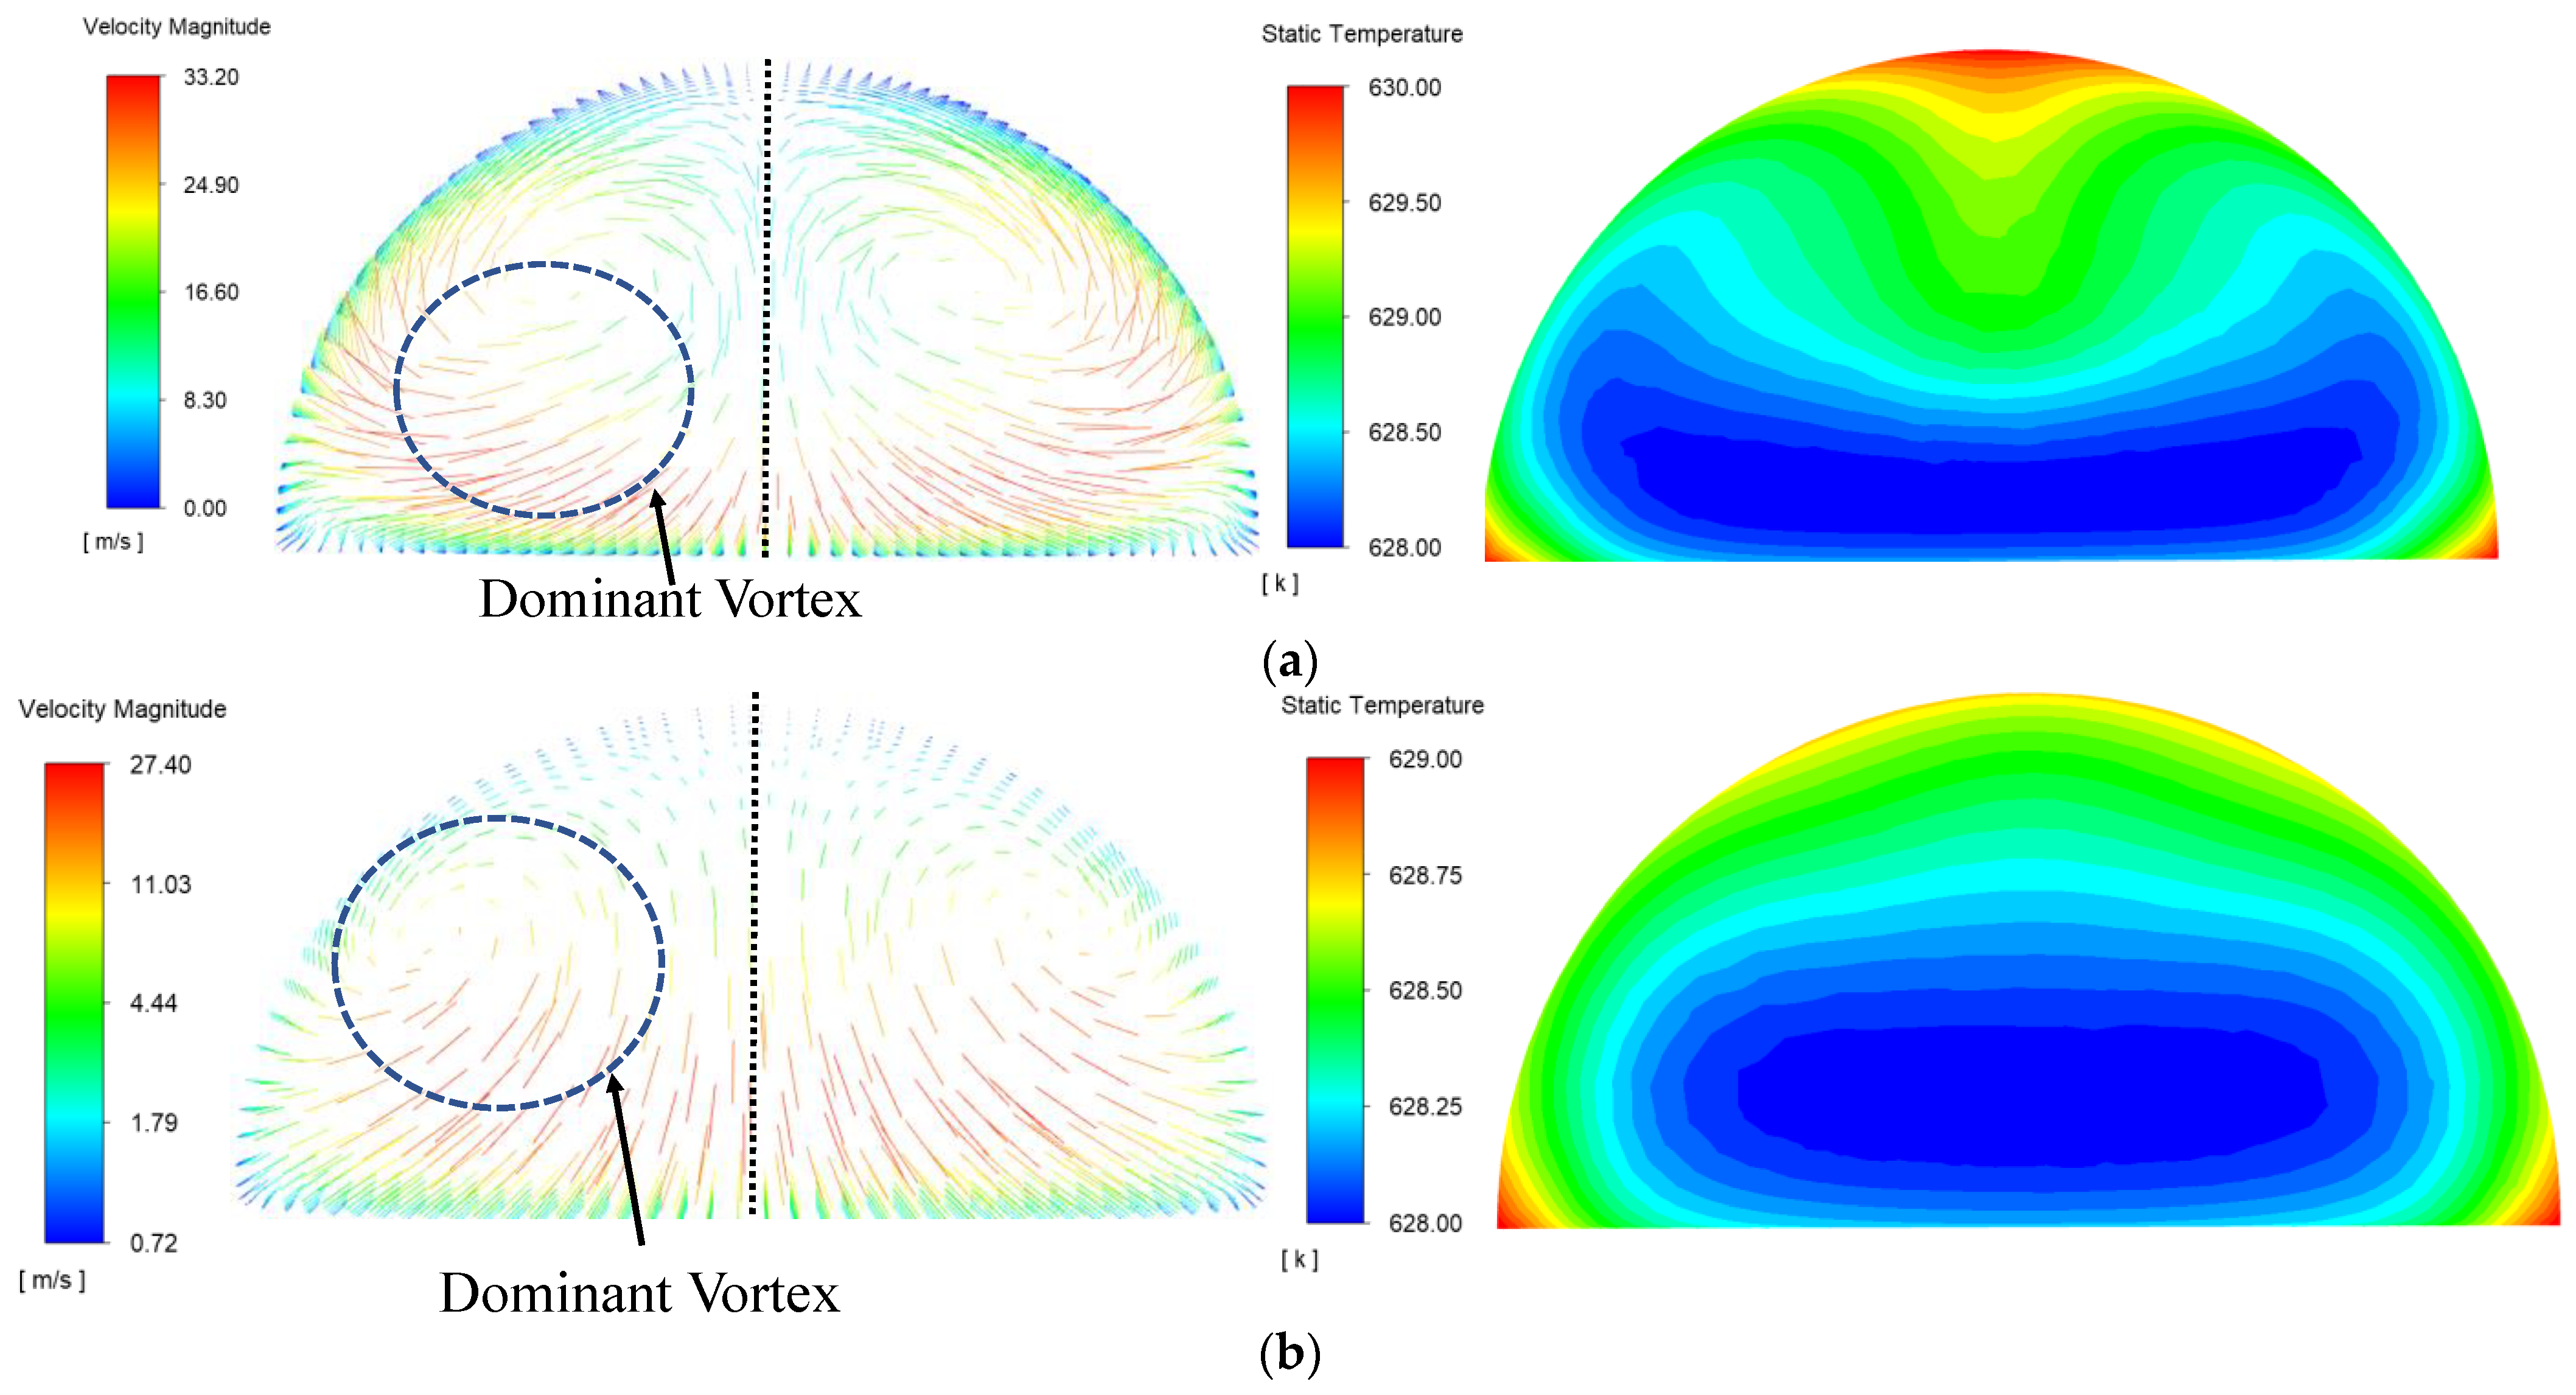
The difference in the force on He–Xe in different flow passages determines the flow patterns of the internal section of the channel. It ultimately affects the heat transfer capacity of the local section. Figure 22 presents the velocity diagrams and temperature contours of the section at the same position in channels of different configurations.
It can be observed from Figure 22 that the velocity and temperature distributions in different pipelines are symmetrical. Two strong vortexes with symmetrical distribution can be found in all the channels. Two weaker vortexes, compared to those in the Sine and Serpentine channels, located in the main flow field can be found in the Zig channel. As a result, a zone featured with high temperature can be observed at the top of the Zig channel section. A high similarity of the vortex distributions can be observed in the Sine channel and Serpentine channel. However, the intensity of the vortexes in the two configurations shows little difference. A stronger vortex can be obtained in the Serpentine channel, which contributes to a uniform temperature distribution in the Serpentine channel section. The weaker Sine channel vortex inevitably results in a high-temperature region at the top inside the section. The different flow characteristics in the three configurations make the temperature distributions of the sections different and further determine the heat transfer irreversibility in different channels. Figure 23 displays the distribution of local heat transfer entropy generation rates in sections of three channels at the same position.
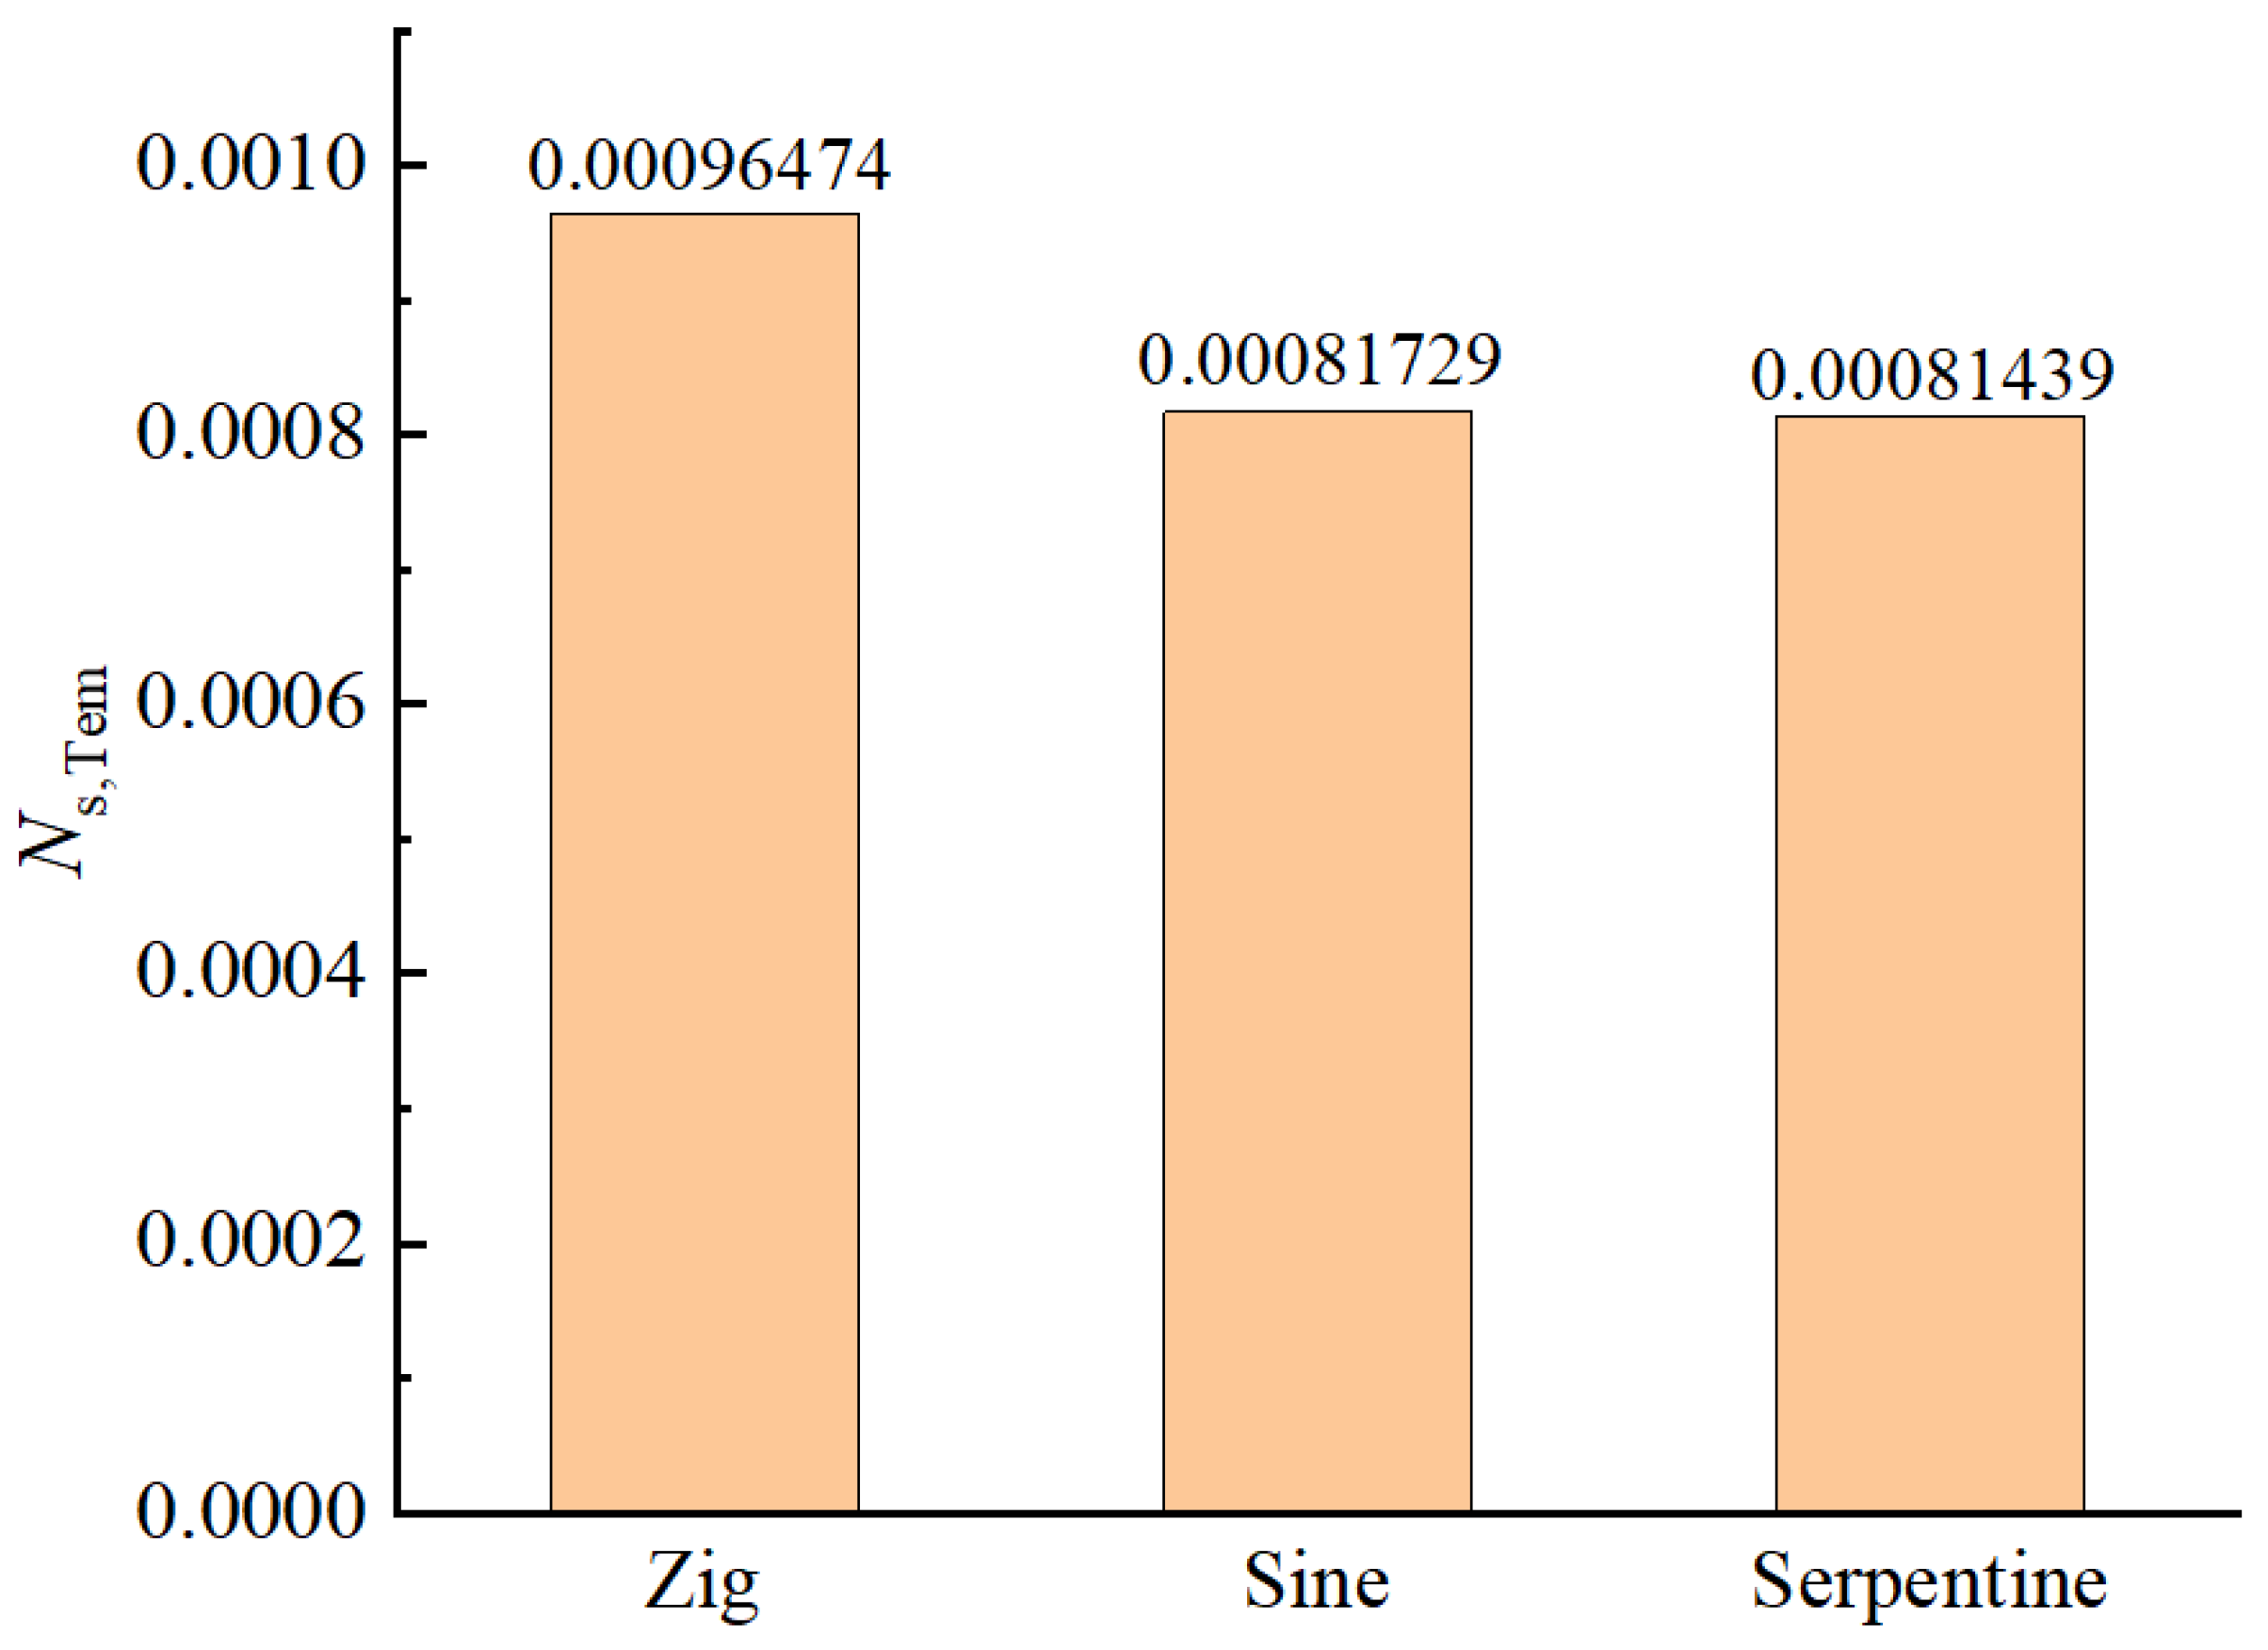
It can be observed from Figure 23 that the region in the Zig channel with the highest heat transfer entropy generation rate is located at the section’s angle. Different from the Zig channel, the regions in the Serpentine and Sine channels with the highest heat transfer entropy generation rates are all located in the boundary layer. The heat transfer Hesselgreaves number inside a single period of different configurations is shown as follows.
The heat transfer irreversibility of the Zig channel is the highest based on the analysis of the heat transfer Hesselgreaves number. The heat transfer Hesselgreaves number of the Serpentine channel is similar to that of the Sine channel but slightly lower than that of the Sine channel. It is indicated from Figure 20 and Figure 24 that the Serpentine channel is featured with the least heat transfer irreversibility but with the strongest heat transfer capacity.
(2)
Comparison of flow pattern along the passage
The velocity distribution along the channels is presented in Figure 16 and will not be repeated here. One flow dead zone can be found at the Zig channel’s corner. The existence of a flow dead zone will significantly deteriorate the local heat transfer capacity according to the theoretical analysis in Section 3.1, which explains the lowest heat transfer capacity in the Zig channel in Figure 19. However, the phenomenon of the deteriorated heat transfer capacity does not exist in the Sine and Serpentine channel because no flow dead zone exists in these channels. Aside from the different heat transfer capacities, the flow pattern inside different configurations contributes to the energy loss with different features. The first law of thermodynamics states that the higher the pressure drop in a pipe, the more energy is lost during flowing. However, pressure drop cannot reflect the energy loss in the flow field. It is pointed out that two parts introduce the energy loss in flow: turbulence dissipation and viscous dissipation, as follows [32,43].
S ˙ g e n , F l o w = μ T 2 u i x i 2 + u i x j + u j x i 2 v i s c o u s d i s s i p a t i o n + ρ ε T t u r b u l e n t d i s s i p a t i o n
The energy loss and pressure drop characteristics within a single period of different flow channels are displayed in Figure 25.
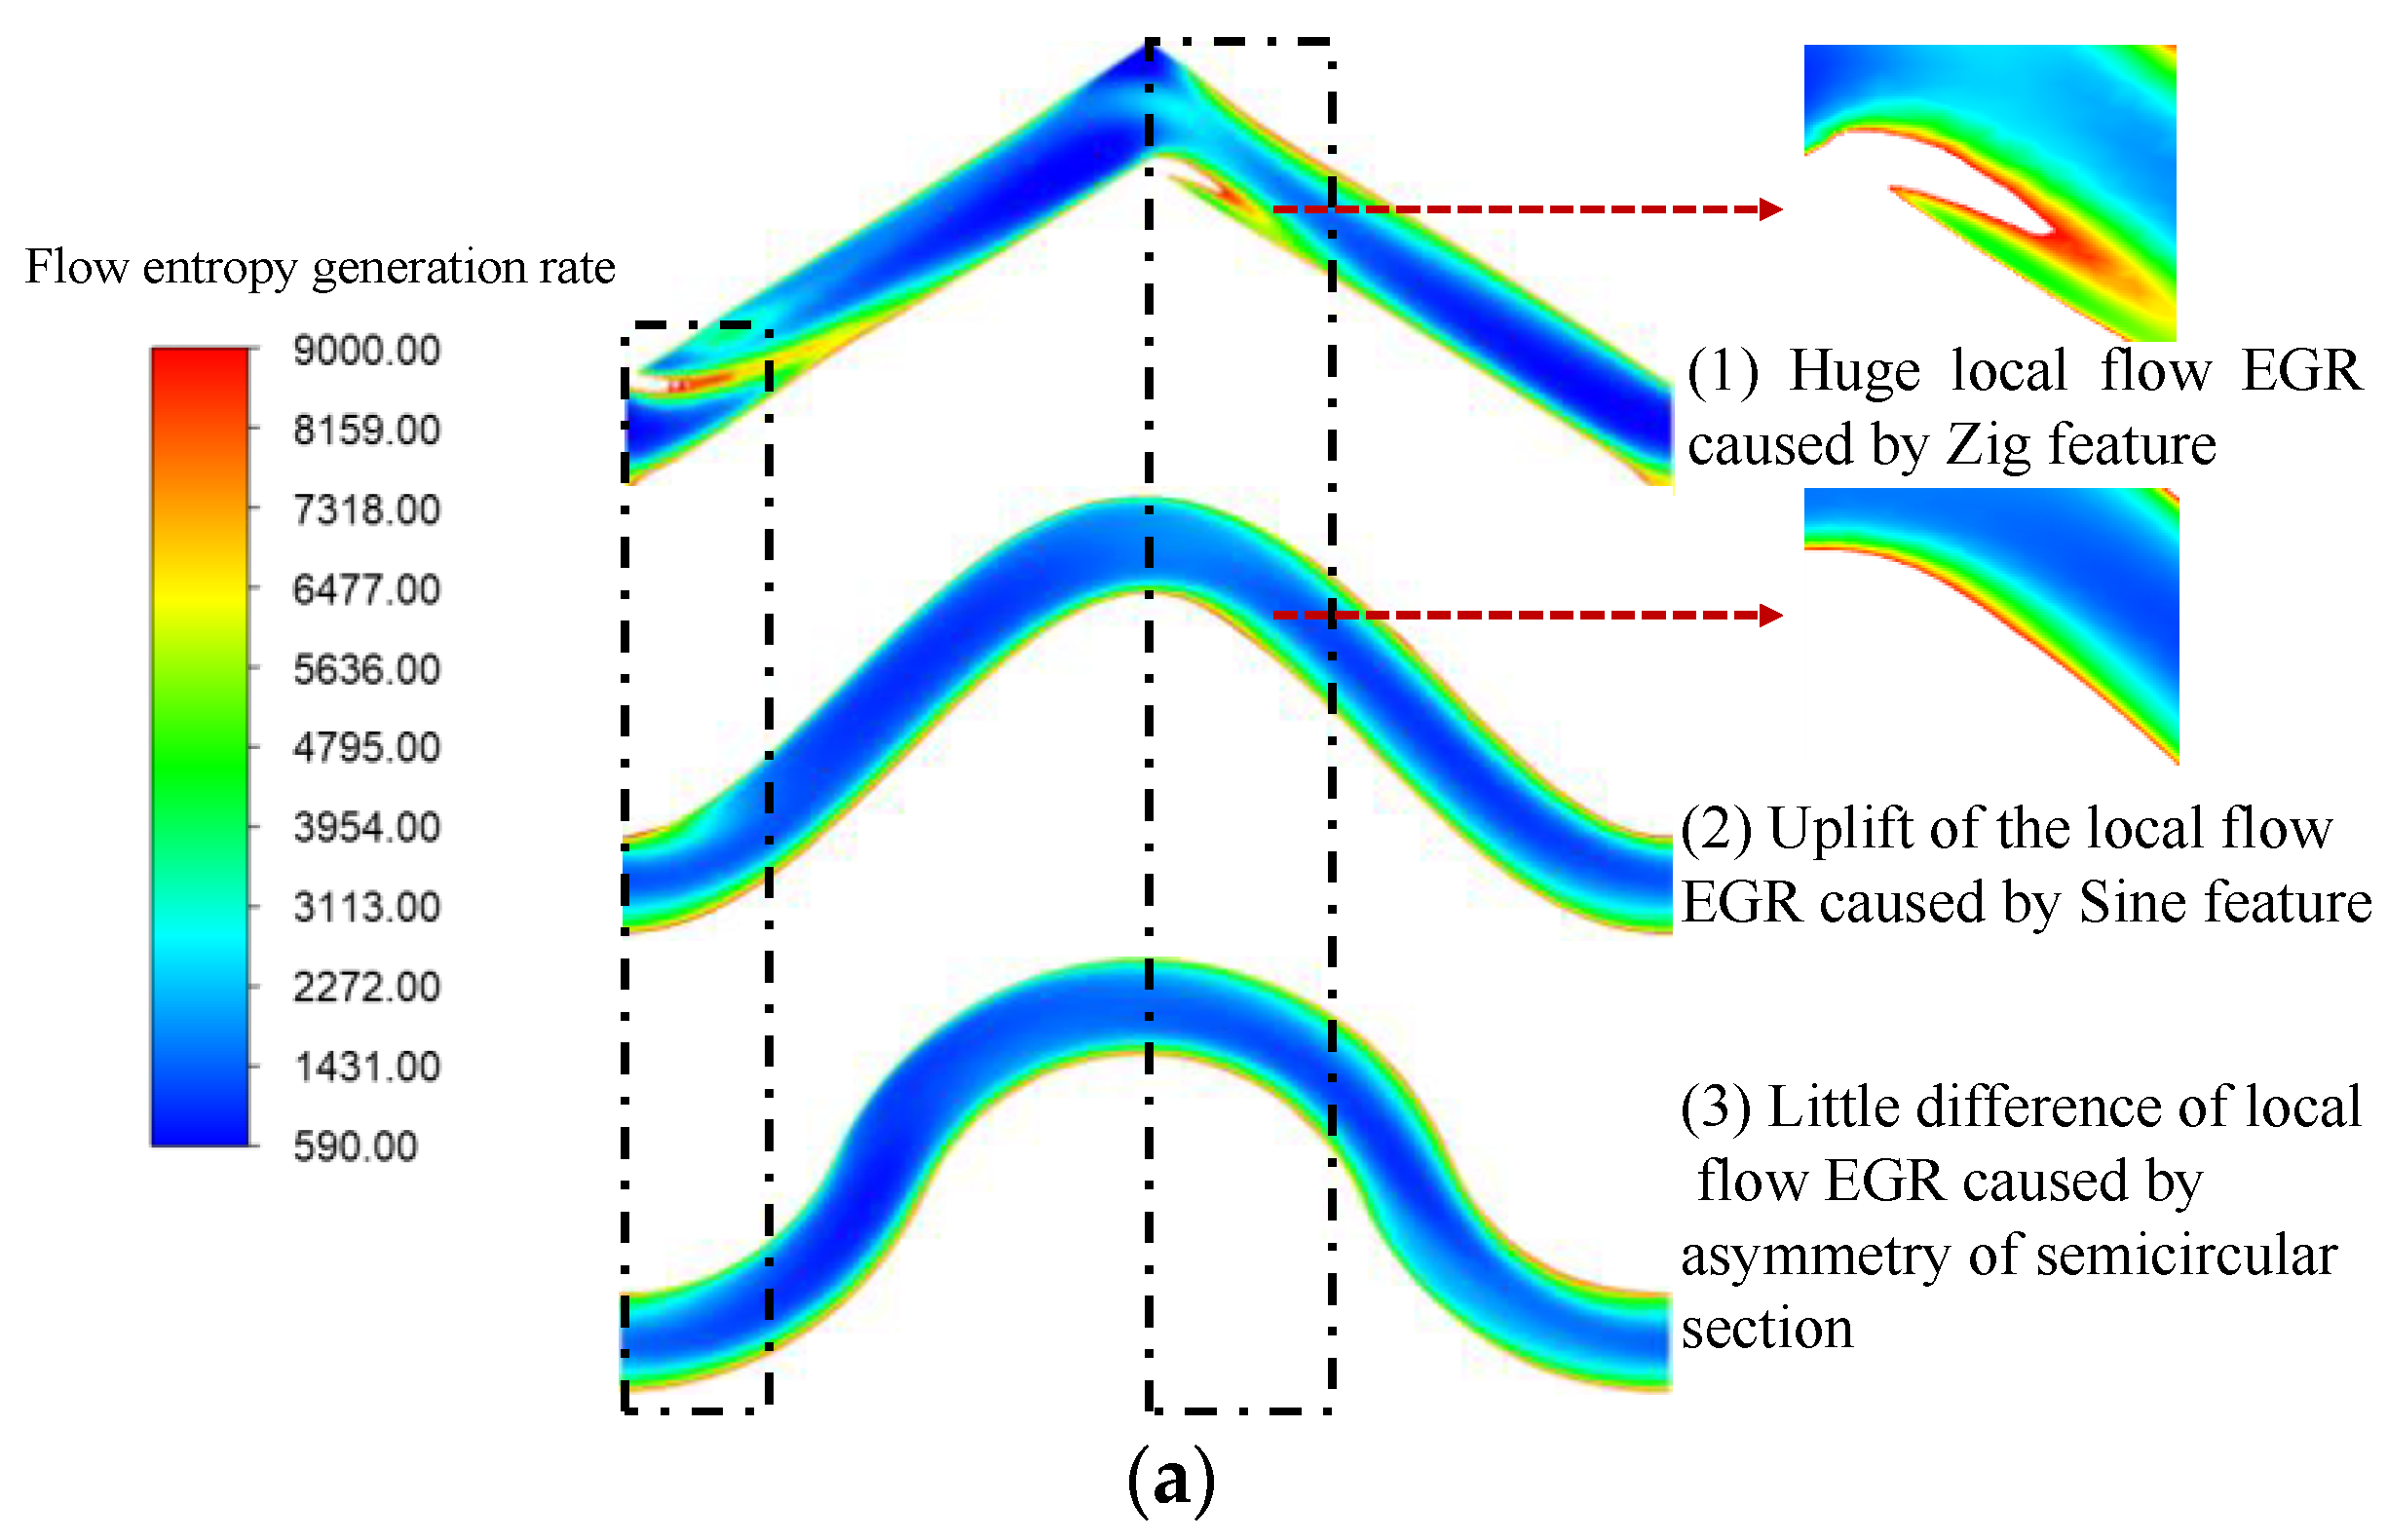
It should be pointed out that the local entropy generation rate at the corner of the Zig channel is too high, which is about 1.05 × 10⁶, with three orders of magnitude higher than that of the Sine pipeline and the Serpentine channel. Therefore, the interval of the entropy generation rate contours is set to be from 590 to 9000 to obtain more details when processing the contours distribution in this paper. It can be found from Figure 25a that the flow in the Zig channel, where the flow direction keeps straight, is featured with a much lower flow entropy generation rate than in the Zig channel, where the flow direction changes abruptly. Unlike the sharp change of flow direction in the Zig channel, the flow direction in Sine and Serpentine channels does not change abruptly. As a result, the flow fields of He–Xe in the Sine and Serpentine channels are not featured with a high flow entropy generation rate.
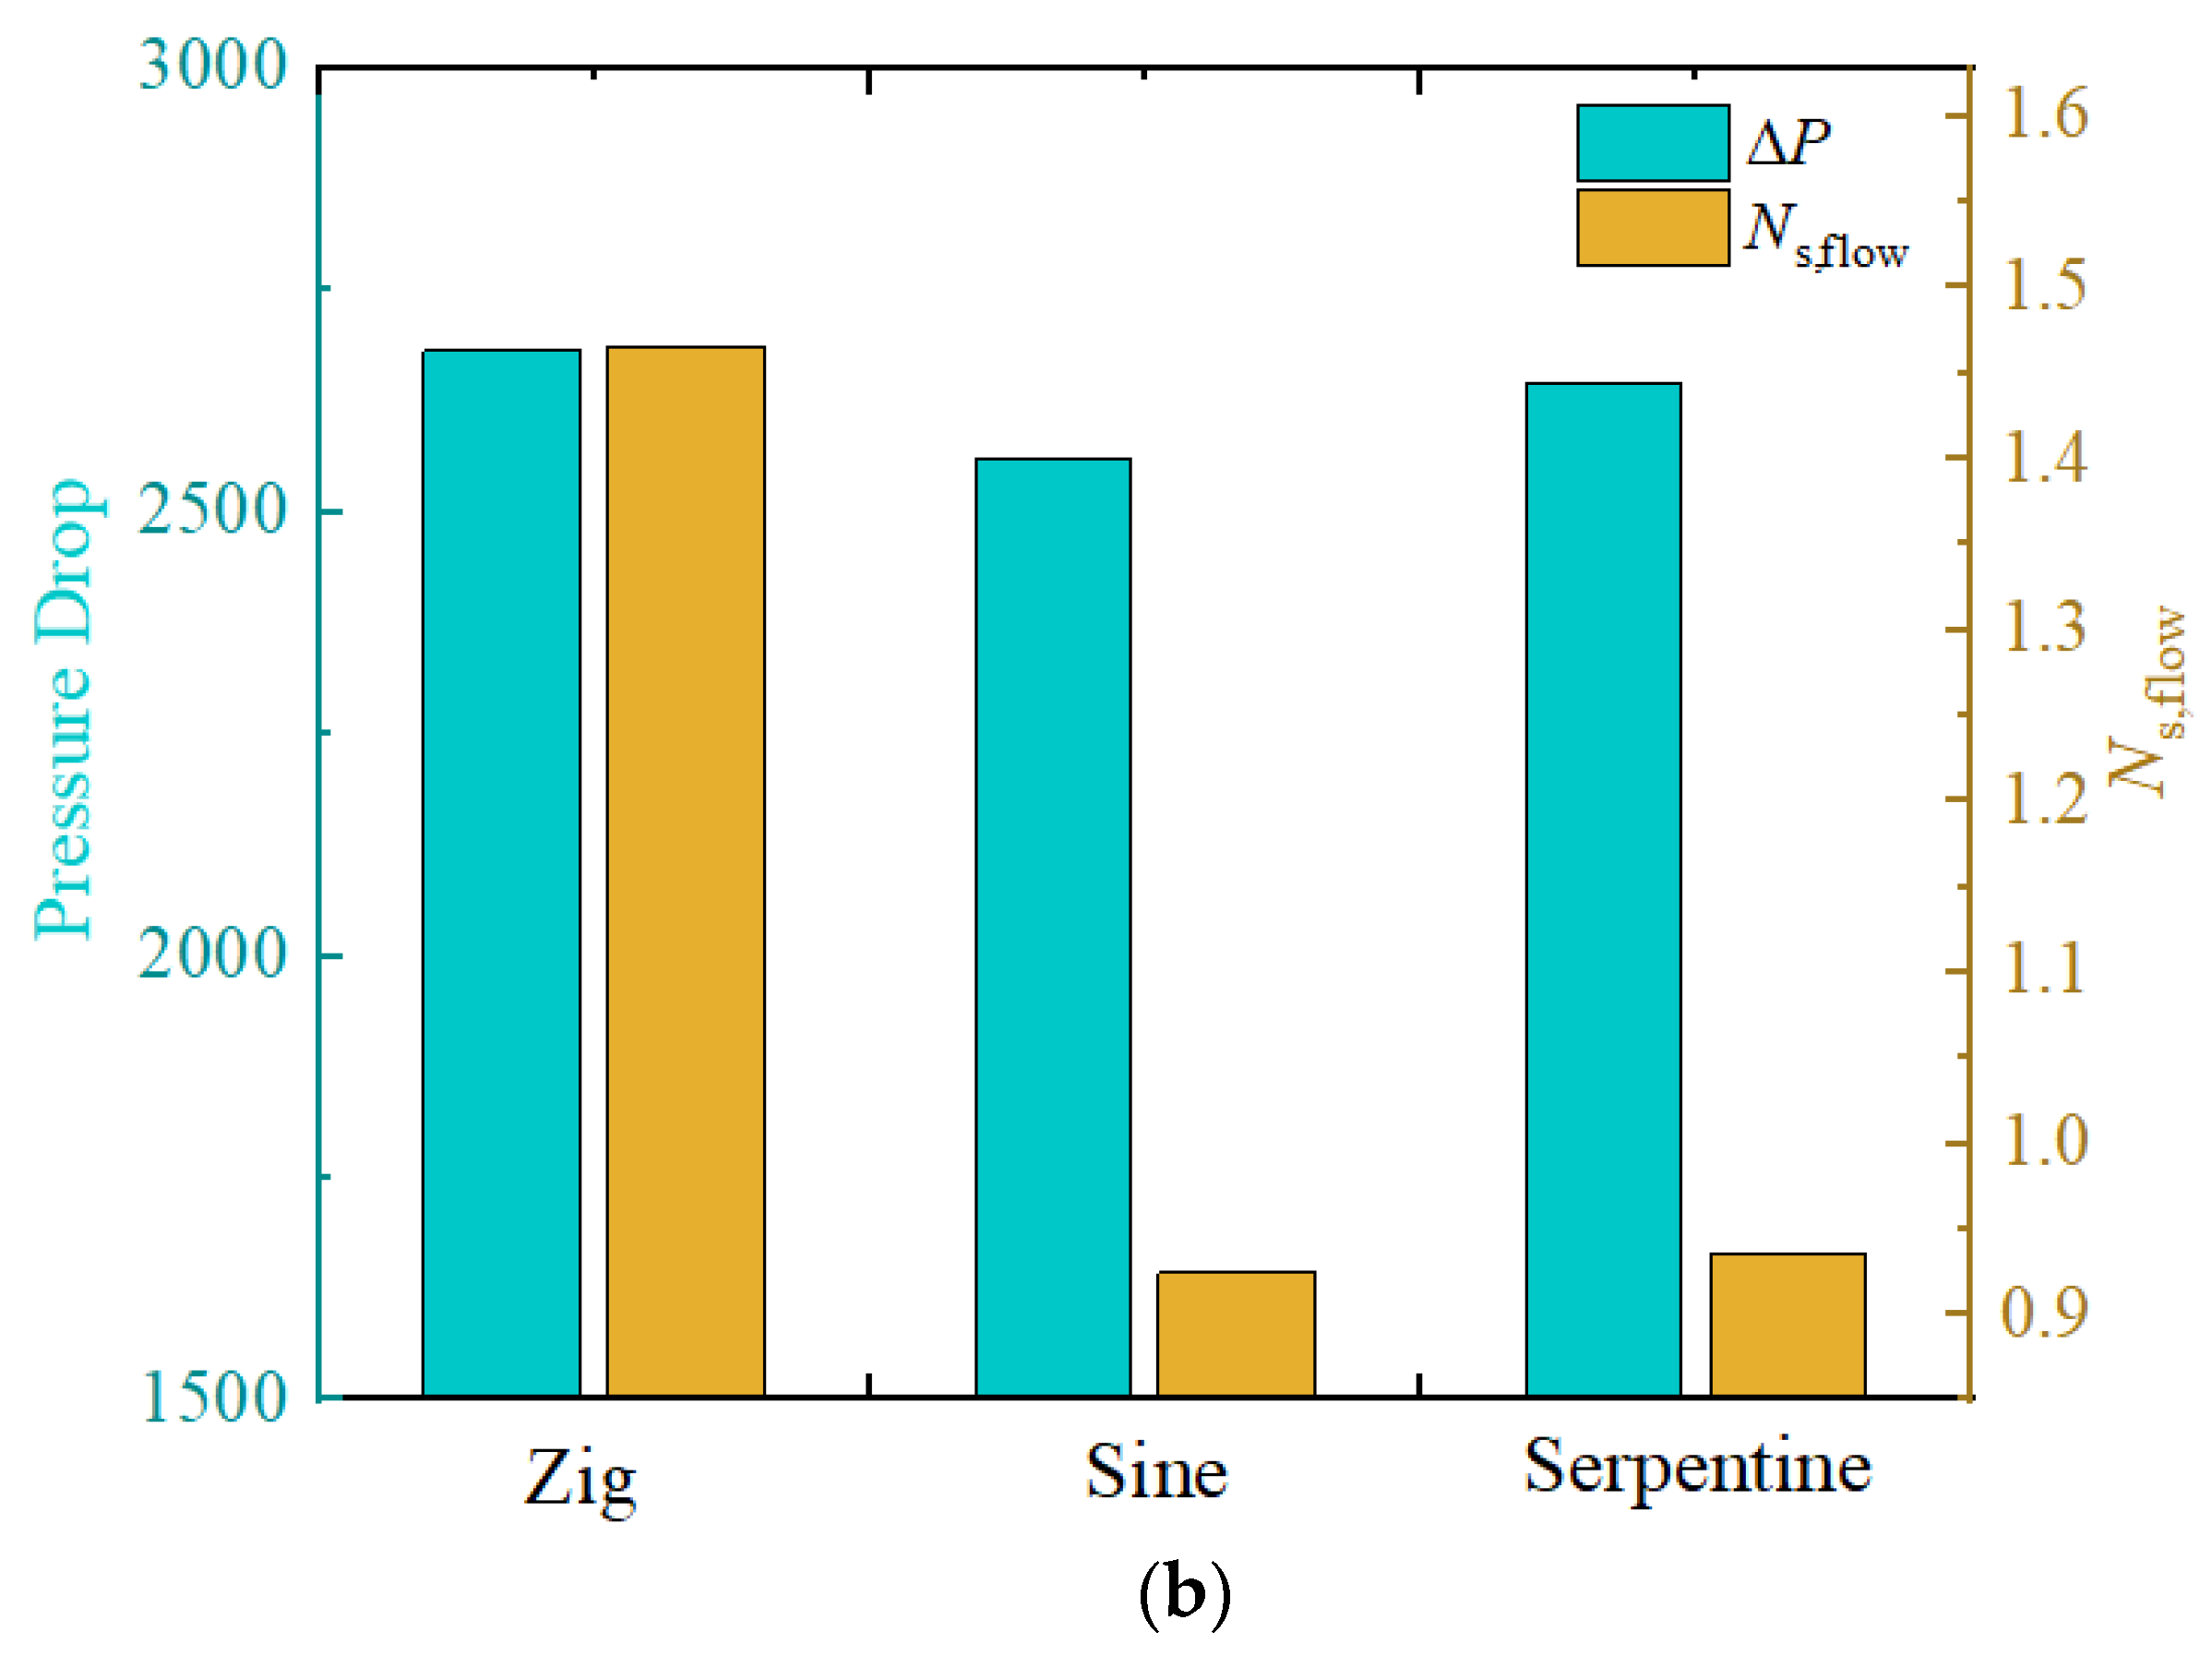
Figure 25b displays the pressure-drop and flow Hesselgreaves number of one single period of different configurations. The lowest pressure drop exists in the Sine channel with a value of 2561.7 Pa. The pressure drop in the Zig and Serpentine channels are higher with the value of 2681.4 Pa and 2646.9 Pa, respectively. Similar patterns of flow Hesselgreaves numbers can be obtained in three configurations. The flow Hesselgreaves number in the Zig channel is the largest, with a value of 1.47. The flow Hesselgreaves numbers in the Sine and Serpentine channels are lower than that in the Zig channel, with values of 0.93 and 0.935, respectively. Based on the comparison and analysis of pressure drop and energy loss, it can be concluded that the flow pattern of Sine and Serpentine channels are superior to the traditional Zig channels.

3.2.3. Configuration Selection

The evaluation criterion parameter combining the first and second laws of thermodynamics is employed to select the channel with the best thermodynamic performance. The evaluation criterion parameter, including Nuave and Ns, is defined as follows:
E P = N u a v e N s
It can be inferred from the mathematical expression of the evaluation criterion parameter that E P represents the heat transfer capacity of unit entropy generation. The higher E P is, the better the thermodynamic performance of the channel is. The E P of a single period of the Sine and Serpentine channel is displayed in Figure 26.
The E P of Sine channel is 15.68, while the E P of Serpentine channel is 15.84. In conclusion, the Serpentine channel owns a higher heat transfer capacity at the cost of a lower irreversibility loss. As a result, it is believed that the Serpentine channel is a better configuration than the Sine channel.

3.3. Influence of Shape Factor on Thermodynamic Performance in Serpentine Channel

3.3.1. Influence of A on the First Law of Thermodynamics

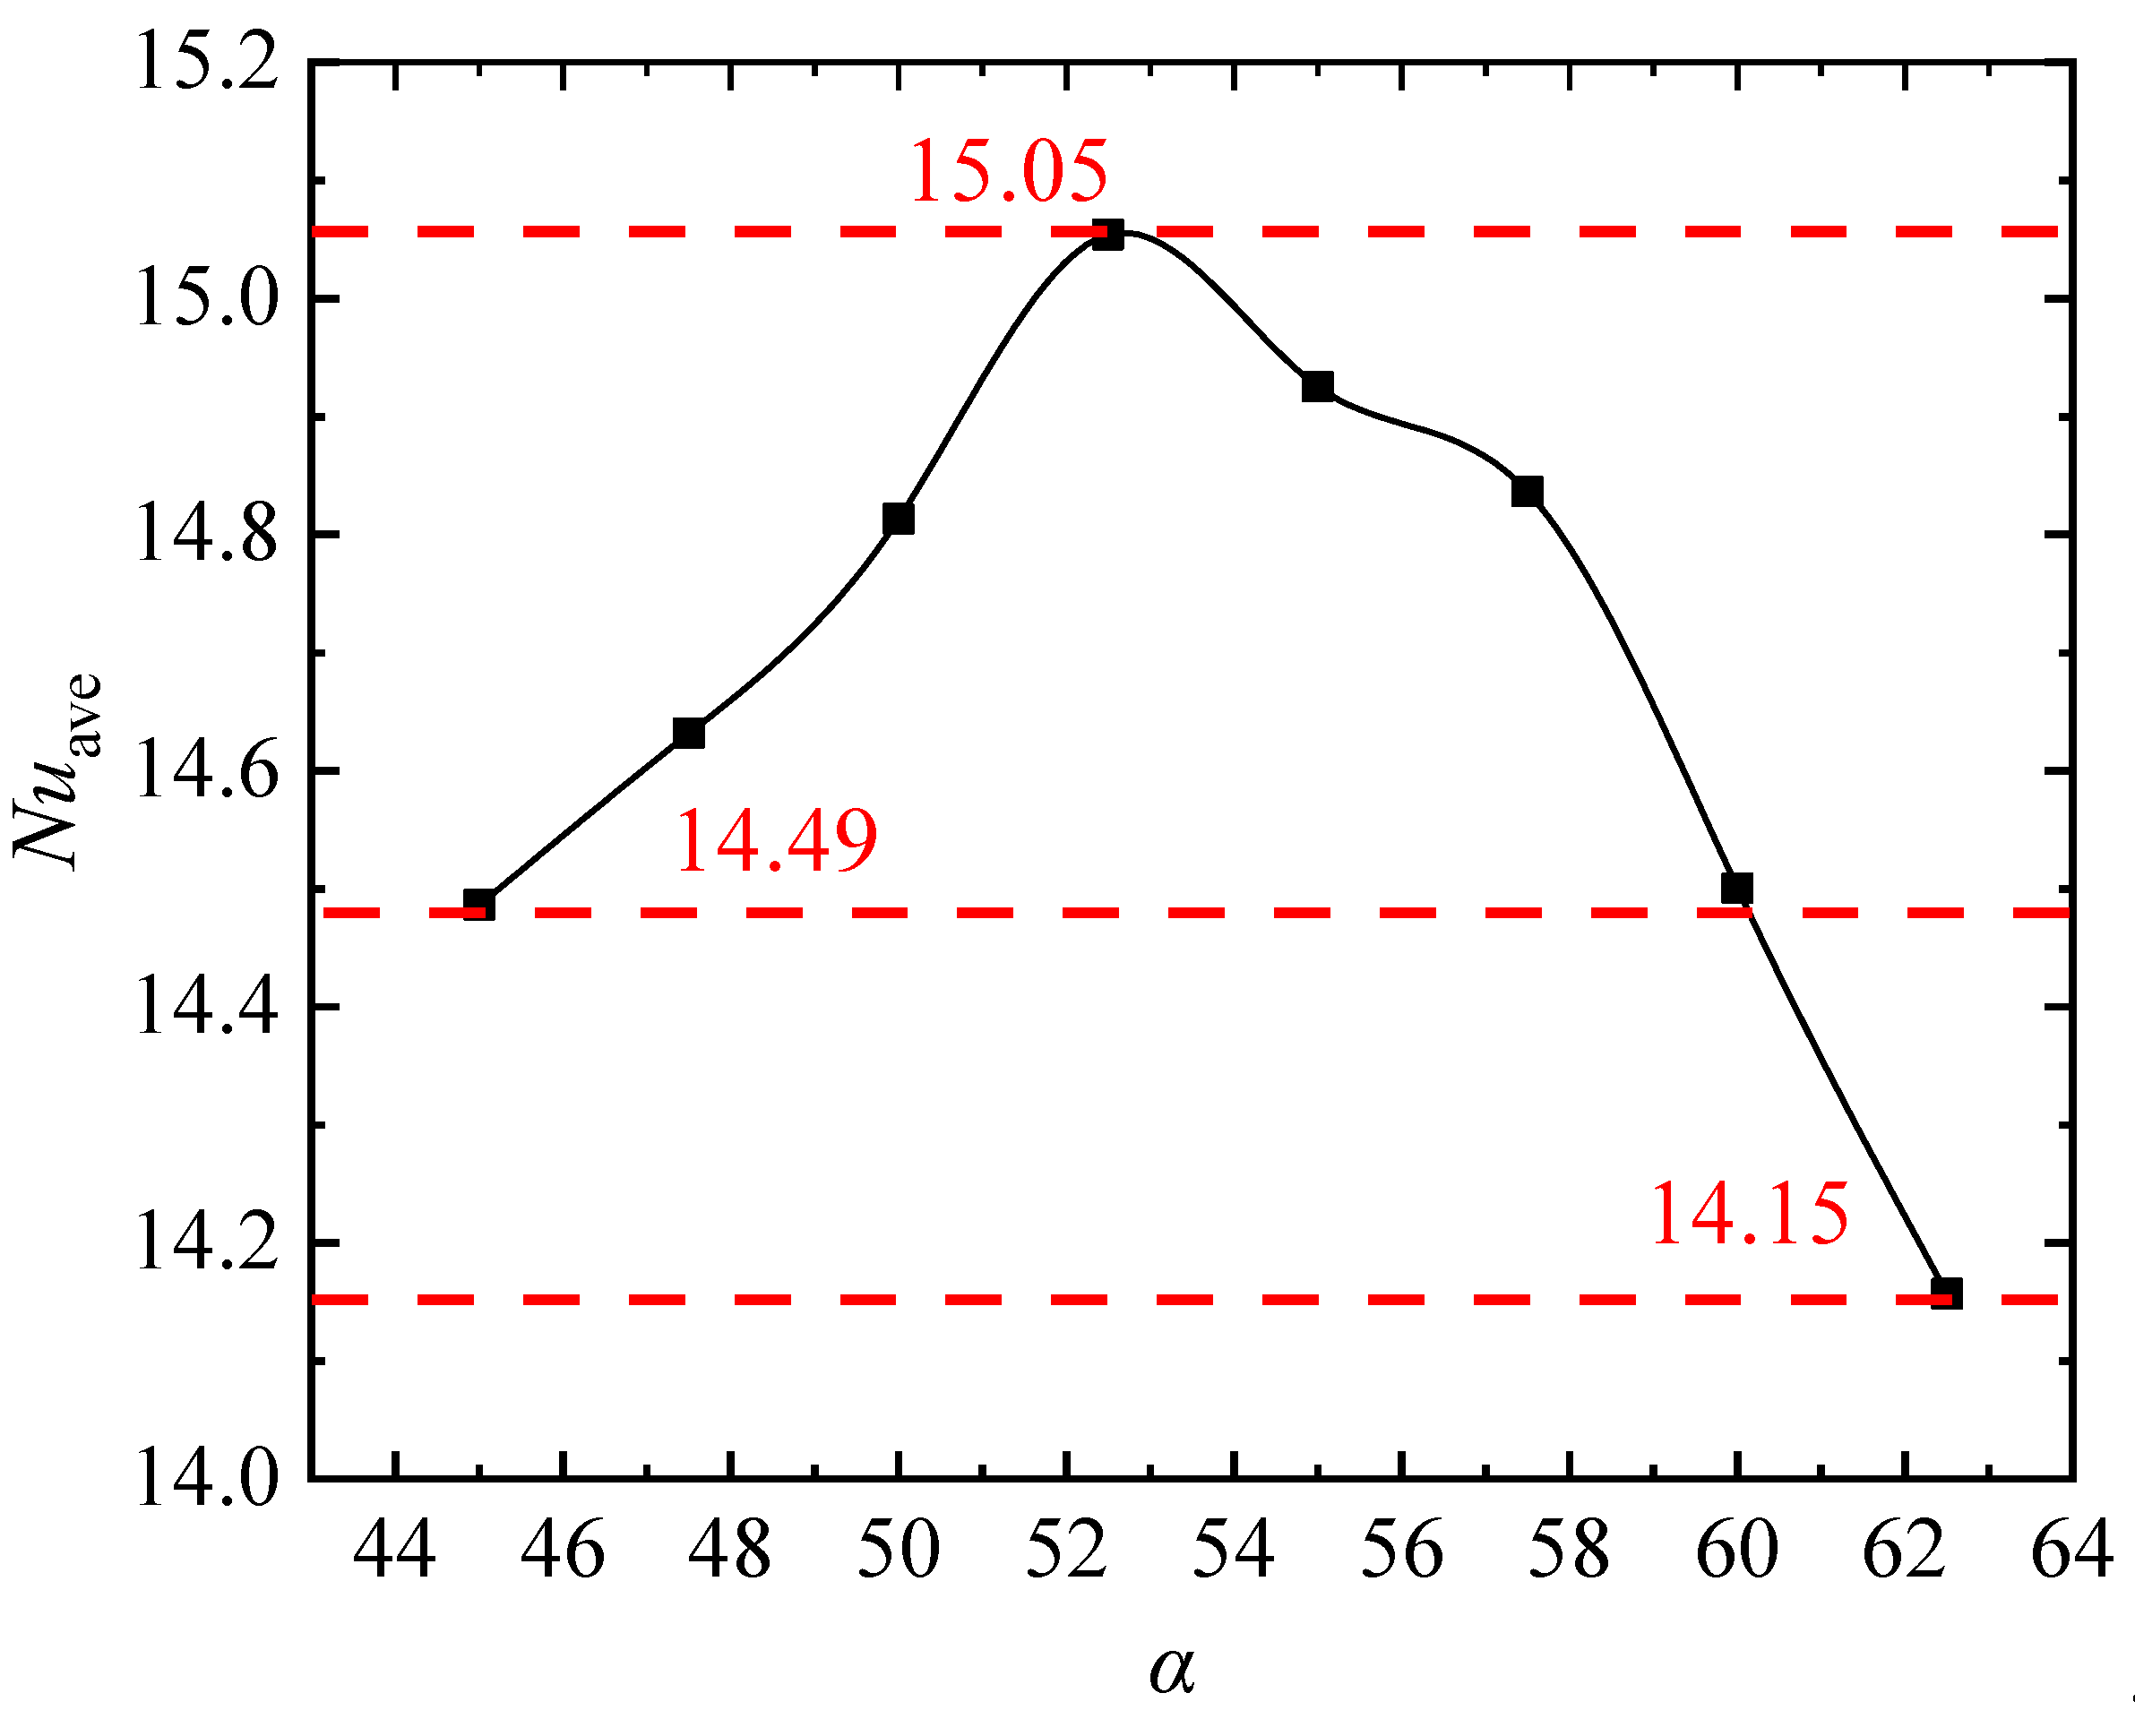
The best configuration, the Serpentine channel, is selected based on the evaluation criterion parameter combining the first law of thermodynamics and the second law of thermodynamics in the last section. The influence of the shape factor on the thermodynamic performance of Serpentine channels will be studied to be prepared for future research on PCHE with the Serpentine channel as the unit channel. As mentioned, N u is a function of Pr, Re, and shape factor. Shape factor, A, has an evident influence on the heat transfer capacity of the Serpentine channel. Figure 27 shows the N u a v e comparison inside one single period with different shape factors with a Rein of 2500 and heat flux of 1 kW/m2.
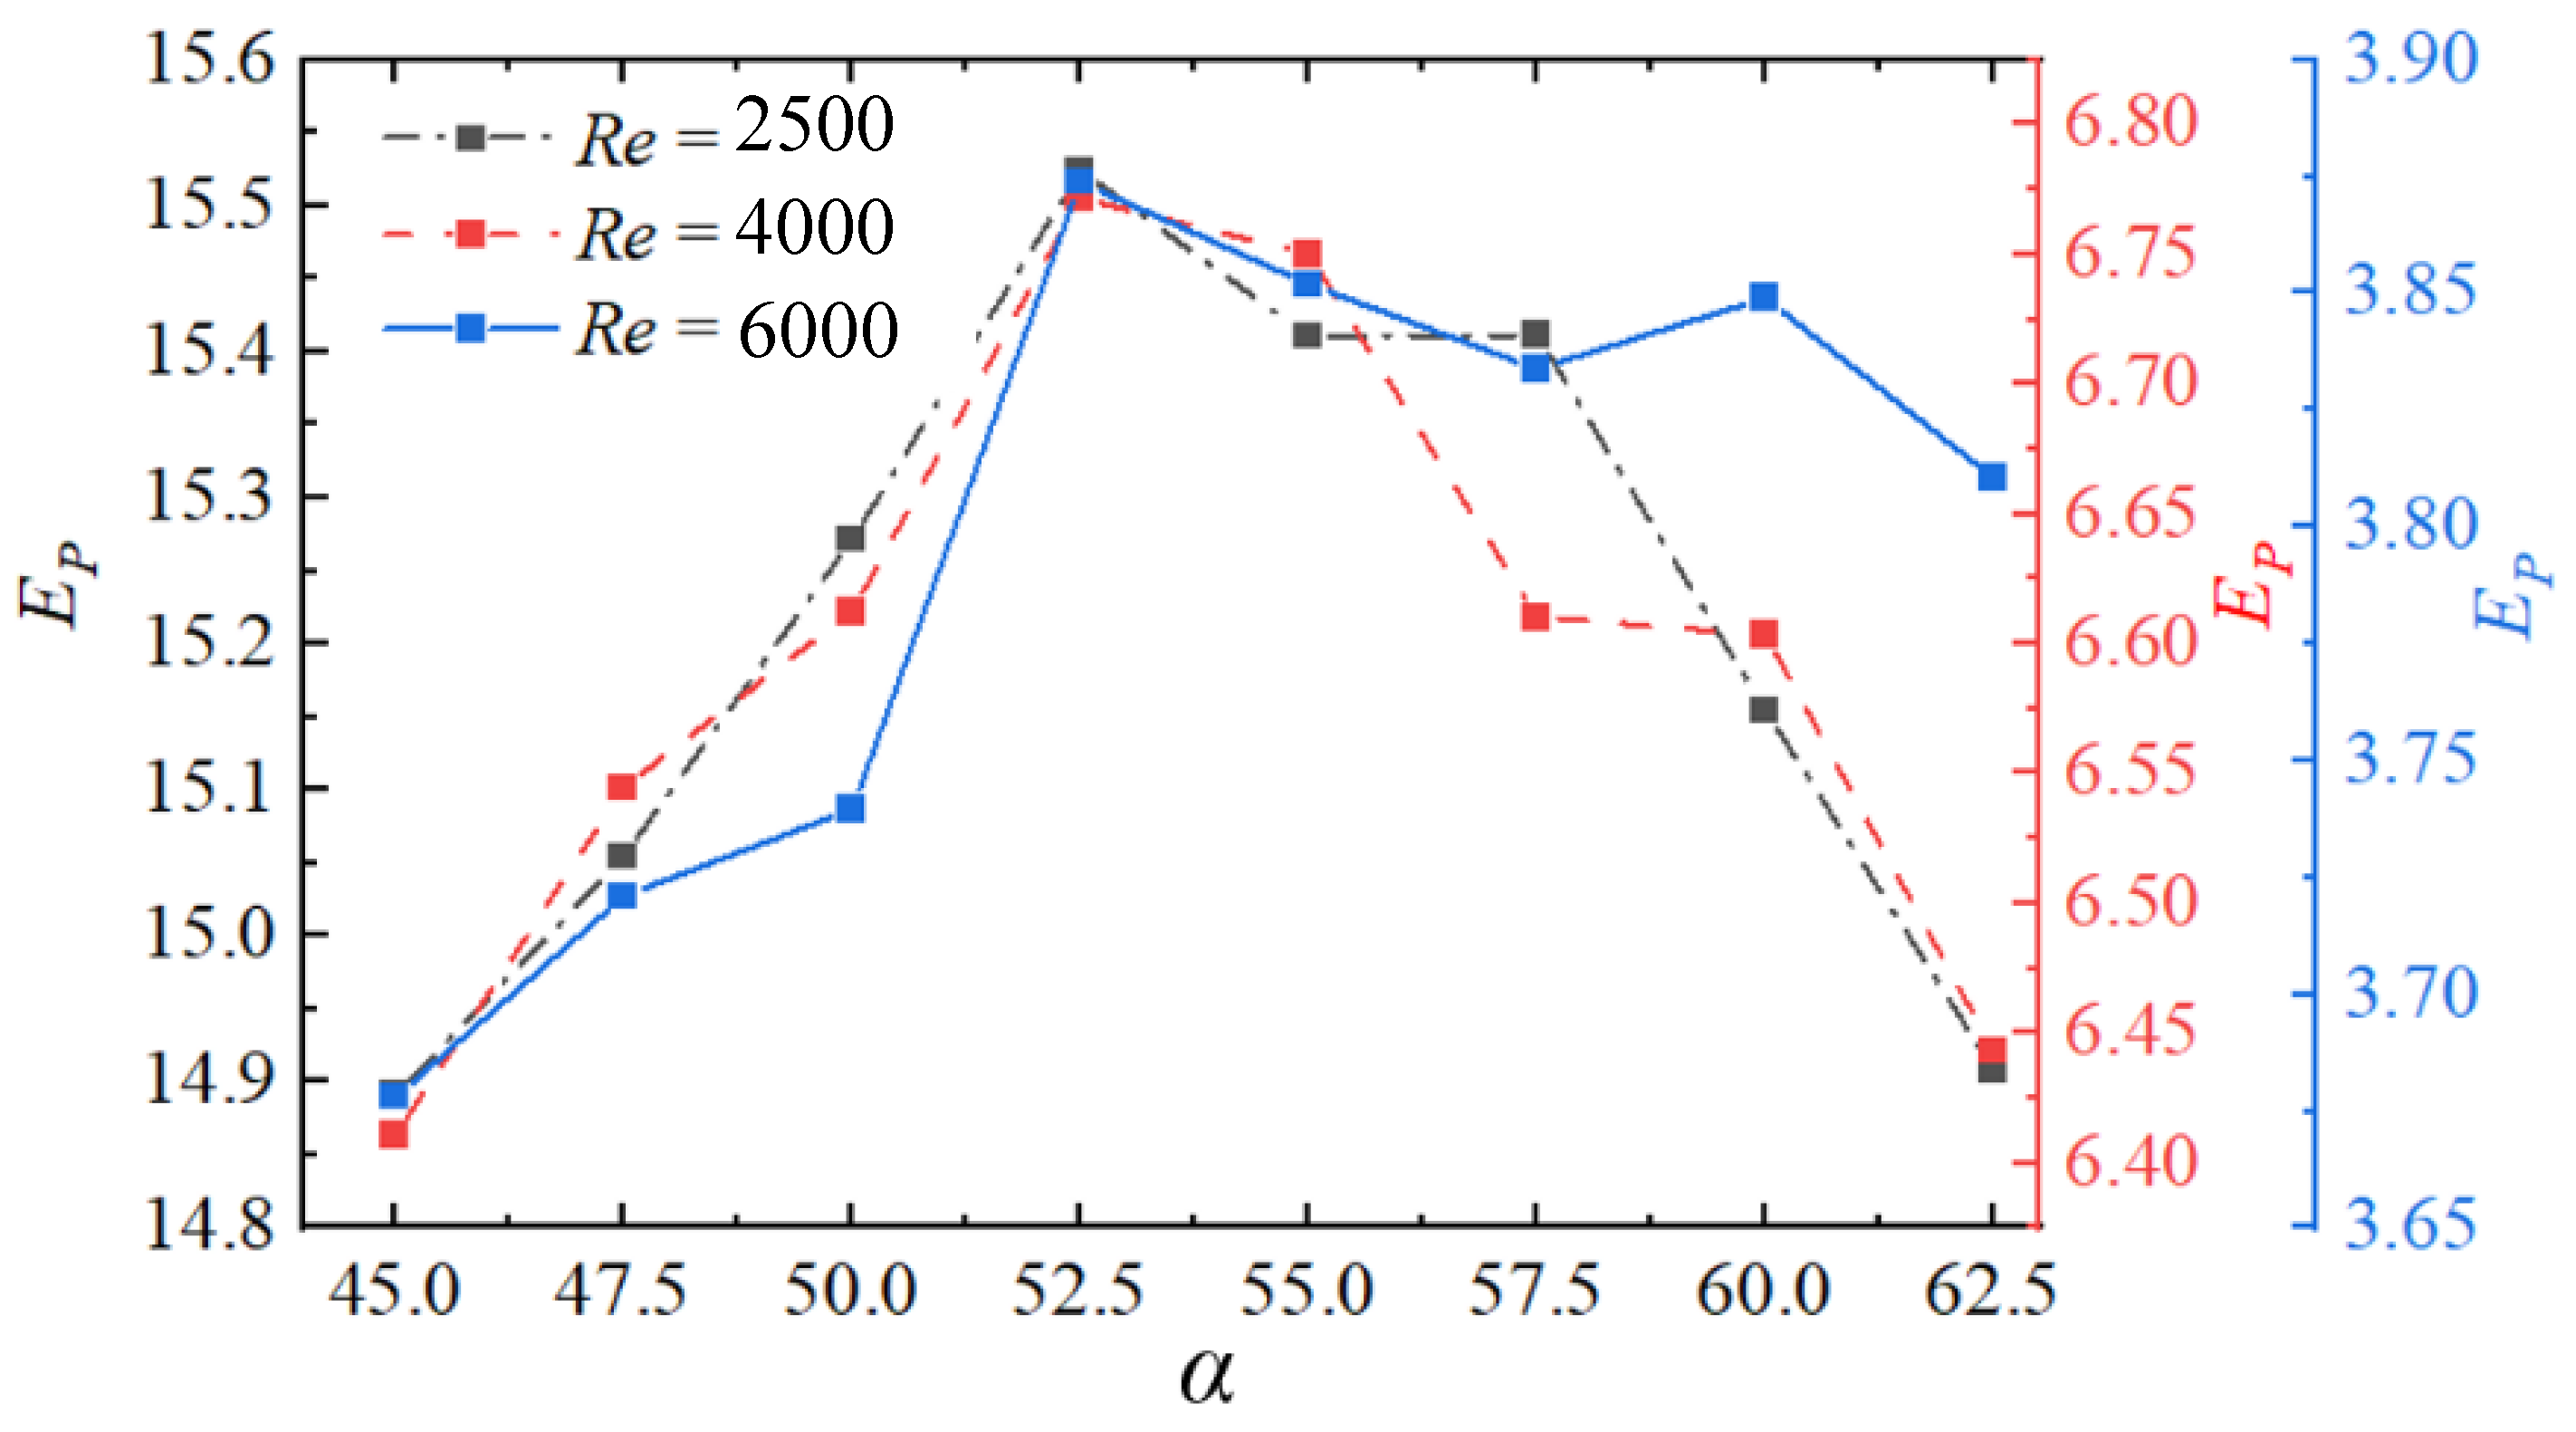
It can be found from Figure 27 that the heat transfer capacity is significantly different with the change of the shape factor. Therefore, it is necessary to investigate the shape factor’s influence to better understand the heat transfer characteristics of He–Xe flow inside the configuration. Figure 28 presents the heat transfer capacity of one period with Rein of 2500, 4000, and 6000 under a heat flux of 1 kW/m2.
It can be obtained from Figure 28 that the Serpentine channel with an A of tan 52.5 ° is featured with the strongest heat transfer capacity under all Rein. The centrifugal force change introduced by the configuration variation contributes to this phenomenon. The velocity vector distributions of the same section with different shape factors are displayed in Figure 29 under the condition that the Rein is 2500 and the heat flux is 1 kW/m2.
It can be obtained from Figure 29 that the strength of the advantage vortexes in the flow channel section gradually declines with the increase of shape factor and even nearly fades with the A of tan 62.5 ° . Additionally, it can be found in Figure 29 that the advantage vortexes move away from the heating wall when A increases from tan 45 ° to tan 52.5 ° . The decay of centrifugal force induced by the increase of A leads to the phenomenon. On the one hand, the erosion of the centrifugal force weakens the heat-exchanging phenomenon inside the channels, resulting in the decline of the He–Xe heat transfer capacity. On the other hand, the decay of centrifugal also drives the advantage vortexes to move toward the heating wall, strengthening the heat-exchanging phenomenon inside the channels. Specifically, when A increases from tan 45 ° to tan 52.5 ° , the vortex center moving to the heating wall plays a major role in the heat transfer capacity of the helium–xenon flow. At this stage, relatively strong vortices still exist inside the flow domain, which is manifested as an obvious curvature radius of the velocity vector inside the flow field. Therefore, in this stage, the increase of A plays a positive role in the convective heat transfer capacity. However, when the shape factor increases from tan 52.5 ° to tan 62.5 ° , the reduction of vortices plays a major role in the heat transfer capacity of the helium–xenon flow. At this stage, the vortex inside the flow domain gradually disappears, which is manifested as the circumferential flow inside the flow domain gradually disappearing. Therefore, in this stage, the increase of A has a negative influence on the convective heat transfer capacity of the flow domain. As a result, the heat transfer capacity of He–Xe flow in the Serpentine channels first increases and then decreases, achieving the largest value with an A of tan 52.5 ° .
The shape factor has different influence characteristics on the heat transfer capacity of the flow field under different Re numbers. The contribution of A to the change of Nuave can be obtained as follows:
I f A = A i / A j N u a v e , i / N u a v e , j
The influence factors of shape factor on Nuave with different Re are shown in Figure 30.
Here, the interval of A from tan 45 °   tan 47.5 ° is defined as A interval 1, and so are other intervals of A in Figure 29. As mentioned above, the larger the influence factor of the flow field feature is, the more limited the heat transfer ability of the flow field feature to influence the helium–xenon flow field is. The higher the Re number is, the lower the average of shape factor influence factors are when the shape factor is less than the tan 52.5 ° . It is indicated that the higher the Re number inside the channels, the greater the influence of the shape factor on the heat transfer capacity of He–Xe flow during this range. However, the tendencies change with the increase of the shape factor. The higher the Re number is, the higher the average of shape factor influence factors are as well, when the shape factor is more than the tan 52.5 ° . It is indicated that the higher the Re number inside the channels, the less the influence of the shape factor on the heat transfer capacity of He–Xe flow during this range. The phenomenon above indicates that the centrifugal force continues to influence the flow heat transfer in the flow field with a high Renumber when the shape factor is more than the tan 52.5 ° . The phenomenon described above is also consistent with the Nuave profile in Figure 29. A sharper increase of the heat transfer capacity with a Re of 6000 compared with a Re of 2500 can be obtained when A is smaller than tan 52.5 ° . Meanwhile, a slower decline of the heat transfer capacity with a Re of 6000 compared with a Re of 2500 can be obtained when A is larger than tan 52.5 ° . A stronger centrifugal force induced by the velocity increase leads to the phenomenon. The advantage vortexes caused by centrifugal force still influence the flow pattern with the rise of A, alleviating the rapid deterioration of the heat transfer capacity of the He–Xe flow.

3.3.2. Influence of A on the Second Law of Thermodynamics

As mentioned, the Hesselgreaves number can evaluate the irreversibility of energy in the physical field. In industrial applications, an ideal heat exchanger should be characterized by efficient heat transfer at the cost of minimal energy loss. The shape factor affects the heat transfer capacity of the He–Xe flow in the Serpentine channel and has a noticeable influence on the irreversibility inside the Serpentine channel. Figure 31 shows the irreversibility of Serpentine channels with different shape factors within one single period under different Re numbers and a heat flux of 1 kW/m2.
It can be observed from Figure 31 that the irreversibility of the He–Xe flow increases significantly with the increase of the Re number of the He–Xe flow. Specifically, the irreversibility of the He–Xe flow increases from around 0.96 to around 9.12, with Res of which are 2500 and 6000, respectively. Meanwhile, the irreversibility distribution feature also changes with the increase of Re. The irreversibility of the He–Xe flow gradually decreases with the increase of the shape factor when Re is 2500. However, with the rise of Re, the influence induced by shape factors on the irreversibility of the He–Xe flow gradually declines. According to the above analysis, the impact of centrifugal force on the He–Xe flow becomes increasingly apparent with the increase of Re. Under the continuous influence of centrifugal force, the irreversibility of the He–Xe flow in Serpentine channels with different shape factors tends to flatten when Re is 6000. Figure 32 displays the thermal economic performance of He–Xe flow fields at different Re numbers with varying shape factors.
It can be concluded from Figure 32 that the best thermal economic performance of the He–Xe flow in Serpentine channels at different Re numbers can be obtained when the shape factor of the Serpentine channel equals tan 52.5 ° . The best heat transfer performance can be achieved under the condition of high heat flux, a low Re number, and the shape factor of Serpentine channel equaling tan 52.5 ° , based on the content of the analysis.

4. Conclusions

The thermodynamic performance of He–Xe in channels with different configurations is investigated in this paper. Given the particularity of the physical properties of He–Xe, the factors affecting the heat transfer capacity of He–Xe in the microchannel are analyzed from the mechanism and verified by numerical simulation. Based on the analysis, it is concluded that improving the flow channel characteristics may enhance the heat transfer capacity of He–Xe flow in the channels. The thermodynamic characteristics of helium–xenon in three configurations of microchannel structures are analyzed based on the first and second laws of thermodynamics. The optimal configuration is obtained by comparing the thermal economic performance of the He–Xe flow pattern in different channels. The conclusions of this paper are as follows:
(1)
It is found by analyzing the effective thermal diffusivity distribution of He–Xe that the temperature distribution of He–Xe at the bottom of the flow domain (y+ < 30) under different flow conditions is the same. The effective thermal diffusivity distribution of He–Xe is determined by the flow pattern in and logarithmic zone and beyond (y+ > 30). Additionally, it is found that the influence of Pr on Nu is stronger than that of Re under different heat fluxes. This indicates that increasing the working temperature of He–Xe fluid is an effective way to enhance heat transfer capacity under the same Re number and channel characteristics.
(2)
By analyzing the flow characteristics of helium–xenon inside the Zig tube, it is found that the dead flow zone and low-velocity zone inside the Zig channel will significantly affect the energy loss where local flow entropy generation reached 1.05 × 10⁶. The maximum flow entropy generation of Sine and Serpentine pipelines with a smooth transition is only around 9000. The average Nu of one period of the Zig channel is 11.5, while that of the Sine and Serpentine channels is 14.5 and 14.84, respectively. In general, the helium–xenon flow field in the Sine channel and Serpentine channel are better than that in the Zig channel from both the first law of thermodynamics and the second law of thermodynamics.
(3)
The centrifugal force on the He–Xe flow in the Sine channel is a function of the X-axis location, while the centrifugal force on the He–Xe flow in the Serpentine channel keeps constant. Therefore, the heat transfer capacity of the He–Xe flow in the Serpentine channel is slightly stronger than that in the Sine channel under the continuous influence of centrifugal force. Meanwhile, the irreversibility of the He–Xe flow in the Serpentine channel is also slightly higher than that in the Sine channel. In this paper, Nu/Ns is adopted as an index to evaluate the thermal economic performance of the He–Xe flow in the Serpentine channel. It is found that the He–Xe flow in the Serpentine channel is featured with a better thermal economic performance.
(4)
The Serpentine channel with a shape factor of tan 52.5 ° is characterized by the best thermodynamic performance considering the first and second laws of thermodynamics. The PCHE with the Serpentine channel as the unit channel may have a better industrial performance with high heat flux and low velocity, considering the increase of the heat transfer cost with the increase of Re.
This paper studies the characteristics of helium–xenon convective heat transfer ability in microchannels based on theoretical analysis and numerical simulation. Based on these research results, the idea of enhancing heat transfer is proposed. Due to the limitation of this research objective, this paper only analyzes the heat transfer performance under a constant channel cross-section size. In fact, with the change in flow size, the heat transfer characteristics of helium–xenon inside the channels may show different rules. Further research on the heat transfer of the helium–xenon channel can be started from the size effect of the pipeline, and the relationship between the channel size and the heat transfer performance of helium–xenon can be analyzed. On the other hand, considering that the helium–xenon central region determines the fluid’s convective heat transfer capacity, the subsequent work can study the influence of the microstructure of the heating wall on the helium–xenon flow domain.

Author Contributions

Z.S.: conceptualization, methodology, writing—original draft, and numerical analysis. H.Z.: supervision, and writing—review and editing. Q.S.: investigation. C.Z.: software. All authors have read and agreed to the published version of the manuscript.

Funding

This work was supported by the National Key R&D Program of China under grant number 2020YFB1901900.

Conflicts of Interest

The authors declare that they have no known competing financial interests or personal relationships that could have appeared to influence the work reported in this paper.

Nomenclature

AShape factorVVolume (m3)
aThermal diffusivity (m2/s)UVelocity vector (m/s)
cLength of half a period (mm)uThe component of velocity in the x direction (m/s)
cpSpecific heat capacity [kJ/(kg·K)]vThe component of velocity in the y direction (m/s)
D T Hydraulic diameter (mm)wThe component of velocity in the z direction (m/s)
E P Thermal economic performance y+Dimensionless distance to the wall
HThe height of one single period (m)xCartesian coordinates x-axis (m)
h Convective heat transfer coefficient [W/(m2·K)]yCartesian coordinates y-axis (m)
h a v e Average convective heat transfer coefficient of one single period [W/(m2·K)]zCartesian coordinates z-axis (m)
h l o c a l Local convective heat transfer coefficient [W/(m2·K)]Greek symbols
I f P r Influence factor of PrαAngle of the arc (°)
I f R e Influence factor of ReβAngle of the arc (°)
I f A Influence factor of A ξ Friction coefficient
kTurbulent kinetic energy (m2/s2) λ Thermal conductivity [W/(m·K)]
KRadius of curvature (m) λ t Turbulent thermal diffusivity [W/(m·K)]
N s Hesselgreaves number λ e f f Effective thermal diffusivity
N s , T e m Hesselgreaves number caused by heat transfer ρ Density (kg/m3)
N s , f l o w Hesselgreaves number caused by the flow μ Viscosity (Pa·s)
NuNusselt number μ t Turbulent viscosity (Pa·s)
N u a v e Average Nusselt number of one single period ε Turbulent dissipation rate
N u l Local Nusselt numberνKinematic viscosity
PPressure (Pa) δ v Thickness of the Viscous layer
PrPrandtl number δ b Thickness of the Buffer layer
PrtTurbulent Prandtl number δ l Thickness of the Logarithmic layer
Q ˙ Heat transfer rate (W)Subscript
qHeat flux (W/m2) b u l k Bulk
rThe radius of arc (m) w a l l Wall
ReReynolds number l o c a l Local
ReinReynolds number of velocity inlet v Viscous layer
S T Source Term b Buffer layer
S ˙ g e n Volumetric entropy generation rate [W/(m3·K)] l Logarithmic layer
T Temperature (K) t Turbulent
T w a l l Temperature of heat wall (K) e f f Effective
T b u l k Temperature of flow bulk (K) i n Inlet pattern

References

  1. El-Genk, M.S.; Schriener, T.M. Long operation life reactor for lunar surface power. Nucl. Eng. Des. 2011, 241, 2339–2352. [Google Scholar] [CrossRef]
  2. National Research Council. NASA Space Technology Roadmaps and Priorities: Restoring NASA’s Technological Edge and Paving the Way for a New Era in Space; National Academies Press: Washington, DC, USA, 2012. [Google Scholar]
  3. NASA. Technology Roadmaps TA3: Space Power and Energy Storage; NASA: Washington, DC, USA, 2015.
  4. Liu, H.; Chi, Z.; Zang, S. Optimization of a closed Brayton cycle for space power systems. Appl. Therm. Eng. 2020, 179, 115611. [Google Scholar] [CrossRef]
  5. Romano, L.F.R.; Ribeiro, G.B. Optimization of a heat pipe-radiator assembly coupled to a recuperated closed Brayton cycle for compact space power plants. Appl. Therm. Eng. 2021, 196, 117355. [Google Scholar] [CrossRef]
  6. Wu, P.; Ma, Y.; Gao, C.; Liu, W.; Shan, J.; Huang, Y.; Wang, J.; Zhang, D.; Ran, X. A review of research and development of supercritical carbon dioxide Brayton cycle technology in nuclear engineering applications. Nucl. Eng. Des. 2020, 368, 110767. [Google Scholar] [CrossRef]
  7. MacDonald, P.E.; Baxter, A.M.; Bayless, P.D.; Bolin, J.M.; Gougar, H.D.; Moore, R.L.; Ougouag, A.M.; Richards, M.B.; Sant, R.L.; Sterbentz, J.W.; et al. The Next Generation Nuclear Plant-Insights Gained from the INEEL Point Design Studies; Idaho National Lab (INL): Idaho Falls, ID, USA, 2004.
  8. El-Genk, M.S.; Tournier, J.M. On the use of noble gases and binary mixtures as reactor coolants and CBC working fluids. Energy Convers. Manag. 2008, 49, 1882–1891. [Google Scholar] [CrossRef]
  9. Schleicher, R.; Raffray, A.R.; Wong, C.P. An assessment of the Brayton cycle for high performance power plants. Fusion Sci. Technol. 2001, 39 Pt 2, 823–827. [Google Scholar] [CrossRef]
  10. El-Genk, M.S.; Tournier, J.M. Noble gas binary mixtures for gas-cooled reactor power plants. Nucl. Eng. Des. 2008, 238, 1353–1372. [Google Scholar] [CrossRef]
  11. Tournier, J.M.P.; El-Genk, M.S. Properties of noble gases and binary mixtures for closed Brayton Cycle applications. Energy Convers. Manag. 2008, 49, 469–492. [Google Scholar] [CrossRef]
  12. Xu, C.; Kong, F.; Yu, D.; Yu, J.; Khan, M.S. Influence of non-ideal gas characteristics on working fluid properties and thermal cycle of space nuclear power generation system. Energy 2021, 222, 119881. [Google Scholar] [CrossRef]
  13. El-Genk, M.; Tournier, J.M. Selection of noble gas binary mixtures for Brayton space nuclear power systems. In Proceedings of the 4th International Energy Conversion Engineering Conference and Exhibit (IECEC), San Diego, CA, USA, 26–29 June 2006; p. 4168. [Google Scholar]
  14. Wang, Z. Study on Bretton Cycle Characteristics of Helium-Xenon Mixed Working Fluid Based on Space Nuclear Power System; Harbin Institute of Technology: Harbin, China, 2021. [Google Scholar]
  15. Yang, X.; Shi, L. Thermodynamic Analysis of closed Brayton Cycle in space nuclear reactor Power Supply. J. Tsinghua Univ. Nat. Sci. 2008, 58, 821–826. [Google Scholar]
  16. Hu, W.; Deng, J.; Liu, X.; Li, Z.; Xue, B. Preliminary study on Key parameters of small helium-xenon cooled reactor. Nucl. Technol. 2021, 44, 85–90. [Google Scholar]
  17. Lee, Y.; Lee, J.I. Structural assessment of intermediate printed circuit heat exchanger for sodium-cooled fast reactor with supercritical CO2 cycle. Ann. Nucl. Energy 2014, 73, 84–95. [Google Scholar] [CrossRef]
  18. Kim, I.H. Experimental and Numerical Investigations of Thermal-Hydraulic Characteristics for the Design of a Printed Circuit Heat Exchanger (PCHE) in HTGRs. Ph.D. Thesis, Korea Advanced Institute of Science and Technology, Daejeon, Republic of Korea, 2012. Available online: http://hdl.handle.net/10203/182224 (accessed on 12 March 2023).
  19. Peng, Y.; Li, Z.; Li, S.; Cao, B.; Wu, X.; Zhao, X. The experimental study of the heat transfer performance of a zigzag-serpentine microchannel heat sink. Int. J. Therm. Sci. 2021, 163, 106831. [Google Scholar] [CrossRef]
  20. Kim, S.G.; Lee, Y.; Ahn, Y.; Lee, J.I. CFD aided approach to design printed circuit heat exchangers for supercritical CO2 Brayton cycle application. Ann. Nucl. Energy. 2016, 92, 175–185. [Google Scholar] [CrossRef]
  21. Taylor, M.F.; Bauer, K.E.; McEligot, D.M. Internal forced convection to low-Prandtl-number gas mixtures. Int. J. Heat Mass Transf. 1988, 31, 13–25. [Google Scholar]
  22. Dittus, F.W.; Boelter, L.M.K. Heat transfer in automobile radiators of the tubular type. Int. Commun. Heat Mass Transf. 1985, 12, 3–22. [Google Scholar]
  23. Pickett, P.E.; Taylor, M.F.; McEaligot, D.M. Heated turbulent flow of helium—Argon mixtures in tubes. Int. J. Heat Mass Transf. 1979, 22, 705–719. [Google Scholar] [CrossRef]
  24. Kays, W.M.; Crawford, M.E.; Weigand, B. Convective Heat and Mass Transfer; McGraw-Hill: New York, NY, USA, 1980. [Google Scholar]
  25. Qin, H.; Wang, C.; Tian, W.; Qiu, S.; Su, G. Experimental investigation on flow and heat transfer characteristics of He-Xe gas mixture. Int. J. Heat Mass Transf. 2022, 192, 122942. [Google Scholar] [CrossRef]
  26. Vitovsky, O.V. Experimental study of heat transfer during the flow of a gas coolant in a heated quasi-triangular channel. Int. J. Heat Mass Transf. 2022, 190, 122771. [Google Scholar] [CrossRef]
  27. Nakoryakov, V.E.; Vitovsky, O.V. Study of heat transfer of a helium–xenon mixture in heated channels with different cross-sectional shapes. J. Appl. Mech. Tech. Phys. 2017, 58, 664–669. [Google Scholar] [CrossRef]
  28. Nakoryakov, V.E.; Elistratov, S.L.; Vitovsky, O.V.; Slesareva, E.Y. Experimental investigation of heat transfer in helium-xenon mixtures in triangle channels. J. Eng. Thermophys. 2015, 24, 139–142. [Google Scholar] [CrossRef]
  29. Qin, H.; Fang, Y.; Wang, C.; Tian, W.; Qiu, S.; Su, G.; Deng, J. Numerical investigation on heat transfer characteristics of helium-xenon gas mixture. Int. J. Energy Res. 2021, 45, 11745–11758. [Google Scholar] [CrossRef]
  30. Zhou, B.; Ji, Y.; Sun, J.; Sun, Y. Modified turbulent Prandtl number model for helium–xenon gas mixture with low Prandtl number. Nucl. Eng. Des. 2020, 366, 110738. [Google Scholar] [CrossRef]
  31. Vitovsky, O.V.; Makarov, M.S.; Nakoryakov, V.E.; Naumkin, V.S. Heat transfer in a small diameter tube at high Reynolds numbers. Int. J. Heat Mass Transf. 2017, 109, 997–1003. [Google Scholar] [CrossRef]
  32. Bejan, A. The concept of irreversibility in heat exchanger design: Counterflow heat exchangers for gas-to-gas applications. J. Heat Transfer. 1977, 99, 374–380. [Google Scholar] [CrossRef]
  33. Hesselgreaves, J.E. Rationalisation of second law analysis of heat exchangers. Int. J. Heat Mass Transf. 2000, 43, 4189–4204. [Google Scholar] [CrossRef]
  34. Ji, Y.; Zhang, H.-C.; Tong, J.-F.; Wang, X.-W.; Wang, H.; Zhang, Y.-N. Entropy assessment on direct contact condensation of subsonic steam jets in a water tank through numerical investigation. Entropy 2016, 18, 21. [Google Scholar] [CrossRef]
  35. Fluent Inc. Fluent User’s Guide; Fluent Inc.: New York, NY, USA, 2019. [Google Scholar]
  36. Dragunov, Y.G.; Smetannikov, V.P.; Gabaraev, B.A.; Belyakov, M.S.; Kobzev, P.V. On the choice of correlations for calculating the heat transfer coefficient in binary gas mixtures. J. Eng. Thermophys. 2013, 22, 30–42. [Google Scholar] [CrossRef]
  37. Sleicher, C.A.; Rouse, M.W. A convenient correlation for heat transfer to constant and variable property fluids in turbulent pipe flow. Int. J. Heat Mass Transf. 1975, 18, 677–683. [Google Scholar] [CrossRef]
  38. Jischa, M.; Rieke, H.B. About the prediction of turbulent Prandtl and Schmidt numbers from modeled transport equations. Int. J. Heat Mass Transf. 1979, 22, 1547–1555. [Google Scholar] [CrossRef]
  39. Azer, N.Z.; Chao, B.T. A mechanism of turbulent heat transfer in liquid metals. Int. J. Heat Mass Transf. 1960, 1, 121–138. [Google Scholar] [CrossRef]
  40. Kim, J.; Moin, P.; Moser, R. Turbulence statistics in fully developed channel flow at low Reynolds number. J. Fluid Mech. 1987, 177, 133–166. [Google Scholar] [CrossRef]
  41. McEligot, D.M.; Taylor, M.F. The turbulent Prandtl number in the near-wall region for low-Prandtl-number gas mixtures. Int. J. Heat Mass Transf. 1996, 39, 1287–1295. [Google Scholar] [CrossRef]
  42. Schlichting, H.; Kestin, J. Boundary Layer Theory; McGraw-Hill: New York, NY, USA, 1961. [Google Scholar]
  43. Sun, Z.; Zhang, H.; Wang, Q.; Sun, W. Entropy Generation Analysis of the Flow Boiling in Microgravity Field. Entropy 2022, 24, 569. [Google Scholar] [CrossRef] [PubMed]
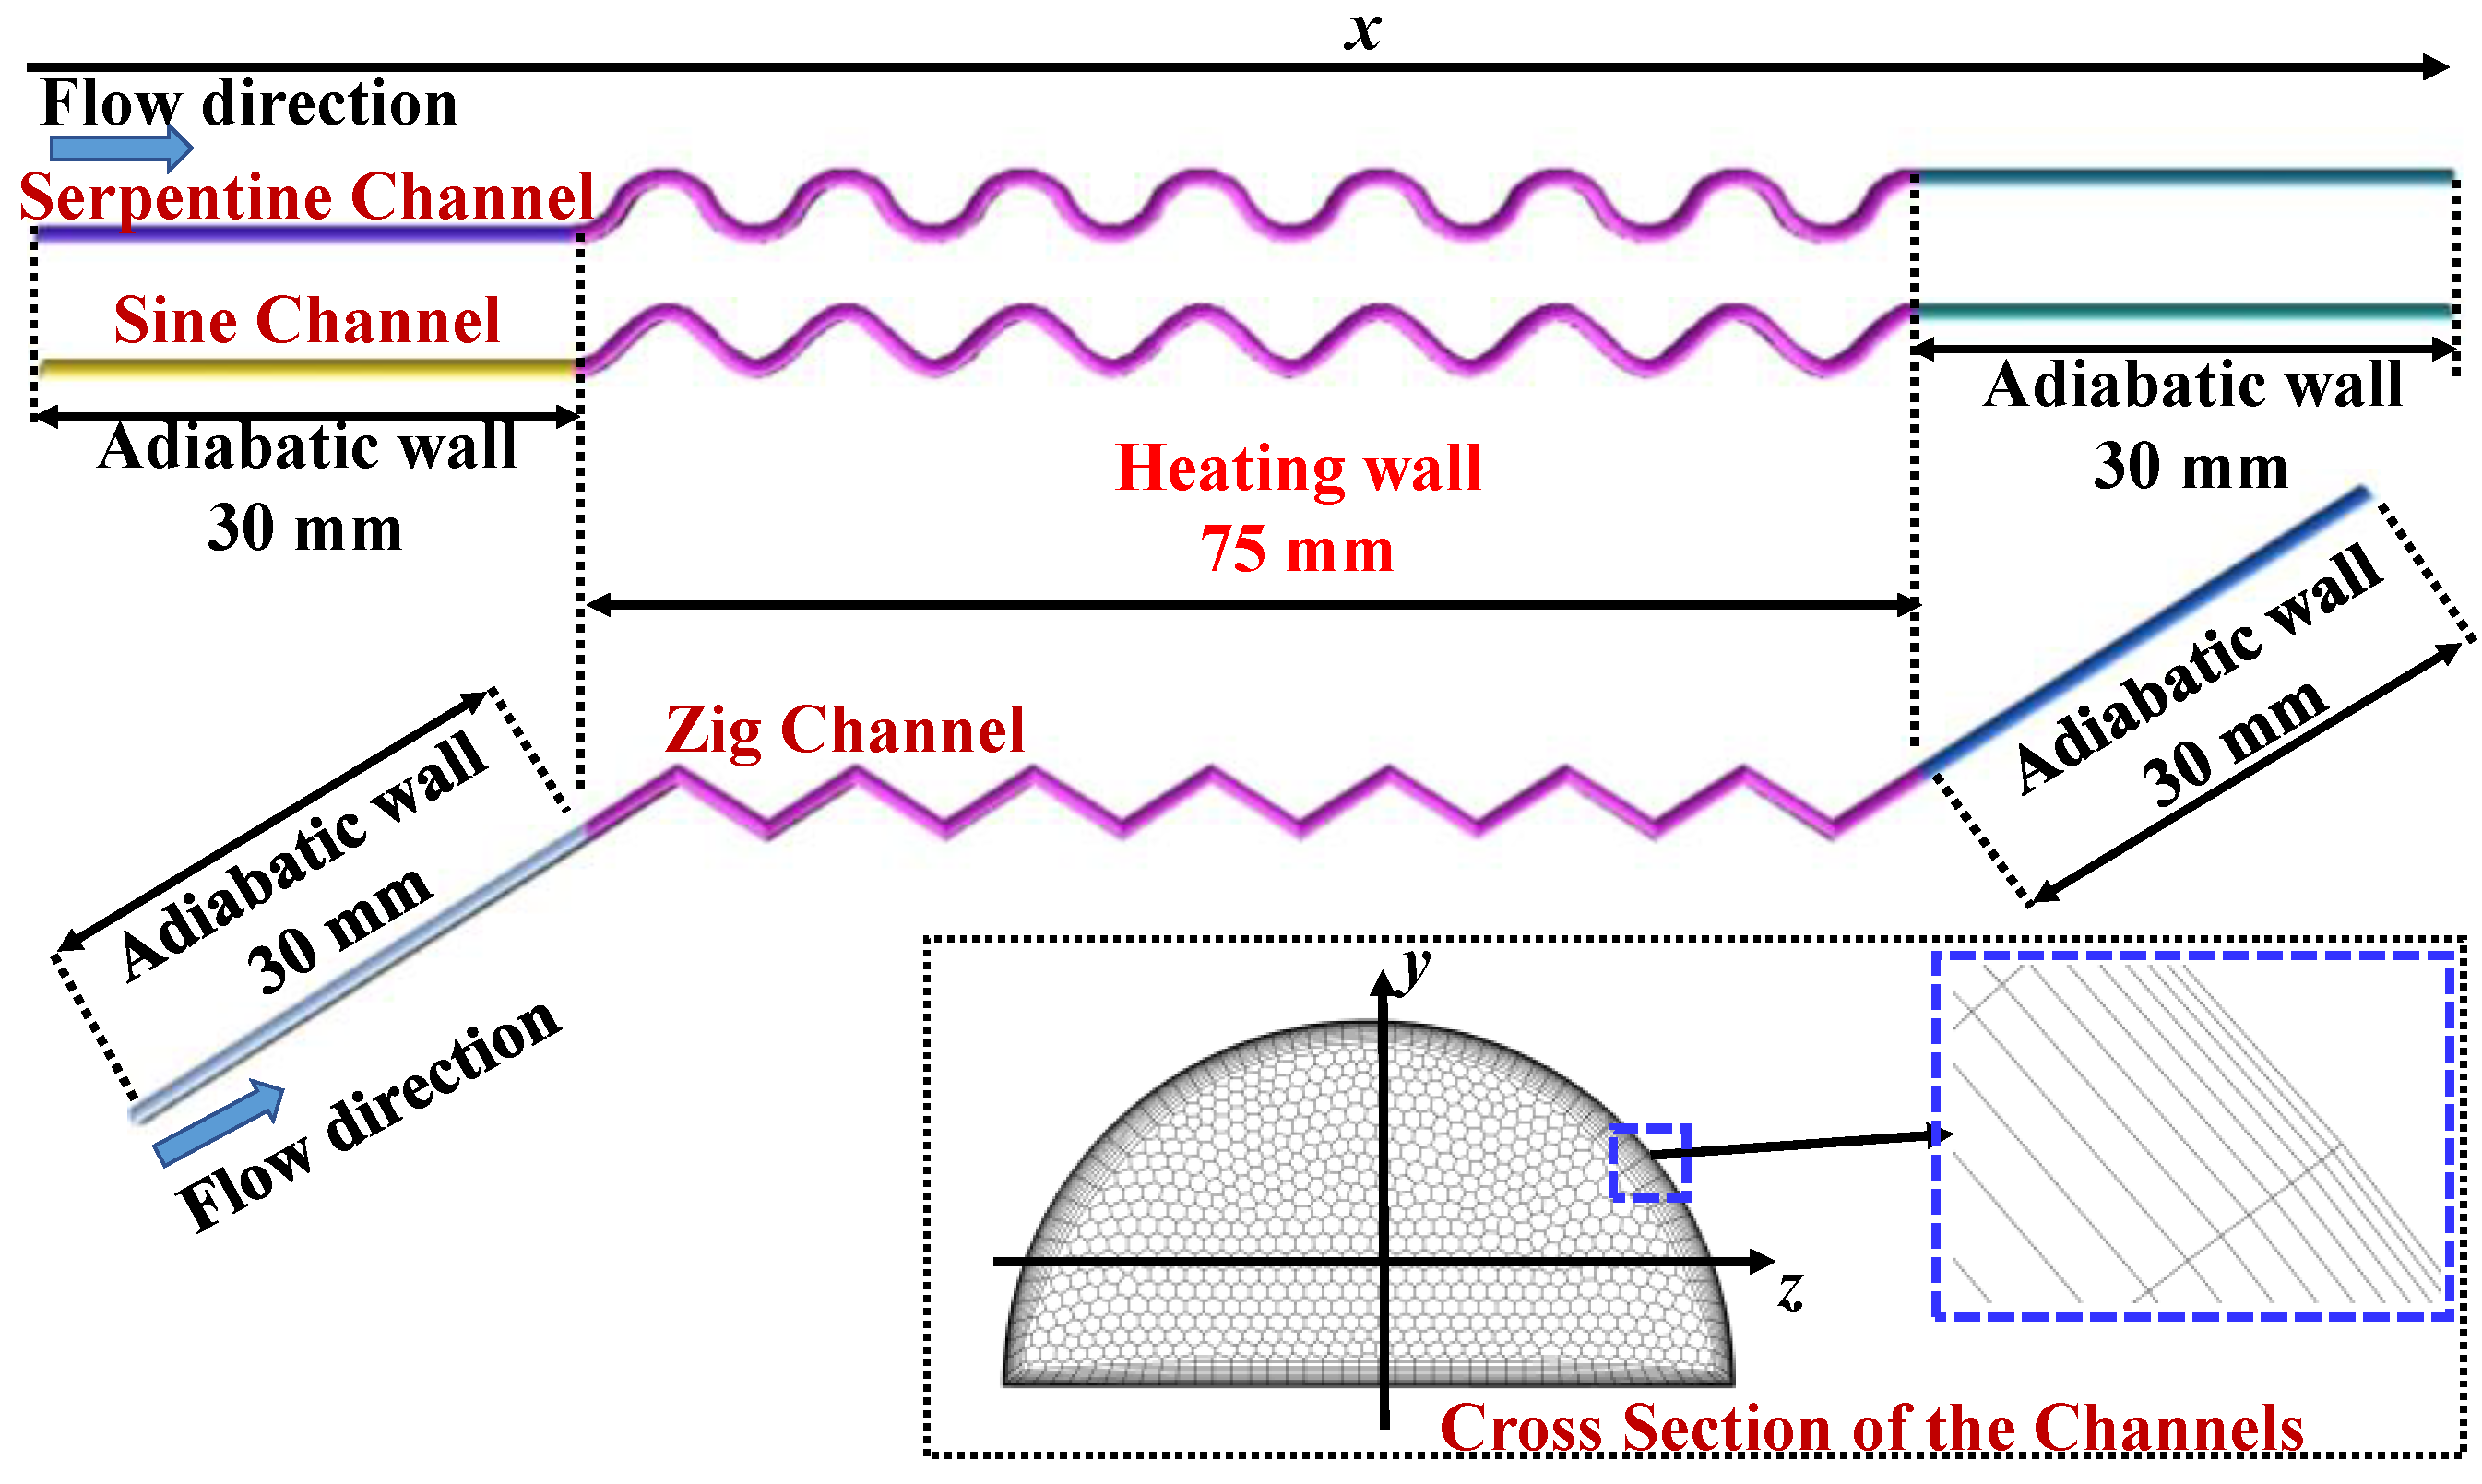
Figure 1. Geometries and meshes.
Energies 16 03322 g001
Figure 2. The configurations of different channels. (a) Serpentine channel configuration. (b) Zig channel configuration. (c) Sine channel configuration.
Energies 16 03322 g002
Figure 3. The properties of He–Xe (P = 0.65 Mpa, Mmix = 40 g/mol).
Energies 16 03322 g003
Figure 4. The comparison between different meshes.
Energies 16 03322 g004
Figure 5. Scheme (a) and photo (b) of the channel’s cross-section.
Energies 16 03322 g005
Figure 6. The comparison of the local heat transfer coefficient between the experiment and simulation.
Energies 16 03322 g006
Figure 7. The verification of the numerical model.
Energies 16 03322 g007
Figure 8. The properties of He–Xe vs. the molar fraction of xenon (P = 0.6 Mpa, T = 640 K).
Energies 16 03322 g008
Figure 9. The radial temperature and velocity distributions under Rein = 2500 (Zig tunnel, A = tan 57.5 ° , q = 1 kW/m2, and 29% Xe).
Energies 16 03322 g009
Figure 10. Profiles of fractional contributions of the viscous and Reynolds stresses to the total stress.
Energies 16 03322 g010
Figure 11. The physical process (a) of Equation (21) and the physical process (b) of Equation (22).
Energies 16 03322 g011
Figure 12. Profiles of contributions of λ and λ t to λ e f f , Rein = 2500, and 29% Xe.
Energies 16 03322 g012
Figure 13. Flow pattern distributions of different at different cross sections, Rein = 2500. (a) Cross-sections’ schematic. (b) Contours of velocity at a different cross-section. (c) Distributions of near-wall effective thermal conductivity at different cross-sections.
Energies 16 03322 g013aEnergies 16 03322 g013b
Figure 14. Local heat transfer capacity vs. cross-section ID, Rein = 2500.
Energies 16 03322 g014
Figure 15. The pressure features inside the Zigzag tunnel (Rein = 2500).
Energies 16 03322 g015
Figure 16. Periodic verification of flow pattern (Rein = 2500, 29% Xe). (a) The cross-section velocity distribution in the X–Y plane. (b) The △Pressure Drop of different periods.
Energies 16 03322 g016
Figure 17. The cross-section diagram.
Energies 16 03322 g017
Figure 18. Influence of the He–Xe property on heat transfer capacity (Rein = 6000, A = tan 57.5 ° , and 29% Xe).
Energies 16 03322 g018
Figure 19. The influence of Re with certain Pr, 29% Xe.
Energies 16 03322 g019
Figure 20. Profiles of local and average heat transfer coefficient in one period (Rein = 2500, A = tan 57.5 ° , q = 1 kW/m2, and 29% Xe).
Energies 16 03322 g020
Figure 21. Force analysis of He–Xe in different tubes. (a) Zig channel. (b) Sine channel. (c) Serpentine channel.
Energies 16 03322 g021aEnergies 16 03322 g021b
Figure 22. The velocity distributions and temperature contours in different tunnels at the same location (Rein = 2500, A = tan 57.5 ° , q = 1 kW/m2, and 29% Xe; cross-section ID_3 in Figure 17). (a) Zig channel. (b) Sine channel. (c) Serpentine channel.
Energies 16 03322 g022aEnergies 16 03322 g022b
Figure 23. The distribution of local heat transfer entropy generation rate (Rein = 2500, A = tan 57.5 ° , q = 1 kW/m2, and 29% Xe; cross-section ID_3 in Figure 17).
Energies 16 03322 g023
Figure 24. The heat transfer Hesselgreaves number of one period in different configurations.
Energies 16 03322 g024
Figure 25. The features of the flow pattern. (a) The distribution of local flow entropy generation rate. (b) The flow Hesselgreaves number and P of one period in different channels.
Energies 16 03322 g025aEnergies 16 03322 g025b
Figure 26. Comparison of different channels (Re = 2500, A = tan 57.5 ° , and q = 1 kW/m2).
Energies 16 03322 g026
Figure 27. Nuave vs. shape factor (Rein = 2500, A = tan α ° , q = 1 kW/m2, and 29% Xe.
Energies 16 03322 g027
Figure 28. Nuave vs. shape factor (Rein = 2500~6000, A = tan α ° , q = 1 kW/m2, and 29% Xe.
Energies 16 03322 g028
Figure 29. The vortex changes under the influence of A within the same cross-section (cross-section ID_8 in Figure 17).
Energies 16 03322 g029
Figure 30. The impact factor of A on Nuave (Rein = 2500~6000, q = 1 kW/m2, and 29% Xe).
Energies 16 03322 g030
Figure 31. The irreversibility vs. A under different Res (A = tan α ° , q = 1 kW/m2, and 29% Xe.
Energies 16 03322 g031
Figure 32. EP vs. A under different Res (A = tan α ° , q = 1 kW/m2, and 29% Xe.
Energies 16 03322 g032
Table 1. Detailed information on the simulation cases.
CaseStructure T i n
(K)
q (kW/m2)Shape Factor (A) R e i n
(×10−3)
1Sine624.51 tan 57.5 ° 2.5
2Zigzag624.51 tan 57.5 ° 2.5
3Serpentine624.51 tan 57.5 ° 2.5/3/3.5/4.5/6
4Serpentine624.55/10/15/20 tan 57.5 ° 6
5Serpentine624.510 tan 57.5 ° 2.5/3/3.5/4.8
6Serpentine624.51 tan 45 ° 2.5/4/6
7Serpentine624.51 tan 47.5 ° 2.5/4/6
8Serpentine624.51 tan 50 ° 2.5/4/6
9Serpentine624.51 tan 52.5 ° 2.5/4/6
10Serpentine624.51 tan 55 ° 2.5/4/6
11Serpentine624.51 tan 60 ° 2.5/4/6
12Serpentine624.51 tan 62.5 ° 2.5/4/6
Table 2. The mesh independence test.
MeshSizemax of the Cell (mm)Ratio (y1/y0)y+max
Mesh 10.121.210.8
Mesh 20.11.25.2
Mesh 30.0851.22.4
Mesh 40.081.21.03
Mesh 50.0751.20.75
Table 3. The pressure drop during different cross-sections (Rein = 2500).
IntervalCross-section IDs 1–2Cross-section IDs 1–3Cross-section IDs 3–4
Pressure Drop (Pa)328.687729.047236.347
Disclaimer/Publisher’s Note: The statements, opinions and data contained in all publications are solely those of the individual author(s) and contributor(s) and not of MDPI and/or the editor(s). MDPI and/or the editor(s) disclaim responsibility for any injury to people or property resulting from any ideas, methods, instructions or products referred to in the content.