Article

Microstructure of Surface Pollutants and Brush-Based Dry Cleaning of a Trough Concentrating Solar Power Station

1
School of Power and Mechanical Engineering, Wuhan University, Wuhan 430062, China
2
Shenzhen Research Institute of Wuhan University, Shenzhen 518000, China
3
CGN Inspection Technology Co., Ltd., Shenzhen 518038, China
4
CGN Solar Energy (Delingha) Photovoltaic Co., Ltd., Delingha 817000, China
*
Author to whom correspondence should be addressed.
Energies 2023, 16(7), 3260; https://doi.org/10.3390/en16073260
Submission received: 10 November 2022 / Revised: 21 December 2022 / Accepted: 13 March 2023 / Published: 5 April 2023

Abstract

:
The accumulation of pollutants on the surface of a Concentrating Solar Power (CSP) station reduces the power generation efficiency of the whole power plant, affects electricity output, and decreases sales income; therefore, it is particularly important to develop a reasonable and effective cleaning process. Surface pollutants which have a strong interaction with the cleaning process of power stations can determine the quality of cleaning to a certain extent. In this paper, the pollutants on the surface of a trough CSP station with different usage times were collected and characterized using a scanning electron microscope (SEM), a particle size analyzer (PSA), and a transmission electron microscope (TEM). It was found that most of the surface pollutants were of a fine size and included amorphous particles which mainly resulted from the sedimentation of particles suspended for a short time or particles in the process of atmospheric circulation for a long time. Considering the service life of the mirror and the scarcity of water resources in the area where the trough CSP power station is located, a brush-based dry cleaning process with different cleaning times was developed. By comparing the changes in the reflectivity and micro-morphology of the mirror surface before and after cleaning, the feasibility and superiority of the brush-based dry cleaning process were fully confirmed.

1. Introduction

Trough Concentrating Solar Power (CSP) stations are currently the most mature technology installed globally [1] and have been widely researched and applied due to their advantage of a high installed capacity which enables one to store heat for later use [2,3]. It is also worth mentioning that with the progress and development of technology, the advantages of a low development risk, low cost, simple structure, and high commercial maturity of CSP stations are emerging [4,5]. CSP stations realize the conversion of light energy to heat energy through the process of mirror aggregation, reflection, and collector tube absorption [6,7].
Reflectors work in the field environment for more than 20 years and even up to 30 years [8], during which time they can easily stick to dust, debris, etc., thus reducing the optical focus of the system. The heat collection efficiency decreases as the average effective reflectance decreases [9], which directly leads to a decrease in power plant output [10] and electricity sales revenue [11]. Pollutant particles can greatly reduce the performance of a collector. For example, dust particles on CSP mirrors installed on the rooftop of a W12 building with coordinates of 25°17′16″ NL and 55°28′42″ EL could reduce the emissivity of the mirror surface by approximately 63% after 3 months of exposure [12]. Furthermore, an amount of 1.5 g/m2 of dust could reduce the instantaneous performance of the collector by up to 60% and also reduce the average performance during dust deposition by up to 37% [13]. The sizes and chemical compositions of pollutant particles vary greatly with the different locations of photothermal power stations [14], which leads to different patterns of deposition on the surfaces of the reflectors. The location of particle accumulation also affects the reflectivity of the station [15,16]. For example, after 120 days without using any cleaning system, the horizontal, vertical, and local tilt angle positions showed decreases of 17.48%, 7.94%, and 14.13% in % transmittance, respectively [15]. In an another study, transmission decreased the most at the bottom edge of the reflector and the least at the center and top edge [17].
Extensive and detailed literature has been published on the exploration of cleaning technology, the optimization of cleaning frequency intervals in solar power plants [18], and the design of dedicated measurement systems [19,20], while the compositions and types of pollutants on the surfaces of photothermal power stations are rarely studied [16]. According to incomplete statistics [21], the literature related to cleaning technology accounts for 59.7% of the total, while the literature on the adhesion mechanisms of micro-particles on matrix surfaces accounts for 19.3% of the total. Fali Ju proposed a photovoltaic dust accumulation coefficient to evaluate the influence of ash accumulation on photovoltaic power generation performance [22]. E.Y Chen et al. fundamentally discussed the interaction between particles and the adhesion between particles and substrates [23]. Dust particles were collected using various suitably designed, 3D-printed jigs, and Si, O, C, and Fe were the most abundant elements [15]. Inhalable particulate matter has a strong relationship with the cleanliness index of a power station [24]. With the different locations of various solar power stations, different types of pollutant particles are deposited in different areas of the reflectors, and the cleaning processes also change [25]. Therefore, in order to ensure the efficiency of trough CSP stations, it is of great significance to determine the types and deposition modes of the pollutant particles gathered on the surfaces of the reflectors for the formulation of an appropriate cleaning process.
Parabolic trough collectors (PTC) are the most commonly utilized types of concentrating solar collectors in solar thermal power plants [26]. The Delingha 50 MW CSP station selected for this paper is of this type, and it is currently the largest photo-thermal power station in China in terms of its installed capacity and energy storage scale. The area selected for the construction of this trough CSP station is located in the vast Gobi Desert in the northwestern area of China, with sparse precipitation, drought, and few water resources. Large-scale CSP power stations over-rely on the cleaning process of spraying with large amounts of water, which will lead to the failure of sustainable regeneration of water resources and even damage the ecological balance of the environment [27]. In view of this, a reasonable dry brush cleaning process should be used to meet the cleaning needs of the trough CSP station in order to minimize the dependence of the cleaning process on water resources. Studies have shown that dry brush cleaning can improve the power generation effect by approximately 3% per week, and the effect can be improved by 5.4% if a vacuum cleaner is used [28]. Moreover, the use of a dry brush cleaning process to clean dusty reflector surfaces will not have significant and permanent effects on the CSP station’s optical properties [29]. AliAl Shehri used an accelerated wear testbed to simulate 20 years’ worth of cleaning and then compared the effects of different brushes made of nylon, cloth, and rubber on the cleaning efficiency. They found that rubber has a strong cleaning effect on fine particles and wet dust layers, and the cleaned surface is very smooth [30]. The dry dust removal brush of the photovoltaic module designed by Ru Kang, which integrates dust vacuuming, dust transport, and dust cleaning, can realize the cleaning of photovoltaic panels without water or a cleaner [31].
By designing a pollutant collection experiment, we analyzed the morphology and composition of the main pollutants gathered on the reflector surface of the CSP station, compared them with the soil in the surrounding environment of the CSP station, and concluded by examining the deposition modes of the pollutants in the CSP station. Based on these results, we designed a brush-based dry cleaning method and verified the feasibility and excellent performance of the process by quantifying the increase in reflectivity and the change in microstructure before and after cleaning.

2. Materials and Methods

2.1. Pollutant Collection

The compositions of contaminants on the reflector surface of a CSP station are complex and influenced by the natural environment of the site and the frequency of cleaning. In order to better simulate the contaminants on site, the reflector fragments were selected and placed in the area of the reflectors on site (which would not be cleaned during daily cleaning), the placement time was set to one or two months, and in each case, five samples were placed in the area. The dust on the reflector surface and the soil from the ground on the site were also collected using a clean non-woven cloth for comparative analysis. After the collection, the samples and the cloth were sealed in a box. At the same time, data including the meteorological conditions and air quality during the pollutant collection period were recorded.

2.2. Brush-Based Dry Cleaning Process

For the reflector surface cleaning needs of the CSP station, two structures (brushes with 8 or 10 loops; see Figure 1) were designed by considering the specificity of the field application, the type of contaminants on the surface, and the deposition mode. The diameter of all the holes used to mount the brushes in Figure 1 was 8 mm, and there were differences in the diameter of the mounted brushes. The diameter was 1 mm in the outest 2 circles (1 in Figure 1) and 0.8 mm in the remaining inner circles (2 in Figure 1). Both brush structures had the same design but varied in the number of loops (8 and 10 loops).
In order to clarify whether the brush-based dry cleaning process caused damage to the reflector, we considered the cleaning speed, cleaning frequency, and contact area. The brush diameter was 1.5 m, the cleaning speed was 3 km/h, and each point of the single contact time was approximately 1.8 s. The full service life of the reflector is 25 years and the use frequency of cleaning is twice a week for 6 months per year; therefore, the total number of cleanings is 1350. The mathematical formula for the equivalent cleaning time is:
T = t k 60
where T is the equivalent cleaning time, min; t is the single contact time between the brush and the mirror, s; and k is the number of times that the brush is used. Then, we can determine that the equivalent cleaning time T is approximately 40 min.
Accordingly, we designed experiments with different cleaning durations of 30, 60, and 120 min and compared the results with those for the unwashed samples. During the cleaning, we continuously sprayed the simulated contaminant particles.

2.3. Scanning Electron Microscope Characterization

Due to the requirement for sample conductivity of a scanning electron microscope (SEM), it is necessary to spray gold onto the sample surfaces to improve the conductivity in order to ensure that the sample morphology can be clearly characterized. The samples were first sprayed with gold (120 s) by an Ion Sputter Coater (Quorum, model: SC7620, Laughton, UK), and then they were observed by scanning electron microscopy (TESCAN, model: MIRA3, Brno, Czech Republic). The presence of gold on the surface of the samples caused them to slightly yellow in terms of the macroscopic morphology but did not affect the observation and testing of the samples. In order to determine the composition of the pollutants, a composition analysis of the pollutants on the reflector was carried out with energy spectrometer equipment (Oxford Instruments Nanoanalysis, model: Aztec Energy, Wycombe, UK).

2.4. Particle Size Analyzer Characterization

In order to accurately grasp the characteristics of the reflector contaminant particles, the particle sizes were investigated. The collected contaminants were dispersed in water, and a laser particle size analyzer (Malvern Panalytical, Model: Mastersizer 3000, Malvern, UK) was selected to test the prepared liquid. When the laser beam passed through the dispersed particle sample, the particle size measurement was completed by measuring the intensity of the scattered light. Then, the data were used to analyze and calculate the particle size based on the scattering pattern. After three tests, the final results were obtained.

2.5. Transmission Electron Microscopy Characterization

For very fine (nanoscale) dusts in the contaminant particles, high-resolution transmission electron microscopy (JEOL, model: JEM-2100Plus, Tokyo, Japan) was operated at 200 kV for analysis.

2.6. Reflectance Measurement Equipment

The instrument used for measuring the mirror reflectance was the portable specular reflectometer (D&S EXPORTS, model: 15R-USB, Norwalk, CT, USA). This equipment operates at a 15° incidence angle, with standard acceptance angles of 15, 25, and 46 mrad. After three tests, the final results were obtained.

3. Results and Discussion

3.1. Morphology and Composition of Pollutants

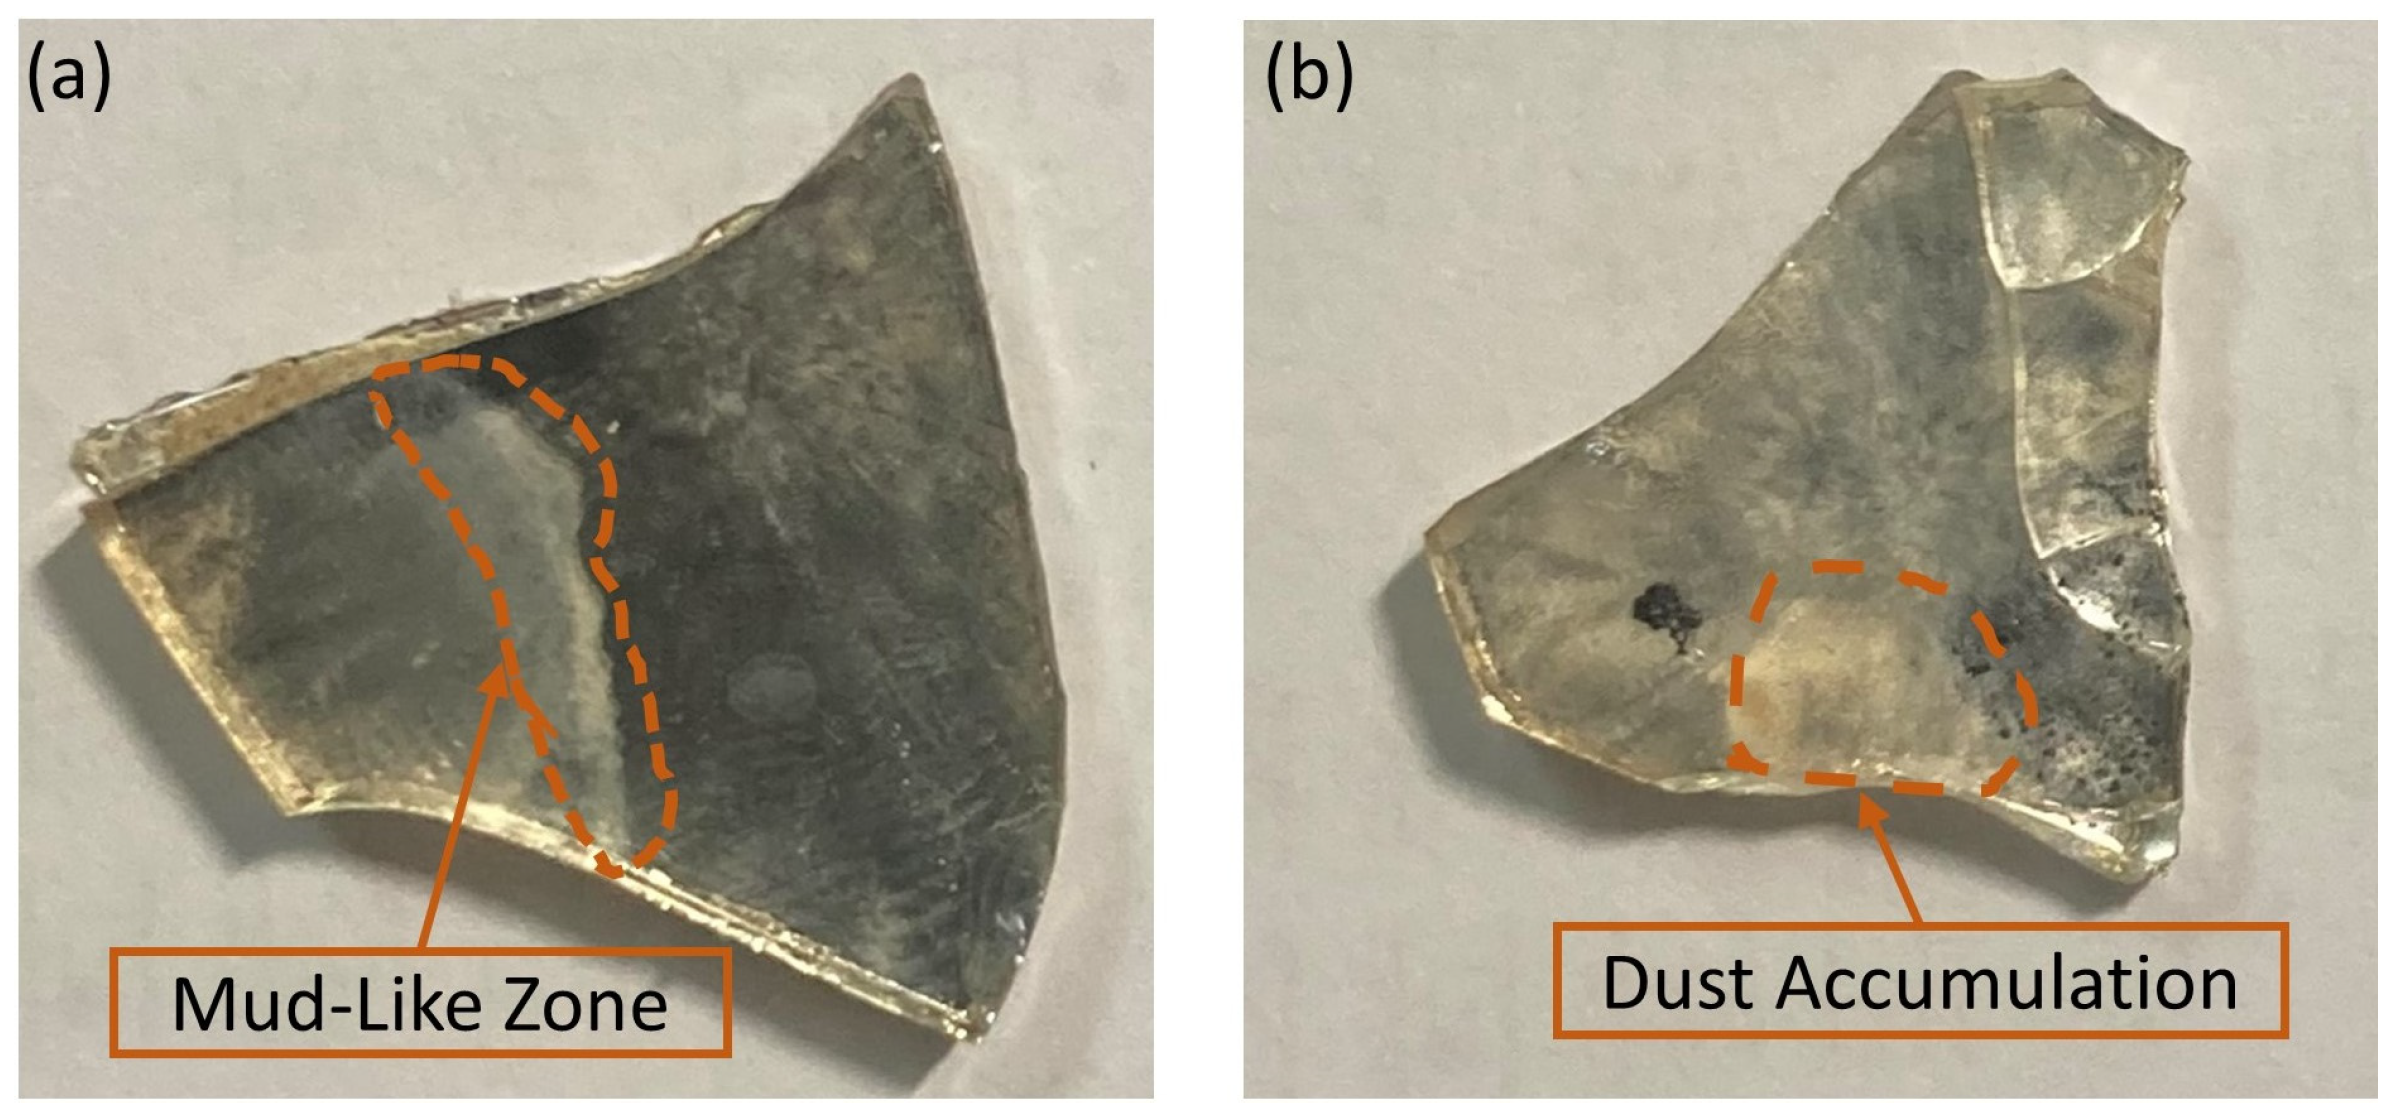
Figure 2 shows the macroscopic morphology of the samples after 1 or 2 months of use. It can be seen that with the increase in the usage time, the severity of dust accumulation on the reflector surface of the CSP station increased and the transmittance decreased. The dust accumulation in different areas showed different and uneven macroscopic distributions, including the mud-like zone left after rain or after cleaning and the severe area of dust accumulation that completely covered the surface.
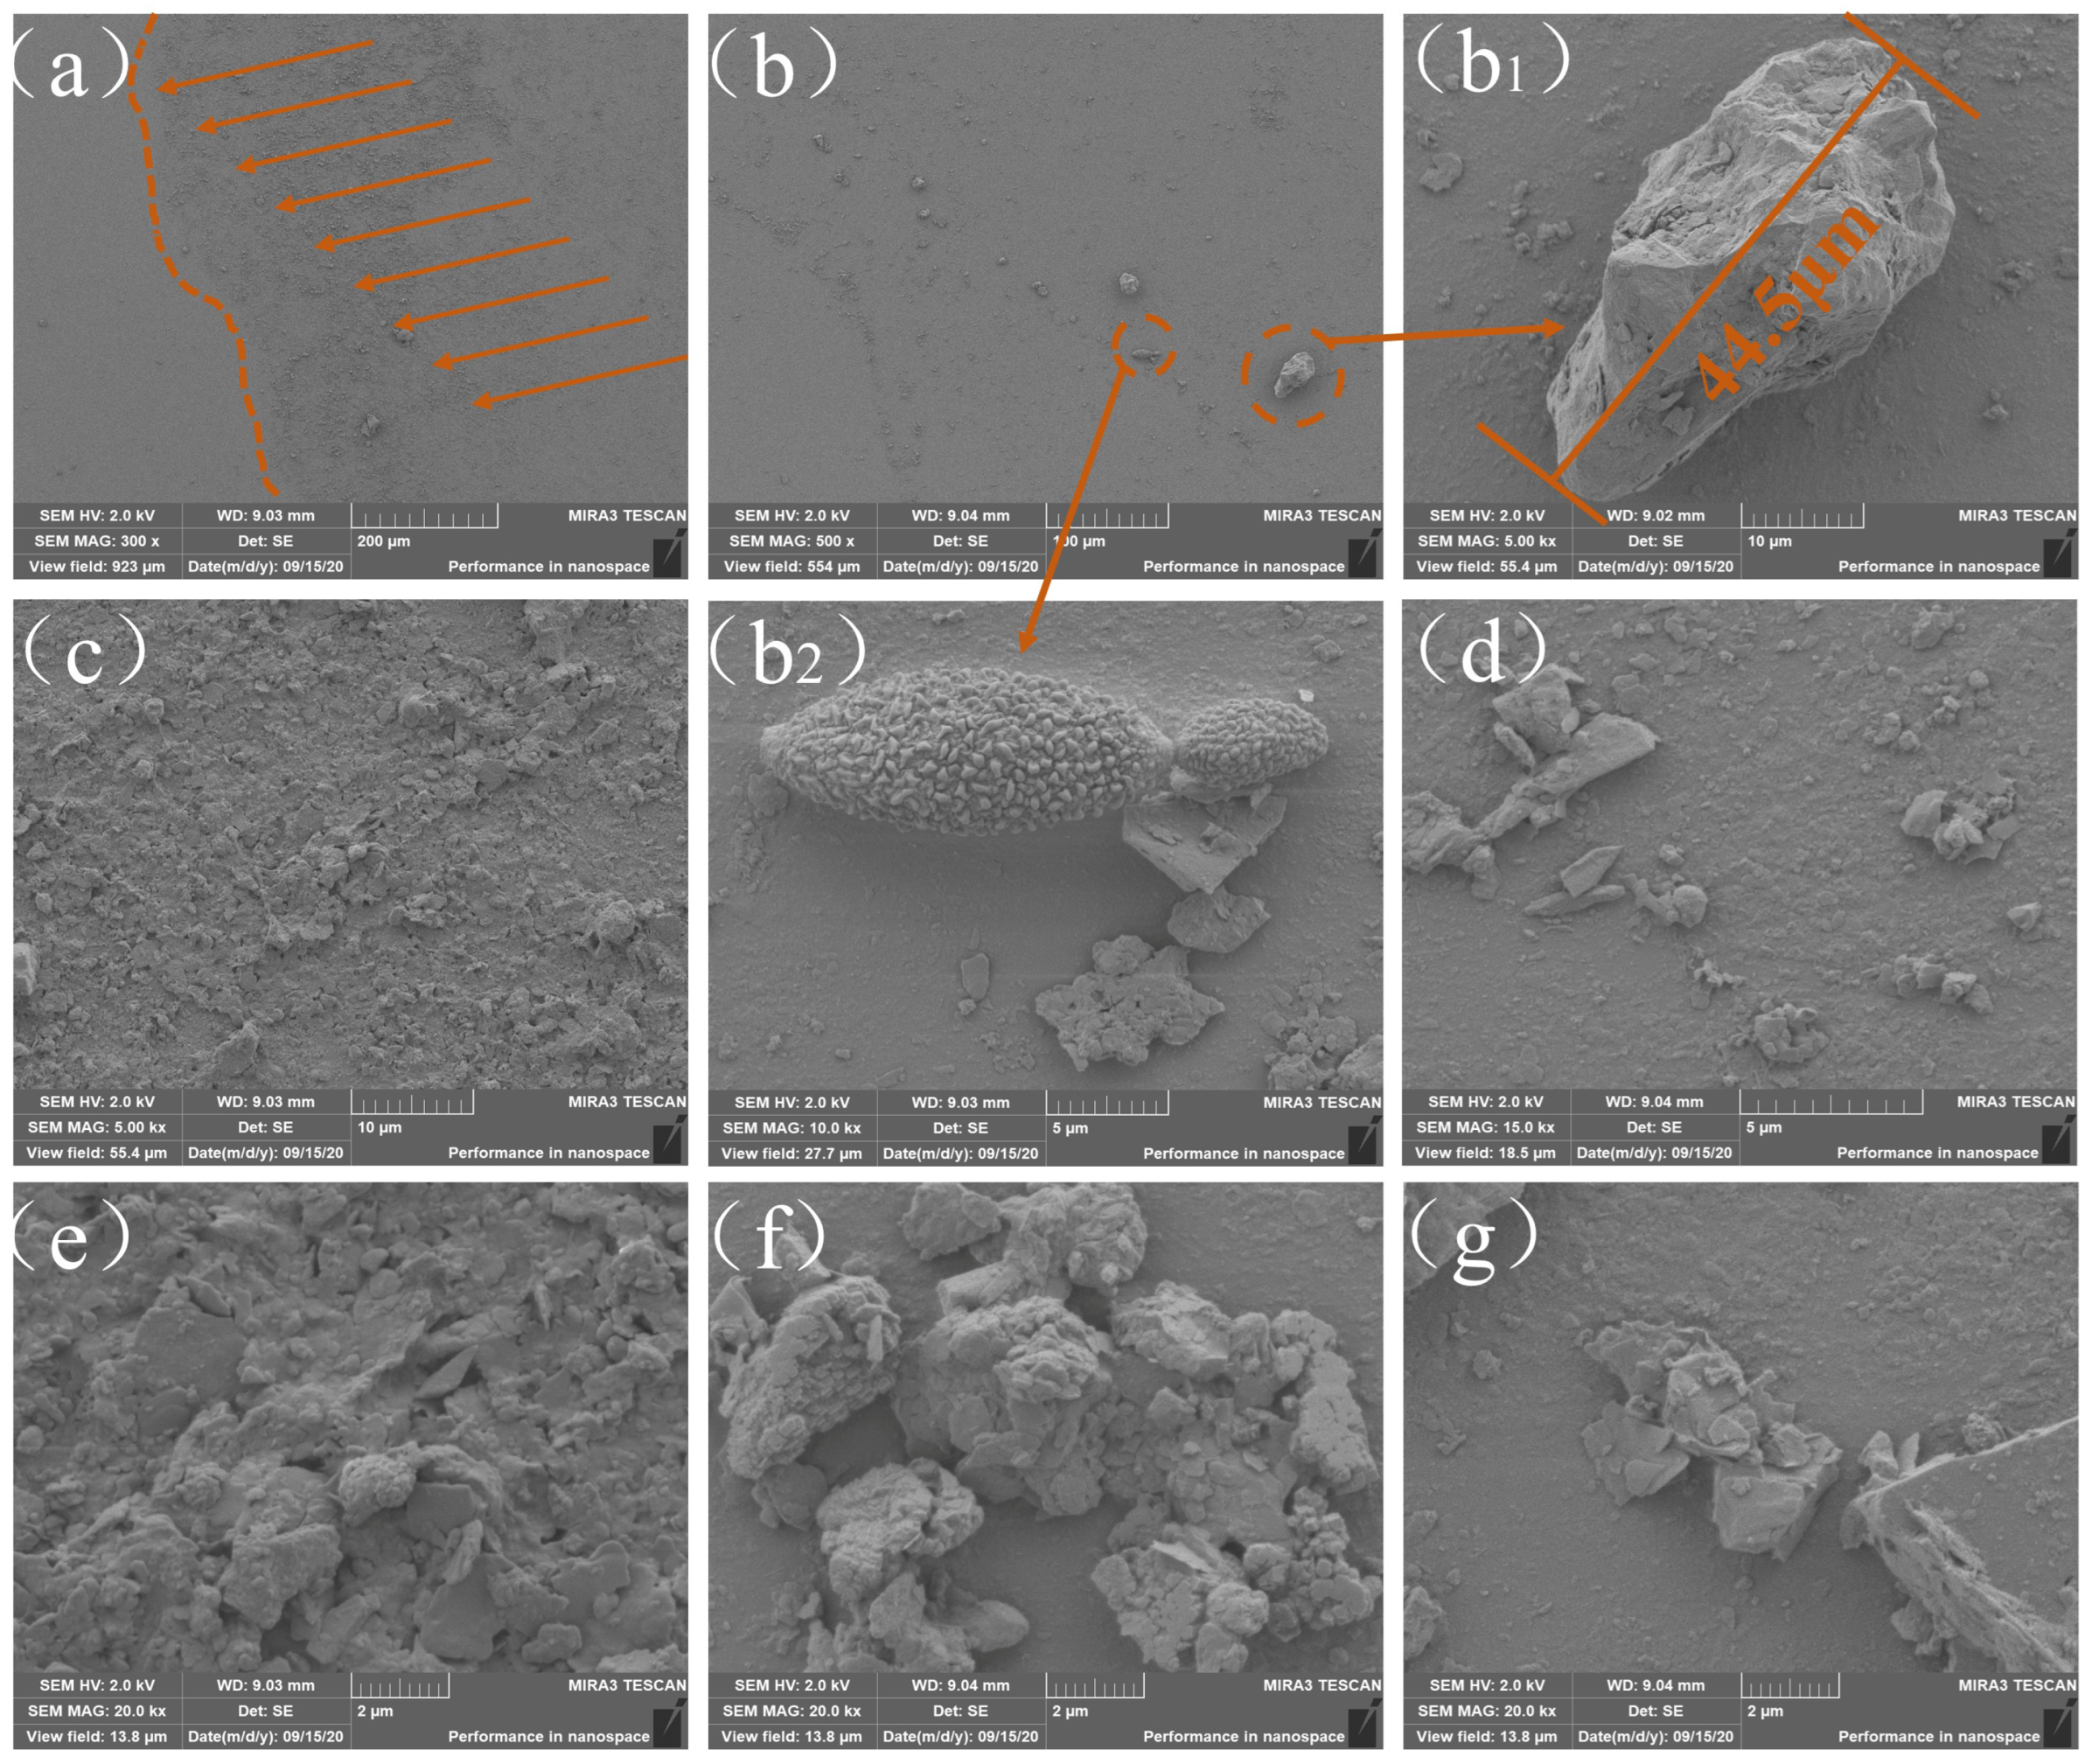
Figure 3 shows the microscopic morphology of the samples after 1 month of use. The particles of accumulated dust in the microscopic state are divided into two areas (Figure 3a). The left side of the separation line is dominated by a scattered deposition of partial large particles, similar to that shown in Figure 3f, while the right side is dominated by an overlapping accumulation of multi-size particles, similar to that shown in Figure 3c,e. The direction of mud-belt accumulation (see Figure 3a) was judged by a comparison with the mud-like zone area. In the non-mud-like zone area shown in Figure 3b,d,g, large scattered particles were observed. The diameters of the larger particles in the whole observation area were up to approximately 50 μm, which indicated that the main effect of the adsorption force on the particles was Van der Waals force [15].
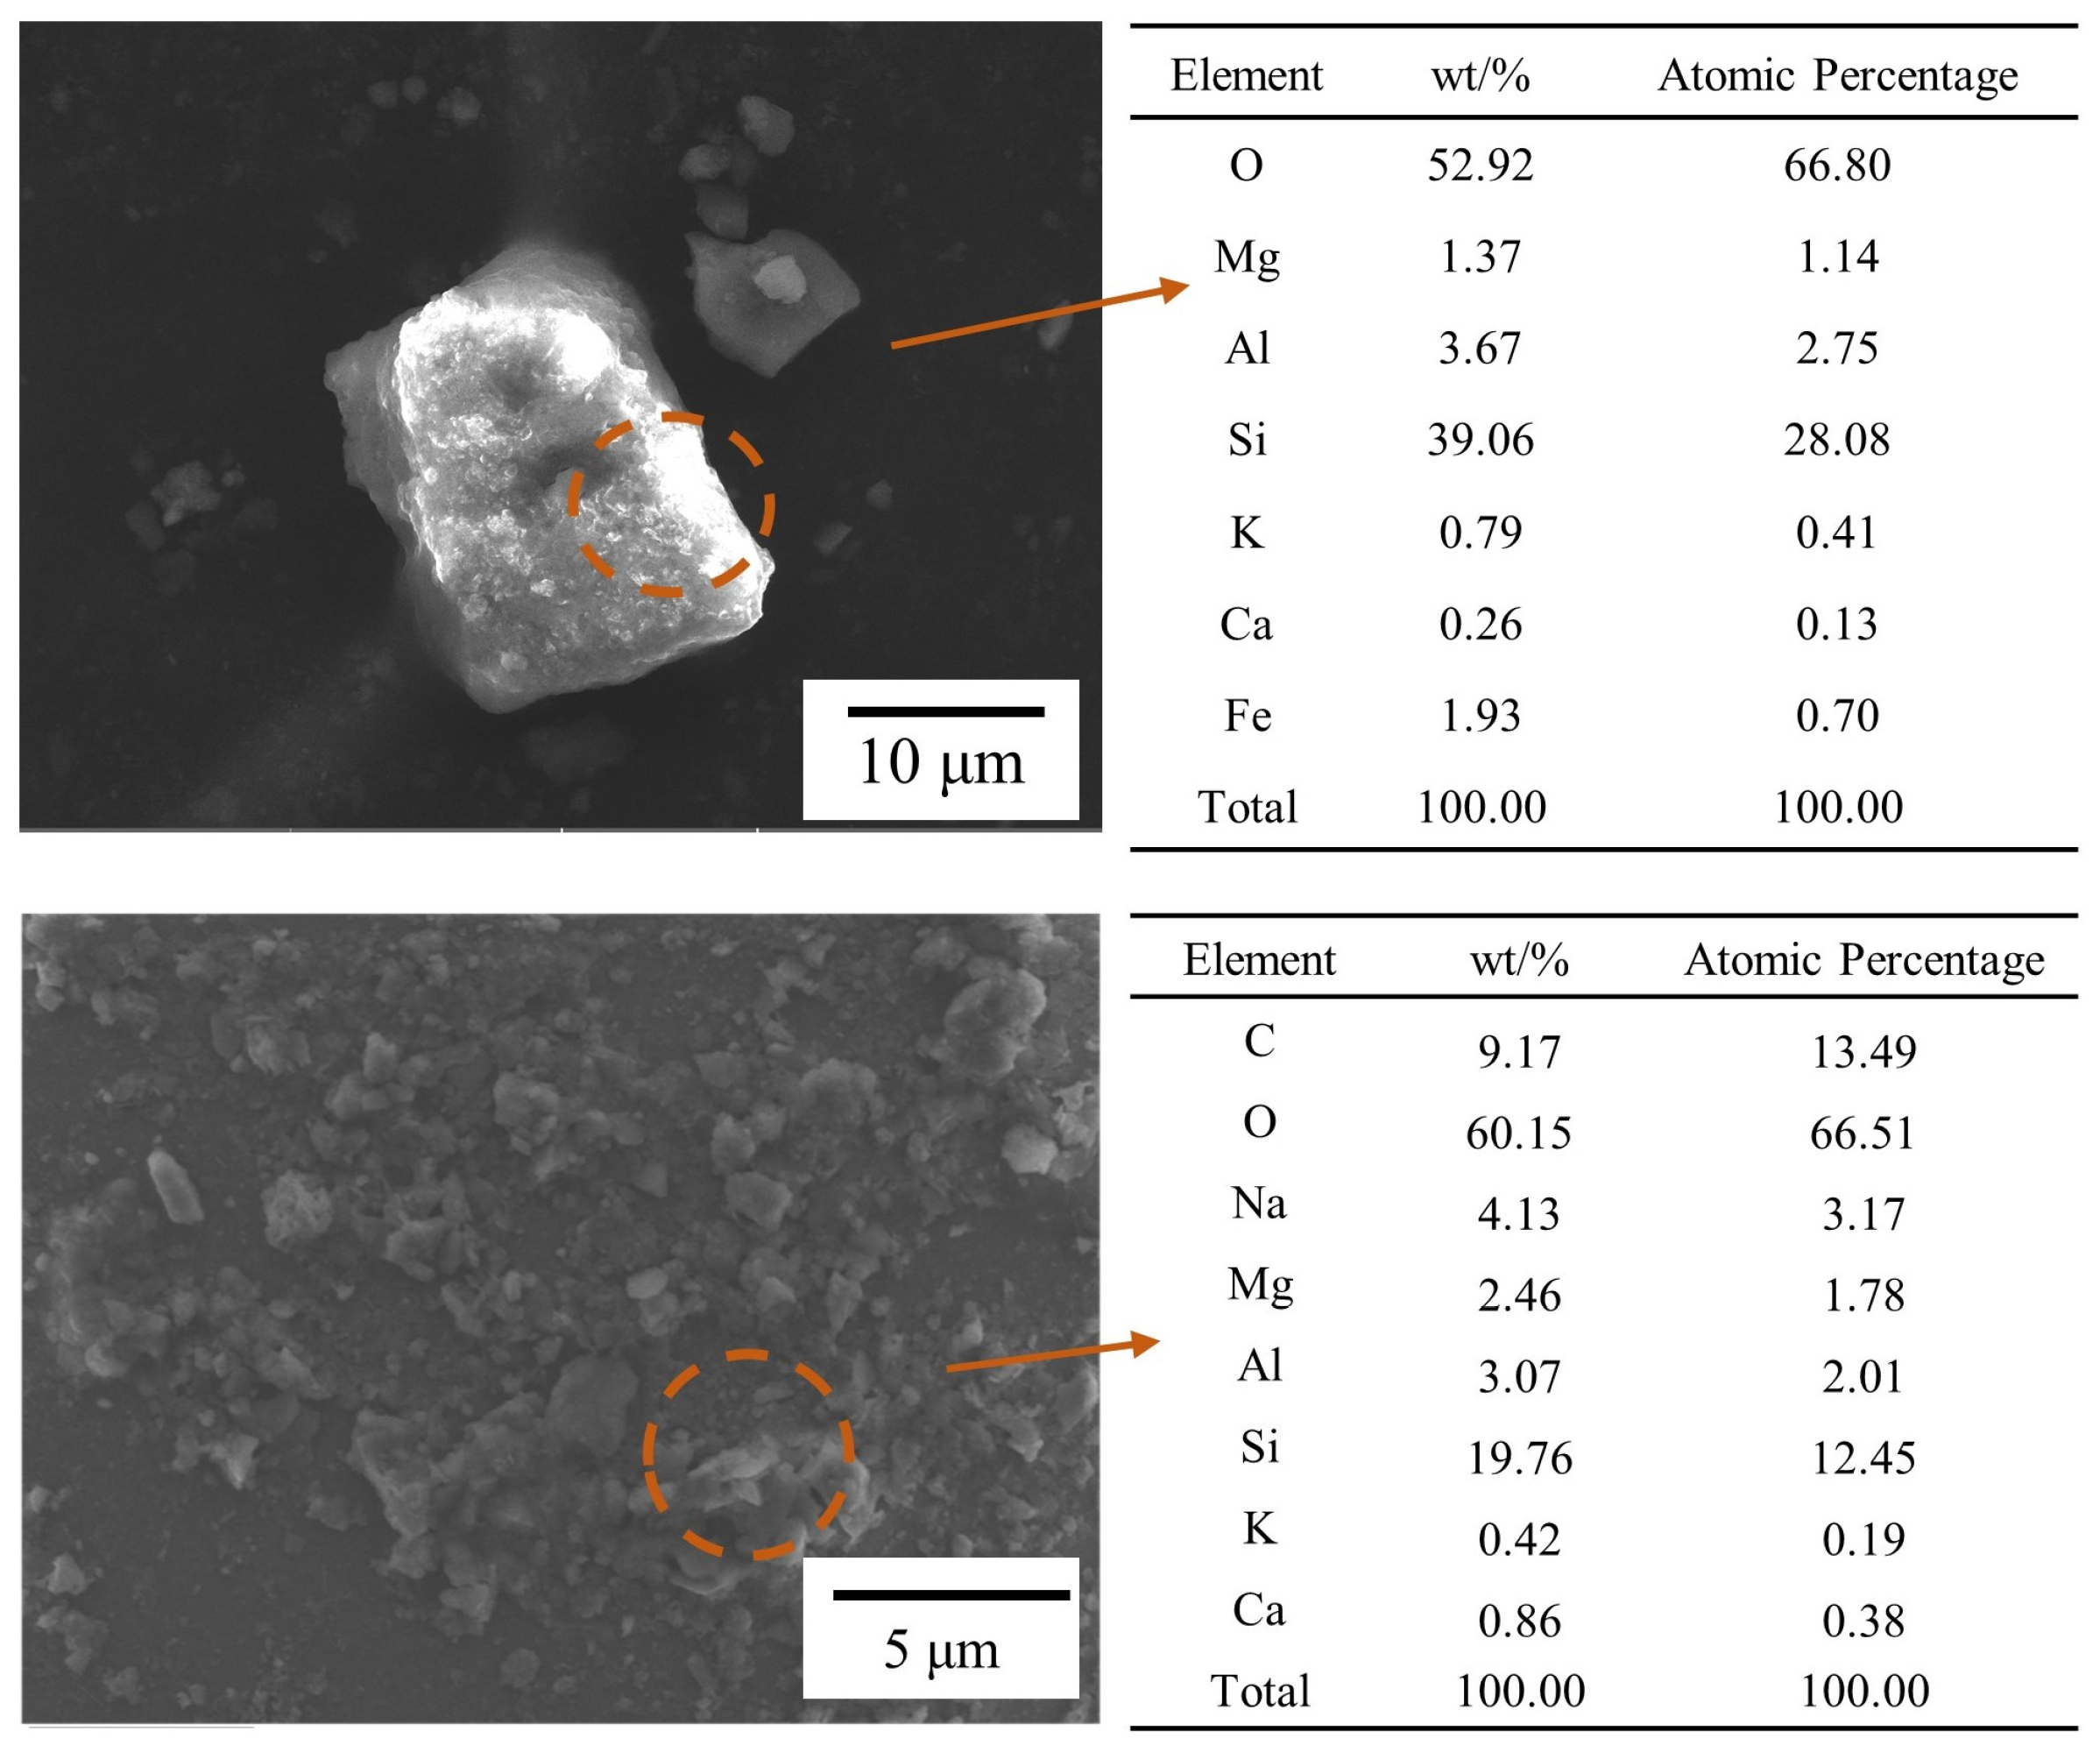
Considering the influence of the original composition of the photothermal component glass sample on the contaminant composition, the surface contaminant particles were transferred to a conductive adhesive before the composition analysis. The composition of the contaminants on the surface of the sample after 1 month of use is shown in Figure 4. Based on the types of elements contained in the samples and their corresponding contents, the main detected elements consisted of the crustal elements oxygen, silicon, carbon, aluminum, iron, calcium, sodium, potassium, and magnesium.
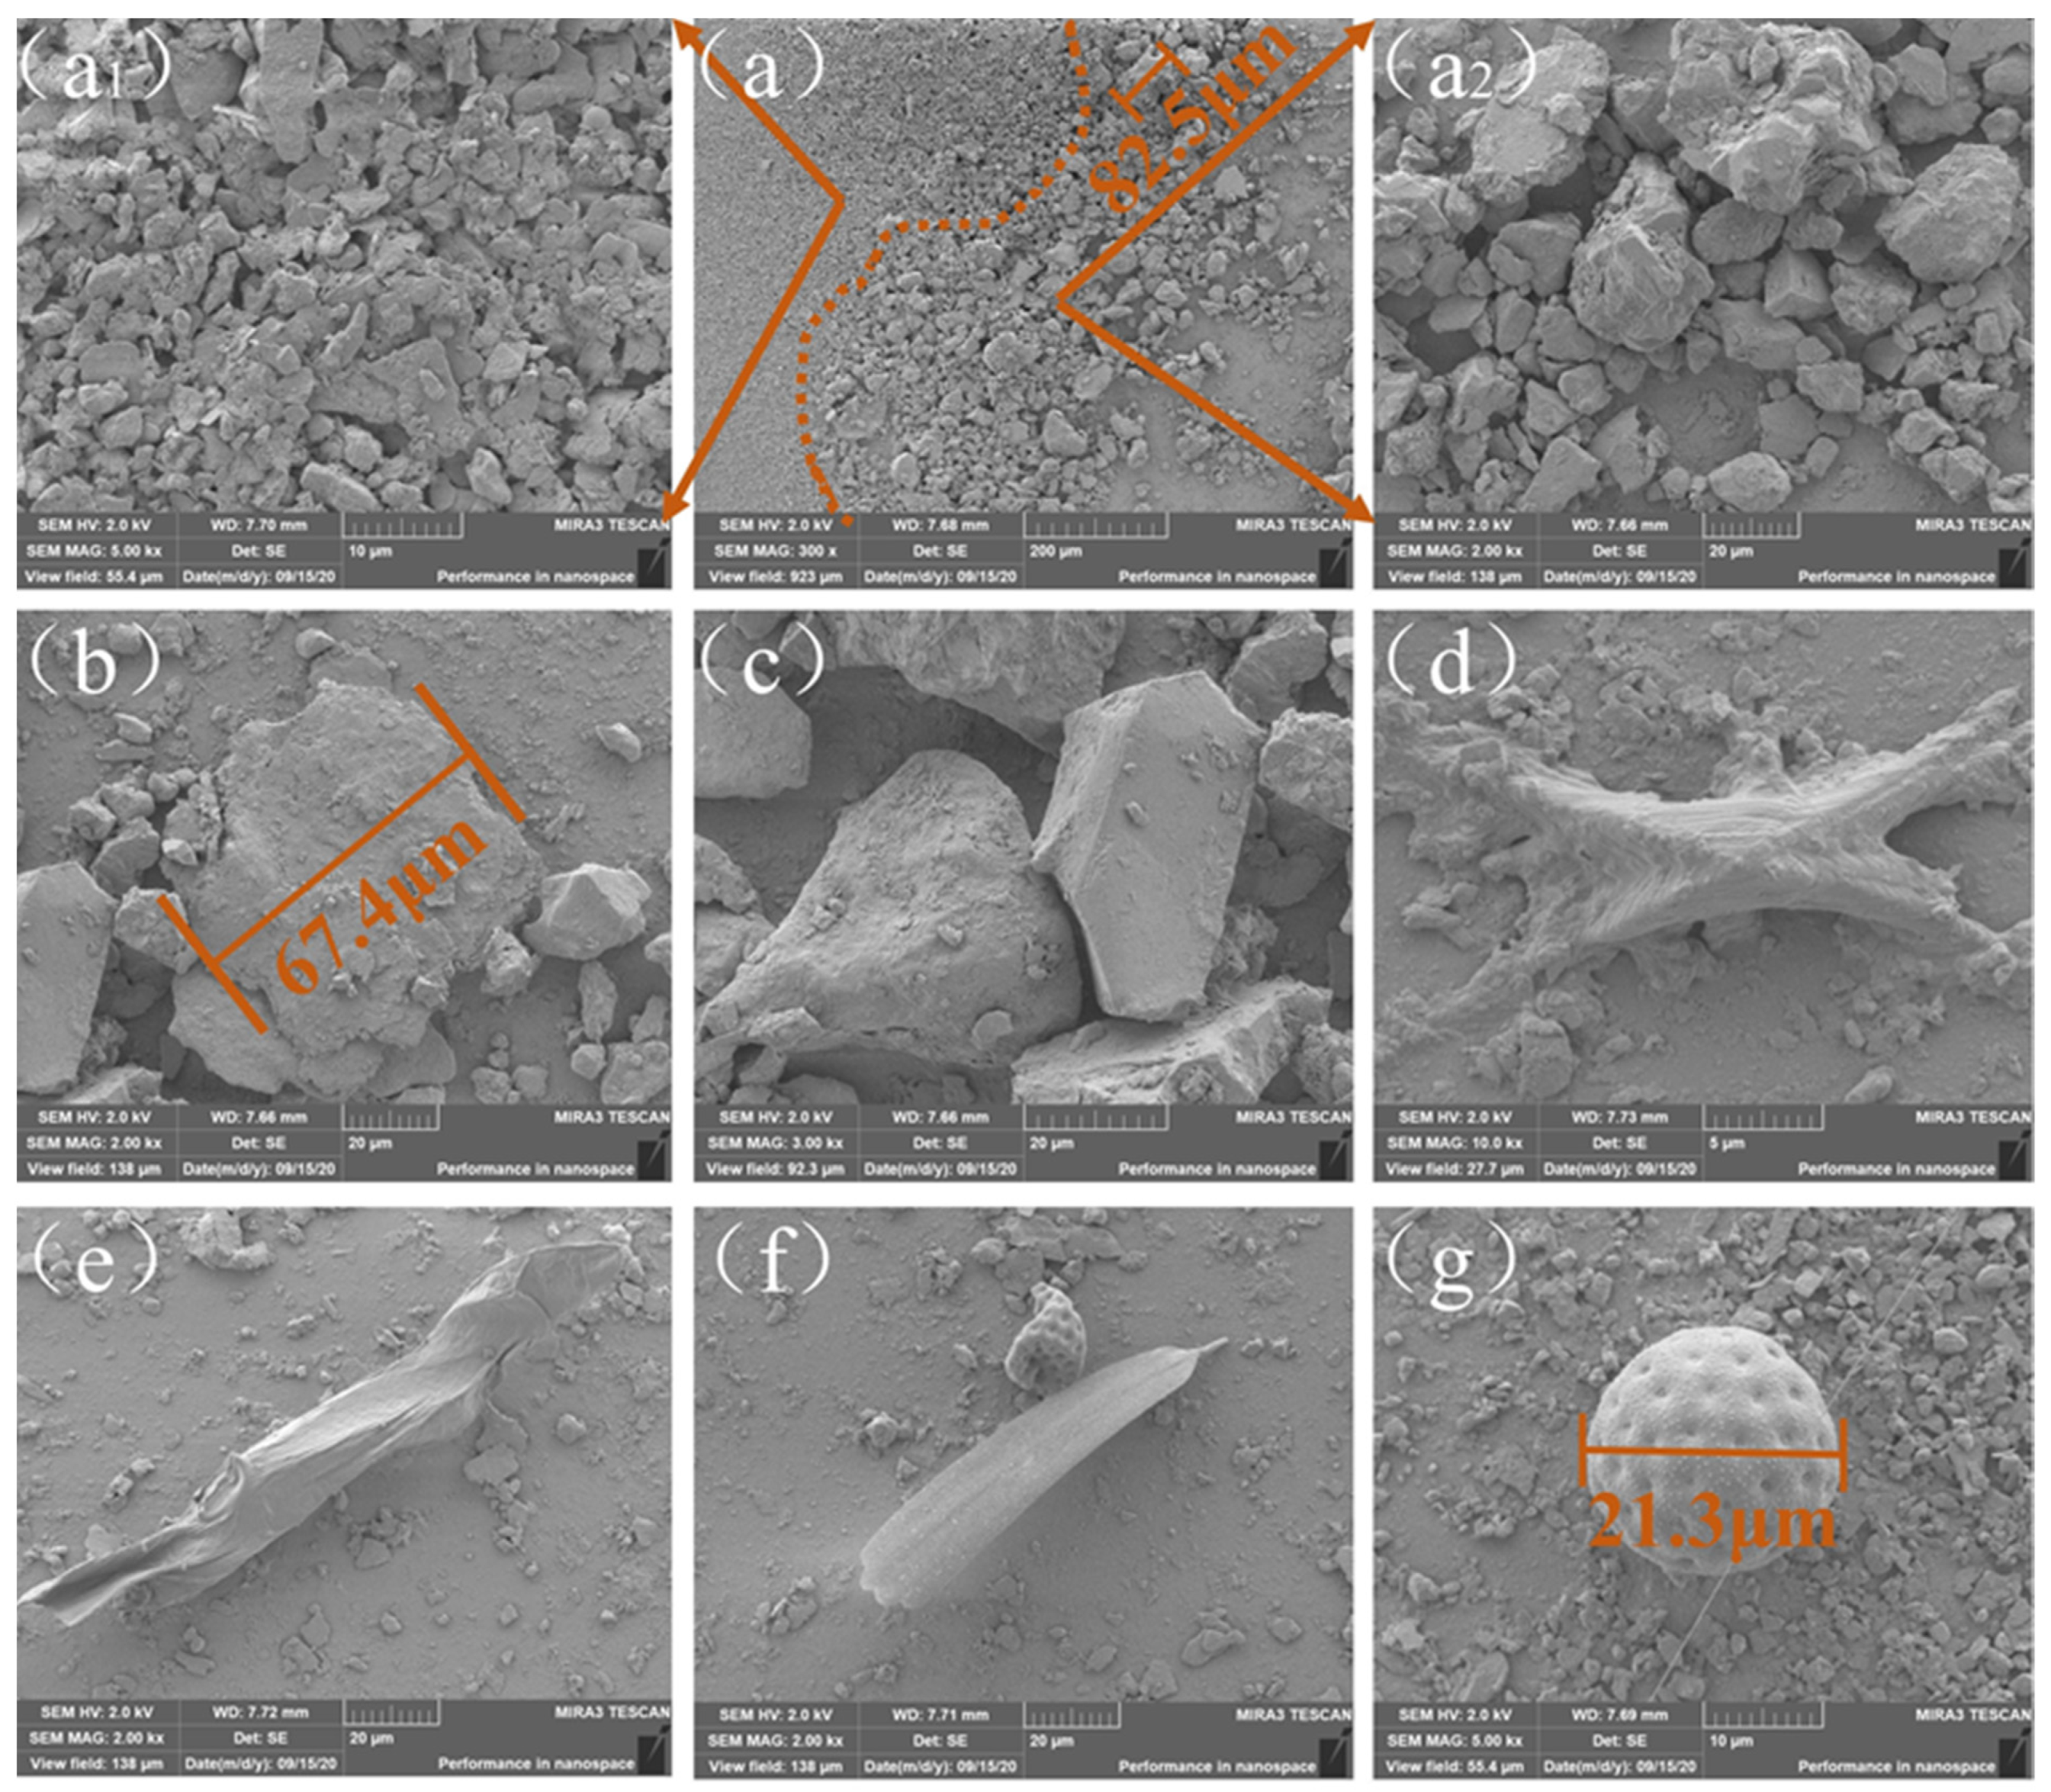
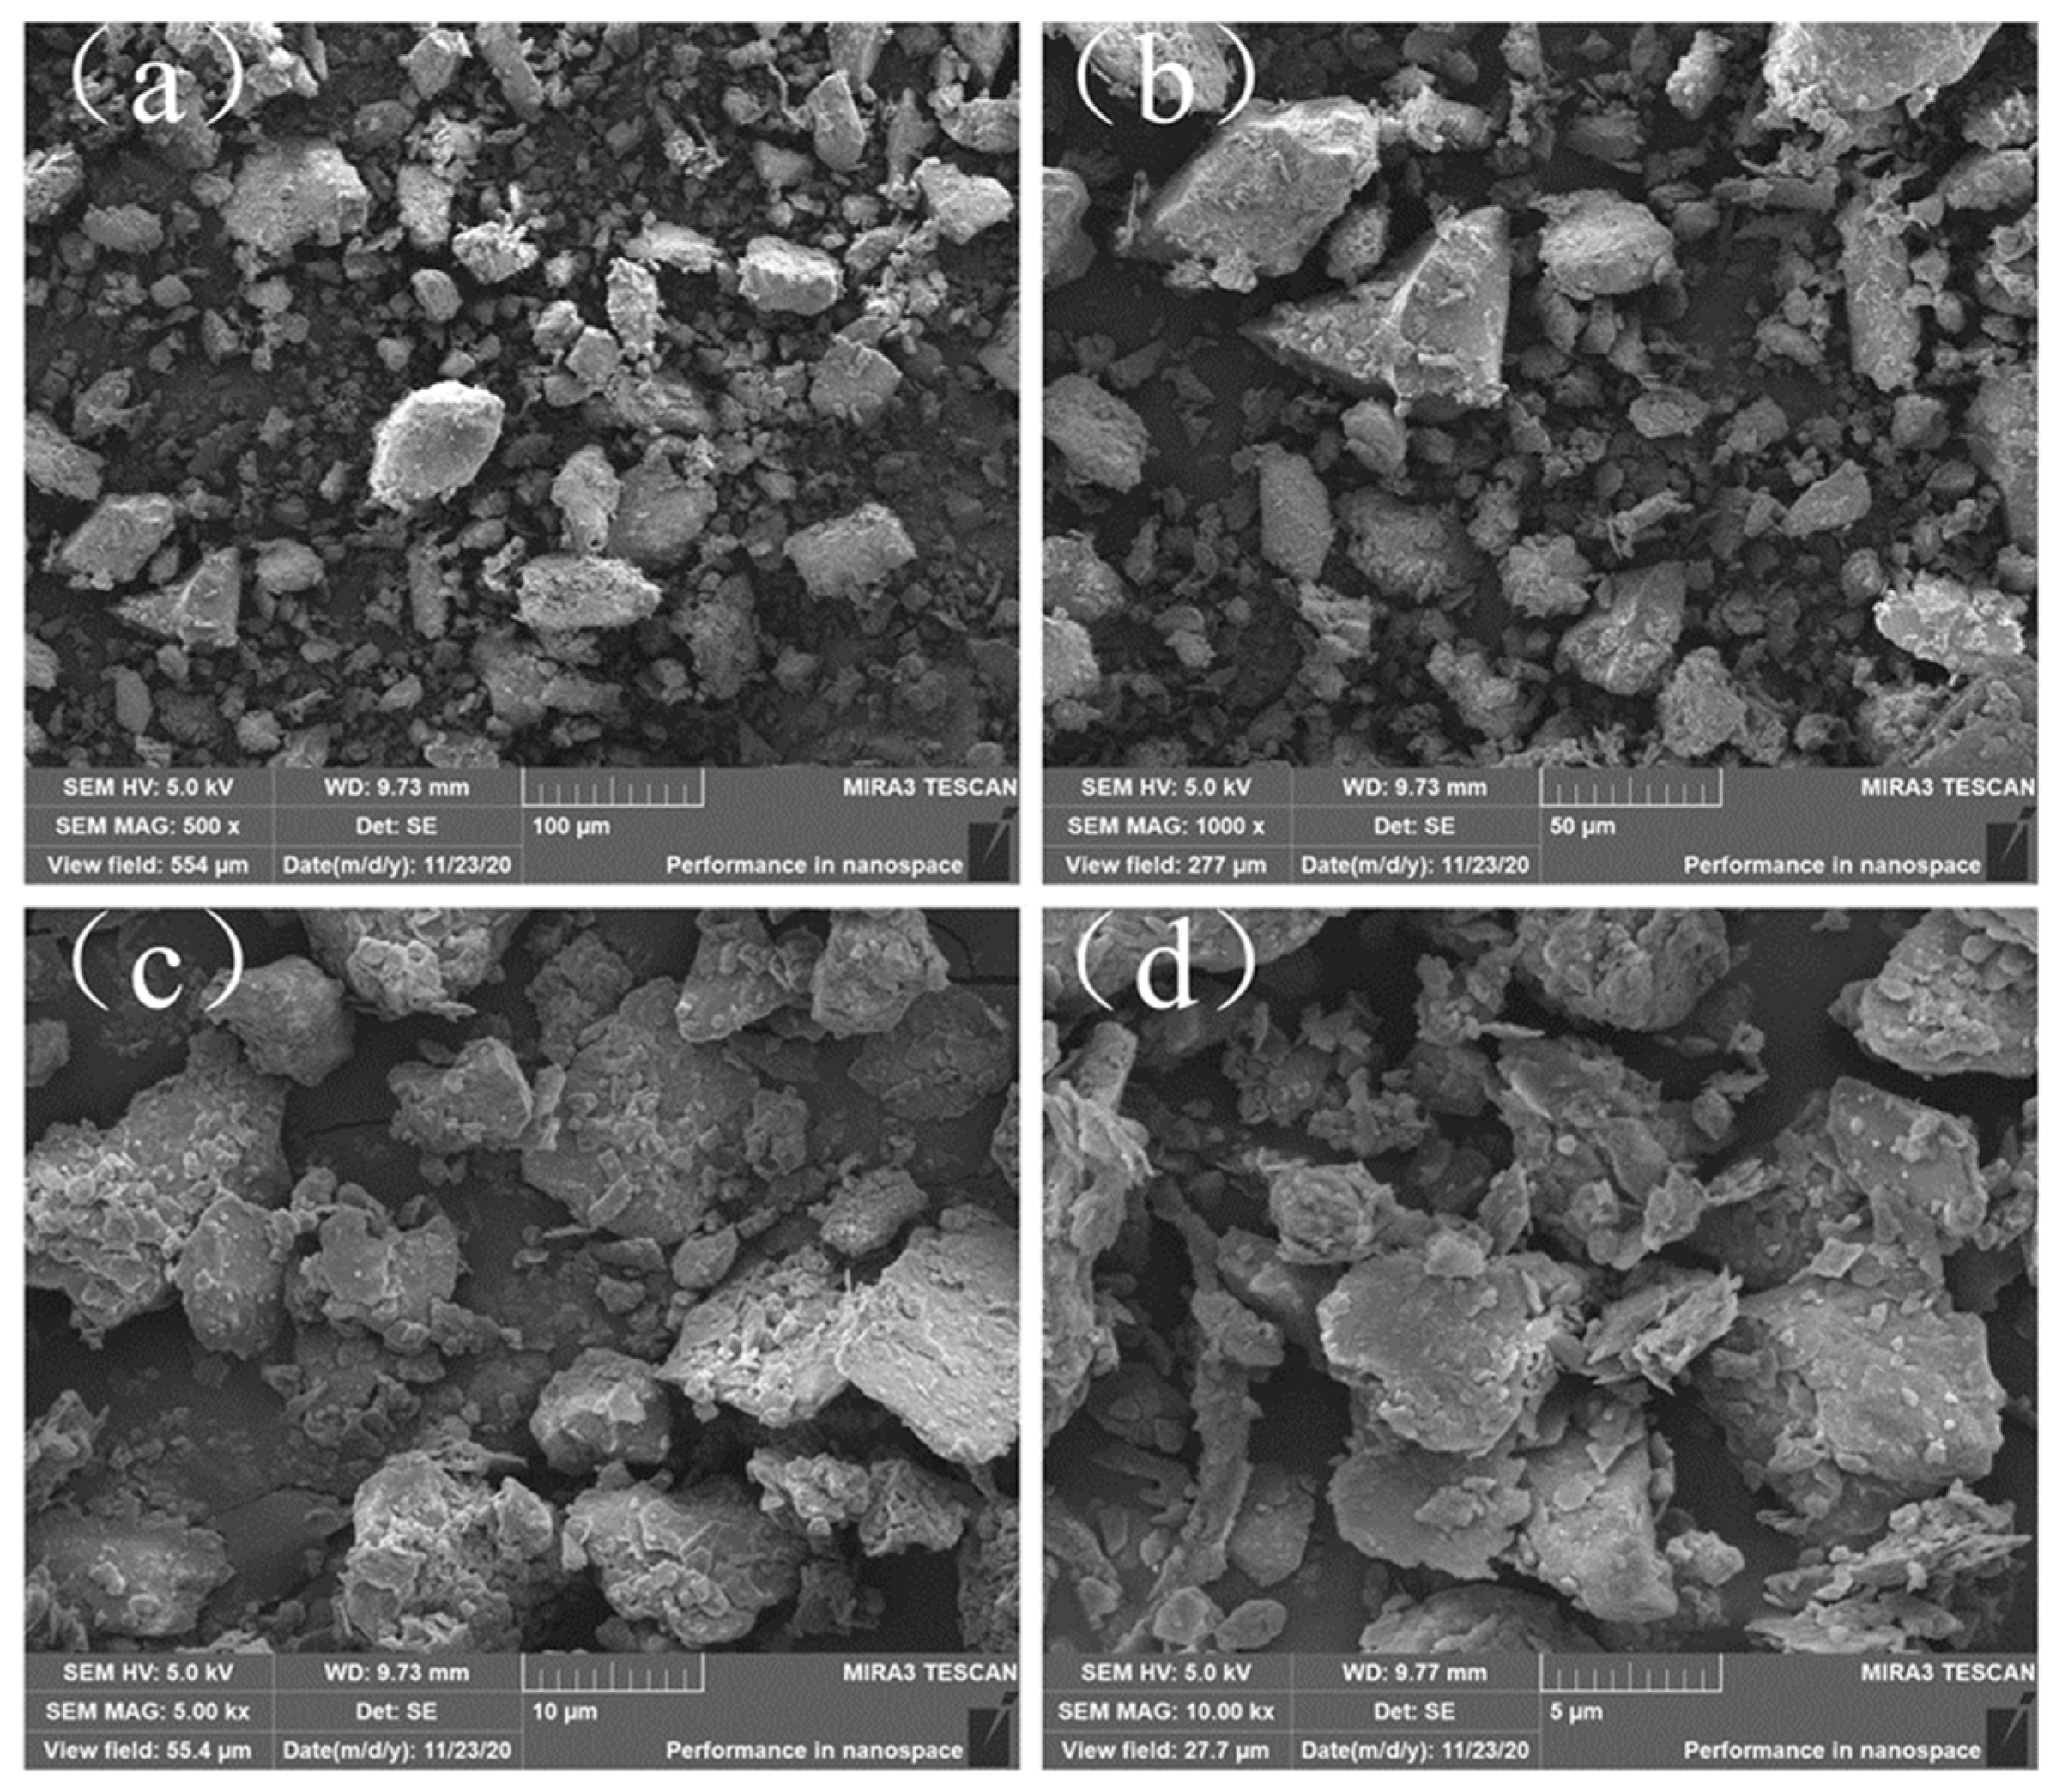
Figure 5 shows the surface morphology of the samples after 2 months of use. It can be seen that the particle sizes of the pollutants were generally less than 85 μm, and their morphologies were mostly amorphous, with a few nearly spherical particles (Figure 5a–d). At the same time, traces of biomass were found (see Figure 5e–g). In addition, fine particle dust agglomeration was very clear in some specific areas (see Figure 5f).
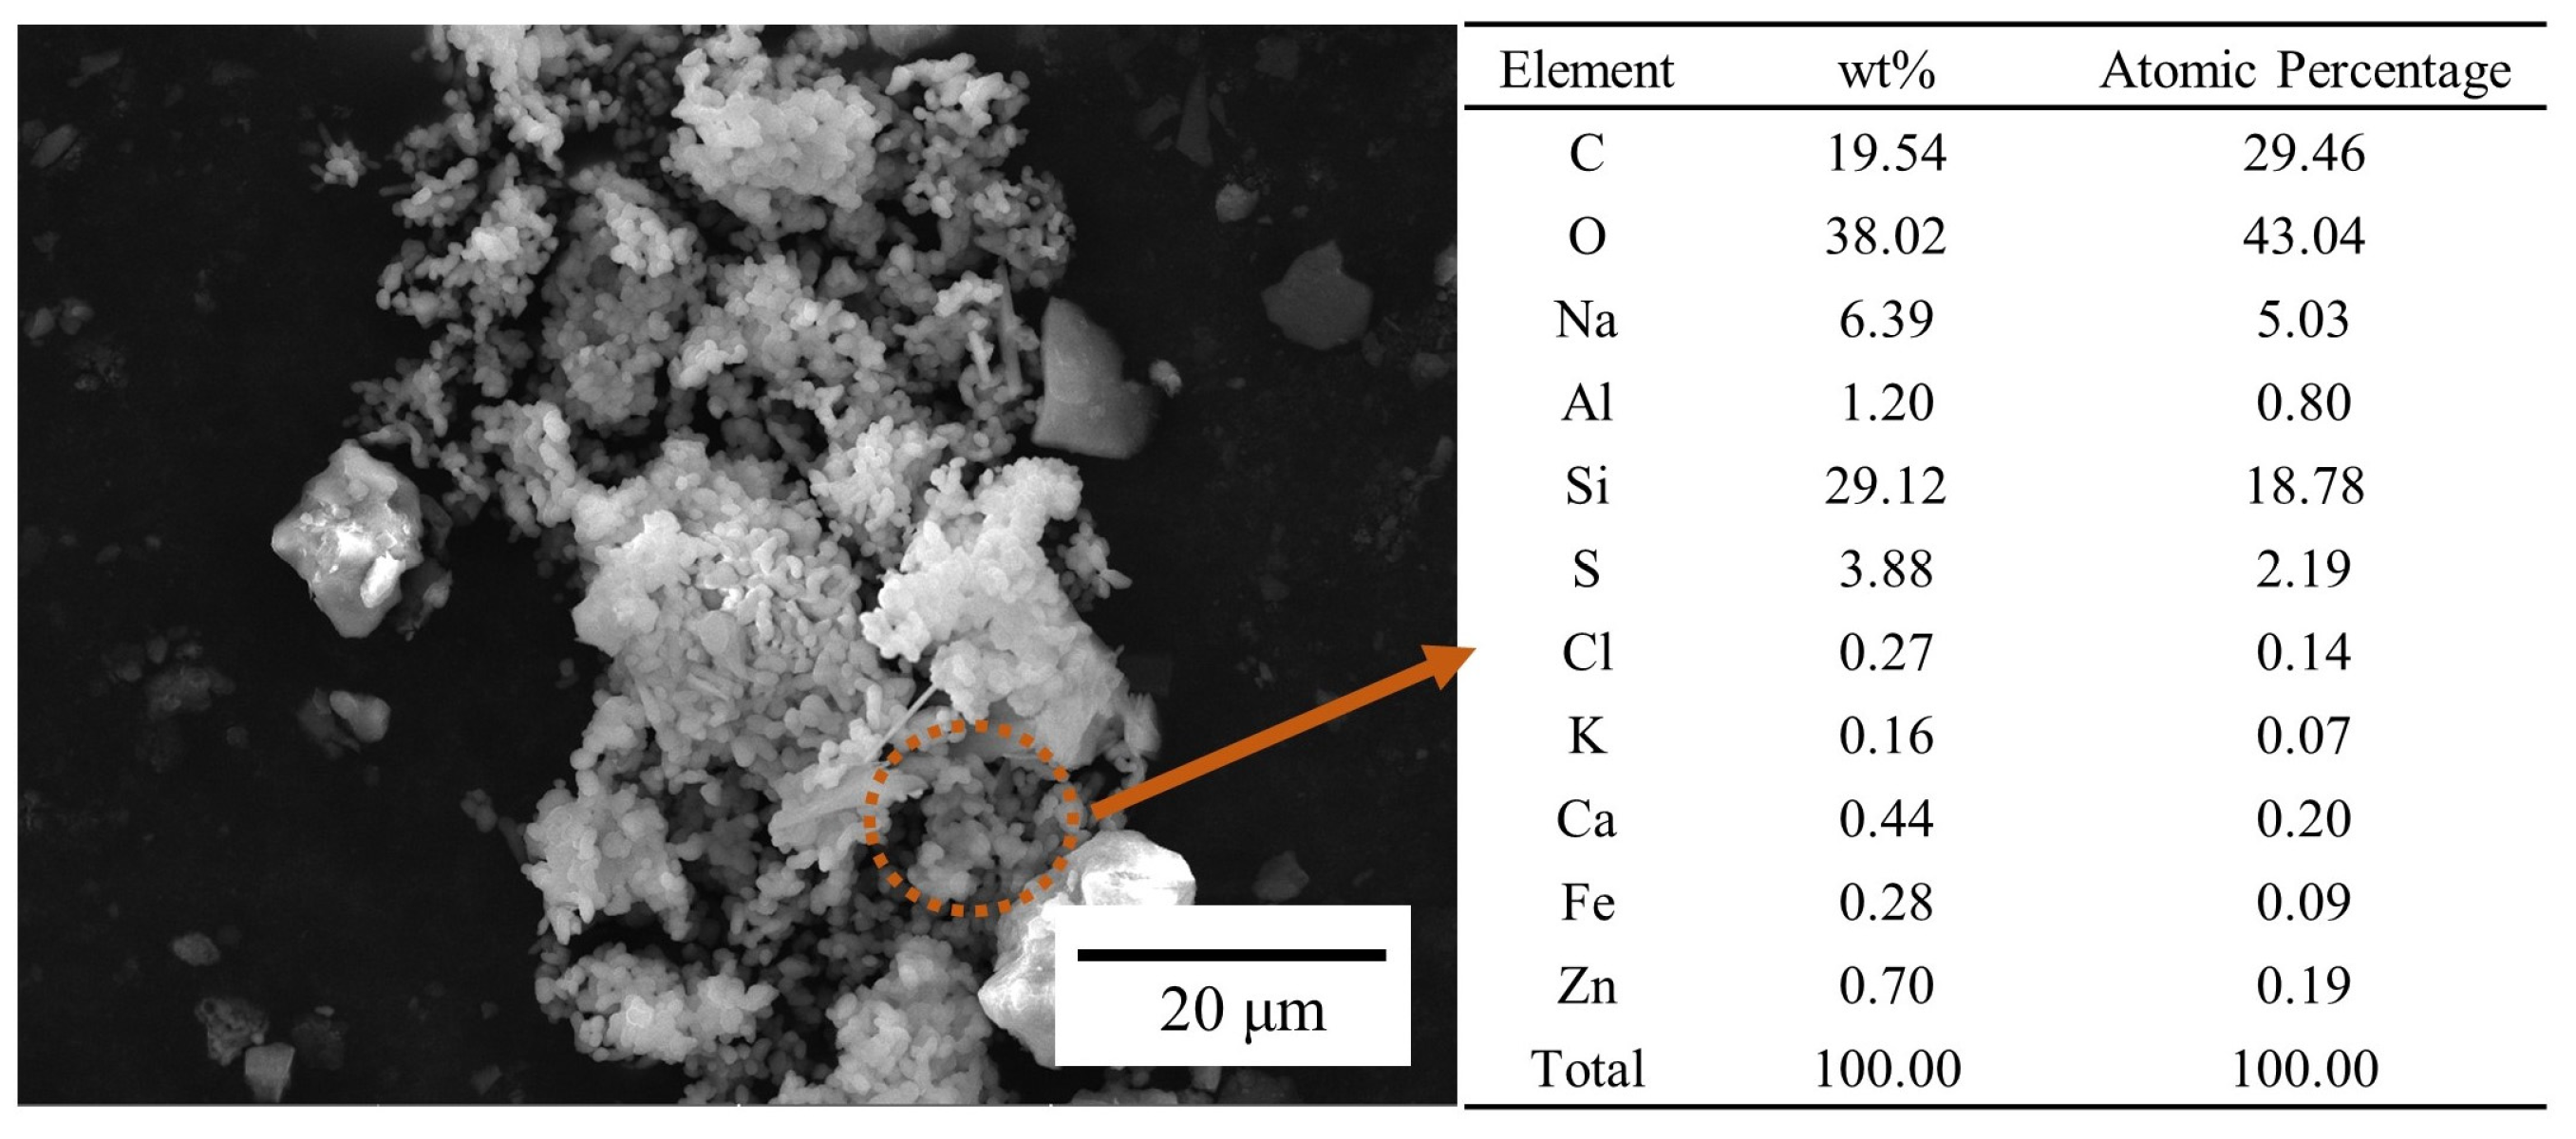
The surface pollutant compositions of the samples after 2 months of use were similar to those after 1 month of use (see Figure 6). The samples were mainly composed of carbon, oxygen, and silicon. However, they were not exactly the same, with the main difference being that the particulate pollutants contained sulfur and chlorine, which were related to biological activities in the surrounding environmental.
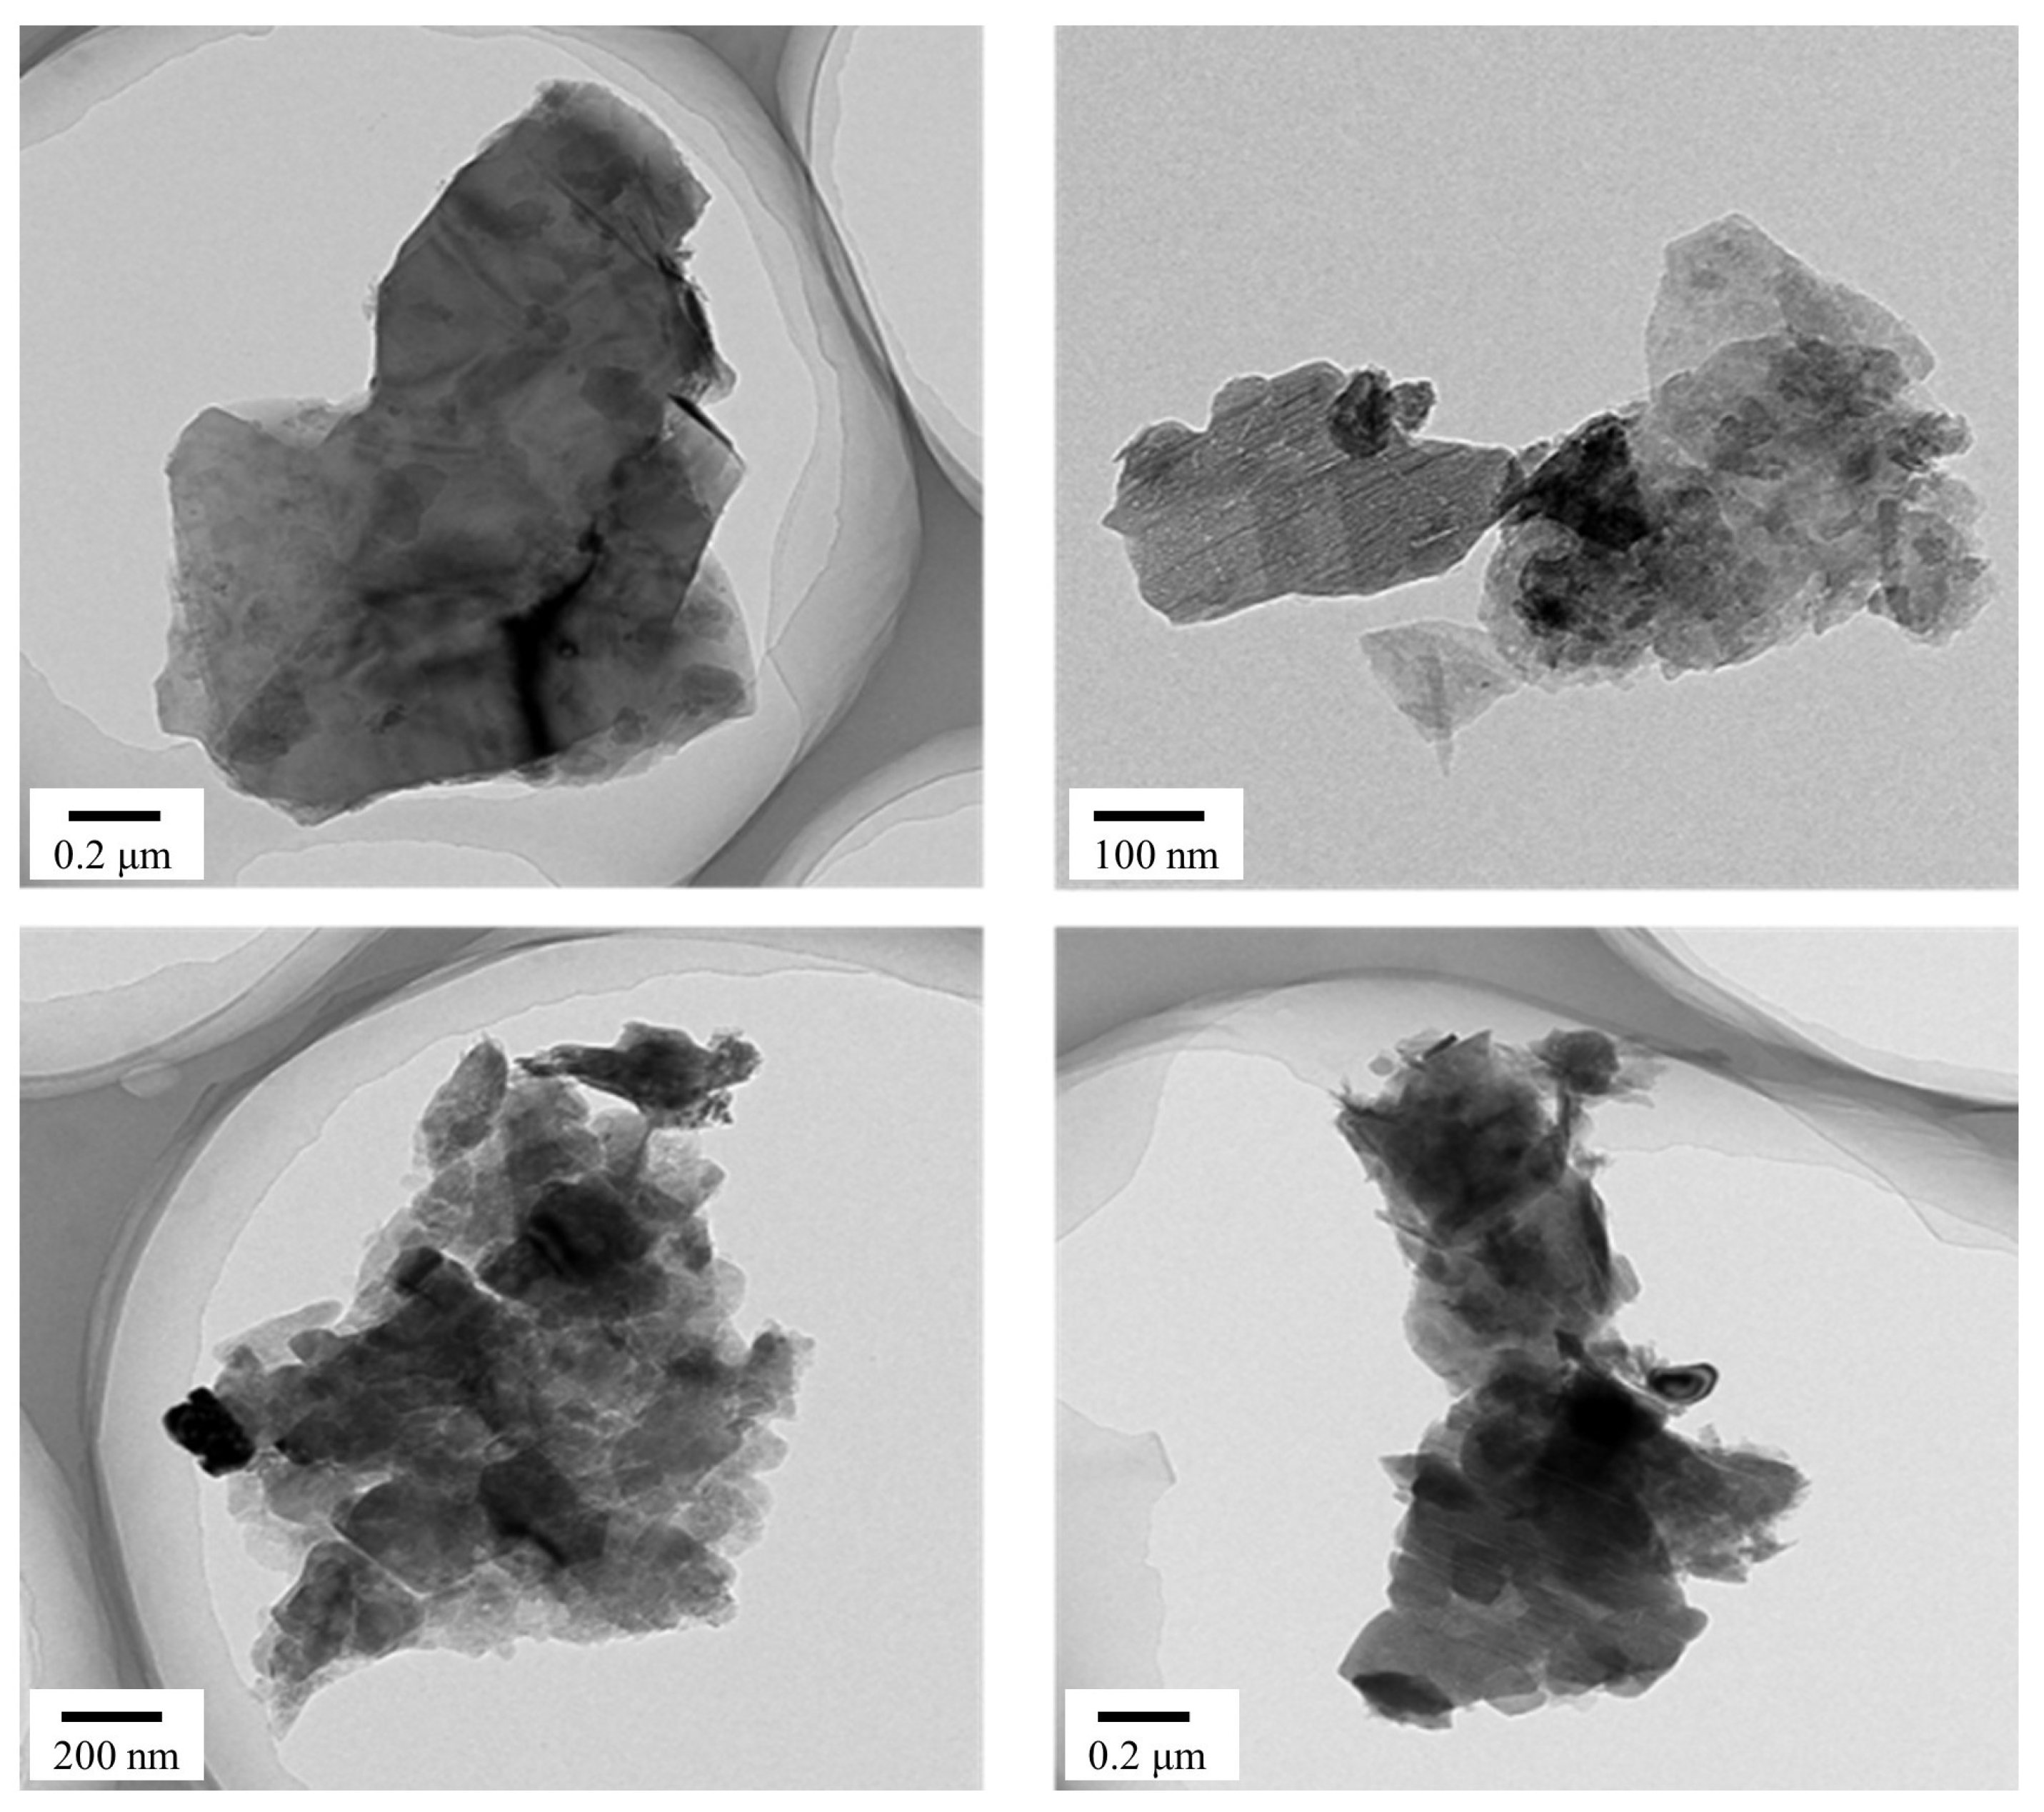
Figure 7 shows a high-resolution transmission electron microscopy (TEM) image of the contaminants on the surfaces of the samples. It can be seen that the dust particles are very fine, ranging from less than 1 μm to a few nanometers on the microscopic scale. The agglomeration status is also shown more clearly. The adhesion between the pollutants in the aggregated state and the reflector became larger over time, which was not conducive to cleaning and thus reduced the photothermal conversion efficiency.

3.2. Size of Pollutant Particles

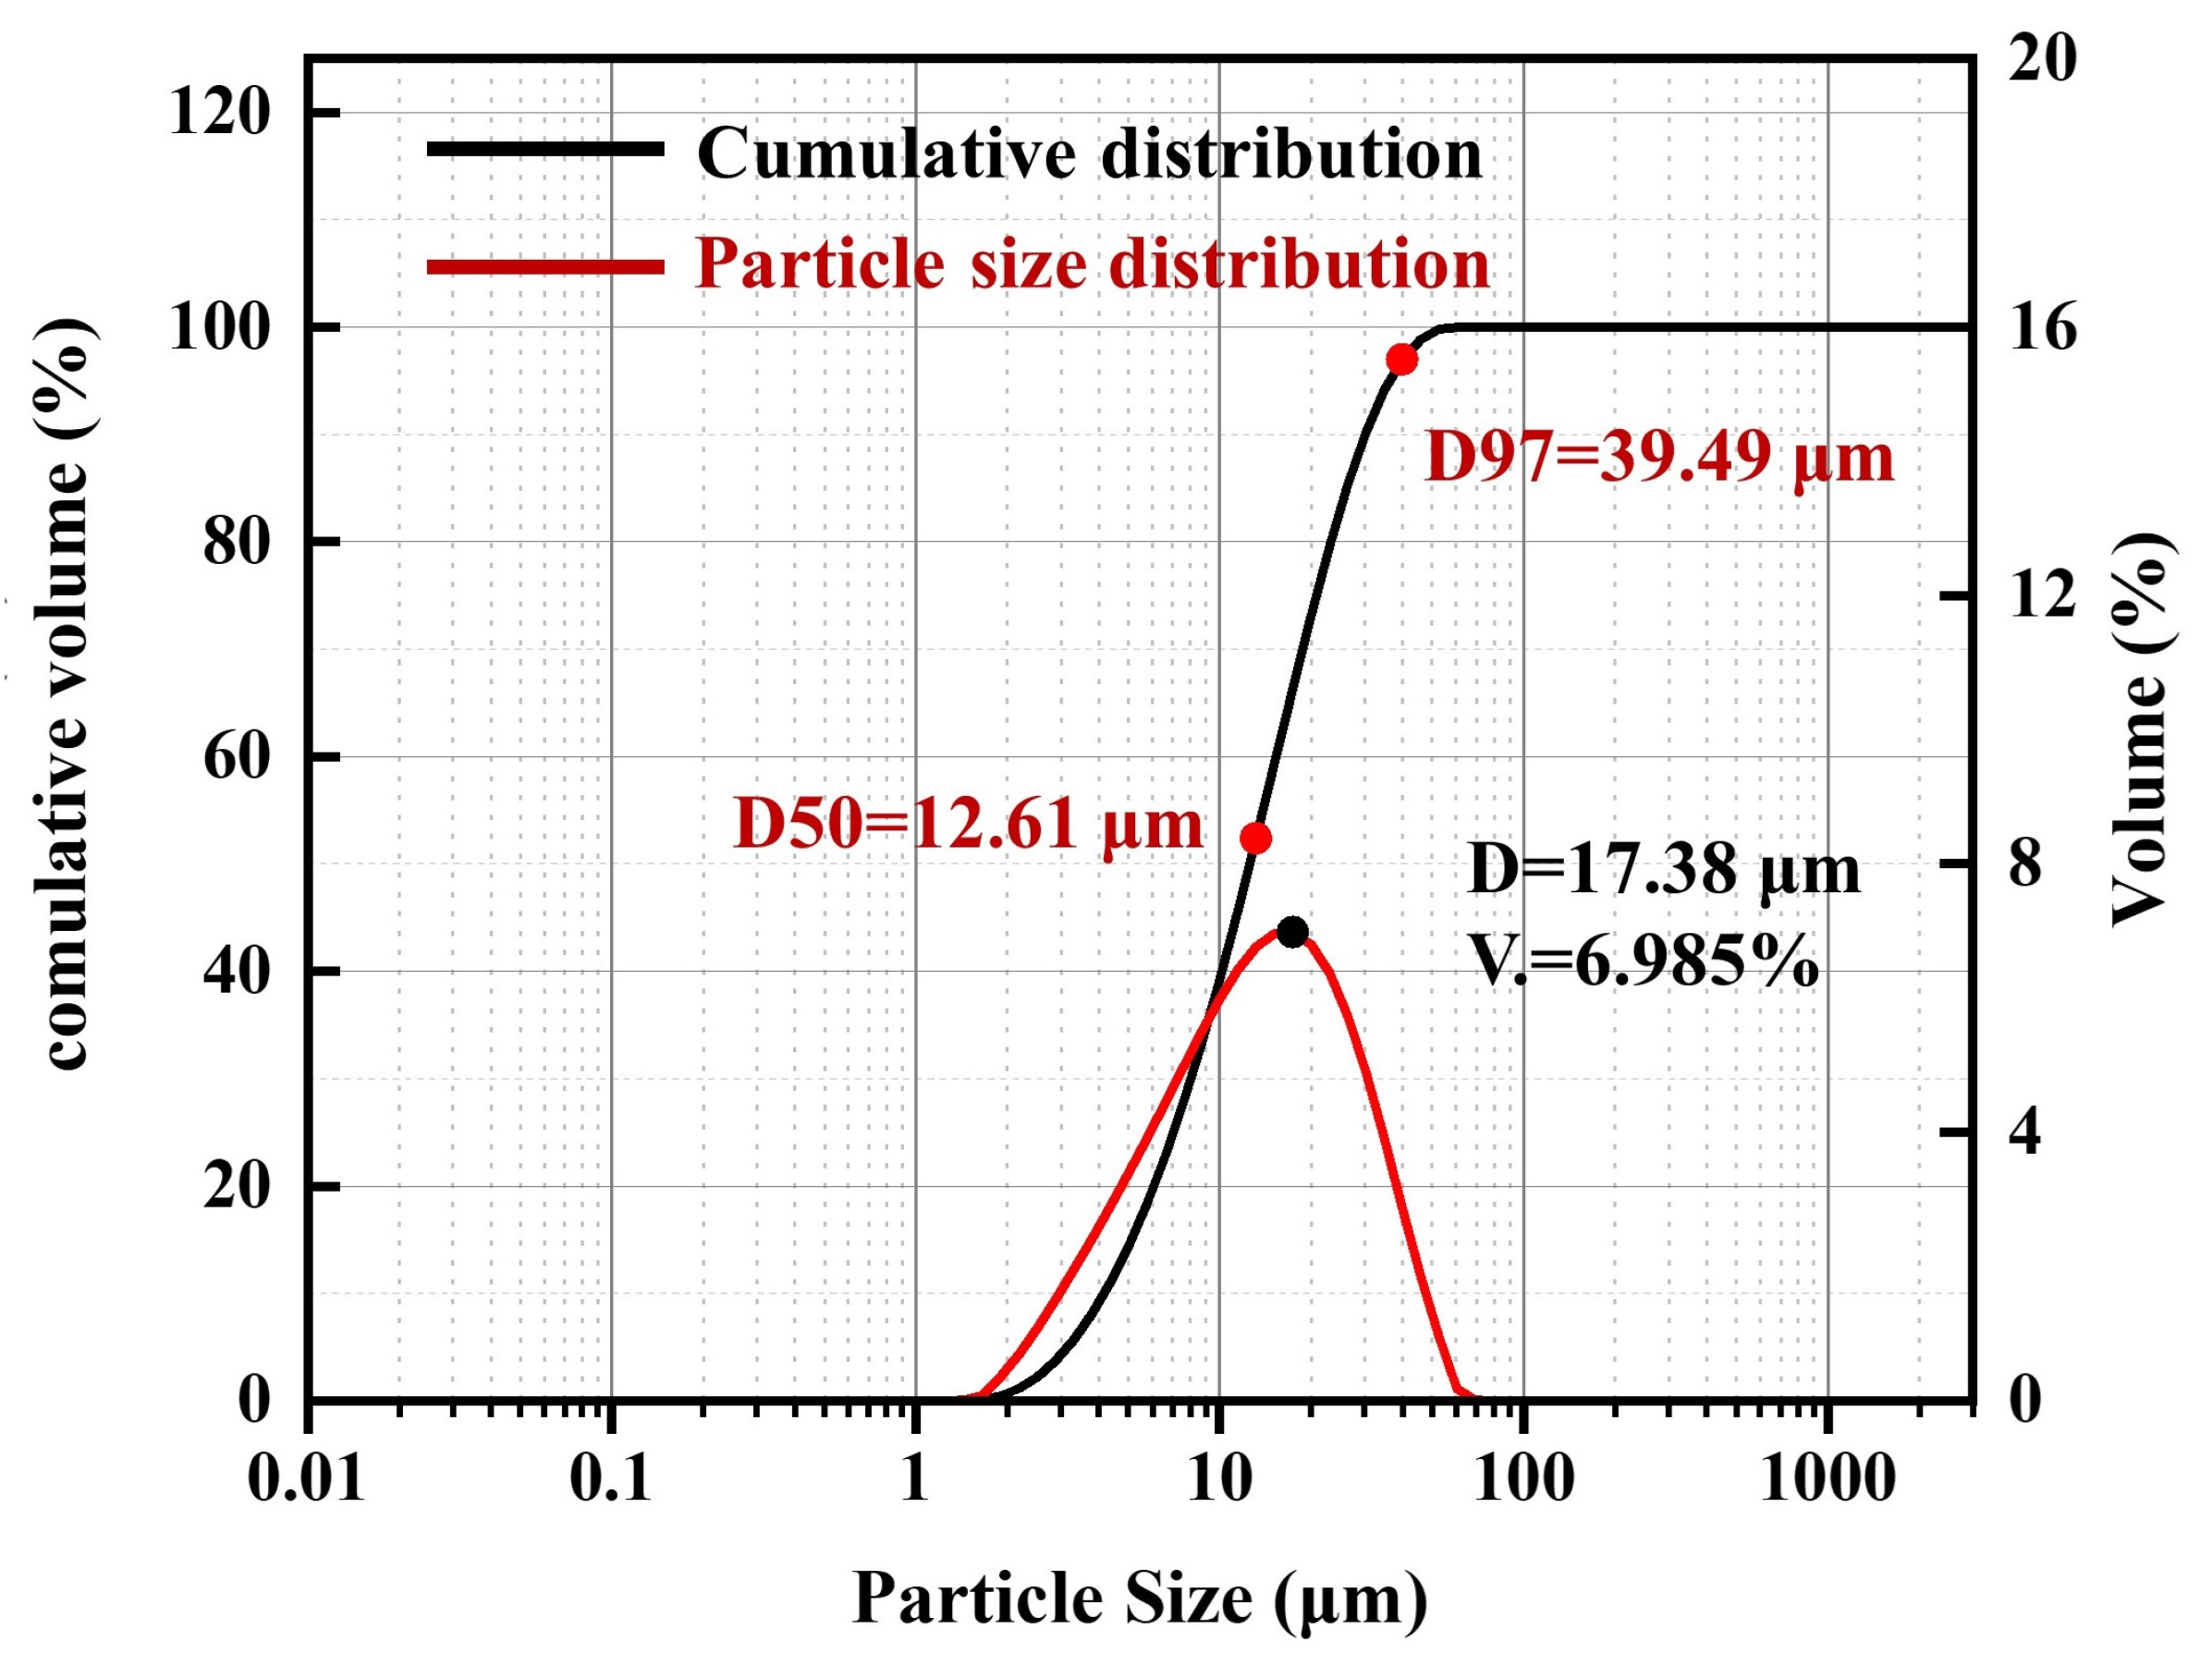
The particle size distribution of contaminants on the sample surface is shown in Figure 8. It can be seen that the main distribution sizes of the sample pollutant particles are in the range of 2–70 μm, which indicates small-sized particles, being similar to the results observed by SEM. The median diameter of the particles was 12.61 μm (D50), indicating that 50% of the particles were less than 12.61 μm in diameter. The coarse particles were evaluated by D97, which revealed that particles approximately 39.49 μm and 17 μm in size were the most abundant, accounting for up to 6.985%. The contents of clay (<5 μm), silt (5–50 μm), and sand (50–2000 μm) were 15.03%, 84.33% and 0.64%, respectively.
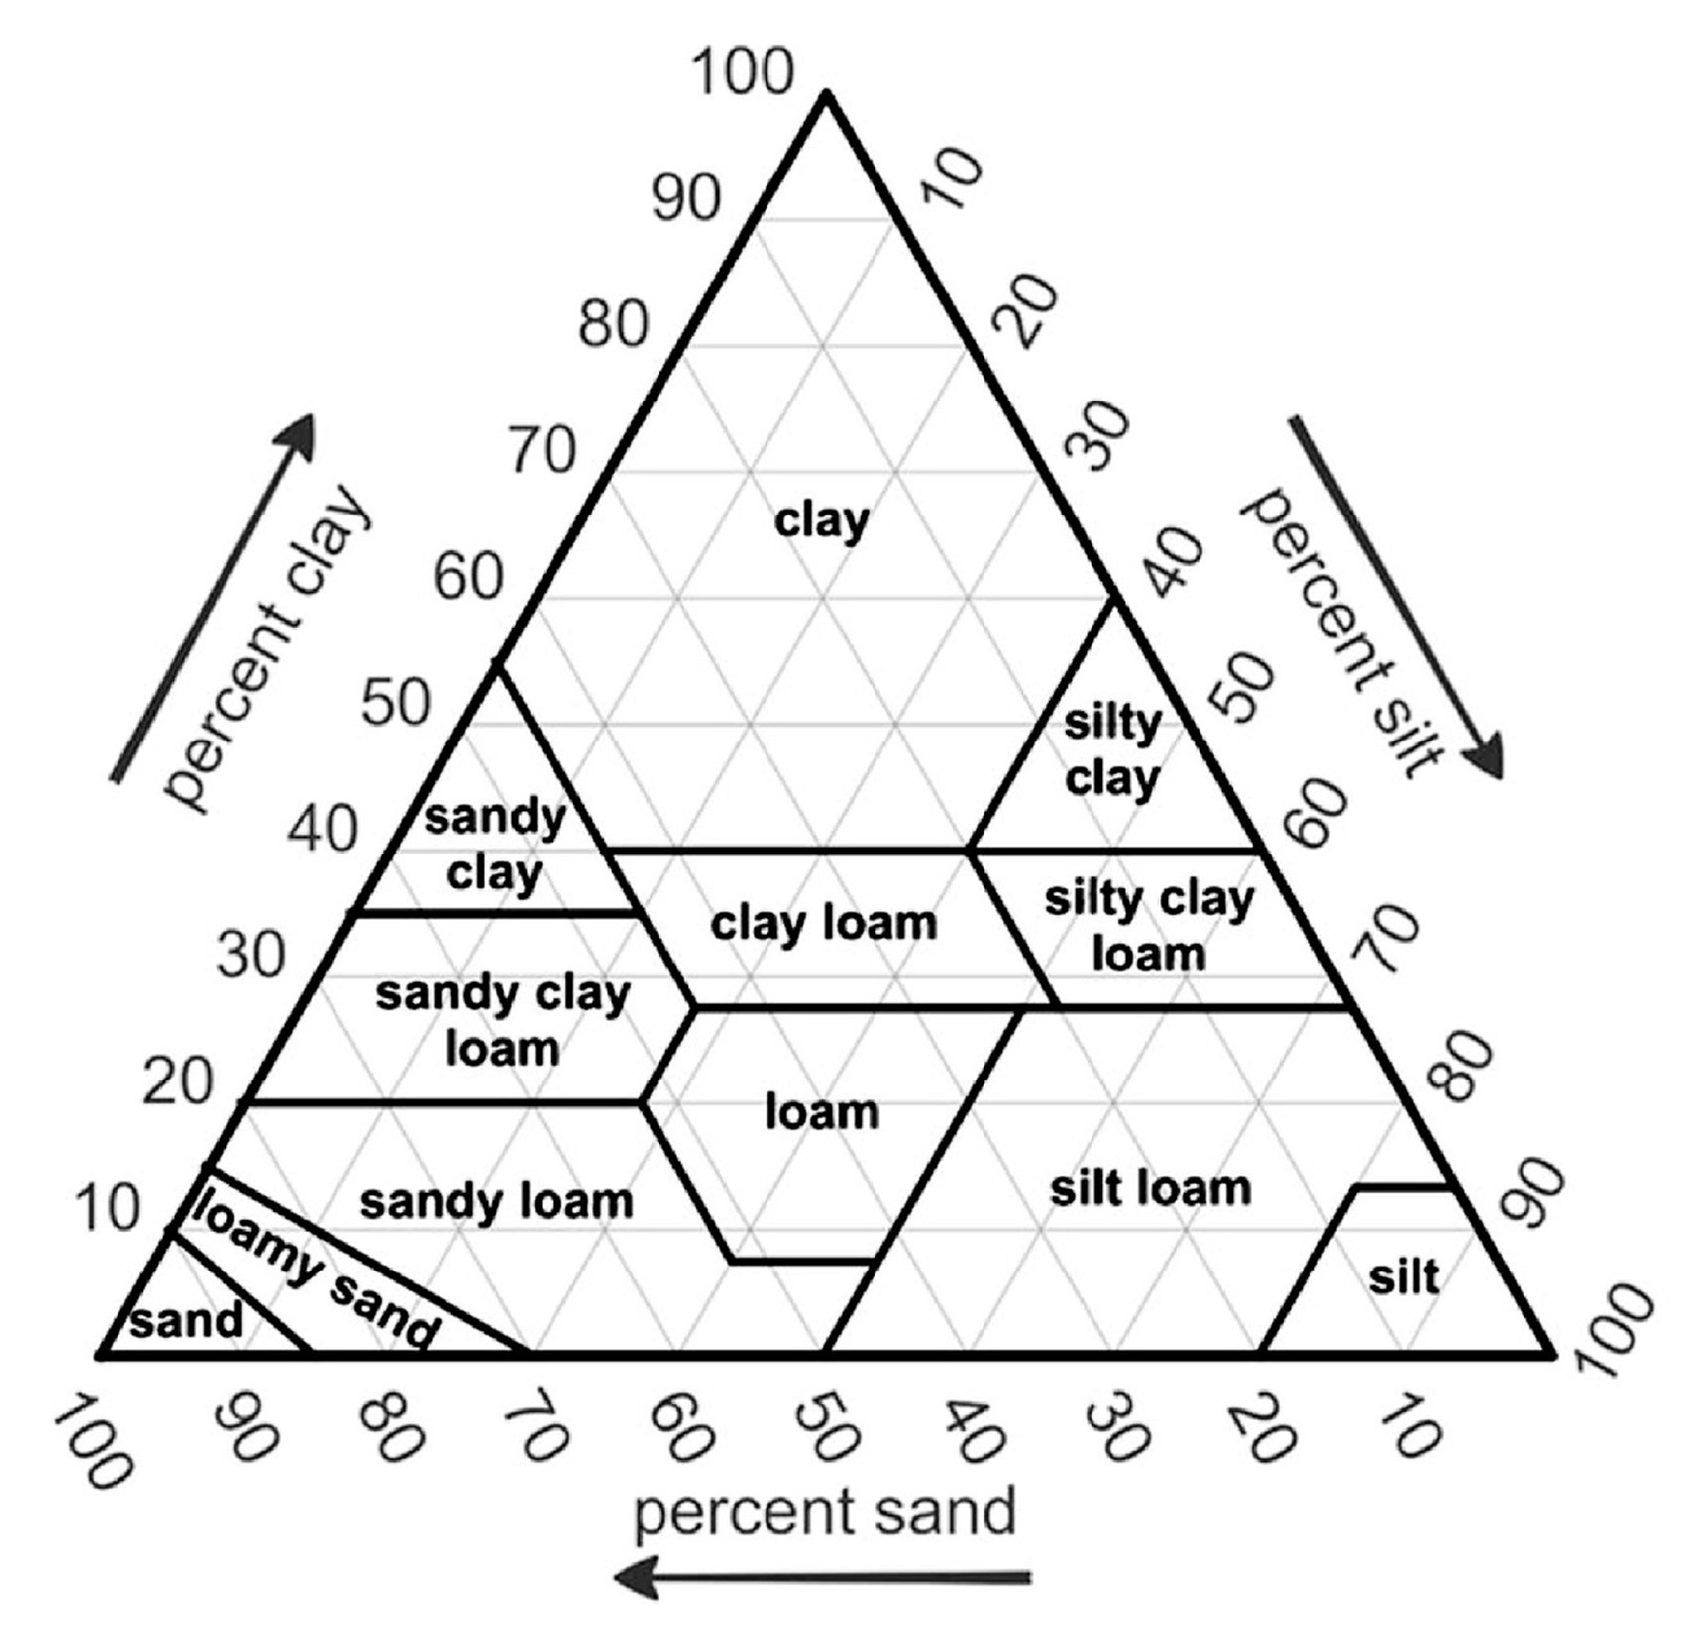
Particle size is one of the most basic properties of soil. In general, this property is obtained through relatively simple and easily interpretable methods. This is evidenced by the widespread use of one of the best-known soil classification systems: the texture triangle of the USDA (1951, 2017), as shown in Figure 9 [32]. The clay–silt–sand analysis of the pollutants studied in this paper showed that they belonged to the category of silt loam.

3.3. Morphology of Environmental Soil and Composition

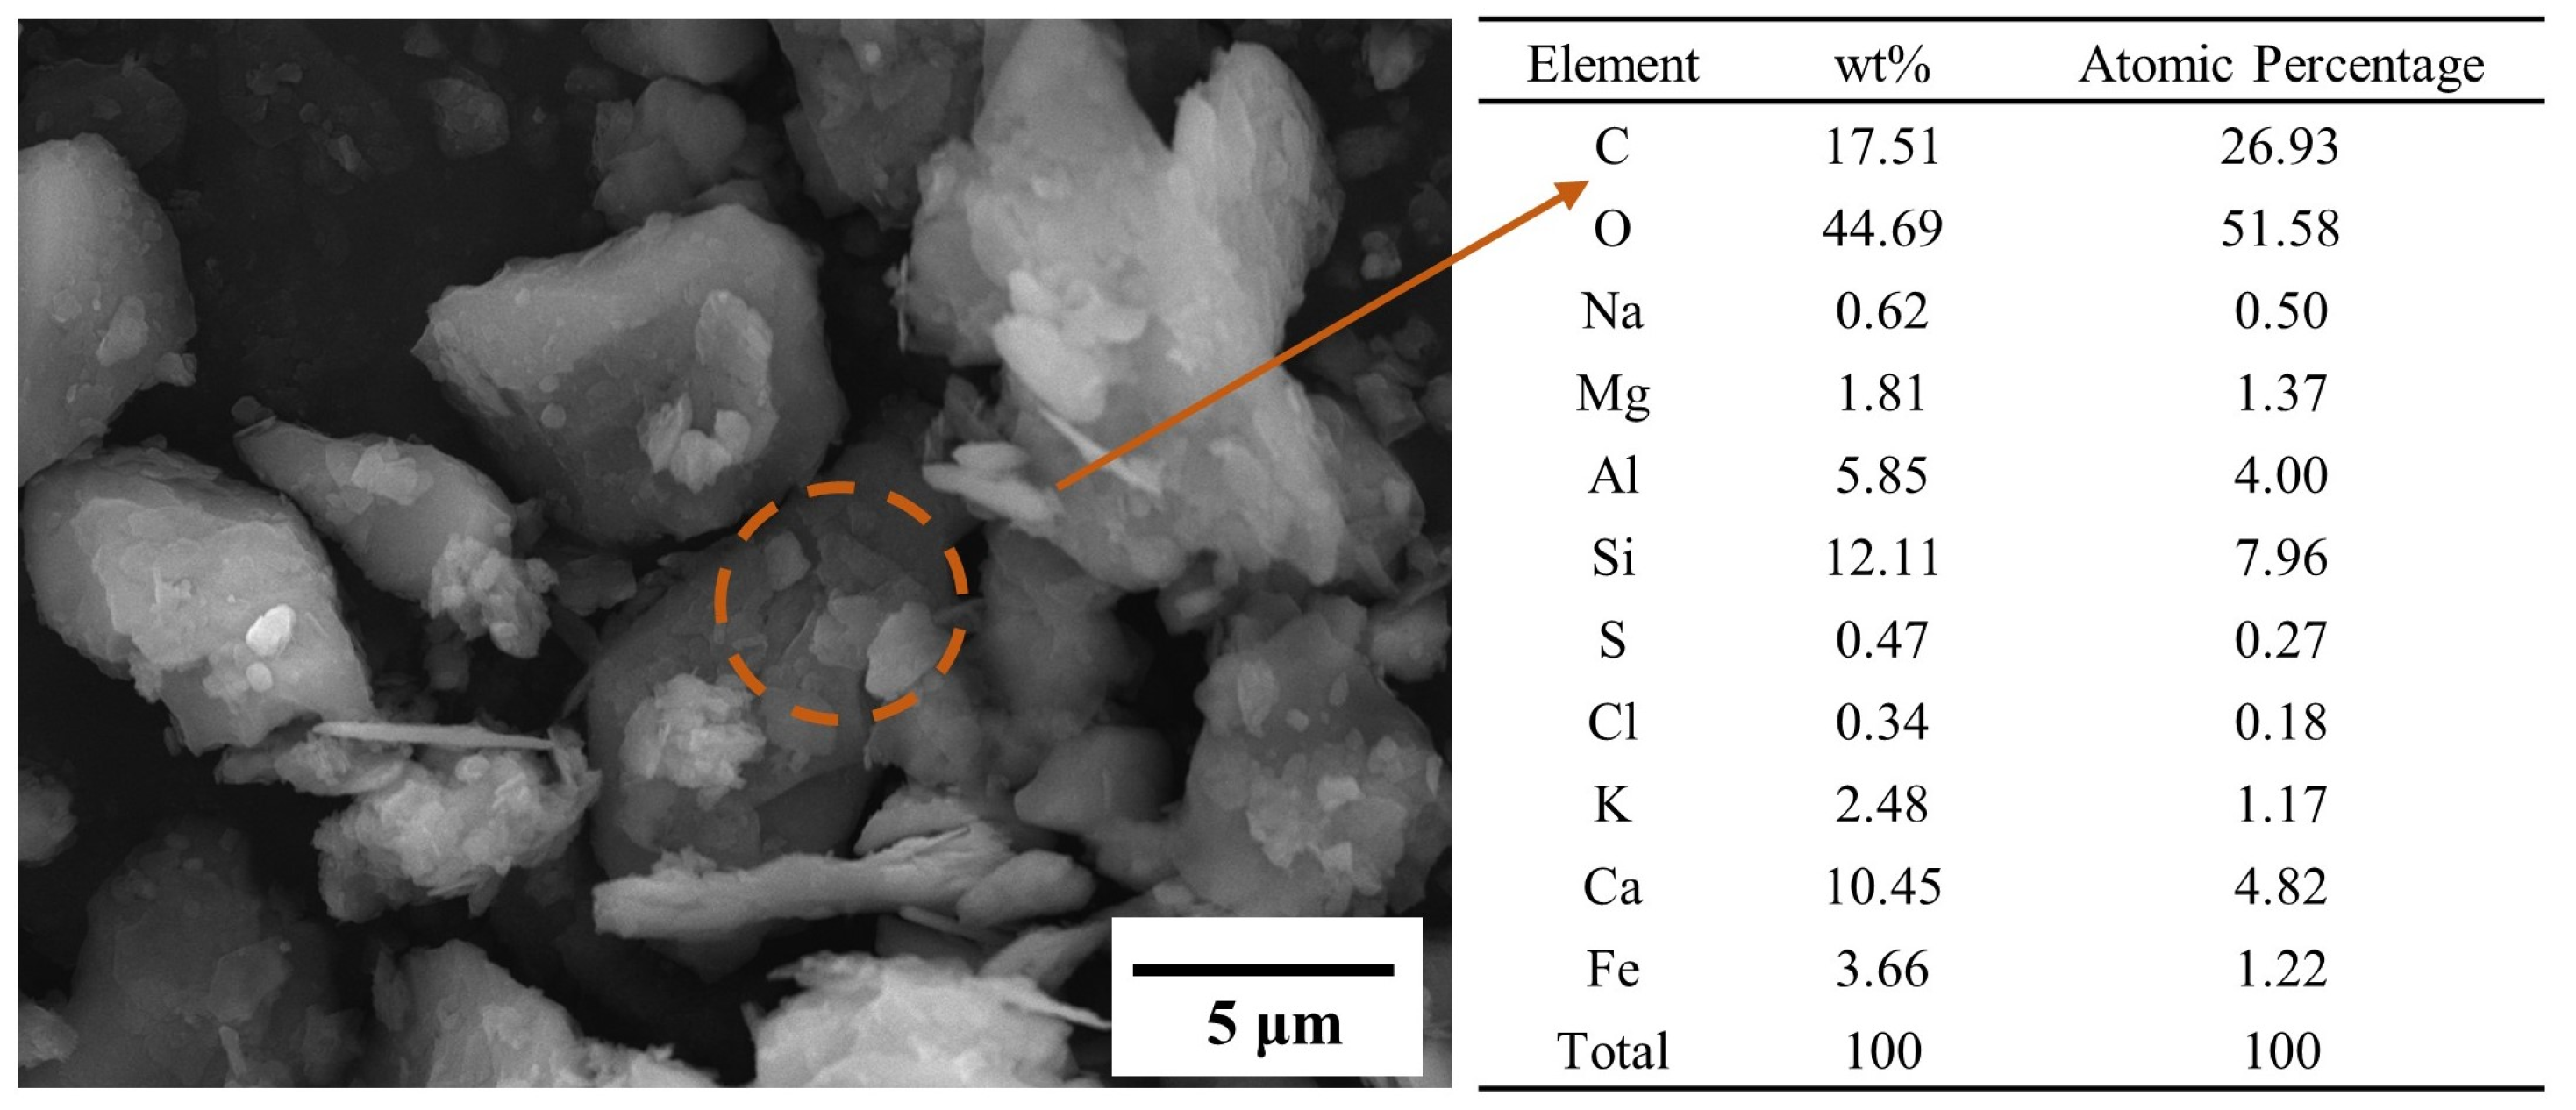
The pollutants deposited on the reflector surface of the CSP station were mostly related to their surrounding environment; thus, the source of the pollutants on the reflector surface was further determined by studying the morphology and composition of the surrounding environmental soil. Figure 10 below shows the micro-morphology of the soil around the CSP station. It can be seen that the size distribution of the particles spans a wide range, and the shapes are generally amorphous. The particle shapes can basically be divided into two major categories: relatively hard and large bulk particles (Figure 10a), and lamellar particles with loose structures (see Figure 10b, shown more clearly in Figure 10c,d).
Figure 11 shows the soil composition of the environment around the CSP station. The environmental composition was very close to the sample composition, both of which contained certain elements (e.g., oxygen, silicon, carbon, aluminum, iron, calcium, sodium, potassium, and magnesium, sulfur, and chlorine).
Bagnold divided wind and sand motions into three interrelated forms, leap, creep, and suspension [33], which can be roughly divided into the following cases according to the particle size: First, when the particle size is larger than 70 μm, the particles leap or creep on the surface, which belongs to the local substance category. Second, when the particle size is in the range of 20–70 μm, the particles are transported in a short suspension belonging to the regional substance category. Third, when the particle size is smaller than 20 μm, the accumulated dust particles are suspended in the troposphere for a long time and can be carried several kilometers away by airflow as a remote substance. The settling velocity, retention time, and removal process of atmospheric particles with different sizes are given in Table 1 [34]. The particle size of pollutants on the reflector surface is generally within 70 μm; thus, most of the pollutants are regional or distant-source substances. It was indicated that the pollutants on the reflector surface of the CSP station originated from particles formed during atmospheric circulation in the short- or long-term suspensions settling on the surface.
Throughout all of the above analyses of pollutants on the reflector surface of the CSP station, it was possible to roughly simulate the deposition of the dust particles. It is recommended that the composition of the simulated dust should be 85% silica (5–70 μm in diameter) and 5% clay (less than 5 μm in diameter), with an average diameter close to 13 μm. The remaining particles can be added as carbon black.

3.4. Brush-Based Dry Cleaning Process

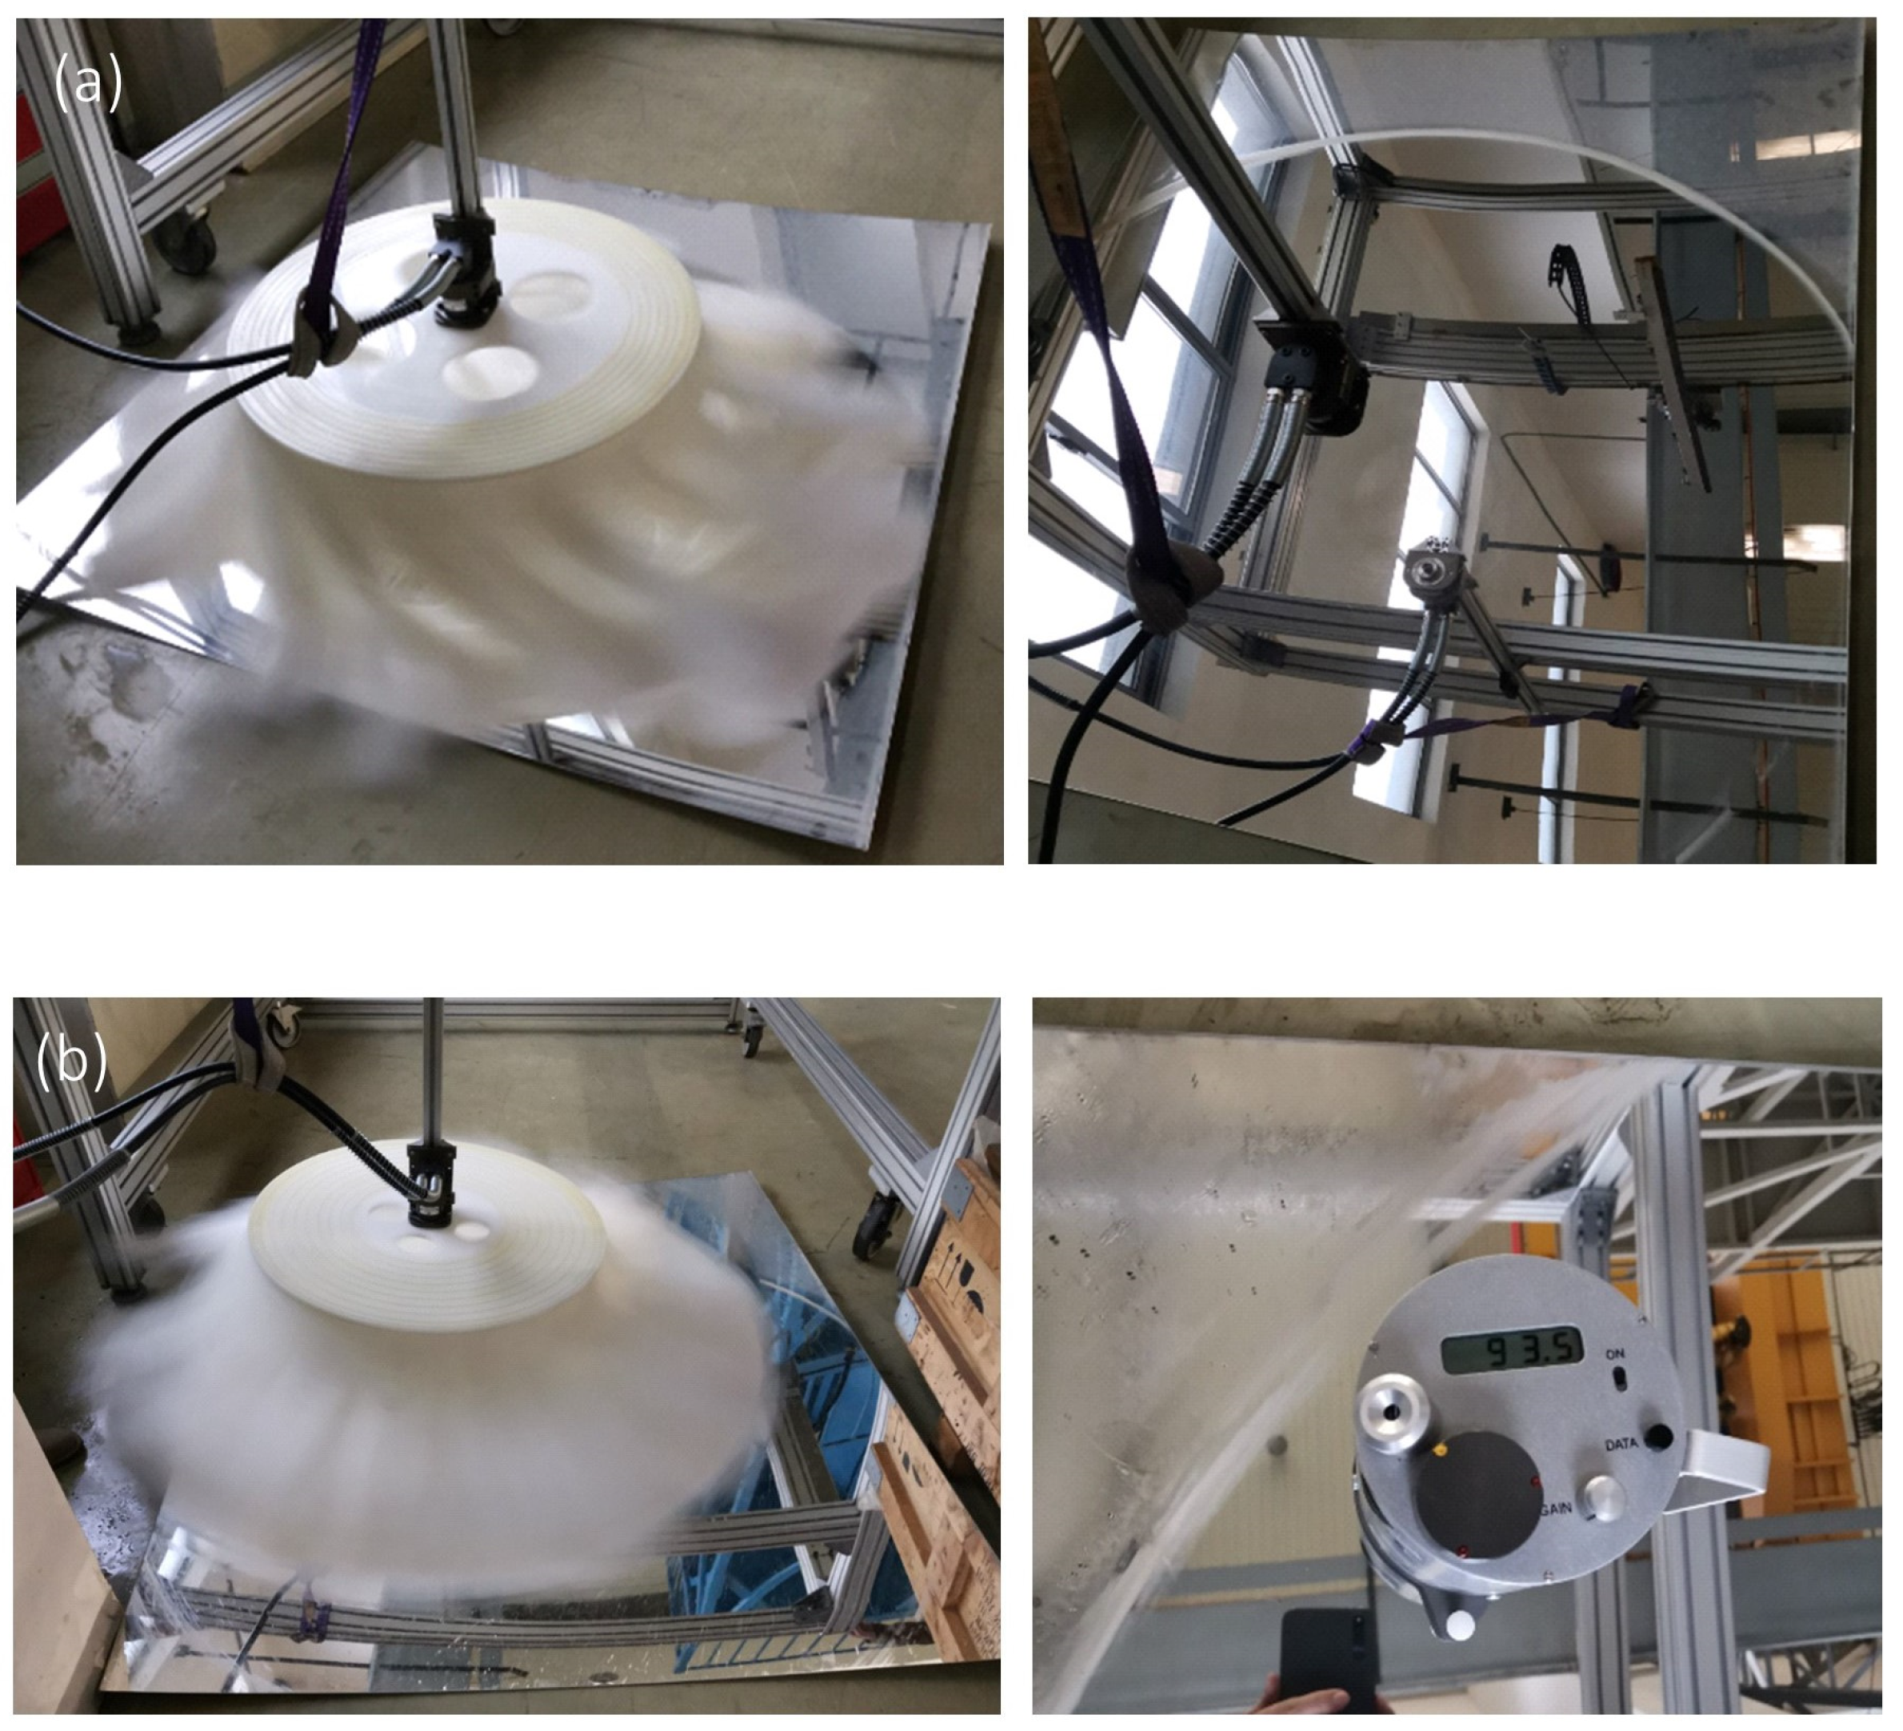
After cleaning with a brush with eight loops, the specular reflectivity of the reflector surface rose from 70 to 92, which met the reflectivity requirements of the site. After cleaning with a brush with 10 loops, the specular reflectivity increased from 68 to 93.5, which was slightly better than the effect of the first brush structure (see Figure 12).
We next examined the surface microstructure of the reflector before and after cleaning at different times in Figure 13. The reflector surface without cleaning had many particles of dust and was smooth in other areas (see Figure 13a). After cleaning for 30 min, the reflector surface had some shallow scratches, but the depth and width of the scratches were not great (see Figure 13b), indicating that the degree of damage was relatively minor. After cleaning for 60 min, the reflector surface had a greater wear depth, with pits in addition to shallow scratches (see Figure 13c). Dust particles become scattered and embedded in such pits during dusting and sweeping, further increasing the difficulty of cleaning and reducing the efficiency of dust removal to a certain extent. After cleaning for 120 min, the reflector surface damage had become serious. The depth of wear of the pits was no longer relatively localized but was instead continuously distributed along the cleaning track (see Figure 13d). The number of dust particles falling into the wear pits also increased, while a larger area of damage in the cleaning process intensified the wear of the adjacent areas and ultimately reduced the overall efficiency.
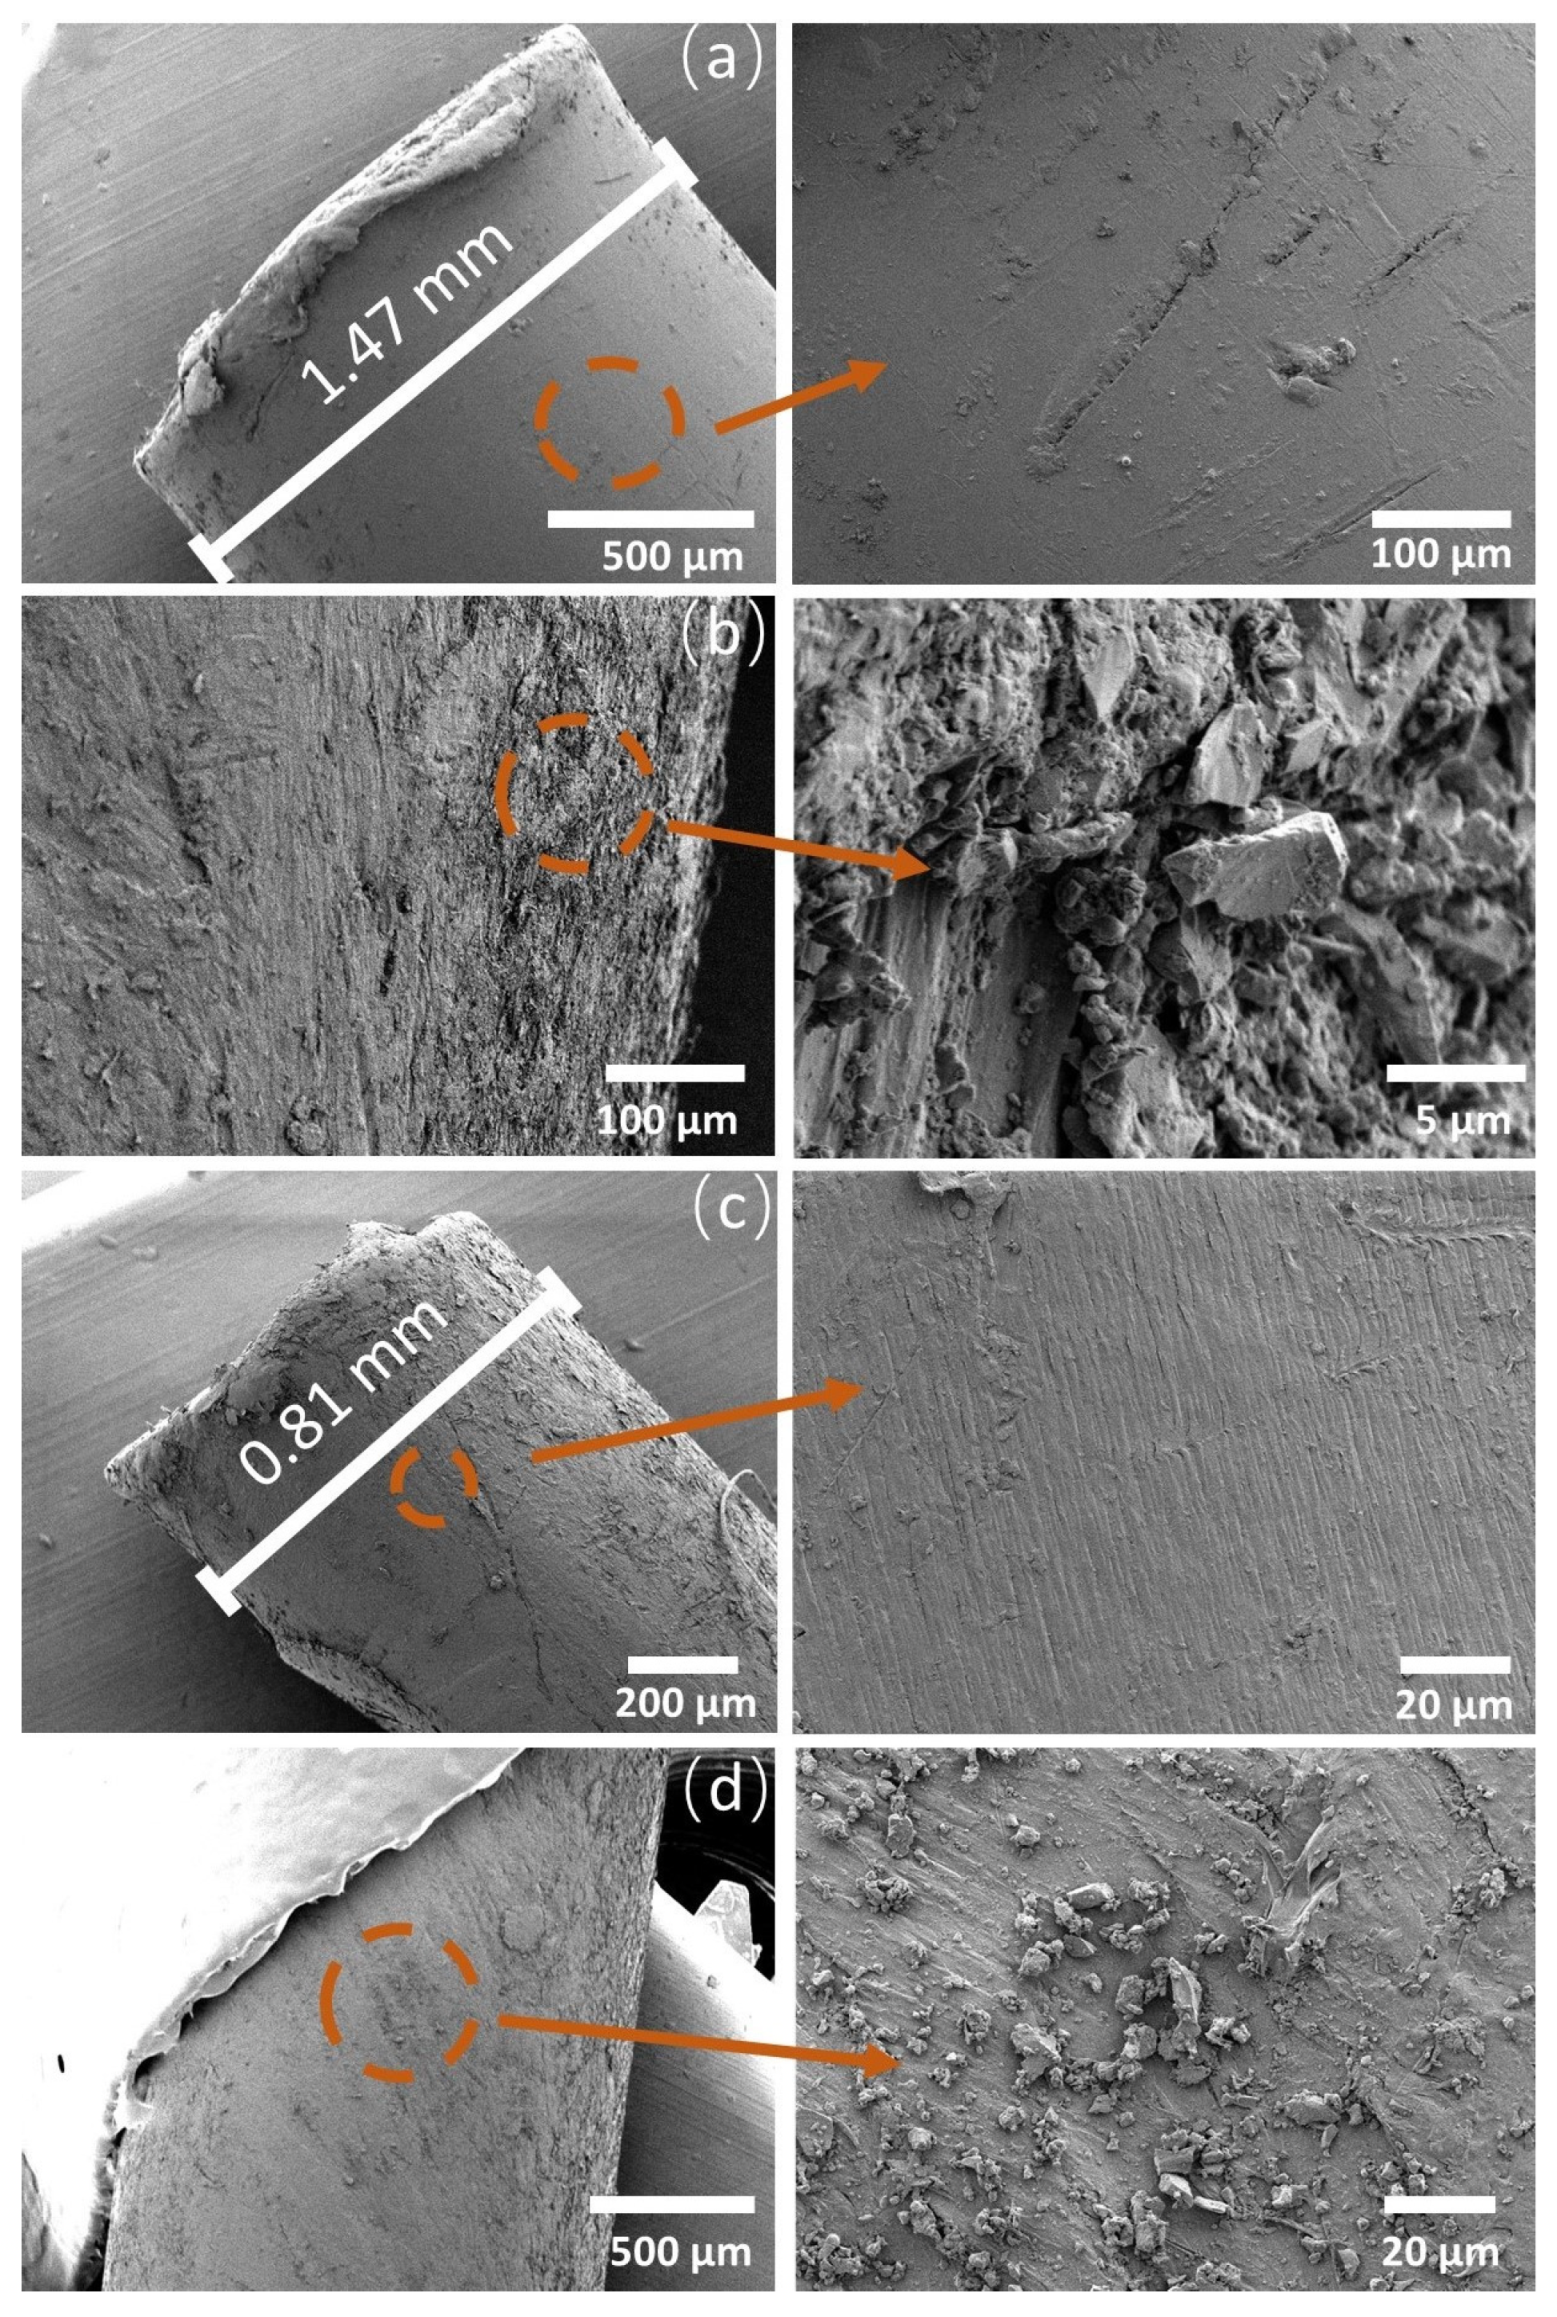
Since there was an interaction between the reflector surface, the pollutants, and the brushes, we analyzed the brushes used for cleaning simultaneously. The SEM images of the surface states of the brushes before and after cleaning are shown in Figure 14. It can be observed that before use, the surfaces of the brushes with diameters of 1.47 mm (outer two loops) or 0.81 mm (remaining inner loops) were flat with some small manufacturing defects (see Figure 14a,c). When the brushes were used after 120 min, it was observed that both brushes also had serious degrees of frictional damage to the track, while dust particles from the reflector could be observed (see Figure 14b,d). A transfer of pollutants occurred during the brush-based dry cleaning process, and these particles partially adhered to the brush, which was a source of secondary pollution that also increased the wear of the brush and the cleaned reflector surface.
Overall, the brush-based dry cleaning process caused wear damage to the reflector surface and the cleaning brushes, and the correlation between the damage and cleaning time was also strong. However, using a brush-based dry cleaning process during the service life of a reflector, one can complete the cleaning task to a relatively comprehensive degree and save significant amounts of water in winter or at other low temperatures.

4. Conclusions

In this paper, by collecting pollutants on the CSP station, analyzing their morphologies and compositions, and designing a brush cleaning process, conclusions were finally obtained as follows. The main size distribution of pollutants on the reflector surface was 2–70 μm. We found fine-sized and amorphous particles with obvious agglomeration, which mainly resulted from the sedimentation of particles suspended for a short time or from particles in the process of atmospheric circulation for a long time. The composition of the particles was dominated by crustal elements such as carbon, oxygen, silicon, aluminum, iron, calcium, sodium, potassium, magnesium, etc. The pollutant composition of the particles was simulated by selecting a dust package composed of 85% silica (5–70 μm in diameter); 5% clay (less than 5 μm in diameter), preferably with an average diameter close to 13 μm; and 10% carbon black, which was useful for developing a cleaning process. Although a brush-based dry cleaning process will cause wear damage to the reflector surface and cleaning brushes, using this process during the service life of a reflector, one can complete the cleaning task to a relatively comprehensive degree and save significant amounts of water in winter or at other low temperatures.

Author Contributions

C.W., J.L. and X.Z. were responsible for the design of the experiments and the methods, as well as the interpretation of the results. J.G., V.P., B.Y. and J.Z. were responsible for the sample selection and procurement, scheduling, and location and facilities arrangement. X.W., Y.D., Y.L. and N.L. were responsible for the execution of the experiments and data collection at the CSP station. C.W. wrote the paper and was supported by other members of the team. All authors have read and agreed to the published version of the manuscript.

Funding

This work was supported by the Science and Technology Program Project of Shenzhen (Zhong2019N032), the National Natural Science Foundation of China (No. U1832127), and the 2022 Wuhan University Sino-Foreign Joint Research Platform Fund Support Program for Key Collaborative Projects (WHUZZJJ202223).

Conflicts of Interest

The authors declare no conflict of interest.

Abbreviations

CSPConcentrated solar power
PTCParabolic trough collectors
SEMScanning electron microscope characterization
PSAParticle size analyzer
TEMTransmission electron microscopy

References

  1. Arnaoutakis, G.E.; Katsaprakakis, D.A.; Christakis, D.G. Dynamic modeling of combined concentrating solar tower and parabolic trough for increased day-to-day performance. Appl. Energy 2022, 323, 119450. [Google Scholar] [CrossRef]
  2. Otanicar, T.P.; Wingert, R.; Orosz, M.; McPheeters, C. Concentrating photovoltaic retrofit for existing parabolic trough solar collectors: Design, experiments, and levelized cost of electricity. Appl. Energy 2020, 265, 114751. [Google Scholar] [CrossRef]
  3. O’Hern, H.; Orosz, M.; Otanicar, T. Parabolic trough powerplants nearing PPA end: Retrofit or replace? Conf. Proc. 2018, 2033, 030010. [Google Scholar]
  4. Gao, X.; Wei, S.; Su, Z. Research on Dual-Mode Model Predictive Rejection Control for Outlet Temperature of Parabolic Trough Solar Field. Acta Energ. Sol. Sin. 2022, 43, 491–496. [Google Scholar]
  5. Zhou, K.; Yu, Z.; Li, X. Status and Trend of Parabolic Trough Solar Power Technology. Energy Res. Manag. 2014, 13, 1988. [Google Scholar]
  6. Hu, M.; Liu, T.; Xu, H. Development of Flux Density Distribution Measurement System for Parabolic Trough Concentrator. Acta Energ. Sol. Sin. 2021, 42, 435–439. [Google Scholar]
  7. Jun, D.; Ershu, X.; Chi, M.; Yanan, Z.; Gang, Y.; Go, S. Performance Evaluation Model of Trough Solar Thermal Power Generation. J. North China Electr. Power Univ. 2021, 48, 116–126. [Google Scholar]
  8. Rodriguez-Sanchez, D.; Rosengarten, G. Improving the concentration ratio of parabolic troughs using a second-stage flat mirror. Appl. Energy 2015, 159, 620–632. [Google Scholar] [CrossRef]
  9. Wang, Z.; Chan, W.; Yang, C.; Tian, R.; Han, X.; Song, L.; Gao, C. Effect and Prediction Method of Specular Dust Based on Trough Solar System. Acta Opt. Sin. 2020, 40, 70–78. [Google Scholar]
  10. Griffith, D.J.; Vhengani, L.; Maliage, M. Measurements of Mirror Soiling at a Candidate CSP Site. Energy Procedia 2014, 49, 1371–1378. [Google Scholar] [CrossRef] [Green Version]
  11. Cohen, G.; Kearney, D.; Kolb, G. Final Report on the Operation and Maintenance Improvement Program for Concentrating Solar Power Plants; No. SAND99-1290; Sandia National Laboratories (SNL): Albuquerque, NM, USA; Livermore, CA, USA, 1999. [Google Scholar]
  12. Hachicha, A.A.; Al-Sawafta, I.; Ben Hamadou, D. Numerical and experimental investigations of dust effect on CSP performance under United Arab Emirates weather conditions. Renew. Energy 2019, 143, 263–276. [Google Scholar] [CrossRef]
  13. Niknia, I.; Yaghoubi, M.; Hessami, R. A novel experimental method to find dust deposition effect on the performance of parabolic trough solar collectors. Int. J. Environ. Stud. 2012, 69, 233–252. [Google Scholar] [CrossRef]
  14. Anglani, F.; Barry, J.; Dekkers, W. A numerical study on high-pressure water-spray cleaning for CSP reflectors. Conf. Proc. 2016, 1734, 160001. [Google Scholar]
  15. Enaganti, P.K.; Bhattacharjee, A.; Ghosh, A.; Chanchangi, Y.N.; Chakraborty, C.; Mallick, T.K.; Goel, S. Experimental investigations for dust build-up on low-iron glass exterior and its effects on the performance of solar PV systems. Energy 2022, 239, 122213. [Google Scholar] [CrossRef]
  16. Merrouni, A.A.; Wolfertstetter, F.; Mezrhab, A.; Wilbert, S.; Pitz-Paal, R. Investigation of Soiling Effect on Different Solar Mirror Materials under Moroccan Climate. Energy Procedia 2015, 69, 1948–1957. [Google Scholar] [CrossRef] [Green Version]
  17. Wu, Z.; Yan, S.; Wang, Z.; Ming, T.; Zhao, X.; Ma, R.; Wu, Y. The effect of dust accumulation on the cleanliness factor of a parabolic trough solar concentrator. Renew. Energy 2020, 152, 529–539. [Google Scholar] [CrossRef]
  18. Muller, M.; Perry, K.; Micheli, L.; Almonacid, F.; Fernández, E.F. Automated detection of photovoltaic cleaning events: A performance comparison of techniques as applied to a broad set of labeled photovoltaic data sets. Prog. Photovolt. Res. Appl. 2022, 30, 567–577. [Google Scholar] [CrossRef]
  19. Fernández-Solas, Á.; Micheli, L.; Muller, M.; Almonacid, F.; Fernández, E.F. Design, characterization and indoor validation of the optical soiling detector “DUSST”. Sol. Energy 2020, 211, 1459–1468. [Google Scholar] [CrossRef]
  20. Muller, M.; Micheli, L.; Solas, A.F.; Gostein, M.; Robinson, J.; Morely, K.; Dooraghi, M.; Alghamdi, Y.A.; Almutairi, Z.A.; Almonacid, F.; et al. An in-depth field validation of “DUSST”: A novel low-maintenance soiling measurement device. Prog. Photovolt. Res. Appl. 2021, 29, 953–967. [Google Scholar] [CrossRef]
  21. Ming, L. Research on Mechanism of Solid Particle Adhesion & Remove from Surface and Dustproof Technology of Surface. Ph.D. Thesis, Central South University, Changsha, China, 2010. [Google Scholar]
  22. Fali, J. Study on the Effect of Photovoltaic Power Generation Project by Dust. Master’s Thesis, Chongqing University, Chongqing, China, 2010. [Google Scholar]
  23. Chen, E.Y.; Renner, P.; Lee, K.; Guo, B.; Liang, H. Effects of humidity on dust particle removal during solar panel cleaning. Surf. Topogr. Metrol. Prop. 2022, 10, 015003. [Google Scholar] [CrossRef]
  24. Javed, W.; Guo, B.; Figgis, B. Modeling of photovoltaic soiling loss as a function of environmental variables. Sol. Energy 2017, 157, 397–407. [Google Scholar] [CrossRef]
  25. Kazem, H.A.; Chaichan, M.T.; Al-Waeli, A.H.A.; Sopian, K. A review of dust accumulation and cleaning methods for solar photovoltaic systems. J. Clean. Prod. 2020, 276, 123187. [Google Scholar] [CrossRef]
  26. Arnaoutakis, G.E.; Katsaprakakis, D.A. Concentrating Solar Power Advances in Geometric Optics, Materials and System Integration. Energies 2021, 14, 6229. [Google Scholar] [CrossRef]
  27. Mazumder, M.K.; Horenstein, M.N.; Heiling, C.; Stark, J.W.; Sayyah, A.; Yellowhair, J.; Raychowdhury, A. Environmental Degradation of the Optical Surface of PV Modules and Solar Mirrors by Soiling and High RH and Mitigation Methods for Minimizing Energy Yield Losses. In Proceedings of the 2015 IEEE 42nd Photovoltaic Specialist Conference (PVSC), New Orleans, LA, USA, 14–19 June 2015. [Google Scholar]
  28. Al-Housani, M.; Bicer, Y.; Koç, M. Assessment of Various Dry Photovoltaic Cleaning Techniques and Frequencies on the Power Output of CdTe-Type Modules in Dusty Environments. Sustainability 2019, 11, 2850. [Google Scholar] [CrossRef] [Green Version]
  29. Al Shehri, A.; Parrott, B.; Carrasco, P.; Al Saiari, H.; Taie, I. Impact of dust deposition and brush-based dry cleaning on glass transmittance for PV modules applications. Sol. Energy 2016, 135, 317–324. [Google Scholar] [CrossRef]
  30. Al Shehri, A.; Parrott, B.; Carrasco, P.; Al Saiari, H.; Taie, I. Accelerated testbed for studying the wear, optical and electrical characteristics of dry cleaned PV solar panels. Sol. Energy 2017, 146, 8. [Google Scholar] [CrossRef]
  31. Ru, K. Design of Dust Removal Brush for Photovoltaic Module and Study on Dust Removal Mechanism. Master’s Thesis, Lanzhou University of Technology, Lanzhou, China, 2017. [Google Scholar]
  32. Moreno-Maroto, J.M.; Alonso-Azcárate, J. Evaluation of the USDA soil texture triangle through Atterberg limits and an alternative classification system. Appl. Clay Sci. 2022, 229, 106689. [Google Scholar] [CrossRef]
  33. Ning, H.; Xiaojing, Z. Research history, achievements and trend on mechanism of aeolian transport. Mech. Eng. 2007, 29, 9–16. [Google Scholar]
  34. Service center for societies of China Association for Science and Technology; Chinese Society for Environmental Sciences. Science and Technology Livelihood Report Series. In Atmospheric Fine Particulate Pollution, 1st ed.; Science and Technology of China Press: Beijing, China, 2018; pp. 48–77. [Google Scholar]
Figure 1. Schematic diagram of the brush structures. 1, 2—holes for mounting brushes; 3—holes for mounting plastic chassis; 4—plastic chassis.
Energies 16 03260 g001
Figure 2. Macrostructures of samples with a usable duration of (a) 1 or (b) 2 months.
Energies 16 03260 g002
Figure 3. SEM images of the samples’ microstructures after one month’s use. The directions of the arrows in (a) indicate the directions of the mud-belt accumulations. (bg) show the microstructures of different regions after enlargement.
Energies 16 03260 g003
Figure 4. Schematic diagram of the pollutant composition on the surface of the sample after one month’s use.
Energies 16 03260 g004
Figure 5. SEM images of the samples after two months’ use. (ag) show the microstructures of different regions at different magnifications.
Energies 16 03260 g005
Figure 6. Schematic diagram of the pollutant compositions on the surface of the samples after 2 months of use.
Energies 16 03260 g006
Figure 7. High-resolution TEM images of contaminants on the sample surface.
Energies 16 03260 g007
Figure 8. The particle size distribution of the pollutants on the surface of the sample.
Energies 16 03260 g008
Figure 9. Soil classifications: the clay–silt–sand texture triangle.
Energies 16 03260 g009
Figure 10. SEM images of soil microstructures around the trough CSP station. (a) relatively hard and large bulk particles; (bd) lamellar particles with loose structures at different magnification.
Energies 16 03260 g010
Figure 11. Schematic diagram of the soil composition around the trough CSP station.
Energies 16 03260 g011
Figure 12. Two kinds of brushes used during work and the reflector surfaces after cleaning (a) 8 loops (b) 12 loops.
Energies 16 03260 g012
Figure 13. SEM images of the microstructure of the reflector before and after cleaning. (a) not cleaned, (b), (c) or (d) after cleaning for 30, 60 or 120 min.
Energies 16 03260 g013
Figure 14. SEM images of the surface states of the brushes before and after use. (a,b) The brushes (outer 2 loops) before and after use. (c,d) The brushes (remaining inner loops) before and after use.
Energies 16 03260 g014
Table 1. Sedimentation velocity, residence time, and removal process of atmospheric particles with different sizes.
Particle Size (μm)Settling Velocity (cm/s)Retention TimeRemoval Process
0.0014.0 × 10−7~1 dayAgglomeration
0.011.5 × 10−4~1 weekAgglomeration
0.12.5 × 10−2--Nucleation (scoured by rain, etc.)
12.5~1 monthSedimentation
10150~12 hSedimentation
100--~10 minSedimentation
Disclaimer/Publisher’s Note: The statements, opinions and data contained in all publications are solely those of the individual author(s) and contributor(s) and not of MDPI and/or the editor(s). MDPI and/or the editor(s) disclaim responsibility for any injury to people or property resulting from any ideas, methods, instructions or products referred to in the content.