Article

Anaerobic Digestion of Olive Mill Wastewater in the Presence of Biochar

1
Dipartimento di Ingegneria Industriale (DII), Università degli Studi di Napoli Federico II, piazzale V. Tecchio 80, 80125 Napoli, Italy
2
Dipartimento di Agraria, Università degli Studi di Napoli Federico II, via Università 100, 80055 Portici, Italy
3
Dipartimento di Ingegneria Chimica, dei Materiali e della Produzione Industriale (DICMaPI), Università degli Studi di Napoli Federico II, piazzale V. Tecchio 80, 80125 Napoli, Italy
*
Author to whom correspondence should be addressed.
Energies 2023, 16(7), 3259; https://doi.org/10.3390/en16073259
Submission received: 1 February 2023 / Revised: 27 March 2023 / Accepted: 3 April 2023 / Published: 5 April 2023

Abstract

:
Biological treatments focused on stabilizing and detoxifying olive mill wastewater facilitate agronomic reuse for irrigation and fertilization. Anaerobic digestion is particularly attractive in view of energy recovery, but is severely hampered by the microbial toxicity of olive mill wastewater. In this work, the addition of biochar to the digestion mixture was studied to improve the stability and efficiency of the anaerobic process. Kinetics and yields of biogas production were evaluated in batch digestion tests with biochar concentrations ranging from 0 to 45 g L−1. The addition of biochar reduced sensibly the lag phase for methanogenesis and increased the maximum rate of biogas generation. Final yields of hydrogen and methane were not affected. Upon addition of biochar, soluble COD removal increased from 66% up to 84%, and phenolics removal increased from 50% up to 95%. Digestate phytotoxicity, as measured by seed germination tests, was reduced compared to raw wastewater. Addition of biochar further reduced phytotoxicity and, furthermore, a stimulatory effect was observed for a twenty-fold dilution. In conclusion, biochar addition enhances the anaerobic digestion of olive mill wastewaters by effectively reducing methanogenesis inhibition and digestate phytotoxicity, thus improving energy and biomass recovery.

1. Introduction

The disposal of olive mill wastewaters (OMWs) represents a serious economic and environmental concern due to the high content of organic matter, the significant phytotoxicity, and the large volumes produced in a short time period [1,2,3].
Proposed OMW management strategies apply treatments that are either physicochemical or biological. Most of the physicochemical treatments suffer several drawbacks, especially in terms of environmental impact, operational costs, and sensitivity to a variable composition [4]. Strategies that are based on biological treatments and allow waste valorization should be preferred in order to comply with current environmental regulations and recommendations [5].
Current practice involves the agronomic reuse of OMWs for irrigation and fertilization, although it is severely limited by their phytotoxicity; this is mainly due to the high polyphenol content [6], which varies in the range of 1–10 g L−1 [5]. The impact of OMW spreading on the fertility of agricultural fields can be attenuated by dosing the volumes to match the self-remediation capacity of healthy soils. However, if the spreading has to be delayed, the storage of huge amounts of black, bad smelling wastewater can be difficult to manage. A biological treatment that is focused on OMW stabilization and detoxification could allow higher rates of spreading and easier storage.
Among biological treatments, the anaerobic digestion (AD) process has been proposed as a promising technology since it allows energy recovery via biogas production. Nevertheless, the application of AD to OMW treatment has some limitations, primarily due to the inhibition of methanogenesis that is caused by the high concentrations of polyphenols [5,7,8]. Concentrations of total polyphenols higher than 1 g L−1 have been found to fully inhibit AD in batch tests with non-adapted inocula [9]. The toxicity of several polyphenols common in OMWs towards acetoclastic methanogens has been demonstrated by the complete suppression of biogas production with concentrations of 1 g L−1 of p-coumaric acid, 0.6 1 g L−1 of caffeic acid, or 0.8 1 g L−1 of protocatechuic acid [10]. A comparison of molecular analysis reports on the population composition of methanogenic Archea in OMW digesters has revealed conflicting results on the prevalent (less inhibited) species, which probably also depend on the digester operating conditions [11].
AD inhibition can be counteracted by reducing the concentration of the polyphenolic compounds either by dilution (by water or by co-digestion with other agricultural and livestock wastes) or by pre-treating OMW to remove the inhibitors. Co-digestion with manure not only dilutes, but also provides nutrients such as nitrogen and phosphorus, which are deficient in OMWs [2,12,13]. Pretreatments include physicochemical (filtration on sand, adsorption on activated carbon, Fenton oxidation, ozonation [12]), and biological processes (aerobic oxidation by indigenous bacteria [14] or by fungi [15]). In spite of the well-known microbial toxicity, OMW AD has been shown to be feasible in principle at the laboratory scale with a careful choice of operating conditions, [2,13,16,17].
In order to stabilize and increase the efficiency of the AD process for actual field application, the use of additives, such as hydrolysis promoters, pH buffering agents, supplemental micronutrients, carbon-based conductive carriers [18], could be envisaged. Biochar is a carbon-based material derived from the pyrolysis of sustainably obtained biomass. It is rich in aromatic carbon and minerals, and is commonly used in soil amendments. A high surface area and high porosity allow biochar to be an effective sorbent for organic and inorganic compounds with different mechanisms, such as adsorption, aromatic-π interaction, and electrostatic interactions [19].
The addition of biochar has been found to enhance the efficiency and stability of AD processes, as shown by shorter methanogenic lag phase in batch processing, faster volatile fatty acid (VFA) formation and utilization, higher rates of biogas production, higher CH4 yields, better stability in the case of organic overload, and mitigation of ammonium inhibition [20].
Several, possibly concomitant, mechanisms have been postulated based on known biochar properties:
  • adsorption of inhibitory substances such as heavy metals, pesticides, furfural, etc. [21];
  • pH buffering capacity during VFA accumulation [22];
  • protective action and syntrophy in biofilms formed on biochar surface [23,24,25];
  • redox activity of biochar, allowing direct interspecies electron transfer (DIET) [23,25], i.e., exchange of electrons without H2 production.
So far, there have been no attempts to use the addition of biochar to stabilize and improve OMW digestion. In this work, the effect of biochar addition to the AD process was evaluated at the laboratory scale by a variant of the standard biomethane potential (BMP) test. BMP tests are usually performed batchwise with high inoculum/substrate ratios in order to minimize the initial lag phase and possible inhibitory effects caused by concentrated wastes [26]. In our setup, the inoculum/substrate ratio was kept low and the inhibitory effect was evaluated by the duration of the lag phase and by the rate of the ensuing biogas production. The overall biomethane potential could also be measured at the end of the prolonged run. The beneficial effects of biochar addition to the OMW digestion mixture were considered not only in terms of biogas production kinetics, which are relevant to the stability of the AD process, but also in terms of parameters that are relevant to the agronomical reuse of digestates, such as polyphenol concentration, oxygen demand (both chemical and biochemical), and phytotoxicity (using seed germination tests).

2. Materials and Methods

2.1. Materials

2.1.1. Olive Mill Wastewater

OMW was obtained from a three-phase olive mill process located in Ostuni (Italy) and stored at −20 °C until use. Since it originated from a process involving centrifugation, it contains low quantities of suspended solid matter and oil phase (total COD was only 7% higher than soluble COD). It was used for anaerobic digestion tests and biochar pre-treatments without any further separation of fractions. The OMW was characterized according to APAT standard methods [27] (Table 1). Total phenolic compounds (TPC) were measured by using the Folin–Ciocalteu reagent on the ethyl acetate extractable fraction [6].

2.1.2. Inoculum

An anaerobic sludge obtained from a mixed poultry and cattle slurry digester located in Eboli (Italy) was used as the inoculum in AD tests. It was characterized using the same analytical procedures previously described for OMW (Table 1).
The inoculum was stored at 4 °C before use for no more than 2 weeks. Biogas production from undigested substrates was measured using the same apparatus described in Section 2.2 without the addition of OMW (replaced by 50 mL of tap water). Overall biogas production was 55 ± 21 mL at 25 °C and 1 atm. The tiny amount was neglected in yield calculations.

2.1.3. Biochar

Biochar was produced from poplar wood in a downdraft, open-top gasifier by AGT (Advanced Gasification Technology, Cremona, Italy). The average biomass residence time inside the reactor was 30–45 min and the temperature reached 1200 °C. Poplar biochar (PB) was used as powder with a granulometry in the range 0.05–0.5 mm. The surface area and the pore volume, determined by the dynamic Brunauer–Emmett–Teller (BET) method, were 76.88 m2 g−1 and 0.046 cm3 g−1, respectively. Additional physical and chemical properties of PB have been published [28,29,30].

2.2. Anaerobic Digestion Tests

AD tests were carried out in glass batch digesters of 750 mL volume, stirred at 60 rpm and maintained at a constant temperature of 35 ± 1 °C.
The fermentative volume was 500 mL and was composed of 50 mL of inoculum, 50 mL of OMW, 400 mL of tap water and 1.91 g of NH4Cl (corresponding to a final concentration of 1 g NH4+-N L−1). NH4Cl was added because bioavailable nitrogen in OMW is generally considered insufficient or non-optimal for bacterial growth [2,12,13]. Added biochar ranged from 0 to 45 g L−1. Digesters were run in duplicate for each biochar concentration.
The anaerobic conditions were ensured by bubbling 150 mL min−1 of nitrogen for 20 min through the digestion medium, then 2 mL with 0.8 mmol mL−1 of Na2S were added to remove the residual dissolved oxygen.
The pH value of the resulting digestion medium was initially around neutrality. The pH of the digestion medium was then checked on liquid samples withdrawn throughout the run. When the deviation from neutrality was more than 0.5 (medium acidifies at the start of fermentation), a solution of 1 M NaOH was added in order to adjust the pH to the range of 6.8–7.2, more favorable to growth of methanogenic bacteria [31]. The required base volume was obtained by titrating the sample and then adding a proportional volume to the actual digestion volume. Correction was necessary only at the start of the digestion without biochar and amounted to a few percent of the total digester volume.
During the biogas production stages, 1 mL liquid samples were taken to assess the formation and utilization of volatile fatty acids (VFAs). Sampling was kept to a minimum to reduce disturbance to digestion (typically 2–3 samplings for each biogas production phase). The presence of VFAs was determined by GC analysis, using a Shimadzu GC–17A equipped with a flame ionization detector and a BP20 capillary column (SGE). At the end of each run, the digestate liquid fraction was characterized for residual COD, BOD5 and phytotoxicity.
A PTFE tube connected the digesters to external MilliGascounter® devices (type MGC–1, from Ritter, Bochum, Germany) for the biogas production measurements, in terms of cumulative volumes with an accuracy of approx. ± 3%, which were collected by an on-line data acquisition system or read directly from the device display. The biogas produced was then collected in gas sampling bags of 500 mL volume and periodically analyzed by a Shimadzu GC-2014 gas chromatograph equipped with a TCD detector and a carbon molecular sieve packed column (Carboxen–1000 Supelco®, from Merck KGaA, Darmstadt, Germany). The biogas composition (H2, CO2, CH4, N2) was determined with an accuracy of approx. ± 0.5%. Cumulative biogas, H2, and CH4 volumes have been reported at the temperature of 0 °C and at the pressure of 1 atm.

2.3. Phytotoxicity Tests

Germination tests were performed with Lepidium sativum seeds in Petri dishes [6], according to the following procedure. Twenty seeds were distributed on a Whatman n.1 filter that was wet with 5 mL of the sample diluted in distilled water. Starting with centrifuged digestates or untreated OMW diluted tenfold, several dilutions ranging from 100 percent (undiluted) down to 0.1 percent of sample in distilled water were tested. Each test was replicated 3 times and a blank (filter wet with distilled water) was included. After 72 h at 25 ± 1 °C in the dark, root length was measured for each seed. For each replica, the germination Index (GI%) was calculated using the following formula:
GI % = N i L i N b i L b i 100
where N is the number of germinated seeds, Li the root length of the i-th germinated seed (mm), Nb the number of germinated seeds for the blank, and Lbi the root length of the i-th germinated seed for the blank (mm). GI% were averaged over the three replicas.
Data regression and IC50 estimation were performed using the R statistical software v.4.2.2 [32] with the drc package v.3.0.1 [33]. Dose–response curves were fitted using the log-logistic model or the Brain-Cousens modification in the case of hormesis.

2.4. Modelling of Biogas Production Curve

All biogas production curves in this study show two well distinct stages: a first, mainly acidogenic, hydrogen-producing phase, and a subsequent fully methanogenic phase. Cumulative biogas volumes V versus digestion times t were thus described by a double modified Gompertz model [34]:
V t = A 1 exp exp R 1 exp 1 A 1 λ 1 t + 1 + A exp exp R exp 1 A λ t + 1
where λ1, R1, and A1 are lag time (d), maximum volumetric production rate (mL d−1), and asymptotic cumulative volume (mL) for the hydrogen production stage; and λ, R, and A are lag time (d), maximum volumetric production rate (mL d−1), and asymptotic cumulative volume (mL) for the methane production stage. The meaning of the parameters in the equation (for λ1 << λ) is further elucidated in Figure 1.
Data regression was performed using the R statistical software v.4.2.2 [32] with the nlstools package v.2.0.0 [35].

3. Results

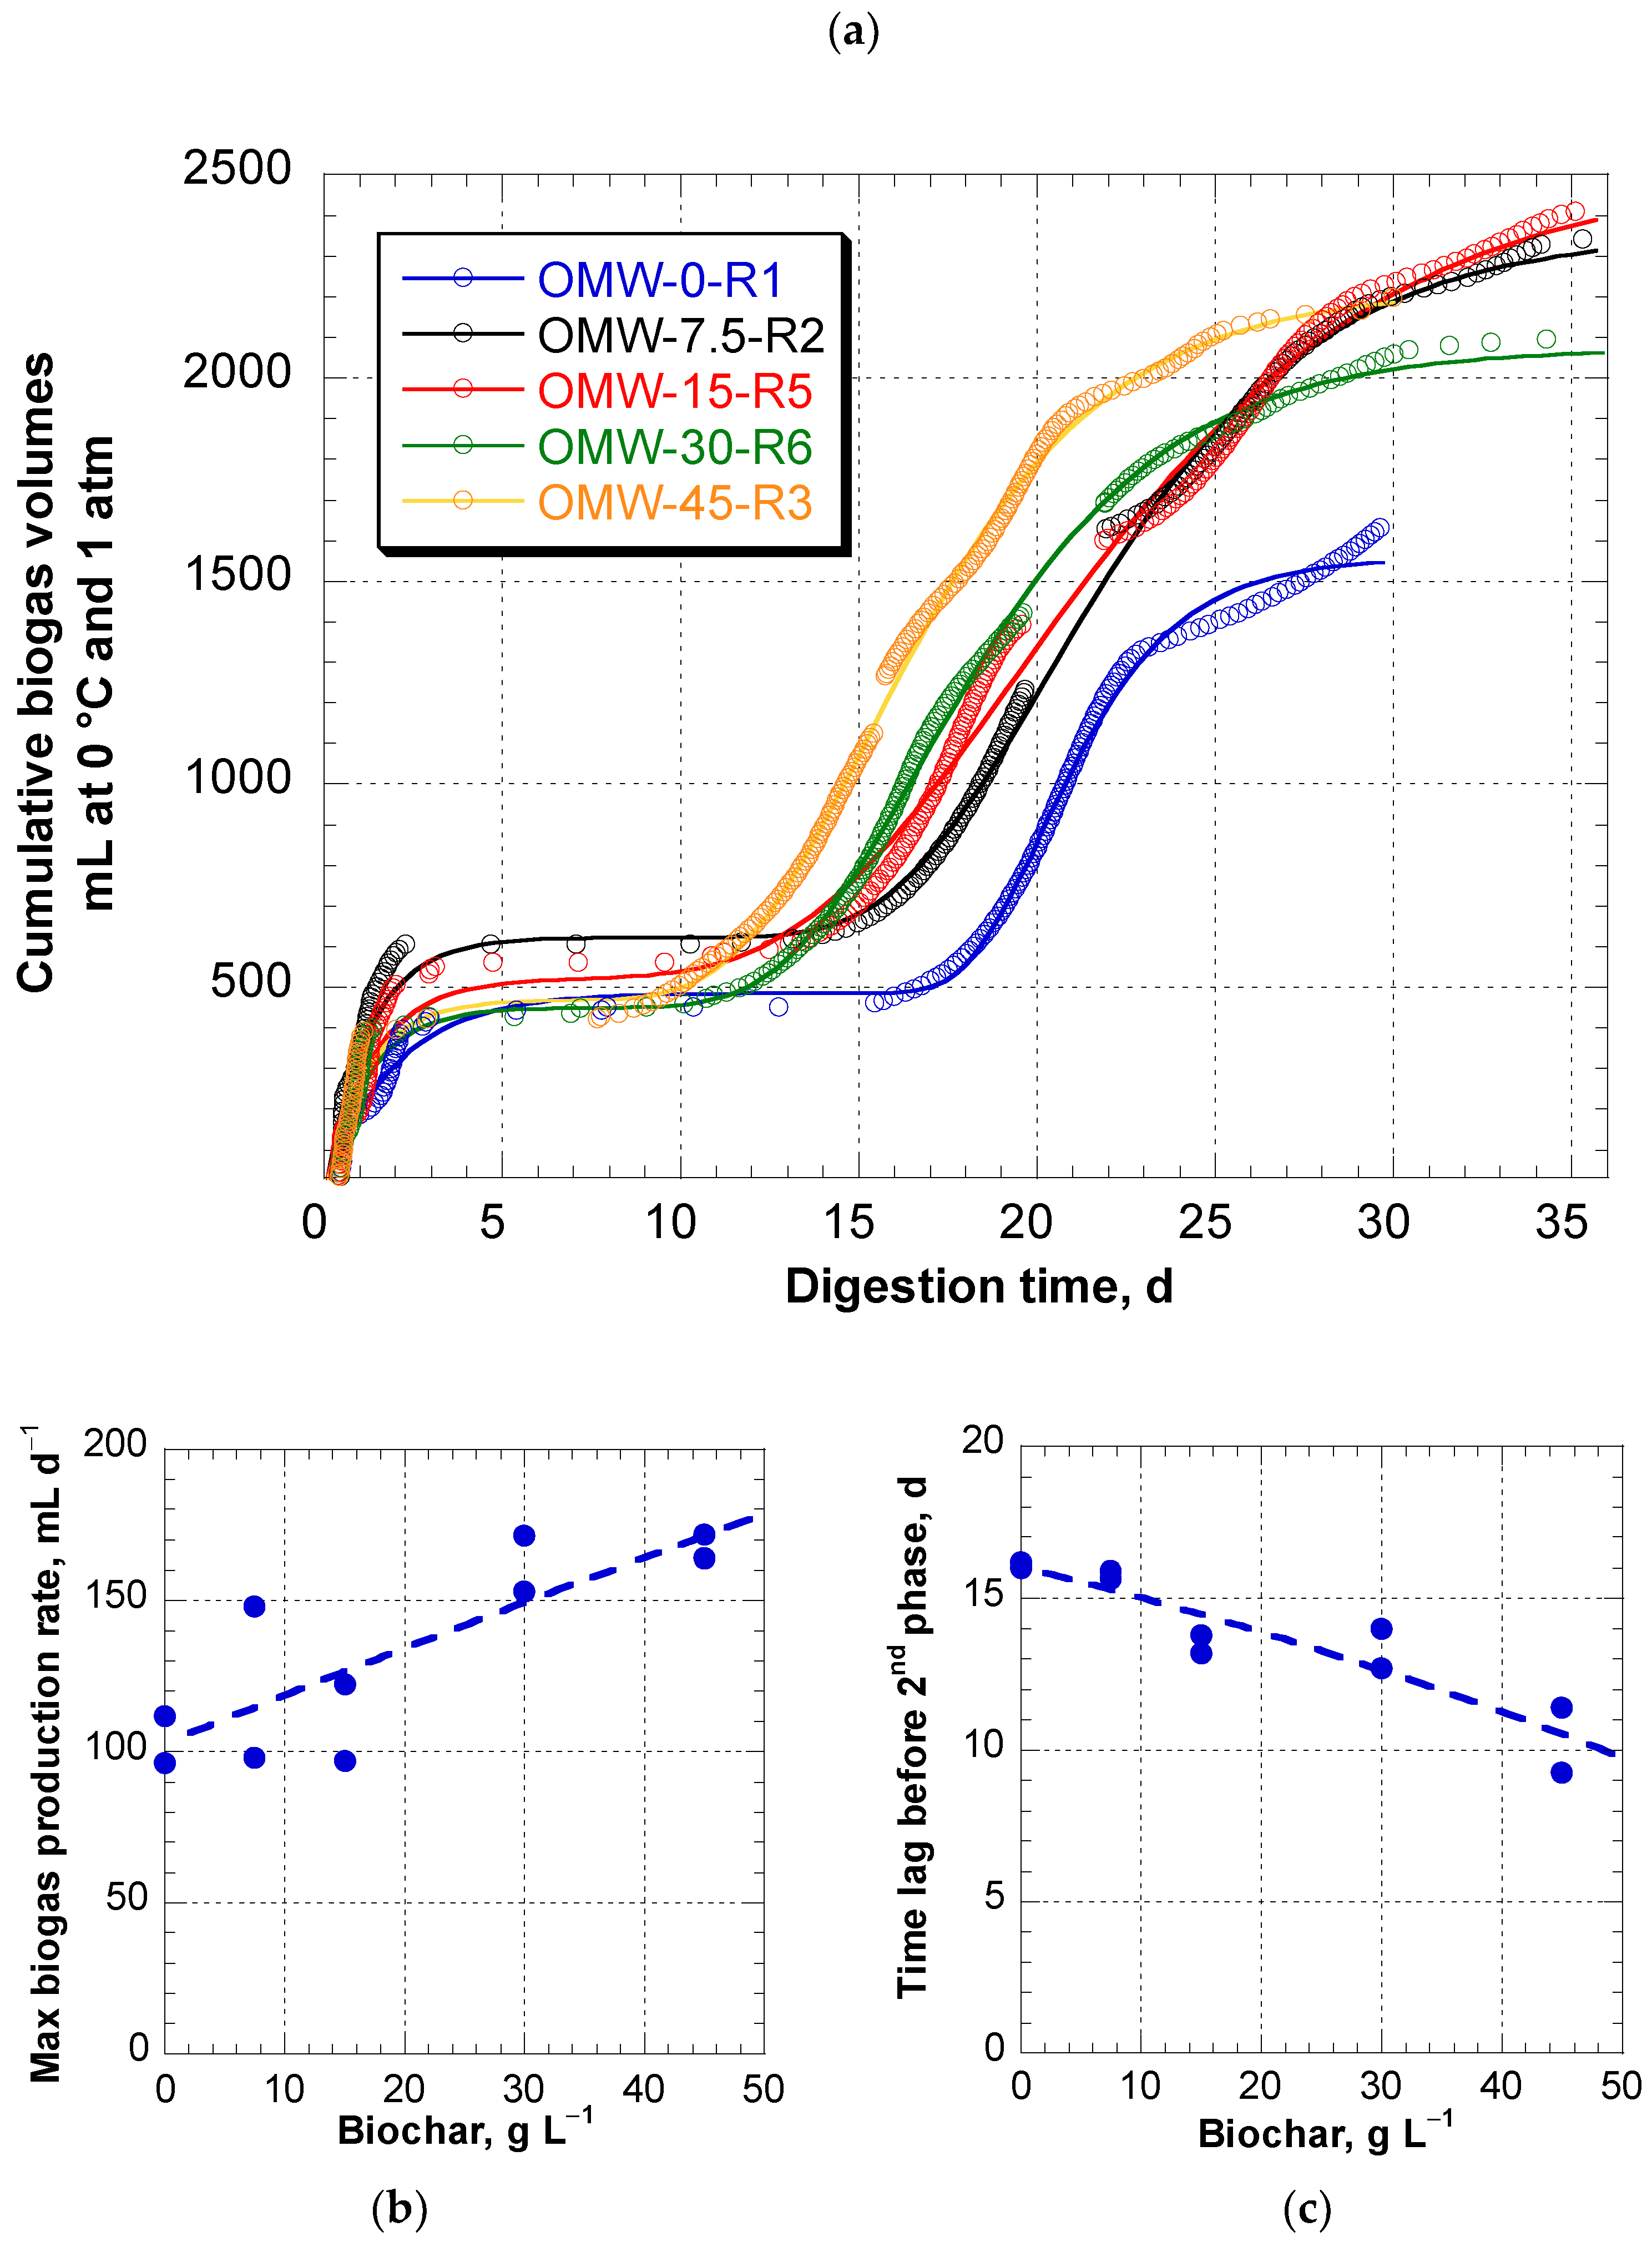
3.1. Time Course of Biogas Production

Online recorded data of biogas production from digesters with different amounts of biochar (0–45 g L−1) (Figure 2) showed a sequence of well-separated phases. Each phase was characterized as follows.
After a short lag time (less than 0.5 days), an initial biogas production occurred in four days (~400–600 mL at 0 °C and 1 atm). The average initial biogas percentages by volume were 42.7% (±5.6) of H2, 1.2% (±0.5) of CH4, and CO2 to balance (see Table S2 of Supplementary Materials for raw data on biogas composition at different digestion times). Taking into account the initial presence of nitrogen in the digester dead volume, the hydrogen partial pressure reached a value of 0.2–0.3 atm. The length of the first phase and the extent of biogas production were not affected by biochar presence and concentration.
At the end of the first biogas production, the pH of the digestion mixture was checked. For the batch without biochar, the pH value had dropped from neutrality to 5–5.5. A neutral pH was immediately restored by adding 1 M NaOH. No further pH correction was necessary. No pH adjustment was necessary for the whole length of digestion with biochar.
A second lag time that lasted for several days followed, without any significant biogas production. The duration of the second lag time decreased with increasing biochar concentration. The biogas production became again appreciable 10–16 days after inoculation, when the cumulative volume of biogas started to increase exponentially. Finally, the biogas production rate declined again. During this phase, the produced biogas consisted mainly of CH4 (77.6 ± 8.1%) and CO2 to balance.
Online recording of the cumulative volumes stopped at the 32nd day due to a failure of signal connection, but the data were sufficient to evaluate lag phases and maximum biogas production rates. Sample fits of biogas production data with the double Gompertz model (Equation (2)) are shown in Figure 2a. While the estimates of λ1 and R1 do not show a trend with biochar concentration (see Table S1 in Supplementary Materials), λ and R values do, as shown in Figure 2b,c. With increasing biochar concentrations, the lag time before the start of the second phase was reduced from ~16 down to ~10 days (Spearman correlation coefficient confirms negative association with ρ = −0.935, p-value = 7.0 × 10⁻⁵), while the maximum biogas production rate increased from ~100 up to ~170 mL d−1 (positive association with Spearman’s ρ = 0.812, p-value = 0.0043).

3.2. Overall Biogas Production

Biogas production continued after the 32nd day at low rates. Tests were stopped at the 36th day when the final cumulative volume reading on the device display was no more than 1–2% of the value at the 32nd day. These values were considered as the ultimate biogas production. The ultimate cumulative volume approached an average value of 2100 ± 300 mL at 0 °C and 1 atm.
Via offline GC–TCD analyses of biogas collected in gas sampling bags (raw data are reported in Table S2 of Supplementary Materials), accurate CH4 and H2 volumes (reported as L of gas at 0 °C and 1 atm per L of digestion mixture) were obtained for each biochar concentration in duplicate (Table 2).
From the theoretical biogas yields per gram of digested COD (0.35 L CH4/g COD and 1.4 L H2/g COD at 0 °C and 1 atm) and from the measured cumulative volumes (Table 2), the overall COD removal for biogas production was calculated as follows:
COD   removal ,   g   L 1 = cumulative   CH 4   volume , L   L 1 0.35 + cumulative   H 2   volume ,   L   L 1 1.4
The concentration of biochar has no significant effect on the cumulative volumes of methane and hydrogen (MANOVA test, p = 0.4724). Average values were 2.62 ± 0.27 L of CH4 and 0.38 ± 0.09 L of H2 per L of digestion mixture, corresponding to an estimated COD removal for biogas production of 7.74 ± 0.81 g L−1. Taking into account OMW dilution in the digestion mixture, a 78% removal of the 9.95 g COD L−1 of added OMW was attained.
Biogas yields cannot be compared directly with values reported in the literature, since the latter are usually measured in digestion tests in which high hydrogen partial pressures are not achieved. However, a comparison can be made in terms of COD removal for biogas production. The CH4 yield of 0.26 L/g COD was measured in AD batch tests with untreated OMW by [15]. Assuming that 0.35 L of CH4 is produced per gram of digested COD, the yield corresponds to a 74% removal of added COD, in good agreement with our estimate.

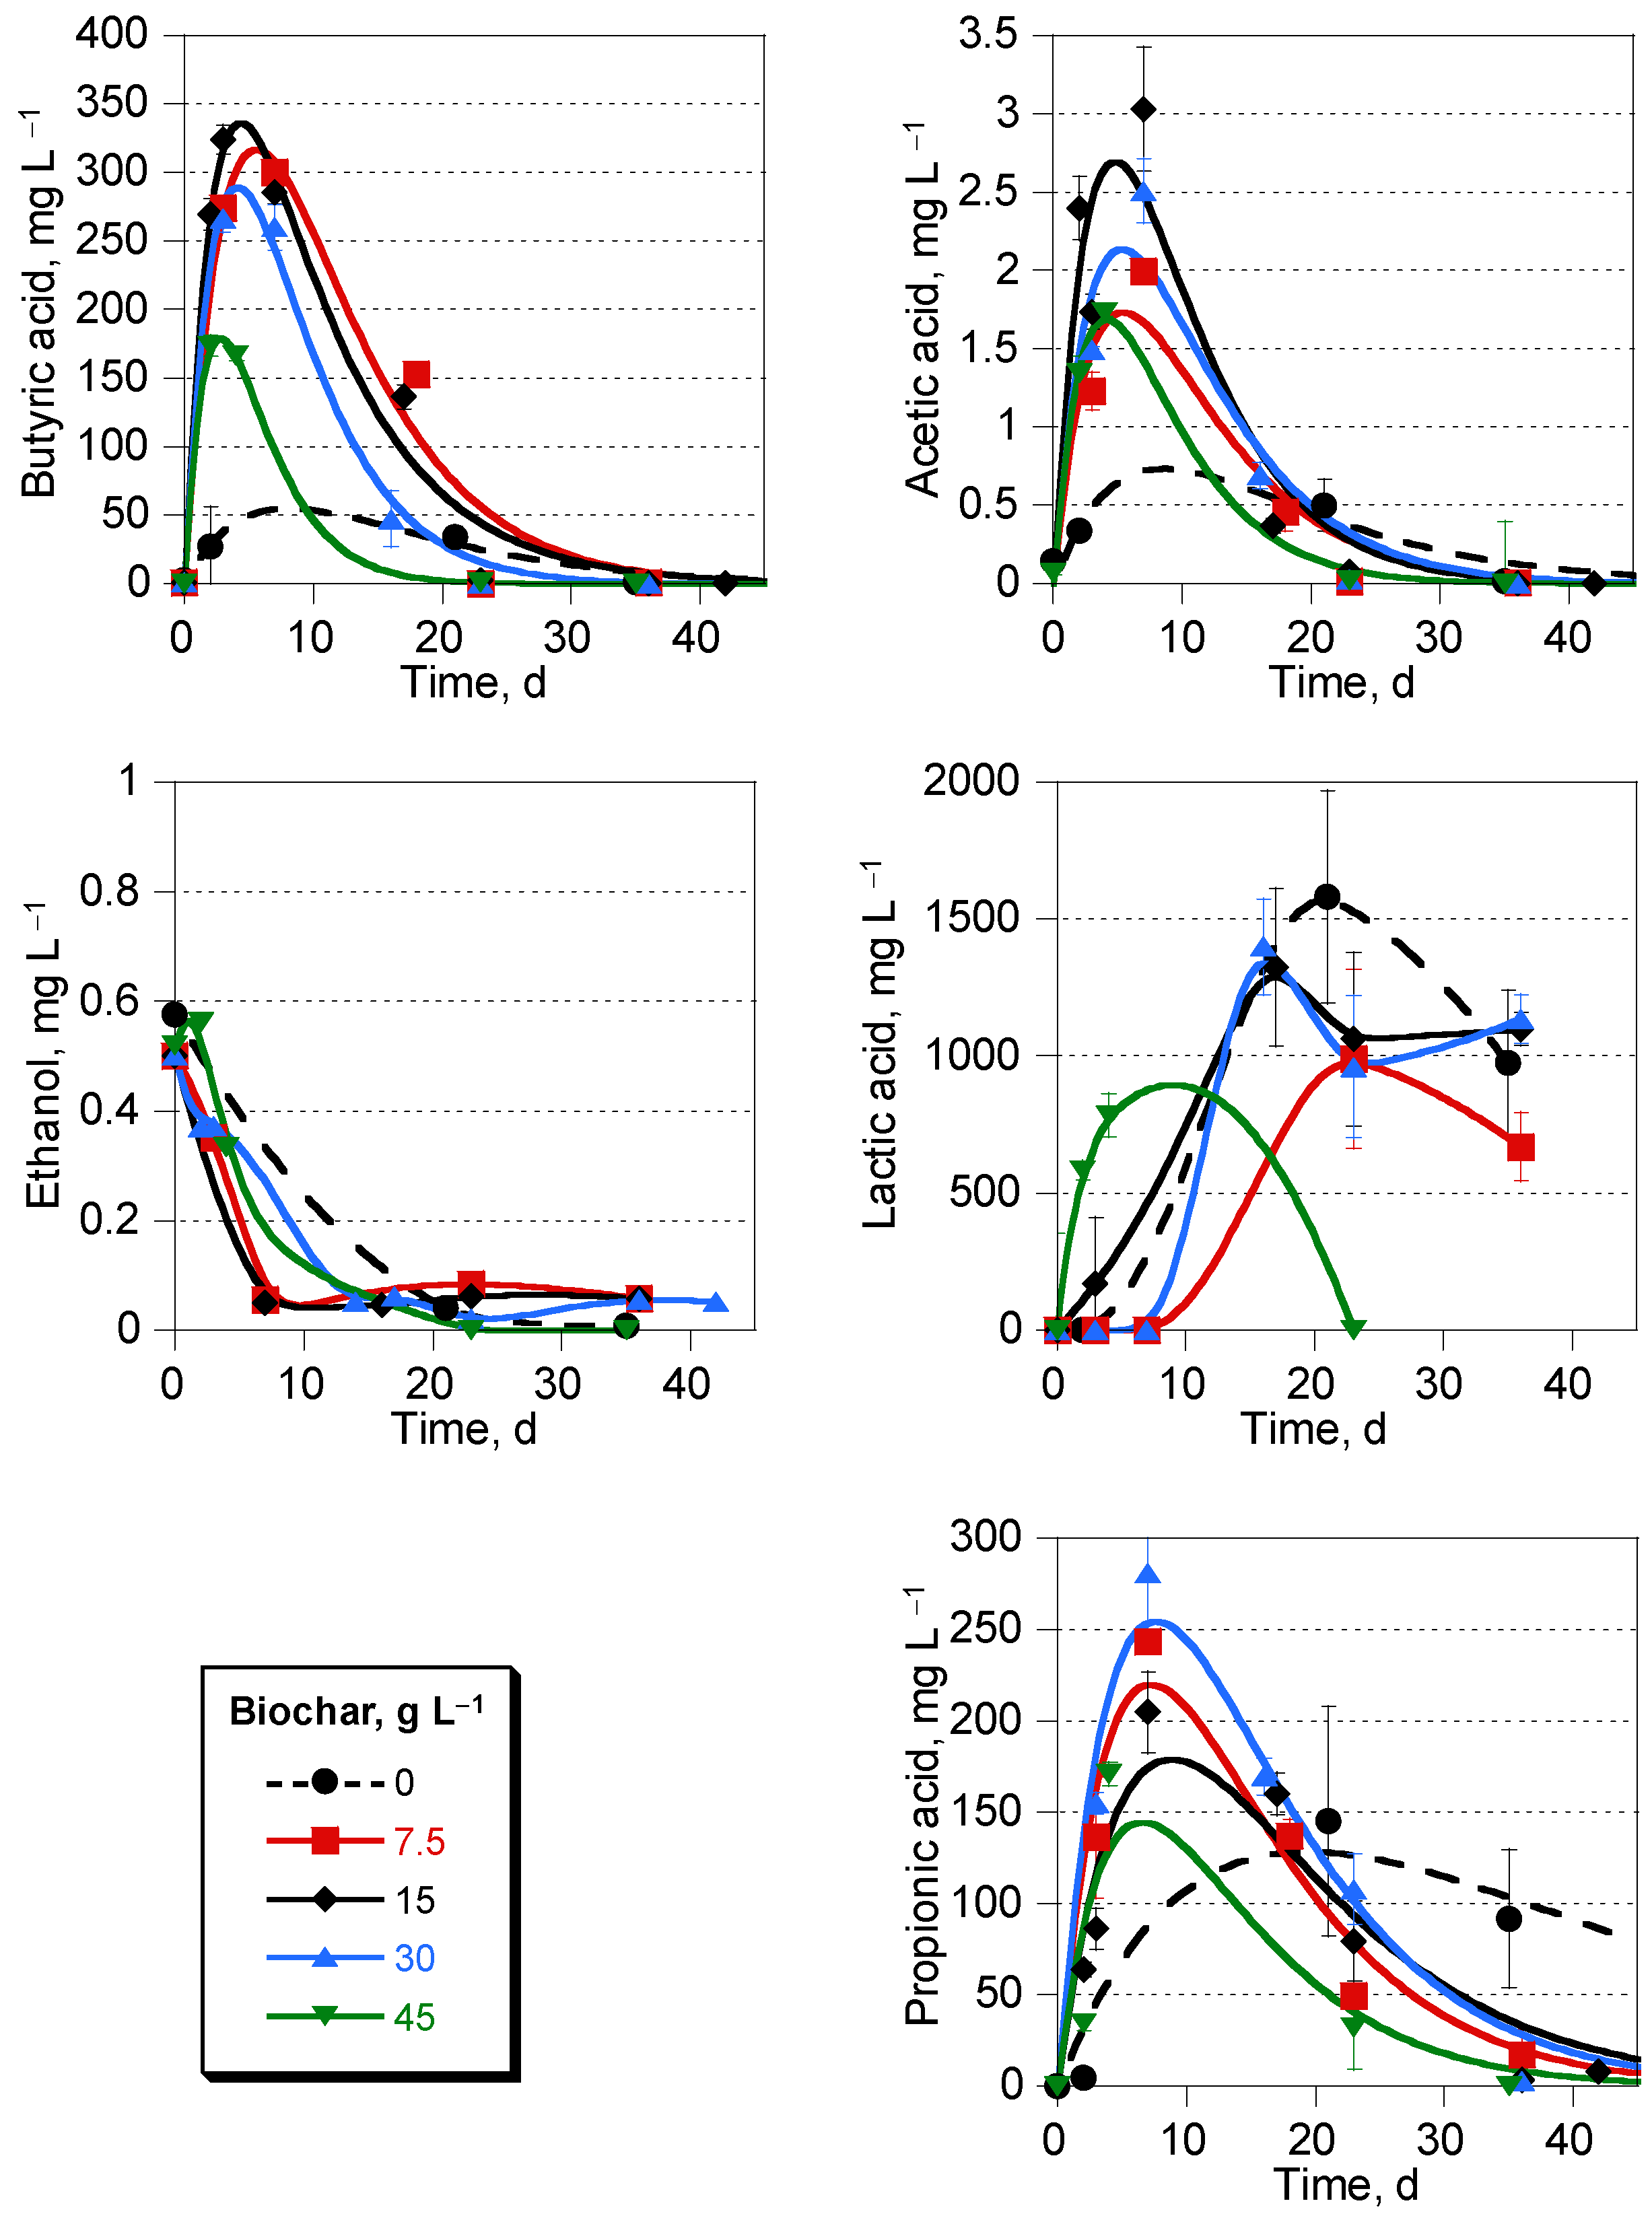
3.3. Volatile Acid Trends during Digestion

Acetate, propionate, butyrate and lactate were detected by a GC–FID analysis of digestate liquid fractions. A small amount of ethanol (~6 mg L−1) was already present in raw OMW and was only consumed as a substrate during digestion in all the digesters (Figure 3).
Only a limited number of samples were drawn from the digestion mixture to minimize disturbances to the process. Nevertheless, some trends could be evidenced. Radically different soluble product distributions were obtained with and without biochar.
In the digesters without biochar, an increase in the acetate and butyrate concentrations stopped simultaneously with the first biogas production (after ~4 days). During the second lag time, propionate and lactate were produced without biogas production. Concentrations of all VFAs declined only after the start of the second biogas burst (~16 days).
In all the digesters with biochar, different and somewhat unexpected VFA time courses were found. Higher concentrations of acetate, propionate and butyrate were initially attained, with production lasting even further at the end of the first biogas production. VFA degradation started already during the second lag time without biogas production. The rate of VFA degradation seemingly increased with biochar concentration. Even though lactate production delayed with respect to the other VFAs, degradation started prior to the second biogas burst and the degradation rate increased with biochar concentration, as well.

3.4. Digestate Characterization

The initial values of sCOD and BOD5 in the digestion mixture soluble fraction were 9170 mg L−1 and 6700 mg L−1, respectively. Residual values of sCOD and BOD5 were also measured at end of digestion on the supernatant after 24 h sedimentation of suspended solids. Biochar improved oxygen demand removal. The residual sCOD and BOD5 of digestates followed the same parallel, approximately linear, decreasing trend with increasing biochar concentration (Figure 4). With biochar concentrations ranging from 0 to 45 g L−1, sCOD removal increased from 66% to 84%, whereas BOD5 removal increased from 60% to 89%.
The amount of extractable TPCs in the undigested mixture was about 0.36 g L−1. Upon digestion in the absence of biochar, the TPC value halved, whereas 80–95% removals were attained in the presence of biochar.
Seed germination tests were also performed, with the soluble fraction of the digestates collected at the end of the runs. For comparison, the phytotoxicity of an undigested sample (10% OMW in distilled water) was tested, as well. Dose–response curves were obtained by plotting percent germination indices (GI%) against several dilutions of undigested and digested samples in distilled water (Figure 5).
The digested mixture was less phytotoxic than the undigested OMW (IC50 95% confidence intervals are 0.2−1.5 and 7.2−10.9 for undigested and digested mixture, respectively). The presence of biochar during digestion further reduced the residual toxicity (IC50 95% confidence interval is 16.9−23.1 for the digestate with 45 g L−1 of biochar). A hormesis zone (for less than 10% of digested sample in distilled water) is also evident at a 45 g L−1 biochar concentration.

4. Discussion

All biogas data showed a sequence of two production phases that were well-separated by a long lag time, namely a first phase with a prevalently fermentative-acidogenic metabolism with scarce methanogenesis and a second phase with a well-developed anaerobic food chain.
The initial biogas production is mainly due to fermentative bacteria that consume the organic substrate and produce H2, CO2 and VFAs. The low inoculum/substrate ratio and the presence of phenolic inhibitors delay the growth of hydrogenotroph methanogens and homoacetogens, and lead to H2 accumulation. The rapid attainment of a H2 partial pressure of 0.2–0.3 atm, which is inhibitory of proton-reducing pathways [36], arrests biogas production because the surplus-reducing equivalents could not be any longer disposed as H2. Fermentation continued without biogas production, but differently in the digesters with biochar compared to those without.
In the digesters without biochar, the inhibition of H2 production also switched the VFA production from acetate and butyrate to propionate and lactate. pH was then adjusted to neutrality to favor the growth of methanogens. However, it was only 16 days after inoculation that the growth of acetogens and hydrogenotrophic methanogens was signaled by the decrease in VFA concentrations and the zeroing of H2 partial pressure with the simultaneous production of CH4. In the digesters with biochar, the production of acetate and butyrate persisted even after the halt of H2 accumulation, and the production of propionate and lactate started earlier. Higher overall VFA concentrations were attained without the necessity of pH adjustments thanks to the buffering capacity of biochar [22]. In all the digesters with biochar, the VFA degradation took place also during the intermediate lag time. Seemingly, the growth of syntrophic acetogens was stimulated by the presence of biochar. Indeed, the rate of the VFA degradation increased with increasing biochar concentration. Several studies have reported that the biochar addition simultaneously enhances the production and degradation of the intermediate VFA products [24,37,38]. The final soluble reduced product generated by acetogenic activity during the lag phase could not be identified by GC–FID analyses, but it could be formate, which is known to go undetected by flame ionization detectors.
Biogas production became again appreciable when the exponential growth of methanogenic bacteria started with the associated production of CH4 and CO2. Even in the case of methanogens, the biochar had a beneficial effect on the kinetics of methanogen growth, as it could be evaluated by the apparent reduction in lag time and increase in the maximum biogas production rate with increasing biochar concentration. Both of these effects have been associated with biochar addition by several authors [24,37,38,39].
The final yields of hydrogen and methane remain unchanged, independent of the concentration of biochar in the digestion medium. Biochar addition seemed to affect only the kinetics of biogas production but not its maximum yields, as if only a fixed fraction of COD could be degraded in anaerobic conditions.
On the contrary, biochar addition did affect oxygen demand abatement, as demonstrated by COD and BOD5 measurements on the soluble fraction of the digestate that showed a decrease in value with the increase in biochar concentration. Further COD abatement (up to an overall ~84%) should be attributed to the non-selective adsorption of soluble organic compounds by biochar. The adsorption could not affect the maximum digestible fraction of COD because it was either not adsorbed by biochar or it could be accessed by bacteria on the biochar surface.
Residual soluble COD can be further degraded aerobically, as shown by BOD5 values. The average BOD5/COD ratio of digestates was 0.62, which is optimal for the fully aerobic biodegradation of COD [31].
The extractable TPC was only halved in the absence of biochar. Higher removals were obtained in the presence of biochar, probably due to the adsorption of polyphenols. Indeed, a batch adsorption test in the absence of fermentation showed a 70% removal of TPC in 20 days with 15 g L−1 of PB [40]. The results confirmed that PB is a good sorbent for phenolic compounds, in agreement with literature data showing the high efficiency of biochar in phenol removal from synthetic and real effluents [30,41,42,43].
The addition of biochar also further decreased the phytotoxicity of the liquid fraction of digestates, as evidenced by germination tests. Again, the beneficial effect could be due to the adsorption of inhibiting compounds.
Additional COD removal by biochar increases the suitability of digested liquids for an aerobic treatment. BOD5/COD ratios are in the optimal range for full biodegradation. The reduced phytotoxicity valorizes digested liquids as soil conditioners, combining irrigation and fertilization [44]. Further research is necessary to evaluate the suitability of using the solid fraction of digestate (consisting of microbial biomass and biochar) as a soil conditioner.
In brief, the mechanisms putatively involved in AD stimulation by biochar are as follows:
  • Adsorption of polyphenolic compounds. It has been hypothesized that adsorption by biochar is involved in the attenuation of the phenol inhibition of methanogenesis [45].
  • Facilitation of symbiosis. The symbiotic activity of acetogens and methanogens is eased by the formation of biofilm on the biochar surface [23,24,25]. DIET, in the presence of a conductive material such as biochar, allows the exchange of electrons between species without H2 production.
The further physicochemical characterization of biochar and the microbiological classification of the methanogenic consortium are necessary to evaluate the relative weights of the different mechanisms in the AD of OMW.
In summary, the addition of biochar is expected to have beneficial effects on the management of OMW anaerobic digestion in process bioreactors. Indeed, the reduced inhibition of methanogen growth allows for higher organic loading rates in the process digester. The stimulation of syntrophic acetogens will prevent VFA build-up in the case of organic overload. Furthermore, the biochar buffering capacity could ease pH control. A reduction in the organic load and phytotoxicity of OMW digestates is also beneficial from the perspective of further treatments or agricultural reuse.

5. Conclusions

Biochar addition improved the efficiency of the anaerobic digestion of OMW by stimulating methanogenesis, enhancing COD removal, and reducing phytotoxicity. Adsorption by biochar did not decrease the bioavailability of degradable COD and maintained the overall biogas production.
Therefore, AD with biochar addition should be considered for the development of a sustainable treatment process of OMW, which would allow both energy recovery and the agricultural reuse of the waste.

Supplementary Materials

The following supporting information can be downloaded at: https://www.mdpi.com/article/10.3390/en16073259/s1, Table S1: Estimated parameters of the double Gompertz equation (Equation (2)); Table S2: Gas compositions and cumulative volumes at 25 °C and 1 atm of collected biogas.

Author Contributions

Conceptualization, G.T., M.A.R. and M.T.; methodology, G.T. and M.A.R.; formal analysis, G.T.; investigation, L.M. and G.D.R.S.; resources, G.T. and M.A.R.; writing—original draft preparation, L.M. and G.D.R.S.; writing—review and editing, G.T., M.A.R. and M.T.; supervision, G.T. and M.A.R.; project administration, M.A.R.; funding acquisition, M.A.R. All authors have read and agreed to the published version of the manuscript.

Funding

This research was part of the project “Mitigation of the environmental impact of olive mill waste water through sustainable bioprocess with energy recovery”, funded by the Università degli Studi di Napoli Federico II, Finanziamento Ricerca di Ateneo 2018.

Data Availability Statement

Data sharing is not applicable to this article.

Conflicts of Interest

The authors declare no conflict of interest.

References

  1. Magdich, S.; Ahmed, C.B.; Jarboui, R.; Rouina, B.B.; Boukhris, M.; Ammar, E. Dose and Frequency Dependent Effects of Olive Mill Wastewater Treatment on the Chemical and Microbial Properties of Soil. Chemosphere 2013, 93, 1896–1903. [Google Scholar] [CrossRef] [PubMed]
  2. McNamara, C.J.; Anastasiou, C.C.; O’Flaherty, V.; Mitchell, R. Bioremediation of Olive Mill Wastewater. Int. Biodeterior. Biodegrad. 2008, 61, 127–134. [Google Scholar] [CrossRef]
  3. Paredes, C.; Cegarra, J.; Roig, A.; Sanchez-Monedero, M.A.; Bernal, M.P. Characterization of Olive Mill Wastewater (Alpechin) and Its Sludge for Agricultural Purposes. Bioresour. Technol. 1999, 67, 111–115. [Google Scholar] [CrossRef]
  4. Ioannou-Ttofa, L.; Michael-Kordatou, I.; Fattas, S.C.; Eusebio, A.; Ribeiro, B.; Rusan, M.; Amer, A.R.B.; Zuraiqi, S.; Waismand, M.; Linder, C.; et al. Treatment Efficiency and Economic Feasibility of Biological Oxidation, Membrane Filtration and Separation Processes, and Advanced Oxidation for the Purification and Valorization of Olive Mill Wastewater. Water Res. 2017, 114, 1–13. [Google Scholar] [CrossRef] [PubMed]
  5. Morillo, J.A.; Antizar-Ladislao, B.; Monteoliva-Sánchez, M.; Ramos-Cormenzana, A.; Russell, N.J. Bioremediation and Biovalorisation of Olive-Mill Wastes. Appl. Microbiol. Biotechnol. 2009, 82, 25–39. [Google Scholar] [CrossRef]
  6. Greco, G.; Colarieti, M.L.; Toscano, G.; Iamarino, G.; Rao, M.A.; Gianfreda, L. Mitigation of Olive Mill Wastewater Toxicity. J. Agric. Food Chem. 2006, 54, 6776–6782. [Google Scholar] [CrossRef]
  7. Hamdi, M. Toxicity and Biodegradability of Olive Mill Wastewaters in Batch Anaerobic Digestion. Appl. Biochem. Biotechnol. 1992, 37, 155–163. [Google Scholar] [CrossRef]
  8. Gonçalves, M.R.; Costa, J.C.; Pereira, M.A.; Abreu, A.A.; Alves, M.M. On the Independence of Hydrogen Production from Methanogenic Suppressor in Olive Mill Wastewater. Int. J. Hydrog. Energy 2014, 39, 6402–6406. [Google Scholar] [CrossRef] [Green Version]
  9. Calabrò, P.S.; Fòlino, A.; Tamburino, V.; Zappia, G.; Zema, D.A. Increasing the Tolerance to Polyphenols of the Anaerobic Digestion of Olive Wastewater through Microbial Adaptation. Biosyst. Eng. 2018, 172, 19–28. [Google Scholar] [CrossRef]
  10. Borja, R.; Alba, J.; Banks, C.J. Impact of the Main Phenolic Compounds of Olive Mill Wastewater (OMW) on the Kinetics of Acetoclastic Methanogenesis. Process Biochem. 1997, 32, 121–133. [Google Scholar] [CrossRef]
  11. Tabatabaei, M.; Rahim, R.A.; Abdullah, N.; Wright, A.-D.G.; Shirai, Y.; Sakai, K.; Sulaiman, A.; Hassan, M.A. Importance of the Methanogenic Archaea Populations in Anaerobic Wastewater Treatments. Process Biochem. 2010, 45, 1214–1225. [Google Scholar] [CrossRef]
  12. Gunay, A.; Karadag, D. Recent Developments in the Anaerobic Digestion of Olive Mill Effluents. Process Biochem. 2015, 50, 1893–1903. [Google Scholar] [CrossRef]
  13. Gonçalves, M.R.; Freitas, P.; Marques, I.P. Bioenergy Recovery from Olive Mill Effluent in a Hybrid Reactor. Biomass Bioenergy 2012, 39, 253–260. [Google Scholar] [CrossRef] [Green Version]
  14. González-González, A.; Cuadros, F. Effect of Aerobic Pretreatment on Anaerobic Digestion of Olive Mill Wastewater (OMWW): An Ecoefficient Treatment. Food Bioprod. Process. 2015, 95, 339–345. [Google Scholar] [CrossRef]
  15. Borja, R.; Martín, A.; Alonso, V.; García, I.; Banks, C.J. Influence of Different Aerobic Pretreatments on the Kinetics of Anaerobic Digestion of Olive Mill Wastewater. Water Res 1995, 29, 489–495. [Google Scholar] [CrossRef]
  16. Azbar, N.; Keskin, T.; Yuruyen, A. Enhancement of Biogas Production from Olive Mill Effluent (OME) by Co-Digestion. Biomass Bioenergy 2008, 32, 1195–1201. [Google Scholar] [CrossRef]
  17. Mantzavinos, D.; Kalogerakis, N. Treatment of Olive Mill Effluents: Part I. Organic Matter Degradation by Chemical and Biological Processes–An Overview. Environ. Int. 2005, 31, 289–295. [Google Scholar] [CrossRef]
  18. Ye, M.; Liu, J.; Ma, C.; Li, Y.-Y.; Zou, L.; Qian, G.; Xu, Z.P. Improving the Stability and Efficiency of Anaerobic Digestion of Food Waste Using Additives: A Critical Review. J. Clean. Prod. 2018, 192, 316–326. [Google Scholar] [CrossRef] [Green Version]
  19. Lehmann, J.; Joseph, S. Biochar for Environmental Management: Science, Technology and Implementation; Routledge: London, UK; Routledge: New York, NY, USA, 2015; ISBN 978-1-134-48953-4. [Google Scholar]
  20. Zhang, J.; Zhao, W.; Zhang, H.; Wang, Z.; Fan, C.; Zang, L. Recent Achievements in Enhancing Anaerobic Digestion with Carbon-Based Functional Materials. Bioresour. Technol. 2018, 266, 555–567. [Google Scholar] [CrossRef]
  21. Fagbohungbe, M.O.; Herbert, B.M.J.; Hurst, L.; Ibeto, C.N.; Li, H.; Usmani, S.Q.; Semple, K.T. The Challenges of Anaerobic Digestion and the Role of Biochar in Optimizing Anaerobic Digestion. Waste Manag. 2017, 61, 236–249. [Google Scholar] [CrossRef] [Green Version]
  22. Wang, D.; Ai, J.; Shen, F.; Yang, G.; Zhang, Y.; Deng, S.; Zhang, J.; Zeng, Y.; Song, C. Improving Anaerobic Digestion of Easy-Acidification Substrates by Promoting Buffering Capacity Using Biochar Derived from Vermicompost. Bioresour. Technol. 2017, 227, 286–296. [Google Scholar] [CrossRef] [PubMed]
  23. Chen, S.; Rotaru, A.-E.; Shrestha, P.M.; Malvankar, N.S.; Liu, F.; Fan, W.; Nevin, K.P.; Lovley, D.R. Promoting Interspecies Electron Transfer with Biochar. Sci. Rep. 2014, 4, 5019. [Google Scholar] [CrossRef] [PubMed] [Green Version]
  24. Luo, C.; Lü, F.; Shao, L.; He, P. Application of Eco-Compatible Biochar in Anaerobic Digestion to Relieve Acid Stress and Promote the Selective Colonization of Functional Microbes. Water Res. 2015, 68, 710–718. [Google Scholar] [CrossRef] [PubMed]
  25. Zhao, Z.; Zhang, Y.; Holmes, D.E.; Dang, Y.; Woodard, T.L.; Nevin, K.P.; Lovley, D.R. Potential Enhancement of Direct Interspecies Electron Transfer for Syntrophic Metabolism of Propionate and Butyrate with Biochar in Up-Flow Anaerobic Sludge Blanket Reactors. Bioresour. Technol. 2016, 209, 148–156. [Google Scholar] [CrossRef] [PubMed] [Green Version]
  26. Holliger, C.; Alves, M.; Andrade, D.; Angelidaki, I.; Astals, S.; Baier, U.; Bougrier, C.; Buffière, P.; Carballa, M.; de Wilde, V.; et al. Towards a Standardization of Biomethane Potential Tests. Water Sci. Technol. 2016, 74, 2515–2522. [Google Scholar] [CrossRef]
  27. APAT. Metodi Analitici Delle Acque; Agenzia per la Protezione dell’Ambiente e per i Servizi Tecnici (APAT): Roma, Italy, 2003; ISBN 88-448-0083-7. [Google Scholar]
  28. De Pasquale, C.; Marsala, V.; Berns, A.E.; Valagussa, M.; Pozzi, A.; Alonzo, G.; Conte, P. Fast Field Cycling NMR Relaxometry Characterization of Biochars Obtained from an Industrial Thermochemical Process. J. Soils Sediments 2012, 12, 1211–1221. [Google Scholar] [CrossRef]
  29. Wiedner, K.; Rumpel, C.; Steiner, C.; Pozzi, A.; Maas, R.; Glaser, B. Chemical Evaluation of Chars Produced by Thermochemical Conversion (Gasification, Pyrolysis and Hydrothermal Carbonization) of Agro-Industrial Biomass on a Commercial Scale. Biomass Bioenergy 2013, 59, 264–278. [Google Scholar] [CrossRef]
  30. Rao, M.A.; Simeone, G.D.R.; Scelza, R.; Conte, P. Biochar Based Remediation of Water and Soil Contaminated by Phenanthrene and Pentachlorophenol. Chemosphere 2017, 186, 193–201. [Google Scholar] [CrossRef]
  31. Tchobanoglous, G.; Burton, F.L.; Eddy, M.; Stensel, H.D. Wastewater Engineering: Treatment and Reuse, 4th ed.; McGraw-Hill: New York, NY, USA, 2004; ISBN 0-07-124140-X. [Google Scholar]
  32. R Core Team. R: A Language and Environment for Statistical Computing; R Foundation for Statistical Computing: Vienna, Austria, 2022. [Google Scholar]
  33. Ritz, C.; Baty, F.; Streibig, J.C.; Gerhard, D. Dose-Response Analysis Using R. PLoS ONE 2015, 10, e0146021. [Google Scholar] [CrossRef] [Green Version]
  34. Ruggeri, B.; Tommasi, T.; Sanfilippo, S. BioH₂ & BioCH₄ Through Anaerobic Digestion. In Green Energy and Technology; Springer: London, UK, 2015; ISBN 978-1-4471-6431-9. [Google Scholar]
  35. Baty, F.; Ritz, C.; Charles, S.; Brutsche, M.; Flandrois, J.-P.; Delignette-Muller, M.-L. A Toolbox for Nonlinear Regression in R: The Package Nlstools. J. Stat. Softw. 2015, 66, 1–21. [Google Scholar] [CrossRef] [Green Version]
  36. Bundhoo, M.A.Z.; Mohee, R. Inhibition of Dark Fermentative Bio-Hydrogen Production: A Review. Int. J. Hydrog. Energy 2016, 41, 6713–6733. [Google Scholar] [CrossRef]
  37. Cai, J.; He, P.; Wang, Y.; Shao, L.; Lü, F. Effects and Optimization of the Use of Biochar in Anaerobic Digestion of Food Wastes. Waste Manag. Res. 2016, 34, 409–416. [Google Scholar] [CrossRef]
  38. Sunyoto, N.M.S.; Zhu, M.; Zhang, Z.; Zhang, D. Effect of Biochar Addition on Hydrogen and Methane Production in Two-Phase Anaerobic Digestion of Aqueous Carbohydrates Food Waste. Bioresour. Technol. 2016, 219, 29–36. [Google Scholar] [CrossRef]
  39. Wang, G.; Li, Q.; Gao, X.; Wang, X.C. Synergetic Promotion of Syntrophic Methane Production from Anaerobic Digestion of Complex Organic Wastes by Biochar: Performance and Associated Mechanisms. Bioresour. Technol. 2018, 250, 812–820. [Google Scholar] [CrossRef]
  40. Micoli, L.; Di Rauso Simeone, G.; Turco, M.; Toscano, G.; Rao, M.A. Anaerobic Digestion of Olive Miil Wastewater after Biochar Pretreatment. Chem. Eng. Trans. 2023. submitted. [Google Scholar]
  41. Braghiroli, F.L.; Bouafif, H.; Hamza, N.; Neculita, C.M.; Koubaa, A. Production, Characterization, and Potential of Activated Biochar as Adsorbent for Phenolic Compounds from Leachates in a Lumber Industry Site. Environ. Sci. Pollut. Res. 2018, 25, 26562–26575. [Google Scholar] [CrossRef]
  42. Kasozi, G.N.; Zimmerman, A.R.; Nkedi-Kizza, P.; Gao, B. Catechol and Humic Acid Sorption onto a Range of Laboratory-Produced Black Carbons (Biochars). Environ. Sci. Technol. 2010, 44, 6189–6195. [Google Scholar] [CrossRef]
  43. Komnitsas, K.A.; Zaharaki, D. Morphology of Modified Biochar and Its Potential for Phenol Removal from Aqueous Solutions. Front. Environ. Sci. 2016, 4, 26. [Google Scholar] [CrossRef] [Green Version]
  44. Di Rauso Simeone, G.; Cesarano, G.; Micoli, L.; Toscano, G.; Turco, M.; Rao, M.A. Chemical and Biochemical Changes in Soil after Biochar-Treated OMW Digestate Amendment. In Proceedings of the EGU General Assembly 2021, online, 19–30 April 2021. EGU21-10407. [Google Scholar]
  45. Wang, G.; Gao, X.; Li, Q.; Zhao, H.; Liu, Y.; Wang, X.C.; Chen, R. Redox-Based Electron Exchange Capacity of Biowaste-Derived Biochar Accelerates Syntrophic Phenol Oxidation for Methanogenesis via Direct Interspecies Electron Transfer. J. Hazard. Mater. 2020, 390, 121726. [Google Scholar] [CrossRef]
Figure 1. Biogas production in a double phase AD. Model parameters: λ1, λ lag times (d), R1, R maximum volumetric production rates (mL d−1), A1 and A asymptotic cumulative volumes (mL).
Energies 16 03259 g001
Figure 2. (a) Sample fits of biogas production data with the double Gompertz model (Equation (2)), only 50% of data points are shown for clarity; (b) R estimates versus biochar concentrations; (c) λ estimates versus biochar concentrations (dashed lines in (b,c) have been drawn to highlight the trends).
Energies 16 03259 g002
Figure 3. Time courses of butyrate, acetate, ethanol, lactate, and propionate concentrations during digestion with different amounts of biochar.
Energies 16 03259 g003
Figure 4. Residual sCOD and BOD5 (a) and residual TPCs (b) of digestate soluble fraction from digesters with different biochar concentrations.
Energies 16 03259 g004
Figure 5. Germination index versus several dilutions of the digestion mixture (as volume percentages in distilled water). Samples from an undigested control (ten-fold diluted OMW), a digestate without biochar, (0 g L−1) and digestates with 7.5, 15, 30, 45 g L−1 of biochar.
Energies 16 03259 g005
Table 1. Chemical characterization of olive mill wastewater and inoculum.
PropertiesOMWInoculum
pH5.00 ± 0.037.60 ± 0.01
EC, mS cm–19.30 ± 0.0412.9 ± 0.12
Dry matter, %8.0 ± 0.26.0 ± 0.1
Organic C, g kg−155.0 ± 0.822.1 ± 3.0
TKN, g N L−10.82 ± 0.012.5 ± 0.2
C/N67.48.7
tCOD a, g L98.6 ± 0.722.5 ± 0.7
sCOD b, g L−191.7 ± 0.51.15 ± 0.07
BOD5, g L−165.0 ± 0.52.0 ± 0.3
TPC, g L−13.3 ± 0.10.20 ± 0.02
a tCOD: total COD; b sCOD: soluble COD.
Table 2. Cumulative volumes of hydrogen and methane collected during each digestion test and estimated COD removal for biogas production. Cumulative volumes are reported as liters of gas at 0 °C and 1 atm per liter of digestate. H2 was collected only during the first phase, and CH4 was collected during both phases of biogas production. COD removal was calculated from Equation (3).
Batch LabelBiochar (g L−1)H2 (L L−1)CH4 (L L−1)COD Removal (g L−1)
OMW-0-R100.322.557.52
OMW-0-R200.282.607.64
OMW-7.5-R27.50.392.597.67
OMW-7.5-R37.50.572.848.53
OMW-15-R4150.383.159.27
OMW-15-R5150.442.567.62
OMW-30-R6300.352.597.66
OMW-30-R7300.272.126.23
OMW-45-R3450.362.788.19
OMW-45-R4450.412.397.12
Mean ± standard deviation0.38 ± 0.092.62 ± 0.277.74 ± 0.81
Disclaimer/Publisher’s Note: The statements, opinions and data contained in all publications are solely those of the individual author(s) and contributor(s) and not of MDPI and/or the editor(s). MDPI and/or the editor(s) disclaim responsibility for any injury to people or property resulting from any ideas, methods, instructions or products referred to in the content.

