Abstract
This article presents causal recipes leading to high and low energy consumption efficiency performances using fuzzy set Qualitative Comparative Analysis (fsQCA). The study found that several causal conditions are sufficient for high energy efficiency performance, including several fiscal and financial incentive policies, a highly educated population, many completed dwellings, and low GDP. The study also found that high inequality in completed dwellings and completed reconstructions, coupled with a low GDP and a low number of policies, lead to high energy consumption efficiency performance. In addition, the analysis showed slight differences between the yearly consistencies, suggesting that time effects are not a concern. On the other hand, a low education level, Gini coefficient, few completed dwellings and reconstructions, coupled with a low number of fiscal and financial policies, are the causal conditions leading to low energy consumption efficiency performance. The study’s results suggest that policymakers and stakeholders should consider a combination of several causal conditions when implementing energy efficiency policies. The study also highlights the need for policies focusing on education, fiscal and financial incentives, completed dwellings, and reconstructions to achieve high energy efficiency performance.
1. Introduction
Energy consumption plays a critical role in economic progress, but its excessive usage has led to greenhouse gas emissions contributing to climate change. Consequently, the European Union has implemented policies to improve energy efficiency to reduce energy consumption and Greenhouse gas (GHG) emissions. In the European Union (EU), households are the second major energy consumers, accounting for 26.3% of final energy consumption in 2019, followed by the transport sector (30.9%), industry (25.6%), services (13.7%), and agriculture and forestry (3.0%) (see Figure 1 below).
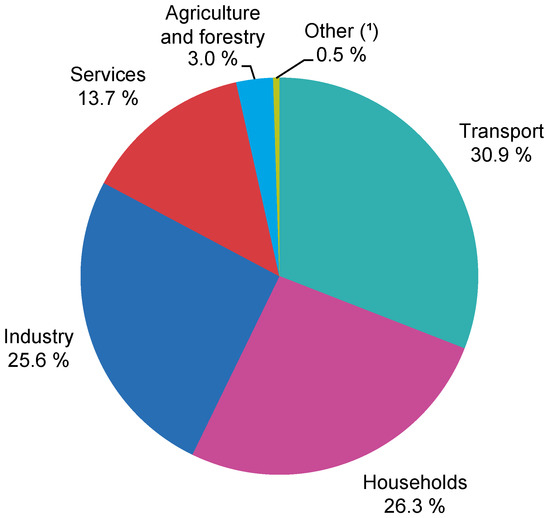
Figure 1.
Final energy consumption by sector in the EU in 2019 expressed as a percentage of the total and based on tons of oil equivalent. The authors created this figure using data from Eurostat [1]. Notes: (1) International aviation and maritime bunkers are excluded from the Transport category.
Furthermore, in the EU, final energy consumption from industry decreased by 13.0% overall between 2007 and 2019. The transport sector’s energy consumption reduction was much less significant, at 0.83%, while household energy consumption decreased by 1.43%. On the other hand, the services sector experienced a notable increase in final energy consumption during the analyzed period, with an overall rise of 2.18%, as shown in Figure 2 below.
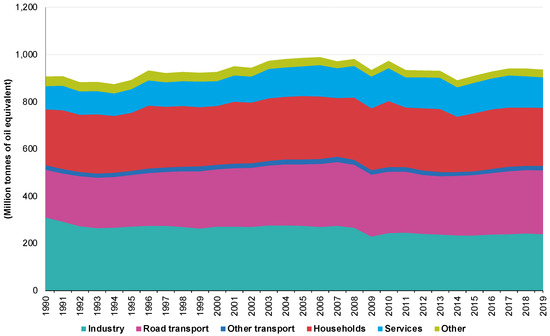
Figure 2.
Final energy consumption by sector in the EU from 1990 to 2019, measured in million tons of oil equivalent. The authors created this figure using data from Eurostat [1].
Despite a lack of significant increase in recent years, the household sector still contributes to a substantial portion of total energy consumption in the EU, accounting for 40% of the total. Moreover, this sector is also responsible for 1/3 of GHG emissions and 36% of CO2 emissions, which contribute to climate change. Energy consumption from the residential sector is the primary contributor to this issue. As Palma et al. [2] noted, various factors influence energy consumption in this sector, making it a complex issue.
Compared to other sectors, the residential sector has made significant progress in energy efficiency thanks to implementing various EU policies. These policies aim to reduce energy consumption and mitigate climate change through cost-effective energy efficiency measures. One such measure is the energy performance guideline for buildings, which includes using energy performance certificates (EPCs) to analyze the energy performance of residential buildings. This initiative has been studied extensively by researchers such as Palma et al. [2], Pablo-Romero et al. [3], Ramos et al. [4], Lee et al. [5], and Abela et al. [6].
The European Union (EU) has implemented a range of policies to improve the energy performance of buildings and reduce energy consumption. One such policy is the energy performance of buildings directive (EPBD) (Directive 2002/91/EU), which was introduced in 2002 and implemented in January 2006. The EPBD focused on minimum energy performance requirements and the inspection of boilers and air conditioning systems [7]. Another policy was the energy performance certificates (EPCs), introduced with Directive (2010/31/EU) in 2010. This policy was the primary EU instrument to improve the energy performance of buildings while considering cost-effectiveness and local conditions and requirements. The implementation of EPCs gradually varied by Member State or region [7,8]. In 2012, Directive (2012/27/EU) updated the goals set by Directive (2010/31/EU) for the years 2020 and 2030, with a 20% and 30% reduction in energy consumption, respectively. Finally, the Directive (2018/844/EU) aimed to accelerate the cost-effective renovation of existing buildings and achieve the goal of a decarbonized building stock by 2050 [9].
Energy performance certificates (EPCs) are tools to evaluate the energy efficiency of buildings and offer recommendations to improve their rating cost-effectively [8]. Typically, EPCs in the EU use a letter scale from A to G, where A represents the highest energy efficiency and G is the lowest [7]. However, in Portugal, the scale ranges from A to F [10]. These guidelines aim to increase transparency and reduce information asymmetry regarding the energy performance of residential units, with the ultimate objective of enhancing energy efficiency and lowering energy consumption in buildings [11].
Providing energy performance certificates (EPCs) to potential buyers and tenants when selling or renting residential units promotes transparency about the energy efficiency of the building and allows for easy access to reliable information [5,12,13,14].
This circumstance can encourage building owners to renovate their properties for improved energy efficiency, as buildings with higher EPC ratings typically have higher prices [15,16,17]. Furthermore, upgrading a building’s energy efficiency can reduce energy consumption by up to 46% [18]. The EPC process promotes energy savings and reduces overall energy consumption by incentivizing building owners to improve their EPC rating.
The implementation of energy performance certification across the EU varies depending on the local political and legal context, financial incentives, and the characteristics of the local property market [7]. Countries and regions have different timelines for adopting EPC legislation in buildings, with some making it mandatory earlier than others. For example, Belgium made it mandatory for all buildings (new and existing) in 2006, while England and Wales followed in 2008, and Austria in an unspecified year. Ireland and Portugal made it mandatory in 2009, and Cyprus and France in 2010 [7].
Regarding Portugal, the subject of our investigation, all new buildings since July 2008 must possess a valid energy performance certificate, while existing buildings have had one since 2009. With the introduction of Decree-Law no. 118/2013 in Portugal, which follows Directive (2010/31/EU), the EPC became mandatory when signing the sale, rental, or lease contract. The number of certificates issued in Portugal was 13,798 in 2008, which more than doubled in 2009, reaching 188,716 certificates. However, the count declined significantly between 2011 and 2013, bottoming at 74,969 in 2013. It can be attributed to the financial and economic crisis that affected Portugal as one of the hardest-hit countries in the EU. Nevertheless, the number of new certificates recorded has increased since 2014, and in 2020, 198,091 certificates were issued (see Figure 3 below).
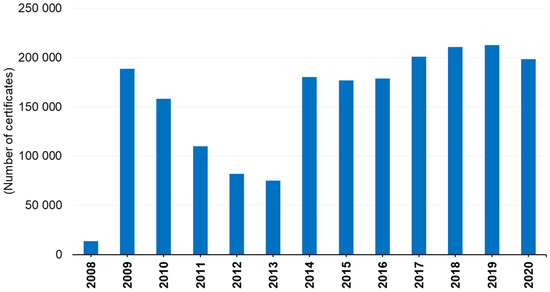
Figure 3.
Energy performance certificates issued in Portugal during 2008–2020. The authors created this figure with data from Observatório da Energia [19]. Notes: During 2008–2013, they included A+, A, B, B-, C, D, E, F, and G certificates, while during 2014–2020, they included the A+, A, B, B-, C, D, E, and F certificates. The EPC with rating G was discontinued in 2014.
Looking at the number of energy certificates issued in Portugal, we can see that in 2008, the most commonly issued certificates were for ratings B and B+. There were 4165 and 1635 certificates issued for these ratings, respectively, while ratings C, D, E, F, and G had much lower numbers, with only 141, 75, 14, 4, and 11 certificates issued, respectively. In 2014, ratings C and D had the most certificates issued, with 58,209 and 46,661 certificates, respectively. There were also 1893 certificates issued for rating A+, 7018 for rating A, 12,951 for rating B, 19,171 for rating B-, 24,379 for rating E, and 9758 for rating F. Moving forward to 2020. The most frequently issued certificates were for ratings C and D, with 41,347 and 34,961 certificates issued, respectively. In addition, there were 31,186 certificates issued for rating B, 20,156 for rating B-, 21,721 for rating E, and 12,934 for rating F. It is worth noting that the data presented for 2008 to 2013 covers certificates with ratings A+, A, B, B-, C, D, E, F, and G, while the data presented for 2014 to 2020 only includes certificates with ratings A+, A, B, B-, C, D, E, and F. It is also important to note that the EPC with a rating of G was discontinued in 2014 (See Figure 4 below).
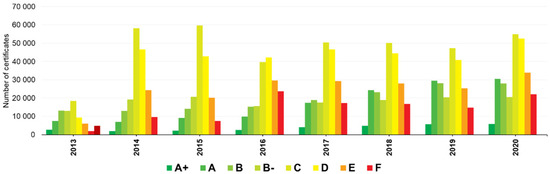
Figure 4.
Energy performance certificates by energy class issued in Portugal during 2008–2020. The authors created this figure with data from Observatório da Energia [19]. Notes: During 2008–2013, they included A+, A, B, B-, C, D, E, F, and G certificates, while during 2014–2020, they included A+, A, B, B-, C, D, E, and F certificates. The EPC with rating G was discontinued in 2014.
Increasing the number of energy certificates with high ratings such as A+, A, B, and B- is important for Portugal to reduce household energy consumption. The household sector accounted for 18.2% of total energy consumption in 2019 (see Figure 5 below).
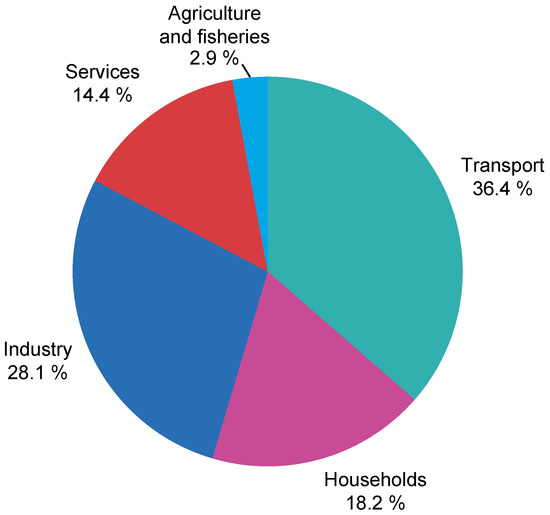
Figure 5.
Final energy consumption by sector in Portugal in 2019, expressed as a percentage of the total and based on tons of oil equivalent. The authors created this figure using data from PORDATA [20].
It increased from 2301.6 Mtoe in 1990 to 2820.9 Mtoe in 2000 and 2891.3 Mtoe in 2019. However, due to financial and economic crises, household energy consumption decreased by 6.52% in 2011, 3.05% in 2012, and 2.29% in 2013 (See Figure 6 below).
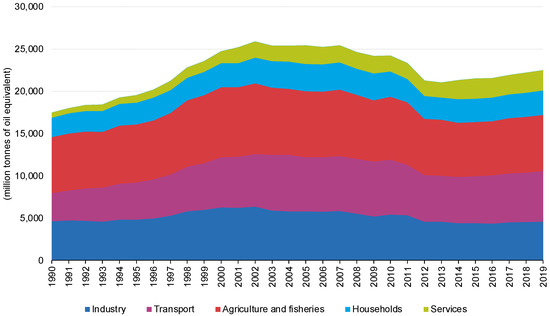
Figure 6.
Final energy consumption by sector in Portugal from 1990 to 2019, measured in million tons of oil equivalent. The authors created this figure using data from Eurostat [1].
The distribution of gross inland energy consumption in Portugal significantly differs from the EU average. In 2019, oil and petroleum products accounted for 42.6% of the energy mix, while solid fossil fuels represented 11.3%, natural gas 21%, and renewables and biofuels 25.2%. In contrast, the EU consumed 34% oil and petroleum products, 11.6% solid fossil fuels, 23.1% natural gas, and 15.8% renewables and biofuels in the same period, according to Eurostat (2023).
Promoting the use of Energy Performance Certificates (EPCs) is crucial to reduce the impact of fossil fuels on the environment and lower household energy consumption in Portugal. As shown in the previous chart (Figure 6 above), in 2019, fossil fuels represented the majority of the energy mix in Portugal, totaling 74.9%.
After observing an increase in the number of new energy performance certificates (EPCs) registered in Portugal, the question arises: What factors influence the adoption of EPCs with high or low energy consumption performance? Surprisingly, the literature does not explore the determinants of EPC adoption in Portugal or other countries. However, existing literature has focused on the factors that determine increased energy efficiency in residential buildings, such as mandatory legislation for energy performance certification, concerns about energy consumption, prices, and the environment, transaction prices and rents, the existence of fiscal and financial/incentive policies, social and economic aspects, and characteristics of proprieties. It is important to note that enhancing energy efficiency in buildings will undoubtedly impact energy efficiency ratings.
Conducting this study has become essential to address the gap in the literature regarding the determinants of EPCs with high or low energy consumption performance adoption in Portugal. Therefore, the main objective of this investigation was to study the determinants of EPCs with high or low energy consumption performance adoption in Portugal. An empirical analysis of 308 municipalities in Portugal from 2015 to 2019 was conducted to accomplish this study. The methodological approach used in this investigation was the fuzzy set Qualitative Comparative Analysis (fsQCA), which aims to identify the combinations of causal conditions sufficient for high or low energy consumption efficiency performance.
This study has several important features, including its relevance, innovation, and potential contributions. This investigation is important because it attempts to fill the gap in the literature regarding the determinants of EPCs with high or low energy consumption performance adoption in Portugal. Therefore, this study is relevant for policymakers, researchers, and stakeholders interested in promoting energy efficiency and reducing carbon emissions in Portugal.
In addition to its relevance, this study is innovative in using the fuzzy set Qualitative Comparative Analysis (fsQCA) methodological approach. This approach allows for identifying the combinations of causal conditions sufficient for high or low energy consumption efficiency performance, providing a more nuanced understanding of the determinants of EPC adoption. This innovative approach can potentially contribute to the broader literature on energy efficiency and EPC adoption.
The potential contributions of this study are significant. On the one hand, it can provide valuable information for policymakers and stakeholders interested in promoting energy efficiency in Portugal. On the other hand, it can contribute to the broader literature on energy efficiency and EPC adoption by providing empirical evidence from a new context and using an innovative methodological approach. This study’s findings have the potential to inform the development of more effective policies and programs aimed at promoting energy efficiency in Portugal and beyond.
Expectations for this study include the identification of key determinants of EPC adoption in Portugal and a better understanding of the relationships between these determinants. This study’s findings may also highlight areas where further research is needed to understand better the factors that influence EPC adoption in Portugal and other contexts. Overall, this study has the potential to significantly contribute to the literature on energy efficiency and EPC adoption, and its findings could have practical implications for policymakers and stakeholders interested in promoting energy efficiency and reducing carbon emissions.
This study is structured as follows: Section 2 is a literature review, providing an overview of existing research on the subject. Section 3 outlines the data and methodology used in this study. Section 4 presents the results of the analysis. Finally, Section 5 provides the study’s conclusions and policy recommendations.
2. Literature Review
The literature does not adequately examine the determinants of household adoption of EPCs with high or low energy consumption performance. To overcome this limitation, we have relied on literature that closely relates to this topic. Therefore, this section will focus on the main literature that addresses the determinants of energy efficiency in residential buildings. Some authors, including Trotta et al. [8], and Mudgal et al. [7], suggest that the increase in energy efficiency performance in residential buildings is related to mandatory legislation of energy performance certification, concerns about energy consumption, energy prices, and the environment, as well as transaction prices and rents. Other authors, such as Trotta et al. [8], Noailly [9], Sarker et al. [21], and Filippini et al. [22] have pointed out that this increase is related to fiscal and financial incentive policies. Some authors, such as Lakić et al. [23], Gómez-Román et al. [24], and Trotta [25], indicated that social-economic aspects can promote energy efficiency initiatives. Moreover, others, such as McCord et al. [26], argued that properties’ characteristics determine specific energy efficiency levels.
This literature review will be structured around the following topics: (Section 2.1) Legal obligation; (Section 2.2) Concerns about energy consumption, prices, and the environment; (Section 2.3) Concerns about transaction prices and rents; (Section 2.4) Existence of fiscal and financial incentive policies; (Section 2.5) Social-economic aspects; and (Section 2.6) Characteristics of proprieties. By examining these topics, we can better understand the determinants of household adoption of EPCs with high or low energy consumption performance and identify the factors that promote or hinder energy efficiency initiatives in the residential building sector.
2.1. Legal Obligation
According to Reed et al. [27], the use of rating tools for buildings began in 1990 in the UK with the introduction of the Building Research Establishment Environmental Assessment Method (BREEAM), a multi-criteria tool. Several other rating schemes have followed in different jurisdictions, some focusing on energy while others taking a broader sustainability approach [28]. For example, Energy Star (energy) in the US, the French HQE scheme (multi-criteria), and the Swiss Minergie (energy) label were all introduced in the 1990s. In the 2000s, various multi-criteria schemes like the Leadership in Energy and Environmental Design (LEED) in the US, Green Globe in Canada, Green Star in Australia, and Comprehensive Assessment System for Built Environment Efficiency (CASBEE) in Japan were launched [7]. The EU framework for energy performance labelling of buildings was a relatively late starter, starting in 2002 [7].
Trotta et al. [8] pointed out that dwelling and energy-related product standards aim to ensure efficient energy performance for buildings, heating equipment, and building components. Even if purchasers lack the motivation or credit to purchase more efficient products, these standards ensure that energy-efficient products are available. Furthermore, Noailly [9] stated that mandatory energy efficiency standards are one of the main drivers of innovation. In the EU, mandatory energy efficiency standards are the preferred policy option to address obstacles to energy efficiency, as per Bleischwitz et al. [29].
The EU began implementing energy efficiency standards in 2002 by introducing the Energy Performance of Buildings Directive (EPBD) (Directive 2002/91/EU). This policy instrument focused on improving the minimum energy performance requirements and inspections of boilers and air conditioning systems, and it came into force in January 2006 [7]. Energy Performance Certifications (EPCs) were gradually introduced in different Member States or regions through Directive (2010/31/EU) in 2010, which was the primary EU policy instrument to improve the energy performance of buildings. This directive aimed to consider cost-effectiveness, local conditions, and requirements, given that energy consumption in buildings is highly influenced by local climates and cultures [7,8]. Directive (2012/27/EU) updated Directive (2010/31/EU) and set goals for reducing energy consumption by 20% and 30% by 2020 and 2030, respectively [9]. The most recent update was made with the introduction of Directive (2018/844/EU), which aims to accelerate the cost-effective renovation of existing buildings and achieve a decarbonized building stock by 2050.
The EPCs are a crucial tool for improving the energy efficiency of buildings, as they are part of the EPBD, as noted by Mudgal et al. [7]. Trotta et al. [8] explained that these certificates evaluate a property’s energy efficiency and suggest cost-effective enhancements to increase the building’s rating. Most countries use a letter-based rating system (such as A to G), where A is very efficient, and G is very inefficient, but Portugal uses a different letter scale (A to F), as per SCE [10]. Additionally, for existing buildings, the EPC may show the potential rating (with possible improvements), the current rating, and a benchmark for an average-performing building, according to Mudgal et al. [7].
Furthermore, according to Trotta et al. [8], the EPCs are an important tool for consumers to learn about the energy consumption of the property they wish to purchase or rent and are mandatory in EU countries in case of a change of occupant or sale. Although new buildings can be designed to be highly efficient, the current stock of buildings is predominantly of poor energy performance. This situation is because these were primarily built before energy use regulations were introduced and when there were varying expectations for thermal comfort. In addition, building components and technical systems are subject to wear and tear over time, leading to increased energy consumption to provide the same level of energy service.
The way energy performance certification is implemented and its effectiveness varies across the EU-27, depending on different factors like the local legal and political context and the specific characteristics of the property market in the area [7]. For instance, it became mandatory to adopt EPC legislation in all buildings (new and existing, and to sell or rent) in Belgium in 2006, in England and Wales in 2008, and in Austria in 2008. In Ireland and Portugal, it became mandatory in 2009, while in Cyprus and France, it became mandatory in 2010 [7].
Although the impact of mandatory energy policies on EPCs has not been explored in the literature, we have opted to use literature closely related to this topic. Therefore, we will use literature that explores the effect of mandatory energy efficiency policies on energy efficiency in buildings. For instance, Jonkutė et al. [30] investigated the impact of mandatory energy performance certification on CO2 emissions in residential buildings in Lithuania. The authors conducted an empirical analysis of data collected in 2014, and the results showed that EPCs mitigate CO2 emissions. Furthermore, the reduction in emissions was caused by increased energy efficiency due to EPCs, reducing energy consumption from non-renewable energy sources.
Thonipara et al. [31] studied the impact of regulatory policies on the energy efficiency of residential buildings in the EU. The authors carried out an empirical analysis of data collected from 28 EU countries for the period 2000–2015. The findings showed that building regulations could effectively reduce energy consumption in residential buildings. However, it may take some time before the impact of regulatory standards for new buildings and significant renovations becomes noticeable. Trotta [25] conducted a study on the factors that affect energy-efficient retrofit investments in the residential sector in England. The author analyzed data from 1990, and the results showed that retrofit measures could significantly decrease energy demand, particularly for space heating, and subsequently lower associated CO2 emissions.
Furthermore, several authors have also investigated the impact of mandatory energy efficiency policies on buildings’ energy efficiency, including Mudgal et al. [7], Trotta et al. [8], Filippini et al. [22], Broin et al. [32], and Vine et al. [33].Thus, it can be observed that mandatory energy performance policies for buildings are the primary drivers that motivate consumers and property owners to improve energy efficiency in their homes by reducing energy consumption. Additionally, energy performance ratings reflect the enhancement of energy efficiency in houses.
2.2. Concerns about Energy Consumption, Prices, and the Environment
Concerns regarding energy consumption and environmental impact can influence consumer decisions regarding adopting energy performance certificates in the EU [7]. Indeed, these two concerns may be related to the consumer’s mind [34]. For example, Mudgal et al. [7] found that consumers consider information about a property’s energy performance when purchasing or renting. Furthermore, the concern about building energy use is the main factor influencing consumers at the moment of the decision since energy use has a positive link with the environment. This situation means that consumers are worried about the type of energy source (e.g., renewable or non-renewable) used in their residences, and an increase in consumption leads to an increase in environmental degradation due to CO2 emissions.
The concerns regarding climate change reflect the views of many Europeans. According to the European Commission [35], almost one-third of Europeans, 28%, consider climate change the most pressing global issue. Furthermore, many individuals have taken measures to control and reduce energy consumption in their homes. Among those measures are using smart meters 10%, installing solar panels 8%, switching to energy suppliers that offer more renewable sources 10%, improving home insulation 18%, and buying low-energy consumption homes 4%.
There is a significant variation in the attitudes and concerns toward energy consumption and the environment among EU countries (see Table 1, below). Indeed, this table below was created with data from European Commission [35].

Table 1.
Attitudes and concerns toward energy consumption and the environment among EU countries.
Therefore, we can consider Europeans in favor of the environment. According to Gómez-Román et al. [24] and Gardner and Stern [36], the BWES covers an individual’s willingness to take energy-efficient measures, such as investments in lower energy use or energy curtailment measures, like reducing the use of air conditioning, watching television, or charging electronic devices.
According to Mills and Schleich [37], the BWES could be related to socio-economic aspects. For example, family age-composition patterns distinctly impact household energy use behavior. Families with young children have a higher tendency to embrace energy-saving technologies and eco-friendly habits while concentrating on energy conservation to protect the environment. Conversely, households with a substantial number of elderly individuals prioritize financial savings. As a result, they typically have lower rates of technology adoption and a reduced understanding of household energy use and energy-saving practices, such as turning off lights or utilizing energy-efficient light bulbs. Moreover, individuals with higher levels of education place greater importance on energy savings for environmental reasons and less on financial savings.
Additionally, Poortinga and colleagues [38] argued that actions that indirectly affect the environment can shape the political environment in which people make decisions related to environmental concerns. For example, engaging in environmental activism and supporting sustainability policies can create a more supportive context for making environmentally conscious choices. Another factor related to energy consumption that leads consumers to invest in energy-efficient retrofits and obtain energy performance certificates is the high price of electricity, which has been increasing in recent years [39]. Indeed, Lainé [40] pointed out that consumers place little importance on energy efficiency when they are highly concerned about their energy bills. The same author also noted that adopting energy certificates in the United Kingdom is related to significant concerns about household energy bills. The Mudgal et al. [7] and ERA [41] stated that energy performance certificates have gained significance due to buyers’ growing awareness of energy expenses and consumption levels, especially for mid-price assets.
The impact of energy consumption, prices, and environmental concerns on adopting EPCs with high or low energy performance in the literature has not been extensively studied. Therefore, we decided to focus on authors investigating the effect of energy consumption, energy prices, and environmental concerns on household energy efficiency.
A study by Lakić et al. [23] investigated the key attributes that Slovenians consider when buying a highly energy-efficient property and investing in more efficient heating controls. The research showed that energy efficiency was the second most critical factor after property price. The study found that individuals who were environmentally conscious, married, or female were more likely to appreciate energy efficiency. The research also found that women preferred shorter payback periods, while people with higher education valued future costs more and were willing to invest more in energy efficiency. Homeowners who were concerned about climate change were also found to be more likely to value energy efficiency.
Similarly, CONSEED [42], Pelenur [43], and Frederiks et al. [44] found that households worried about climate change were more inclined to value energy efficiency. However, these incentives for energy-efficient measures were primarily targeted at environmentally conscious homebuyers. Other authors, such as Mudgal et al. [7], Gómez-Román et al. [24], Gardner and Stern [36], Mills and Schleich [37], Poortinga et al. [38], Nair et al. [39], Ferrantelli and Kurnitsk [45], Belaïd et al. [46], and Stern [47], have also investigated the effect of energy consumption, prices, and environmental concerns on energy efficiency in households.
It can be observed that concerns about energy consumption in favor of the environment and energy prices are among the determinants that lead households to adopt energy efficiency technologies and conservation practices. This adoption, in turn, impacts the energy efficiency ratings of buildings.
2.3. Concerns about Transaction Prices and Rents
Concerns about transaction prices and rents also drive the adoption of energy performance certificates. Mudgal et al. [7] stated that environmental and energy labelling schemes make a product’s energy performance visible, which would not be easily visible otherwise. Therefore, without information from sellers about a property’s energy performance, the value of a well-insulated building would not be reflected in the transaction price or rent. This lack of transparency may discourage owners from making energy-saving improvements, particularly if they plan to sell or rent their property in the short term.
The concept that products can be understood as a bundle of characteristics, as proposed by Lancaster [48], supports the idea that some characteristics are more visible than others. Mudgal et al. [7] argued that environmental and energy labelling schemes make it possible for buyers to consider a product’s energy performance, which would otherwise be difficult to compare. However, this information can only impact the market if energy performance is deemed important by buyers/renters or if sellers/landlords anticipate its growing importance and choose to make energy efficiency a salient attribute. Mudgal et al. [7] further suggested that energy and other environmental labelling schemes are necessary for energy-efficient products to receive due recognition in the market, as they provide the basic conditions for buyers/renters to consider this product dimension.
Mudgal et al. [7] argued that constructing buildings with better energy performance is more expensive, and it is important to determine if the extra cost is justifiable and if it results in any additional returns for the investor. This argument also holds when renovating existing buildings. Hence, the authors suggested that it is worth exploring whether buyers are willing to pay a premium for buildings with better energy performance, irrespective of whether they are more costly to build. Additionally, buildings with better energy performance may retain their value better in changing demands and regulatory requirements, making them more future-proof.
Ürge-Vorsatz et al. [49] conducted a review which suggests that the energy performance of buildings impacts their value due to the savings it can generate and the increasing awareness of environmental concerns. Additionally, energy-efficient buildings are expected to have higher monetary value because they offer more benefits than less efficient buildings, such as better services. According to Mudgal et al. [7], energy performance affects the cost of providing a certain level of services. If two properties offer similar services but have different running costs, the price of living in these properties should reflect that difference. Therefore, the net present value of goods providing the same utility to consumers should be equalized. As a result, the price of two goods providing the same services but with different energy efficiency levels should not be the same.
Mudgal et al. [7] examined the relationship between energy performance certificates (EPCs) and European transaction prices and rents. They found that improvements in a property’s energy efficiency were associated with higher prices and rents in several countries. For example, in Austria, a one-letter improvement in energy efficiency was linked to an 8% increase in sales prices and a 4.4% increase in rental prices. In Belgium, EPCs significantly impacted property prices and rents, with a clear relationship between a property’s energy efficiency and the advertised price or rent. Improvements in energy efficiency were associated with a 4.3% higher price and a 3.2% higher rent. Similarly, a one-letter improvement in a property’s energy label corresponded to a 4.3% higher price in France. Finally, in Ireland, there were indications that energy efficiency was rewarded in the property market, with a one-letter improvement in energy efficiency resulting in a 2.8% increase in sales prices and a 1.4% increase in rental prices.
While limited literature explores the impact of transaction prices and rents on energy performance certificates (EPCs), we can draw insights from related studies. Barreca et al. [50] analyzed data on Turin’s Italian real estate market, investigating the influence of EPC labels and building features on housing prices between 1946 and 1990. Their findings suggest that EPC labels are gaining influence in shaping price dynamics, with low EPCs (E, F, and G) having a significantly negative impact on prices and high EPCs (A1, A2, A3, A4, and B) having a slightly positive effect. Intrinsic building characteristics such as building category and housing unit maintenance level also emerged as influential factors in property price formation.
An investigation on the impact of energy performance certificates (EPCs) on the rental market in Norway was conducted by Khazal and Sønstebø [51]. The authors utilized data collected for the period 2011 to 2018 to determine whether labelled dwellings had a premium compared to non-labelled ones. The results indicated that labelled dwellings had a premium, which increased with a higher EPC label.
According to McCord et al. [26], a study was conducted to evaluate the impact of EPCs on house prices in the Belfast housing market, Northern Ireland. The authors used data collected from Q2 2018 to Q1 2019 and assessed the effects of standardized cost-effective retrofit improvements. The results suggest that EPCs have differential valuations across the quantiles, with only upper quantiles of the price distribution showing significant capitalization effects with energy performance. Additionally, only properties with higher EPC scores significantly positively affect prices at the higher end of the price distribution, with brown discount effects observed for lower-rated properties within F- and G-rated EPC properties at the higher end of the pricing distribution. Furthermore, the potential energy efficiency rating also shows increased sales prices and appears to minimize any brown discount effects.
Additionally, several studies have examined the relationship between EPCs and transaction prices and rents, including works by Mudgal et al. [7], McCord et al. [52], Cespedes-Lopez et al. [53], Chegut et al. [54], Wilhelmsson [55], Graaf [56], Cerin et al. [57], Högberg [58], and Fuerst and McAllister [59]. However, this literature review highlights the lack of consensus regarding the impact of EPCs on transaction prices and rents. While some authors suggest that EPCs lead to an increase in transaction prices and rents (e.g., Mudgal et al. [7]; McCord et al. [26]; Barreca et al. [50]; Khazal and Sønstebø, [51]; Chegut et al. [54]; Graaf, [56]; Cerin et al. [57]; and Högberg [58]), others suggest that they have no effect (e.g., McCord et al. [52]; Cespedes-Lopez et al. [53]; Chegut et al. [54]; Wilhelmsson [55]; and Fuerst and McAllister [59]).
2.4. Existence of Fiscal and Financial Incentive Policies
Various policies providing fiscal and financial incentives can significantly promote households’ adoption of Energy Performance Certificates (EPCs) in buildings. Studies conducted by researchers such as Trotta et al. [8], Noailly [9], Sarker et al. [21], and Filippini et al. [22] have suggested that incentives in the form of financial and credit rewards encourage individuals to improve energy efficiency.
According to Sarker et al. [21], fiscal incentives are essential in promoting building energy efficiency. Such incentives, often provided via a country’s tax system, offer tax subsidies, rebates, and tax holidays for investments in energy-efficient technologies. Moreover, financial incentives are also available to homeowners contemplating energy efficiency refurbishment, including roof insulation, walls, recuperative ventilation, and investments in green energy sources [23].
The literature lacks research on the influence of fiscal and financial incentive policies on Energy Performance Certificates (EPCs) with varying levels of energy performance. Therefore, we relied on literature that is closely related to this topic. This literature review focuses on authors who have explored the impact of fiscal and financial incentive policies on energy efficiency in buildings. Several studies have investigated this relationship. For instance, He and Chen [60] studied the effect of different government subsidy policies on green buildings. They examined four subsidy policies: subsidies to developers only, subsidies to consumers only, subsidies to both, and non-payment of subsidies. Their results revealed that subsidies positively impact the development of green buildings. Furthermore, simultaneous subsidies to developers and consumers yielded the most significant benefits for developers and the highest social welfare.
Villca-Pozo and Gonzales-Bustos [61] studied the effect of tax incentives to improve the energy efficiency of Spanish households. The study conducted by the authors examined data collected for the period 2009 to 2018 and revealed that tax benefits alone are insufficient to promote energy efficiency. However, the authors suggested utilizing the fiscal route to encourage home energy efficiency. Finally, Trotta et al. [8] investigated the effectiveness of policy instruments and private initiatives in selected European countries, such as Finland, Italy, Hungary, Spain, and the United Kingdom. The authors analyzed policy instruments implemented in these countries between 1990 and 2015. The findings indicated that financial facilities, including grants, subsidies, soft loans, etc., and fiscal incentives indirectly reduce the cost of investments and incentivize building energy efficiency.
In a study by Bonifaci and Copiello [62], tax incentive policies for enhancing energy resilience in residential buildings in Italy were evaluated. The authors analyzed data from 2010 and found that the tax incentive policies failed to stimulate an increase in the minimum energy standards in residential buildings. Moreover, other authors have also explored the effects of fiscal and financial incentive policies on EPCs (e.g., Filippini et al. [22]; Ferrantelli et al. [63]; Neveu and Sherlock [64]; Ameer and Krarti, [65]; Shen et al. [66]; Chen and Hong [67]; Alberini and Bigano [68]; Charlier [69]; and Dubois and Allacker, [70]).
This literature review highlights the lack of consensus regarding the influence of fiscal and financial incentive policies on building energy efficiency. While some authors suggest that these policies have a positive impact on Energy Performance Certificates (EPCs), others do not share the same view (e.g., Trotta et al. [8]; Filippini et al. [22]; He and Chen [60];Neveu and Sherlock, [64]; Ameer and Krarti [65]; and Chen and Hong [67]). At the same time, others have indicated that fiscal and financial incentive policies do not have any impact (e.g., Villca-Pozo and Gonzales-Bustos [61]; Bonifaci and Copiello [62]; Shen et al. [66]; Alberini and Bigano [68]; Charlier [69]; and Dubois and Allacker [70]).
2.5. Social and Economic Aspects and Energy Efficiency
Trotta [25] indicated that social and economic factors influence building energy efficiency. Regarding social and economic factors, we discuss income, the Gini coefficient, education, credit, age group, and gender. However, the impact of social and economic aspects on EPCs has not been explored in the literature. Therefore, we opted to use literature closest to this topic issue.
For example, Lakić et al. [23] studied the most important attributes when buying a highly energy-efficient property and investing in more efficient heating controls in Slovenia. According to the authors, energy efficiency is crucial for Slovenians when purchasing properties. It is the second most important factor after property price. Individuals with higher education place more value on future costs and are more willing to invest in energy efficiency due to its increased benefits. Additionally, several studies, such as Gómez-Román et al. [24], Mills and Schleich [37], and Morton et al. (2018) [71], have linked higher education with behaviors related to energy efficiency.
In a study by Gamtessa [72] in Canada, the author examined the residential factors influencing energy efficiency retrofit behavior between October 1998 and September 2005. The study found that higher income levels and a greater proportion of elderly household members are positively associated with energy efficiency retrofit investments. Meanwhile, several other authors, such as Hamilton et al. [73], Hamilton et al. [74] and Tovar [75], have also linked higher income levels with increased energy efficiency. However, Koengkan et al. [76] and Fuinhas et al. [77] have identified that the impact of income on the energy efficiency of housing varies. In the highest-efficiency housing categories (A+, A, and B), income has a negative and significant impact, whereas in the lowest-efficiency categories (C, D, and E), it has a positive and significant impact. Moreover, the impact of income on (B)-level housing is the most significant.
Galvin [78] explored the link between Gini and energy poverty, which is related to low energy consumption efficiency in buildings or houses. The Gini index indicates the discrepancy between people’s income levels in a particular country, region, or municipality [78]. The author found that low income is one of the causes of energy poverty in European countries. Moreover, other authors who studied the same link found the same result [79,80].
One economic aspect that may encourage household energy efficiency is credit availability for consumers. Trotta et al. [8] noted that soft loans are frequently used to promote energy efficiency improvements by reducing the upfront costs that households face. These loans may help to increase the adoption of energy-efficient upgrades by making them more affordable and accessible to homeowners. Ameli and Brandt [81] complemented this by stating that in Organization for Economic Co-operation and Development (OECD) countries, low-income families without direct subsidies, tax credits, or rebates opt to use credit to access clean energy technologies with low consumption. Berkouwer and Dean [82] used a randomized controlled trial (RCT) to show that providing access to credit reduces the energy efficiency gap for adopting energy-efficient cookstoves in Kenya.
2.6. Characteristics of Proprieties and Energy Efficiency
McCord et al. [26] argued that properties’ characteristics determine specific energy efficiency levels. This view is also shared by Mudgal et al. [7], who suggested that different energy efficiency levels depend on the country, region, or physical attributes. Additionally, Cerin et al. [57] suggested that the energy performance relationship varies according to the type of housing.
When referring to the characteristics of houses or buildings, we typically mean size, property type, age, temperature, and location [25,83]. However, the impact of these characteristics on EPCs has not been explored in the literature. For this reason, we chose to use the literature closest to this topic issue.
For instance, McCord et al. [26] examined the relationship between EPCs and sales prices in Belfast, UK. The authors found that larger properties have less energy efficiency, while smaller properties are associated with more energy efficiency. The property type can also affect energy efficiency, with apartments and terraces showing a positive correlation. In terms of property age, the authors found that older properties have a greater negative effect on energy efficiency, and this effect diminishes as the age classification becomes new.
Trotta [25] investigated the determinants of energy-efficient retrofit investments in the English residential sector. The author found that British households living in houses built before 1990 and living there for more than a year are more likely to invest in energy-efficient retrofit measures. Nair et al. [39] examined the impact of property characteristics, such as building age and thermal comfort, on energy-efficient retrofit investments in Sweden. The authors found that the likelihood of investing in new building envelope components and other energy efficiency measures increases with thermal discomfort and the age of the house. In a study by Gamtessa [72], the relationship between household characteristics and energy-efficient retrofit measures was investigated. The findings indicated that building obsolescence was positively associated with retrofit investments, suggesting that older buildings were more likely to undergo energy-efficient upgrades. Conversely, larger floor area, larger household size, and living in attached/row, mobile, or multi-floor homes were negatively associated with retrofit investments, indicating that these factors may be barriers to retrofit adoption.
3. Data and Methods
This section presents the variables and the methods used to assess the causal conditions leading to buildings’ high or low energy consumption performance across Portuguese municipalities.
3.1. Data
Municipalities are political-administrative divisions of the Portuguese territory. Portugal has 308 municipalities, with populations ranging from a few thousand to more than half a million and areas ranging from 7.94 to 1720.6 km2 (see Figure 7 below).
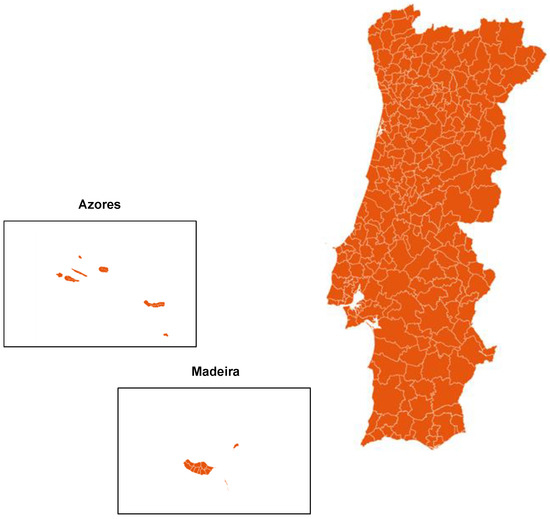
Figure 7.
Portuguese municipalities. The authors created this map.
Indeed, studying energy performance adoption in municipalities is particularly relevant given the global imperative to transition towards a low-carbon, sustainable energy future. Municipalities are key actors in this transition, as they are responsible for a significant proportion of energy consumption and greenhouse gas emissions. By identifying the determinants of high or low energy consumption performance adoption in municipalities, researchers can contribute to developing more effective policies and programs to reduce energy consumption, promote renewable energy, and mitigate climate change. Table 2 describes the variables used in this empirical investigation.
Table 2.
Description of the variables.
To measure the energy performance of buildings, which is the dependent variable in our model, we retrieved the cumulative number of energy certificates for each class from the Portuguese municipalities using the Sistema de Certificação Energética dos Edifícios (SCE) [10]. In Portugal, there are eight energy classes, ranging from A+ for the most efficient to F for the least efficient. A residential property under A+ has a primary energy demand that does not exceed 25% of the reference consumption, while F classifies a property whose energy consumption is more than two and a half times the reference level. We used these data to define our study variables: (i) high energy performance certificates (EPC-H), which represent the fraction of the three highest classes in the total certificates, and (ii) low energy consumption performance certificates (EPC-L), which represent the portion of the three least efficient classes in the total certificates. We excluded from the analysis the class C certificates as they are less relevant because they represent the average energy performance, and we are interested in assessing the drivers of high and low performance. We chose this normalization to account for the different dimensions of the Portuguese municipalities. Some authors have used this variable as a proxy for energy efficiency performance, such as Koengkan et al. [76], Fuinhas et al. [77], and Koengkan et al. [87].
The use of Fiscal/Financial incentives policies, Gross domestic product (GDP), Higher education (HE), Gini coefficient (Gini), Completed dwellings (CD), and Completed reconstructions (CR) as independent variables to explain energy efficiency performance in houses can be grounded in various economic, social, and environmental theories. In contrast, there may not be specific literature that directly justifies using these variables or relevant studies closely related to this topic. Therefore, this investigation draws on existing literature to support the selection of these variables and their theoretical justification.
For example, we used the variable Fiscal/Financial incentives policies (FIP). This variable was retrieved from the International Energy Agency [84] and is only available nationally. The behavioral economics theory can explain this variable’s use in our econometric model. This theory suggests that people are more likely to undertake energy efficiency measures if they are financially incentivized. Financial incentives can help overcome the initial investment costs associated with energy efficiency improvements, making them more attractive to homeowners. Several studies support using this variable to explain the energy efficiency in houses. For example, Trotta et al. [8], Noailly [9], Sarker et al. [21], Filippini et al. [22], Broin et al. [32], He and Chen [60], Neveu and Sherlock [64], Ameer and Krarti [65], Chen and Hong [67], and Sathre and Gustavsson [88]. All authors indicated that the fiscal/financial incentive policies encourage families to install solar panels, improve the thermal insulation of their homes, and replace domestic apparel with others that consume less energy.
The variable Gross Domestic Product (GDP) is used to understand the relationship between economic growth and house energy efficiency. Although GDP data are not available at the municipality level in Portugal, it can be estimated using the per capita GDP of the 25 NUTS III territorial units. Therefore, we used each municipality’s NUTS III unit’s per capita GDP as a proxy for their per capita GDP. This variable is valid because economic growth theory suggests that increasing energy efficiency is crucial for sustainable economic development. Higher GDP levels tend to be associated with greater investments in energy efficiency in homes. Several studies support the use of per capita GDP as a variable to explain energy efficiency in houses, including Gamtessa [72], Hamilton et al. [73], Hamilton et al. [74], Tovar [75], Koengkan et al. [76], and Fuinhas et al. [77]. These authors have found that higher income levels and a higher proportion of elderly household members are positively associated with energy efficiency retrofit investments. By using per capita GDP as a proxy variable, we can examine the relationship between economic growth and energy efficiency at the municipal level in Portugal.
The variable higher education (HE) was retrieved from the Direção-Geral de Estatísticas da Educação e Ciência [86]. The use of higher education can be explained by the theory of human capital, which suggests that education and knowledge are important factors that influence energy-efficient behavior. People with higher levels of education are more likely to be aware of the benefits of energy efficiency and take steps to improve it. Several studies support the use of higher education as a variable to explain energy efficiency in houses, including Lakić et al. [23], Gómez-Román et al. [24], Mills and Schleich [37], and Morton et al. [71]. These authors indicated that higher levels of education are associated with greater awareness of the benefits of energy efficiency and a greater willingness to invest in energy-efficient measures.
The Gini coefficient (Gini) variable was obtained from the Instituto Nacional de Estatística [85]. The use of the Gini coefficient can be explained by the theory of income inequality, which suggests that income inequality can result in unequal access to energy-efficient housing. Wealthier households may have more resources to invest in energy-efficient technologies and materials. Several studies have supported the use of the Gini coefficient as a variable to explain energy efficiency in homes, such as Galvin [78], Bouzarovski and Simcock [79], Sovacool [80], and Gough et al. [89]. These authors indicated that income inequality could lead to disparities in access to energy-efficient homes.
The variables Completed dwellings (CD) and Completed reconstructions (CR) were obtained from the Instituto Nacional de Estatística [85]. The housing supply and demand theory can explain the use of completed dwellings and reconstructions. This theory suggests that housing stock availability and quality can influence the adoption of energy efficiency measures.
Moreover, new buildings often have a higher energy performance than existing ones, as they are subject to stricter regulations, and builders want to appeal to high-income and sophisticated clients. Reconstructions may also benefit from modern techniques that improve energy efficiency. Some studies have supported the use of the completed dwellings and completed reconstructions as variables to explain energy efficiency in homes, such as Trotta [25], Nair et al. [39], Gamtessa [72], and Attia et al. [90].
The empirical investigation was conducted for the period 2015 to 2019, deemed the most suitable period. This period was chosen because data on the energy efficiency certificate ratings that make up the EPC_H and EPC_L variables were available starting in 2015. Additionally, all municipalities had data available until 2019 for some other variables, such as HE, CD, and CR, making it the logical endpoint for the study.
Table 3 below displays the descriptive statistics for all the variables. After removing cases with missing data, we retain 1316 observations. On average, the share of low-energy consumption certificates (54.16) is much higher than that of high-energy ones (24.48). Their range is very large: from 0 to 66.79 for high energy certificates and 17.24 to 94.90 for low energy consumption certificates. For most municipalities, the share of high-energy certificates is between 10% and 40%, while the majority of low-energy consumption certificates are concentrated in the 30% to 70% range (Figure 8). The number of policies varies between four and six. The per capita gross domestic product shows an average of 16,839 €, with a mild dispersion. On the contrary, the proportion of the population enrolled in higher education varies widely across the municipalities. The same pattern is observed for completed dwellings and reconstructions, suggesting that the dynamics of the construction sector differ greatly between the municipalities.
Table 3.
Descriptive Statistics.
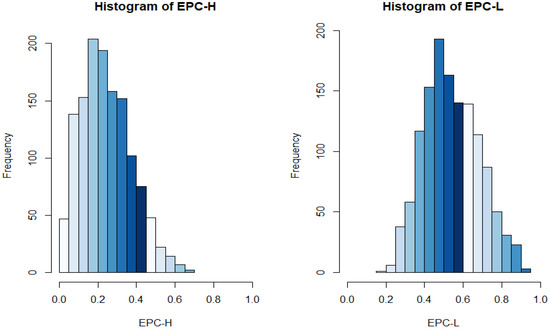
Figure 8.
Histogram for high energy performance certificates (EPC-H) and low energy consumption performance certificates (EPC-L).
Figure 9 shows the boxplots for all the variables. Higher Education, the Gini coefficient, and mostly completed dwellings and completed reconstructions have many outliers. However, unlike traditional regression methods, fuzzy set Qualitative Comparative Analysis is robust to this data feature.
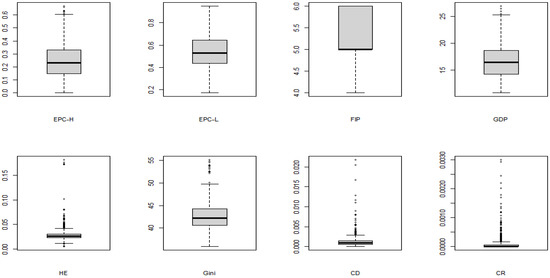
Figure 9.
Boxplot for the variables EPC-H, EPC-L, FIP, GDP, HE, Gini, CD, and CR.
Table 4 presents the correlation coefficients between the variables. Most values are statistically significant. High energy performance certificates positively correlate with FIP, HE, CD, and CR, while their correlation with EPC_L, GDP, and the Gini coefficient is negative. Low energy consumption performance certificates are negatively correlated with all the variables.
Table 4.
Correlation coefficients.
3.2. Methods
3.2.1. Fuzzy Set Qualitative Comparative Analysis
In this research, we use fuzzy set Qualitative Comparative Analysis (fsQCA) to find combinations of causal conditions sufficient for high or low energy consumption efficiency performance. This method, developed by Ragin [91], combines fuzzy set theory [92] with Boolean algebra and is well-equipped to deal with the complexity inherent in the real world. The FsQCA focuses on analyzing cases while preserving their complexity, unlike regression methods that strip the attributes from observed cases and attempt to find meaningful relationships between variables. This difference confers several advantages to fsQCA over regression methods. First, fsQCA considers the conjunction of conditions. That is, it allows the influence of a given condition to depend on the values of the remaining conditions. Regression methods, which rely on “net effects” reasoning, exclude this possibility [93,94]. Second, fsQCA can find several different combinations of conditions that lead to the desired outcome (equifinality). Finally, it contemplates the possibility of asymmetric effects of given attributes on different causal recipes. For example, a given attribute that is positively related in a recipe leading to an outcome may be negatively related or unrelated in a different causal combination leading to the same outcome [95].
Another important difference between regression methods and fsQCA is how they use the data. While the former uses the data in their raw form, the latter requires calibrated data in the interval from zero to one, indicating the degree of membership in a given set. In this research, we used the direct calibration method and define the 5%, 50%, and 95% quantiles as thresholds for full exclusion, crossover, and full inclusion in the set.
The second step of this method requires the researcher to construct the truth table. This table displays all possible combinations of causal conditions, the frequency of cases associated with each, and their consistency with the outcome. A real-world feature that affects fsQCA is the problem of limited diversity: some combinations of causal conditions are never observed. Therefore, we need to define a frequency threshold for the combinations that will later be used in the Quine–McCluskey algorithm. Schneider and Wagemann [96] argued that the researcher should choose a frequency threshold that includes at least 75% of the cases, and this threshold should grow with the sample size. Following their advice, we choose a frequency threshold of 6 cases.
Regarding the consistency threshold, we chose the value 80%, which is higher than the minimum acceptable limit suggested by Rihoux and Ragin [97]. Next, we used the Quine–McCluskey algorithm to find complex and parsimonious solutions. The parsimonious solutions include all the remainders (causal combinations with no observed cases) in the minimization process, while complex solutions include none [94].
Finally, we must assess the quality of our causal recipes by measuring their consistencies and coverages. Consistency shows the degree to which a causal combination agrees with the result, while coverage measures the portion of instances of the outcome that respects the causal recipe and indicates its empirical relevance [94]. In our panel data framework, we measured the pooled consistency of a sufficient causal recipe by the degree of inclusion of the set representing the causal combination in the outcome set [94,98].
where , and represent the degree of membership of the case in the causal recipe and the outcome, respectively, while T, and N are the number of years and municipalities. Pooled coverage is characterized by the degree of inclusion of the result in the causal recipe.
to detect panel effects, Garcia-Castro and Ariño [98] proposed a cross-section (between) and across-time (within) measures for consistency and coverage. The between consistency is defined as:
for each t = 1, …, T. Between coverage is defined similarly-
for each t = 1, …, T. The within consistency and the coverage may be defined analogously. However, we do not use these measures in our study because the time dimension of our panel is very short.
Garcia-Castro and Ariño [98] argued that sizable differences between consistencies across the years may signal unaccounted time effects. To assess the significance of these differences, these authors propose the following measure adjusted distance measure.
where represents the Euclidean distance between the vector containing the cross-section consistencies for all the years and the T-dimensional vector whose elements are all equal to .
Garcia-Castro and Ariño [98] claimed that an adjusted distance of fewer than 0.1 signals that there are no significant time effects.
3.2.2. Robustness Check
The standard analysis of fsQCA is prone to finding spurious causal recipes because it relies on analyzing multiple possible combinations from the truth table. Completely random variables added to the model often comprise at least one sufficient condition [99]. Braumoeller [100] proposed a simple permutation test that considers the multiple testing performed in fsQCA to avoid the problem of false positives and adjusts the p-values accordingly. We will use this test to assess the robustness of our results.
4. Results
This section presents the causal recipes leading to a high or low energy consumption efficiency performance. Table 5 shows the combinations of causal conditions sufficient for a high energy consumption efficiency performance, using an 80% consistency threshold and a 6-cases frequency threshold. We performed a sensitivity analysis by considering different consistency (90%) and frequency (5 and 7 cases) thresholds, and the results remained broadly unchanged.
Table 5.
Configurations for high energy consumption efficiency.
We adopted the notation used by Fiss [93] and represent by “●” the presence of a core condition, “●” the presence of a peripheral condition, and by a blank space the “do not care” condition. The first combination, which features a large number of fiscal and financial incentive policies, a highly educated population, and a large number of completed dwellings, coupled with low GDP, shows pooled consistency and coverage scores of 0.907 and 0.373, respectively. The second causal recipe differs from the first one in only one attribute: a low GDP is replaced by a low inequality, represented by the Gini coefficient. This combination presents a slightly higher pooled consistency (0.910) but a lower coverage (0.356). The third configuration, which includes high inequality, completed dwellings, and completed reconstructions, coupled with a low GDP and the number of policies, exhibits consistency and coverage scores of 0.945 and 0.181, respectively. Finally, the last two configurations only differ in two attributes. Both require many fiscal and financial policies, completed dwellings, and completed reconstructions. However, the fifth one calls for a high GDP and inequality, and the fourth requires their absence. As a result, consistency is slightly higher for the last recipe (0.973 vs. 0.941), while the reverse relation holds for coverage (0.163 vs. 0.202). The overall solution’s pooled consistency and coverage scores are 0.895 and 0.501, respectively.
The cross-sectional analysis of consistencies shows slight differences between the scores. The adjusted distance between the yearly consistencies never exceeds 0.1, which suggests that time effects are not a concern.
Table 6 displays the causal recipes leading to low energy consumption efficiency performance. The first configuration requires a low education level and Gini coefficient, few completed dwellings, and reconstructions. This solution’s pooled consistency and coverage scores are 0.885 and 0.486, respectively. The last two configurations share several attributes: a low number of fiscal and financial policies coupled with low inequality, few completed dwellings, and a high GDP. However, while the second requires a low educational level, the last calls for a few completed reconstructions. Their pooled consistency scores are similar (0.948 for the second one and 0.941 for the last one), as are their pooled coverages (0.260 for the second one and 0.266 for the last one).
Table 6.
Configurations for low energy consumption efficiency performance.
The examination of the yearly consistency scores reveals, once again, that their differences are minor. Furthermore, the adjusted distance is always below 0.1, thus indicating that there are almost no signs of time effects. In the last part of this section, we present the results of the Braumoeller [100] permutation test for high and low energy consumption efficiency performance. We used 10,000 permutations for each test run.
The hypotheses that the configurations for high environmental performance result from mere chance are strongly rejected in all cases. The adjusted p-values are highly significant (see Table 7 and Figure 10 below), and the permuted consistency distributions are always to the left of the observed consistencies.
Table 7.
Consistency for high energy consumption efficiency performance.
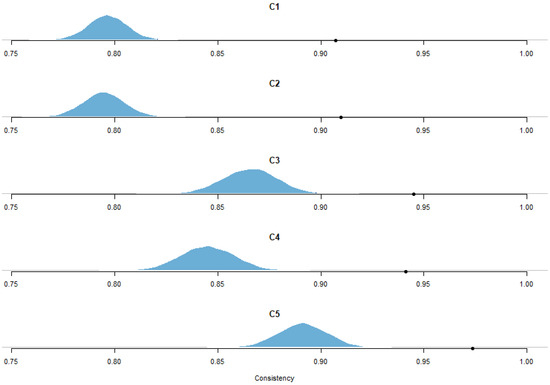
Figure 10.
Observed consistencies and consistency distributions based on permutations for high energy consumption efficiency performance. Notes: The permutation test is based on 10,000 replications. C1—FIP × ~GDP × CD × HE. C2—FIP × CD × HE × ~Gini. C3—~FIP × GDP × CD × Gini × CR. C4—FIP × ~GDP × CD × ~Gini × CR. C5—FIP × GDP × CD × Gini × CR. The dots represent the observed consistency scores, and the distributions are the permuted ones.
We reached the same conclusion for configurations leading to a low energy consumption efficiency performance. The hypotheses that the causal recipes are spurious are strongly rejected (See Table 8 and Figure 11 below).
Table 8.
Consistency for low energy consumption efficiency performance.
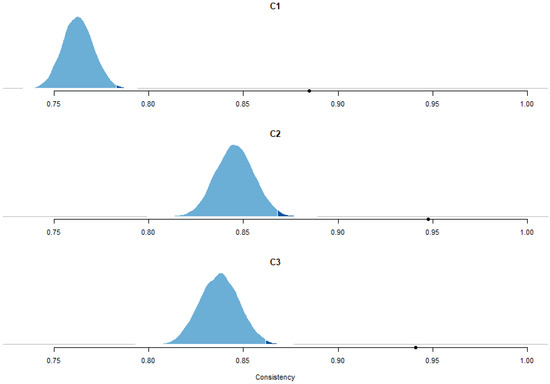
Figure 11.
Observed consistencies and consistency distributions based on permutations for low energy consumption efficiency performance. Notes: The permutation test is based on 10,000 replications. C1—~CD × ~HE × ~Gini × ~CR. C2—~FIP × ~CD × GDP × ~HE × ~Gini. C3—~FIP × ~CD × GDP × ~CR × ~Gini. The dots represent the observed consistency scores, and the distributions are the permuted ones.
5. Conclusions and Policy Implications
Causal conditions leading to high and low energy consumption efficiency performances of dwellings were researched for Portuguese municipalities, using data disaggregated by the municipality for the period 2015 to 2019, using a panel fuzzy set Qualitative Comparative Analysis. The study used, as the explained variable, the energy performance certificates. We considered high-energy consumption performance certificates (classes A+, A, and B) on total cumulative energy certificates (%). For low energy performance certificates we used the cumulative certificates with low consumption performance (classes D, E, and F) on total cumulative energy certificates (%). The explanatory variables comprise (i) fiscal/financial incentive policies for energy efficiency for the residential sector, (ii) gross domestic product per capita at 2016 constant prices, (iii) the portion of the population of each municipality that is enrolled in higher education (%), (iv) the Gini coefficient of gross declared income deducted from personal income tax assessed per tax household, (v) completed dwellings in new construction for family dwelling by municipality per 10,000 inhabitants, and (vi) completed reconstructions for family dwelling by municipality per 10,000 inhabitants.
The study’s results support that several combinations of variables cope with this goal to achieve the energy performance of dwellings. However, the study also reveals that causal conditions of high energy consumption efficiency were not symmetric to low energy consumption efficiency. These results confirm that the energy performance of dwellings (i) is complex, (ii) requires the use of statistical techniques able to handle asymmetrical multiple causal conditions, (iii) the causal conditions of high energy consumption efficiency dwellings are more diversified (five causal conditions) than for low energy consumption efficiency of dwellings (three causal conditions), and (iv) the transitions from low to the high energy consumption performance of dwellings involve the management of variables through time.
Five causal conditions are sufficient for high energy consumption efficiency performance in dwellings. These causal conditions include many fiscal and financial incentive policies, a highly educated population, and many completed dwellings coupled with low GDP. The study also found that a high disparity between completed dwellings and completed reconstructions, coupled with a low GDP and few policies, can lead to high energy consumption efficiency performance. The study also showed slight differences between the yearly consistencies, supporting that time effects are not disturbing. On the other hand, a low education level, Gini coefficient, few completed dwellings, and reconstructions, coupled with few fiscal and financial policies, can be causal conditions leading to low energy consumption efficiency performance of dwellings.
Three causal conditions are sufficient for low energy consumption efficiency performance in dwellings. The configurations involve (i) low education level and Gini coefficient, few completed dwellings and reconstructions, (ii) few fiscal and financial policies, low inequality, few completed dwellings, low educational level, and a high GDP, and (iii) few fiscal and financial policies, low inequality, few completed dwellings, few completed reconstructions, and a high GDP. Furthermore, the yearly consistency scores reveal almost no signs of time effects.
The study innovates by confirming the relevance of variables identified in the literature, but with the nuance of multiple configurations achieving high (or low) energy consumption efficiency performance in dwellings.
The study reveals that the factors causing low energy efficiency in dwellings differ from those responsible for high energy consumption efficiency, highlighting the importance of tailored policies. To that end, the following policy recommendations are suggested: (i) Increase fiscal and financial incentives for energy efficiency in the residential sector. Municipalities should prioritize policies that offer tax breaks, subsidies, and other financial incentives to homeowners who invest in energy-efficient home upgrades. (ii) Enhance the educational level of the population, with an emphasis on environmental and energy literacy. Municipalities should promote educational programs and initiatives to raise awareness among homeowners about the benefits of energy-consumption-efficient homes and provide them with the knowledge and skills to make informed decisions. (iii) Promote the construction and reconstruction of energy-efficient homes. Municipalities should encourage and facilitate new construction and reconstruction of existing buildings to increase the number of energy-efficient homes in their communities. (iv) Address income inequality. Municipalities should prioritize policies that reduce income inequality, as low-income households may not have the financial resources to invest in energy-efficient upgrades. (v) Design targeted policies for low energy consumption efficiency performance. Municipalities should devise policies targeting the causal conditions leading to low energy consumption efficiency performance in dwellings, such as education, fiscal and financial incentives, and completed dwellings and reconstructions. (vi) Address territorial diversity. Municipalities should evaluate which configurations for high or low energy consumption efficiency performance better service their path to achieving efficient dwellings. (vii) Monitor and evaluate policy outcomes over time. Municipalities should track the effectiveness of energy efficiency policies and adjust them to ensure they achieve the desired outcomes.
Overall, the study highlights the need for a multifaceted approach to achieve energy efficiency in dwellings with tailored policies that account for the unique causal conditions in each municipality. By prioritizing policies that enhance education, offer fiscal and financial incentives, and promote energy-efficient constructions and reconstructions, municipalities in Portugal can work towards achieving high energy consumption efficiency performance in dwellings, improving residents’ quality of life, and contributing to a more sustainable future.
5.1. Study Limitations
The primary limitation of this research was the restricted number of variables that could be analyzed at the municipality level, which limited the extent of complex analysis that could be performed. Including sociological variables that could capture the influence of household lifestyles and expectations is particularly relevant. Furthermore, this study requires further cross-validation to improve the reliability and confidence of our empirical findings. The current state of the art in the literature is still in its infancy, which restricts the depth of discussion. Additionally, the research would benefit from complementary analysis using other econometric techniques that can assess individual configurations identified by the fsQCA analysis, allowing for a more comprehensive examination of the results. Despite these limitations, this study provides valuable insights into the factors that influence energy efficiency in dwellings, and future research should consider the importance of sociological variables and explore other analytical techniques to enhance our understanding of the topic.
5.2. Further Research
Future research can expand on this study by extending the analysis to municipalities in other countries. This approach could identify more general causal configurations and add new variables to the existing literature. Additionally, future research could employ necessary condition analysis models to identify the essential factors and bottlenecks for energy efficiency performance in dwellings. Another fruitful avenue for future research is to incorporate techniques that can pre-identify municipalities that share common characteristics, reducing the disturbing effect of high levels of heterogeneity. Furthermore, future research could explore using qualitative methods, such as interviews and surveys, to gain a more in-depth understanding of the sociological and cultural factors that influence energy efficiency performance in dwellings. Finally, additional research could investigate the impact of policy interventions on energy efficiency in dwellings, providing insights into effective policy design and implementation. By conducting further research, we can improve our understanding of the factors influencing energy efficiency in dwellings and develop more effective strategies for promoting sustainable and energy-efficient housing.
Author Contributions
Introduction, literature review, data curation, original draft preparation, supervision, visualization, M.K.; conceptualization, methodology, writing and original draft preparation, supervision, validation, data curation, investigation, formal analysis, visualization, N.S.; conclusions, investigation, reviewing and editing, J.A.F. All authors have read and agreed to the published version of the manuscript.
Funding
The UCILeR is an R&D Unit accredited and funded by FCT—Portugal National Agency within the scope of its strategic project: UIDB/04643/2020. CeBER: R&D unit funded by National Funds through FCT—Fundação para a Ciência e a Tecnologia, I.P., project UIDB/05037/2020.
Data Availability Statement
Data are available on request from the corresponding author.
Conflicts of Interest
The authors declare no conflict of interest.
References
- Eurostat. Energy statistics—An overview. 2023. Available online: https://ec.europa.eu/eurostat/statistics-explained/index.php?title=Energy_statistics_-_an_overview (accessed on 14 March 2023).
- Palma, P.; Gouveia, J.P.; Simoes, S.G. Mapping the Energy Performance Gap of Dwelling Stock at High-Resolution Scale: Implications for Thermal Comfort in Portuguese Households. Energies 2019, 12, 1071. [Google Scholar] [CrossRef]
- Pablo-Romero, M.; Pozo-Barajas, R.; Yñiguez, R. Global Changes in Residential Energy Consumption. Energy Policy 2017, 101, 342–345. [Google Scholar] [CrossRef]
- Ramos, A.; Gago, A.; Labandeira, X.; Linares, P. The role of information for energy efficiency in the residential sector. Energy Econ. 2015, 52, S17–S29. [Google Scholar] [CrossRef]
- Lee, H.; Lee, M.; Lim, S. Do Consumers Care about the Energy Efficiency of Buildings? Understanding Residential Choice Based on Energy Performance Certificates. Sustainability 2018, 10, 4297. [Google Scholar] [CrossRef]
- Abela, A.; Hoxley, M.; McGrath, P.; Goodhew, S. An Investigation of the Appropriateness of Current Methodologies for Energy Certification of Mediterranean Housing. Energy Build. 2016, 130, 210–218. [Google Scholar] [CrossRef]
- Mudgal, S.; Lyons, L.; Cohen, F. Energy Performance Certificates in Buildings and Their Impact on Transaction Prices and Rents in Selected EU Countries. European Commission (DG Energy). 2013, pp. 1–158. Available online: https://ec.europa.eu/energy/sites/default/files/documents/20130619-energy_performance_certificates_in_buildings.pdf (accessed on 11 November 2022).
- Trotta, G.; Spangenberg, J.; Lorek, S. Energy Efficiency in the Residential Sector: Identification of Promising Policy Instruments and Private Initiatives among Selected European Countries. Energy Effic. 2018, 11, 2111–2135. [Google Scholar] [CrossRef]
- Noailly, J. Improving the Energy Efficiency of Buildings: The Impact of Environmental Policy on Technological Innovation. Energy Econ. 2012, 34, 795–806. [Google Scholar] [CrossRef]
- SCE. Emitted EPCs Ration. Available online: https://www.sce.pt/estatisticas/ (accessed on 14 March 2023).
- Collins, M.; Curtis, J. Bunching of Residential Building Energy Performance Certificates at Threshold Values. Appl. Energy 2018, 211, 662–676. [Google Scholar] [CrossRef]
- Gouveia, J.P.; Palma, P. Harvesting Big Data from Residential Building Energy Performance Certificates: Retrofit-ting and Climate Change Mitigation Insights at a Regional Scale. Environ. Res. Lett. 2019, 14, 095007. [Google Scholar] [CrossRef]
- Dell-Anna, F.; Bravi, M.; Marmolejo-Duarte, C.; Bottero, M.C.; Chen, A. EPC Green Premium in Two Different European Climate Zones: A Comparative Study between Barcelona and Turin. Sustainability 2019, 11, 5605. [Google Scholar] [CrossRef]
- Franke, M.; Nadler, C. Energy Efficiency in the German Residential Housing Market: Its Influence on Tenants and Owners. Energy Policy 2019, 128, 879–890. [Google Scholar] [CrossRef]
- Stanley, S.; Lyons, R.C.; Lyons, S. The price effect of building energy ratings in the Dublin residential market. Energy Effic. 2016, 9, 875–885. [Google Scholar] [CrossRef]
- Fuerst, F.; McAllister, P.; Nanda, A.; Wyatt, P. Does Energy Efficiency Matter to Homebuyers? An Investigation of EPC Ratings and Transaction Prices in England. Energy Econ. 2015, 48, 145–156. [Google Scholar] [CrossRef]
- Cajias, M.; Piazolo, D. Green Performs Better: Energy Efficiency and Financial Return on Buildings. J. Corp. Real Estate 2013, 15, 53–72. [Google Scholar] [CrossRef]
- European Commission. Energy Performance of Buildings. 2019. Available online: https://ec.europa.eu/energy/en/topics/energy-efficiency/energy-performance-of-buildings (accessed on 14 March 2023).
- Observatório da Energia. Indicadores Energéticos. Available online: https://www.observatoriodaenergia.pt/pt/energia-em-numeros/portugal/2008/2020/bar/certificados/2248-2298-2306 (accessed on 14 March 2023).
- PORDATA. Energy. Available online: https://www.pordata.pt/en/Subtheme/Europe/Energy-149 (accessed on 14 March 2023).
- Sarker, T.; Taghizadeh-Hesary, F.; Mortha, A.; Saha, A. The Role of Fiscal Incentives in Promoting Energy Efficiency in the Industrial Sector: Case Studies from Asia; ADBI Working Paper 1172; Asian Development Bank Institute: Tokyo, Japan, 2020; Available online: https://www.adb.org/publications/role-fiscalincentives-promoting-energy-efficiency-industrial-sector-asia (accessed on 14 March 2023).
- Filippini, M.; Hunt, L.; Zorić, J. Impact of energy policy instruments on the estimated level of underlying energy efficiency in the EU residential sector. Energy Policy 2014, 69, 73–81. [Google Scholar] [CrossRef]
- Lakić, E.; Domingos, D.; Gubina, A.F. How Important Is Energy Efficiency for Slovenian Households? A Case of Homeowners and Potential Homebuyers and Their Willingness to Invest in More Efficient Heating Controls. Energy Effic. 2021, 14, 9. [Google Scholar] [CrossRef]
- Gómez-Román, C.; Lima, M.L.; Seoane, G.; Alzate, M.; Dono, M.; Sabucedo, J.-M. Testing Common Knowledge: Are Northern Europeans and Millennials More Concerned about the Environment? Sustainability 2021, 13, 45. [Google Scholar] [CrossRef]
- Trotta, G. The Determinants of Energy Efficient Retrofit Investments in the English Residential Sector. Energy Policy 2018, 120, 175–182. [Google Scholar] [CrossRef]
- McCord, M.; Davis, P.; McCord, J.; Haran, M.; Davison, K. An Exploratory Investigation into the Relationship between Energy Performance Certificates and Sales Price: A Polytomous Universal Model Approach. J. Financ. Manag. Prop. Constr. 2020, 25, 247–271. [Google Scholar] [CrossRef]
- Reed, M.S.; Graves, A.; Dandy, N.; Posthumus, H.; Hubacek, K.; Morris, J.; Prell, C.; Quinn, C.H.; Stringer, L.C. Who’s in and why? A typology of stakeholder analysis methods for natural resource management. J. Environ. Manag. 2009, 90, 1933–1949. [Google Scholar] [CrossRef]
- Sayce, S.; Sundberg, A.; Clements, B. Is sustainability reflected in commercial property prices: An analysis of the evidence base. RICS Research, School of Surveying and Planning, Kingston University, January 2010. Available online: http://eprints.kingston.ac.uk/15747/1/Sayce-S-15747.pdf (accessed on 14 March 2023).
- Bleischwitz, R.; Bahn-Walkowiak, B.; Irrek, W.; Schepelmann, P.; Schmidt-Bleek, F.; Giljum, S.; Lutter, S.; Bohunovski, L.; Hinterberger, F.; Hawkins, E.; et al. Eco-Innovation-Putting the EU on the Path to a Resource and Energy Efficient Economy. Wuppertal Spezial No. 38, Wuppertal Institut für Klima, Umwelt und Energie, Wupper-tal. Available online: https://epub.wupperinst.org/frontdoor/deliver/index/docId/3433/file/WS38.pdf (accessed on 14 March 2023).
- Jonkutė, G.; Norvaišienė, R.; Banionis, K.; Monstvilas, E.; Bliūdžius, R. Analysis of Carbon Dioxide Emissions in Residential Buildings through Energy Performance Certification in Lithuania. Energy Sources Part B Econ. Plan. Policy 2020, 16, 198–215. [Google Scholar] [CrossRef]
- Thonipara, T.; Runst, P.; Ochsner, C.; Bizer, K. Energy Efficiency of Residential Buildings in the European Union—An Exploratory Analysis of Cross-Country Consumption Patterns. Energy Policy 2019, 129, 1156–1167. [Google Scholar] [CrossRef]
- Broin, E.Ó.; Nässén, J.; Johnsson, F. Energy Efficiency Policies for Space Heating in EU Countries: A Panel Data Analysis for the Period 1990–2010. Appl. Energy 2015, 150, 211–223. [Google Scholar] [CrossRef]
- Vine, E.; Pont, P.D.; Waide, P. Evaluating the Impact of Appliance Efficiency Labeling Programs and Standards: Process, Impact, and Market Transformation Evaluations. Energy 2001, 26, 1041–1059. [Google Scholar] [CrossRef]
- Winward, J.; Schiellerup, P.; Boardman, B. Cool Labels: The First Three Years of the European Energy Label; Environmental Change Institute, University of Oxford: Oxford, UK, 1998. [Google Scholar]
- European Commission. Climate Action and the Environment Energy: Climate Change. 2023. Available online: https://europa.eu/eurobarometer/surveys/detail/2273 (accessed on 14 March 2023).
- Gardner, G.T.; Stern, P.C. Environmental Problems and Human Behavior, 2nd ed.; Pearson Custom: Boston, MA, USA, 2002. [Google Scholar]
- Mills, B.; Schleich, J. Residential Energy-Efficient Technology Adoption, Energy Conservation, Knowledge, and Attitudes: An Analysis of European Countries. Energy 2012, 49, 616–628. [Google Scholar] [CrossRef]
- Poortinga, W.; Steg, L.; Vlek, C. Values, Environmental Concern, and Environmental Behaviour: A Study into Household Energy Use. Environ. Behav. 2004, 36, 70–93. [Google Scholar] [CrossRef]
- Nair, G.; Gustavsson, L.; Mahapatra, K. Factors Influencing Energy Efficiency Investments in Existing Swedish Residential Buildings. Energy Policy 2010, 38, 2956–2963. [Google Scholar] [CrossRef]
- Lainé, L. As Easy as EPC? Consumer Views on the Content and Format of the Energy Performance Certificate. Consumer Focus: London. 2011. Available online: www.consumerfocus.org.uk/files/2011/06/Easy-as-EPC-WEB.pdf (accessed on 14 March 2023).
- ERA. Barometer study results. 2012. Available online: www.era.be/fr/connaitre-ERA/les-news.aspx (accessed on 14 March 2023).
- CONSEED. Consumer Energy Efficiency Decision Making. Available online: https://conseedproject.eu/ (accessed on 14 March 2023).
- Pelenur, M. Household Energy Use: A Study Investigating Viewpoints towards Energy Efficiency Technologies and Behaviour. Energy Effic. 2018, 11, 1825–1846. [Google Scholar] [CrossRef]
- Frederiks, E.R.; Stenner, K.; Hobman, E.V. Household Energy Use: Applying Behavioural Economics to Understand Consumer Decision-Making and Behaviour. Renew. Sustain. Energy Rev. 2015, 41, 1385–1394. [Google Scholar] [CrossRef]
- Ferrantelli, A.; Petlenkov, E.; Thalfeldt, M.; Kurnitski, J. Evaluating the Energy Readiness of National Building Stocks Through Benchmarking. IEEE Access 2022, 10, 45430–45443. [Google Scholar] [CrossRef]
- Belaïd, F.; Ranjbar, Z.; Massié, C. Exploring the Cost-Effectiveness of Energy Efficiency Implementation Measures in the Residential Sector. Energy Policy 2021, 150, 112122. [Google Scholar] [CrossRef]
- Stern, P.C. Toward a Coherent Theory of Environmentally Significant Behavior. J. Soc. Issues 2000, 56, 407–424. [Google Scholar] [CrossRef]
- Lancaster, K. A New Approach to Consumer Theory. J. Political Econ. 1966, 74, 132–157. Available online: https://www.jstor.org/stable/1828835 (accessed on 14 March 2023). [CrossRef]
- Ürge-Vorsatz, D.; Novikova, A.; Sharmina, M. Counting Good: Quantifying the Co-benefit of Improved Efficiency in Buildings. In Proceedings of the ECEEE Summer Study, La Colle sur Loup, France, 1–6 June 2009; European Council for an Energy-Efficient Economy: Stockholm, Sweden, 2009. Available online: https://3csep.ceu.edu/sites/default/files/field_attachment/page/node-3234/cobenefitseceee2009.pdf (accessed on 14 March 2023).
- Barreca, A.; Fregonara, E.; Rolando, D. EPC Labels and Building Features: Spatial Implications over Housing Prices. Sustainability 2021, 13, 2838. [Google Scholar] [CrossRef]
- Khazal, A.; Sønstebø, O.J. Valuation of Energy Performance Certificates in the Rental Market—Professionals vs. Nonprofessionals. Energy Policy 2020, 147, 111830. [Google Scholar] [CrossRef]
- McCord, M.; Haran, M.; Davis, P.; McCord, J. Energy Performance Certificates and House Prices: A Quantile Regression Approach. J. Eur. Real Estate Res. 2020, 13, 409–434. [Google Scholar] [CrossRef]
- Cespedes-Lopez, M.F.; Mora-Garcia, R.T.; Perez-Sanchez, V.R.; Marti-Ciriquian, P. The Influence of Energy Certification on Housing Sales Prices in the Province of Alicante (Spain). Appl. Sci. 2020, 10, 7129. [Google Scholar] [CrossRef]
- Chegut, A.; Eichholtz, P.; Holtermans, R.; Palacios, J. Energy Efficiency Information and Valuation Practices in Rental Housing. J. Real Estate Finance Econ. 2020, 60, 181–204. [Google Scholar] [CrossRef]
- Wilhelmsson, M. Energy Performance Certificates and Its Capitalisation in Housing Values in Sweden. Sustainability 2019, 11, 6101. [Google Scholar] [CrossRef]
- Graaf, I. Capitalising Energy Efficiency in Housing Markets: An Investigation into the Impact of Energy Performance Certificates (EPCs) on Transaction Prices in Selected European Countries. Master’s Thesis, Technische Universität Wien, Diplomatische Akademie Wien, Wien, Austria, 2016; pp. 1–92. Available online: https://resolver.obvsg.at/urn:nbn:at:at-ubtuw:1-4442. (accessed on 14 March 2023).
- Cerin, P.; Hassel, L.G.; Semenova, N. Energy Performance and Housing Prices. Sustain. Dev. 2014, 22, 404–419. [Google Scholar] [CrossRef]
- Högberg, L. The Impact of Energy Performance on Single-Family Home Selling Prices in Sweden. J. Eur. Real Estate Res. 2013, 6, 242–261. [Google Scholar] [CrossRef]
- Fuerst, F.; McAllister, P. The Impact of Energy Performance Certificates on the Rental and Capital Values of Commercial Property Assets. Energy Policy 2011, 39, 6608–6614. [Google Scholar] [CrossRef]
- He, L.; Chen, L. The Incentive Effects of Different Government Subsidy Policies on Green Buildings. Renew. Sustain. Energy Rev. 2021, 135, 110123. [Google Scholar] [CrossRef]
- Villca-Pozo, M.; Gonzales-Bustos, J.P. Tax Incentives to Modernise the Energy Efficiency of the Housing in Spain. Energy Policy 2019, 128, 530–538. [Google Scholar] [CrossRef]
- Bonifaci, P.; Copiello, S. Incentive Policies for Residential Buildings Energy Retrofit: An Analysis of Tax Rebate Programs in Italy. In Proceedings of the International Conference on Smart and Sustainable Planning for Cities and Regions, Bolzano, Italy, 22–24 March 2017. [Google Scholar]
- Ferrantelli, A.; Kurnitski, J. Energy Performance Certificate Classes Rating Methods Tested with Data: How Does the Application of Minimum Energy Performance Standards to Worst-Performing Buildings Affect Renovation Rates, Costs, Emissions, Energy Consumption? Energies 2022, 15, 7552. [Google Scholar] [CrossRef]
- Neveu, A.R.; Sherlock, M.F. An Evaluation of Tax Credits for Residential Energy Efficiency. East. Econ. J. 2016, 42, 63–79. [Google Scholar] [CrossRef]
- Ameer, B.; Krarti, M. Impact of Subsidisation on High Energy Performance Designs for Kuwaiti Residential Buildings. Energy Build. 2016, 116, 249–262. [Google Scholar] [CrossRef]
- Shen, L.; He, B.; Jiao, L.; Song, X.; Zhang, X. Research on the development of main policy instruments for improving building energy efficiency. J. Clean. Prod. 2016, 112, 1789–1803. [Google Scholar] [CrossRef]
- Alberini, A.; Bigano, A. How Effective Are Energy-Efficiency Incentive Programs? Evidence from Italian Homeowners. Energy Econ. 2015, 52, S76–S85. [Google Scholar] [CrossRef]
- Chen, W.; Hong, X. Design of Effective Subsidy Policy to Develop Green Buildings: From the Perspective of Policy Benefit. Clean Technol. Environ. Policy 2015, 17, 1029–1038. [Google Scholar] [CrossRef]
- Charlier, D. Energy Efficiency Investments in the Context of Split Incentives among French Households. Energy Policy 2015, 87, 465–479. [Google Scholar] [CrossRef]
- Dubois, M.; Allacker, K. Energy savings from housing: Ineffective renovation subsidies vs efficient demolition and reconstruction incentives. Energy Policy 2015, 86, 697–704. [Google Scholar] [CrossRef]
- Morton, C.; Wilson, C.; Anable, J. The Diffusion of Domestic Energy Efficiency Policies: A Spatial Perspective. Energy Policy 2018, 114, 77–88. [Google Scholar] [CrossRef]
- Gamtessa, S.F. An Explanation of Residential Energy-Efficiency Retrofit Behaviour in Canada. Energy Build. 2013, 57, 155–164. [Google Scholar] [CrossRef]
- Hamilton, I.G.; Shipworth, D.; Summerfield, A.J.; Steadman, P.; Oreszczyn, T.; Lowe, R. Uptake of Energy Efficiency Interventions in English Dwellings. Build. Res. Inf. 2014, 42, 255–275. [Google Scholar] [CrossRef]
- Hamilton, I.G.; Summerfield, A.J.; Steadman, J.P.; Oreszczyn, T.; Lowe, R. Energy Efficiency Uptake and Energy Savings in English Houses: A Cohort Study. Energy Build. 2016, 118, 259–276. [Google Scholar] [CrossRef]
- Tovar, M.A. The Structure of Energy Efficiency Investment in the UK Households and Its Average Monetary and Environmental Savings. Energy Policy 2012, 50, 723–735. [Google Scholar] [CrossRef]
- Koengkan, M.; Fuinhas, J.A.; Osmani, F.; Kazemzadeh, E.; Auza, A.; Alavijeh, N.K.; Teixeira, M. Do Financial and Fiscal Incentive Policies Increase the Energy Efficiency Ratings in Residential Properties? A Piece of Empirical Evidence from Portugal. Energy 2022, 241, 122895. [Google Scholar] [CrossRef]
- Fuinhas, J.A.; Koengkan, M.; Silva, N.; Kazemzadeh, E.; Auza, A.; Santiago, R.; Teixeira, M.; Osmani, F. The Impact of Energy Policies on the Energy Efficiency Performance of Residential Properties in Portugal. Energies 2022, 15, 802. [Google Scholar] [CrossRef]
- Galvin, R. Letting the Gini out of the Fuel Poverty Bottle? Correlating Cold Homes and Income Inequality in European Union Countries. Energy Res. Soc. Sci. 2019, 58, 101255. [Google Scholar] [CrossRef]
- Bouzarovski, S.; Simcock, N. Spatialising Energy Justice. Energy Policy 2017, 107, 640–648. [Google Scholar] [CrossRef]
- Savacool, B. Fuel poverty, affordability, and energy justice in England: Policy insights from the warm front program. Energy 2015, 93, 361–371. [Google Scholar] [CrossRef]
- Ameli, N.; Brandt, N. Determinants of Households’ Investment in Energy Efficiency and Renewables: Evidence from the OECD Survey on Household Environmental Behaviour and Attitudes. Environ. Res. Lett. 2015, 10, 44015. [Google Scholar] [CrossRef]
- Berkouwer, S.B.; Dean, J.T. Credit and Attention in the Adoption of Profitable Energy-Efficient Technologies in Kenya. Energy Institute WP 303. Available online: https://escholarship.org/uc/item/8g698115 (accessed on 14 March 2023).
- Koengkan, M.; Fuinhas, J.A. Heterogeneous Effect of “Eco-Friendly” Dwellings on Transaction Prices in Real Estate Market in Portugal. Energies 2022, 15, 6784. [Google Scholar] [CrossRef]
- International Energy Agency. Available online: https://www.iea.org/ (accessed on 14 March 2023).
- Instituto Nacional de Estatística. Available online: https://www.ine.pt/xportal/xmain?xpgid=ine_main&xpid=INE&xlang=en (accessed on 14 March 2023).
- Direção-Geral de Estatísticas da Educação e Ciência. 2022. Available online: https://www.dgeec.mec.pt/np4/home (accessed on 14 March 2023).
- Koengkan, M.; Fuinhas, J.A.; Auza, A.; Ursavaş, U. The Impact of Energy Efficiency Regulations on Energy Poverty in Residential Dwellings in the Lisbon Metropolitan Area: An Empirical Investigation. Sustainability 2023, 15, 4214. [Google Scholar] [CrossRef]
- Sathre, R.; Gustavsson, L. Variability in energy and carbon dioxide performance of wood-framed multi-family buildings. Build. Res. Inf. 2011, 39, 589–604. [Google Scholar]
- Gough, K.V.; Pollitt, H.; Watson, J. Addressing Fuel Poverty and Energy Efficiency in the UK: Policy and Practice. Energy Policy 2016, 140, 280–290. [Google Scholar] [CrossRef]
- Attia, S.; De Herde, A.; Hamdy, M. Impact of Completed Dwellings and Reconstructed Buildings on Energy Efficiency in the Residential Sector. Sustainability 2018, 10, 2889. [Google Scholar] [CrossRef]
- Ragin, C.C. The Comparative Method: Moving beyond Qualitative and Quantitative Strategies; University California Press: Berkeley, CA, USA, 1987. [Google Scholar]
- Zadeh, L.A. Fuzzy Sets. Inf. Control 1965, 8, 338–353. Available online: https://web.archive.org/web/20150813153834/http://www.cs.berkeley.edu/~zadeh/papers/Fuzzy%20Sets-Information%20and%20Control-1965.pdf (accessed on 14 March 2023). [CrossRef]
- Fiss, P.C. Building better causal theories: A fuzzy set approach to typologies in organization research. Acad. Manag. J. 2011, 54, 393–420. [Google Scholar] [CrossRef]
- Ragin, C.C. Redesigning Social Inquiry: Fuzzy Sets and Beyond; University of Chicago Press: Chicago, IL, USA, 2008. [Google Scholar]
- Misangyi, V.F.; Greckhamer, T.; Furnari, S.; Fiss, P.C.; Crilly, D.; Aguilera, R. Embracing Causal Complexity: The Emergence of a Neo-Configurational Perspective. J. Manag. 2017, 43, 255–282. [Google Scholar] [CrossRef]
- Carsten, Q.; Schneider, C.Q.; Wagemann, C. Standards of Good Practice in Qualitative Comparative Analysis (QCA) and Fuzzy-Sets. Comp. Sociol. 2010, 9, 397–418. [Google Scholar] [CrossRef]
- Rihoux, B.; Ragin, C.C. Configurational Comparative Methods: Qualitative Comparative Analysis (QCA) and Related Techniques; Sage Publications: Thousand Oaks, CA, USA, 2009. [Google Scholar]
- Garcia-Castro, R.; Ariño, M.A. A General Approach to Panel Data Set-Theoretic Research. J. Adv. Manag. Sci. Inf. Syst. 2016, 2, 63–76. [Google Scholar] [CrossRef]
- Krogslund, C.; Choi, D.; Poertner, M. Fuzzy Sets on Shaky Ground: Parameter Sensitivity and Confirmation Bias in fsQCA. Political Anal. 2015, 23, 21–41. [Google Scholar] [CrossRef]
- Braumoeller, B. Guarding Against False Positives in Qualitative Comparative Analysis. Political Anal. 2017, 23, 471–487. [Google Scholar] [CrossRef]
Disclaimer/Publisher’s Note: The statements, opinions and data contained in all publications are solely those of the individual author(s) and contributor(s) and not of MDPI and/or the editor(s). MDPI and/or the editor(s) disclaim responsibility for any injury to people or property resulting from any ideas, methods, instructions or products referred to in the content. |
© 2023 by the authors. Licensee MDPI, Basel, Switzerland. This article is an open access article distributed under the terms and conditions of the Creative Commons Attribution (CC BY) license (https://creativecommons.org/licenses/by/4.0/).