Abstract
The industrial sector is a crucial economic pillar, seeing annual increases in the production output. In the last few years, a greater emphasis has been placed on the efficient and sustainable use of resources within industry. The use of compressed air in this field is hence gaining interest. These systems have numerous benefits, such as relative low investment costs and reliability; however, they suffer from low-energy efficiency and are highly susceptible to faults. Conventional detection systems, such as ultrasonic leak detection, can be used to identify faults. However, these methods are time consuming, meaning that leakages are often left unattended, contributing to additional energy wastage. Studies published in this area often focus on the supply side rather than the demand side of pneumatic systems. This paper offers a novel review based on the Preferred Reporting Items for Systematic Reviews and Meta-Analyses (PRISMA) methodology of fault detection methods on the demand side of compressed air systems, leading towards a comprehensive understanding of smart and sustainable pneumatic systems. Fifty-three studies were classified and reviewed under the following three areas: (a) demand parameters which help in identifying fault sources; (b) approaches taken to analyse the parametric data; and (c) the role of Artificial Intelligence (AI) in pneumatic fault monitoring systems. This review shows that fault detection on the demand side has received greater importance in the last five years and that data analysis is crucial for AI to be implemented correctly. Nevertheless, it is clear that further research in this sector is essential, in order to investigate more complex systems. It is envisaged that this study can promote the adoption of such systems, contributing to an energy-efficient and cost-effective industry.
1. Introduction
The industrial sector has cemented itself as being one of the main economic pillars in the European Union (EU). This is evident when reviewing statistics, particularly 2019 pre-pandemic figures which show that production in the industrial sector increased by approximately 8 per cent, compared to 2015 [1]. Different industries, including manufacturing, use Compressed Air (CA) as an energy storage and transfer medium [2]. This energy source is used to power pneumatic equipment which are commonly adopted in industrial applications due to their advantages, including cleanliness and safety, amongst others [3,4]. Nevertheless, the industrial sector is amongst one of the main polluters in the EU, ranking second, following energy production [5]. One of the main reasons for this is the high energy consumption attributed to the production of CA where, in certain applications, the electrical demand amounts to 20 to 50 per cent [6,7]. For context, Saidur et al. [8] state that approximately 10 per cent of the total electrical energy consumed by the EU in industry is attributable to the production of CA.
Compressed Air Systems (CAS) comprise of two subsystems: the supply side and the demand side, with the former responsible for generating, conditioning and storing the system’s CA whilst the latter distributes it to respective end-effectors [9]. These systems are quite complex, consisting of various components and for this reason, the occurrence of inefficiencies is very likely, rendering them quite inefficient [10,11,12]. On the demand side, the three most occurring inefficiency sources are artificial demand, inappropriate uses and leaks. Indeed, R. Marshall [13] adds that up to 50 per cent of the CA produced is wasted due to these losses. Abdelaziz et al. [14] also claim that leaks can reduce the output by 50 per cent. For this reason, it is often reported that the overall energy efficiency of these systems is approximately 10 to 12 per cent [15]. To keep up with the required demand, the compressor has to work more frequently to counter these losses, thereby directly increasing the emitted emissions and energy costs. For instance, a study by R. Dindorf et al. [16] states that leaks can contribute to an increase of 40–50 per cent in the energy costs and emissions, whilst a study by T. Guenther et al. [17] suggests an increase of 20 per cent. It is estimated that in Europe, the average cost of CA is €0.02/m3 [7].
It has also been reported that the associated hissing noise of compressed air leaks, causes stress, anxiety and high blood pressure, amongst other health problems [18]. Safety is also another challenging issue, since pressurised faulty equipment may not operate as intended, causing hazardous working conditions in the plant [19]. The social pillar is therefore also adversely impacted by the presence of leaks, directly causing health issues.
A push towards sustainable operation in the industrial sector has been heavily promoted in recent years. These include efforts such as the EU 2030 Target Plan [20], the EU Green Deal Industrial Plan [21] and the Sustainable Development Goals by the United Nations [22], all providing targets that companies and countries should follow. For instance, the EU plans specify that greenhouse emissions need to be reduced by 55 per cent by 2030, as compared to 1990 levels, and that the EU should become climate-neutral by 2050 [20,21]. The EU Machinery Directive [23] and other safety related standards also highlight the importance of properly maintaining equipment in order to lessen the occurrence of injuries.
In the case of CAS, the majority of improvements lie in fault repair. Indeed, this was seconded by the study conducted by S. Çağman et al. [24], where the results showed that across 44 industrial companies, including the automotive and food sectors, over 42 per cent of the energy-saving potential lied in fault repairs. In another study performed in Malta, a single UV varnishing line was investigated for leak repairs. It was concluded that these would save the company 32 per cent in financial and environmental repercussions, translating to €2864 in energy bills and 10.12 tonnes of CO2 emissions, requiring 15 photovoltaic panels to offset [25]. For further context, K. Abela et al. [26] also quantified the annual financial repercussions of differently sized leaks, at different pressures (Table 1). With the introduction of the Green Deal Plan, S. Çağman et al. [24] claimed that companies have another incentive to perform these improvements, mainly to benefit from reduced carbon taxes imposed by said plan. These improvements however, are not often implemented since they require a considerable amount of downtime, mainly to identify the fault source [27]. Although equipment, such as ultrasonic leakage detectors, which amplify the leak hissing noise, aid in the fault-finding process, the procedure is still heavily user dependent and time consuming, deterring companies from performing the repairs.

Table 1.
The annual financial repercussions of differently sized leaks [26].
In light of the mentioned shortcomings, pneumatic fault detection has been increasingly researched in recent years. This is a consequence of the advancements made on the concept of the Industrial Internet of Things (IIoT), which has embedded itself into multiple systems, with improvements in both smart sensors and cloud manufacturing being catalysts for the phenomenon [28,29]. For CAS, the aim of adopting this approach is to develop a system capable of intelligently identifying the presence of fault sources, whilst remotely surveying the performance of the set-up [30,31]. For instance, KAESER developed the ‘Sigma Air Utility’ [32], a system focused on automatically identifying the presence of faults on the supply side of the set-up, whilst automatically sending user alert notifications.
Research has also advanced as studies were published with the objective of improving and automating the fault detection process. However, both R. Cupek et al. [33] and K. Abela et al. [26,34] observed that the majority of current studies and systems in this area focus only on the supply side, neglecting the demand side. This was seconded by Neale et al. [35] who claimed that not only are demand improvements five times cheaper to implement, but they have the potential of improving the overall efficiency by 50–70 per cent. P. Eret et al. [36] also conclude that a key step towards optimising and improving efficiency in CAS is to focus on fault repairs in this subsystem.
In the last five years, a few products, such as the ‘Energy Efficiency Module’ by Festo [37], the ‘Air Management System’ by SMC [38], and the ‘Smart Pneumatics Monitor’ by Aventics [39], have been developed focusing on the demand side. All systems claim to automatically detect the presence of faults using sensor data. A push towards designing similar systems using generic equipment has been prioritized in certain studies, with the aim of encouraging companies to adopt these systems. With these observations in mind, it can be deduced that further research in this sector, mainly on the demand side, will highly benefit the area in question, helping to further develop reliable and attractive fault detection and monitoring systems.
1.1. Research Aim and Objectives
To the authors’ knowledge, review studies examining pneumatic fault detection on the demand side are not frequently covered. One of the closest studies found that relates to this paper was by P. Conada et al. [40]. However, this paper mainly reviews the working principle and advantages of vibration monitoring in CAS, rather than providing a thorough review of demand pneumatic fault detection. In view of these observations, this study aims to present a systematic review of the literature which holistically focuses on pneumatic fault monitoring on the demand side. This entails, providing details about current fault monitoring parameters used for pneumatic fault detection, followed by describing the approaches available in order to analyse the recorded data. In doing so, one will also be able to identify trends, including the different fault types currently investigated in these studies and the most commonly used parameters in this sector, amongst others. Finally, with Artificial Intelligence (AI) based approaches being implemented in numerous monitoring studies, the importance of data analysis with respect to this concept is also highlighted.
Hence, the main objectives of this study are as follows:
- Synthesising and critically comparing the sensor data and current state-of-the-art utilised in fault detection studies (Section 3.3);
- Understanding how sensor data is utilised in modern fault detection systems (Section 3.4);
- Establishing the importance of data analysis in implementing AI techniques (Section 3.5);
- Contributing a systematic review on demand pneumatic fault detection.
2. Methodology: A PRISMA-Based Systematic Review
This study aims to provide a holistic review of pneumatic fault detection, focusing on the demand side. In light of this, the PRISMA (Preferred Reporting Items for Systematic Reviews and Meta-Analyses) protocol was adopted for this study. Following the suggestions of Regona et al. [41] and T. Cortese et al. [42], this review is structured on the following three stages:
- Planning the development of the research aim, objectives and search criteria;
- Conducting the review;
- Disseminating the results.
The review was conducted using the Scopus and Web of Science databases since both contain a considerable amount of relevant indexed journals [43]. The first stage commenced by identifying the research aim and objectives (defined in Section 1.1) and the keywords to be used. “Compressed air” and “pneumatic” were the first two identified terms and served as the foundation of the search. Following prior searches, other keywords which were also identified as relevant included: “monitoring”, “anomaly detection”, “preventive maintenance”, “predictive maintenance”, “leak”, “leakage”, “fault”, “detection”, “diagnosis”, “review” and “sustainability analysis”. This was followed by identifying the inclusion and exclusion criteria, summarised in Table 2.
Table 2.
The criteria followed during the selection process.
The next step of the PRISMA methodology was to conduct the literature search. The keywords identified in the prior stage were used for the searches in both databases; (“pneumatic” OR “compressed air”) AND (“monitoring” OR “anomaly detection” OR “preventive maintenance” OR “predictive maintenance” OR “leak” OR “leakage” OR “fault” OR “detection” OR “diagnosis” OR “review” OR “sustainability analysis” OR “performance degradation”). In both search engines, this search was limited to the title, abstract and keywords, and the documents found were sorted according to relevance. Care was also taken not to specify any application, since CAS can be used for various applications. Due to rapid technological advancement in this area, the search was limited to a range of 11 years, i.e., 2013 to 2023, in order to exclude relatively outdated information which may no longer be novel and relevant. The search yielded a substantial number of results, being 11,797 for Scopus and 5829 for Web of Science. To this end, the first 250 non-duplicate documents (sorted by relevance) from each database were shortlisted and assessed (i.e., a total of 500 studies). After screening the abstracts of each study, a total of 92 studies were chosen to be fully reviewed. For this selection process, the following criteria were considered, which ensured that the studies chosen contributed towards fulfilling the research aims:
- Identifying studies which focus on the demand side of pneumatic monitoring;
- Recognising which parameters are utilised for fault detection;
- Determining the different approaches which these parameters can be used for fault detection;
- Establishing the role of data analysis in the implementation of AI tools.
Ultimately, after each chosen study was read in full, 53 papers were selected to be included in this review as these were considered as fulfilling the criteria. Specific details on each study can be found in Appendix A. Figure 1 provides a summary of the completed PRISMA process [44]. Initial observations, together with a detailed review are discussed in the following sections. Some supplementary material was also included in order to aid the user to understand certain concepts. In order to reduce bias, the review was performed by three researchers.
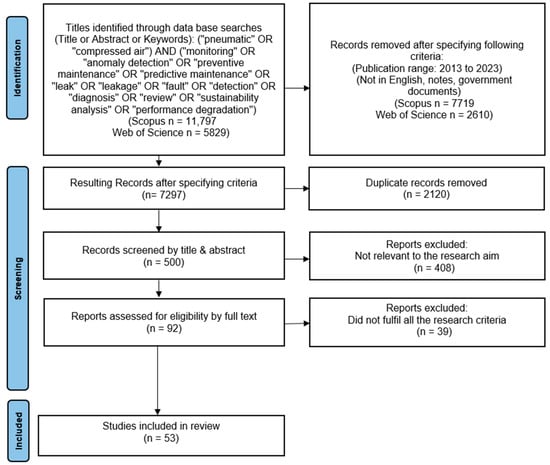
Figure 1.
A summary of the PRISMA process adopted for this review [44].
3. Results and Discussions
3.1. General Observations
The initial findings highlighted the fact that studies focusing on the demand side are not frequently researched. For instance, from 500 studies, 53 were chosen for the final review since the vast majority were oriented towards the study of the supply side of compressed air systems. Apart from this, those studies which solely focused on AI approaches for fault monitoring in CAS were also discarded since they described the working concept of these methods, rather than how fault identification on the demand side could be performed.
At first glance, a trend was apparent from the chosen sources, being that the popularity of pneumatic fault detection on the demand sub-system has increased in recent years. For context, over 60 per cent of the reviewed studies were published in the last five years (2018–2022). In contrast, earlier years covered this area less frequently, with year 2015 in particular since one relevant study was found. The annual distribution of the resulting studies is shown in Figure 2. Another observation was that only two studies did not relate to industrial applications, with their focus being on the pneumatic suspension and pneumatic brakes of trains. Nevertheless, this shows that knowledge in this area can be used for various applications.
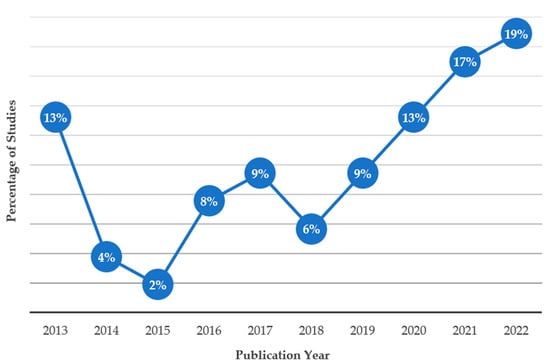
Figure 2.
The annual distribution of the studies covered in this review.
The review process focused on identifying sources that relate to demand pneumatic fault detection. However, three other sub-topics were also identified, all contributing towards fulfilling the proposed objectives:
- Parameters utilised to identify fault sources;
- The approach taken to use the parametric data for fault detection;
- The role of AI in pneumatic fault detection.
These can also be further divided into subsequent topics, which are summarised in Figure 3. For this reason, the systematic review was divided in three sections (Section 3.3, Section 3.4 and Section 3.5), and each article was classified accordingly.
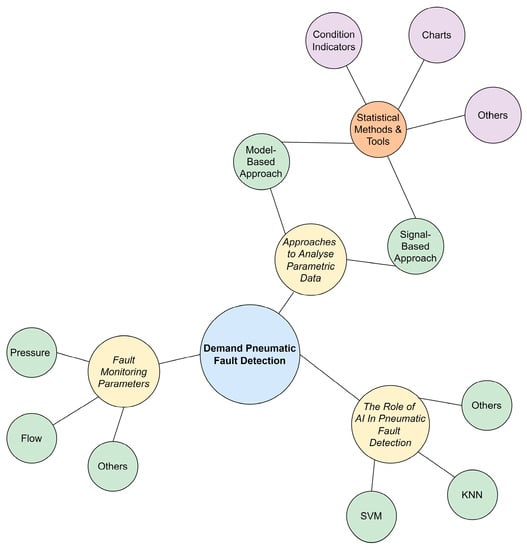
Figure 3.
Main topics concerning demand-oriented pneumatic fault detection covered in this review.
3.2. Common Faults Encountered
With pneumatic systems being quite complex set-ups, consisting of a network of components, the faults encountered can be numerous. Upon reviewing the selected papers, the faults investigated could be categorised into five:
- Control valve faults;
- CA line faults;
- Actuator faults;
- Valve faults;
- Heavy-vehicle actuator faults (Non-Industrial Application).
The bar chart in Figure 4, also shows the frequency of each fault type examined by these studies.
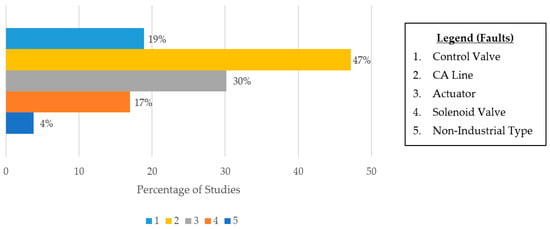
Figure 4.
The frequency of faults investigated in the selected studies.
These results show that the most covered fault types were those in the CA line, followed by actuator and valve faults, all commonly encountered in industrial applications. On the contrary, non-industrial faults were less covered, making up only 4 per cent of the total studies. Another observation was that the majority of the studies focused on investigating one type of fault. To this end, only 34 per cent explored in detail the effects of multiple faults. This percentage also includes control valves, where up to 19 faults could be induced through a program called Development and Application of Methods for Actuator Diagnosis in Industrial Control Systems (DAMADICS) benchmark [45,46,47,48,49]. This meant that the majority of the investigations were relatively simple compared to those found in the industry, where multiple faults are present simultaneously. Furthermore, more than half of the papers (i.e., 51 per cent) focused on specific components, including actuators and valves. This continues to affirm the previous statement, highlighting the fact that published studies often analyse less complex systems. Finally, excluding studies focusing on control valves, all the faults examined were leaks. Although some studies introduced flow controllers, such as those found in [50], these were not utilised to induce pressure drops, but rather to regulate the flow through the leak. This again highlights the previous observation, with R. Kosturkov et al. [7] also stating that further research on more complex systems is required to further improve these set-ups. Consequently, the main limitation of the study was identified, being that the majority of this review focused on simple systems, rather than complex industrial systems. Furthermore, publication bias should also be considered, since it is likely that studies without conclusive results did not publish their findings.
3.3. Fault Monitoring Parameters
The first step towards determining the presence of faults is to identify changes in the system’s behaviour. To do so, different parameters can be recorded which allow the user to detect these changes. In this section, different measurements which are currently used to find faults are reviewed. These include parameters which are traditionally used in pneumatic systems, including flow rate and pressure, together with others which are relatively new, including current output and non-invasive methods. Appendix A summarises the parameters used for each selected study.
3.3.1. Flow and Pressure
In general, leaks and faults are often associated with pressure drops and increase in flow, since these are the most apparent changes encountered. For instance, in the study by R. Dindorf et al. [16], tests were performed on a system of unknown size and flow rate measurements were recorded using a flow meter on a CA line situated upstream to the valve manifold. It was concluded that a leak caused the flow rate to increase by 4.58 NL/min, at a system pressure of 5 bar. Another example is the study by R. Cupek et al. [33] where a test bed comprising of a double acting actuator and a suction cup experienced higher flow rate peaks in excess of 10 per cent whilst a leak of unknown size was induced. In a study by K. Abela et al. [34], tests were performed on a small set-up consisting of a single double acting actuator. A 1.6 mm leak was induced downstream to the consumer unit and pressure measurements were recorded both upstream and downstream to the fault. The results showed that drops were recorded in both measurements, where the upstream pressure decreased by approximately 2 per cent whilst the post leak pressure reduced by 7 per cent. Since the flow rate and pressure measurements offer good fault identification results, both are often recorded simultaneously during fault monitoring, such as in the latter study. The changes in flow and pressure can be attributed to Bernoulli’s Principle, described by Equation (1). From this relationship, the total pressure (PTotal) is constant and is the sum of the static pressure (PStatic), dynamic pressure (PDynamic) and Frictional Losses. Typically, pressure transducers measuring the system pressure are installed perpendicular to the CA flow, hence the system pressure at a particular point is PStatic. Consequently, PDynamic is the pressure generated by a flowing fluid. Therefore, a leak causes the CA flow to increase, thereby contributing to a rise in the PDynamic and pipe frictional losses. Since PTotal remains constant, PStatic decreases, hence reducing the overall system pressure.
Other studies have developed methods which identify the presence of faults by focusing on pressure measurements. For instance, the study by R. Dindorf et al. [16] presented a method where faults could be identified by measuring pressure drops to indirectly calculate the flow rate of the fault. The working principle was that the mass flow rate is a function of the piping volume and the derivative of pressure with time. Assuming a polytropic process, as the flow rate increases due to the fault, the pressure derivative decreases. For instance, when a leak was induced at a system pressure of 4.91 bar, the recorded pressure drop was approximately 2 per cent over 60 s. Using this method, this pressure decay was translated to a leak of 4.73 NL/min. It was also claimed that this method was quite accurate since the calculated values had a minimal error of approximately 4 per cent. A similar concept was developed by Y. Shi et al. [51], where the leakage flow rate could be detected by measuring the differential pressure between the component investigated and a reference one. Indeed, this study highlighted that this technique was able to calculate the flow rate with sufficient accuracy of over 75 per cent. However, in order to adopt such a method, all actuations have to be halted which increases the downtime. Another example that used pressure drops to identify faults was the study by C. Yang et al. [52] which focused on train hydro-pneumatic suspension springs. The working principle was to collect pressure data using an in-built sensor found inside the component, together with recording the displacement of said spring. Experiments were performed by inducing leaks in order to measure the pressure degradation, with each trial lasting 10 min. Two differently sized leaks were induced, and although the actual size of each fault was not stated, the pressure decay recorded for each leak at the same displacement was approximately 5 and 43 per cent, respectively.
3.3.2. Cycle Time
The fact that modern systems use multiple sensors increases the probability of sensor failure. Consequently, efforts are made to try and reduce the number of sensors utilised. One parameter that has emerged as capable of reliably detecting faults is the cycle time (i.e., actuation timing), which can be recorded using proximity sensors or linear encoders, already installed on the set-up.
The study by W. Gauchel et al. [53] investigates in detail the effects of faults on the cycle time. It emphasizes how this parameter could be used to identify faults using the travelling time (i.e., the time between leaving the first end position and reaching the second end position) and the reaction time (i.e., the time between valve signal and leaving first end position). To induce faults, a flow controller was installed in the upper cylinder chamber, implying that the fault was present only during the extension phase. It was deduced that for all leak settings, the closing reaction time was significantly less than the control. This was attributed to the fact that whilst the valve switched positions (i.e., from the opening position to the closing position), the leak caused the pressure in the upper chamber to drop faster, thereby reducing the reaction time. Furthermore, the fault also increased the exhaust area; therefore, reducing the travelling time of the clamp actuation. For instance, when the leak was adjusted to the 36 per cent setting, the reaction and travelling times dropped by 23 and 28 per cent, respectively. On the contrary, for the opening action, the leakage orifice delayed the build-up of pressure in the upper chamber, hence increasing the reaction time. Conversely, travelling time was also reduced when a significant leak was induced. This was a result of the delay in the reaction time since as the pressure built up in the upper chamber, the pressure in the lower chamber dropped. This meant that when the movement of the piston eventually initiated, the pressure drop in the lower chamber allowed for the clamp to open faster. Thus, for this leak, the opening reaction time increased by 11 per cent whilst the travelling time reduced by 3 per cent.
The cycle time parameter was also utilised to identify faults in solenoid valves. For instance, Kulkarni et al. [54] recorded the opening and closing times of a 3/2-way solenoid valve with respect to leaks. In their study, the fault was induced either in the supply port of the valve, using a bypass valve, or in the exhaust port via a vent valve. Both fault types were induced by adjusting the opening position of the bypass and vent valves. Although the actual leak dimensions were not provided, the sizes were categorised between 0 to 100 per cent, according to the valve position opening setting. The findings showed that the leak in the supply port caused the valve to open faster and close slower than the control, whilst the leak in the exhaust port caused the valve to close quicker and open slower. The reason for this was that again, the leak increased the exhaust area. For instance, comparing results whilst both valves were open at 25 and 50 per cent, the opening time reduced by approximately 24 per cent and the closing time increased by approximately 60 per cent for the supply leak. For the exhaust leak, the opening time increased by approximately 2 per cent, whilst the closing time reduced by less than 0.5 per cent. These results showed that the supply port valve had a greater impact on the actuation timing, as compared to the exhaust port fault. Further tests were also performed using mapping tables together with valve modelling, and it was estimated that the proposed method could detect supply leaks of sizes between 1 to 4.4 × 10⁻⁷ m2, with the model accuracy constraint set to 0.3. A similar approach was performed by Takosoglu et al. [19], where a modular pneumatic valve was designed. Although it was stated that actuation timing is used to identify faults, it was not stated how this would be done. Finally, the research by J. Zuo et al. [55] also used this method to identify faults in a train brake valve. Indeed, whilst the brakes were released, the time required for the pressure to be exhausted was monitored. The results proved promising, as tests performed using an internal leak of unknown size showed that this parameter increased by an excess of 10 per cent.
3.3.3. Electric Output
During actuations, electric components experience fluctuations in the power supplied to them, which varies with the start of actuations. To this end, this phenomenon has been used to create a novel method for fault identification in pneumatic end-effectors. In this review, two such studies were found, one by Z. Yuan et al. [56] and the other by X. Fu et al. [57], investigating this method on a rodless and double acting actuator, respectively. Both studies used triboelectric sensors which generate a current during actuations. To this end, a copper electrode is sandwiched between a poly(tetrafluoroethylene) polymer layer and an insulation layer, both embedded inside the actuator’s chamber. As the piston extends or retracts, a potential difference is generated, which generates a current to the copper electrode or to the ground, respectively. This change in current polarity makes it possible to distinguish between extensions and retractions. Furthermore, it was established that this mechanism could not only be used to replace proximity sensors, but could also be utilised to determine the actuation speed, the pressure inside the actuator and the CA flow rate. All three features responded linearly with the current produced, and hence could be utilised for fault detection. The relationship obtained between the current and the flow rate is shown in Figure 5. Nevertheless, it was not concluded how effective this method is in identifying faults, which is part of future work of both research groups.
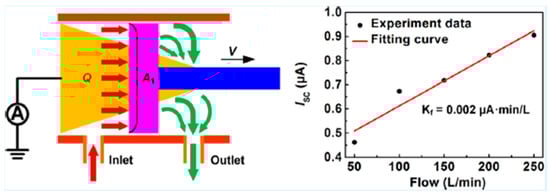
Figure 5.
Left: schematic diagram of the triboelectric sensor. Right: the relationship between current output produced and flow rate through the actuator during the extension phase [57].
3.3.4. Non-Invasive Fault Monitoring Parameters
An emerging trend in fault detection is the development of non-invasive monitoring systems with one of the main advantages being that minimal to no alterations would be required to the existing set-up [40]. Despite this, the term non-invasive is not clearly defined, and according to the review published by M. Alotaibi et al. [58] on non-invasive monitoring techniques, two opinions are most common. The first one is that non-invasive is a synonym to non-destructive, where the diagnosis is performed without damaging the component in question; the second opinion is that non-invasive refers to monitoring without any device contact [58]. Based on this, this sub-section describes both types of non-invasive techniques in further detail.
Low Frequency Noise Analysis
When CA leaks through an orifice, it generates noise that can be used as an indicator for fault detection. One method for monitoring this noise is by using microphones, capturing low frequency noise in the region of 20 kHz. The studies by A. Ribeiro et al. [59] and Santos et al. [60] utilised this non-contact method to identify piping leaks. Using amplified and digitally converted data from microphones, the signal could be analysed in the frequency spectrum. Both concluded that the presence of leaks increased the signal value. For further perspective, in the former’s study, when a 3 mm leak was induced, the peak recorded value increased approximately 6 times whilst in the latter, a 5 mm leak resulted in the measured peak value to increase approximately 12 times. Additional tests were also performed in order to simulate background noise, such as footsteps. The obtained results showed that this technique was still able to identify faults with a success rate of over 80 per cent [59]. Nevertheless, one limitation was highlighted by A. Ribeiro et al. [59], that leaks smaller or equal to 0.5 mm in diameter could not be identified. The other study did not encounter this problem since the induced leaks’ diameters were larger or equal to 1 mm. In the end, this type of set-up still has potential, with the study by W. Tang et al. [61] being a good example where this technique was further developed to work with a mobile robot successfully able to automatically locate the presence of faults. Furthermore, other studies, including the one by D. Czopek et al. [62], also continued to evolve this technique to quantify losses resulting from faults. Indeed, the working principle of this method was to convert the microphone data to mass flow, which could be directly correlated to power loss. For instance, whilst inducing a 1.5 mm leak at a system pressure of 6 bar, the emitted noise (i.e., 99 dB) resulted in a power loss of 375 W for a compressor with an output flow rate of 200 NL/min.
Another approach to monitor the low frequency vibrations emitted by an actuator is to use an accelerometer. To this end, both studies by B. Dobossy et al. [63] and S. Venkata et al. [64] used this contact-based method to monitor the vibrations of actuators. In the former, three accelerometers were utilised to monitor the acceleration of a test bed in the X, Y and Z-axes, whilst the latter used a single sensor installed on the supply port of a control valve. The results showed that this method could detect faults quite accurately with the former claiming accuracy results of approximately 90 per cent, whilst the latter claimed results of 97 per cent. In the former, it was also stated that this measurement outperformed others in detecting leaks, including flow rate and pressure. Nevertheless, no details were presented with regards to the actual size of the faults induced. Another observation was that by using accelerometers, the monitoring system would be confined to fault identification, meaning that other functions, such as location identification or severity, cannot be performed.
High Frequency Noise Analysis
In the previous section, low frequency noises were identified as being a parameter that can be used to identify the presence of faults. Despite this, it is claimed that such a method can still be phased by background noise, especially in an industrial environment [51,65]. Therefore, noise monitoring has evolved to work with high frequency noises, making it less prone to interfering signals in the acoustic band [17]. The two most discussed methods of this type are ultrasonic and acoustic emission monitoring, with the frequency range being in the region of 40 kHz and 400 kHz, respectively [40,66].
The use of ultrasonic waves for leakage detection is one of the traditional non-contact methods, where handheld ultrasonic leakage detectors enable users to pinpoint high-pitched noise originating from faults. Indeed, multiple studies including [7,24,67,68] utilised this method in order to identify the energy waste resulting from faults. For example, E. Soylu et al. [67] and S. Çağman et al. [24] clearly highlighted the impacts posed by faults. In the former, an energy audit was performed within an industrial factory and leakages were identified using an ultrasonic leak detector. A total of 15 leaks were identified throughout the entire factory, with the annual energy costs amounting to approximately €14,500, at a system pressure of 6 bar. The largest leak was identified, with a flow rate of 202 NL/min, contributing to approximately 7 per cent of the total financial repercussions [67]. In the latter, another audit was performed on a larger scale, where 44 factories across Turkey were assessed for faults using the same type of detector. This analysis went into further detail, where the leakage repercussions were also quantified in terms of savings per product. The results showed that leak repairs would translate to €3.07 in savings per product. The environmental repercussions in terms of CO2 emissions were also considered, with the highest annual savings by a single factory recorded at approximately 612,000 tonnes [24]. Nevertheless, this leak detection method still has its limitations, particularly because it is still phased by noise and is not effective when the leak is more than 3 m away from the device [17]. Consequently, studies including those by T. Wang et al. [66], P. Liao et al. [69] and A. Schenck et al. [70], continued to develop this method, by increasing the number of sensors used. The working principle for these systems was the beamforming technique together with the time delay concept, where spatial noise maps were created. This method allowed the microphone array to be virtually focused on a single point, such as a leak, as shown in Figure 6 [66]. This was done by continuously calculating the time delay between each microphone whose signals were delayed, summed and normalised, accordingly. This was repeated until the time difference between each device was virtually zero. It was claimed that by doing so, the overall accuracy improved compared to the low frequency counterpart, although no actual figures were provided. Nevertheless, it must be noted that this method was still phased by background noise and that leaks smaller than 0.1 mm were still difficult to identify. Furthermore, this method also has the potential of identifying the fault location since the beamforming technique allows the sensors to focus on the leak, indicating its position. This was reported for all three studies where the obtained results showed that this could be achieved quite reliably. For instance, in the study by T. Wang et al. [66], it was concluded that the constructed set-up was able to indicate the distance of a 0.1 mm leak with an error of 20 mm, with the sensors placed 800 mm away from said fault. Modern ultrasonic leakage detectors also have the ability to estimate the leakage size by correlating the intensity of the emitted noise to the fault size. However, according to the study by M. Hassan et al. [71], this method was not accurate since an average error of approximately 70 per cent was recorded whilst inducing leaks with diameters of 1.5 and 2 mm. This means that further advancements would be required in order to reliably identify the leakage size.
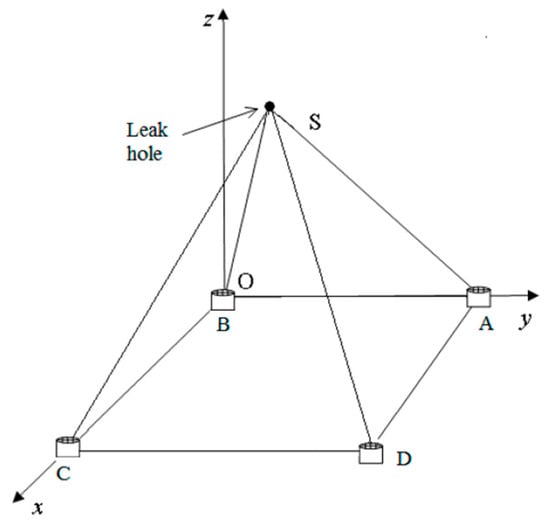
Figure 6.
The concept of the beamforming method, with each sensor focusing on the leak [66].
The second high-frequency technique for leak identification is monitoring of acoustic emissions. As a component becomes defective, spontaneous high frequency mechanical waves are emitted and these can be captured using specialised acoustic emission sensors. These work by converting these vibrations into a charge signal, which is pre-amplified and filtered. This signal, which is in the frequency spectrum, is then analysed in different ranges, for example 100–200 kHz or 300–400 kHz, and anomalies are detected [58,72]. In pneumatic systems, this contact-based method has mostly been adapted for actuators. The studies by H. Mahmoud et al. [73] and P. Mazal et al. [72] conclude that faults are identifiable using this method. In the former study, a faulty cylinder with multiple faults including a leaking piston seal, exhibited higher energy values in the retraction stroke by approximately 150 per cent. In the latter, no actual percentages were provided, although it was stated that when a leak in the piston gasket was present, three new frequencies were recorded: 50, 195 and 385 kHz [72]. Another approach by M. Yerra et al. [74], was to use this method to identify the state of a pneumatic valve, i.e., opened or closed. In doing so, the actuation time of the valve could be identified, which, as discussed previously, can also be used for fault detection. Nevertheless, actual fault identification results were not yet available.
When compared with ultrasonic monitoring, the implementation cost for the acoustic emission method is higher, mainly due to costlier sensors. However, since these devices are installed directly on the actuator, the overall results are generally more accurate [72]. Ultimately, compared to low-frequency monitoring, advancements in both high-frequency methods produce better monitoring results than their counterpart [40,66].
Temperature
The reviewed studies also showed that the temperature parameter was frequently utilised in mathematical models. For instance, in the study by Y. Shi et al. [51], the CA temperature was used to represent gas expansions whilst modelling pressure decay in a chamber, whereas R. Dindorf et al. [16] used the CA temperature as a calibration factor whilst calculating the CA flow rate through a circuit. In other studies, such as those by M. Rajashekarappa et al. [75] and B. Rahman et al. [76], the temperature parameter was investigated for its potential for pneumatic fault monitoring, with both instances using conventional temperature sensors. In the former, a 1 mm leak was induced upstream to the actuator in an industrial conveyer set-up. The temperature readings showed that during the simulations, the average temperature was recorded as approximately 22–23 °C. No additional sensor values were provided; however, a ranking tool was used to determine the fault-finding potential of various measurements, mainly the flow rate, temperature and pressure. The results showed that although the flow rate ranked first, the temperature was still a good parameter for fault identification, ranking ahead of pressure. It was also concluded that the RMS (Root Mean Square), average and peak values were the best temperature indicators. Conversely, the latter contradicts this, since when inducing a leak of unknown size in the CA line, pressure was highlighted as the best parameter to identify faults, with temperature observed to not be a good indicator for fault detection. Consequently, it could not be confirmed if conventional temperature monitoring is capable of adequately identifying pneumatic faults.
Recently, new non-invasive methods have been devised using temperature measurements promising to accurately identify faults. For instance, a new contact-based thermodynamic method was developed by T. Terrill et al. [77] that was able to identify pneumatic faults. The working principle of this method revolves around the pipe temperature decay using thermocouples. Thermal heaters were used to heat the piping to a reference temperature, after which they were switched off to allow the pipes to cool to ambient temperature. The resulting cooling rate, which increased with increased flow, allowed the temperature decay to correlate with the cooling time, with the ensuing profile allowing for fault detection to occur. For instance, when a leak of 300 NL/min was induced, the temperature profile reduced by approximately 30 per cent in the first minute. Additionally, it was stated that this method could also quantify leak sizes with approximately 10 per cent accuracy. A similar working concept is currently utilised in flow meters, such as the PFMB series by SMC [78], where resistors are used to measure the temperature decay and translate it to the corresponding flow rate. Although Terrill et al. [77]’s study identified faults with sufficient accuracy, the overall set-up was phased by multiple factors, including the piping size and material, amongst others. Furthermore, apart from being expensive to implement, another disadvantage was that in order for this method to work, all actuations had to be stopped, so that the resulting CA flow would only be associated with faults. Finally, all the tests were performed with piping diameters between 0.051 and 0.076 m, ensuing large flow rates; hence, further tests would be needed in order to confirm the effectiveness with smaller-sized leaks [77].
Thermography, which is the process of capturing thermal images, is another non-contact approach used for fault detection, with M. Hassan et al. [71] being one of the adopters of the method. The system operates by having an infrared camera, whose signal is pre-processed and binarized to remove noise. This set-up continuously analyses the difference between the temperature of the leak area compared to that of the surrounding fault-free area. For instance, at a system pressure of 8 bar, a 1.5 mm leak resulted in a temperature decay of 5.5 °C. The width and height of the leak could also be calculated by recording the temperature change across the fault as a function of its size, which could also be translated to the leakage flow rate. Tests were performed using a 1.6 mm leak at a pressure of 2.7 bar, with the resulting flow rate calculated to approximately 41 NL/min. The results showed that the system performed reliably, with an accuracy of approximately 95 per cent. This also indicated that this method could be used to identify moderately sized leaks, commonly found in industry. Moreover, it was also stated that the proposed technique outperformed the ultrasonic method whilst identifying leaks, with the results showing better accuracy figures by approximately 65 per cent.
Machine Vision
From Section 3.2, one can deduce that different faults can occur: those which relate to the CA line and those which are component specific. In the latter, there might be cases where one can identify faults visually. For instance, if a solenoid valve is not in operation, the coil lights do not turn on. To this end, research has been prompted to automate fault identification via machine vision.
J. Jura et al. [79] dedicated their study towards developing a non-contact machine vision system capable of identifying actuator faults. The proposed set-up consisted of three sets of tags: one to indicate the actuator position, one to detect the operation of the proximity switches, and one to monitor the Programmable Logic Controller (PLC) periphery switching. A camera was used to monitor these tags and assess the performance of the peripherals in question. The authors also suggest that each actuation state could be monitored using these tags, making it possible to extract the cycle times. Nevertheless, further tests would be required to establish the effectiveness of this method.
Another vision approach was to identify faults in control valves where leaks may affect the stem opening position, resulting in inadequate pressure adjustments. Both studies by K. Santhosh et al. [80] and Navada et al. [81] are examples of this, where the movement range of the valve stem was recorded via cameras. By comparing the captured image with the controller data, the percentage stem opening was determined, and any positional deviations were recorded. In doing so, the fault in the valve stem could be accurately identified, with the former discussing the results in further detail. For instance, when a leak of unknown size was induced and the supply pressure was reduced, fluctuations in the displacement were recorded to be up to 85 per cent, showing that this method would be capable of identifying leakages.
Exergy Analysis
An exergy analysis by K. Taheri et al. [82] was also found to be another method for CA fault identification, mainly by quantifying its effects. Although this is not a directly measured parameter, it was still included since it was based on temperature and pressure measurements. When referring to an exergy analysis, the objective is to find a system’s maximum possible work, whilst bringing the set-up to thermodynamic equilibrium with its environment [83]. The whole concept is to map out the relationship between the input exergy rate to the output exergy rate. In the case of CA, the remaining exergy is attributable to the increase in output pressure. Therefore, in contrast with an enthalpy analysis, being the sum of internal energy and the product of pressure and volume, both temperature and pressure inefficiencies are considered. Hence, when leaks and faults occur, the work output decreases, indicating the presence of faults. In this research, a system with pressure of 7.4 bar was investigated and it was reported that when leaks amounting to a total flow rate of 10.3 × 10³ NL/min were induced, the exergy value increased by 18.5 per cent. These results suggest that this method was a good indicator for identifying faults.
3.3.5. Further Parametric Observations
Following the in-depth parametric analysis, further observations could be derived by breaking down each study into each parameter measured for fault detection. Indeed, Figure 7 shows how frequently each parameter was covered.
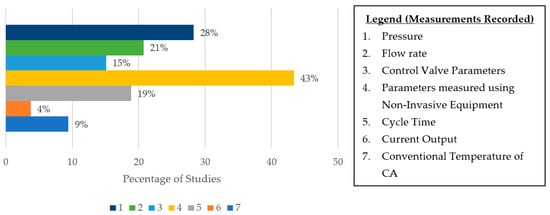
Figure 7.
The distribution of the measurements recorded in the reviewed studies.
The results show that the most investigated parameters were of the Non-Invasive type, again confirming their increase in popularity in the past 10 years. Furthermore, pressure, flow rate and cycle time were also commonly analysed, all having similar usage percentages. The output current technique (i.e., the use of triboelectric sensors) was the least covered, which could be due to two reasons: either it is still a relatively new concept, or it does not offer good potential in pneumatic fault detection. The former is the most likely since all concerned studies were published in the last 5 years. Both control valve specific parameters and conventional temperature measurements were also not as popular; however, they were still investigated over twice as much as the previously mentioned parameter.
The number of parameters utilised for each study was also considered. To this end, the majority of the papers (70 per cent) investigated one type of parameter for fault detection. However, the majority of this percentage (i.e., 62 per cent) was attributable to Non-Invasive parameters. This meant that when considering other measurements, mainly pressure, flow rate and cycle time, these were often used in junction with other parameters. For perspective, these three were on average used solely approximately 23 per cent of the time. This also ties in with the observation by Rahman et al. [84] that more effort should be placed in simplifying monitoring systems, promoting the use of pre-existing equipment.
3.4. Approaches to Analyse Parametric Data
In the previous section, the different parameters used to monitor demand-oriented pneumatic faults were reviewed. The focus of modern monitoring systems is to automate the fault-finding process, where the set-up is capable of automatically analysing the collected data and identifying anomalies. The ultimate goal is to design a monitoring system serving as a Fault Detection and Diagnosis (FDD) system, where a fault is detected, isolated and diagnosed, as per the following pillars:
- Fault Detection: identify presence of faults;
- Fault Isolation: determine where the fault is;
- Fault Diagnosis: determine size of fault, type of fault and onset time of fault [85].
In the case of the reviewed studies, they all fulfilled the first pillar; however, not all satisfied the second and third pillars. In Appendix A, the FDD pillars satisfied by each study are highlighted. The first observation was that the number of studies fulfilling the second pillar were quite substantial, amounting to 36 per cent of the total papers. However, it should be highlighted that the research performed in these papers was mostly catered for small systems or specific actuators, with the leak being localised. For this reason, the fault location was already known and hence was not identified by the monitoring system. All of these studies were marked with an * in Appendix A. Considering this, the percentage of studies capable of successfully identifying the presence of the fault source reduced to 11 per cent. With regards to fulfilling all three pillars, the total studies successful in doing so amounted to 42 per cent. However, when excluding the studies marked with an *, this percentage decreased to approximately 8 per cent, highlighting that fault location identification is still not frequently covered.
In order to design a monitoring system capable of automatically identifying anomalies, the set-up not only has to collect the parametric data, but has to process and analyse it accordingly. To do so, two different approaches can be used: a model-based approach or a signal-based approach. Furthermore, different statistical tools, including those in the time or frequency domain, can be used to further extract features of interest or better comprehend the system’s performance. These techniques are described in further detail in the following sections.
- Model-Based Approach
As the term suggests, this approach uses models for fault detection. Mathematical models are created, whose output approximate the benchmark system performance. Once this is done, the sensor data is plugged into the developed model and the output values are continuously analysed. In a fault-free system, the output from the model and data from the sensors are equal. With the inclusion of faults, variations (also known as residuals) occur which indicate that an anomaly is present [85,86]. This process is summarised in Figure 8 [85].
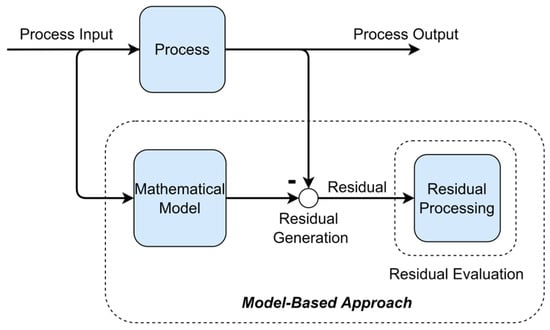
Figure 8.
A summary of the model-based approach used for fault detection. Adapted from [85].
This approach has been implemented for fault detection in pneumatic systems. The study by B. Rahman et al. [76], for example, uses a model-based approach to identify faults on a small pneumatic test bed containing a single double-acting actuator. The premise of the process was that the majority of the pneumatic components could be modelled using pipes and orifices whilst utilising pressure and flow data. The pipes represented a means where CA could be conveyed, whilst orifices offered a pathway where CA could be exhausted. For example, the pressure regulator could be depicted by an orifice with a flow area that depends on the input and output pressures. From the performed tests, the authors stated that the model was able to depict the system accurately; however, no actual results were provided. Furthermore, it was also stated that although the model was only tested on a small system, the ensuing results showed potential that it could also be applied at a larger scale, with further tests planned as future work. Another example included the study by L. Vailati et al. [87] where models were used to estimate the mass flow rate of a spool valve by solely using pressure readings. Indeed, data was collected from two pressure sensors, one at inlet and the other at the outlet of the valve, in order to continuously map out the relationship between both measurements. Furthermore, by calculating the rate of volume change through the valve using the time derivative of mass flow and pressure, the actuator rod velocity and displacement could be computed. To this end, the model proved to be effective since the actuator displacement had an accuracy of 92.9 per cent, whilst the mass flow rate had an accuracy of 93.7 per cent. Consequently, it was stated that by identifying changes in flow, it was possible to detect the presence of faults; however, no actual figures were presented. An observation on this study is that it highlighted that this method was developed by experts in the field since extensive geometrical knowledge was required. Hence, it may not always be feasible to adopt such a method.
System modelling has evolved from the traditional method previously described, mainly by using software packages, such as Simulink R2023a by MATLAB, allowing users to model systems using pre-defined block diagrams. Although proficiency regarding the system’s physical side is still required, such a method simplifies the overall process. Two studies which use this technique were [88,89]. A. Peerapur et al. [88], for example, used Simulink to model a set-up with one double-acting actuator and a five-port three-way directional control valve. The cylinder model comprised of ports and blocks, where chambers A and B represented the cylinder chambers, port H the thermal conserving port and ports R and C the mechanical translational conserving ports. Altogether, these simulated the movement of the cylinder. For instance, in the case that the cylinder extended in the positive direction, port A was switched on to simulate CA flowing through chamber A, whilst the flow through chamber B was exhausted through port B. Port H depicted the cylinder’s heat exchange to the environment, whilst ports C and R were used to monitor the current position of the end-effector. The model used pressure sensor data from both the extension and retraction lines of the actuator together with the actuation cycle time using the proximity switches. Through the use of the derived equations and the sensor data, the mass flow rate was also calculated. This was achieved by considering that the force exerted on the cylinder movable surface could be expressed as a function of the product of pressure inside both the cylinders’ chambers and the respective chamber area, both expressed as a function of time. The simulation results showed that faults could be identified using this system. For instance, when inducing a leak of unknown size in one of the CA lines, the total flow consumption through the valve doubled in a span of 10 s. The study also states that the system performed with adequate accuracy; however, no actual figures were provided.
- Signal-Based Approach
As previously attested, the construction of mathematical models requires proficient knowledge regarding the physics aspect of the system. Whilst analysing the model-based studies, it was noticed that the modelled systems were quite simple, mostly comprising of a double-acting actuator and a solenoid valve. This indicates that this approach is mostly utilised for simple set-ups. Y. Yang et al. [90] added that in order to model complex non-linear systems, the set-up is often linearized, lowering the model accuracy. For this reason, both M. Heydarzadeh [91] and B. Six et al. [86] suggested that a signal-based approach is ideally adopted for modelling complicated set-ups. This technique uses historic sensor data to automatically analyse the symptoms generated by anomalies, allowing to identify the presence of faults. This process is summarised in Figure 9 [92]. Some studies that adopted this approach included the ones by A. Ribeiro et al. [59] and Kulkarni et al. [54]. In the former, the data from microphones detected a 600 per cent increase in the peak noise for a 3 mm leak, whilst in the latter, solenoid switching data was used to quantify the valve opening time, which reduced by 24 per cent when a supply leak of unknown size was induced.
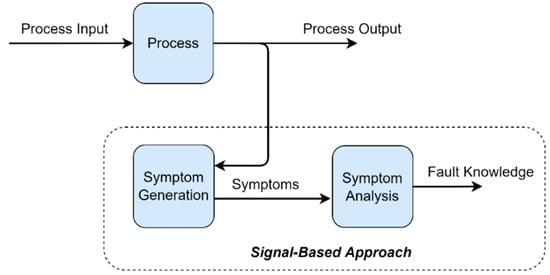
Figure 9.
A summary of the signal-based approach used for fault detection. Adapted from [92].
3.4.1. Further Analysis on Model and Signal-Based Approaches
Following a thorough analysis of how both model and signal-based approaches are currently being adopted for pneumatic fault identification, the frequency use of both methods was also investigated. To this end, 70 per cent of the studies used the signal-based approach, whilst approximately 30 per cent used the model-based approach. These results second the observations by M. Heydarzadeh [91] and B. Six et al. [86], where both stated that a signal-based approach is preferred in modern monitoring systems. Although the systems explored in these papers were generally quite simple, the model-based method was still avoided for the most part since even for smaller set-ups, the required mathematical equations become quite complex.
3.4.2. Statistical Methods and Tools for Fault Detection
For fault detection to occur, especially in signal-based approaches, the data has to be analysed using statistical methods since parametric changes or features, which help in identifying faults, cannot be identified using raw sensor data. This is performed using condition indicators, which serve as computational tools that produce features of interest [63]. These indicators can be categorised in two groups; those in the time-domain and those in the frequency-domain. The difference between the two is that indicators in the time-domain describe how the data changes over time, whilst those in the frequency-domain describe how much a signal lies within a given frequency band [63,85]. For example, the studies by K. Fojtášek et al. [89] and K. Abela et al. [34] used the mean condition indicator for time-domain pressure data, in order to record the drop in the average system pressure. In the former, an average pressure drop of 14 per cent [89] was recorded for a leak of unknown size at a pressure of 5 bar, whilst in the latter, a 1.6 mm leak caused the post leak pressure to drop by 7 per cent [34] from the 6.1 bar system pressure. Other studies, including those by H. Mahmoud et al. [73] and P. Mazal et al. [72], used the peak indicator for acoustic emission values in the frequency domain to identify faults in end-effectors. In the former, a leak in the actuator’s gaskets, which contributed to an average pressure decay of 86.6 Pa/s at a system pressure of 6 bar, was examined. The RMS, i.e., arithmetic mean of squares for the acoustic emissions, showed that the fault contributed to the peak value’s increase by an excess of 28.5 per cent. In the latter, a similar study was performed, again investigating the effects of seal leaks in double-acting actuators. Although no percentages were provided, it was stated that new peak values emerged when inducing leaks, i.e., 50, 195 and 385 kHz. Table 3 provides a list of commonly used condition indicators in both domains [63,75].
Table 3.
Some examples of frequently used condition indicators [63,75].
In certain applications, such as when dealing with noise signals, it is required that signals in the time-domain are converted into the frequency spectrum, in order to achieve a smoother signal. This is done using the Fourier Transform function, which breaks down the signal from sine and cosine functions into a representation of distinct functions at different high-resolution frequencies [93]. Studies [40,59,60,74], all mentioning or using this technique, show that the benefit of such a process is that it allows for signals to be represented in a clearer and more organised manner. This is especially true when dealing with noisy signals, allowing more easily the detection of anomalies. In other instances, however, Fourier Transforms are not adequate for signal decomposition since although the output signal is of high frequency, no time resolution is noted. This means that in applications where changes occur rapidly, certain features of interest might not be emphasised. To this end, another technique can be used, i.e., the Wavelet Transform tool, which converts data into both the frequency and time domains at high resolutions (i.e., a time-frequency decomposition), with studies [91,94,95] using this technique. Although none of these studies directly compared the results of both approaches, the study by A. Desmet et al. [94] highlighted the fact that the use of the Fourier Transform for pneumatic applications may filter out important features during fault monitoring. This was observed in this research, where the sinusoidal decomposition of the signal resulted in features to be smoothed out when sudden drops in pressure occurred as a consequence of the opening and closing of the valves.
Supplementary Statistical Methods and Tools
Apart from simply identifying faults, other tools can be used to either offer additional functionality to the monitoring system or extract information that help the user better comprehend and visualise the system performance. In this section, five other tools/methods used in pneumatic FDD systems are discussed: classification tools, correlation analysis, regression analysis, control charts and pareto charts.
- Classification and Correlation Tools
As previously attested, the development of an FDD system entails the fulfilment of three pillars, meaning that details, such as fault type, need to be determined. Classification methods, used to distinguish between different fault types, are statistical tools which help with the development of these systems, mainly by classifying between different fault types [63]. To this end, one study by R. Kosturkov et al. [7] was dedicated to comparing different classification methods for pneumatic fault detection. The selected techniques were two distance-based tools, the Minkowski Distance and the Canberra Distance. Although both used the distance between two points to distinguish between data sets, the manner in which this was done differed. In the former, the distance was calculated as a generalisation of the shortest distance between the points, or the X and Y-distances. In the latter, the distance was calculated using the sum of fractional differences between two points. The aim was to distinguish between three faults: i.e., a leak downstream to the pressure regulator, a leak upstream to the cylinder retraction chamber, and a dynamic leak upstream to the cylinder extension chamber. The results showed that the Canberra Distance performed better than its counterpart, being able to distinguish between different fault types. For instance, when comparing data from the downstream static leak of 1 NL/min with that of the dynamic leak of 2 NL/min, an excess of 25 per cent of the data from the derived Minkowski Distance method overlapped, whilst that of its counterpart encountered no such problem. However, it was noted that by using the Canberra Distance method, it was still difficult to distinguish between the small and large leak since although the data points were all distinct, they were all within close proximity. To solve this problem, correlation techniques were also introduced, identifying a relationship between distinct sets of flow sensor data. This was done so that a hybrid technique, comprising of both correlation and classification tools, could be developed. The Pearson Correlation method and the Angular Separation correlation coefficient method were investigated. In the former, the linear relationship between the points is found, whilst the latter identifies the similarity between the cosine angles between the sets of data; meaning that the higher the cosine value, the more similar the data points are to each other. Ultimately, Pearson Correlation was chosen to work with the Canberra Distance since the Angular Separation method did not allow for the classification of the fault location. This was clearly seen whilst trying to categorise between a supply line fault and an actuator fault, where over 35 per cent of the resulting data points overlapped. Figure 10 [7] shows the classification results of the hybrid method, showing that the system was able to classify the fault type and location.
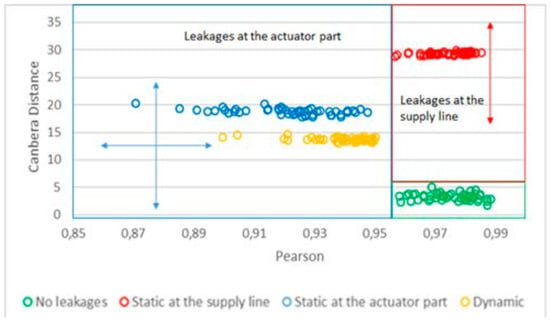
Figure 10.
The classification obtained using the novel classification method whilst inducing different leak types [7].
- Regression Analysis
All systems are confounded with multiple inputs, which together produce the desired output. By identifying relationships between these parameters, the user can better understand how these affect the output. Contrary to correlation tools, which only indicate the relationship strength between parameters, regression analysis is used to estimate the mathematical relationship between a dependent variable (i.e., the output) with its confounding independent variables (i.e., the inputs) [96]. From the studies found, this tool was mainly used to identify the relationships between the CA output with other dependent parameters including noise, amongst others [68,97,98]. Equation (2) is an example of the derived equations, developed by N. Doner et al. [98]. A relationship between the CA output, measured using a flow meter, and emitted Leak Noises recorded via an ultrasonic leakage detector, was produced for a system operating at 6.3 bar. Each equation was also tested for its goodness of fit, measuring the variance between the derived relationship to the real one. This is represented by the R2 value, with values greater or equal to 0.9 considered as adequate for goodness of fit [96]. In the case of Equation (2), the resulting R2 value was 0.996, meaning that the relationship was represented adequately.
- Control Charts
In order to better visualise results and identify any patterns, charts are often used. One of the most encountered statistical charts in this review were control charts, used to monitor process variations which indicate the presence of faults. Upper and lower quartile limits are used to determine if the process is within the required tolerance. Indeed, these limits are produced three times above and below the standard deviation value of the particular dataset, with the standard deviation being a measure of how much the data points vary from the mean. Historical data in the time domain is plotted, with any outliers identified using the specified quartile limits [99]. One example was to monitor variations in the flow rate, with any changes being attributed to leaks or faults in the CA line of a pneumatic system [97]. The CUSUM control chart can also be used in this regard. Contrary to its counterpart, this method displays the cumulative sum of deviations from a target value, using data from current and previous samples. The advantage of using this chart is that it helps in detecting small variations more effectively [100]. In the reviewed studies, this type of graph was again utilised to monitor the demand of the CA flow rate [68,97].
- Pareto Charts
Another chart type, known as the Pareto bar chart, is used to highlight the main areas of significance for a particular process. The working concept is the 80/20 rule, meaning that approximately 80 per cent of the effects encountered are the result of 20 per cent of the causes. Consequently, after plotting the bar chart data in descending order, the categories which contribute to 80 per cent of the cumulative frequency are noted [101]. In the pneumatic studies reviewed, this tool was used to categorise the faults encountered or the processes which consumed the most CA [68,98,102]. For instance, the study conducted by R. Kosturkov et al. [102] utilised this method for a case study performed in 10 bottle manufacturing companies to identify the most severe pneumatic faults, in terms of CA consumed. From the graph in Figure 11, it was deduced that the faults which had to be tackled first were the push-fittings, amounting to 10 per cent of the total faults on the demand side, followed by the Filters–Regulators–Lubricators, grippers, tubes/connectors and valves.
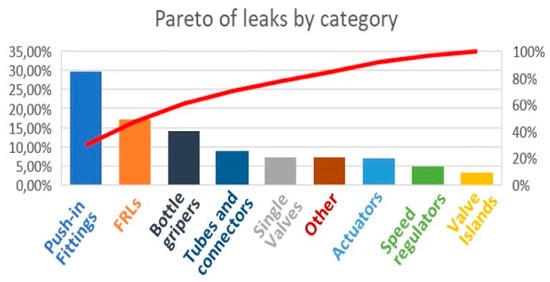
Figure 11.
The Pareto chart used to highlight the fault severity in the study by R. Kosturkov et al. [102].
Further Analysis on Statistical Methods
After reviewing the tools typically used to help in analysing the recorded sensor data, it was evident that the selected studies mainly opted for time and/or frequency domain tools during the fault-finding process. In order to assess this quantitatively, the reviewed tools were categorised as follows and classified in Appendix A:
- Time domain tools;
- Frequency domain tools;
- Classification/correlation tools via mathematical equations;
- Regression analysis;
- Charts.
Figure 12 shows the distribution of the tools used by all the reviewed studies for fault identification.
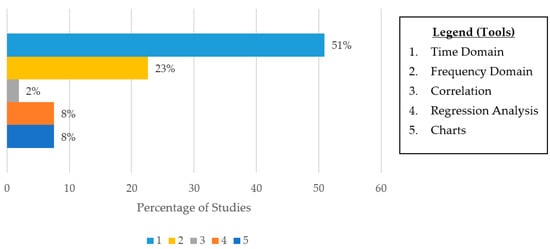
Figure 12.
Distribution of the statistical tools utilised by the reviewed studies.
This diagram highlights that the least popular tools used were charts, together with the regression analysis technique and classification and correlation mathematical tools. In regards to frequency domain tools, these were used more often and it was noticed that approximately 50 per cent of these studies all dealt with noise emissions. The reason for this was that the Fourier Transform tool was utilised to smooth out the noisy signals. Amongst other tools, the rest of the studies dealing with the frequency domain used the Wavelet Transform technique, hence also taking into consideration the time domain. The other papers that utilised time domain techniques varied, being that these tools were not confined to any specific monitoring parameters. For instance, this technique was used for pressure and flow measurements together with noise emission parameters, amongst others.
3.5. Role of AI in Pneumatic Fault Detection
With Industry 4.0 cementing itself in modern industrial systems, AI is a tool increasingly adopted by various organisations. Although the scope of this review does not include reviewing AI techniques, it was still important to briefly mention how these are being adopted in current pneumatic monitoring systems.
The role of AI is to increase the system’s level of intelligence by automating specific tasks, whilst decreasing the level of human intervention. Indeed, machine learning algorithms are becoming popular in pneumatic FDD systems, with one of the main roles being to classify between different fault types. Unlike the classification tools explained in Section ‘Further Analysis on Statistical Methods’, where the user had to use respective tools to perform the classification process, multiple algorithms can be used to automate this process, with each having a specific method of classifying the data. Some examples include K Nearest Neighbour, Support Vector Machine and K-Means Cluster, amongst others [63,70,91]. Similar to the classification tools mentioned previously, these work using mathematical techniques to classify different points according to the calculated distances. For instance, the Support Vector Machine algorithm, used in the studies by M. Heydarzadeh et al. [91] and B. Dobossy et al. [63], classified and separated the data set by constructing the best hyperplane. The hyperplane is chosen by selecting the one which results in the maximum distance between the data set elements and this plane [103]. This method is claimed to work quite well with pneumatic applications, with the study by M. Heydarzadeh et al. [91] being a good example. In this research, tests were performed on a control valve with the DAMADICS tool used to induce 19 different faults, including internal and external leaks, amongst others. The Support Vector Machine algorithm was able to classify these faults, with the results showing that this was done successfully with an accuracy in excess of 95 per cent.
In the reviewed studies, AI has mostly been implemented in signal-based approaches. Nevertheless, two studies by Y. Yang et al. [104] and Z. Feng et al. [105] utilised this concept with model-based approaches, where the Back Propagation Neural Network algorithm was adopted to classify faults for pneumatic solenoid valves and control valves, respectively. Neural networks consist of numerous layers, utilised to execute decisions according to rules specified by the user. This is possible by training the system and providing it with data from different fault types in order to assess factors which allow for fault classification. For instance, in the research carried out by Z. Feng et al. [105], where a control valve was again investigated using the DAMADICS tool, five mathematical models were derived, each representing a particular relationship between different valve variables, including inlet/outlet pressure and valve displacement. One of these models showed that the output flow rate was a function of the valve displacement together with the input and output pressures. Another model correlated the valve displacement as a function of the control valve position signal. After inducing faults, the five model outputs were fed to this tool and processed through the nodes. Five sets of unique outputs were created for each fault, allowing to automatically distinguish between different fault types. Although no actual figures were provided, the authors state that this system was able to classify the majority of the faults. Nevertheless, further work would be required since certain faults, such as pressure drops, were still not fully distinguishable.
In all scenarios, classification is performed through tools which analyse specific data features from the provided data. For this reason, it is important to provide attributes that allow the system to adequately distinguish between different faults since the raw data may not differ significantly. This underscores the importance of using statistical methods, including those mentioned in Section 3.4.2, which allow for the extraction of particular characteristics. Two examples are the Wavelet Transform Function and the use of condition indicators, amongst others. When using AI techniques, the use of the mentioned tools becomes particularly important during data pre-processing, which is the first step when adopting such a method, as illustrated in Figure 13 [63]. This process is regarded as a crucial part for the successful use of these techniques with the reason being that not only is raw data cleaned and time synchronised, but the system is advised which statistical features are best used for the identification of faults. This therefore highlights the importance that feature selection has on the proper completion of data pre-processing, which is an essential step for AI techniques to work correctly [7,63,85].
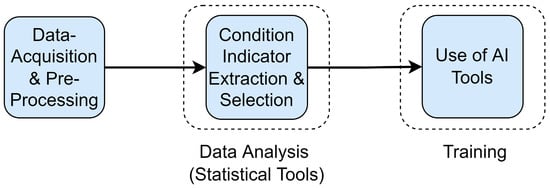
Figure 13.
A summary of how AI is used for fault classification. Adapted from [63].
Ultimately, it can be concluded that AI plays a major role in automating the fault detection process, considered to be the future of monitoring systems, with both model and signal-based approaches having the possibility to use such tools. Nevertheless, the successful use of these tools relies on correctly using other aforementioned methods.
4. Conclusions
With the increasing complexity of modern industrial systems, maintenance is becoming more complex and time consuming. This also holds for pneumatic systems, with repairs often being neglected, thereby wasting energy and increasing emissions [106]. The concept of monitoring in this area has been increasingly researched and discussed in recent years, with the aim of simplifying the fault-finding process. Nevertheless, the majority of published studies focused on the supply side, whilst neglecting the demand side which promises the most potential for sustainable improvement [35]. To this end, this study aimed to contribute a review study dedicated solely to pneumatic demand fault monitoring.
This study adopted the PRISMA protocol, identifying 53 papers that fulfilled the research objectives, and some initial observations were provided. Firstly, it was evident that this area was researched more frequently in recent years, with over 60 per cent of the studies being published in the last five years. Secondly, demand pneumatic studies were not confined to industrial applications, but included other areas, such as the pneumatic brake and suspension systems of trains.
The first takeaway from this review is that the majority (66 per cent) of the reviewed studies investigated the effects posed by a single type of fault. Furthermore, with more than half of the studies being component specific, i.e., investigating faults in valves or actuators, this indicated that the overall systems investigated were simpler than those found in industry. This highlights the main limitation of this study, since the majority of the reviewed studies catered to smaller systems. To detect faults, various parameters were found to be successful. These include flow and pressure measurements, both being the most utilised in the studies. However, another category of monitoring parameters also emerged as being popular, classified as non-intrusive. These were the most popular out of all the studies, amounting to approximately 40 per cent of all parameters used. As reported by M. Alotabibi et al. [58], these are becoming popular due to the minimal alterations required to the current set-up. When excluding papers that focused on non-intrusive parameters, most of the studies used multiple parameters to identify faults. For instance, approximately 75 per cent of the studies using the pressure, flow rate and cycle time parameters, did so in conjunction with other parameters. This underlines the need to explore the possibility of simplifying fault monitoring, as also suggested by Rahaman et al. [76], with one of the solutions being adopting methods that utilise pre-existing equipment.
This study also reviewed the manner in which recorded sensor data could be processed and used for fault monitoring systems. This review found that although the majority of the systems were less complex than actual industrial systems, 70 per cent of the studies still opted for a signal-based approach in their analyses. The reason being that, as suggested by M. Heydarzadeh [91] and B. Six et al. [86], even for simpler systems, the required mathematical equations can become quite complex. Statistical tools were also used to increase the functionality of the detection system. Over 50 per cent of the papers used time-domain tools which were used for all types of monitoring parameters. This was followed by frequency-domain techniques, such as Fourier Transform, being frequently used with noise monitoring methods, in order to smooth out noisy signals.
Finally, with IIoT implemented across different systems, including pneumatic fault monitoring, the use of AI tools has become increasingly popular, establishing it as a staple concept for future systems to adopt. These allow for the automation of certain tasks, making the system more intelligent. For instance, they can be used to automatically classify different fault types. The effective use of this technique, however, lies in successfully completing the pre-processing stage, which entails that the data not only be time synchronised and cleaned, but also identifying statistical attributes for fault detection to occur reliably. Therefore, the proper use of various statistical tools is essential to achieve a correctly functioning AI system.
Ultimately, this study aimed to highlight the potential of demand fault monitoring, enticing more research in the area, specifically towards more complex systems and faults. Therefore, this would contribute towards an energy efficient industry and a sustainable and an overall cleaner environment.
Author Contributions
Conceptualization, M.B., P.R. and E.F.; methodology, M.B., P.R. and E.F.; software, M.B.; validation, P.R. and E.F.; formal analysis, M.B.; investigation, M.B., P.R. and E.F.; resources, P.R. and E.F.; data curation, M.B.; writing—original draft preparation, M.B.; writing—review and editing, P.R. and E.F.; visualization, M.B.; supervision, P.R. and E.F.; project administration, P.R. and E.F.; funding acquisition, P.R. and E.F. All authors have read and agreed to the published version of the manuscript.
Funding
This study is funded by the project ‘Development and Analysis of an IndustRy 4.0 System to Autonomously ImproVE the Sustainability of Pneumatics’—AIR SAVE (R&I-2020-008T), which is financed by the Fusion Technology Development Programme (TDP) of the Malta Council for Science and Technology (MCST). The project consortium comprises the University of Malta and the industrial partner, AIM Enterprises Ltd.
Institutional Review Board Statement
Not applicable.
Informed Consent Statement
Not applicable.
Data Availability Statement
Not applicable.
Acknowledgments
The authors would like to thank AIM Enterprises Ltd. for their technical contribution and support.
Conflicts of Interest
The authors declare no conflict of interest.
Nomenclature
| AI | Artificial Intelligence |
| CA | Compressed Air |
| CAS | Compressed Air Systems |
| DAMADICS | Development and Application of Methods for Actuator Diagnosis in Industrial Control Systems |
| EU | European Union |
| IIoT | Industrial Internet of Things |
| PLC | Programmable Logic Controller |
| PDynamic | Dynamic Pressure |
| PStatic | Static Pressure |
| PTotal | Total Pressure |
| PRISMA | Preferred Reporting Items for Systematic Reviews and Meta-Analyses |
| RMS | Root Mean Square |
Appendix A
Table A1.
Classification of studies according to their attributes.
Table A1.
Classification of studies according to their attributes.
| Ref. | Publication Name | Year | Parameter/s Used | Fault Location | FDD Pillars | Approach Taken | Statistical Tools Used | |||||||||||||||||
|---|---|---|---|---|---|---|---|---|---|---|---|---|---|---|---|---|---|---|---|---|---|---|---|---|
| Pressure | Flow rate | DAMADICS | Non-Intrusive | Cycle Time | Current Output | Temp. Invasive | Control Valve | CA Line | Actuator | Solenoid Valve | Non-Industrial | 1 | 2 | 3 | Model | Signal | Time | Frequency | Classification | Regression | Charts | |||
| [105] | Research of Pneumatic Actuator Fault Diagnosis Method Based on GA Optimized BP Neural Network and Fuzzy Logic | 2013 | / | / | X | / | / | / | / | X | / | / | / | / | X | X * | X | X | / | / | / | / | / | / |
| [50] | Predictive Consumption Models for Electropneumatic Production Systems | 2013 | X | / | / | / | X | / | / | / | X | / | / | / | X | / | / | X | / | X | / | / | / | / |
| [69] | Compressed air leak detection based on time delay estimation using a portable multi-sensor ultrasonic detector | 2013 | / | / | / | X | / | / | / | / | X | / | / | / | X | X | / | / | X | / | / | / | / | / |
| [95] | A Study on the Detection of Internal Leaks through Valves in Gas Pipeline Based on Support Vector Machine | 2013 | / | / | / | X | / | / | / | / | / | / | X | / | X | X * | X | / | X | X | X | / | / | / |
| [60] | Spectral Analysis for Detection of Leaks in Pipes Carrying Compressed Air | 2013 | / | / | / | X | / | / | / | / | X | / | / | / | X | X * | X | / | X | / | X | / | / | / |
| [33] | End-point Device Compressed Air Consumption Analysis by Reverse Engineering Algorithm | 2013 | / | X | / | / | / | / | / | / | X | X | / | / | X | X | / | / | X | X | / | / | / | / |
| [49] | Study on Fault Simulation for Pneumatic Actuator Model | 2013 | / | / | X | / | / | / | / | X | / | / | / | / | X | X * | X | / | X | / | / | / | / | / |
| [19] | Innovative modular pneumatic valve terminal with self-diagnosis, control and network | 2014 | X | / | / | / | X | / | / | / | / | / | X | / | X | / | / | / | X | / | / | / | / | / |
| [54] | Validation of Model-Based Prognostics for Pneumatic Valves in a Demonstration Testbed | 2014 | / | / | / | / | X | / | / | / | / | / | X | / | X | X * | X | X | / | X | / | / | / | / |
| [48] | Investigation of Fault Detection Techniques for an Industrial Pneumatic Actuator Using Neural Network: DAMADICS Case Study | 2015 | / | / | X | / | / | / | / | X | / | / | / | / | X | X * | X | X | / | / | / | / | / | / |
| [91] | A Two-Stage Fault Detection and Isolation Platform for Industrial Systems Using Residual Evaluation | 2016 | / | / | X | / | / | / | / | X | / | / | / | / | X | X * | X | X | / | X | X | / | / | / |
| [80] | Fault Identification and Isolation in Pneumatic Valve using Image Processing | 2016 | / | / | / | X | / | / | / | X | / | / | / | / | X | X * | / | / | X | / | / | / | / | / |
| [17] | Automated Detection of Compressed Air Leaks Using a Scanning Ultrasonic Sensor System | 2016 | / | / | / | X | / | / | / | / | X | / | / | / | X | X | X | / | X | X | / | / | / | / |
| [72] | The Use of Acoustic Emission Method for Diagnosis of Damage of Pneumatic Cylinders | 2016 | / | / | / | X | / | / | / | / | / | X | / | / | X | X * | / | / | X | / | X | / | / | / |
| [57] | Embedded Triboelectric Active Sensors for Real-Time Pneumatic Monitoring | 2017 | / | / | / | / | / | X | / | / | / | X | / | / | X | X * | / | / | X | X | / | / | / | / |
| [76] | Fault Diagnosis of Pneumatic Systems: Application of a Systematic Model-Based Methodology | 2017 | X | X | / | / | / | / | X | / | / | X | / | / | X | X | / | X | / | / | / | / | / | / |
| [94] | Leak detection in compressed air systems using unsupervised anomaly detection techniques | 2017 | X | / | / | / | X | / | / | / | X | / | / | / | X | X * | / | / | X | X | X | / | / | / |
| [74] | Sequential State Logic for Pneumatic Valve Monitoring using Piezo Film Sensors | 2017 | / | / | / | X | / | / | / | / | / | / | X | / | X | X * | / | / | X | X | / | / | / | / |
| [82] | Industrial compressed air system analysis: Exergy and thermoeconomic analysis | 2017 | / | / | / | X | / | / | / | / | X | / | / | / | X | / | / | X | / | / | / | / | / | / |
| [16] | Test of measurement device for the estimation of leakage flow rate in pneumatic pipeline systems | 2018 | X | / | / | / | / | / | / | / | X | / | / | / | X | / | X | X | / | / | / | / | / | / |
| [66] | Gas Leak Location Detection Based on Data Fusion with Time Difference of Arrival and Energy Decay Using an Ultrasonic Sensor Array | 2018 | / | / | / | X | / | / | / | X | / | / | / | X | X | / | X | / | / | / | / | / | / | |
| [59] | Leak Detection Modeling of a Pipeline Using Echo State Neural Networks | 2018 | / | / | / | X | / | / | / | / | X | / | / | / | X | X * | / | / | X | / | X | / | / | / |
| [89] | Comparison and Mathematical Modelling of Leakage Tests (Flow controller) | 2019 | X | X | / | / | / | / | / | / | X | / | / | / | X | X * | X | X | X | X | / | / | / | / |
| [97] | Real Time Energy Performance Control for Industrial Compressed Air Systems: Methodology and Applications | 2019 | / | X | / | / | / | / | / | / | X | / | / | / | X | / | / | / | X | X | / | / | X | X |
| [52] | Failure prognostics of heavy vehicle hydro-pneumatic spring based on novel degradation feature and support vector regression | 2019 | X | / | / | / | / | / | X | / | / | / | / | X | X | X * | / | X | / | / | X | / | / | / |
| [64] | Fault Detection of a Flow Control Valve Using Vibration Analysis and Support Vector Machine | 2019 | / | / | / | X | / | / | / | X | / | / | / | / | X | X * | / | / | X | / | X | / | / | / |
| [55] | Latent Leakage Fault Identification and Diagnosis Based on Multi-Source Information Fusion Method for Key Pneumatic Units in Chinese Standard Electric Multiple Units (EMU) Braking System | 2019 | X | / | / | / | X | / | / | / | / | / | / | X | X | X * | X | / | X | X | / | / | / | / |
| [102] | Expert estimation of leakage losses in the pneumatic systems in the bottling industry | 2020 | / | X | / | / | / | / | / | / | X | X | X | / | X | / | / | / | X | X | / | / | / | X |
| [68] | Energy management of compressed air systems. Assessing the production and use of compressed air in industry | 2020 | / | X | / | / | / | / | / | / | X | X | / | / | X | / | / | / | X | X | / | / | X | X |
| [70] | AirLeakSlam: Automated Air Leak Detection | 2020 | / | / | / | X | / | / | / | / | X | / | / | / | X | X | / | / | X | / | / | / | / | / |
| [71] | Compressed air leakage detection and quantification through infrared thermography | 2020 | / | / | / | X | / | / | / | / | X | / | / | / | X | X * | X | / | X | X | / | / | / | / |
| [73] | Detecting pneumatic actuator leakage using acoustic emission monitoring | 2020 | / | / | / | X | X | / | / | / | / | X | / | / | X | X * | / | / | X | X | X | / | / | / |
| [53] | Predictive maintenance with a minimum of sensors using pneumatic clamps as an example | 2020 | / | / | / | / | X | / | / | / | / | X | / | / | X | X | / | / | X | X | / | / | / | / |
| [47] | Fault Diagnosis Approach for Pneumatic Control Valves Based on Modified Expert System | 2020 | / | / | X | / | / | / | / | X | / | / | / | / | X | X * | X | / | X | X | / | / | / | / |
| [88] | A Proposed Method for Online Condition Monitoring of Pneumatic Systems Under Different Operating Conditions and Parameters for Optimal Energy Consumption | 2021 | X | / | / | / | X | / | / | / | / | / | X | / | X | X * | / | X | / | / | / | / | / | / |
| [7] | Diagnosis of Pneumatic Systems on Basis of Time Series and Generalized Feature for Comparison with Standards for Normal Working Condition | 2021 | / | X | / | / | X | / | / | / | X | X | / | / | X | X | X | / | X | X | / | X | / | / |
| [79] | Fault Diagnosis in Manufacturing Systems Using Machine Vision | 2021 | / | / | / | X | / | / | / | / | / | X | X | / | X | X * | / | / | X | / | / | / | / | / |
| [77] | Feasibility of using thermal response methods for nonintrusive compressed air flow measurement | 2021 | / | / | / | X | / | / | / | / | X | / | / | / | X | / | X | X | / | / | / | / | / | / |
| [61] | A Mobile Robot Based Monitoring Platform for Pipeline Leakage Diagnosis | 2021 | / | / | / | X | / | / | / | / | X | / | / | / | X | X | X | / | X | X | / | / | / | / |
| [75] | A Data-Driven Approach to Air Leakage Detection in Pneumatic Systems | 2021 | X | X | / | / | / | / | X | / | X | / | / | / | X | X * | / | / | X | X | / | / | / | / |
| [45] | Fault Detection of Pneumatic Control Valves Based on Canonical Variate Analysis | 2021 | / | / | X | / | / | / | / | X | / | / | / | / | X | X * | X | / | X | X | / | / | / | / |
| [67] | An ultrasonic application to evaluate energy costs of air leakages at the compressed air systems | 2021 | / | / | / | X | / | / | / | / | X | X | / | / | X | / | / | / | X | / | / | / | / | / |
| [87] | A Method for Mass Flow and Displacement Estimation in a Pneumatic Actuation System Using Valve-Based Pressure Sensing | 2021 | X | / | / | / | / | / | / | / | / | / | X | / | X | X * | X | X | / | X | / | / | / | / |
| [56] | Integrated Real-time Pneumatic Monitoring System with Triboelectric Linear Displacement Sensor | 2022 | / | / | / | / | / | X | / | / | / | X | / | / | / | / | / | / | X | / | / | / | / | / |
| [63] | Fault Detection and Identification on Pneumatic Production Machine | 2022 | X | X | / | X | / | / | / | / | / | X | / | / | X | X | X | / | X | X | X | / | / | / |
| [81] | Fusion-Based Online Identification Technique for Pneumatic Actuator Faults | 2022 | / | / | X | X | / | / | / | X | / | / | / | / | X | X * | X | X | / | / | / | / | / | / |
| [51] | Gas Leakage Detection and Pressure Difference Identification by Asymmetric Differential Pressure Method | 2022 | X | / | / | / | / | / | X | / | X | / | / | / | X | X * | X | X | / | X | / | / | / | / |
| [46] | Process monitoring of the pneumatic control valve using Canonical Variate Analysis | 2022 | / | / | X | / | / | / | / | X | / | / | / | / | X | X * | X | / | X | / | / | / | / | / |
| [98] | Regression analysis of the operational parameters and energy-saving potential of industrial compressed air systems | 2022 | X | X | / | / | / | / | X | / | X | / | / | / | X | / | / | / | X | X | / | / | X | X |
| [40] | A Review of Fault Detection Methods in Smart Pneumatic Systems | 2022 | / | / | / | X | / | / | / | / | / | X | / | / | X | X * | / | / | X | / | X | / | / | / |
| [34] | Analysis of pneumatic parameters to identify leakages and faults on the demand side of a compressed air system | 2022 | X | X | / | / | X | / | / | / | X | X | / | / | X | X * | X | / | X | X | / | / | / | / |
| [24] | A research on the easy-to-use energy efficiency performance indicators for energy audit and energy monitoring of industrial compressed air systems | 2022 | / | / | / | X | / | / | / | / | X | X | / | / | X | / | / | / | X | / | / | / | X | / |
| [62] | Identification of energy wastes through sound analysis in compressed air systems | 2022 | / | / | / | X | / | / | / | / | / | / | X | / | X | X * | X | X | / | / | X | / | / | / |
| Percentage of Studies | 28 | 21 | 15 | 43 | 19 | 4 | 9 | 19 | 47 | 30 | 17 | 4 | 100 | 36 | 42 | 70 | 32 | 51 | 23 | 2 | 8 | 8 | ||
Legend: X: Satisfies the criterion/Does not satisfy the criterion, * Fault Location Automatically Known Due to Size of System.
References
- Eurostat. Industrial production statistics. Available online: https://ec.europa.eu/eurostat/statistics-explained/index.php?title=Industrial_production_statistics (accessed on 10 December 2022).
- Talbott, E.M. Compressed Air Systems A Guidebook on Energy and Cost Savings, 2nd ed.; The Fairmont Press, Inc.: Lilburn, Georgia, 1993. [Google Scholar]
- Papoutsidakis, M.; Tseles, D.; Malatestas, P. A Comparative Study of Controlling a Pneumatic Conveying System with a Multifunctional Interface and Simulation. Int. J. Sustain. Energy Dev. 2015, 4, 196–205. Available online: https://www.researchgate.net/publication/293481342 (accessed on 15 November 2022). [CrossRef]
- Foit, K.; Banaś, W.; Ćwikła, G. The pneumatic and electropneumatic systems in the context of 4th industrial revolution. IOP Conf. Series: Mater. Sci. Eng. 2018, 400, 022024. [Google Scholar] [CrossRef]
- Eurostat. Air emissions accounts for greenhouse gases by NACE Rev. 2 activity—Quarterly data. Available online: https://ec.europa.eu/eurostat/cache/metadata/en/env_ac_aigg_q_esms.htm (accessed on 10 December 2022).
- Blagojevic, V.; Seslija, D.; Dudic, S.; Randjelovic, S. Energy Efficiency of Pneumatic Cylinder Control with Different Levels of Compressed Air Pressure and Clamping Cartridge. Energies 2020, 13, 3711. [Google Scholar] [CrossRef]
- Kosturkov, R.; Nachev, V.; Titova, T. Diagnosis of Pneumatic Systems on Basis of Time Series and Generalized Feature for Comparison with Standards for Normal Working Condition. TEM J. 2021, 10, 183–191. [Google Scholar] [CrossRef]
- Saidur, R.; Rahim, N.A. Hasanuzzaman A review on compressed-air energy use and energy savings. Renew. Sustain. Energy Rev. 2010, 14, 1135–1153. [Google Scholar] [CrossRef]
- Abela, K.; Refalo, P.; Francalanza, E. Design and implementation of an energy monitoring cyber physical system in pneumatic automation. Procedia CIRP 2020, 88, 240–245. [Google Scholar] [CrossRef]
- Vittorini, D.; Cipollone, R. Energy saving potential in existing industrial compressors. Energy 2016, 102, 502–515. [Google Scholar] [CrossRef]
- Raisch, A.; Sawodny, O. Energy Savings in Pneumatically Driven Plants. IEEE/ASME Trans. Mechatron. 2022, 27, 1023–1033. [Google Scholar] [CrossRef]
- Giacone, E.; Mancò, S. Energy efficiency measurement in industrial processes. Energy 2012, 38, 331–345. [Google Scholar] [CrossRef]
- Marshall, R. Snack Food Manufacturer Saves 50%. Available online: https://www.airbestpractices.com/industries/food/snack-food-manufacturer-saves-50 (accessed on 14 November 2022).
- Abdelaziz, E.A.; Saidur, R.; Mekhilef, S. A review on energy saving strategies in industrial sector. Renew. Sustain. Energy Rev. 2011, 15, 150–168. [Google Scholar] [CrossRef]
- Mousavi, S.; Kara, S.; Kornfeld, B. Energy Efficiency of Compressed Air Systems. Procedia CIRP 2014, 15, 313–318. [Google Scholar] [CrossRef]
- Dindorf, R.; Wos, P. Test of measurement device for the estimation of leakage flow rate in pneumatic pipeline systems. Meas. Control 2018, 51, 514–527. [Google Scholar] [CrossRef]
- Guenther, T.; Kroll, A. Automated detection of compressed air leaks using a scanning ultrasonic sensor system. In Proceedings of the 2016 IEEE Sensors Applications Symposium, Catania, Italy, 20–22 April 2016; pp. 116–121. [Google Scholar] [CrossRef]
- CDC. Too Loud! For Too Long! 2020. Available online: https://www.cdc.gov/vitalsigns/hearingloss/index.html#:~:text=Continual%20exposure%20to%20noise%20can,home%20and%20in%20the%20community (accessed on 27 January 2022).
- Takosoglu, E.J.; Laski, P.; Blasiak, S. Innovative modular pneumatic valve terminal with self-diagnosis, control and network communications. In Proceedings of the 20th International Conference Engineering Mechanics, Cairo, Egypt, 28–31 March 2022; pp. 12–15. [Google Scholar]
- European Commission. 2030 Climate Target Plan. Available online: https://climate.ec.europa.eu/eu-action/european-green-deal/2030-climate-target-plan_en#:~:text=With%20the%202030%20Climate%20Target,40%25EN%E2%80%A2%E2%80%A2%E2%80%A2 (accessed on 10 December 2022).
- European Commission. The Green Deal Industrial Plan; EU Publications: London, UK, 2023. [CrossRef]
- United Nations. The 17 Goals. 2021. Available online: https://sdgs.un.org/goals (accessed on 1 December 2021).
- European Agency for Safety and Health at Work. Directive 2006/42/EC—New Machinery Directive. 2021. Available online: https://osha.europa.eu/en/legislation/directives/directive-2006-42-ec-of-the-european-parliament-and-of-the-council (accessed on 10 December 2022).
- Çağman, S.; Soylu, E.; Ünver, Ü. A research on the easy-to-use energy efficiency performance indicators for energy audit and energy monitoring of industrial compressed air systems. J. Clean. Prod. 2022, 365, 132698. [Google Scholar] [CrossRef]
- Caruana, L.; Refalo, P. Sustainability analysis of a compressed air system. Eng. Sustain. Sustain. Energy 2018, 39–45. [Google Scholar]
- Abela, K.; Francalanza, E.; Refalo, P. Utilisation of a compressed air test bed to assess the effects of pneumatic parameters on energy consumption. In Proceedings of the 27th CIRP Life Cycle Engineering (LCE) Conference, Online, 13–15 May 2020; pp. 498–503. [Google Scholar] [CrossRef]
- Šešlija, D.; Dudić, S. Potential energy savings in compressed air systems in Serbia. 2011. Available online: https://www.researchgate.net/publication/267217619 (accessed on 10 December 2022).
- Vadde, S.; Kamarthi, S.V.; Berry, N.M.; Vadde, S. Smart sensors in a flow-line manufacturing system: An agent-based simulation. In Proceedings of the 2005 International Conference on Integration of Knowledge Intensive Multi-Agent Systems, KIMAS’05: Modeling, Exploration, and Engineering, Waltham, MA, USA, 18–21 April 2005; pp. 635–640. [Google Scholar] [CrossRef]
- Xu, X. From cloud computing to cloud manufacturing. Robot. Comput. Manuf. 2012, 28, 75–86. [Google Scholar] [CrossRef]
- Boehm, R.; Franke, J. Demand-side-management by Flexible Generation of Compressed Air. In Proceedings of the 50th CIRP Conference on Manufacturing Systems, Taichung City, Taiwan, 3–5 May 2017. [Google Scholar] [CrossRef]
- Jena, M.C.; Mishra, S.K.; Moharana, H.S. Application of Industry 4.0 to enhance sustainable manufacturing. Environ. Prog. Sustain. Energy 2020, 39, 13360. [Google Scholar] [CrossRef]
- KAESER. Sigma Air Utility: Air as a Service. Available online: https://us.kaeser.com/services/compressed-air-as-utility-service/ (accessed on 25 November 2022).
- Cupek, R.; Folkert, K.; Huczala, L.; Zonenberg, D.; Tomczyk, J. End-point device compressed air consumption analysis by reverse engineering algorithm. In Proceedings of the IECON Proceedings (Industrial Electronics Conference), Vienna, Austria, 10–13 November 2013; pp. 7519–7524. [Google Scholar] [CrossRef]
- Abela, K.; Refalo, P.; Francalanza, E. Analysis of pneumatic parameters to identify leakages and faults on the demand side of a compressed air system. Clean. Eng. Technol. 2022, 6, 100355. [Google Scholar] [CrossRef]
- Neale, J.R.; Kamp, P.J.J. Compressed air system best practice programmes: What needs to change to secure long-term energy savings for New Zealand? Energy Policy 2009, 37, 3400–3408. [Google Scholar] [CrossRef]
- Eret, P.; Harris, C.; O’Donnell, G.; Meskell, C. A practical approach to investigating energy consumption of industrial compressed air systems. Proc. Inst. Mech. Eng. Part A J. Power Energy 2012, 226, 28–36. [Google Scholar] [CrossRef]
- FESTO. Energy efficiency module MSE6. Available online: https://www.festo.com/gb/en/a/8085453/?q=~:festoSortOrderScored (accessed on 25 November 2022).
- SMC. Air Management System. Available online: https://www.smcworld.com/products/video/en-jp/air_management_system.html (accessed on 25 November 2022).
- EMERSON. AVENTICS Smart Pneumatics. 2019. Available online: https://www.emerson.com/documents/automation/brochure-smart-pneumatics-aventics-en-6980724.pdf (accessed on 25 November 2022).
- Coanda, P.; Avram, M.; Comeaga, D.; Gramescu, B.; Constantin, V.; Nita, E. A Review of Fault Detection Methods in Smart Pneumatic Systems and Identification of Key Failure Indicators. Innov. Mechatron. Eng. II 2022, 82, 132–142. [Google Scholar] [CrossRef]
- Regona, M.; Yigitcanlar, T.; Xia, B.; Li, R.Y.M. Opportunities and Adoption Challenges of AI in the Construction Industry: A PRISMA Review. J. Open Innov. Technol. Mark. Complex. 2022, 8, 45. [Google Scholar] [CrossRef]
- Cortese, T.T.P.; de Almeida, J.F.S.; Batista, G.Q.; Storopoli, J.E.; Liu, A.; Yigitcanlar, T. Understanding Sustainable Energy in the Context of Smart Cities: A PRISMA Review. Energies 2022, 15, 2382. [Google Scholar] [CrossRef]
- Martín-Martín, A.; Orduna-Malea, E.; Thelwall, M.; Delgado López-Cózar, E. Google Scholar, Web of Science, and Scopus: A systematic comparison of citations in 252 subject categories. J. Informetr. 2018, 12, 1160–1177. [Google Scholar] [CrossRef]
- Page, M.J.; McKenzie, J.E.; Bossuyt, P.M.; Boutron, I.; Hoffmann, T.C.; Mulrow, C.D.; Shamseer, L.; Tetzlaff, J.M.; Akl, E.A.; Brennan, S.E.; et al. The PRISMA 2020 Statement: An Updated Guideline for Reporting Systematic Reviews. BMJ 2021, 372, n71. [Google Scholar] [CrossRef] [PubMed]
- Han, X.; Jiang, J.; Xu, A.; Huang, X.; Pei, C.; Sun, Y. Fault Detection of Pneumatic Control Valves Based on Canonical Variate Analysis. IEEE Sensors J. 2021, 21, 13603–13615. [Google Scholar] [CrossRef]
- Ma, L.; Li, X.; Lei, C.; Wang, W. Process monitoring of the pneumatic control valve using canonical variate analysis. In Proceedings of the Chinese Automation Congress, Xiamen, China, 20–22 October 2017; pp. 2784–2788. [Google Scholar] [CrossRef]
- Zhang, D.; Hao, J.; Chen, L.; Zhou, L. Fault Diagnosis Approach for Pneumatic Control Valves Based on Modified Expert System. In Proceedings of the 2020 19th Distributed Computing and Applications for Business Engineering and Science, DCABES 2020, Xuzhou, China, 16–19 October 2020; pp. 104–107. [Google Scholar] [CrossRef]
- Elakkiya, V.; Kumar, K.R.; Gomathi, V.; Kumar, S.R. Investigation of Fault Detection Techniques for an Industrial Pneumatic Actuator Using Neural Network: DAMADICS Case Study. In Artificial Intelligence and Evolutionary Algorithms in Engineering Systems; Springer: Berlin/Heidelberg, Germany, 2015; Volume 324, pp. 237–246. [Google Scholar] [CrossRef]
- Feng, Z.G.; Zhang, X.J. Study on Fault Simulation for Pneumatic Actuator Model. Adv. Mater. Res. 2013, 706–708, 1025–1028. [Google Scholar]
- Harris, P.; O’Donnell, G.E.; Whelan, T. Predictive Consumption Models for Electropneumatic Production Systems. IEEE/ASME Trans. Mechatron. 2013, 18, 1519–1526. [Google Scholar] [CrossRef]
- Shi, Y.; Chang, J.; Wang, Y.; Zhao, X.; Zhang, Q.; Yang, L. Gas Leakage Detection and Pressure Difference Identification by Asymmetric Differential Pressure Method. Chin. J. Mech. Eng. 2022, 35, 44. [Google Scholar] [CrossRef]
- Yang, C.; Song, P.; Liu, X. Failure prognostics of heavy vehicle hydro-pneumatic spring based on novel degradation feature and support vector regression. Neural Comput. Appl. 2019, 31, 139–156. [Google Scholar] [CrossRef]
- Gauchel, W.; Kg, G.F.A.; Streichert, T.; Wilhelm, Y. Predictive maintenance with a minimum of sensors using pneumatic clamps as an example. Core 2020, 12, 175–183. [Google Scholar] [CrossRef]
- Kulkarni, M.J.; Daigle, K.; Goebel, M.; Gorospe, G. Validation of Model-Based Prognostics for Pneumatic Valves in a Demonstration Testbed. 2014. Available online: https://www.researchgate.net/publication/266386316 (accessed on 10 November 2022).
- Zuo, J.; Ding, J.; Feng, F. Latent Leakage Fault Identification and Diagnosis Based on Multi-Source Information Fusion Method for Key Pneumatic Units in Chinese Standard Electric Multiple Units (EMU) Braking System. Appl. Sci. 2019, 9, 300. [Google Scholar] [CrossRef]
- Yuan, Z.; Zhang, X.; Gao, Q.; Wang, Z.; Cheng, T.; Wang, Z.L. Integrated Real-Time Pneumatic Monitoring System with Triboelectric Linear Displacement Sensor. IEEE Trans. Ind. Electron. 2022, 70, 6435–6441. [Google Scholar] [CrossRef]
- Fu, X.P.; Bu, T.Z.; Ben Xi, F.; Cheng, T.H.; Zhang, C.; Wang, Z.L. Embedded Triboelectric Active Sensors for Real-Time Pneumatic Monitoring. ACS Appl. Mater. Interfaces 2017, 9, 32352–32358. [Google Scholar] [CrossRef] [PubMed]
- Alotaibi, M.; Asli, B.H.S.; Khan, M. Non-Invasive Inspections: A Review on Methods and Tools. Sensors 2021, 21, 8474. [Google Scholar] [CrossRef] [PubMed]
- Ribeiro, A.M.; Grossi, C.D.; Santos, B.F.; Santos, R.B.; Fileti, A.M. Leak Detection Modeling of a Pipeline Using Echo State Neural Networks. In Proceedings of the 28th European Symposium on Computer Aided Process Engineering Computer Aided Chemical Engineering, Graz, Austria, 10–13 June 2018; pp. 1231–1236. [Google Scholar] [CrossRef]
- Santos, R.B.; de Almeida, W.S.; da Silva, F.; da Cruz, S.L.; Fileti, A.M.F. Spectral Analysis for Detection of Leaks in Pipes Carrying Compressed Air. 2013. Available online: www.aidic.it/cet (accessed on 10 November 2022).
- Tang, W.; Zhang, G.; Fengshou, G.; Tang, X. A Mobile Robot Based Monitoring Platform for Pipeline Leakage Diagnosis. In Proceedings of the IncoME-V & CEPE Net, Zhuhai, China, 23–25 October 2020; pp. 477–489. [Google Scholar]
- Czopek, D.; Gryboś, D.; Leszczyński, J.; Wiciak, J. Identification of energy wastes through sound analysis in compressed air systems. Energy 2022, 239, 122122. [Google Scholar] [CrossRef]
- Dobossy, B.; Formanek, M.; Stastny, P.; Spacil, T. Fault Detection and Identification on Pneumatic Production MachineModelling and Simulation for Autonomous Systems. In Proceedings of the 8th International Conference, MESAS 2021, Virtual, 13–14 October 2021. [Google Scholar] [CrossRef]
- Venkata, S.K.; Rao, S. Fault Detection of a Flow Control Valve Using Vibration Analysis and Support Vector Machine. Electronics 2019, 8, 1062. [Google Scholar] [CrossRef]
- Eret, P.; Meskell, C. Microphone Arrays as a Leakage Detection Tool in Industrial Compressed Air Systems. Adv. Acoust. Vib. 2012, 2012, 689379. [Google Scholar] [CrossRef]
- Wang, T.; Wang, X.; Hong, M. Gas Leak Location Detection Based on Data Fusion with Time Difference of Arrival and Energy Decay Using an Ultrasonic Sensor Array. Sensors 2018, 18, 2985. [Google Scholar] [CrossRef]
- Soylu, E.; Bilgin, H.; Cagman, S.; Unver, U. An Ultrasonic Application to Evaluate Energy Costs of Air Leakages at the Compressed Air Systems. In Proceedings of the 2021 6th International Conference on Smart and Sustainable Technologies, Split, Croatia, 8–11 September 2021. [Google Scholar] [CrossRef]
- Eras, J.J.C.; Gutiérrez, A.S.; Santos, V.S.; Ulloa, M.J.C. Energy management of compressed air systems. Assessing the production and use of compressed air in industry. Energy 2020, 213, 118662. [Google Scholar] [CrossRef]
- Liao, P.; Cai, M.; Shi, Y.; Fan, Z. Compressed air leak detection based on time delay estimation using a portable multi-sensor ultrasonic detector. Meas. Sci. Technol. 2013, 24, 055102. [Google Scholar] [CrossRef]
- Schenck, A.; Daems, W.; Steckel, J. AirLeakSlam: Automated Air Leak Detection. In Proceedings of the 14th International Conference on P2P, Parallel, Grid, Cloud and Internet Computing (3PGCIC-2019), Barcelona, Belgium, 7–9 November 2020; pp. 746–755. Available online: http://www.springer.com/series/15179 (accessed on 10 November 2022).
- Hassan, M.; Ebrahimi, A.; Woo Jeon, H.; Wang, C. Compressed air leakage detection and quantification through infrared thermography. In Proceedings of the IISE Annual Conference, Virtual, 30 May–2 June 2020. [Google Scholar]
- Mazal, P.; Vlasic, F.; Mahmoud, H.; Jana, M. The Use of Acoustic Emission Method for Diagnosis of Damage of Pneumatic Cylinders. In Proceedings of the 19th World Conference on Non-Destructive Testing, Munich, Germany, 13–17 June 2016; Available online: http://creativecommons.org/licenses/by/3.0 (accessed on 13 November 2022).
- Mahmoud, H.; Mazal, P.; Vlasic, F. Detecting pneumatic actuator leakage using acoustic emission monitoring. In Insight: Non-Destructive Testing and Condition Monitoring; British Institute of Non-Destructive Testing: Northampton, UK, 2020; Volume 62, pp. 22–26. [Google Scholar] [CrossRef]
- Yerra, M.; Nasipuri, A.; Duemmler, H. Sequential state logic for pneumatic valve monitoring using piezo film sensors. In Proceedings of the Conference Proceedings–IEEE Southeastcon, Concord, NC, USA, 30 March–2 April 2017. [Google Scholar] [CrossRef]
- Rajashekarappa, M.; Lene, J.; Bekar, E.T.; Skoogh, A.; Karlsson, A. A Data-Driven Approach to Air Leakage Detection in Pneumatic Systems. In Proceedings of the Global Reliability and Prognostics and Health Management, Nanjing, China, 15–17 October 2021. [Google Scholar] [CrossRef]
- Rahman, B.M.; Busch, G.T.; Ahmed, Q.; Rizzoni, G. Fault Diagnosis of Pneumatic Systems: Application of a Systematic Model-Based Methodology. IFAC PapersOnLine 2017, 50, 3294–3300. [Google Scholar] [CrossRef]
- Terrill, T.J.; Kim, T.; Rasmussen, B.P. Feasibility of using thermal response methods for nonintrusive compressed air flow measurement. Flow Meas. Instrum. 2021, 77, 101869. [Google Scholar] [CrossRef]
- SMC. 2-Colour Display Digital Flow Switch. Available online: https://www.smcworld.com/newproducts/en-jp/21/pf2m7/ (accessed on 12 December 2022).
- Jura, J.; Kubica, J.; Cejnek, M.; Kuchar, M. Fault Diagnosis in Manufacturing Systems Using Machine Vision. In Proceedings of the 2021 23rd International Conference on Process Control, PC 2021, Virtual, 1–4 June 2021; pp. 313–318. [Google Scholar] [CrossRef]
- Santhosh, K.V.; Shenoy, V.; Navada, B.R. Fault identification and isolation in pneumatic valve using image processing. In Proceedings of the 2016 IEEE International Conference on Distributed Computing, VLSI, Electrical Circuits and Robotics, DISCOVER 2016—Proceedings, Mangalore, India, 13–14 August 2016; pp. 205–210. [Google Scholar] [CrossRef]
- Navada, B.R.; Venkata, S. Fusion-Based Online Identification Technique for Pneumatic Actuator Faults. Eng. Sci. 2022, 17, 56–69. [Google Scholar] [CrossRef]
- Taheri, K.; Gadow, R. Industrial compressed air system analysis: Exergy and thermoeconomic analysis. CIRP J. Manuf. Sci. Technol. 2017, 18, 10–17. [Google Scholar] [CrossRef]
- Szargut, J.; Morris, D.R.; Steward, F.R. Exergy Analysis of Thermal, Chemical, and Metallurgical Processes; Hemisphere Publishing: New York, NY, USA, 1987. [Google Scholar]
- Rahman, B.M.; Busch, G.T.; Ahmed, Q.; Rizzoni, G. Structural Analysis-Based Fault Diagnosis of Pneumatic Systems. In Proceedings of the ASME 2016 Dynamic Systems and Control Conference, Minneapolis, MN, USA, 12–14 October 2016; pp. 1–10. [Google Scholar] [CrossRef]
- Zhang, K. Fault Detection and Diagnosis for Multi-Actuator Pneumatic Systems. Ph.D Thesis, Stony Brook University, Stony Brook, NY, USA, 2011. [Google Scholar] [CrossRef]
- Six, B.; Ould-Bouamama, B.; Lintz, S.; Gehin, A. Railway direct braking system analysis using hybrid bond graph. In Proceedings of the 2016 International Conference on Control, Decision and Information Technologies (CoDIT), St. Julian’s, Malta, 6–8 April 2016; pp. 34–39. [Google Scholar] [CrossRef]
- Vailati, L.G.; Goldfarb, M. A Method for Mass Flow and Displacement Estimation in a Pneumatic Actuation System using Valve-based Pressure Sensing. IEEE/ASME Trans. Mechatron. 2021, 26, 235–245. [Google Scholar] [CrossRef]
- Peerapur, A.U.; Dhavalikar, M.N.; Dingare, S.V.; Patle, B.K. A Proposed Method for Online Condition Monitoring of Pneumatic Systems Under Different Operating Conditions and Parameters for Optimal Energy Consumption. In Proceedings of the ASME 2021 International Mechanical Engineering Congress and Exposition, Virtual, 1–4 November 2021. [Google Scholar] [CrossRef]
- Fojtášek, K.; Dvořák, L.; Krabica, L. Comparison and Mathematical Modelling of Leakage Tests. EPJ Web Conf. 2019, 213, 02019. [Google Scholar] [CrossRef]
- Yang, Y.; Xiong, L.; Huang, Z.; Lin, K.-C. An energy-based nonlinear pressure observer for electronically controlled pneumatic brake fault diagnosis. In Proceedings of the 29th Chinese Control and Decision Conference, CCDC 2017, Chongqing, China, 28–30 May 2017; pp. 3005–3010. [Google Scholar] [CrossRef]
- Heydarzadeh, M.; Nourani, M. A Two-Stage Fault Detection and Isolation Platform for Industrial Systems Using Residual Evaluation. IEEE Trans. Instrum. Meas. 2016, 65, 2424–2432. [Google Scholar] [CrossRef]
- Gao, Z.; Cecati, C.; Ding, S.X. A Survey of Fault Diagnosis and Fault-Tolerant Techniques—Part I: Fault Diagnosis with Model-Based and Signal-Based Approaches. IEEE Trans. Ind. Electron. 2015, 62, 3757–3767. [Google Scholar] [CrossRef]
- Müller, M. Fourier Analysis of Signals. In Fundamentals of Music Processing; Springer International Publishing: Berlin/Heidelberg, Germany, 2015; pp. 39–114. [Google Scholar] [CrossRef]
- Desmet, A.; Delore, M. Leak detection in compressed air systems using unsupervised anomaly detection techniques. In Proceedings of the Annual Conference of The Prognostics and Health Management Society, Jeju, Republic of Korea, 12–15 July 2017. [Google Scholar]
- Cao, G.; Xu, C.; Chen, G.; Shi, H.; Pan, B. A Study on the Detection of Internal Leaks through Valves in Gas Pipeline Based on Support Vector Machine. In Icptt 2013: Trenchless Technology; ASCE: Reston, VI, USA, 2013; pp. 162–173. [Google Scholar] [CrossRef]
- Nakoinz, O. Regression and Correlation Analysis. In The Encyclopedia of Archaeological Sciences; John Wiley & Sons, Inc.: Hoboken, NJ, USA, 2018; pp. 1–4. [Google Scholar] [CrossRef]
- Benedetti, M.; Bonfà, F.; Introna, V.; Santolamazza, A.; Ubertini, S. Real Time Energy Performance Control for Industrial Compressed Air Systems: Methodology and Applications. Energies 2019, 12, 3935. [Google Scholar] [CrossRef]
- Doner, N.; Ciddi, K. Regression analysis of the operational parameters and energy-saving potential of industrial compressed air systems. Energy 2022, 252, 124030. [Google Scholar] [CrossRef]
- Şengöz, N.G. Control Charts to Enhance Quality. In Quality Management Systems—A Selective Presentation of Case-Studies Showcasing Its Evolution; IntechOpen: London, UK, 2018. [Google Scholar] [CrossRef]
- Gan, F.F. Cumulative Sum (CUSUM) Chart; Wiley: Hoboken, NJ, USA, 2017. [Google Scholar] [CrossRef]
- Wilkinson, L. Revising the Pareto Chart. Am. Stat. 2006, 60, 332–334. [Google Scholar] [CrossRef]
- Kosturkov, R.D.; Nachev, V.G.; Titova, T.P. Expert estimation of leakage losses in the pneumatic systems in the bottling industry. IOP Conf. Series Mater. Sci. Eng. 2020, 878, 012008. [Google Scholar] [CrossRef]
- Kecman, V. Support Vector Machines–An Introduction. In Support Vector Machines: Theory and Applications; Studies in Fuzziness and Soft Computing; Wang, L., Ed.; Springer: Berlin/Heidelberg, Germany, 2005; Volume 177, pp. 1–47. [Google Scholar]
- Yang, Y.; Zhu, C.; Xiao, P.; Zheng, C.; Huang, Z. Fault Diagnosis of Direct Electro-pneumatic Brake Based on Model and Data-driven. In Proceedings of the 13th World Congress on Intelligent Control and Automation, Changsha, China, 4–8 July 2018; pp. 1584–1589. [Google Scholar] [CrossRef]
- Feng, Z.; Zhang, X.; Yang, H. Research of Pneumatic Actuator Fault Diagnosis Method Based on GA Optimized BP Neural Network and Fuzzy Logic. In Proceedings of the 10th International Symposium on Neural Networks, Dalian, China, 4–6 July 2013; Proceedings, Part II. pp. 578–585. [Google Scholar] [CrossRef]
- Unger, M.; Radgen, P. Energy Efficiency in Compressed Air Systems-A review of energy efficiency potentials, technological development, energy policy actions and future importance Electric Motors View project. 2018. Available online: https://www.researchgate.net/publication/323019150 (accessed on 14 November 2022).
Disclaimer/Publisher’s Note: The statements, opinions and data contained in all publications are solely those of the individual author(s) and contributor(s) and not of MDPI and/or the editor(s). MDPI and/or the editor(s) disclaim responsibility for any injury to people or property resulting from any ideas, methods, instructions or products referred to in the content. |
© 2023 by the authors. Licensee MDPI, Basel, Switzerland. This article is an open access article distributed under the terms and conditions of the Creative Commons Attribution (CC BY) license (https://creativecommons.org/licenses/by/4.0/).