Abstract
Renewable energy sources (RESs) and electricity demand are not evenly distributed geographically across Europe. Thus, harvesting the wind energy from the north and solar energy from the south and delivering them to the demand in central Europe is a more viable solution. However, the present High-voltage alternating current (HVAC) transmission grids have been sometimes congested; thus, High-voltage direct current (HVDC) provides another possibility along the existing HVAC infrastructure. In this paper, we propose a hybrid HVAC-HVDC grid, allowing a large penetration of concentrated RES in Europe and North Africa. More specifically, the HVDC network is constructed to transfer wind and hydro electricity from northwestern Europe and solar electricity from north Africa, while the HVAC network is used to distribute electricity within each country or among adjacent areas. To quantitatively evaluate the feasibility and relevant performances, multiple dimensions of indicators are designed. Employing several European energy scenarios up to 2050, the performances of the proposed HVAC-HVDC infrastructure are analyzed and compared. The calculation results show that compared with the pure HVAC grid, the integrated HVAC-HVDC grid can significantly reduce greenhouse gas emissions and pollutants, leading to a further reduction in the number of deaths from air pollution. In addition, the HVAC-HVDC grids can accommodate a higher penetration of RES without causing infeasible power flows.
1. Introduction
Energy plays a leading role in satisfying the essential needs of the human being, not only as a direct contribution, but also concerning the basic needs of humans for clean air, water, and food, as well as a higher level of technical and societal aspects at large for supporting the sustainable development of the human society. In 2020, more than two-thirds of the total energy supply of the European Union (EU) was still coming from fossil fuels, including solid fossil fuels (coal), oil and petroleum, and natural gas [1]. Due to the lack of local fossil resources, almost 60 percent of the EU’s energy needs were met by net imports, which will be put in a predicament. For instance, electricity prices in EU countries increased sharply after the Russia–Ukraine war broke out in 2022 as Russia was the main extra-EU supplier [2]. To decrease the energy dependency of EU countries, an electricity-centered energy transition balancing the energy dilemma (security, sustainability, affordability) is necessary and not deferrable.
At present, RESs and electricity demands are not evenly distributed geographically in Europe. According to the latest statistics produced by the European Network of Transmission System Operators for Electricity (ENTSO-E) in 2018 [3], Norway leads in terms of absolute production of hydropower, while Germany has the largest wind power production, followed by Spain, the UK, France, and Italy. As for solar energy, Spain, Germany, and Italy have the highest production in absolute terms, accounting for 78% of all solar capacity together with UK and France. However, in the Nordic and Baltic countries and Poland, there is very little or no solar utilization. A similar situation also applies to geothermal, which almost entirely exists in Iceland, Italy, and Turkey. On the other hand, the total demand at the peak and off-peak hours was, respectively, 590 GW and 264 GW, of which France, Germany, the UK, Italy, and Spain accounted for 57% of the total peak load among 35 ENTSO-E countries.
One of the solutions to solve this problem is to rely on the power transfer corridors, which harvest the wind energy from the north and solar energy from the south and deliver them to the demand in central Europe. Traditionally, HVAC transmission grids have been widely used due to the easy conversion of voltage levels [4]. However, it has already presented several bottlenecks in integrating RESs, transmitting electricity freely, and incurring high congestion costs. According to the study of ENTSO-E in 2020 [5], the congestion frequencies of the critical transmission lines can range from 0.5% to higher than 35% of the total hours of the year. The most congested areas are mainly the interconnection between the “National Grid of Great Britain” and the Nordic grid with continental Europe, as well as connections around Central East Europe. Due to the transmission congestion, the RES curtailment in 2040 is estimated to be 81 TWh [6]: 22% of North Sea wind generation, 19% of Norwegian RES, 11% of Italian RES (most from the south), and 7% of Spanish RES, if the network is not properly upgraded [7]. Based on the weakly integrated EU electricity market through price coupling, a rough estimated congestion cost for the case above can reach around 736 million euros per year.
Thus, the main challenge lies in establishing a robust transmission network capable of efficiently integrating RES from the most abundant sources to the demand center while minimizing congestion. Additionally, the natural characteristics of RESs, such as their non-programmability, low controllability, high volatility, and uneven distribution, pose a challenge for grid operators. In comparison to HVAC, HVDC boasts greater transport capacity, occupies less space, and incurs fewer losses for long-distance transmission [8,9,10,11,12]. With the help of converters, HVDC permits the interconnection of asynchronous systems and offers flexible control over voltage and reactive power [13].
Currently, the majority of the studies or implementations only used HVDC lines to integrate the single-site RESs into the HVAC network rather than form a HVDC network. For example, in [14], a hybrid HVAC-HVDC grid is created by integrating a 1000 MW solar power plant into the Iraqi super grid. To evaluate the network’s performance, the indicator of stability is proposed. In [15], a dynamic hybrid HVAC-HVDC model is introduced for Transmission Expansion Planning, which can effectively integrate high levels of renewable resources. In addition, the operational benefits of a potential hybrid HVAC-HVDC grid in Switzerland are explored in [16], which outlines three scenarios for network configurations in 2025. In addition, these studies mainly focused on power flow control technology and grid security based on their own assumptions for the scenarios, and other factors such as the geographic distribution of large-scale RESs and energy dialogues between different regions cannot been considered, due to the small scale of the studies. Therefore, there is a need for investigating the needed infrastructure for accommodating and supporting large-scale electricity flows compatible with future energy scenarios higher than the national level, e.g., the EU scenarios.
Thus, our proposal involves establishing an HVDC network to gather large-scale RES generation and deliver them to the demand center in conjunction with the existing HVAC system. This approach provides an additional means of distributing power within countries to meet rising demand. The focus of this paper is to propose a vision for supporting the large penetration of RESs in Europe and test their compatibility and feasibility with the EU scenarios [17]. Our contributions can be summarized as follows: (1) We present a comprehensive solution for the transmission of RESs through a hybrid HVAC-HVDC grid, which delivers a large amount of RESs from distant sources into the vicinity of demand centers by HVDC and using existing HVAC to further distribute the electricity transmitted over the HVDC grid. (2) To determine the optimal interconnection between the two networks, we develop a bus allocation model that considers factors such as demand distribution and geographic distances between the HVAC and HVDC buses. (3) We assess the performance of the proposed hybrid grid under various scenarios by using multiple dimensions of indicators, including environment, society, energy, and economy.
The remainder of the paper is organized as follows: the hybrid HVAC-HVDC grid is presented in Section 2, the allocation model and the electricity matching model are given in Section 3, assessment indicators are developed in Section 4, and then different scenarios as well as the simulation results are explained in Section 5. Finally, Section 6 concludes the paper.
2. Integrating an HVDC Network into the Existing HVAC Grid
The European transmission grid is operated by ENTSO-E, which represents 42 Transmission System Operators (TSOs) [18,19]. The interconnected network of ENTSO-E is involved in 35 countries across Europe [20,21]. Apart from the EU’s TSOs, the TSOs from Albania, Bosnia, Herzegovina, Iceland, Switzerland, Montenegro, FYR of Macedonia, Norway, and Serbia are also members of ENTSO-E [22].
In Europe, sizable RESs are concentrated in sites far from the current power grid (e.g., offshore sea) or where grid transfer capacity is low. To fully utilize these resources, the power grid must be enhanced to allow electricity to be transported to the main demand centers. Hence, a more flexible yet robust transmission grid should be designed to transport large amounts of electricity over long distances [23].
The modeling of the generation and demand centers of the expected network involves the investigation of natural resource distribution, such as solar irradiation and wind distribution, as well as future load evolution, including the electrification possibilities. In addition, the appropriate network structure of the energy system is critical for modeling and evaluation [24]. The full European grid is complex and has a multitude of parameters. On the other hand, oversimplified abstract models often neglect fundamental correlations and structures present in real systems [25].
In our research, an integrated HVAC and HVDC network is constructed to simulate ac-power flows and dc-power flows. The network consists of a 256-bus AC system and a 40-bus DC system, where the former is taken from the Pypsa-Europe, which is a python-based multi-energy modeling software package, and the latter is then added on top of the former based on a previous work performed by ABB [26]. To solve the energy crisis in Europe and strengthen socioeconomic development in North Africa [27], four African nodes (Morocco, Algeria, Tunisia, Libya) are involved in the proposed DC system, representing the energy dialogues between the European continent and Africa.
In the DC grid, the main sources of generation are solar energy in northern Africa and wind power from North-western Europe, and the power produced in the RES is transmitted a far distance into the load centers all around Europe. The information on DC generation buses and load center buses is given in Table A1 and Table A2, and the information about DC lines is given in Table A3. For each line, the voltage limit is given as 1100 kV, and the power limit is set to be 10,000 times the number of cables. Similarly, the AC network is used for the high-voltage distribution grid to transmit the RES and the conventional energy further to the demand.
Based on the information given above, we establish the integrated HVAC-HVDC grid (see Figure 1).
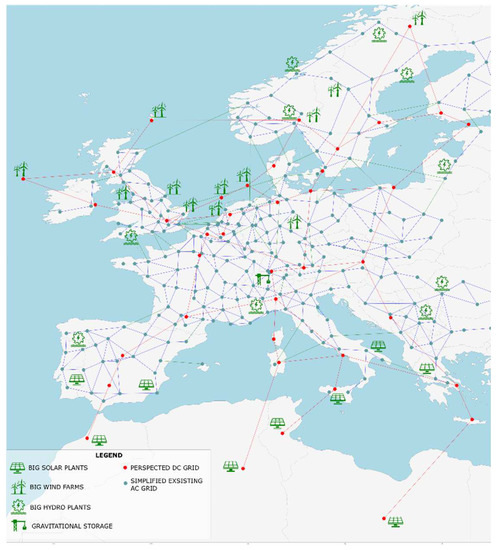
Figure 1.
The integrated HVAC-HVDC Grid.
3. Grid Calculations Related to RES Penetration
As described before, the energy is supplied by both the AC network and the DC network. For the DC system, the electricity is transmitted from DC generation buses to DC load centers and then integrated into AC buses. These load centers are also regarded as the junction points of the AC grid and the DC grid. In this section, we present the allocation model and the electricity matching model to decide the distribution of electricity in different scenarios.
3.1. DC Bus Allocation Model
To decide how to sign each AC bus to a DC load center, an optimization model aiming at maximally averaging the loading of each DC load center as well as geographic distances is developed, considering the capacity of each DC bus, the demand of AC buses, and the natural isolation of continents and islands.
The first objective is to allocate the demand as evenly as possible to the DC buses. Given a set M = {1, 2, …, m} of AC buses, using i as the indicator, and a set N = {1, 2, …, n} of DC load centers, using j as the indicator, the reference for the even value is expressed by the average of the total load.
where is the demand at the bus i.
The second objective is that the geographical distance should be as short as possible. Given the latitude and the longitude of every AC bus and DC load center, we have the geographic distance of bus i and bus j:
where and are the radian values of the geographic coordinates of bus i and bus j, respectively.
Thus, mathematically, the objective function can be expressed by:
s.t
where α and β are weighting factors to form the objective function, and the binary variable denotes if AC bus i would be connected to DC bus j.
Constraint (5) shows that each AC bus can only be connected to one DC load center, while constraint (6) means that each DC load center cannot take an AC load more than .
Based on the mathematical model present above, we can obtain the result of the load allocation to DC buses (see Figure 2).
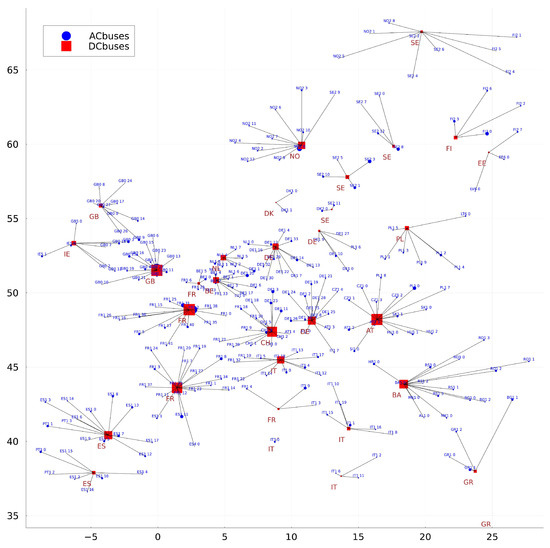
Figure 2.
Allocation results.
3.2. Electricity Matching Model
To simulate different scenarios, we decide the electricity value of every generator, load, and storage by using the following mathematical model: given a set M = {1, 2, …, m} of AC buses, using i as the indicator; a set N = {1, 2, …, n} of DC load centers, using j as the indicator; a set O = {1, 2, …, o} of DC generator buses, using k as the indicator; a set C = {Austria, Belgium, Bulgaria, Czech Republic, Germany, Denmark, Estonia, Greece, Spain, Finland, France, Croatia, Hungary, Ireland, Italy, Lithuania, Luxembourg, Latvia, Netherlands, Poland, Portugal, Romania, Sweden, Slovenia, Slovakia} of involved European countries, using c as the indicator; a set T = {nuclear, biomass, hydro, onwind, offwind, solar, coal, oil, gas} of generator type, using t as the indicator; a set B = {battery, PHS (Pumped Hydro Storage), gravity} of storage type, using b as the indicator.
3.2.1. Pure AC Network
In our research, the properties of a generator can be defined as (country, type). The electricity value of a generator can be set by distributing the gross electricity values of generators of the same property under a scenario.
where is the original pypsa electricity value of the generator attached to bus i, of type t and in country c; is the total pypsa electricity value of all generation of type t in country c; is the total electricity value of all generations of type t in country c under scenario s.
Similarly, the capacity of every generator is:
where is the original pypsa capacity of the generator attached to bus i, of type t and in country c; is the total pypsa capacity of all generators of type t in country c; is the total capacity of all generators of type t in country c under scenario s.
The setting electricity value of loads can be expressed as:
where is the original pypsa electricity value of the load attached to bus i in country c; is the total pypsa electricity value of all loads in country c; is the total electricity value of all loads in country c under scenario s; is the elasticity factor of load in country c.
The electricity value of storages is set as:
where is the total capacity of storages of type b; is the number of storages of type b.
In general, an increase in the proportion of RES necessitates a reduction in conventional energy sources to balance supply and demand. If all conventional generators are shut down and the supply still exceeds demand, the excess can be absorbed by activating energy storage. In this case, the network should meet the following equation:
where , , and are, respectively, the setting electricity value of every hydro generation, solar generation, and wind generation under scenario s; , , and are, respectively, the increased ratio of hydro generation, solar generation, and wind generation; , , and are the enabled scale of battery storage, PHS storage, and gravity storage, respectively.
3.2.2. Hybrid AC and DC Network
In the integrated AC and DC network, the electricity demand is supplied by both the AC grid and DC grid; in other words, part of the power generation of the pure AC network will be transferred to the DC network, and the load on AC nodes will remain. For the AC grid, the electricity value of loads is set as follows:
Based on the results of the DC buses allocation model, the electricity value of every DC load center can be expressed as:
where and are the electricity value of the generation in bus i under scenario s of, respectively, the pure AC network and the hybrid AC and DC network; denotes whether bus i is connected to DC load center j.
The electricity value of the DC generators can be set by distributing the total load that the DC grid should take.
where is the electricity value of DC generator k in ABB’s work; is the total electricity value of all generations in ABB’s work [26].
If storage is activated, the integrated AC and DC network should meet the following equation:
where is the gross electricity values of DC generation.
4. Comparison of Possible Scenarios of RES Penetration in EU
To quantify and compare the performance of the integrated AC-DC network in every scenario, we design four dimensions of evaluation indicators, including environment, society, energy, and economy.
4.1. Emissions
Generators whose energy carriers are gas, oil, biomass, and coal can cause pollution. Given a set R = {Gas, Oil, Biomass, Coal} of polluting energy, using r as the indicator, and a set E = { } of exhaust gas, using e as the indicator, the emission of gas e in scenario s can be calculated as follows:
where denotes the total generation of r generators; denotes the generation efficiency of r; denotes the quantity of gas e that can be produced by one unit of r source. Values of are given in [28].
4.2. Percentage of RES in TFC
4.3. Reserve Margin
The reserve margin is calculated as the difference between the non-intermittent installed capacity and the load [29].
where is the total capacity of all generators under scenario s; and are, respectively, the total capacity of all wind generators and all solar generators under scenario s; is the total load under scenario s.
4.4. Carbon Emission over GDP
4.5. Investment for DC Lines
The cost of DC lines consists of two sectors: the cost of converter stations and the cost of cross-section conductors. The specific indexes can be found in [30]. For the proposed network, the total cost in euros of DC lines can be expressed as follows.
where L is the length in km of the cable.
4.6. Investment for Additional Storages
The total cost of storage can be expressed as follows:
where , , and are the unit cost in euros of battery storage, PHS storage, and gravity storage, respectively. , , and are the total power in kW of battery storage, PHS storage, and gravity storage, respectively.
4.7. Number of Deaths
The calculation of the number of premature deaths caused by the electricity generation process is based on the health impacts of exposure to pollutants described in the Air Quality 2020 report of the European Environment Agency (EEA) [31]. In the report, the number of premature deaths is attributed to three categories of pollutants: , , and .
Concerning , having no specific data on fine particulate emissions, we consider that in the power generation sector, particulate emissions are essentially related to combustion processes, so they can be to a first approximation related to emissions, which are also outputs of combustion processes. Data on the carbon dioxide emissions are taken from the “EU Greenhouse Gas Monitoring Report” from EEA [32]: to estimate mortality due to electricity production exclusively, the ratio of emissions that can be attributed to IPCC sector 1.A.1.a (Public Electricity and Heat Production) with respect to the total net emissions is computed, to obtain the share due to electricity.
From this ratio, the number of deaths per ton of emitted by the power generation process can be calculated in linear proportion to the total number of deaths.
The same method can also be applied to the share of deaths caused by emissions, which, in the absence of more detailed data, are assumed to be proportional to total nitrogen oxide emissions. Data on emissions are taken from the “National Emission reductions Commitments (NEC) Directive” emission inventory data [33].
Like what has been performed for , also for , the number of casualties resulting from the power generation process can be calculated proportionally.
Regarding , power generation processes do not emit significant amounts of ozone; therefore, it is decided not to consider this term.
The total number of casualties due to power generation is computed as the sum of all the relevant terms, shown as follows.
5. Simulation Results
The simulation is performed on a laptop with an 11th Gen Intel(R) Core (TM) i7-1165G7@2.80GHz, and the following software packages: Pypsa-Europe (v0.8.0) for extracting the HVAC network structure and calculating the power flow of the network, Julia for the DC bus allocation model, and Python for the calculation of proposed indicators. In this paper, 12 different cases are developed based on the European Commission’s policy scenarios for delivering the European Green Deal: (a) REF-2030-peak, (b) REF-2030-offpeak, (c) REF-2050-peak, (d) REF-2050-offpeak, (e) REG-2030-peak, (f) REG-2030-offpeak, (g) MIX-2030-peak, (h) MIX-2030-offpeak, (i) MIX-CP-2030-peak, (j) MIX-CP-2030-offpeak, (k) REF-2020-peak, and (l) REF-2020-offpeak.
REF is the baseline scenario aimed at assessing the long-term effects of the policies in place, while REG relies on a very strong intensification of energy and transport policies in the absence of carbon pricing in road transport and buildings. MIX relies on a uniform extension of carbon pricing to road transport and buildings, with a strong intensification of energy and transport policies. By comparison, MIX-CP represents a more carbon price-driven policy mix, with a revision of the EED (Energy Efficiency Directive) and RED (Renewable Energy Directive) directives but with a lower intensification of current policies in addition to the application of carbon pricing to new sectors.
It should be noted that even though there are several mathematical methods that can be employed to calculate the weighting factors α and β, such as game theories, analytic hierarchy processes, analytic network processes, and entropy, in practice, they should be assigned by the decision makers based on their priority assessment. In our study, to not distract from the focus, we set them equally. In addition, it should be noted that as the objectives have a different dimension, they are normalized before assigning the weighting factor. In the off-peak cases of every scenario, all solar generators of the AC network and DC network are set to be closed [34]. The load factor of every country involved is given in Table A4, with Load-MaxFactor for peak scenarios and Load-MinFactor for off-peak scenarios. The information on TFC and GDP in every scenario is given in Table 1.

Table 1.
TFC and GDP in every scenario.
After conducting the power flow analysis, the performance indicators presented in Section 4 are computed. These indicators include emissions, deaths resulting from pollution, reserve margins, percentages of renewable energy sources (RESs) in total final consumption (TFC), and carbon emissions over gross domestic product (GDP) across different scenarios (Figure 3, Figure 4, Figure 5, Figure 6 and Figure 7). The integrated HVAC-HVDC grid exhibits better environmental performance, emitting fewer polluting gases such as , and as depicted in Figure 3a,b. Consequently, under similar conditions, the integrated grid can reduce the death toll by approximately 40%, as illustrated in Figure 4. Regarding energy, the integrated HVAC-HVDC grid offers a higher reserve margin than the pure HVAC grid, implying greater resource adequacy and reliability (Figure 5). In terms of the economy, the RES percentage in TFC for the integrated grid is 10–20% higher than that of the pure HVAC grid. Moreover, the carbon emission over GDP of the former is about 37% lower than that of the latter under the same load scenarios in 2030 and 2050, as evident in Figure 6 and Figure 7, respectively.
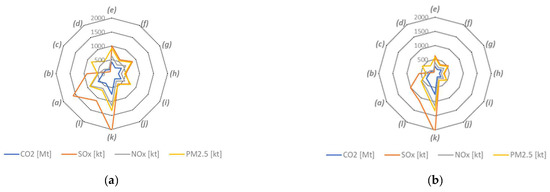
Figure 3.
(a) Emissions of pure HVAC grid. (b) Emissions of hybrid HVAC-HVDC grid.
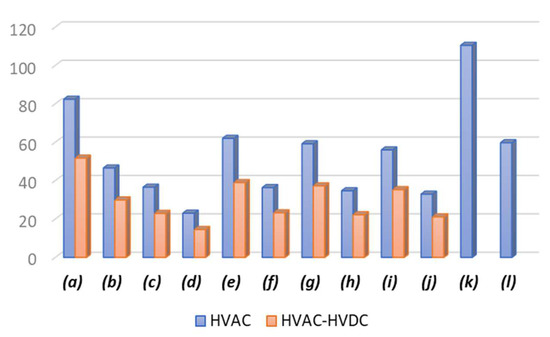
Figure 4.
Number of deaths (kpers).
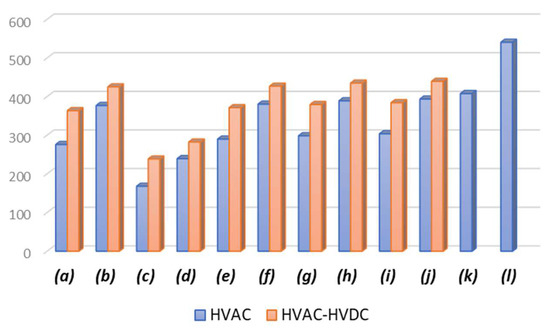
Figure 5.
Reserve margin (GW).
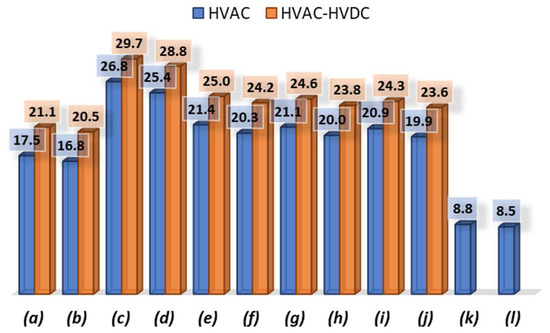
Figure 6.
Percentage of RES in TFC (%).
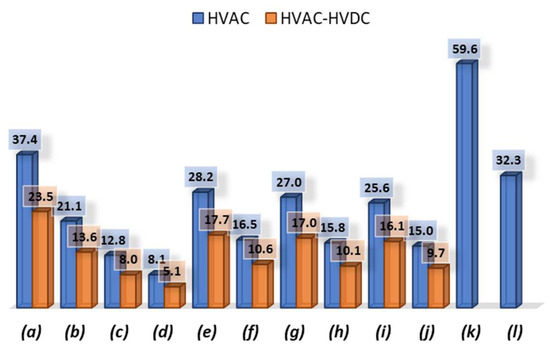
Figure 7.
Carbon emission over GDP (tCO2/M EUR).
In the pure HVAC grid, to reduce the number of deaths caused by pollution, the percentage of RES generation needs to be further increased. At the same time, the storage should be enlarged to balance supply and demand, which leads to the additional cost of the network. In Table 2 and Table 3, we compare the investment cost and congestion of the pure HVAC grid and integrated HVAC-HVDC grid under the same death toll [35]. For example, under scenario REG-2030-peak, if we want to drop the death toll from 62 k persons to 41.4 k persons in the pure HVAC grid, generators of wind, hydro, and solar types should simultaneously increase by 20% and the battery storage needs to extend by 20%. In this case, there are 24 congested lines in the pure HVAC grid and the most load-congested line is 261.4%. However, when the number of deaths is 41.4 k persons, the values of the previous two congestion indicators will be both 0 in the integrated HVAC-HVDC grid, which means it can reduce network congestion significantly. In terms of economy, the integrated HVAC-HVDC requires a much larger investment (282 G EUR), compared to the additional storage cost of a pure HVAC network.

Table 2.
Comparison of HVAC grid.

Table 3.
Comparison of Integrated HVAC-HVDC grid.
Table 4 compares the impact of different levels of renewable energy source (RES) penetration on the proposed indicators. To maintain consistency, we analyze a typical scenario, “REF-2030 peak,” and evaluate the performance of a hybrid HVAC-HVDC grid at varying RES penetration levels. The base RES percentage in this case is 78%. Our analysis reveals an inverse relationship between the RES percentage level and the death toll. A 10% reduction in RES penetration would result in an increase in the number of deaths to 60.26 k individuals, which is about 16.5% higher than the base case. Conversely, increasing RES penetration results in a larger reserve margin. An increase of 10% in RES penetration would result in a rise of 14.8 GW in the reserve margin. In this scenario, altering the level of RES penetration does not cause any storage activation or congestion.

Table 4.
Comparison of Different RES percentages under REF-2030 peak scenario.
6. Conclusions
This paper proposes a hybrid HVAC-HVDC grid, designed to facilitate the large-scale integration of concentrated RESs in Europe and North Africa. The HVDC network has been developed to transport wind and hydro electricity from northwestern Europe, and solar electricity from north Africa, while the HVAC system is used to distribute electricity within countries and across adjacent areas. To simplify the European grid, our network is designed with only 256 AC buses and 40 DC buses. However, the proposed methodology can be adapted to networks of varying sizes, provided there is sufficient information available on the natural resource distribution, geographic coordinates of each bus, load distribution, line parameters, etc. To evaluate the feasibility and performance of our approach, we design multiple dimensions of indicators and develop several different scenarios for the evolution of the European energy system up to 2050.
The results of this study demonstrate the effectiveness of the hybrid HVAC-HVDC grid, which can decrease pollutant emissions and significantly alleviate line congestion. Compared to a pure HVAC grid, the proposed integrated grid can substantially reduce greenhouse gas emissions and pollutants, resulting in a significant reduction of approximately 40% in the number of deaths caused by air pollution. Furthermore, the HVAC-HVDC grid can accommodate a higher RES percentage in TFC, up to 10–20%, without causing infeasible power flows, and it is of greater resource adequacy and reliability. Our findings offer a potential solution for designing the future European grid, with the goal of increasing RES penetration.
Although we present an effective approach, the practical implementation of this method is subject to certain limitations. One limitation is the technical barriers in controlling the HVDC loop system. Additionally, regulatory differences between countries can hinder the widespread establishment of this network. Furthermore, this paper did not consider the recovery of investment, for the wheeling charge mechanism is unclear, making it challenging to model the strategic bidding of market players and accurately calculate the charge. Therefore, further research is necessary to address these issues.
Author Contributions
Conceptualization, E.B. and T.H.; methodology, T.H., H.W. and L.S.; software, T.H., H.W. and L.S.; data curation, T.H., H.W. and L.S.; writing—original draft preparation, H.W., T.H. and L.S.; writing—review and editing, T.H., E.B. and H.W.; validation: T.H. and H.W.; investigation: T.H., H.W., E.B. and L.S.; visualization, T.H. and H.W.; supervision, E.B. and T.H. All authors have read and agreed to the published version of the manuscript.
Funding
This research received no external funding.
Data Availability Statement
No new data were created in this study. Data sharing is not applicable to this article.
Conflicts of Interest
The authors declare no conflict of interest.
Appendix A

Table A1.
DC generation buses.
Table A1.
DC generation buses.
| DC Generator Buses | Longitude | Latitude | Carrier |
|---|---|---|---|
| Shetland | −1.27686 | 60.31516 | wind |
| Oslo | 10.75211 | 59.92592 | wind |
| Harspranget | 19.72371 | 67.57072 | wind |
| North_sea_1 | 4.289222 | 53.94362 | wind |
| North_sea_2 | 6.476374 | 54.80273 | wind |
| Atlantic | −11.828 | 54.99067 | wind |
| Morocco | −6.76444 | 33.77547 | solar |
| Algeria | 5.991758 | 31.16178 | solar |
| Tunisia | 9.73213 | 34.17042 | solar |
| Libya | 18.10944 | 27.2245 | solar |

Table A2.
DC load center buses.
Table A2.
DC load center buses.
| DC Generator Buses | Longitude | Latitude | DC Generator Buses | Longitude | Latitude |
|---|---|---|---|---|---|
| Vienna | 16.37979 | 48.20468 | Glasgow | −4.26822 | 55.86747 |
| Sarajevo | 18.38017 | 43.85774 | Athens | 23.72802 | 37.9913 |
| Brussels | 4.352742 | 50.85677 | Crete | 25.04414 | 35.1648 |
| Zurich | 8.541149 | 47.38227 | Dublin | −6.28165 | 53.34433 |
| Munich | 11.50861 | 48.12606 | Milan | 9.188647 | 45.48454 |
| Bremen | 8.801285 | 53.10803 | Napoli | 14.27177 | 40.86158 |
| Rostock | 12.06175 | 54.16894 | Sicily | 13.70237 | 37.6604 |
| Jutland | 8.833933 | 56.07809 | Sardinia | 8.995972 | 40.22472 |
| Tallinn | 24.74354 | 59.45514 | Amsterdam | 4.89869 | 52.37202 |
| Cordoba | −4.78758 | 37.89018 | Oslo | 10.75211 | 59.92592 |
| Madrid | −3.70397 | 40.41776 | Gdansk | 18.62038 | 54.35726 |
| Abo | 22.26441 | 60.44973 | Malmo | 13.00493 | 55.61098 |
| Toulouse | 1.440377 | 43.60758 | Jonkoping | 14.16623 | 57.7945 |
| Paris | 2.344222 | 48.86394 | Uppsala | 17.6323 | 59.87092 |
| Lille | 3.059241 | 50.6323 | Harspranget | 19.72371 | 67.57072 |
| Corsica | 9.02502 | 42.18225 | |||
| London | −0.07438 | 51.51363 |

Table A3.
DC lines information.
Table A3.
DC lines information.
| Line | Resistance (Ω/km) | Length (km) | Number of Cables | Line | Resistance (Ω/km) | Length (km) | Number of Cables |
|---|---|---|---|---|---|---|---|
| Algeria-Sardinia | 0.6625 | 1000 | 4 | Sicily-Tunisia | 0.6625 | 1000 | 4 |
| Sardinia-Corsica | 0.265 | 300 | 3 | Munich-Zurich | 0.33125 | 250 | 2 |
| Corsica-Milan | 0.309167 | 350 | 3 | Zurich-Milan | 0.265 | 300 | 3 |
| Munich-Rostock | 0.86125 | 650 | 2 | Milan-Vienna | 0.86125 | 650 | 2 |
| Rostock-Malmo | 0.53 | 200 | 1 | Vienna-Gdansk | 1.9875 | 750 | 1 |
| Malmo-Jonkoping | 0.6625 | 250 | 1 | Gdansk-Tallinn | 1.59 | 600 | 1 |
| Jonkoping-Harspranget | 2.65 | 1000 | 1 | Tallinn-Abo | 0.795 | 300 | 1 |
| Jonkoping-Uppsala | 1.06 | 400 | 1 | Abo-Harspranget | 1.59 | 600 | 1 |
| Uppsala-Abo | 0.6625 | 250 | 1 | Lille-Brussels | 0.265 | 100 | 1 |
| London-Glasgow | 1.4575 | 550 | 1 | Brussels-Amsterdam | 0.265 | 200 | 2 |
| Glasgow-Shetland | 1.855 | 700 | 1 | Amsterdam-Bremen | 0.795 | 300 | 1 |
| London-Lille | 0.220833 | 250 | 3 | Bremen-Rostock | 0.33125 | 250 | 2 |
| Munich-Lille | 0.795 | 600 | 2 | Rostock-Gdansk | 1.59 | 600 | 1 |
| Lille-Paris | 0.265 | 200 | 2 | Sardinia-Napoli | 0.6625 | 250 | 1 |
| Paris-Toulouse | 0.795 | 600 | 2 | Napoli-Athens | 1.59 | 600 | 1 |
| Toulouse-Milan | 1.7225 | 650 | 1 | Glasgow-Atlantic | 1.325 | 500 | 1 |
| Toulouse-Madrid | 0.795 | 600 | 2 | Atlantic-Dublin | 0.33125 | 250 | 2 |
| Madrid-Cordoba | 0.309167 | 350 | 3 | Dublin-London | 0.59625 | 450 | 2 |
| Cordoba-Marocco | 0.6625 | 1000 | 4 | London-North_sea_1 | 0.265 | 300 | 3 |
| Munich-Vienna | 1.06 | 400 | 1 | London-Amsterdam | 1.06 | 400 | 1 |
| Vienna-Sarajevo | 0.72875 | 550 | 2 | North_sea_1-North_sea_2 | 0.33125 | 250 | 2 |
| Sarajevo-Athens | 0.750833 | 850 | 3 | North_sea_2-Jutland | 1.06 | 400 | 1 |
| Athens-Crete | 0.19875 | 300 | 4 | Jutland-Oslo | 1.06 | 400 | 1 |
| Crete-Libya | 0.6625 | 1000 | 4 | Oslo-Shetland | 2.7825 | 1050 | 1 |
| Milan-Napoli | 0.618333 | 700 | 3 | Oslo-Jonkoping | 0.46375 | 350 | 2 |
| Napoli-Sicily | 0.485833 | 550 | 3 | North_sea_2-Bremen | 0.220833 | 250 | 3 |

Table A4.
Load factor.
Table A4.
Load factor.
| Country Name | Load-MaxFactor | Load-MinFactor | Country Name | Load-MaxFactor | Load-MinFactor |
|---|---|---|---|---|---|
| Austria | 1.456 | 0.632 | Hungary | 1.348 | 0.698 |
| Belgium | 1.313 | 0.698 | Ireland | 1.347 | 0.649 |
| ulgaria | 1.662 | 0.676 | Italy | 1.444 | 0.648 |
| Czech Republic | 1.433 | 0.638 | Lithuania | 1.379 | 0.683 |
| Germany | 1.285 | 0.595 | Luxembourg | 1.159 | 0.876 |
| Denmark | 1.561 | 0.623 | Latvia | 1.411 | 0.649 |
| Estonia | 1.178 | 0.775 | Netherlands | 1.291 | 0.722 |
| Greece | 1.323 | 0.702 | Poland | 1.321 | 0.64 |
| Spain | 1.16 | 0.677 | Portugal | 1.285 | 0.701 |
| Finland | 1.418 | 0.713 | Romania | 1.339 | 0.706 |
| France | 1.764 | 0.576 | Sweden | 1.654 | 0.614 |
| Croatia | 1.501 | 0.643 | Slovenia | 1.4 | 0.711 |
| Slovakia | 1.357 | 0.767 |
References
- Stollinger, R. The EU’s Most Urgent Industrial Mission: Zero Imports of Fossil Energy. Available online: https://wiiw.ac.at/the-eu-s-most-urgent-industrial-mission-zero-imports-of-fossil-energy-n-547.html (accessed on 29 November 2022).
- Wettengel, J. Germany and the EU Remain Heavily Dependent on Imported Fossil Fuels. Available online: https://www.cleanenergywire.org/factsheets/germanys-dependence-imported-fossil-fuels (accessed on 10 January 2023).
- ENTSO-E. Statistical Facts 2018-Provisional Values As of 5 June 2019; ENTSO-E: Brussels, Belgium, 2018. [Google Scholar]
- Li, X.; Yuan, Z.; Fu, J.; Wang, Y.; Liu, T.; Zhu, Z. Nanao multi-terminal VSC-HVDC project for integrating large-scale wind generation. In Proceedings of the 2014 IEEE PES General Meeting, Conference & Exposition, National Harbor, MD, USA, 27–31 July 2014; pp. 1–5. [Google Scholar]
- ENTSO-E. Bidding Zone Configuration Technical Report 2021: Regular Reporting on Bidding Zone Configuration; ENTSO-E: Brussels, Belgium, 2021. [Google Scholar]
- ENTSO-E. Completing the Map—Power System Needs in 2030 and 2040; ENTSO-E: Brussels, Belgium, 2020. [Google Scholar]
- Europe’s Future Secure and Sustainable Electricity Infrastructure—E-Highway2050 Project Results. Available online: http://www.e-highway2050.eu (accessed on 30 November 2022).
- Kalair, A.; Abas, N.; Khan, N. Comparative study of HVAC and HVDC transmission systems. Renew. Sustain. Energy Rev. 2016, 59, 1653–1675. [Google Scholar] [CrossRef]
- Halder, T. Comparative study of HVDC and HVAC for a bulk power transmission. In Proceedings of the 2013 International Conference on Power, Energy and Control (ICPEC), Dindigul, India, 6–8 February 2013; pp. 139–144. [Google Scholar]
- Hussein, I.I.; Essallah, S.; Khedher, A. Comparative study of HVDC and HVAC systems in presence of large scale renewable energy sources. In Proceedings of the 2020 20th International Conference on Sciences and Techniques of Automatic Control and Computer Engineering (STA), Monastir, Tunisia, 20–22 March 2020; pp. 225–230. [Google Scholar]
- Nguyen, M.H.; Saha, T.K.; Eghbal, M. A comparative study of voltage stability for long distance HVAC and HVDC interconnections. In Proceedings of the IEEE PES General Meeting, Minneapolis, MN, USA, 25–29 July 2010; pp. 1–8. [Google Scholar]
- Albannai, B. Comparative Study of HVAC and HVDC Transmission Systems With Proposed Machine Learning Algorithms for Fault Location Detection. Ph.D. Thesis, Arizona State University, Tempe, AZ, USA, 2019. [Google Scholar]
- Pillay, C.J. Transmission Systems: HVAC vs HVDC. In Proceedings of the 5th NA International Conference on Industrial Engineering and Operations Management Detroit, Michigan, MI, USA, 10–14 August 2021; Volume 2. [Google Scholar]
- Hussein, I.I.; Essallah, S.; Khedher, A. Improvement of the Iraqi Super Grid Performance Using HVDC/HVAC Links by the Integration of Large-Scale Renewable Energy Sources. Energies 2022, 15, 1142. [Google Scholar] [CrossRef]
- Moradi-Sepahvand, M.; Amraee, T. Hybrid AC/DC transmission expansion planning considering HVAC to HVDC conversion under renewable penetration. IEEE Trans. Power Syst. 2020, 36, 579–591. [Google Scholar] [CrossRef]
- Stanojev, O.; Garrison, J.; Hedtke, S.; Franck, C.M. Demiray. Benefit Analysis of a Hybrid HVAC/HVDC Transmission Line: A Swiss Case Study. In Proceedings of the 2019 IEEE Milan PowerTech, Milan, Italy, 23–27 June 2019; pp. 1–6. [Google Scholar] [CrossRef]
- Siregar, Y.; Pardede, C. Study of Hybrid Transmission HVAC/HVDC by Particle Swarm Optimization (PSO). Energies 2022, 15, 7638. [Google Scholar] [CrossRef]
- Verseille, J.; Staschus, K. The Mesh-Up: ENTSO-E and European TSO Cooperation in Operations, Planning, and R&D. IEEE Power Energy Mag. 2015, 13, 20–29. [Google Scholar] [CrossRef]
- ENTSO-E. Market Report 2022; ENTSO-E: Brussels, Belgium, 2022. [Google Scholar]
- Semerow, A.; Höhn, S.; Luther, M.; Sattinger, W.; Abildgaard, H.; Garcia, A.D.; Giannuzzi, G. Dynamic Study Model for the interconnected power system of Continental Europe in different simulation tools. In Proceedings of the 2015 IEEE Eindhoven PowerTech, Eindhoven, The Netherlands, 29 June–2 July 2015; pp. 1–6. [Google Scholar] [CrossRef]
- Hutcheon, N.; Bialek, J.W. Updated and validated power flow model of the main continental European transmission network. In Proceedings of the 2013 IEEE Grenoble Conference, Grenoble, France, 16–20 June 2013; pp. 1–5. [Google Scholar] [CrossRef]
- Glowacki Law Firm Report: European Network of Transmission System Operators for Electricity (ENTSO-E); ENTSO-E: Brussels, Belgium, 26 August 2015. Available online: https://emissions-euets.com/internal-electricity-market-glossary/894-european-network-of-transmission-system-operators-for-electricity-entso-e (accessed on 26 January 2023).
- European Commission. Transcontinental and Global Power Grids. Available online: https://ses.jrc.ec.europa.eu/transcontinental-and-global-power-grids (accessed on 15 October 2022).
- Tranberg, B.; Thomsen, A.B.; Rodriguez, R.A.; Andresen, G.B.; Schäfer, M.; Greiner, M. Power flow tracing in a simplified highly renewable European electricity network. New J. Phys. 2015, 17, 105002. [Google Scholar] [CrossRef]
- Raunbak, M.; Zeyer, T.; Zhu, K.; Greiner, M. Principal mismatch patterns across a simplified highly renewable European electricity network. Energies 2017, 10, 1934. [Google Scholar] [CrossRef]
- Asplund, G.; Jacobson, B.; Berggren, B.; Linden, K. Continental Overlay HVDC-Grid, Paris 2010. Available online: http://www.cigre.org (accessed on 22 August 2022).
- Jin, X.; Wen, Z.; Weidong, L.; Yan, L.; Xinshou, T.; Chao, L.; Linjun, W. Study on the driving force and challenges of developing power grid with high penetration of renewable energy. In Proceedings of the 2017 IEEE Transportation Electrification Conference and Expo, Asia-Pacific (ITEC Asia-Pacific), Harbin, China, 7–10 August 2017; pp. 1–5. [Google Scholar]
- Jafari, M.; Bompard, E.; Delmastro, C.; Botterud, A.; Grosso, D. Electrify Italy; Enel Foundation: Torino, Italy, 2020. [Google Scholar]
- Lei, X.; Huang, T.; Yang, Y.; Fang, Y.; Wang, P.A. A bi-layer multi-time coordination method for optimal generation and reserve schedule and dispatch of a grid-connected microgrid. IEEE Access 2019, 7, 44010–44020. [Google Scholar] [CrossRef]
- Zhao, Z.Q.; Dai, Y.M.; Song, X.F.; Sun, L.C.; Nie, H.Z. Research on the Economy of UHVDC Transmission under the Background of Global Energy Interconnect. In IOP Conference Series: Materials Science and Engineering; IOP Publishing: Bristol, UK, 2018; Volume 439, p. 052022. [Google Scholar]
- European Environment Agency (EEA). Air Quality in Europe—2020 Report; European Environment Agency (EEA): Copenhagen, Denmark, 23 November 2020; Available online: https://www.eea.europa.eu/publications/air-quality-in-europe-2020-report (accessed on 24 November 2020).
- European Environment Agency (EEA). National Emissions Reported to the UNFCCC and to the EU Greenhouse Gas Monitoring Mechanism; European Environment Agency (EEA): Copenhagen, Denmark, 31 May 2022; Available online: https://www.eea.europa.eu/data-and-maps/data/national-emissions-reported-to-the-unfccc-and-to-the-eu-greenhouse-gas-monitoring-mechanism-18 (accessed on 31 May 2022).
- European Environment Agency (EEA). National Emission Reductions Commitments (NEC) Directive Emission Inventory Data; European Environment Agency (EEA): Copenhagen, Denmark, 30 August 2022; Available online: https://www.eea.europa.eu/data-and-maps/data/national-emission-ceilings-nec-directive-inventory-19 (accessed on 30 August 2022).
- Bompard, E.; Huang, T.; Yang, L. Market equilibrium under incomplete and imperfect information in bilateral electricity markets. IEEE Trans. Power Syst. 2011, 26, 1231–1240. [Google Scholar] [CrossRef]
- Huang, T.; Bompard, E.; Yan, Z. Congestion management impacts on bilateral electricity markets under strategic negotiation. Electr. Power Syst. Res. 2011, 81, 1161–1170. [Google Scholar] [CrossRef]
Disclaimer/Publisher’s Note: The statements, opinions and data contained in all publications are solely those of the individual author(s) and contributor(s) and not of MDPI and/or the editor(s). MDPI and/or the editor(s) disclaim responsibility for any injury to people or property resulting from any ideas, methods, instructions or products referred to in the content. |
© 2023 by the authors. Licensee MDPI, Basel, Switzerland. This article is an open access article distributed under the terms and conditions of the Creative Commons Attribution (CC BY) license (https://creativecommons.org/licenses/by/4.0/).