Article

Design and Implementation of a Low-Voltage Photovoltaic System Integrated with Battery Energy Storage

1
Division of Electronic and Informatics, Gunma University, Kiryu 376-8515, Japan
2
School of Electrical Engineering and Automation, Changshu Institute of Technology, Suzhou 215506, China
3
Department of Electronic Engineering, Yangzhou University, Yangzhou 225127, China
*
Author to whom correspondence should be addressed.
Energies 2023, 16(7), 3057; https://doi.org/10.3390/en16073057
Submission received: 19 February 2023 / Revised: 23 March 2023 / Accepted: 24 March 2023 / Published: 27 March 2023

Abstract

:
In this paper, the simulation and design of a power converter suitable for a low-voltage photovoltaic (PV) battery energy storage converter was investigated. The converter was suitable for sources and loads with near voltage levels and were aimed at efficiency improvement. The converter was called a series partial power converter (SPPC). A continuous current and a boost SPPC topology based on an isolated Cûk converter was constructed. The operation modes of the converter were analyzed. The efficiency verification test of the SPPC in a laboratory environment was completed using an outdoor start-up test, a photovoltaic full cover test and a steady-state operation test under different power levels. The results show that the SPPC can achieve 95–98% converter efficiency within the 87 W–242 W power range. The incremental conductance method based on the SPPC can realize the dynamic MPPT under constant illumination and changing meteorological conditions.

1. Introduction

Solar energy is a new energy with great potential for development and utilization, but its output power has great fluctuation and intermittence. The PV storage system can overcome the shortcomings of the PV volatility and intermittence, and it can achieve peak cutting and valley filling and improve the utilization rate of PV power generation [1,2,3,4,5].
At present, improving PV power electronic converter efficiency is the main research direction of PV storage systems [6,7]. The purpose of this study is to explore the realization of a high-efficiency low-voltage optical storage system by using the SPPC and further promote the popularization of PV storage systems. Now, the research on PV storage systems mainly focuses on circuit topology, system transmission efficiency optimization and modular operation modes. In recent years, many scholars and research institutions have proposed a series of circuit topologies for integrated energy modules and energy storage devices. This kind of circuit topology mostly adopts a digital signal controller as the core control mode.
Al-Soeidat et al. [8] proposed a reconfigurable three-port DC-DC converter with an integrated photovoltaic module system in 2020. The converter topology is shown in Figure 1.
The converter was a non-isolated three-port DC-DC converter that superimposed the battery energy storage with photovoltaic modules for off-grid solar power generation. The converter integrated the photovoltaic modules with backup batteries to reduce the impact of the intermittent and unpredictable load demands from renewable energy sources.
In 2019, Lakshmi et al. [9] proposed a bidirectional converter, whose topology is shown in Figure 2.
The topology consisted of two diodes and two MOSFET switches. The main advantage of this topology was that the soft switching technology could be implemented without the need for any additional control loops, thus reducing the switching losses and reducing costs.
From the analysis of the literature [8,9,10,11,12], it can be seen that the efficient utilization of renewable energy and the multi-mode power transmission between the power supply and energy storage can be realized through novel converter topology and energy storage integration. The PV storage system should not only be evaluated comprehensively from the aspects of reliability, volume and weight, but also the efficiency of the power transmission and the difficulty of the engineering implementation. In order to improve the efficiency of the PV storage system, this paper will explore a single-stage power conversion on the basis of the original to further improve the transmission efficiency of the system.

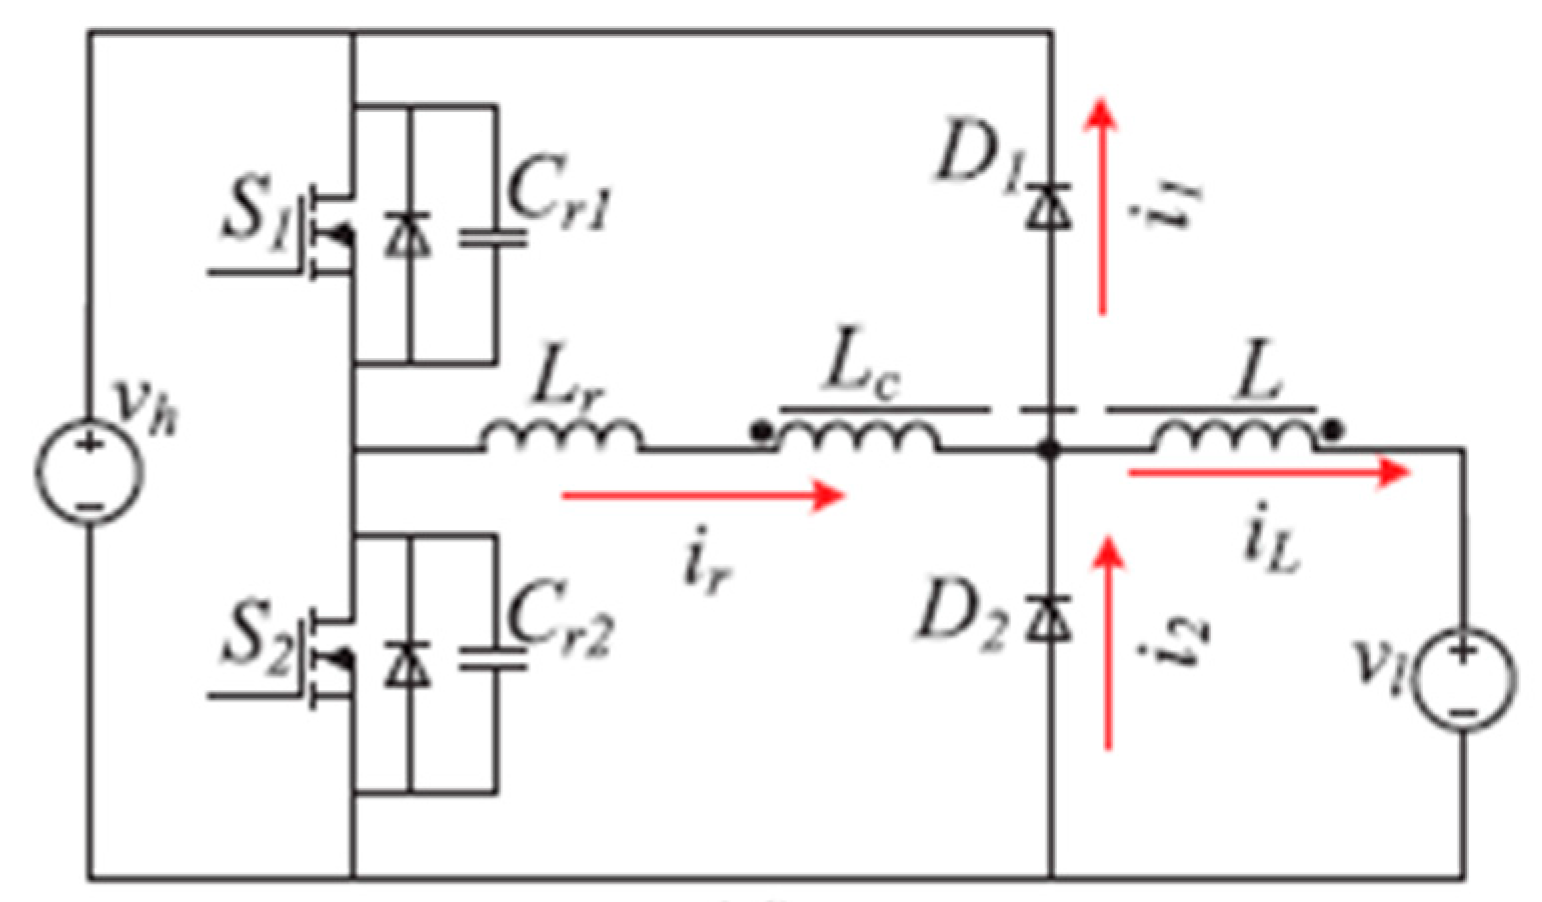
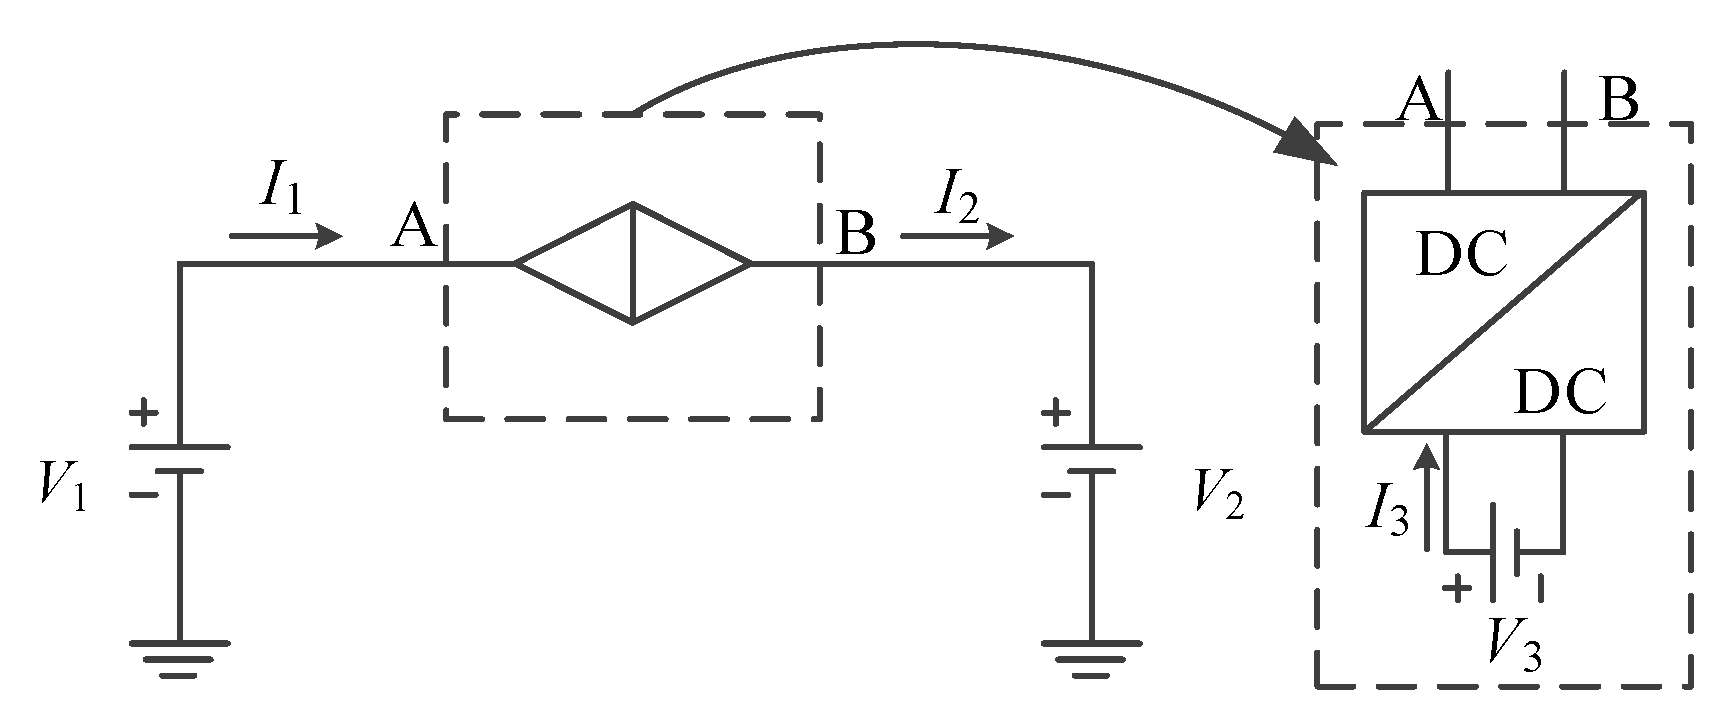
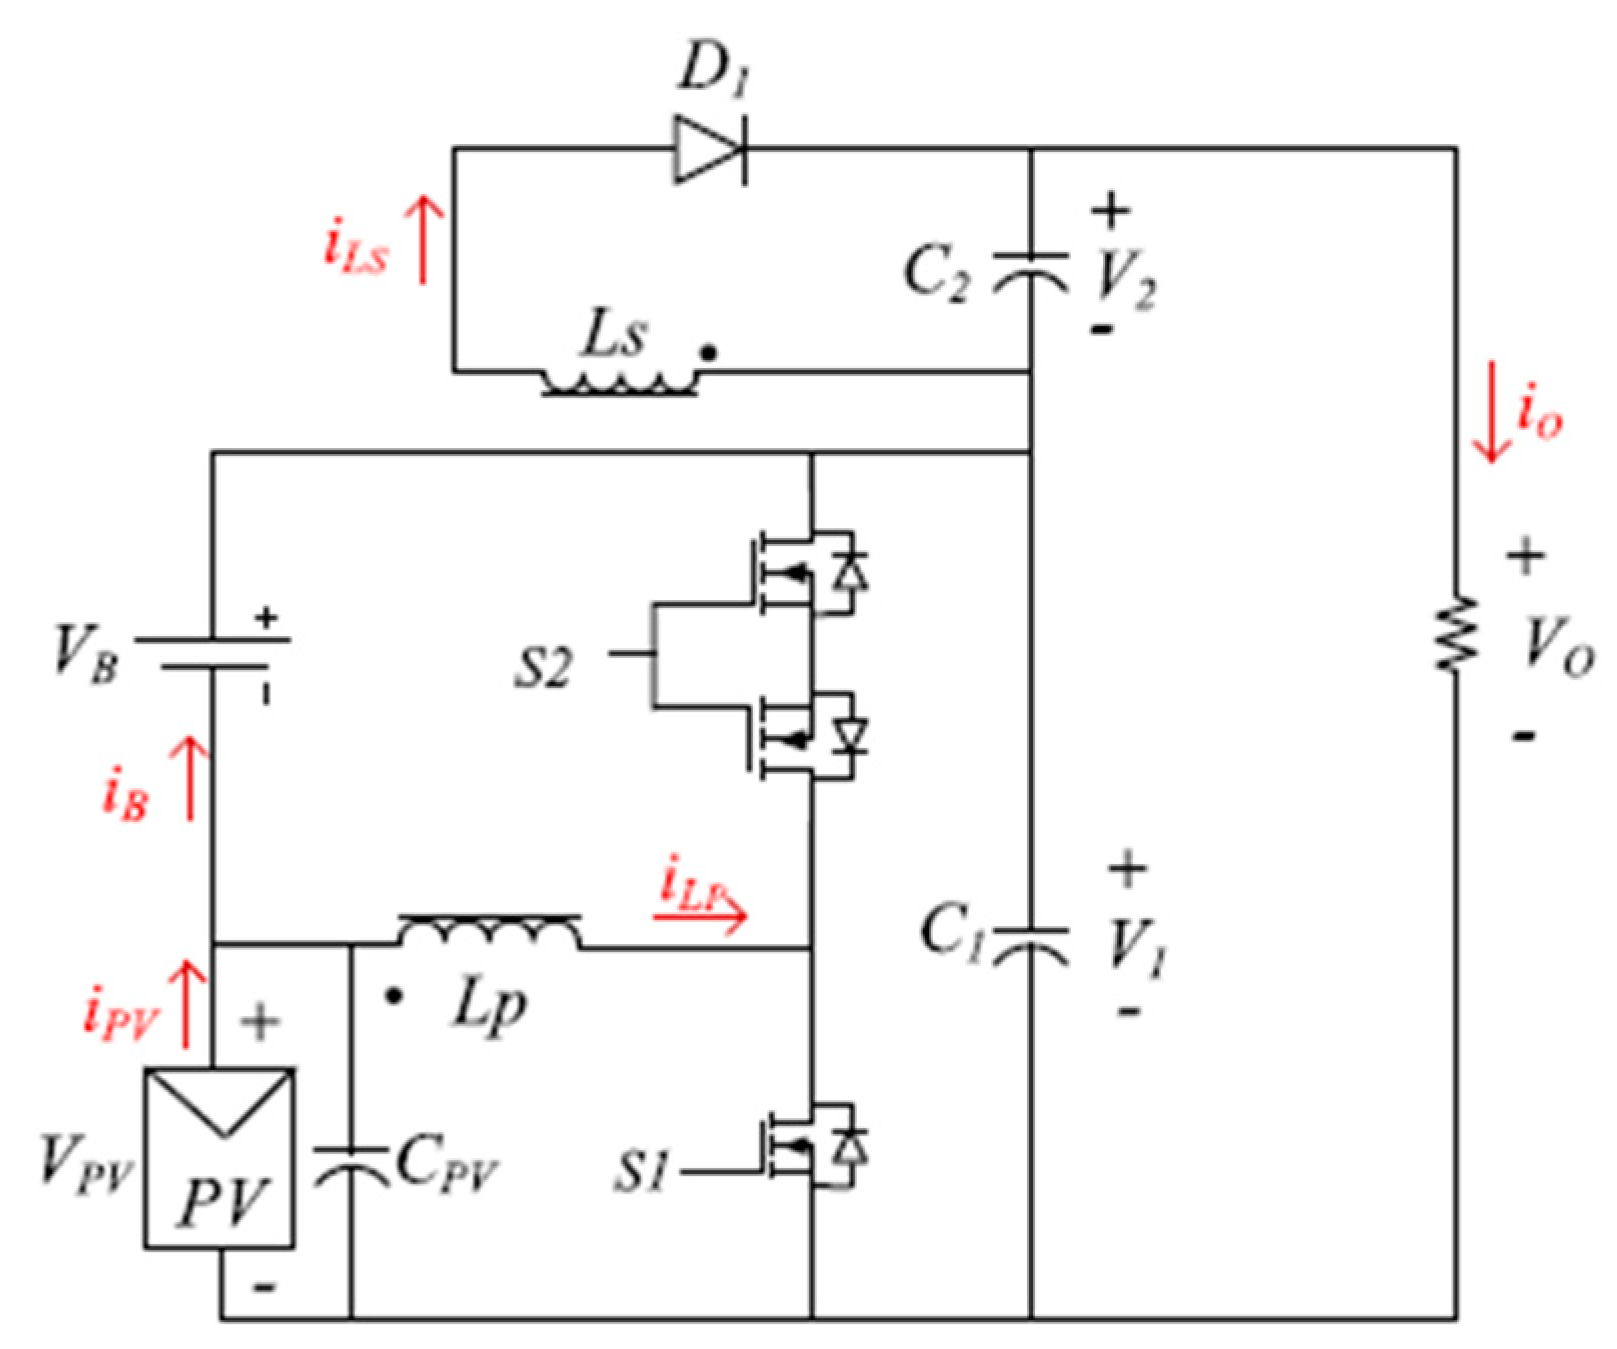
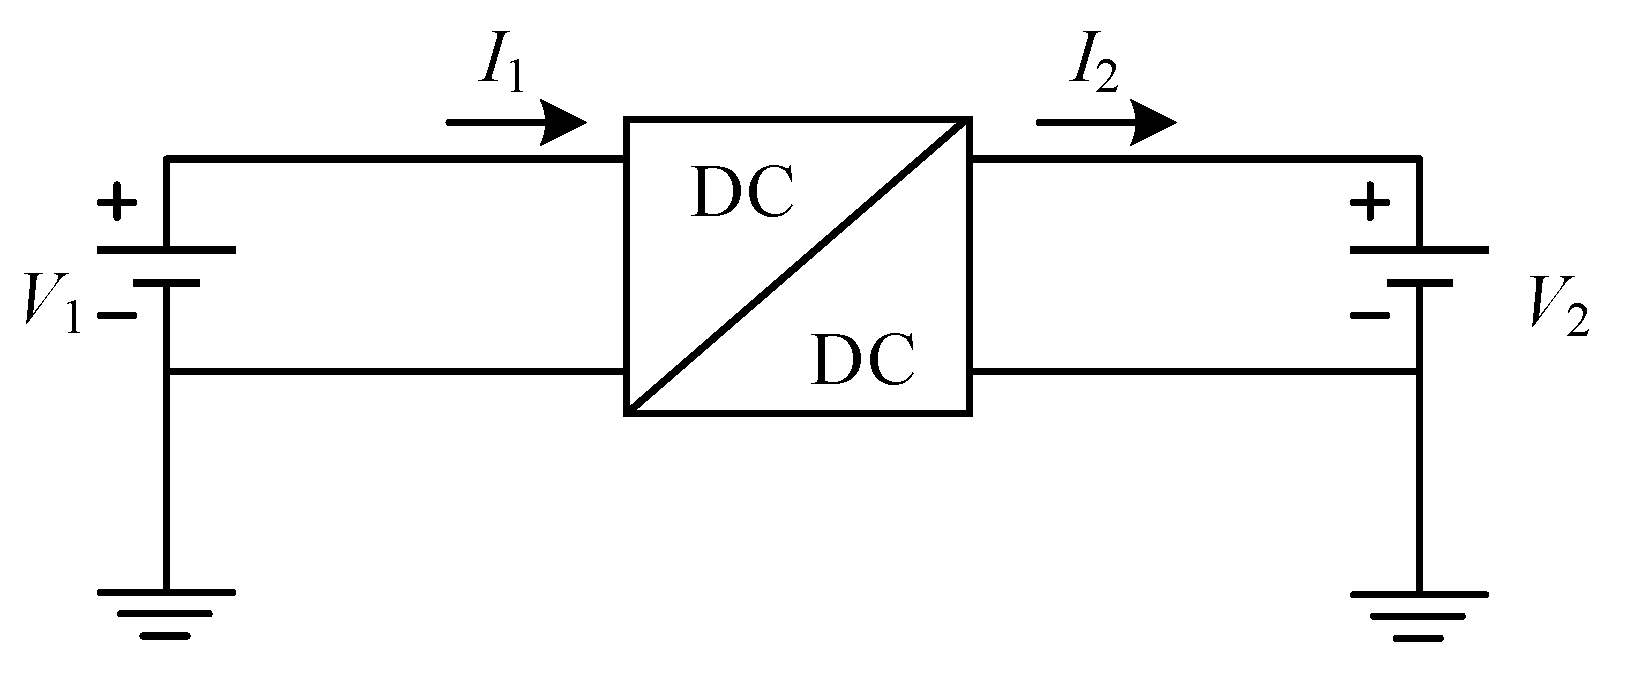
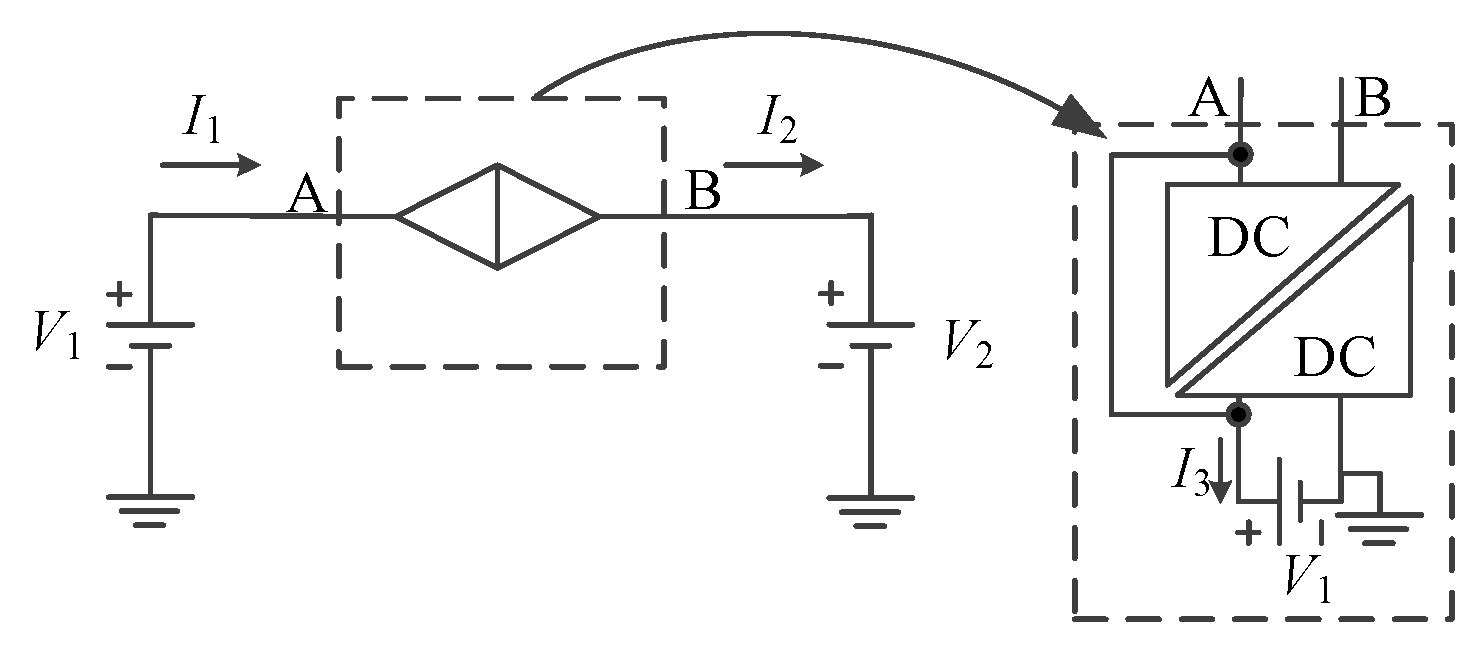
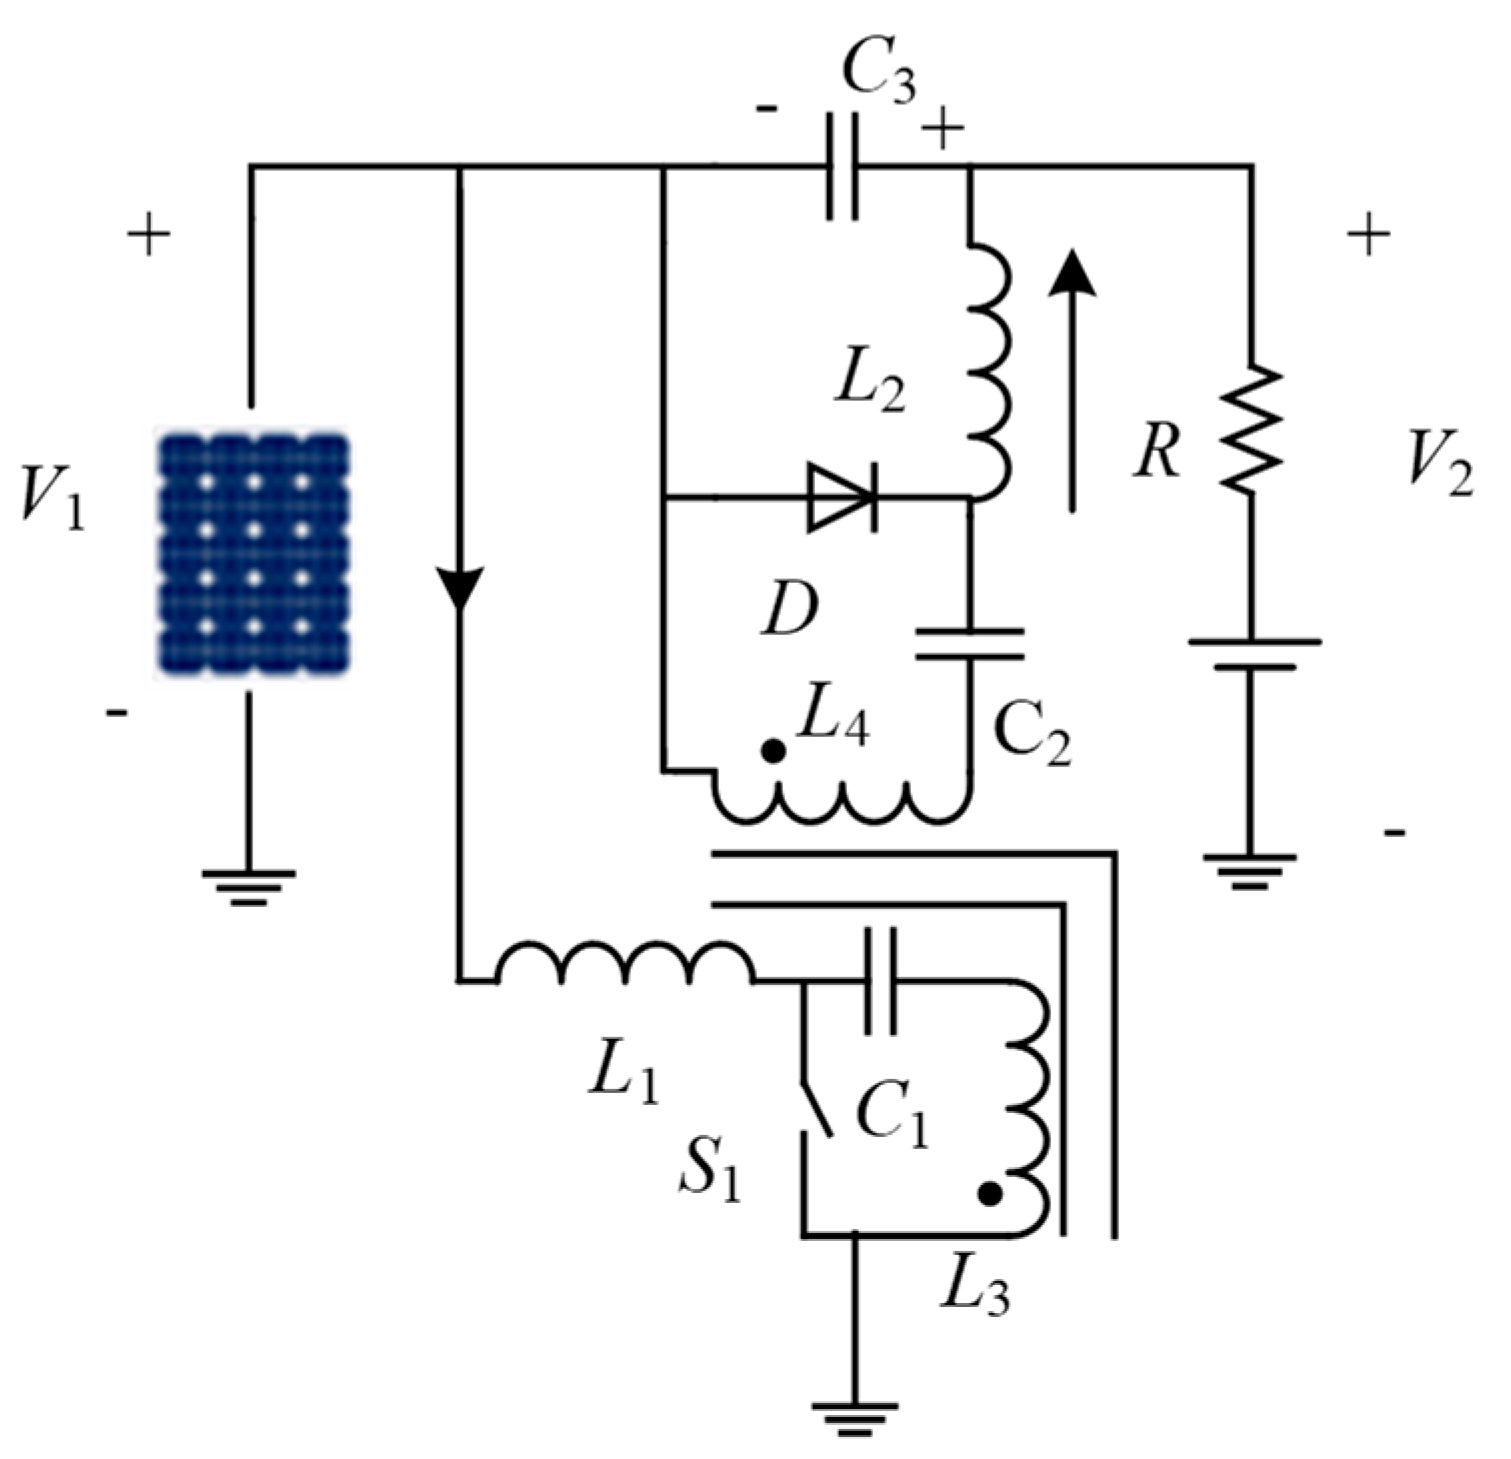
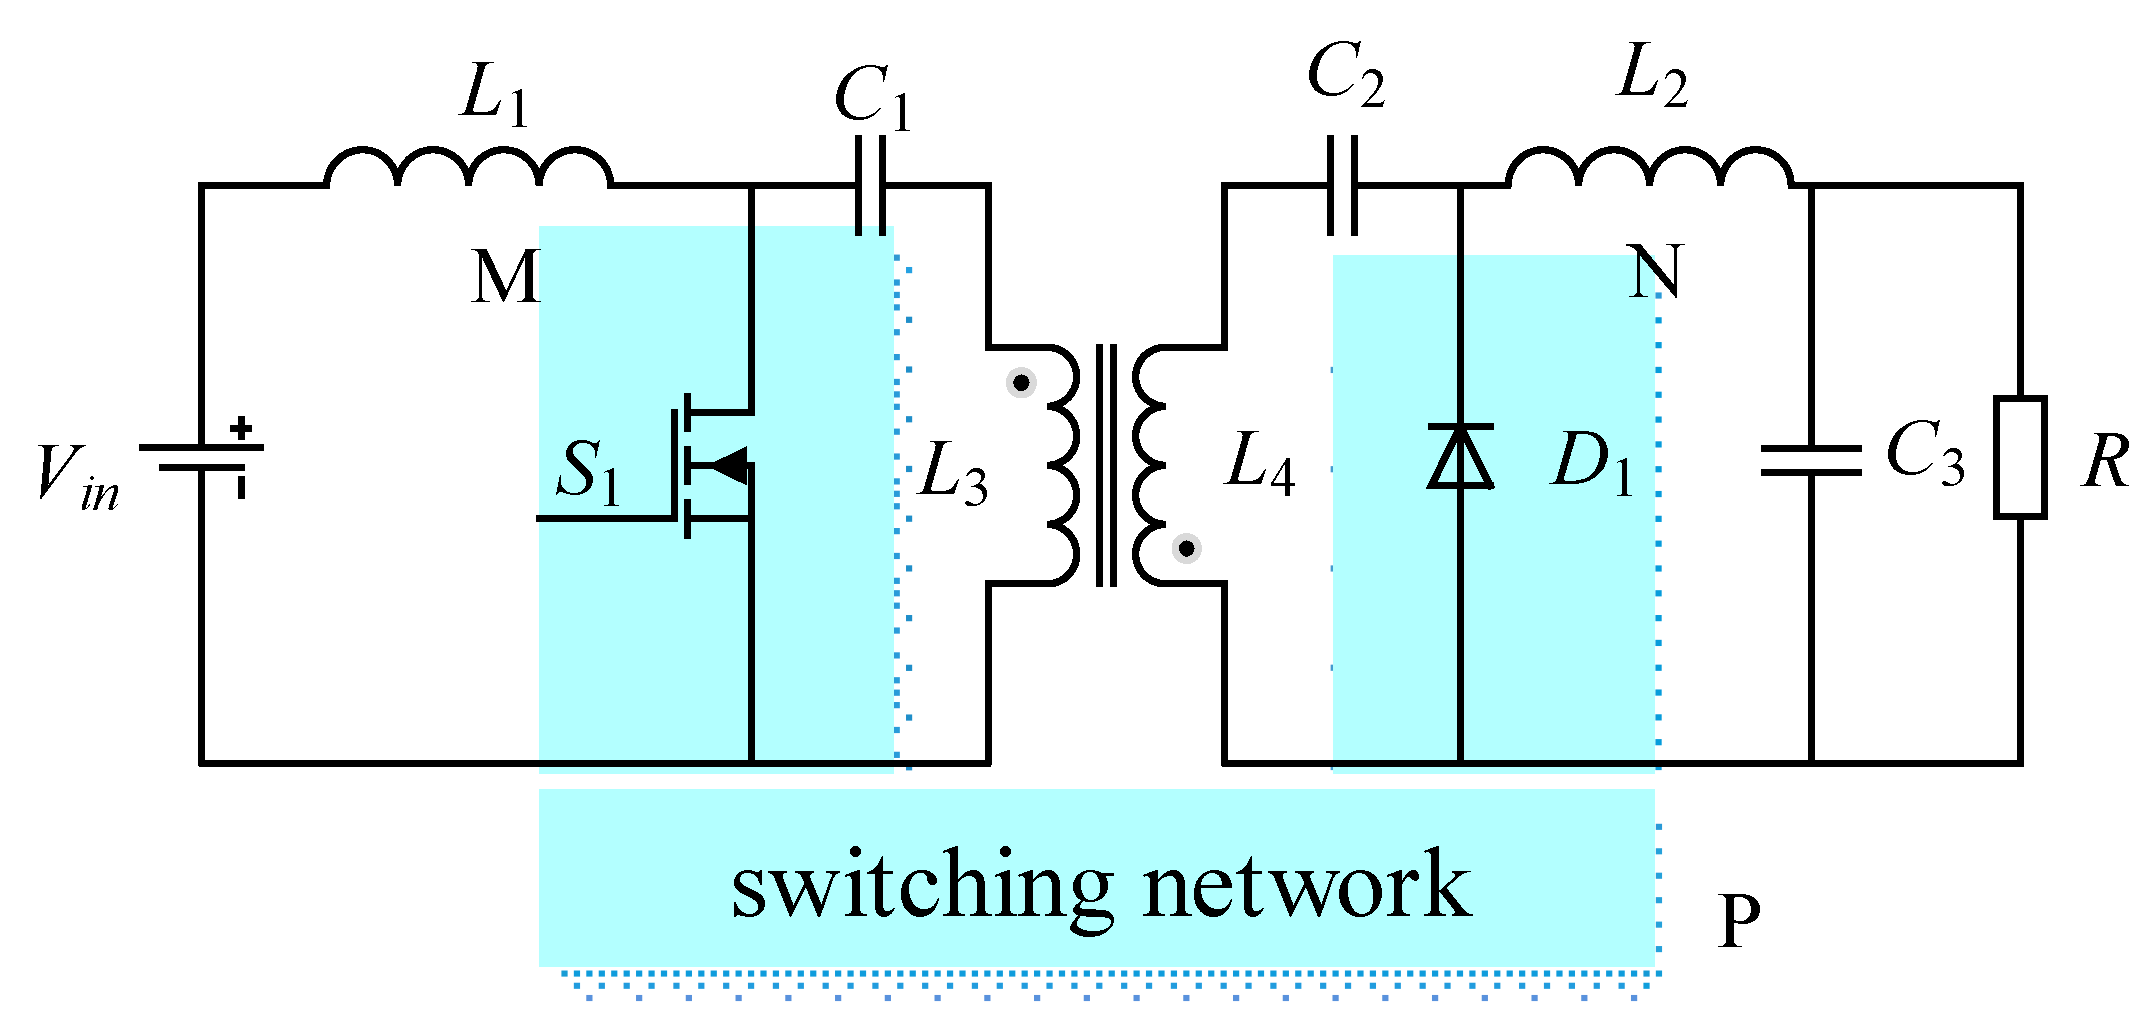
2. Series Partial Power Converter
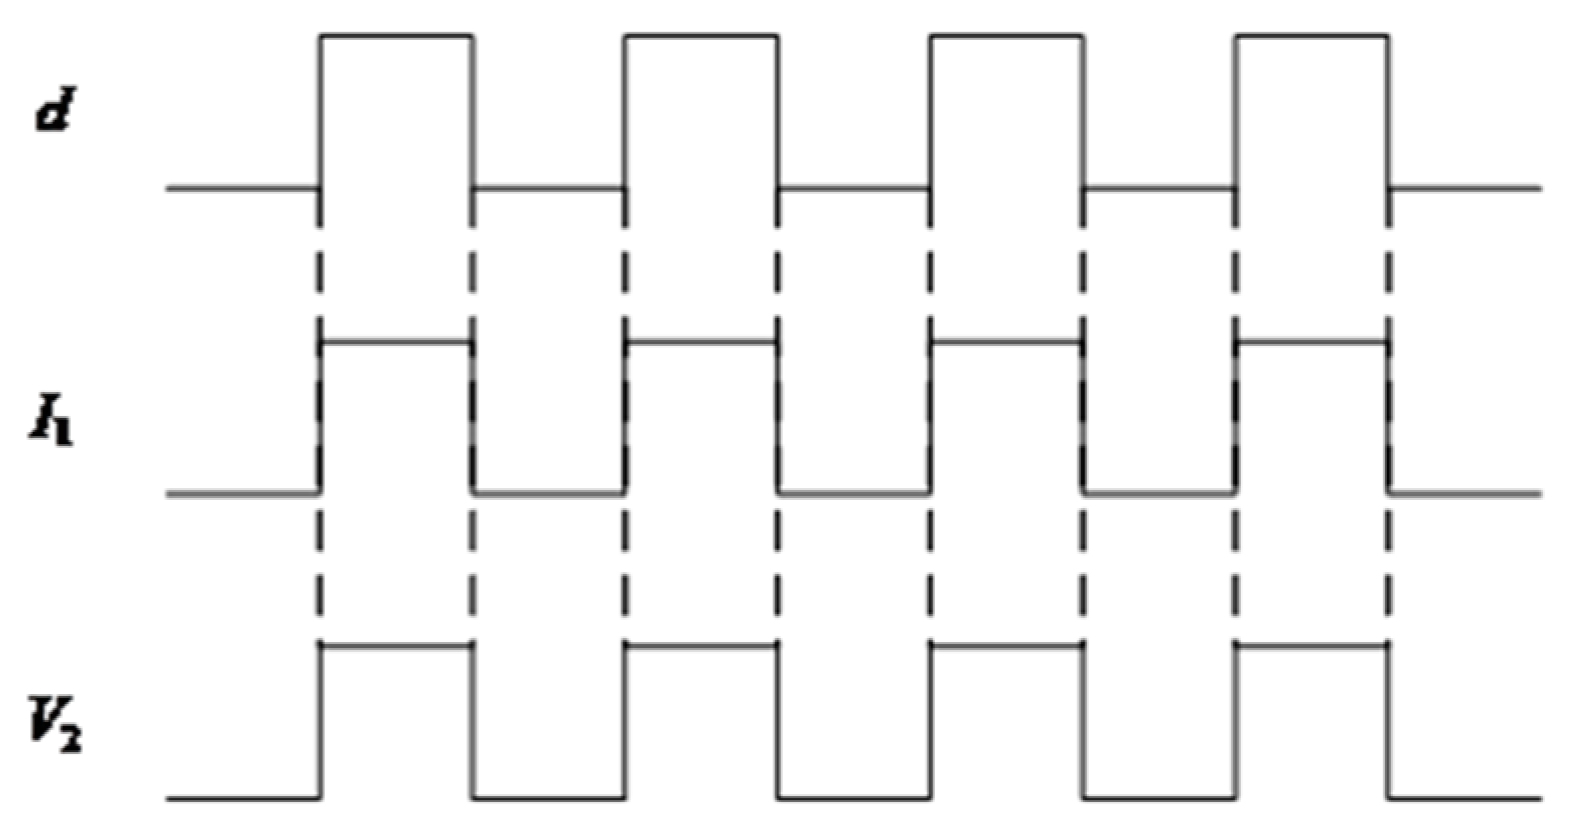
Generally, cascaded (full power) power conversion is adopted in power electronic converters [13]. Common bidirectional cascade converters include bidirectional half-bridge DC-DC converters, bidirectional buck-boost converters, bidirectional Cûk converters, bidirectional SEPIC converter etc., as shown in Figure 3. When these type of converters are used as the PV storage converter and the power transmission, they needs to bear all the converted power. It is assumed that the bidirectional power transmission efficiency of the cascade converter theory is η. The theoretical transmission loss of the converter shown in Figure 1 is shown in Equation (1).
  P 1 l o s s = V 1 V 2 ( 1 η )
  • V1: input voltage
  • I1: input current
  • η: theoretical transfer efficiency
When a non-isolated converter is used as a partial power converter, as shown in Figure 4, the converter is equivalent to a controlled current source in the series between two DC sources. When the partial power converter is in operation, the bidirectional energy flow is realized by controlling the current size and direction of the controlled current source. When the controlled current source schedules the power of the two DC sources, the controlled current source topology is equivalent to the full-bridge topology. The two current sources appear as two power voltage sources with the same reference point and the same voltage level, respectively, connected to the positive and negative ends of the full-bridge circuit output. The high-frequency electronic switch, input source and LC filter that connect the two power voltage sources in the series are equivalent to the controlled current source. When V1 is slightly less than V2, as shown in Figure 1 and Figure 4 in the converter cascade power transmission direction, the transmission loss for the converter theory is shown in Equation (2).
  P 2 l o s s = | V 1 V 2 | I 2 ( 1 η ) η
  • V1: input voltage
  • V2: output voltage
  • I1: input current
  • η: transfer efficiency
Equation (3) is obtained from Equations (1) and (2).
  P 1 l o s s P 2 l o s s = V 1 I 1 ( 1 η ) | V 2 V 1 | I 2 ( 1 η ) η = V 1 I 1 η | V 2 V 1 | I 2 = V 2 I 2 | V 2 V 1 | I 2 > 1
If the output inductance current of the above two converters remains the same, when the voltage level is similar, the topology shown in Figure 4 can mobilize the full power transmission through a smaller design capacity and theoretically has a smaller power transmission loss. The converter of this topology is called the serial partial power converter [14,15]. The input voltage source of the series partial power converter provides the voltage level to maintain the normal operation of the converter. Due to the small difference in the voltage levels at the output terminal, this topology can be used for the full power conversion, which can improve the transmission efficiency of the system.
In the series partial power transmission system, there is a voltage difference between the two ends of the controlled current source ΔV, so the power state depends on the polarity of ΔV and the direction of the current. The controlled current source has two states: the absorbed power and the emitted power. Table 1 lists the power of the controlled current source, where ΔV is the difference between V1 and V2. Assume that V1 and V2 do not have the same voltage.
The input voltage source V3 of the converter, as shown in Figure 4, are replaced with one of the voltage sources V1. The transformer in the converter provides a suspended DC energy buffer, and no additional voltage source is required to provide the voltage level for a normal operation of the power supply circuit. Its structure is equivalent to that shown in Figure 5. The output current I1 of the power voltage source V1 is composed of two parts: the serial transmission current I2 and the cascade power buffer current I3. The converter based on this topology can realize the efficient transmission of the off-grid photovoltaic energy storage.
Considering the stable tracking of the photovoltaic maximum power point and the current quality of the battery charging, the input and output current of the converter is required to be continuous during the experiment. After studying the properties and functions of many converters, it was found that the Cûk converter was suitable for the basic topology of this research due to its current continuity. Moreover, since the transformer in the converter provides a suspended DC energy buffer to realize the function of V3 in Figure 4, it is necessary to use an isolated converter to realize it. In this topic, the SPPC topology based on the isolated Cûk infrastructure is shown in the Figure 6.

3. Modeling and Simulation Analysis of Converter

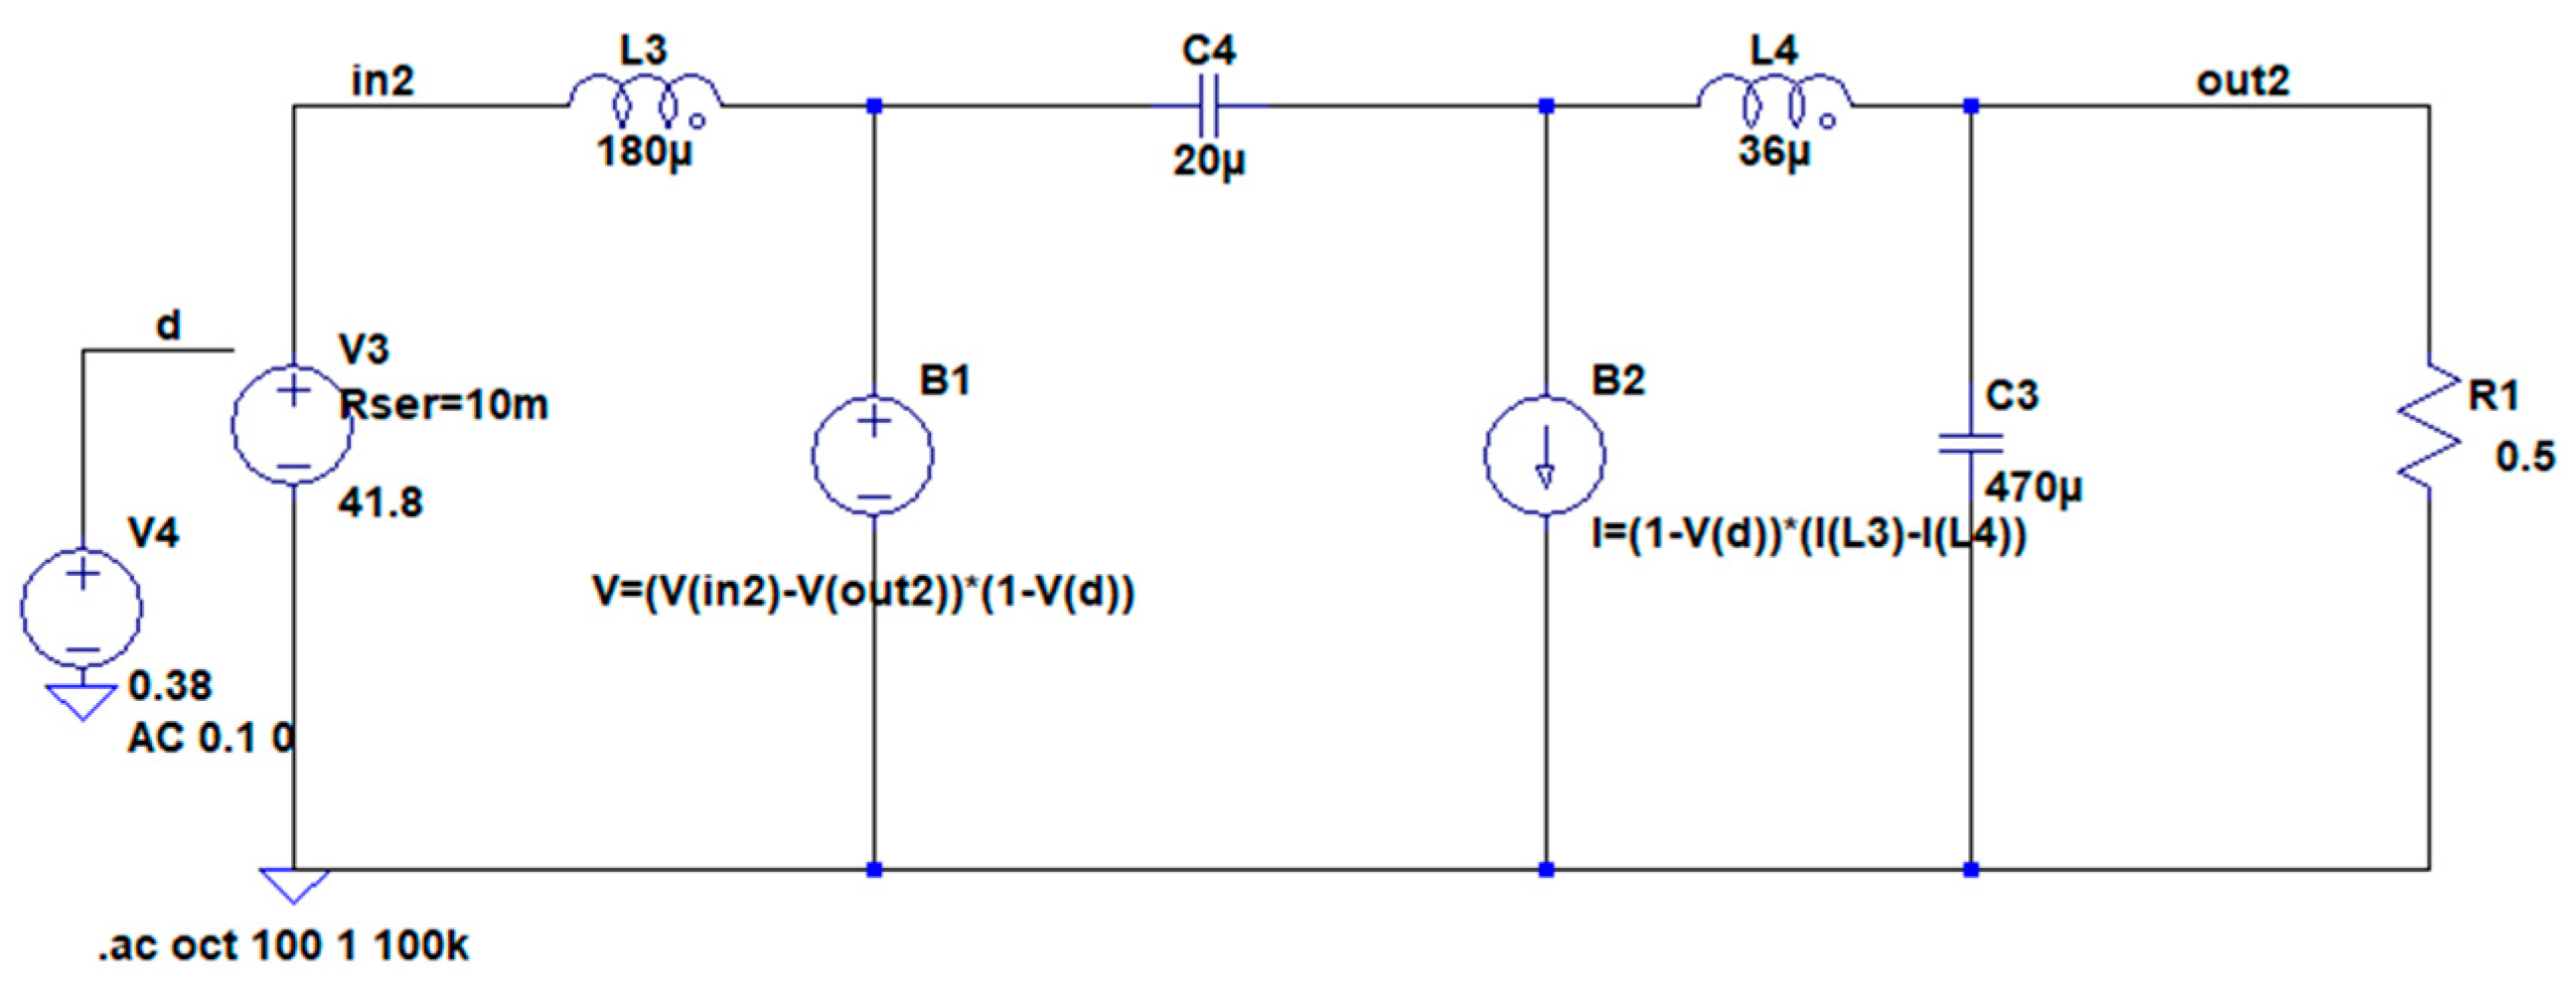
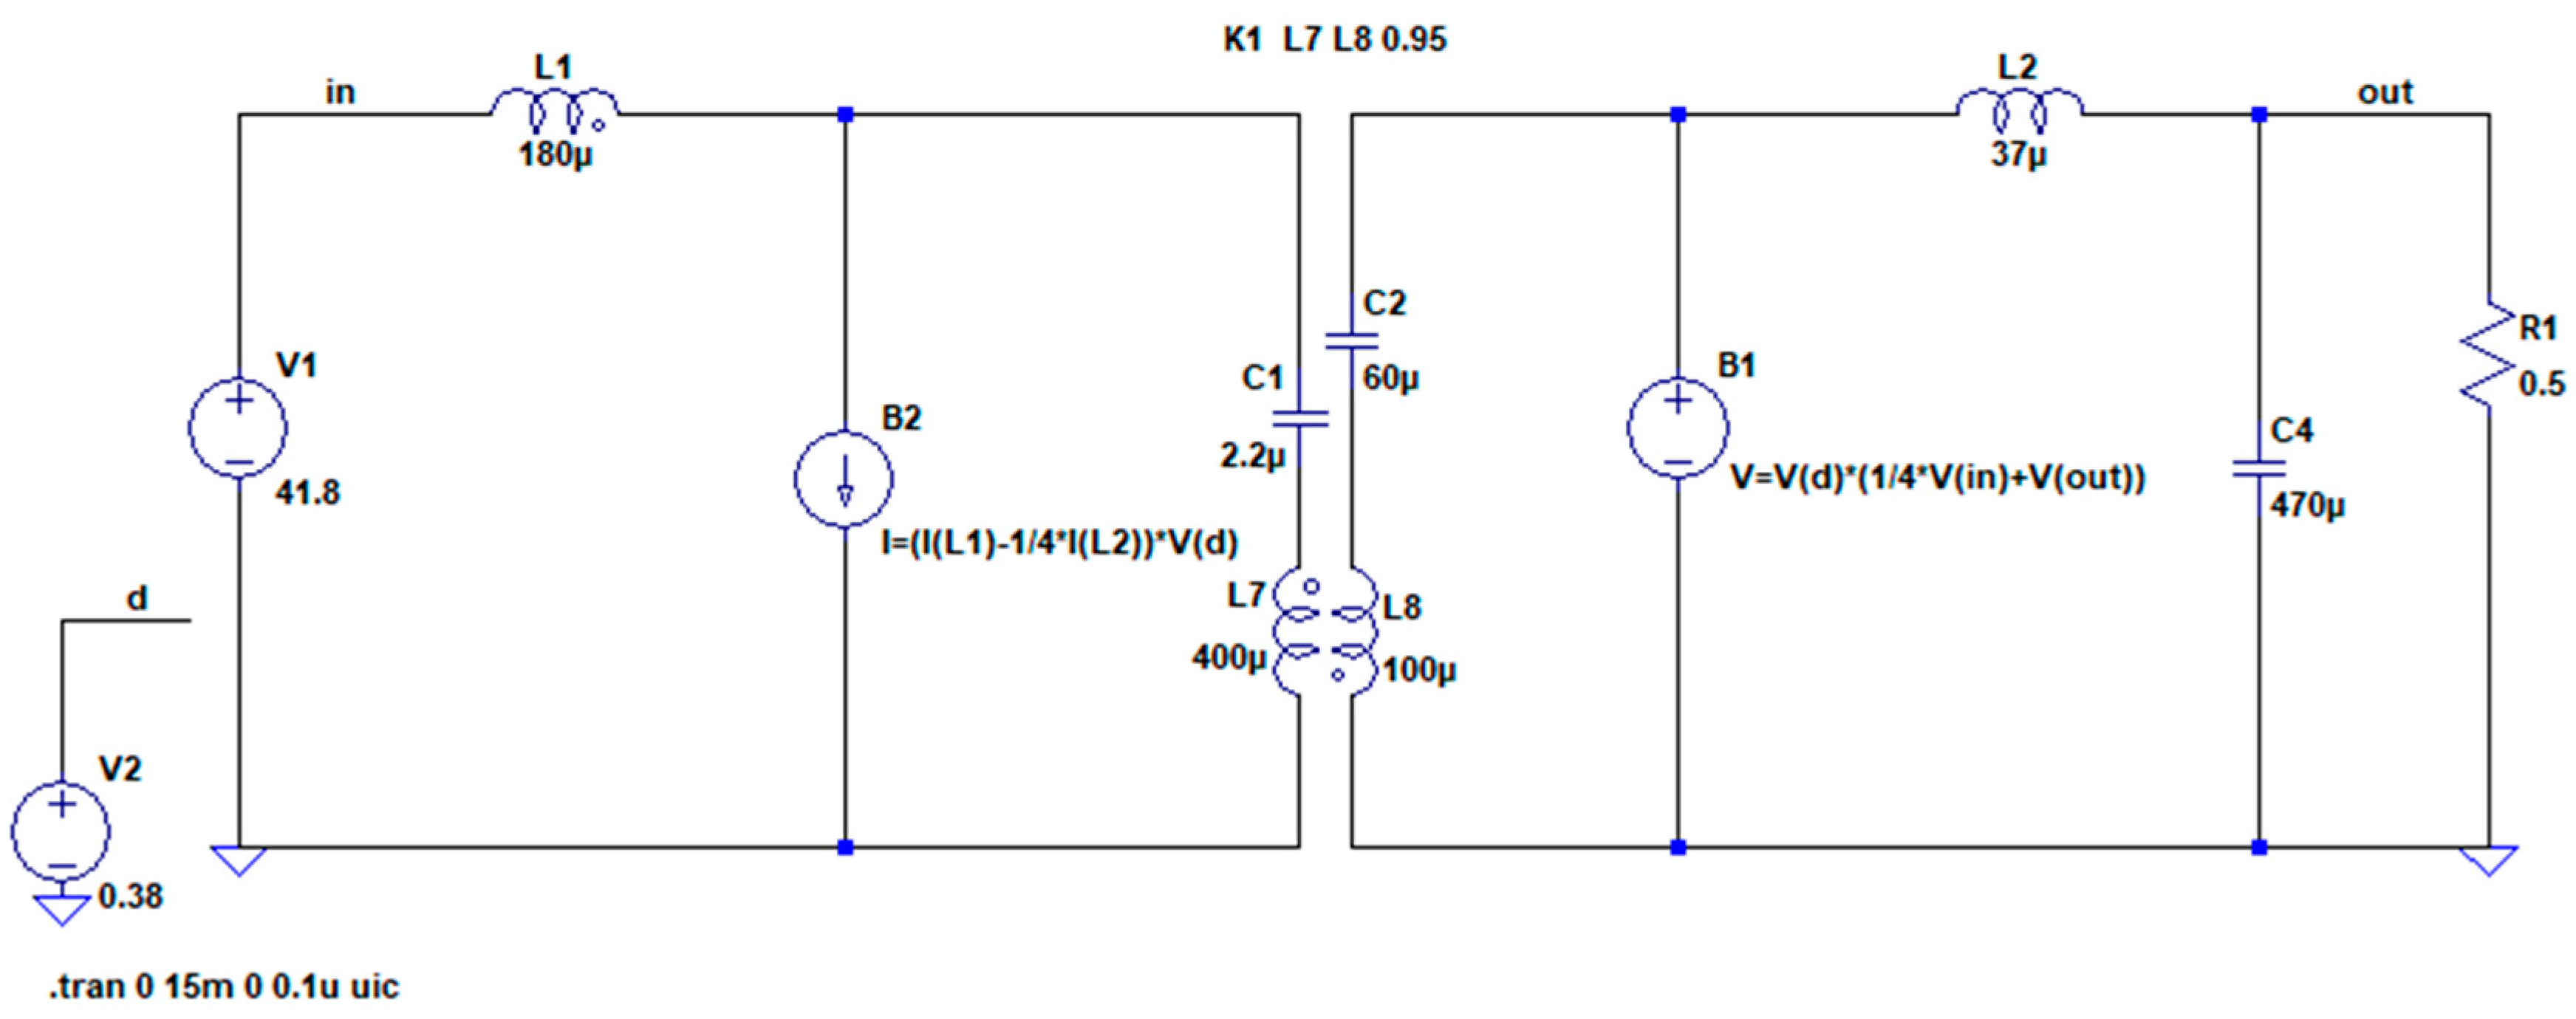
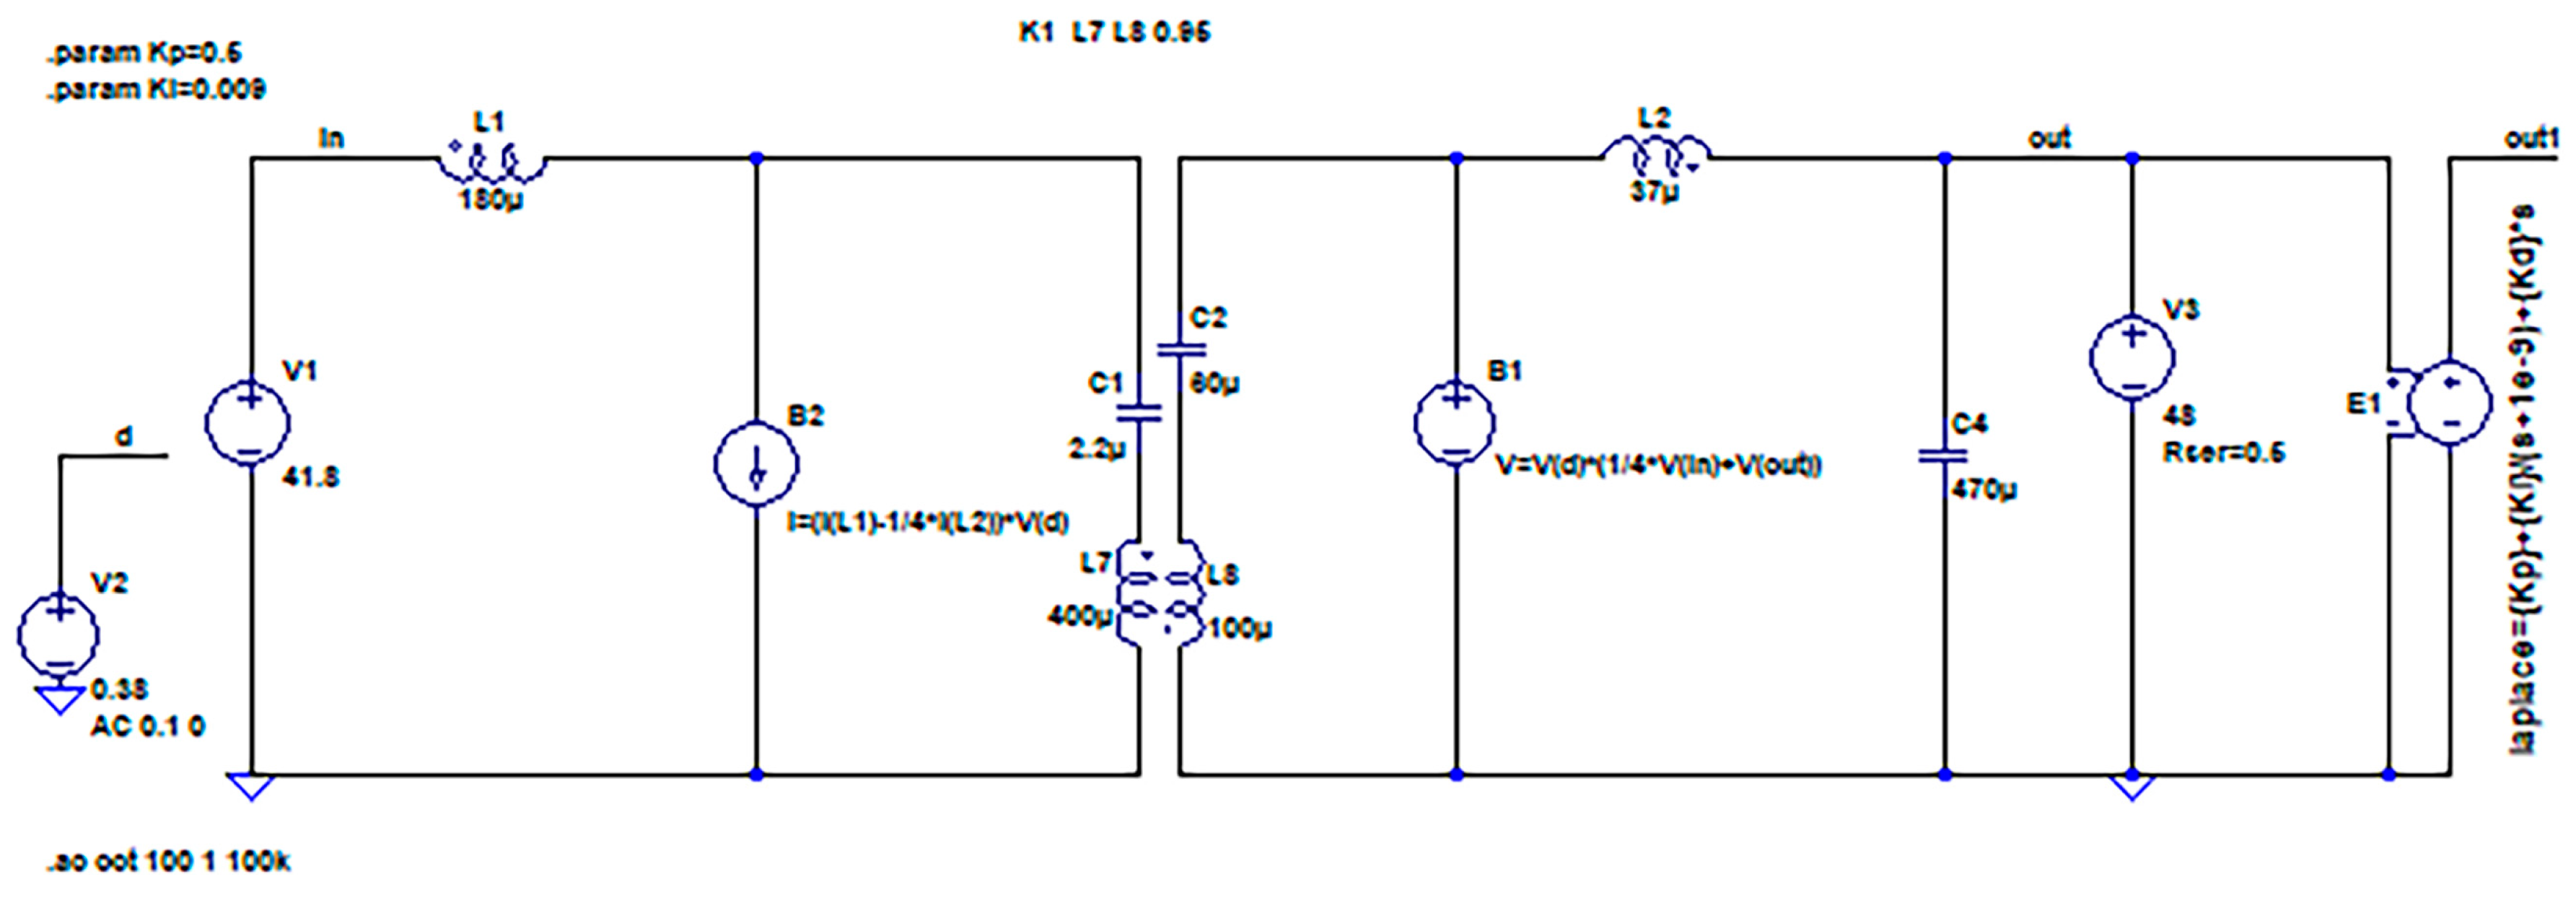
3.1. Switch Averaging Modeling

The equivalent source method was used to model the isolated Cûk converter, and the steady-state characteristic model was obtained. The converter was divided into the linear time-invariant network and the switching network, as shown in Figure 7. The shaded part is the switching network part.
The switching state of the PWM was set to variable d. When the switch tube S1 was on, d = 1, the input voltage Vin supplied power to the load. At this point, when the secondary tube D1 was cut off, the equivalent voltage at both ends of the secondary tube V2 = VL4 + VC2 was obtained. The equivalent current through the switch tube was S1 I1 = IL1 + IC1. When the switch tube S1 was disconnected, d = 0, the inductance current was in a continuous state the secondary tube D1 was on and it played the role of the continuous flow. When the equivalent current through the switch tube S1 was I1 = 0, the equivalent voltage at both ends of the secondary tube was V2 = 0. Thus, the relationship between the duty cycle D with I1 and V2 is shown in Figure 8.
Using the equivalent source method and assuming that the transformer turns ratio was n, the end voltage V2 of the diode in the circuit and the current I1 flowing through the switch tube were represented by the switch function d (d = 1 or 0) and the related inductance current and capacitance voltage. According to the energy conservation of the primary and secondary sides of the transformer, Equation (4) was obtained.
I C 1 V L 3 = I C 2 V L 4
The voltage relationship between the primary and secondary sides of the transformer is shown in Equation (5).
V L 3 = n V L 4
Equation (6) was obtained from Equation (5).
I C 1 = - 1 n I C 2
The voltage and the current relationship between the primary and secondary sides of the switching device is shown in Equations (7) and (8).
I 1 = d ( I L 1 + I C 1 ) = d ( I L 1 1 n I C 2 ) = d ( I L 1 1 n I L 2 )
V 2 = d ( V C 2 + V L 4 ) = d ( V C 2 1 n V L 3 ) = d ( V C 2 + 1 n V C 1 )
Since,
V in V L 3 V C 1 = 0
V out V L 4 V C 2 = 0
Equation (11) was obtained as the following.
V 2 = d ( 1 n V in + V out )
According to many simulations, the transformer’s turn ratio was 2:1, and the parameter selection of each device is shown in the Table 2. Therefore, the equivalent diagram of the switching cycle average method was obtained, as shown in Figure 9.
The switching tube in the isolated Cûk converter was equivalent to the controlled current source, and the diode was equivalent to the controlled voltage source.

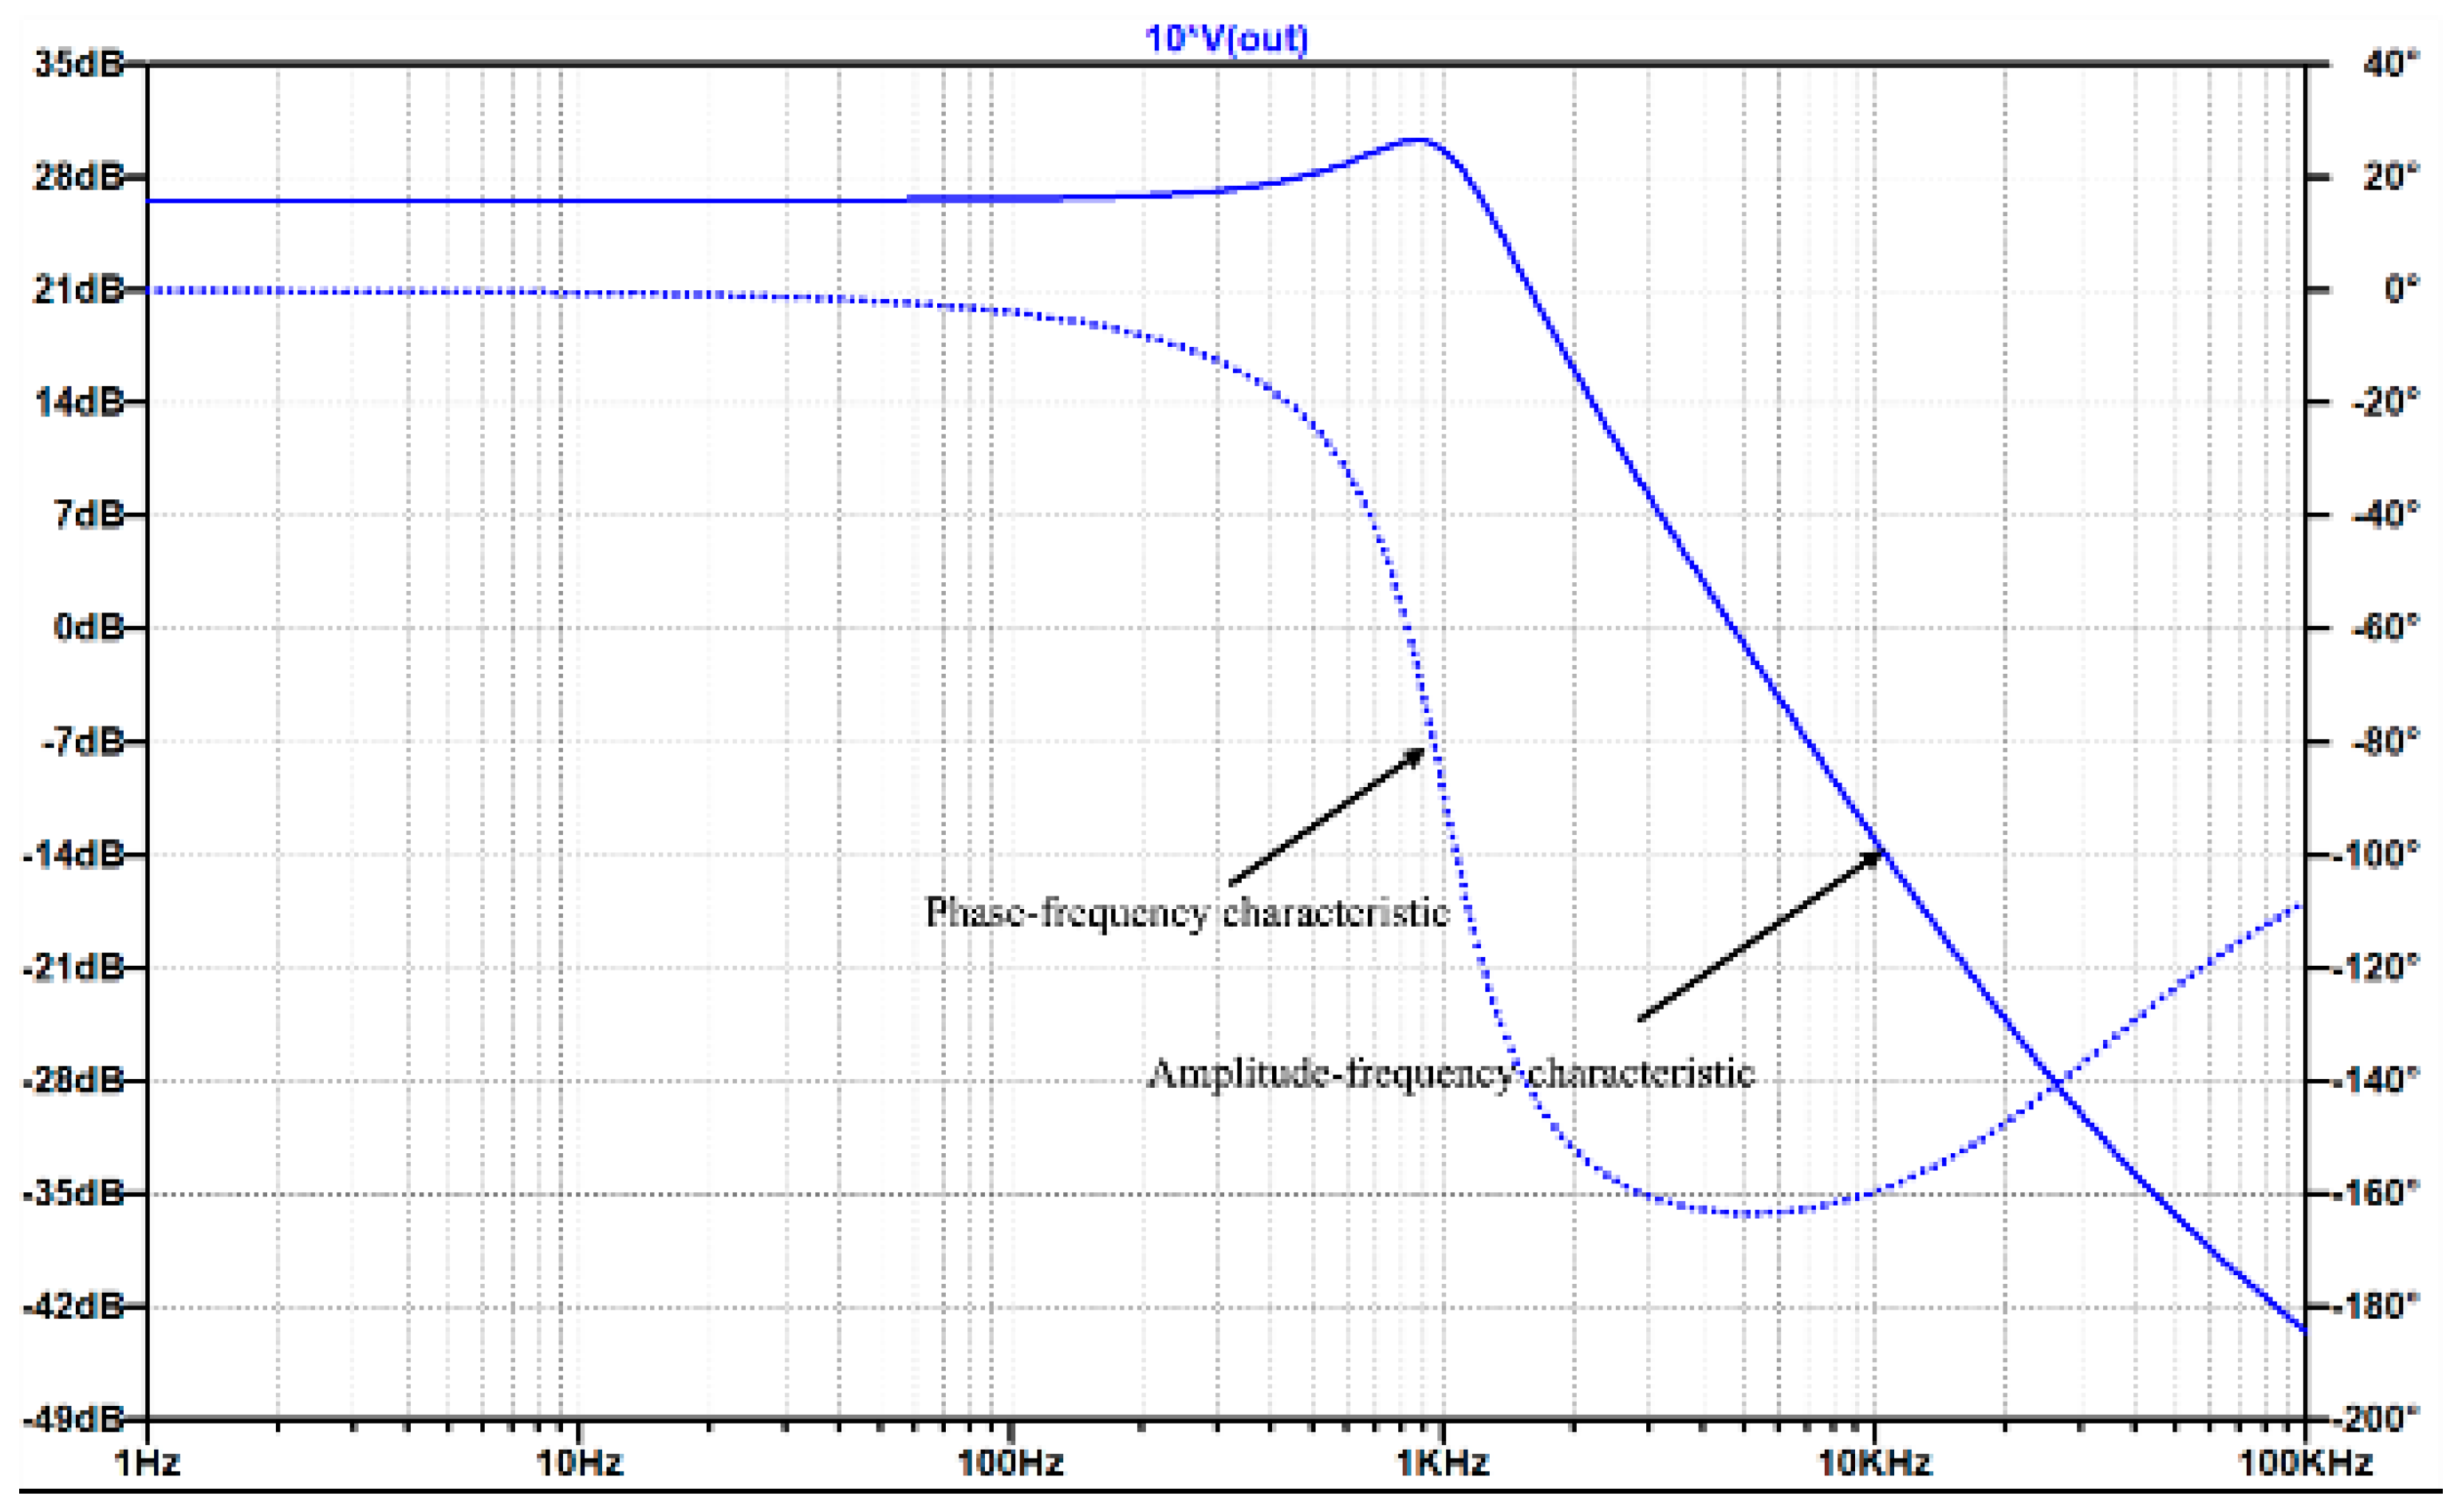
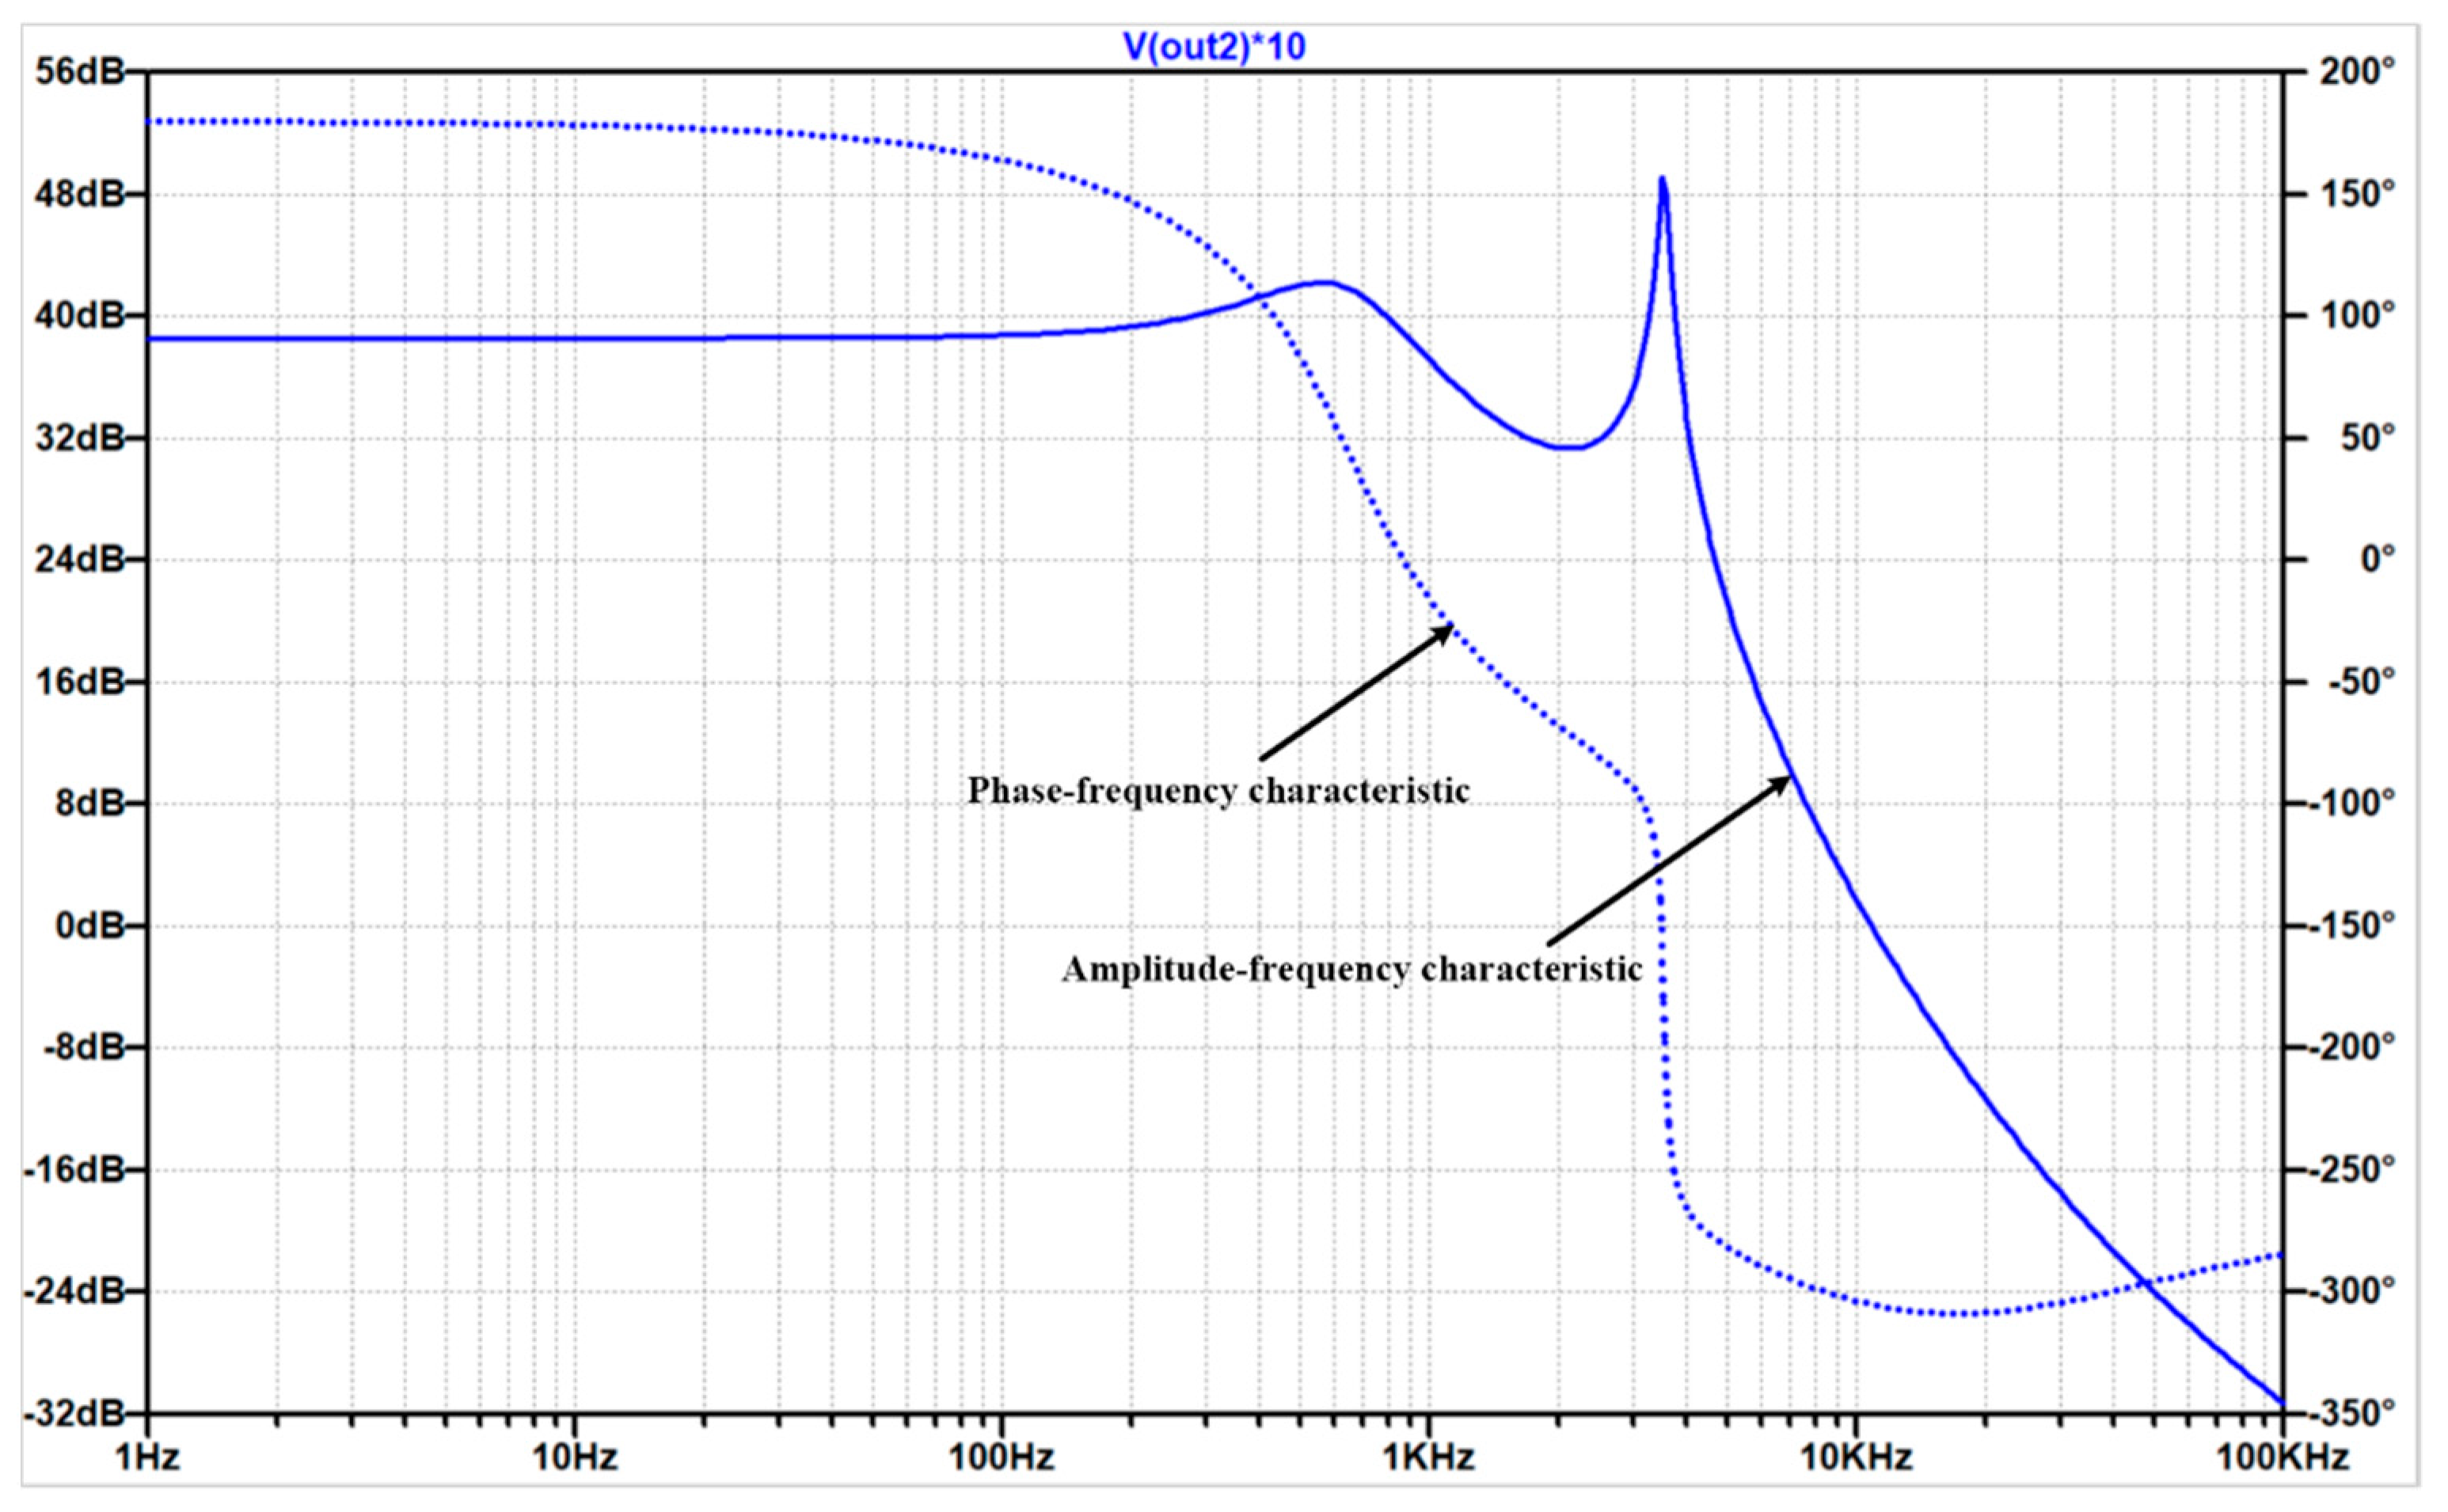
3.2. Simulation Based Numerical Frequency Domain Model Analysis

The non-isolated Cûk circuit was a four-order system, while the isolated Cûk topology had a higher order. If the transformer coupling coefficient is not 1, the system is more complex. Therefore, numerical modeling was used to design the system in this study. Firstly, the average modeling of the Cûk switching network was carried out in Section A. Then the frequency domain sweeping of the target transfer function was carried out using LTspice, and finally the loop compensation was carried out by the controller.

3.2.1. AC Sweep at Output of Cûk Circuit

Figure 10 shows the AC sweeping circuit of the Cûk circuit. Due to the amplitude limitation of the duty cycle disturbance, only 0.1 was used for the sweeping replication, so the output target variable of the sweep frequency was expanded by 10 times, as below. Figure 11 shows the frequency domain sweeping results of the output voltage using the duty cycle ratio.

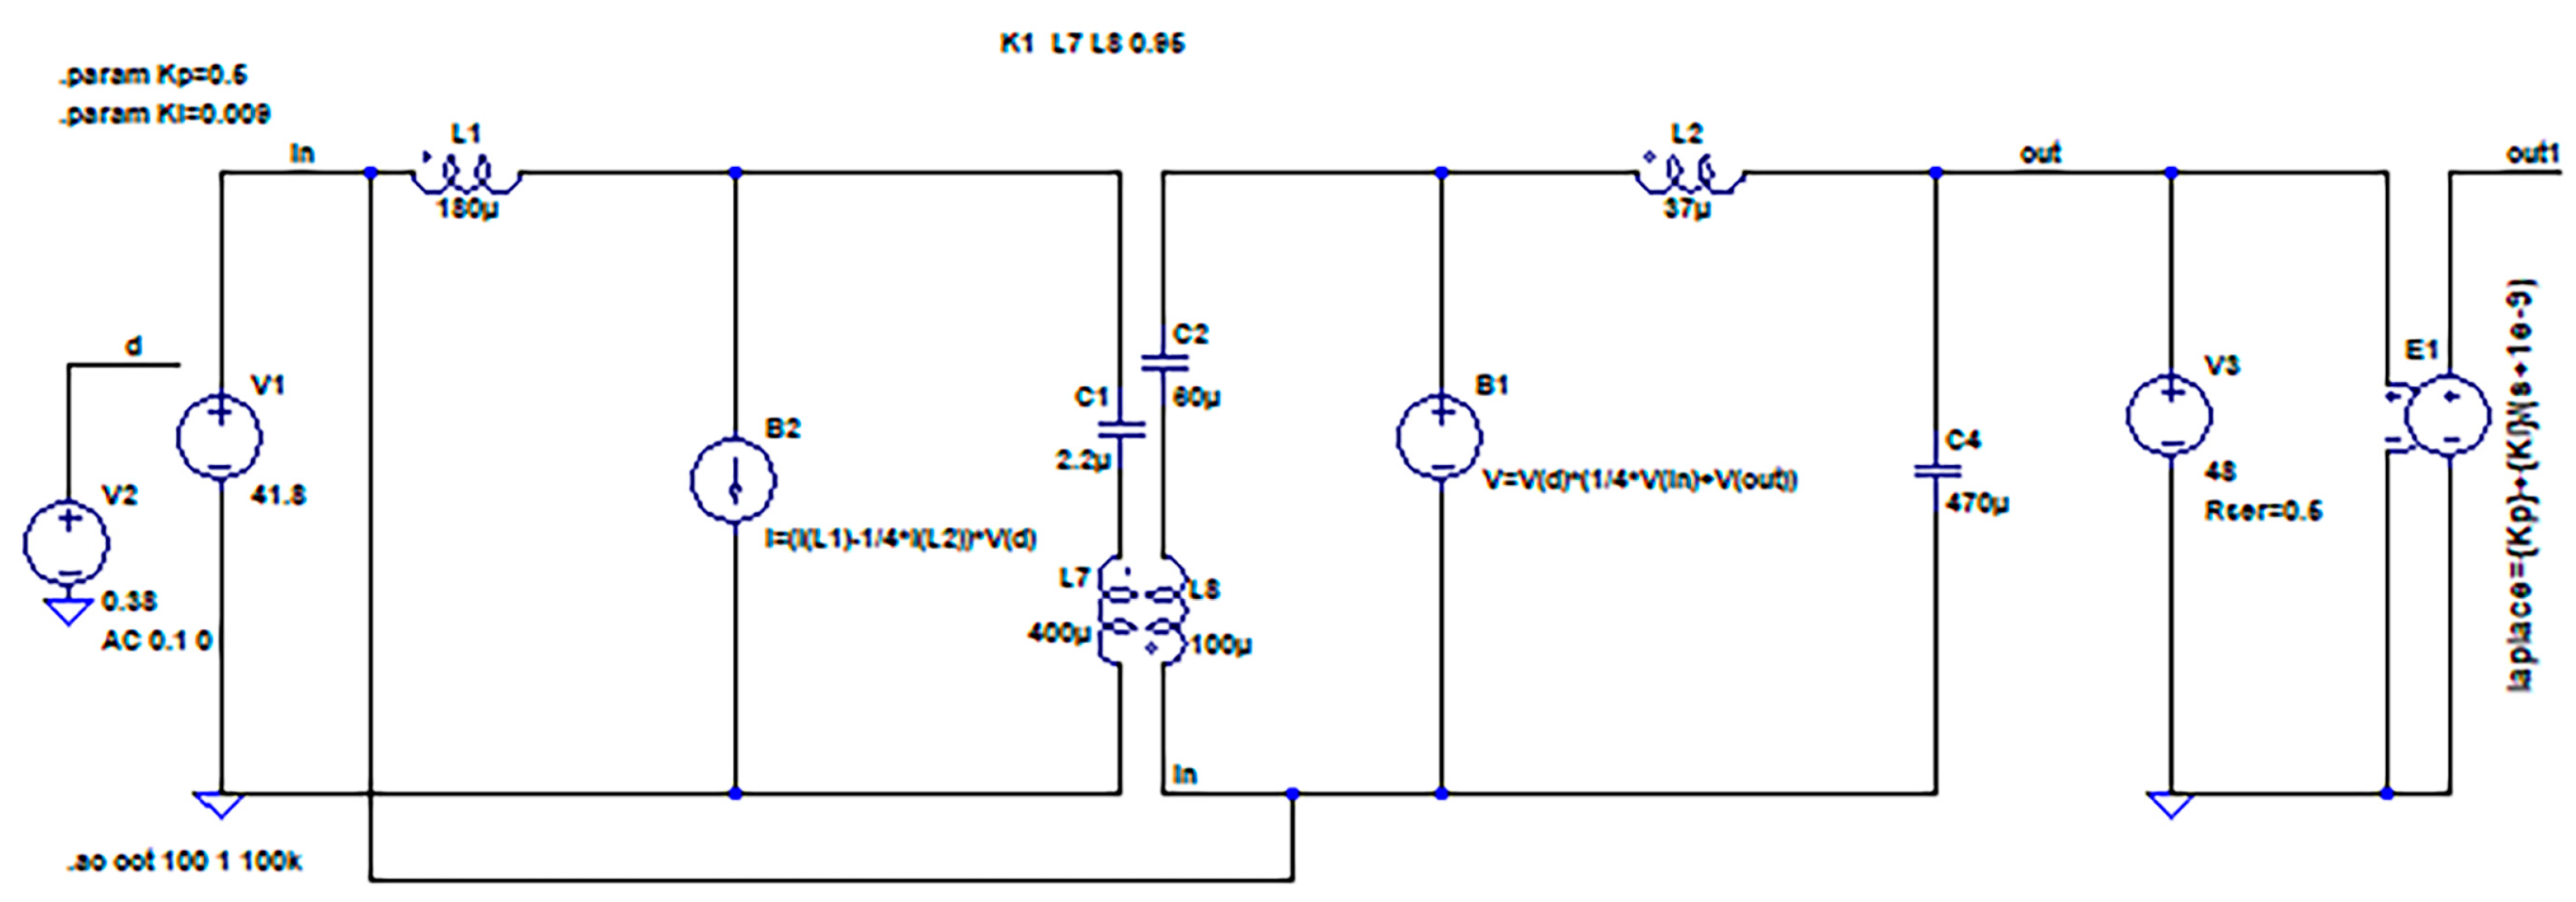
3.2.2. AC Sweep at Output of the Isolated Cûk Circuit

Figure 12 shows the AC sweeping circuit of the isolated Cûk circuit. Figure 13 shows the frequency domain sweeping results of the output voltage using the duty cycle ratio.

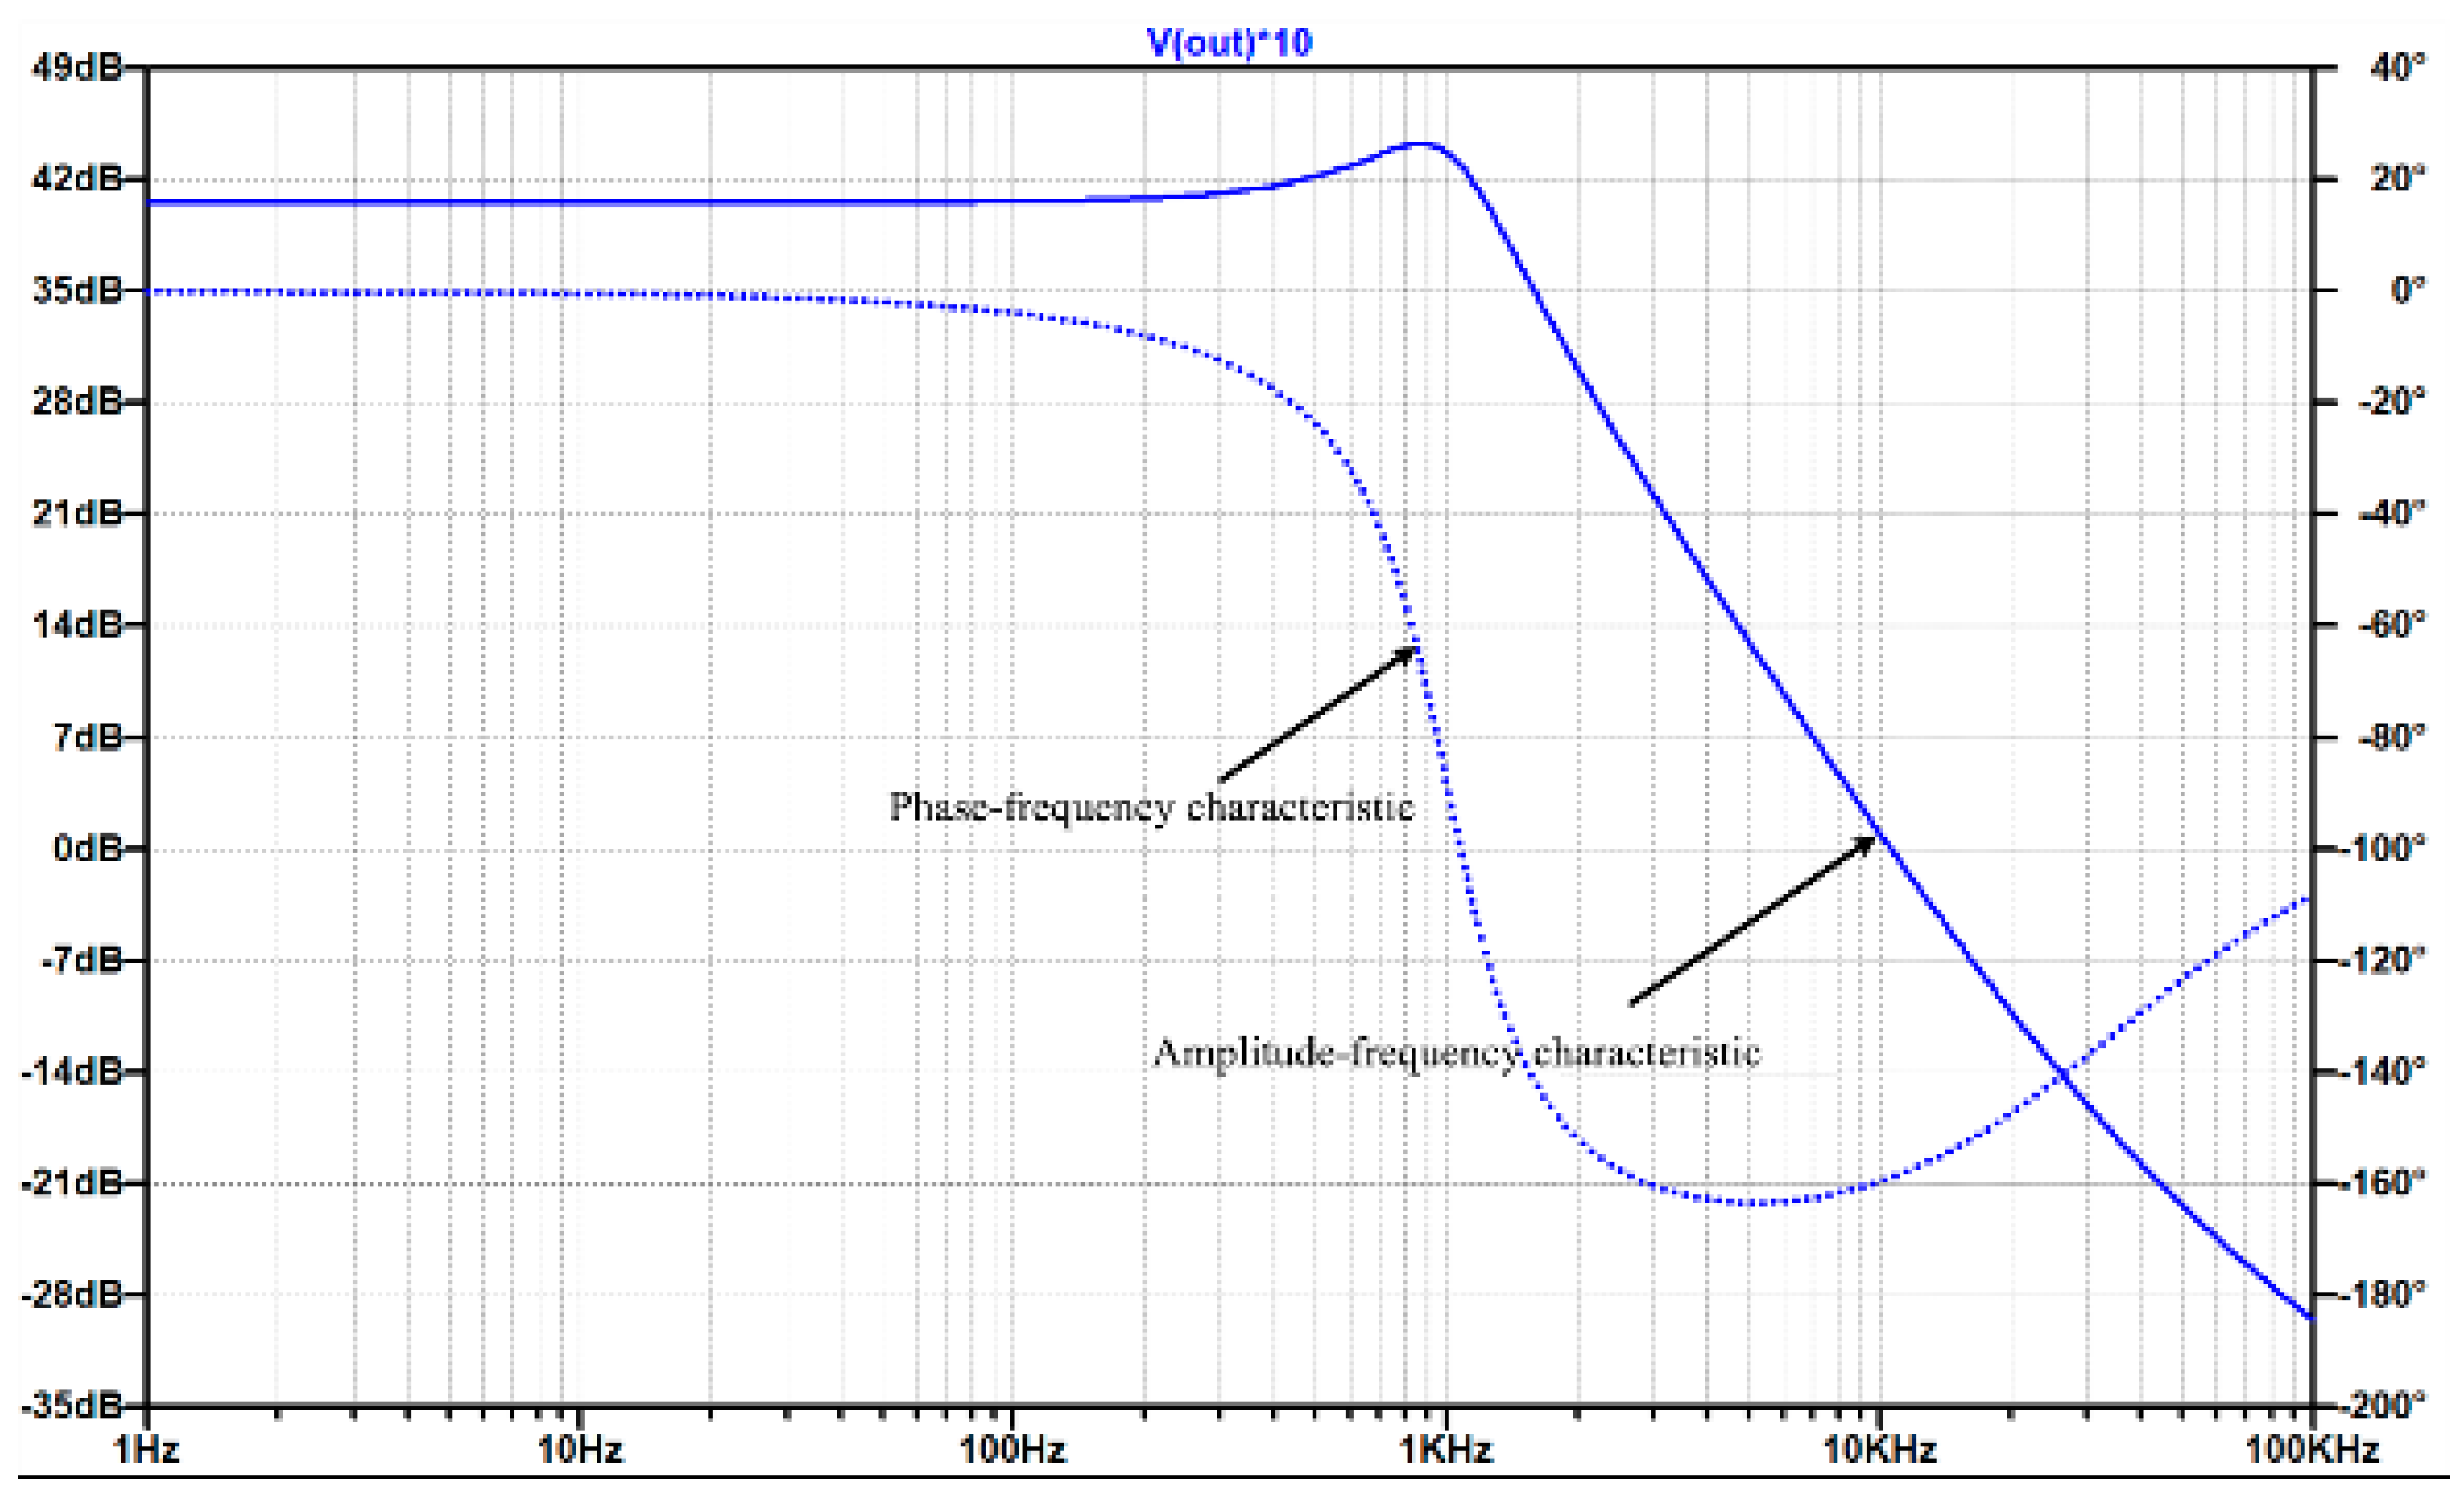
3.2.3. AC Sweep at Output of the SPPC

In the case of the independent power supply to the load, it was necessary to know the transfer function Vo(s)/d(s) of the output voltage of the duty cycle. The series partial power conversion circuit was based on an isolated Cûk converter, as shown in Figure 6. Then the SPPC circuit was swept. Figure 14 shows the AC sweeping diagram of the series partial power conversion circuit, and Figure 15 shows the sweeping results of the duty cycle in the frequency domain of the output voltage.

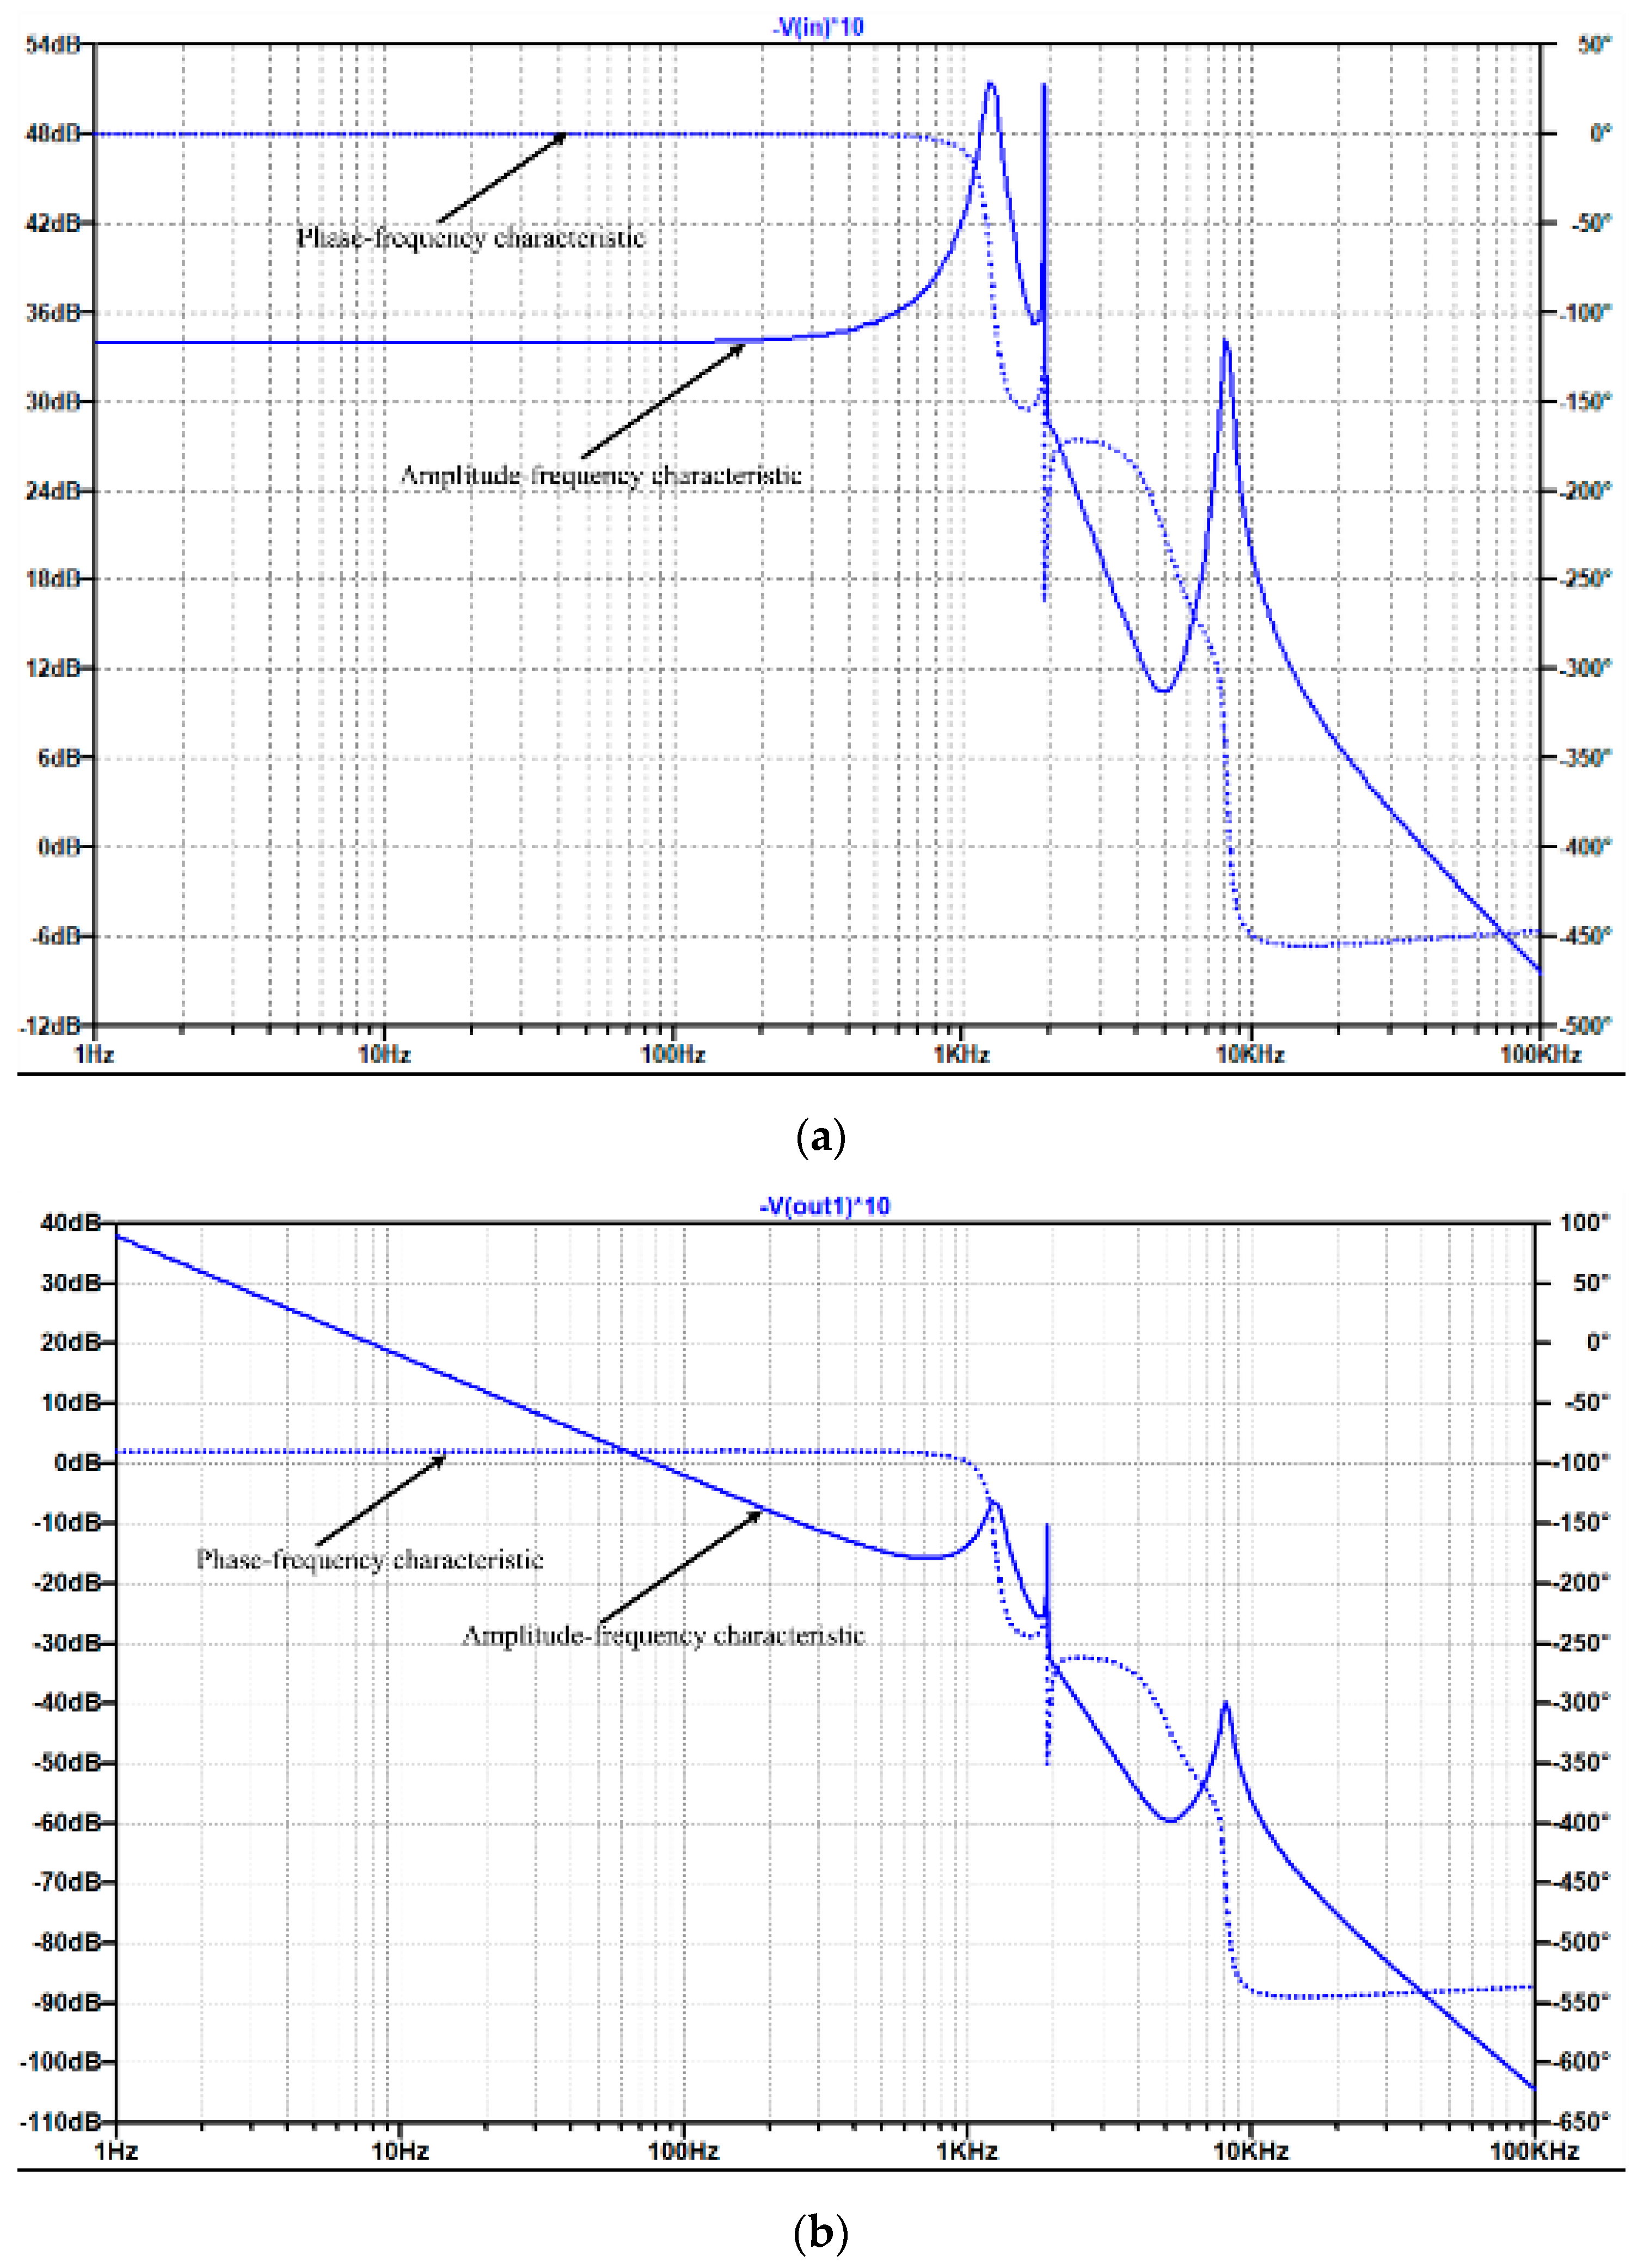
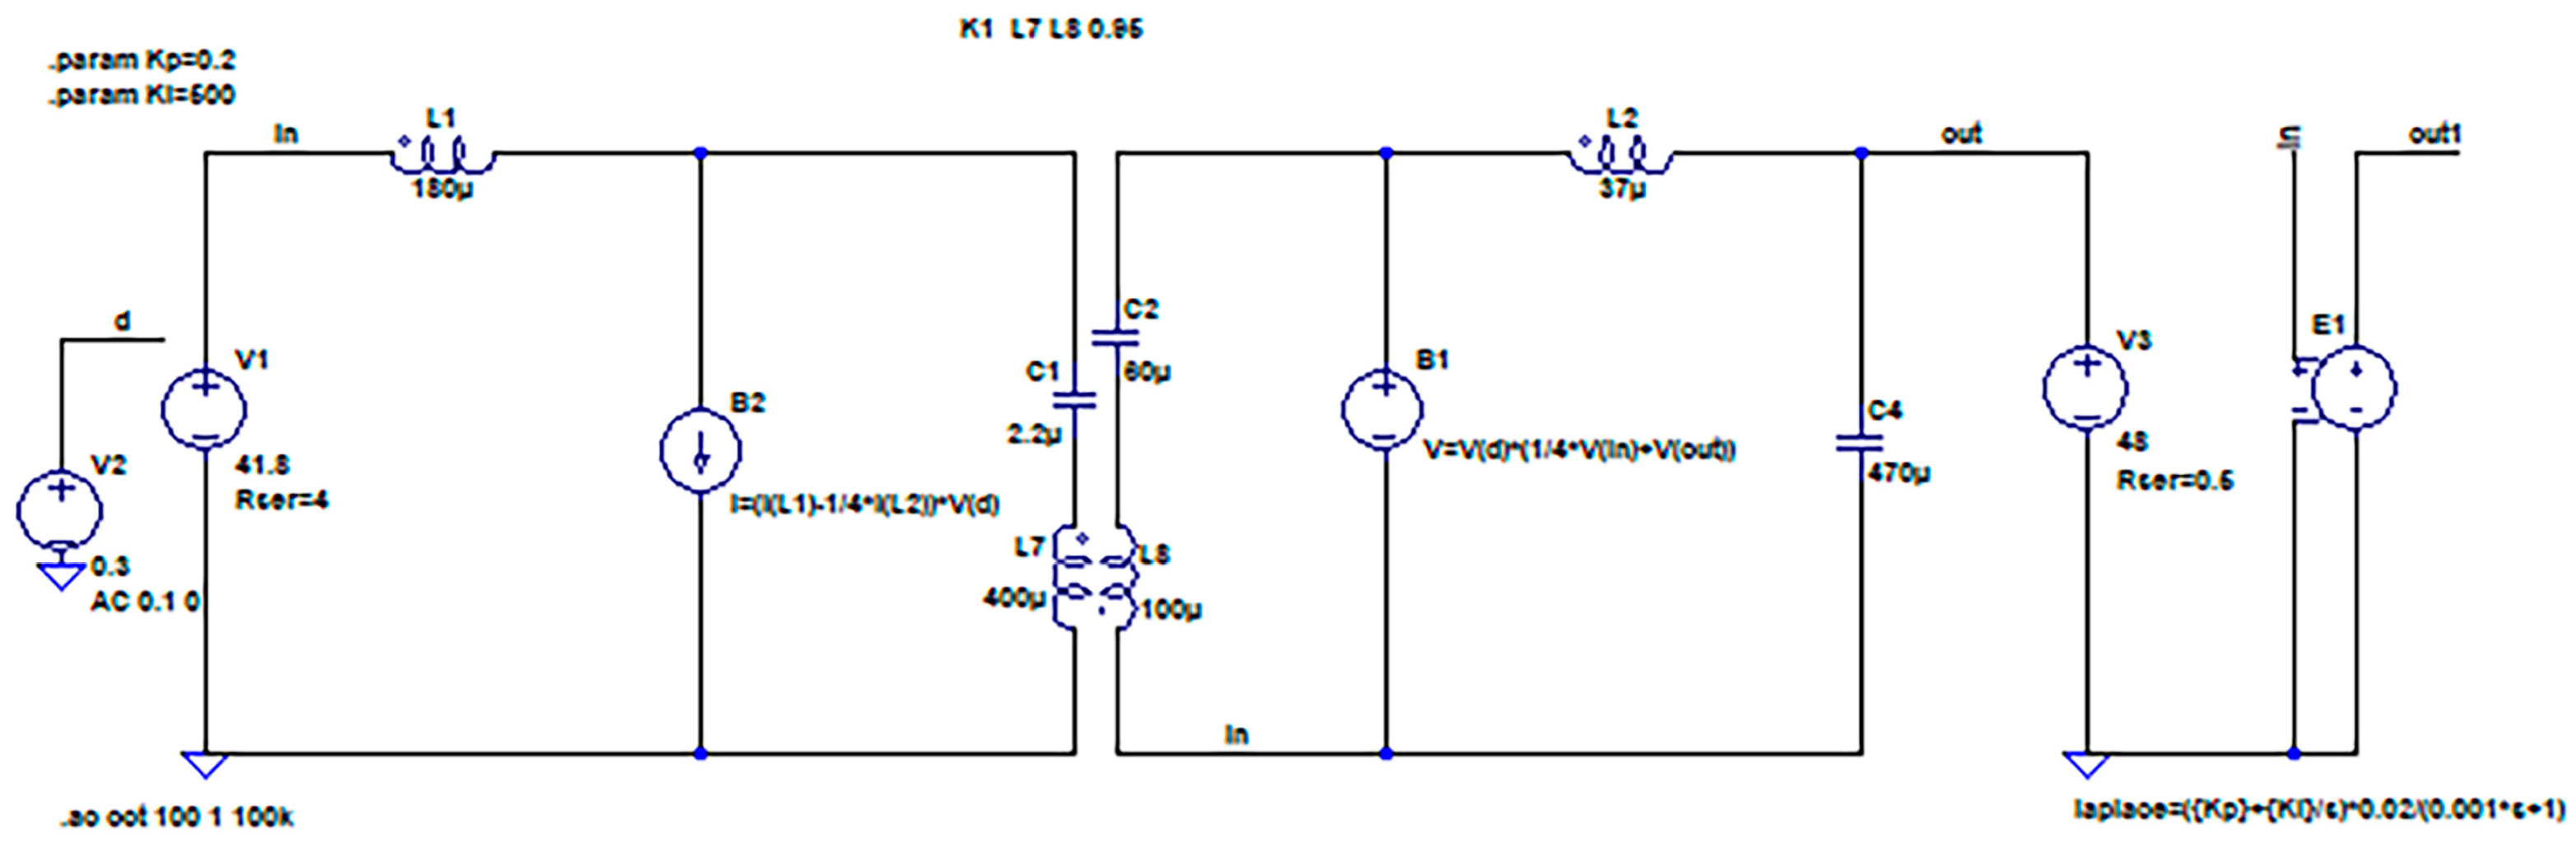
3.2.4. AC Sweep at Input of SPPC
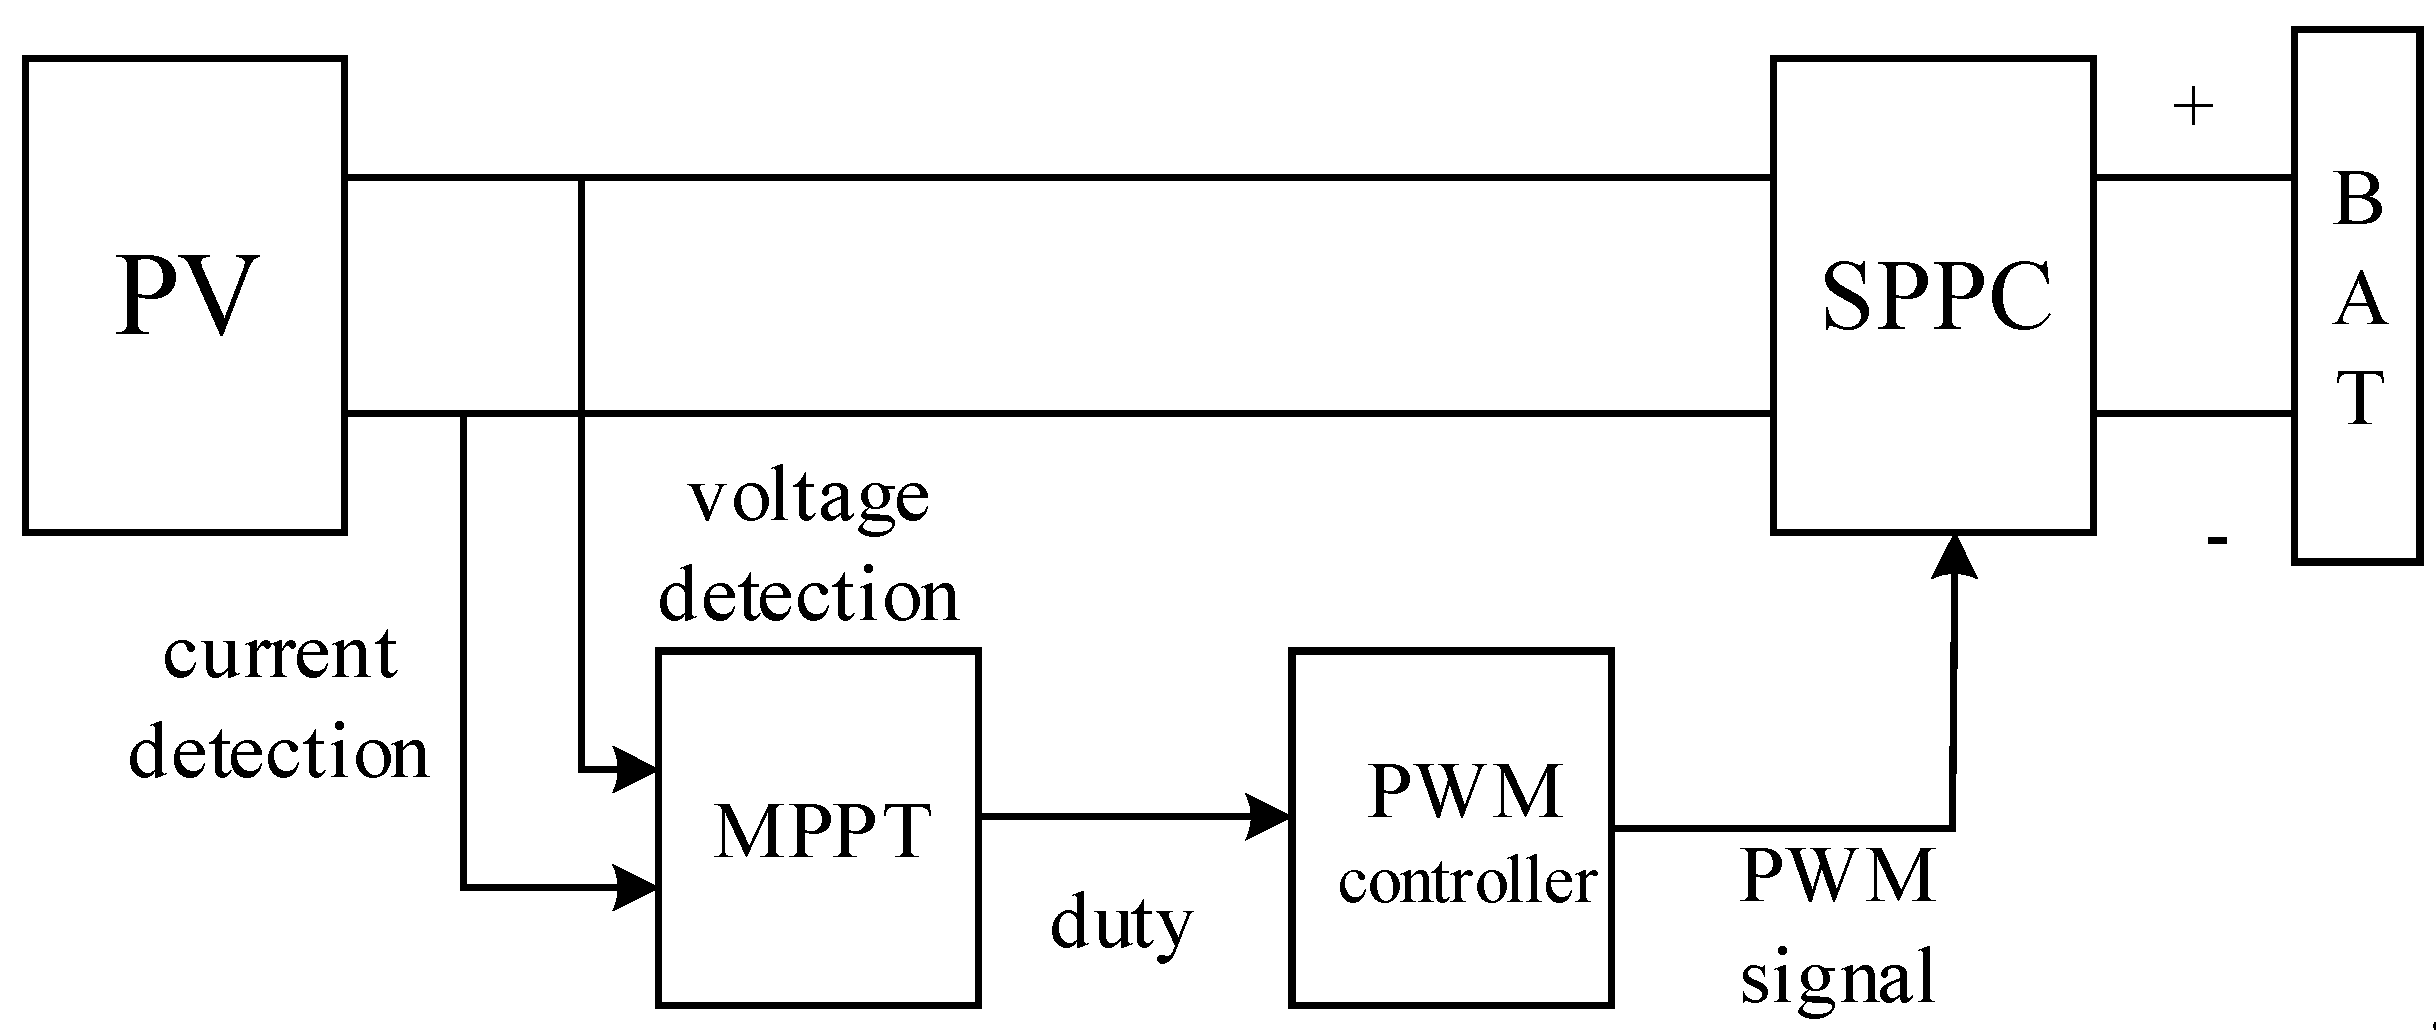
For the case of the photovoltaic maximum power tracking, it was necessary to study the transfer function relation Vin(s)/d(s) of the input voltage of the duty cycle ratio.
R PV = V MPP I MPP
RPV is the equivalent voltage of the input power supply.
The AC sweeping diagram of the input terminal of the series partial power converter is shown in Figure 16. The AC sweeping results of the input terminal and frequency domain characteristics of the open-loop loop after compensation are shown in Figure 17a,b, respectively. The PI parameters Kp = 0.2 and Ki = 500 were selected, the phase margin of the loop compensation was about 90 degrees, which met the stability requirements, and the traversal frequency was approx. 80 Hz. In the non-dynamic condition, it basically met the control speed requirements, as shown in Figure 17.
From the above results, the isolated Cûk converter was suitable for the basic converter topology of the series partial power converter.

3.3. System Control

Generally, it was essential to ensure that the photovoltaic module works at the maximum power point to improve the photovoltaic utilization rate. Nowadays, the commonly used MPPT mainly consists of the disturbance observation method, the neural network method, the conductance increment method, the fuzzy control method, and so on.
The disturbance observation method has a strong correction ability and a fast reaction speed, but the shock occurs at the maximum power point. The fuzzy control method has a higher steady-state control precision, but it has a large amount of computation and a slow dynamic response. The conductance increment method is fast and stable, but the sampling sensor has a high precision.
With the development of modern power electronics technology, the precision of the sensors is also improving. To sum up, this paper used the conductance increment method for the maximum power point tracking.
Figure 18 shows the system control block diagram.
The maximum power point tracking algorithm used the i conductance increment method, the battery group was a 48 V lithium battery group composed of 13 lithium batteries in the series and the PWM controller controlled the switching tube in the SPPC converter.

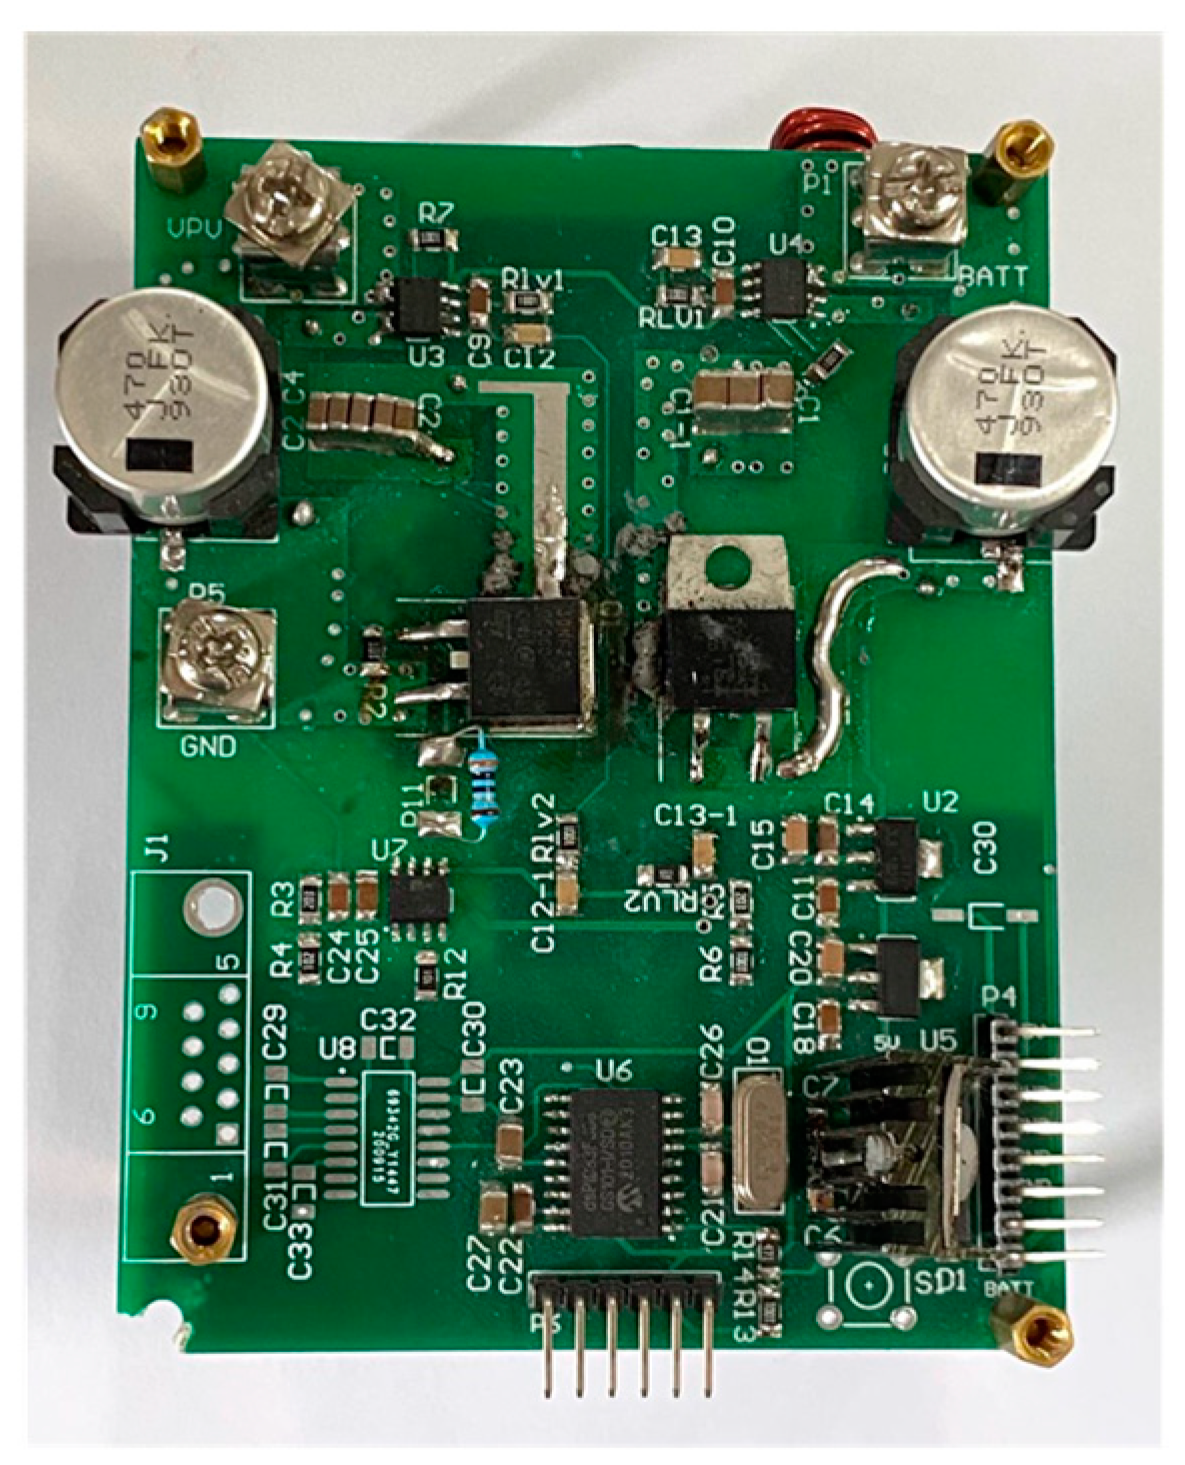
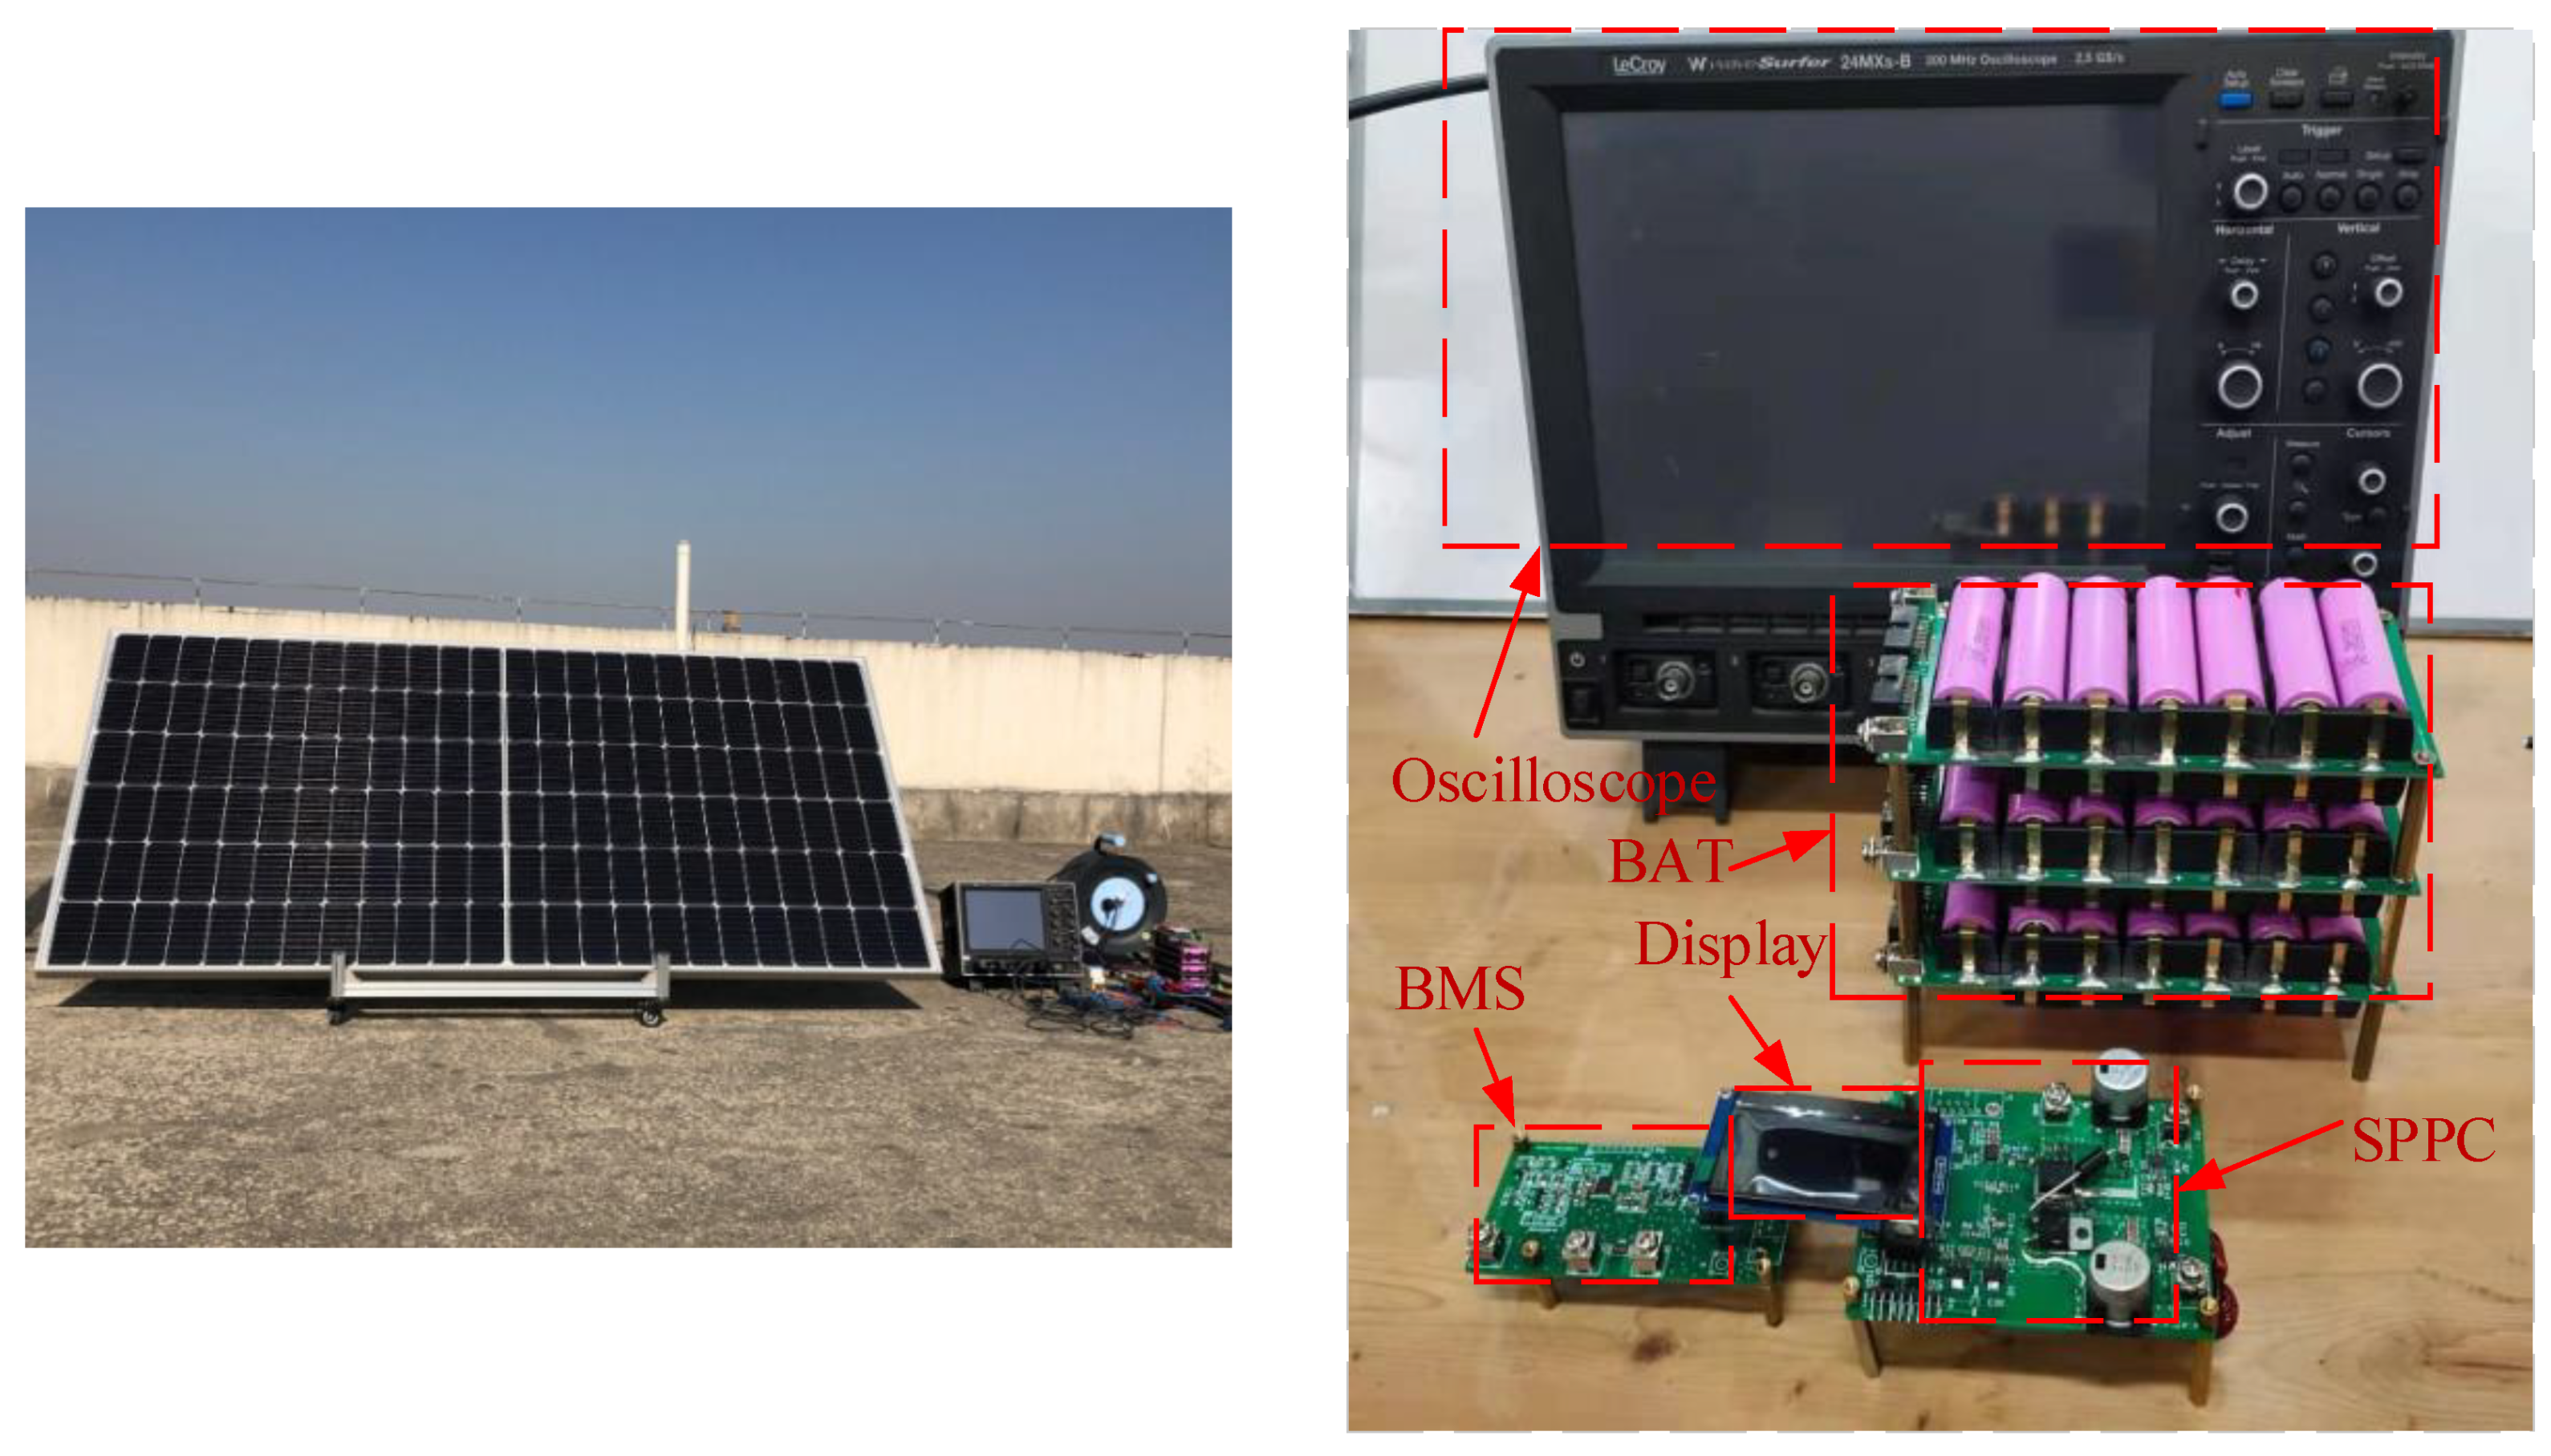
4. Experimental Verification of the Low-Voltage Photovoltaic Storage System

The transmission efficiency and maximum power tracking effect were the key technical indexes in photovoltaic storage system research. So, this part will carry out the experimental verification of the power transmission efficiency in a laboratory environment and the power transmission efficiency in natural working conditions.

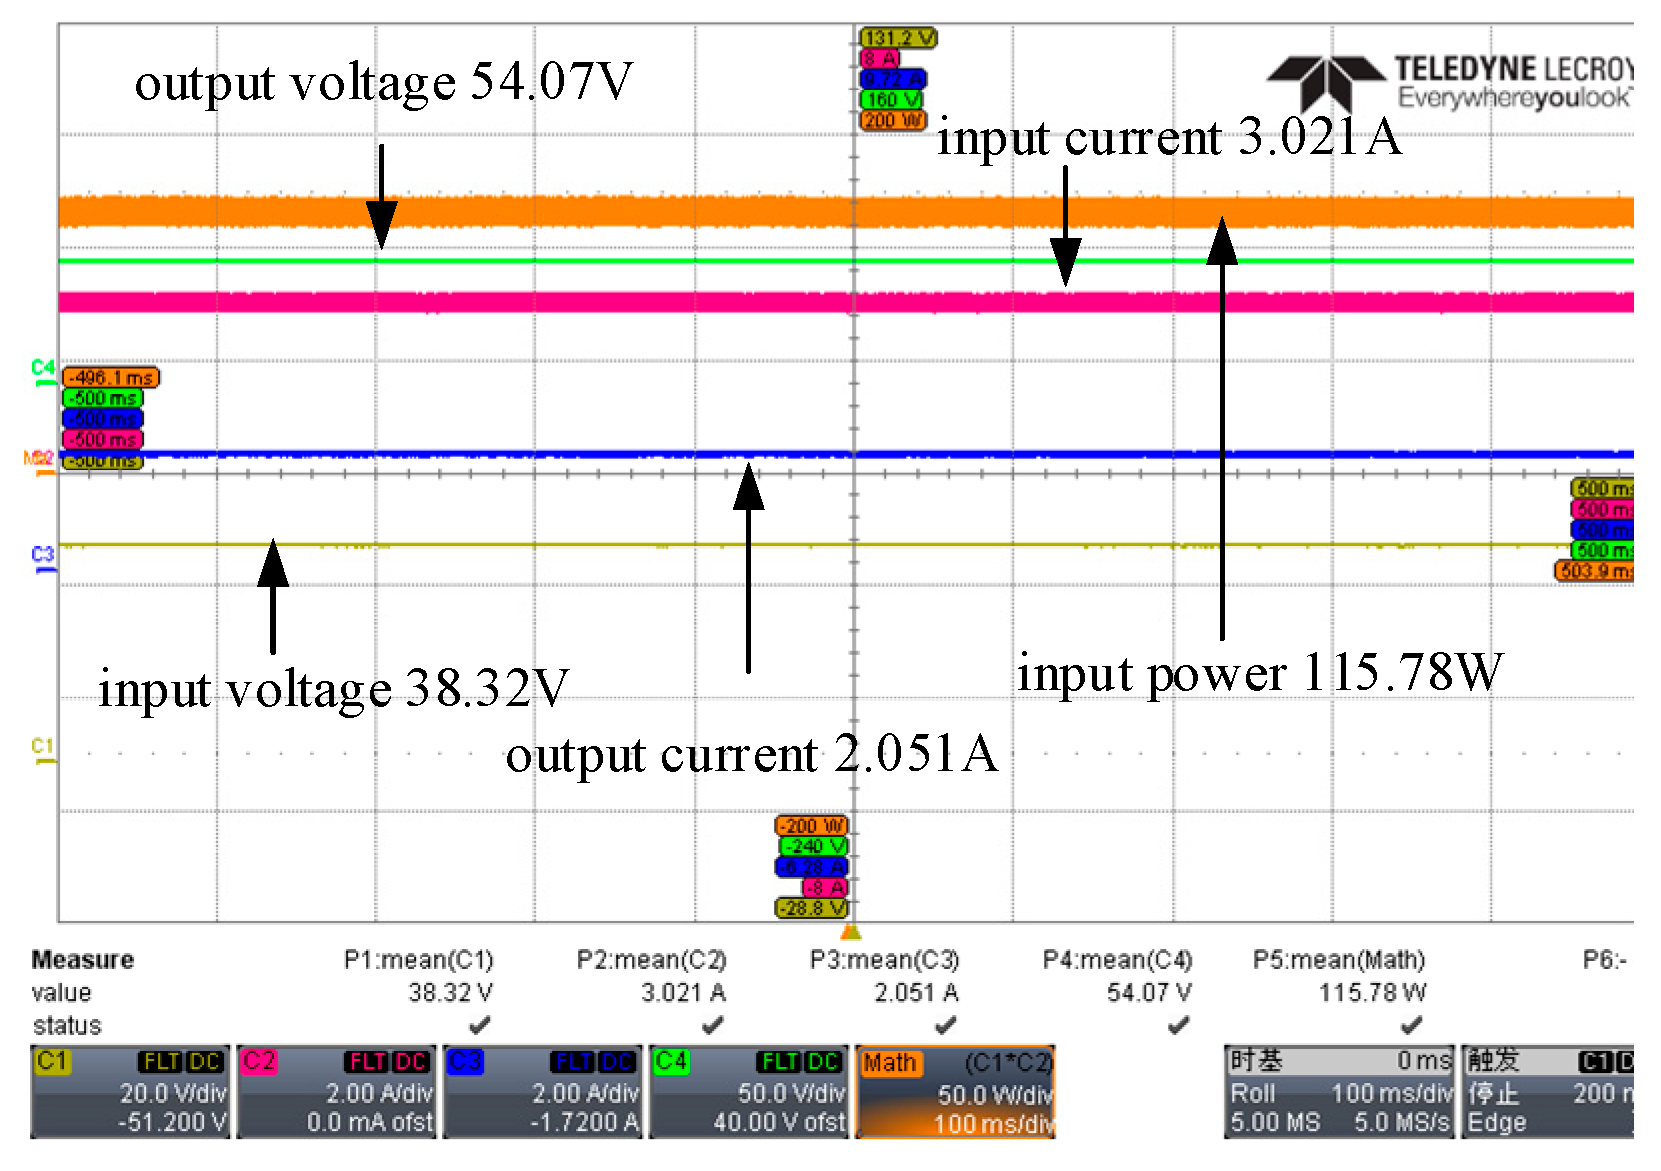
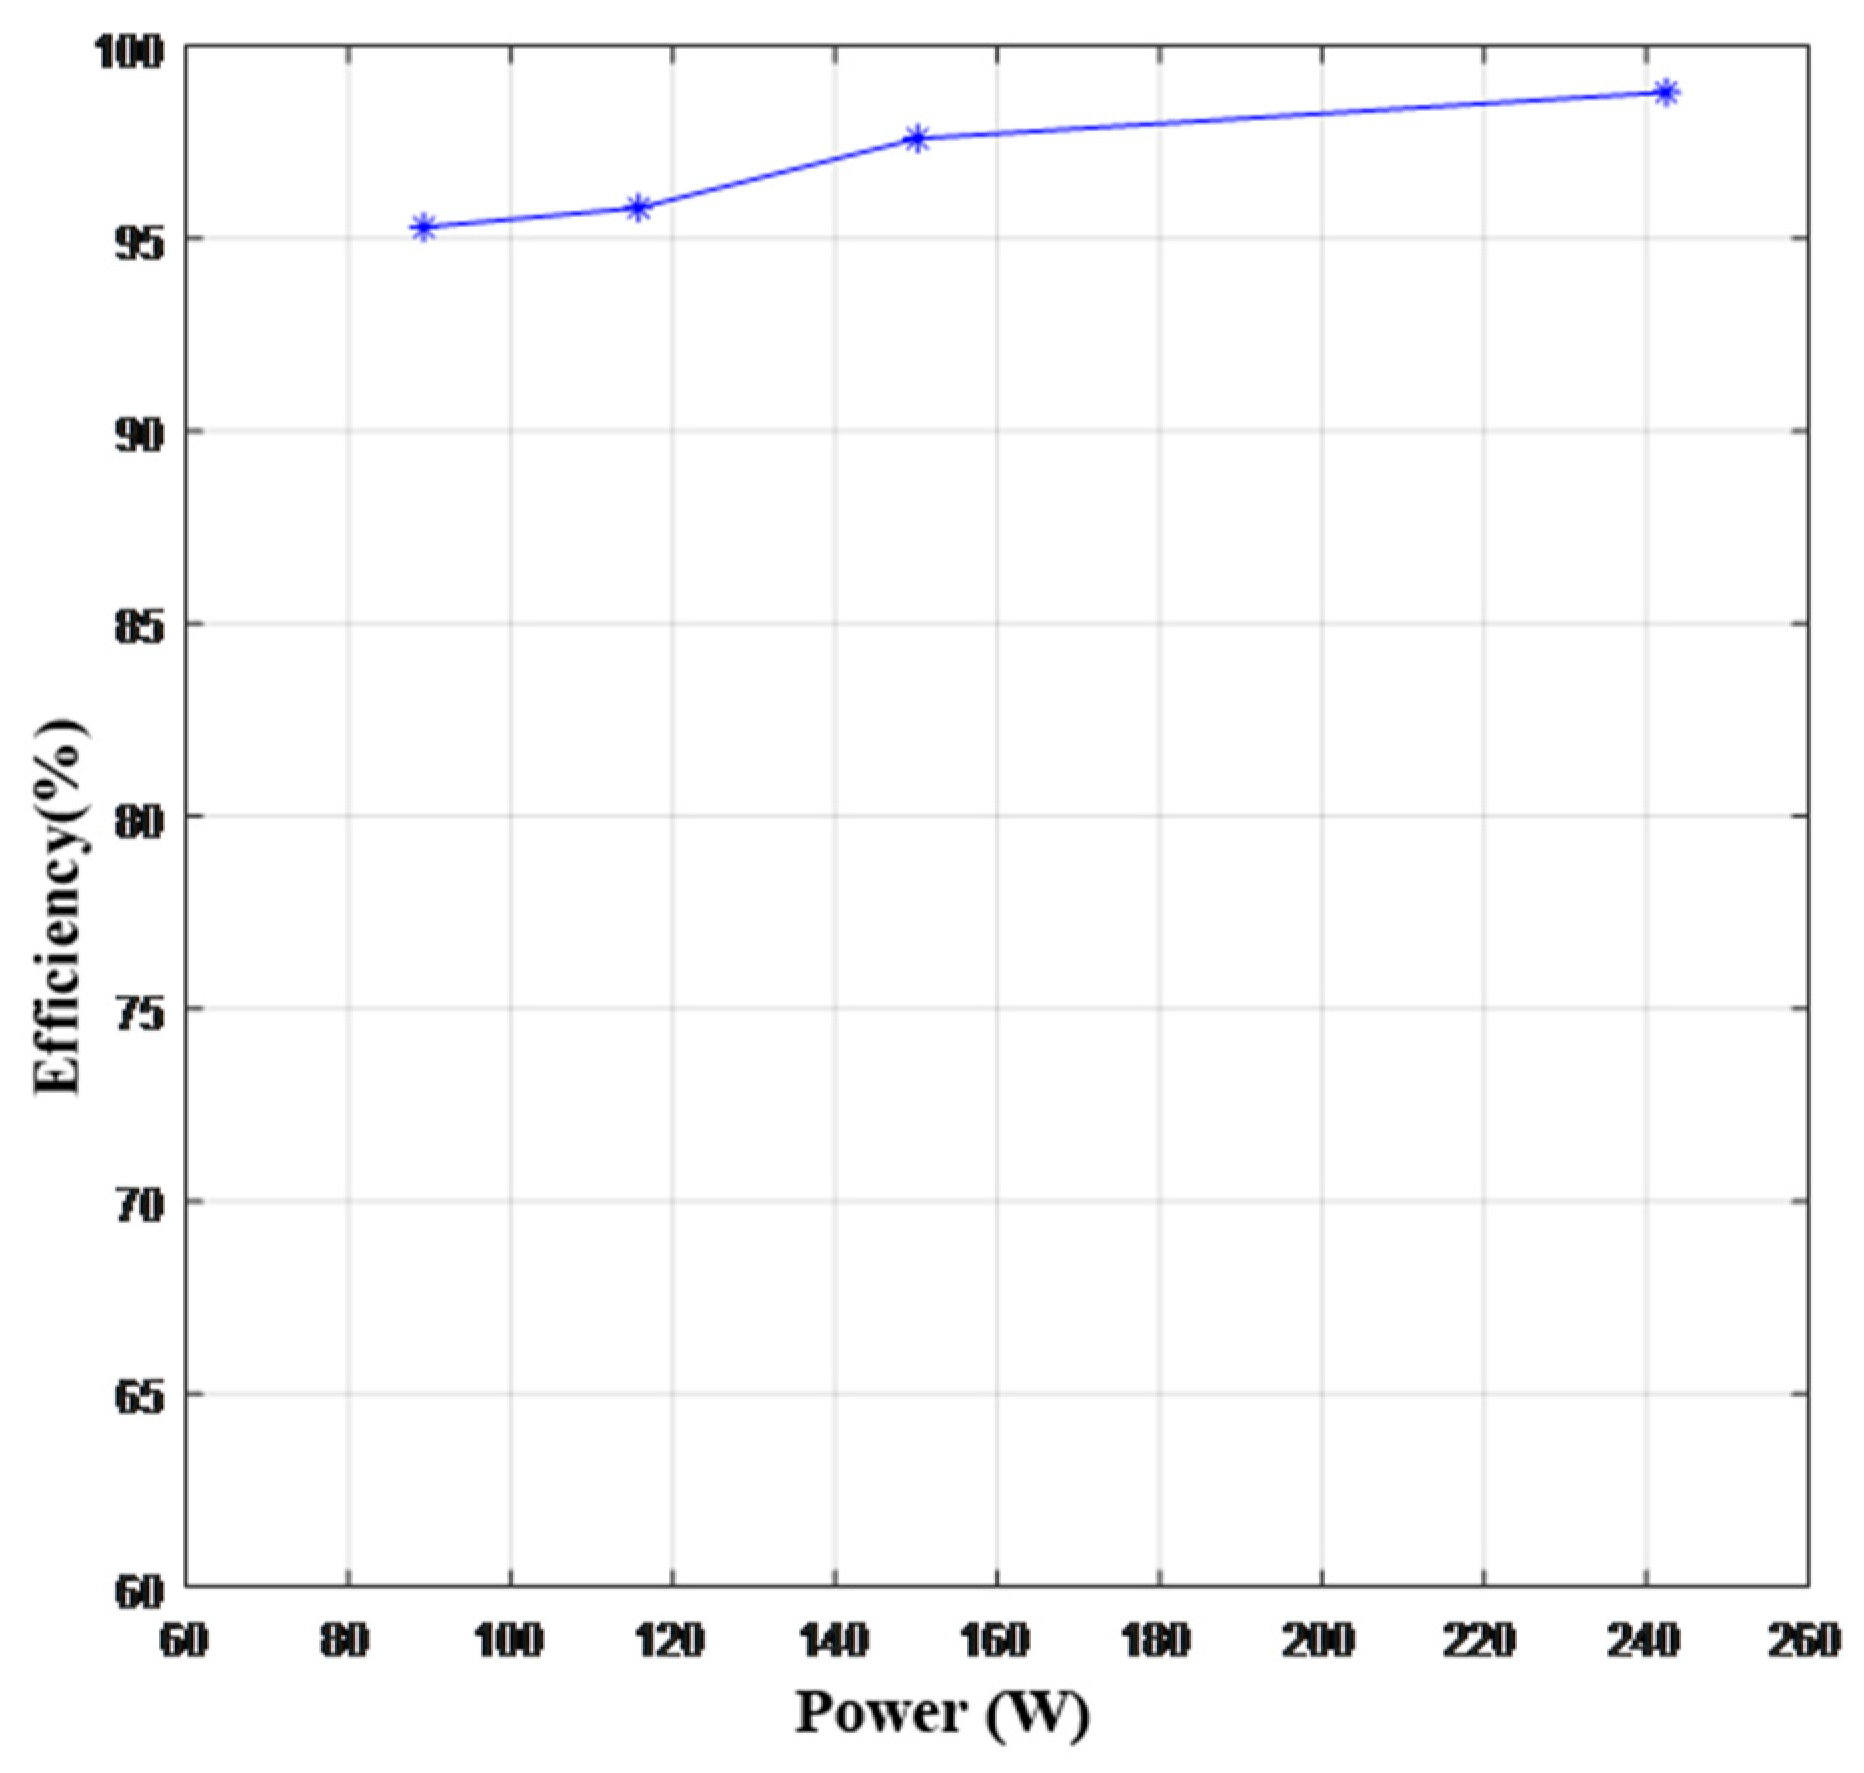
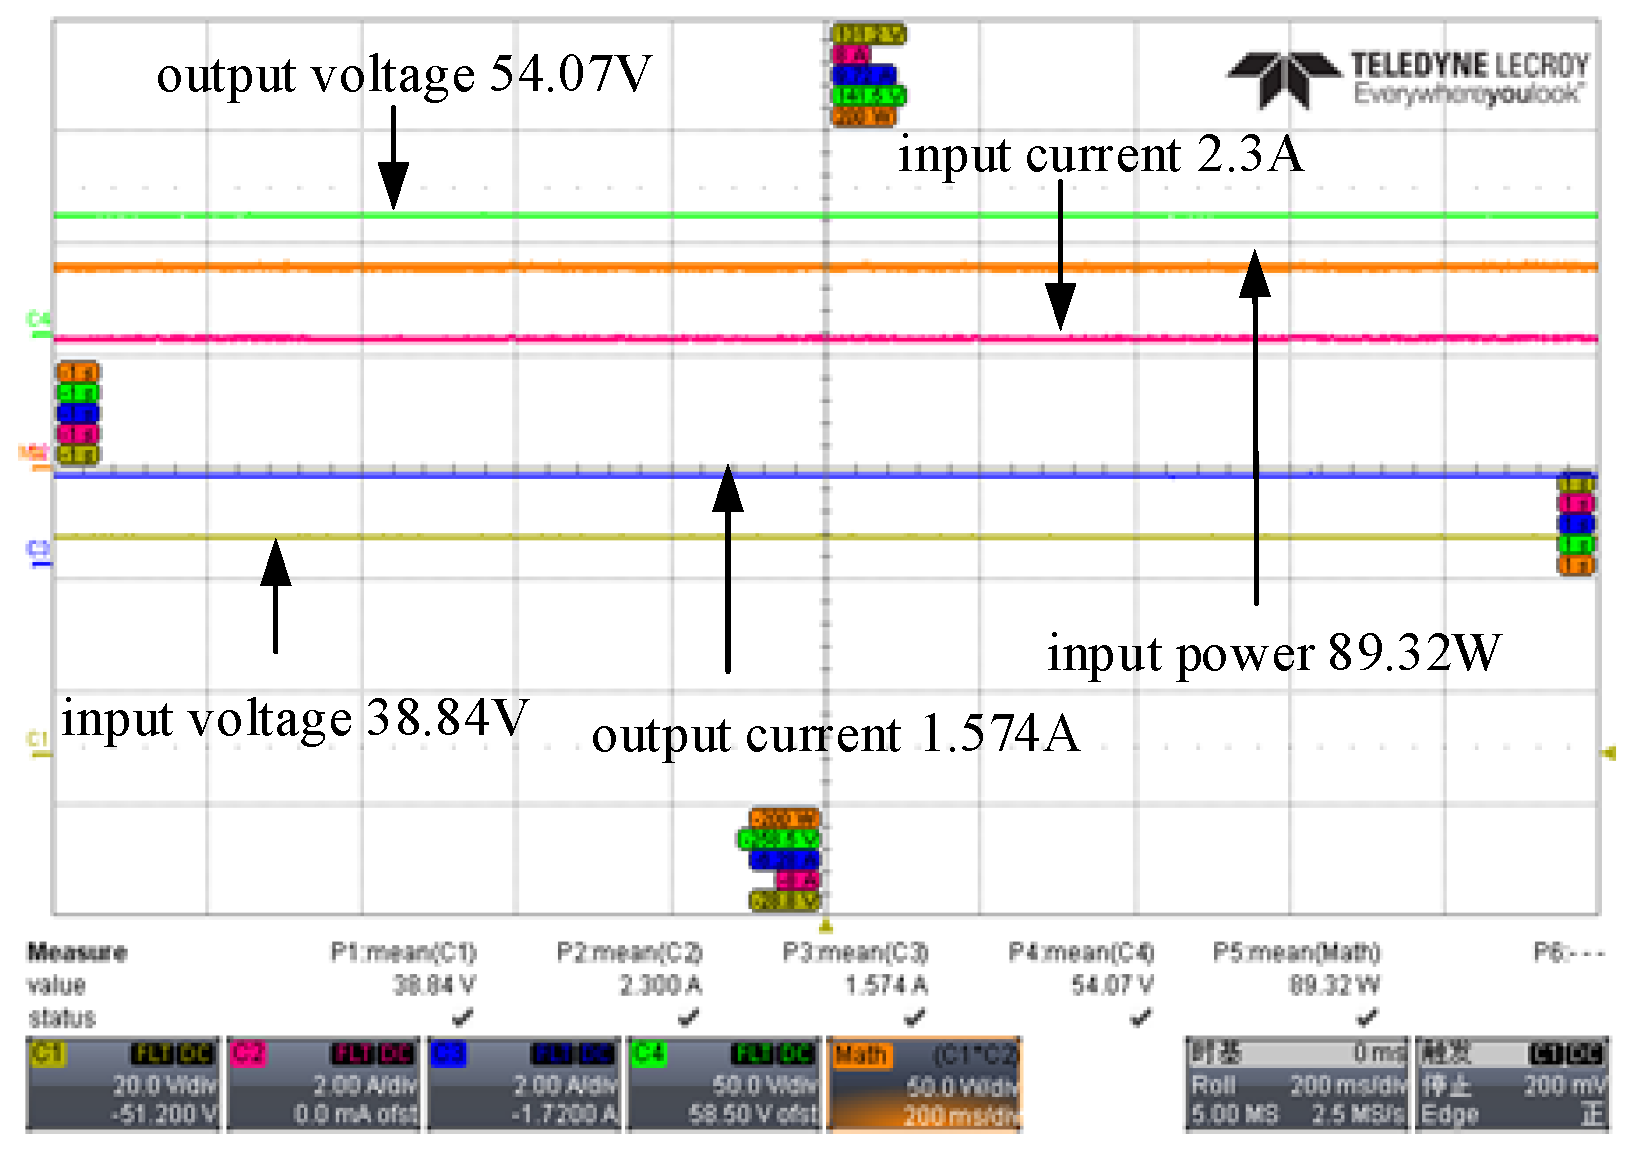
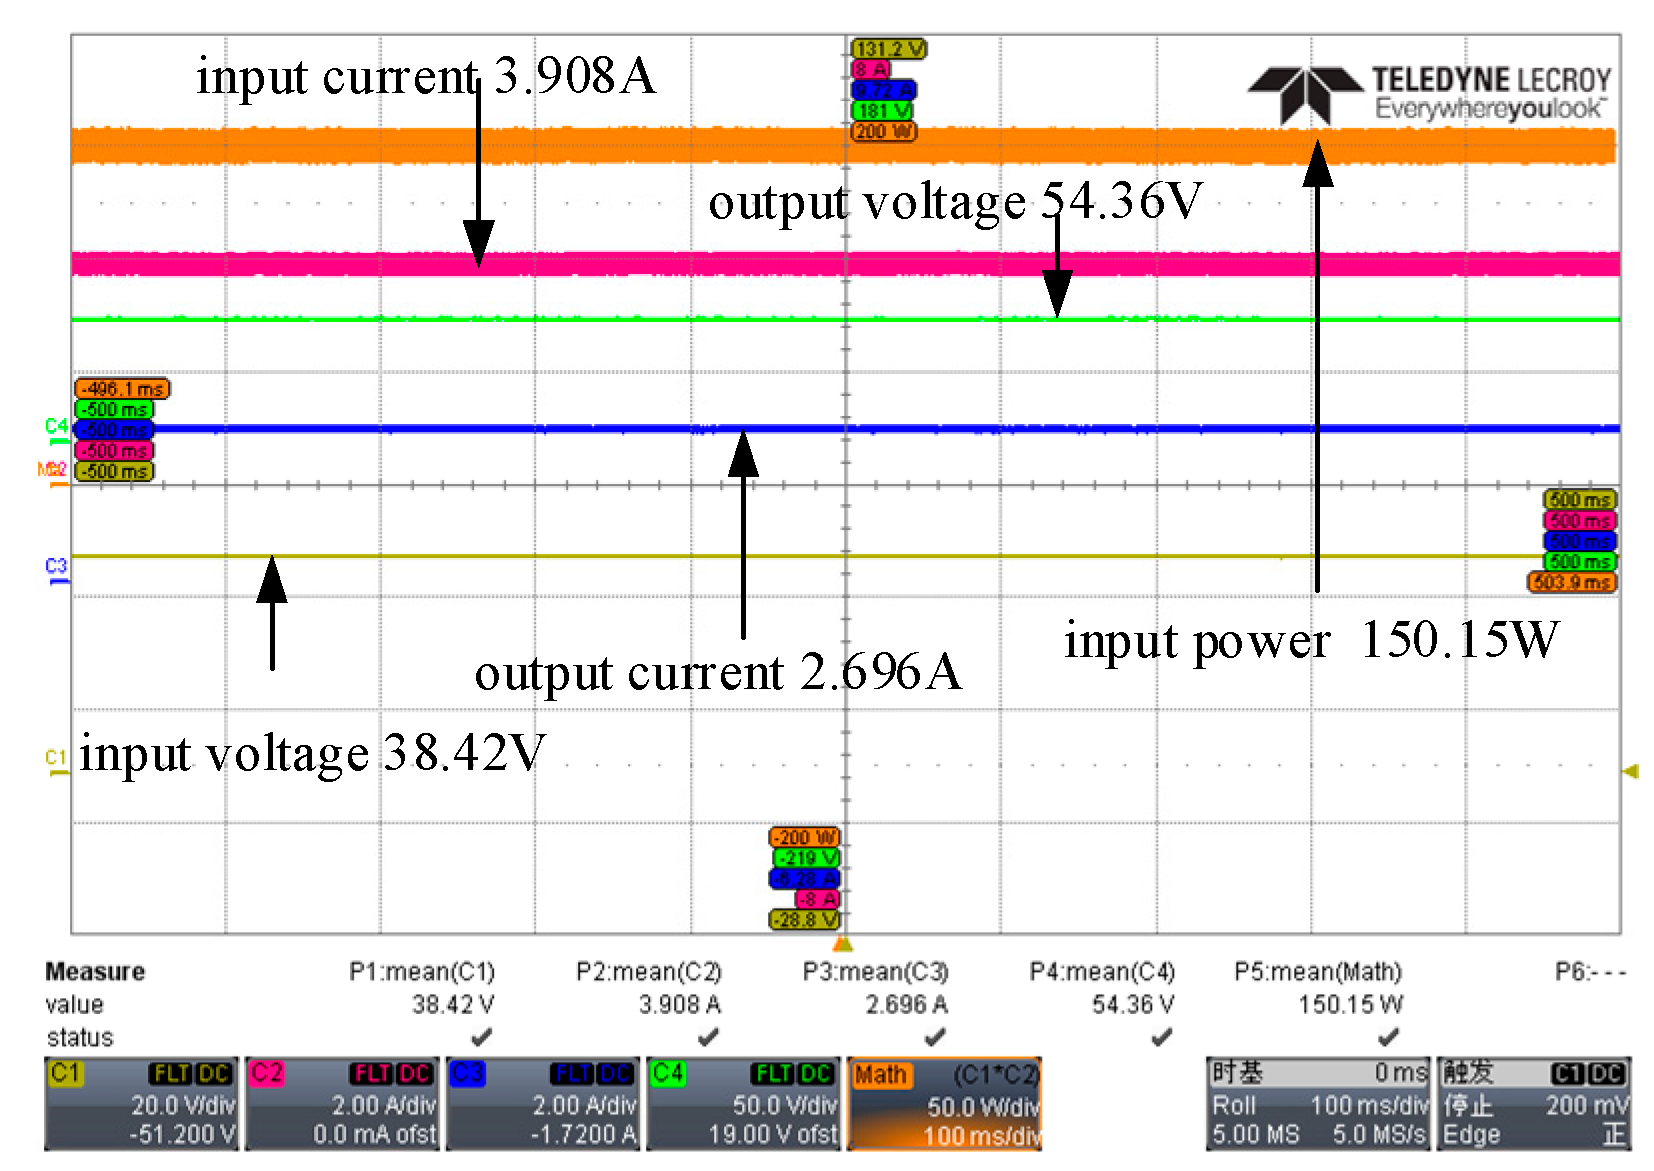
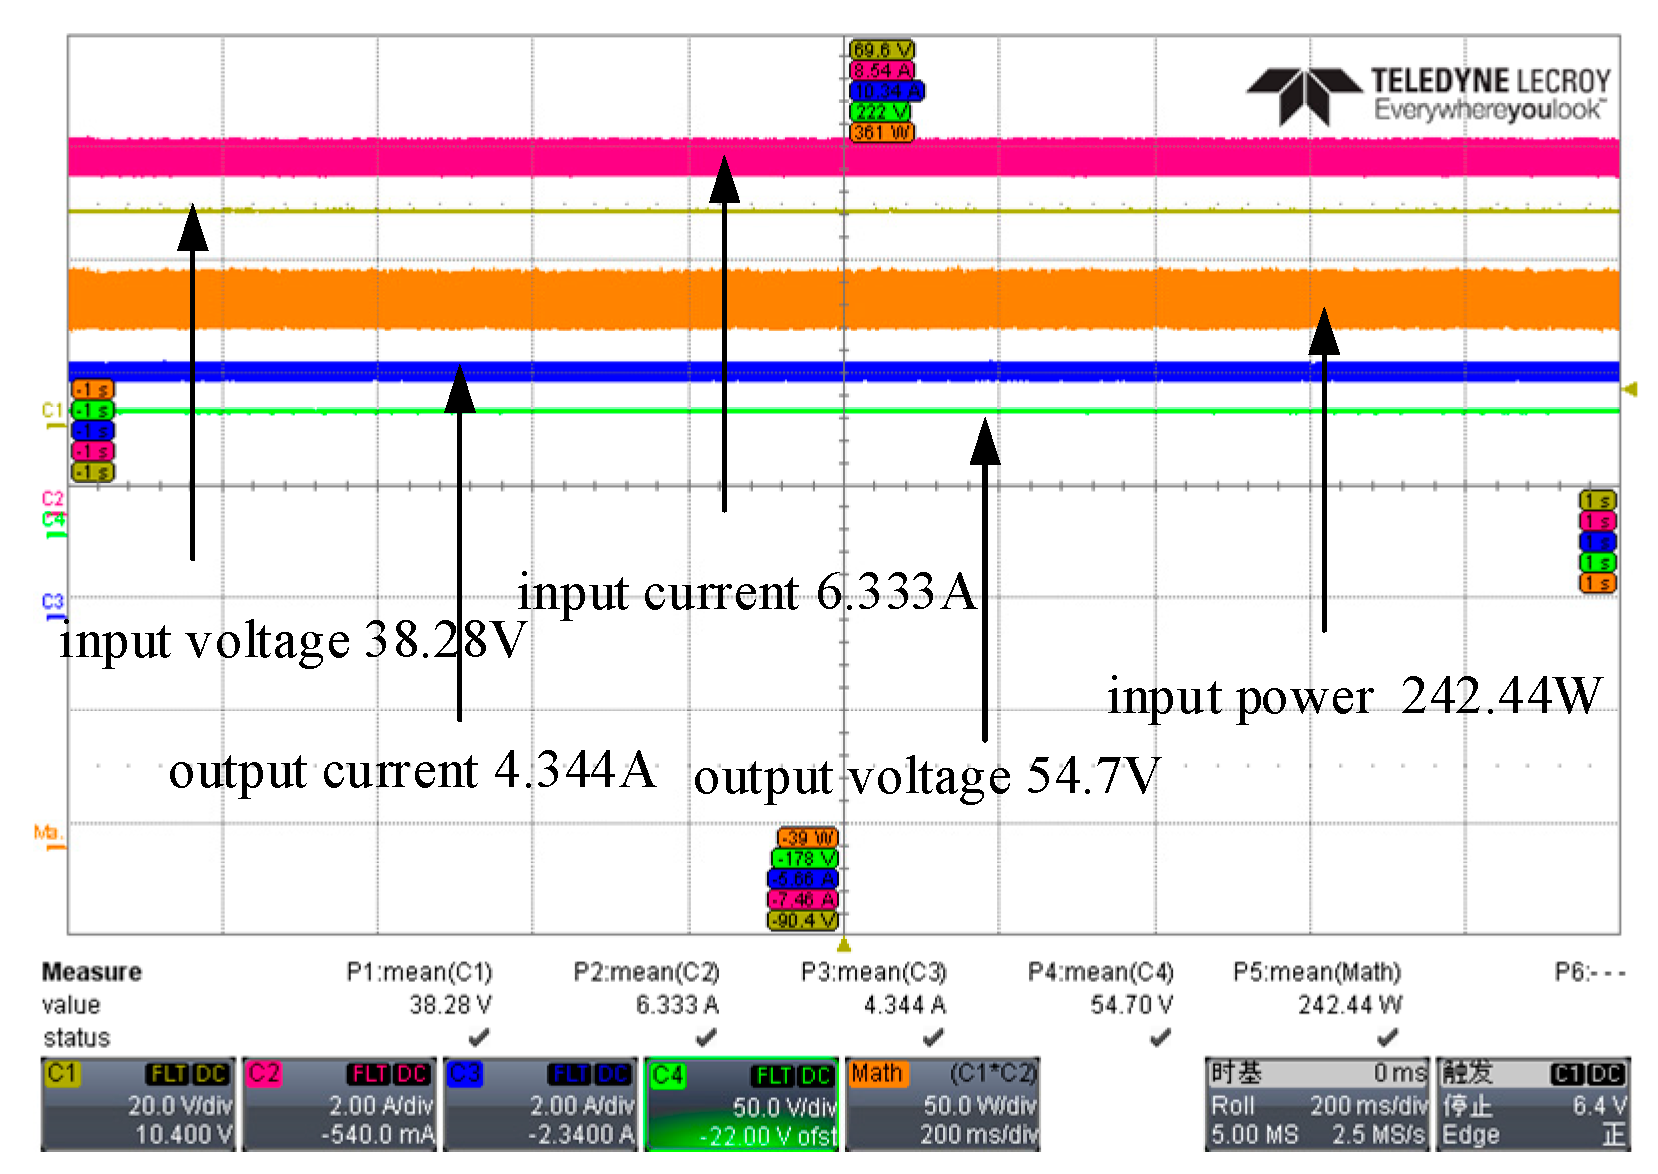
4.1. Experimental Verification of the Power Transmission Efficiency in a Laboratory Environment

The low-voltage PV storage system consisted of photovoltaic modules, series partial power converters, load batteries and management systems. The series partial power converter consisted of a power level circuit, an auxiliary power supply circuit, a signal detection and conditioning circuit, a control circuit composed of a dsPIC33FJ06GS101 digital power supply special microcontroller and a battery management circuit with ATmega328p as the core. Figure 19 shows the hardware prototype of the low-voltage photovoltaic storage system.
The steady-state photovoltaic module and lithium battery pack were simulated by DC power supply and the constant voltage electronic load, respectively, in the laboratory environment. The power transmission efficiency of the converter was verified under different lighting conditions.
The experiments verified that the maximum power point voltage of the PV was approx. 38 V under the different working conditions. The battery group in the system was composed of 13 lithium batteries with a single voltage of 3.7 V. The normal charging voltage of the battery group was 54.6 V, so the electronic load in the constant voltage mode was used in the laboratory environment and its load voltage was set to approx. 54 V. Under the condition that the input and output voltages of the system basically remained unchanged, different output current reference values of the SPPC were set to achieve the purpose of transmitting different power, and the steady-state experiment of the varying transmission power was carried out.
In test 1, the load current was 1.574 A and the steady-state waveform is shown in Figure 20.
Under the current experimental conditions, the transmission efficiency of the system was obtained, as shown in Equation (13).
η = V out I out V in I in = 54.07 × 1.574 38.84 × 2.3 = 95.3 %
In test 2, the load current was 2.051 A and the steady-state waveform is shown in Figure 21.
Under the current experimental conditions, the transmission efficiency of the system was obtained, as shown in Equation (14).
η = V out I out V in I in = 54.07 × 2.051 38.32 × 3.021 = 95.8 %
In test 3, the load current was 2.696 A, and the steady-state waveform is shown in Figure 22.
Under the current experimental conditions, the transmission efficiency of the system was obtained, as shown in Equation (15).
η = V out I out V in I in = 54.36 × 2.696 38.42 × 3.908 = 97.6 %
In test 4, the load current was 4.344 A, and the steady-state waveform is shown in Figure 23.
Under the current experimental conditions, the transmission efficiency of the system was obtained, as shown in Equation (16).
η = V out I out V in I in = 54.7 × 4.344 38.28 × 6.333 = 98 %
According to the above experimental data, the curve of the changing relationship between the system input power and the transmission efficiency can be drawn, as shown in Figure 24.
As seen in the figure above, when the system input voltage was controlled at 38 V, the output was 54 V at the constant voltage load and the system input power at 87 W–242 W level achieved a 95–98% measured efficiency. The higher the power level, the higher the transmission efficiency of the system.

4.2. Experiment of the Power Transmission under Natural Working Conditions

After the steady-state efficiency test of the prototype circuit was completed, the photovoltaic maximum power tracking experiment was carried out under natural light conditions. The test was carried out on a day with strong light in winter. The test load was a 48 V lithium battery pack consisting of 13 lithium batteries in a series. Table 3 lists the parameter value for each component of the hardware circuit during the test. Figure 25 shows the hardware test platform of the low-voltage photovoltaic storage system.
In order to verify the adaptability of the SPPC in the photovoltaic power conditioning, the experiments were carried out in the following four steps.
4.2.1. Photovoltaic output power sweeping test
4.2.2. Photovoltaic maximum power tracking experimental verification
4.2.3. Start-up experiment of the PV storage system
4.2.4. Photovoltaic full cover and tracking experiment

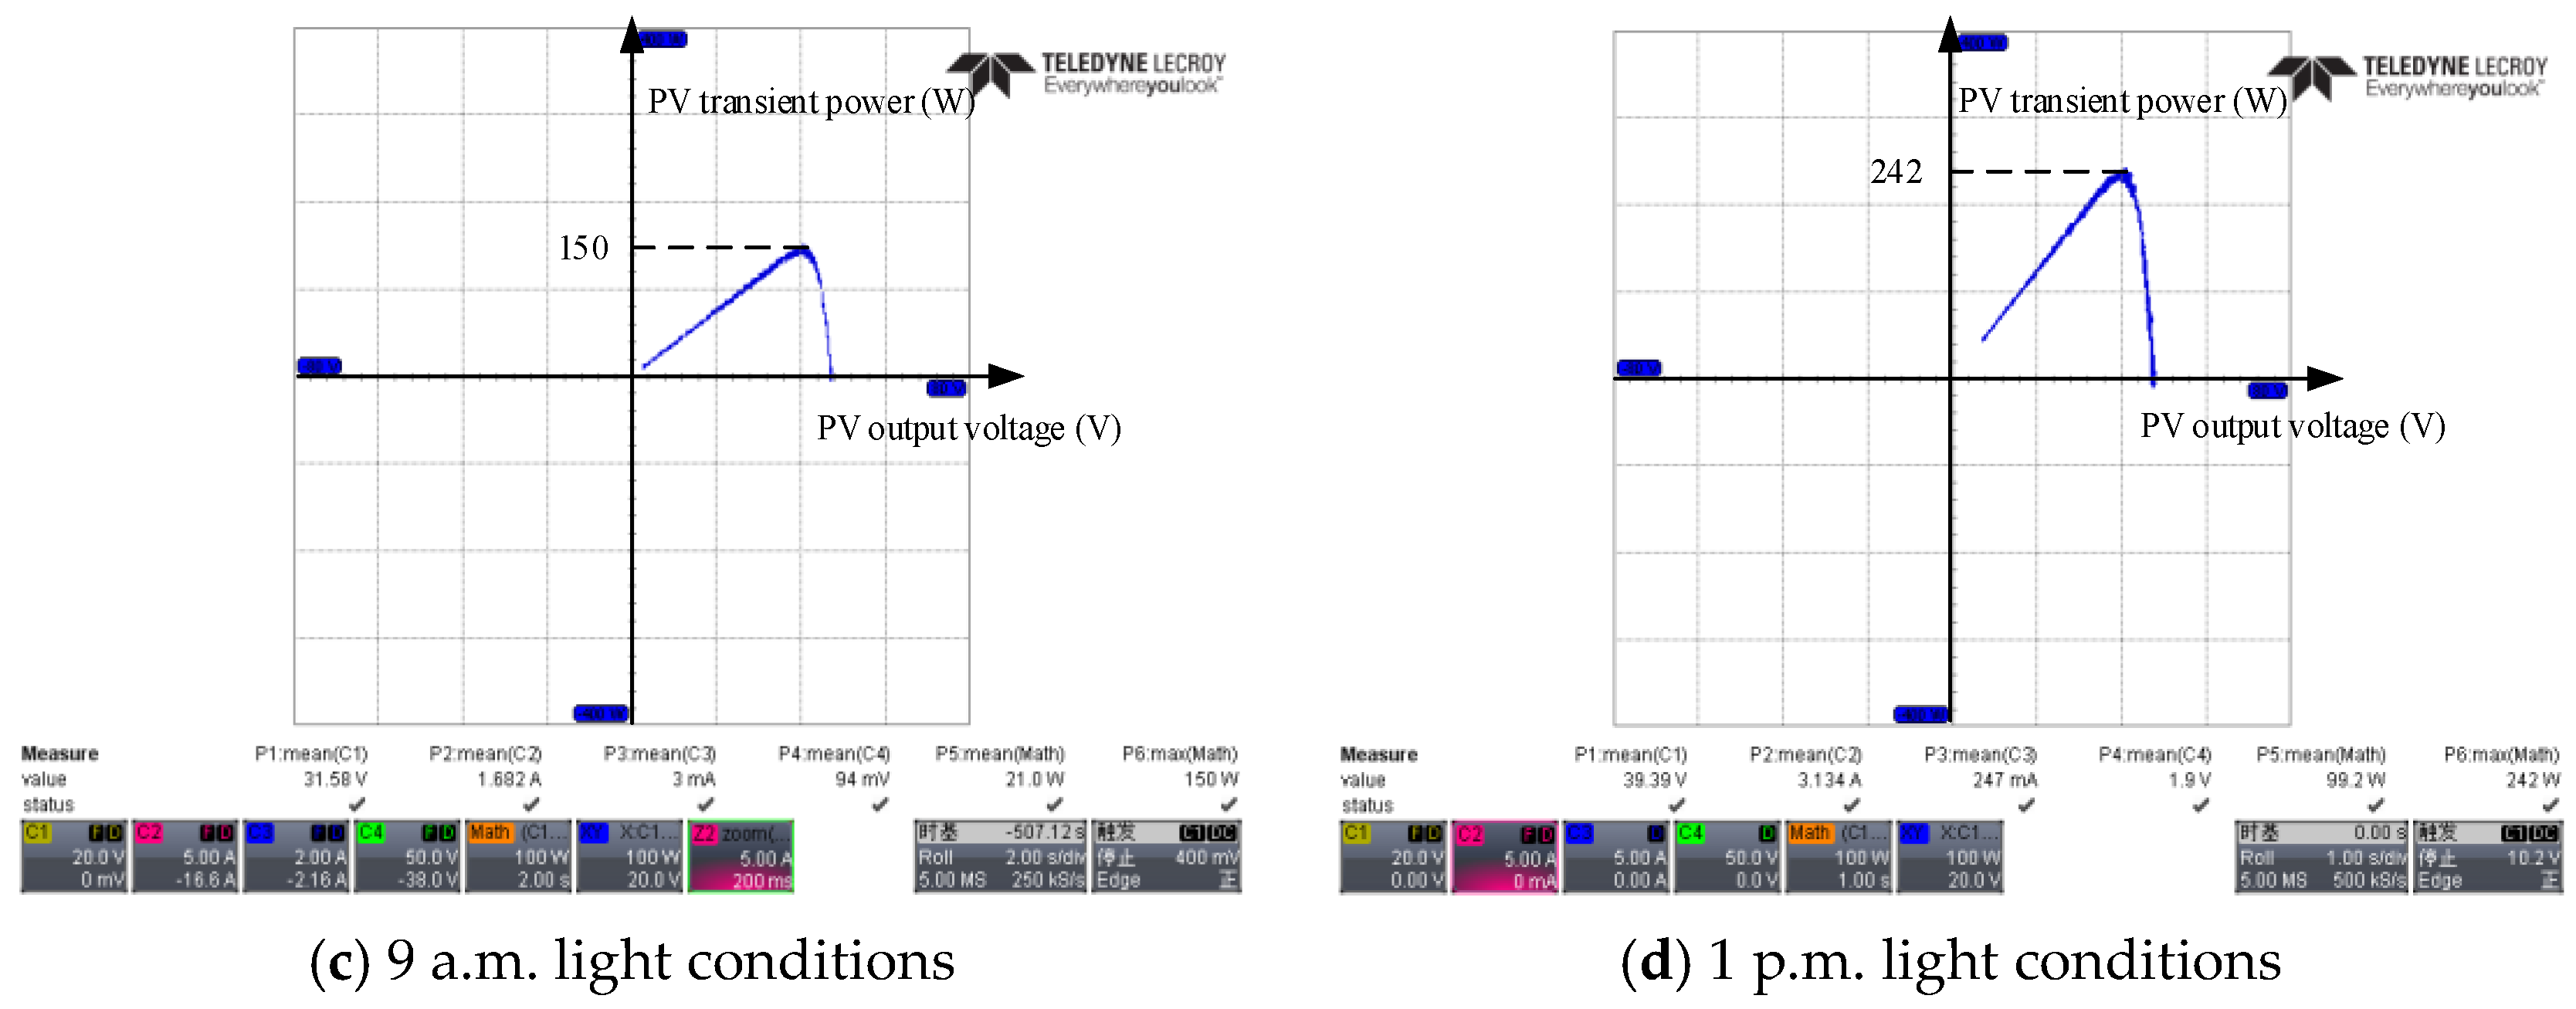
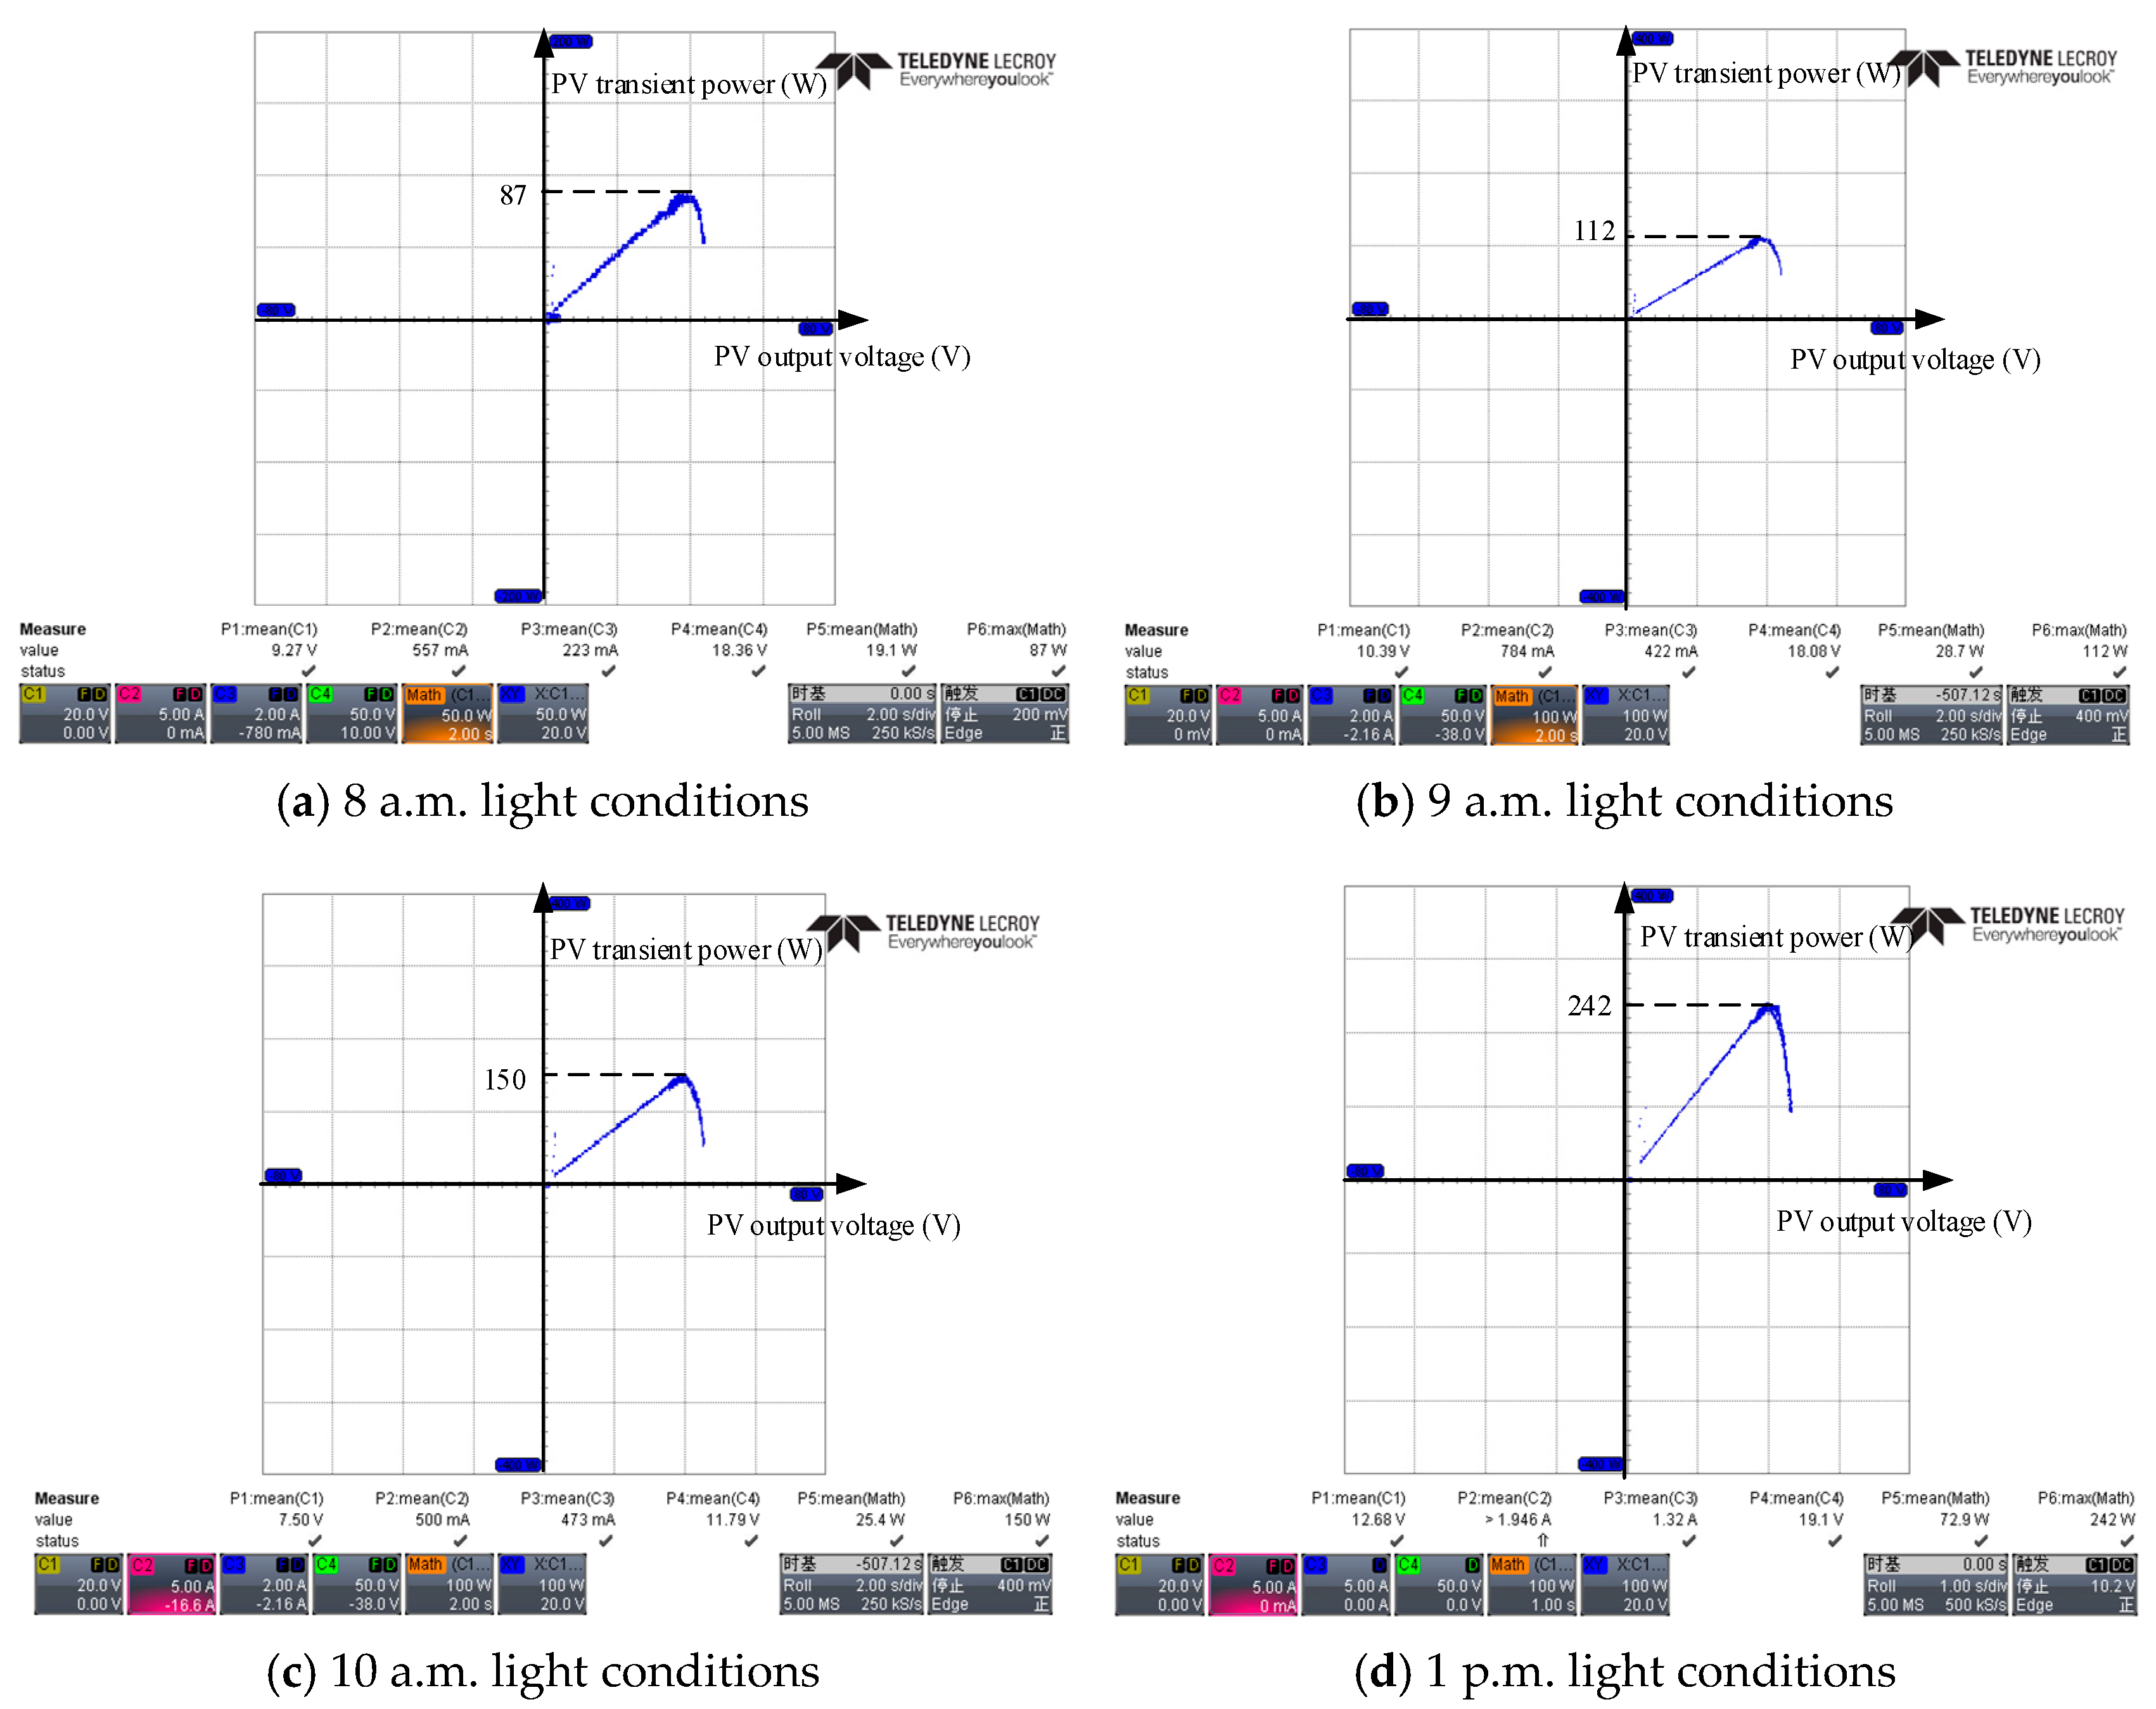
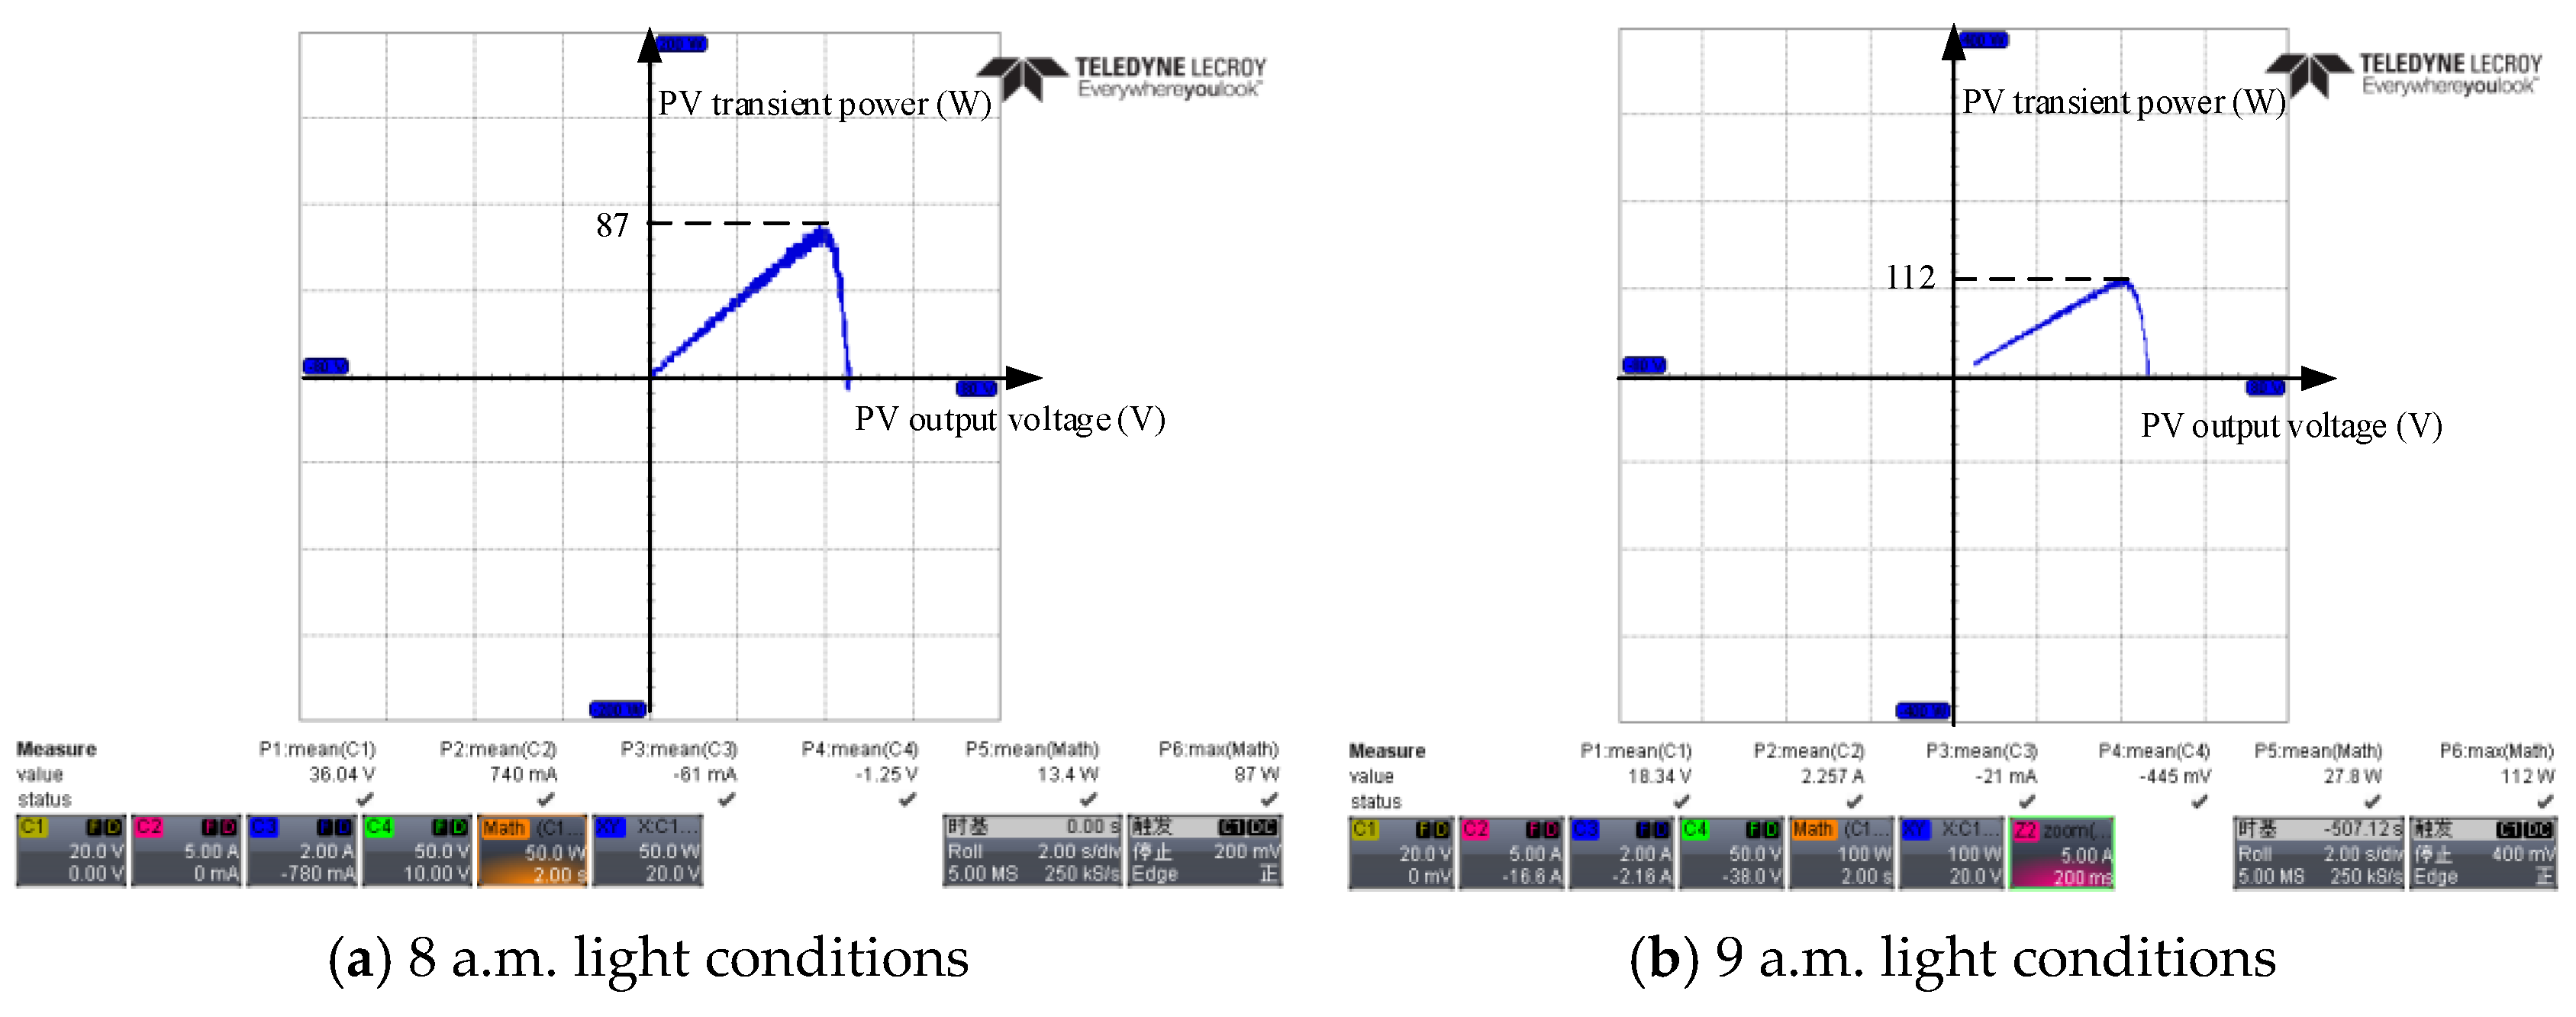
4.2.1. Photovoltaic Output Power Sweeping Test

Before the test under natural light conditions, the maximum power output should be calibrated for the current light, as shown in Figure 26.
Figure 21 shows the photovoltaic panel P-V curve obtained by changing the output duty ratio of the SPPC under different lighting conditions. The horizontal axis is the output voltage of the PV panel and the vertical axis is the instantaneous output power of the PV panel. At different times, (a) the maximum output power of the photovoltaic panel was 87 W, (b) the maximum output power of the photovoltaic panel was 112 W, (c) the maximum output power of the photovoltaic panel was 150 W and (d) the maximum output power of the photovoltaic panel was 242 W.

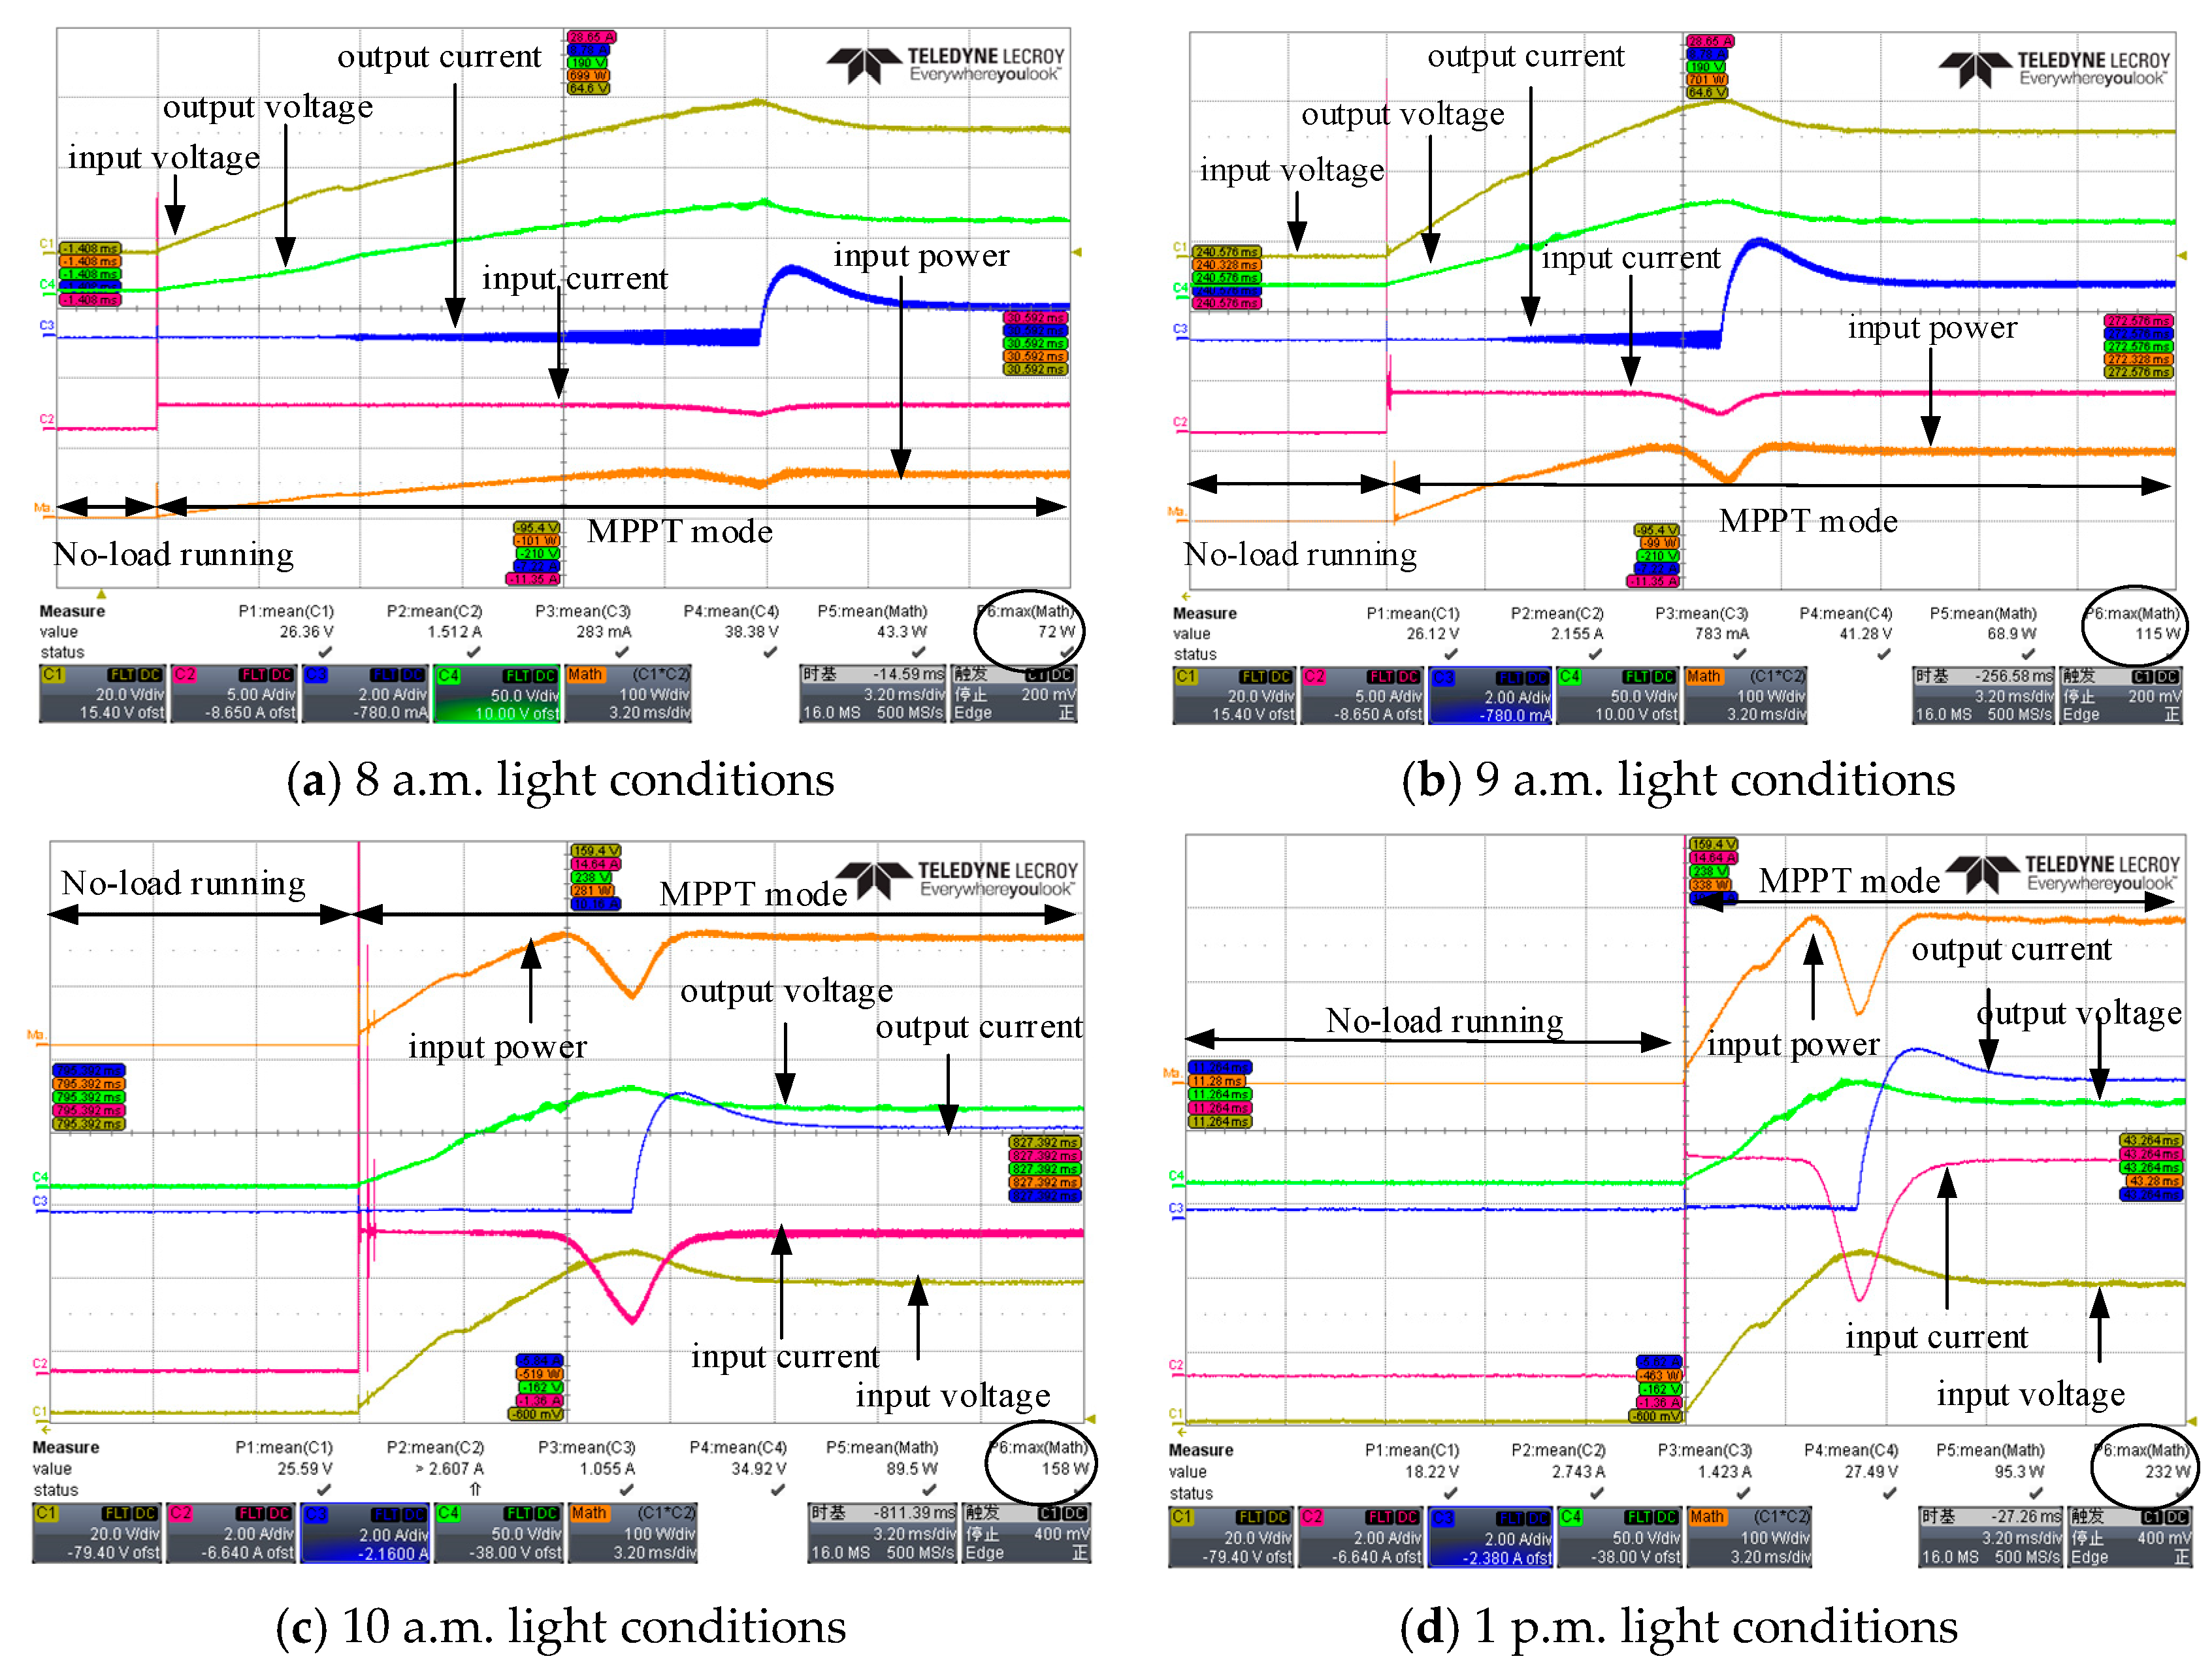
4.2.2. Photovoltaic Maximum Power Tracking Experimental Verification

Figure 27 shows the experimental waveform for the maximum power tracking of the photovoltaic panels in the same environment (same time period), as shown in Figure 26.
Figure 27 shows the photovoltaic panel P-V curve tracked by the system using the incremental conductance method. The horizontal axis is the output voltage of the PV panel and the vertical axis is the instantaneous power output of the PV panel. It can be seen that under the same environmental conditions (same time period), as shown in Figure 26, (a) the system tracked the maximum power output of the photovoltaic panel as 87 W, (b) the system tracked the maximum power output of the photovoltaic panel as 112 W, (c) the system tracked the maximum power output of the photovoltaic panel as 150 W and (d) the system tracked the maximum power output of the photovoltaic panel as 242 W.
Compared to Figure 26, the system accurately tracked the maximum power of the photovoltaic panels under the corresponding environmental conditions.

4.2.3. Start-Up Experiment of the PV Storage System

Figure 28 shows the experimental waveforms of the light storage start-up under the different lighting conditions. The initial value of the duty ratio was determined by the open-circuit voltage method, and the conductance increment method was used after starting. It can be seen that as the system input power waveform rose from zero, (a) the graph tended to steady at 19 ms, (b) the graph tended to steady at 11.2 ms, (c) the graph tended to steady at 9.6 ms and (d) the graph tended to steady at 7.3 ms. As can be seen from the figure, the photovoltaic panel quickly and accurately tracked the maximum power point of the photovoltaic panel under the current light intensity for the corresponding lighting conditions.

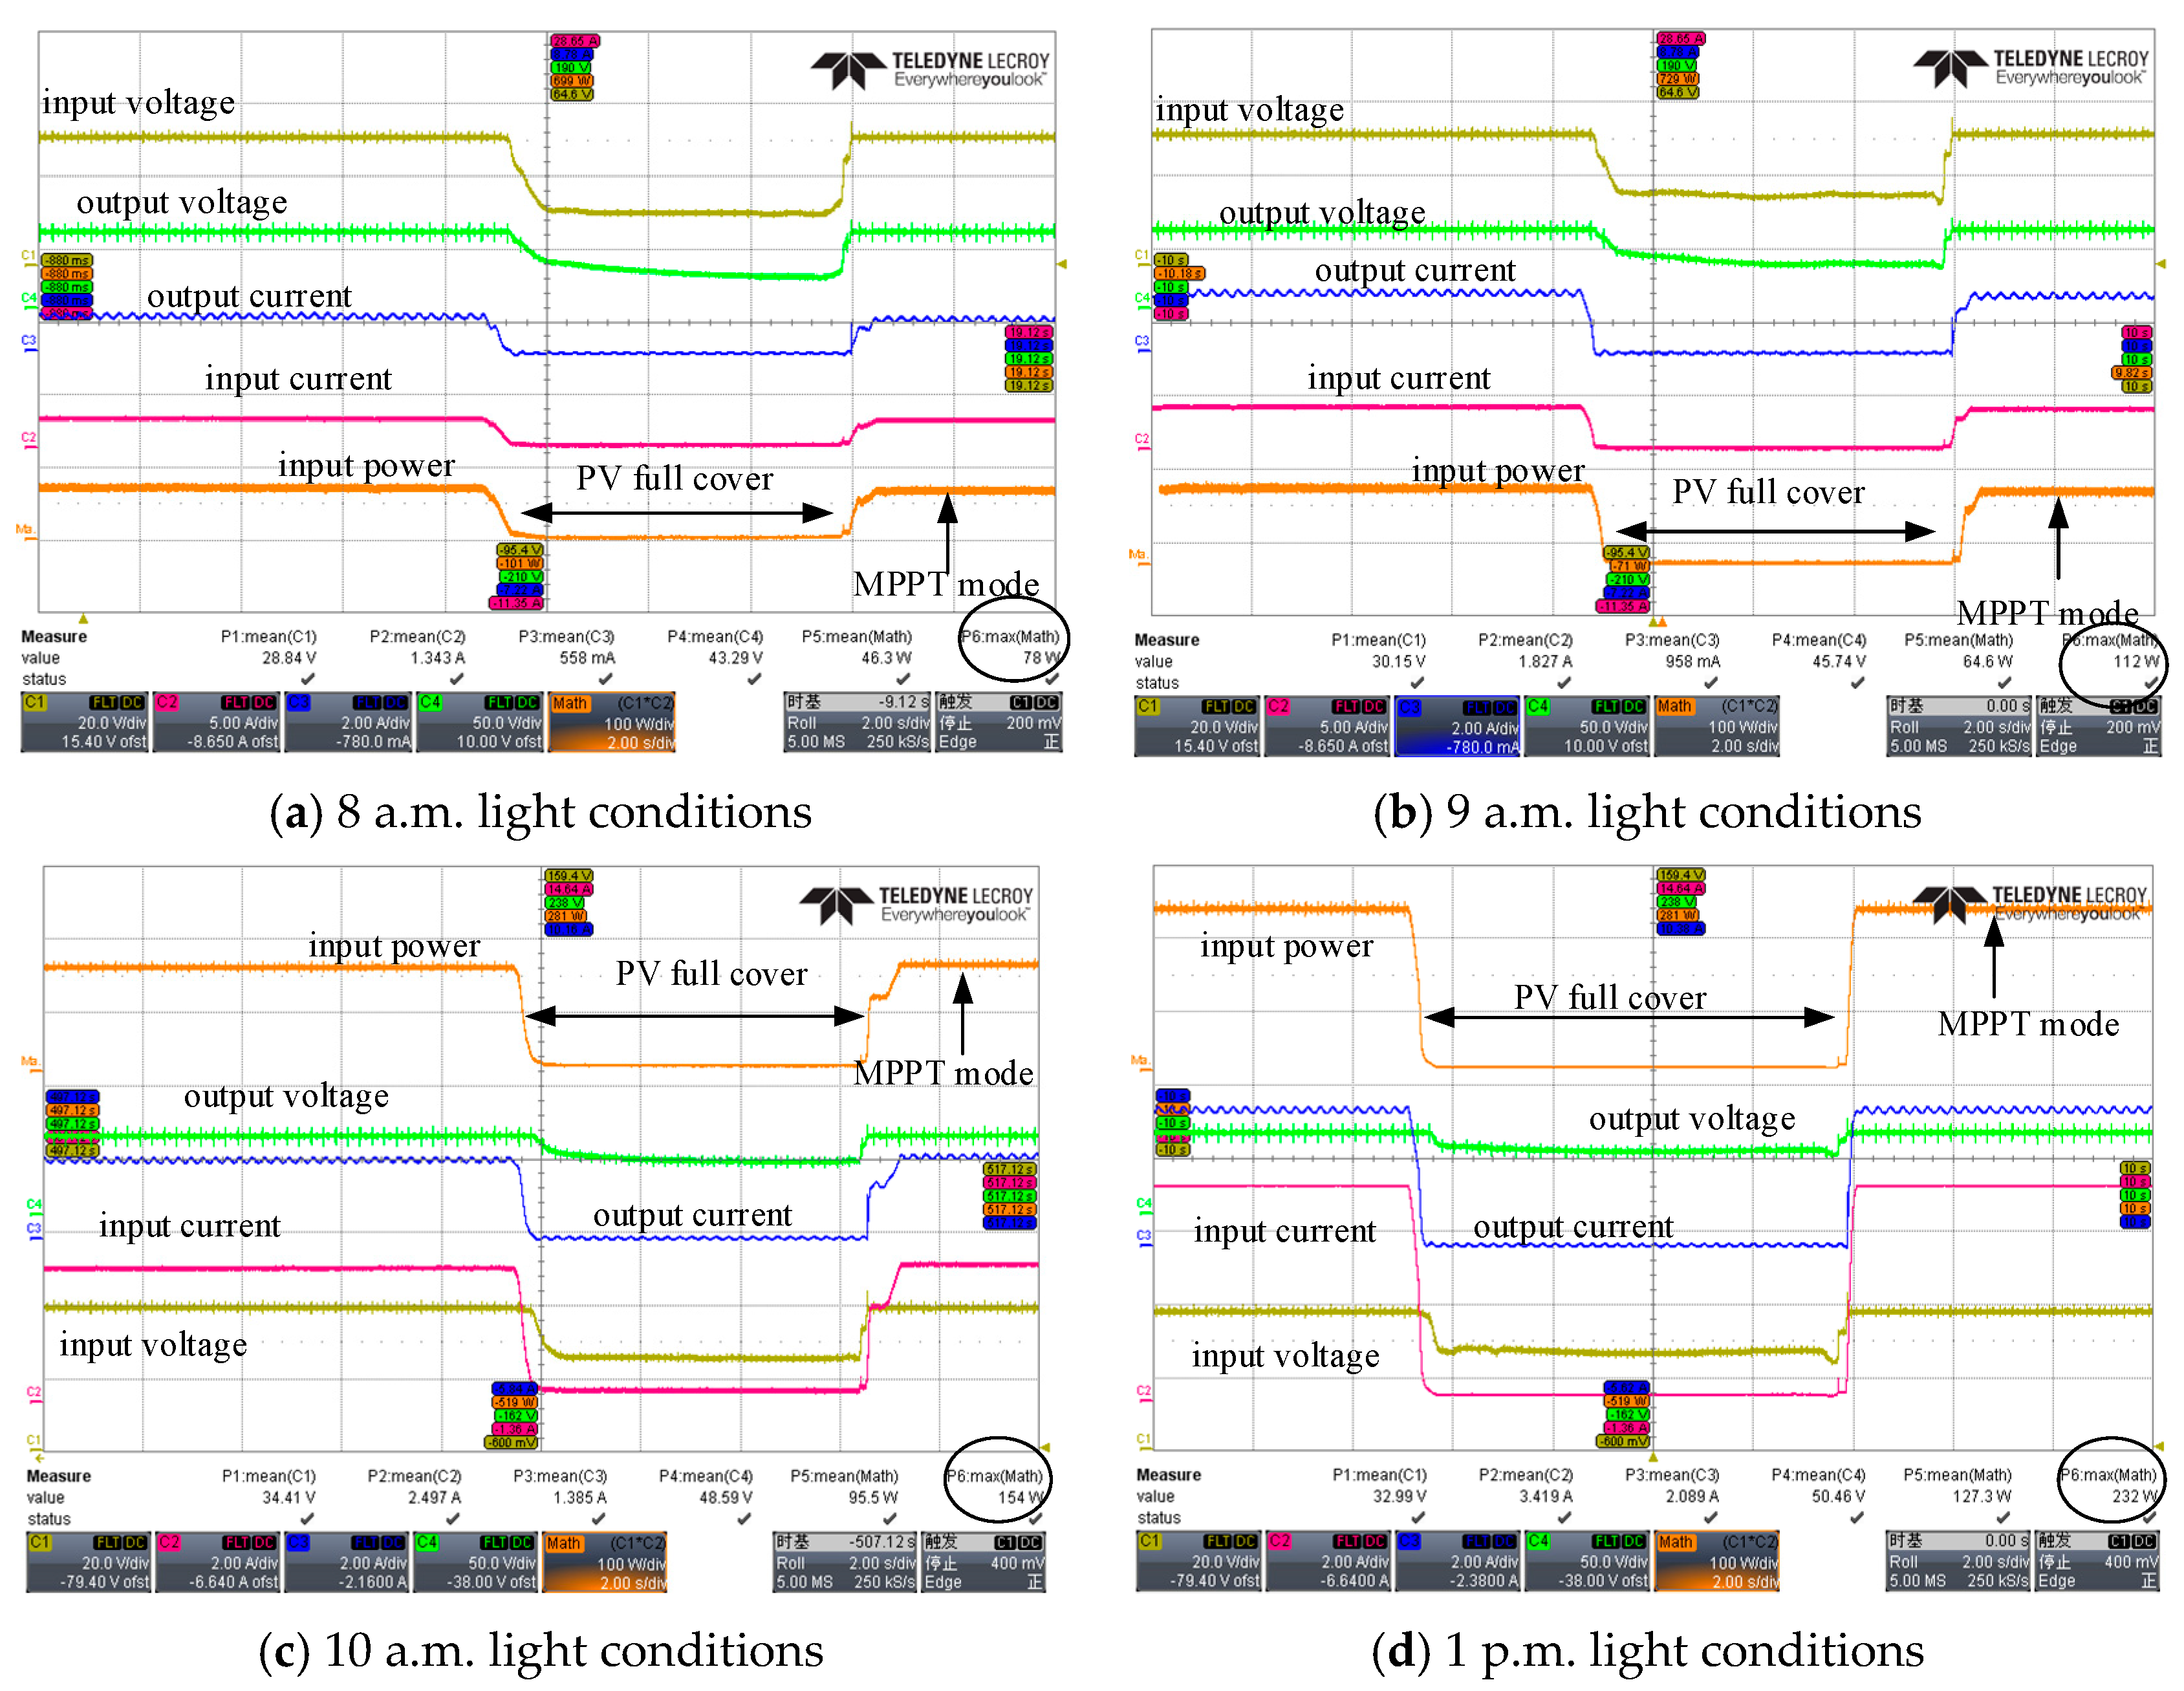
4.2.4. Photovoltaic Full Cover and Tracking Experiment

Figure 29 shows the experimental waveforms of the photovoltaic full covering and tracking under the different lighting conditions of the system. The photovoltaic panel was fully covered during the steady-state operation of the photovoltaic panel. When the photovoltaic panel was covered, the output of the photovoltaic panel decreased rapidly, and then the cover was removed. (a) The output power of the photovoltaic panel returned to the maximum power point under the current illumination conditions within 0.6 s, (b) the output power of the photovoltaic panel returned to the maximum power point under the current illumination conditions within 0.48 s, (c) the output power of the photovoltaic panel returned to the maximum power point under the current illumination conditions within 0.8 s and (d) the output power of the photovoltaic panel returned to the maximum power point under the current illumination conditions within 0.32 s. A conductance increment of about 100 W was compared to the power transmission in the boost cascade transmission mode and a similar response time for the MPPT recovery was obtained.
The results of the outdoor optical storage start-up test, the photovoltaic full cover test and the steady-state operation test at the different power levels showed that the conductance increment method based on the SPPC can realize the dynamic MAXIMUM power point tracking under constant illumination and changing meteorological conditions, which is consistent with the simulation results above.

5. Conclusions

Starting with improving the efficiency of the energy transmission between the photovoltaic and lithium batteries, this topic proposed a solution for the efficient power transmission between photovoltaic and lithium battery packs with similar voltage levels. The specific work completed includes the following.
A. The basic topology Cuk converter of the SPPC was analyzed, and the input–output relationship of the basic topology was verified using the LTspice simulation. The SPPC transformer, diode, input and output inductance value; the input and output capacitance value and other parameters were selected and designed based on the photovoltaic panel selected in the topic. The average switching model of the SPPC was established and the frequency domain models of the Cuk circuit, isolated Cuk circuit output, SPPC output, isolated Cuk circuit input and SPPC isolated input were analyzed to verify the feasibility of the SPPC. The system simulation was carried out using the PSIM simulation software to verify the maximum power tracking under varying lighting conditions.
B. The efficiency of the SPPC in the laboratory environment was tested. The experiment showed that the TRANSMISSION efficiency of the SPPC reached 95–98% in the 87 W–242 W power range. The light storage start-up test under natural light conditions was completed, and the maximum power point of the photovoltaic panel under the current light intensity was accurately tracked. The dynamic effect was tested and verified using the photovoltaic full cover experiment.

Author Contributions

Conceptualization, W.J. and X.H.; methodology, X.H.; software, S.H.; validation, W.J., S.H. and X.H.; formal analysis, X.H.; investigation, J.L.; resources, T.K.; data curation, X.H.; writing—original draft preparation, X.H.; writing—review and editing, S.H.; visualization, X.H.; supervision, J.L.; project administration, J.L.; funding acquisition, J.L. All authors have read and agreed to the published version of the manuscript.

Funding

This research received no external funding.

Data Availability Statement

Not applicable.

Conflicts of Interest

The authors declare no conflict of interest.

References

  1. Chi, C.-J. Analysis of Energy Technology Development Strategy in Shanghai. In Proceedings of the 2006 International Conference on Management Science and Engineering, Lille, France, 5–7 October 2006; pp. 1831–1835. [Google Scholar]
  2. Amrouche, S.O.; Rekioua, D.; Rekioua, T.; Bacha, S. Overview of energy storage in renewable energy systems. In Proceedings of the 2015 3rd International Renewable and Sustainable Energy Conference (IRSEC), Marrakech, Morocco, 10–13 December 2015; pp. 1–6. [Google Scholar]
  3. Carrasco, J.M. Power electronics for the integration of renewable energies into smart grids. In Proceedings of the 2011 International Conference on Power Engineering, Energy and Electrical Drives, Malaga, Spain, 11–13 May 2011; p. 1. [Google Scholar]
  4. Lucchese, F.C.; Canha, L.N.; Brignol, W.S.; Hammerschmitt, B.K.; Da Silva, L.N.F.; Martins, C.C. Energy Storage Systems Role in Supporting Renewable Resources: Global Overview. In Proceedings of the 2019 54th International Universities Power Engineering Conference (UPEC), Bucharest, Romania, 3–6 September 2019; pp. 1–6. [Google Scholar] [CrossRef]
  5. Ogunniyi, E.O.; Pienaar, H. Overview of battery energy storage system advancement for renewable (photovoltaic) energy applications. In Proceedings of the 2017 International Conference on the Domestic Use of Energy (DUE), Cape Town, South Africa, 4–5 April 2017; pp. 233–239. [Google Scholar]
  6. Gebreslassie, B.; Kelam, A.; Zayegh, A. Energy saving, in commercial building by improving photovoltaic cell efficiency. In Proceedings of the 2017 Australasian Universities Power Engineering Conference (AUPEC), Melbourne, Australia, 19–22 November 2017; pp. 1–6. [Google Scholar]
  7. Wang, J.; Yang, C.; Liu, F.; Meng, X.; Wang, J.; Liu, J. The development and utilization of new clean energy. In Proceedings of the 2016 IEEE International Conference on Power and Renewable Energy (ICPRE), Shanghai, China, 21–23 October 2016; pp. 639–643. [Google Scholar]
  8. Al-Soeidat, M.R.; Aljarajreh, H.; Khawaldeh, H.; Lu, D.D.-C.; Zhu, J. Three-Port DC–DC Converter for Integrated PV-Battery System. IEEE J. Emerg. Sel. Top. Power Electron. 2020, 8, 3423–3433. [Google Scholar] [CrossRef]
  9. Lakshmi, J.J.; Shankar, N.; Maheswari, K.; Manivannan, S. Improved Bidirectional Converter for PV System with Battery Storage. In Proceedings of the 2019 International Conference on Advances in Computing and Communication Engineering (ICACCE), Sathyamangalam, India, 4–6 April 2019; pp. 1–4. [Google Scholar]
  10. Nedyalkov, I.; Arnaudov, D.; Hinov, N.; Kanchev, H. Modelling of an off-grid photovoltaic power supplying system for telecommunication equipment. In Proceedings of the 2017 15th International Conference on Electrical Machines, Drives and Power Systems (ELMA), Sofia, Bulgaria, 1–3 June 2017; pp. 64–69. [Google Scholar]
  11. Matsuo, H.; Lin, W.; Kurokawa, F.; Shigemizu, T.; Watanabe, N. Characteristics of the multiple-input DC-DC converter. IEEE Trans. Ind. Electron. 2004, 51, 625–631. [Google Scholar] [CrossRef]
  12. Bhunia, M.; Gupta, R.; Subudhi, B. Cascaded DC-DC converter for a reliable standalone PV fed DC load. In Proceedings of the 2014 IEEE 6th India International Conference on Power Electronics (IICPE), Kurukshetra, India, 8–10 December 2014; pp. 1–6. [Google Scholar]
  13. Simes, M.G.; Farret, F.A. POWER ELECTRONICS. In IEEE Modeling Power Electronics and Interfacing Energy Conversion Systems; Wiley-IEEE Press: Piscataway, NJ, USA, 2017; pp. 61–81. [Google Scholar]
  14. Suntio, T.; Kuperman, A. Comments on “An Efficient Partial Power Processing DC/DC Converter for Distributed PV Architectures”. IEEE Trans. Power Electron. 2015, 30, 2372. [Google Scholar] [CrossRef]
  15. Zientarski, J.R.R.; Martins, M.L.D.S.; Pinheiro, J.R.; Hey, H.L. Evaluation of Power Processing in Series-Connected Partial-Power Converters. IEEE J. Emerg. Sel. Top. Power Electron. 2019, 7, 343–352. [Google Scholar] [CrossRef]
Figure 1. Reconfigurable three-port DC-DC converter for a battery system and integrated PV.
Energies 16 03057 g001
Figure 2. Bidirectional converter.
Energies 16 03057 g002
Figure 3. Schemes follow the same formatting.
Energies 16 03057 g003
Figure 4. A series partial power converter with its own voltage source V3.
Energies 16 03057 g004
Figure 5. Series partial power converter.
Energies 16 03057 g005
Figure 6. SPPC topology based on the isolated Cûk infrastructure.
Energies 16 03057 g006
Figure 7. Isolated Cûk converter.
Energies 16 03057 g007
Figure 8. Diagram of the switch status (control duty cycle d) with I1 and V2.
Energies 16 03057 g008
Figure 9. Quivalent diagram of the switching period average method.
Energies 16 03057 g009
Figure 10. Cûk circuit AC sweep circuit diagram.
Energies 16 03057 g010
Figure 11. AC sweeping result diagram of the isolated Cûk circuit.
Energies 16 03057 g011
Figure 12. Isolated Cûk circuit AC sweep circuit diagram.
Energies 16 03057 g012
Figure 13. AC sweeping result diagram of the isolated Cûk circuit.
Energies 16 03057 g013
Figure 14. AC sweeping circuit diagram of the series partial power conversion circuit.
Energies 16 03057 g014
Figure 15. Simulation result diagram of the series partial power conversion circuit.
Energies 16 03057 g015
Figure 16. AC sweeping circuit diagram of the series partial power conversion circuit.
Energies 16 03057 g016
Figure 17. Frequency domain characteristics of the duty cycle ratio of the input voltage and open-loop frequency domain characteristics after compensation of the series partial power converter.
Energies 16 03057 g017
Figure 18. System control module diagram.
Energies 16 03057 g018
Figure 19. Physical drawing of the hardware circuit.
Energies 16 03057 g019
Figure 20. The output load current was 1.574 A in the laboratory conditions.
Energies 16 03057 g020
Figure 21. The output load current was 2.051 A in the laboratory conditions.
Energies 16 03057 g021
Figure 22. The output load current was 2.696 A in the laboratory conditions.
Energies 16 03057 g022
Figure 23. The output load current was 4.344 A in the laboratory conditions.
Energies 16 03057 g023
Figure 24. Graph of the transmission efficiency changing with the system input power in the laboratory environment.
Energies 16 03057 g024
Figure 25. Low-voltage optical storage system test platform.
Energies 16 03057 g025
Figure 26. Sweeping waveform for the output power of the photovoltaic panel under different illumination conditions.
Energies 16 03057 g026aEnergies 16 03057 g026b
Figure 27. Experimental waveform for the maximum power tracking of the photovoltaic panels under different lighting conditions.
Energies 16 03057 g027
Figure 28. Experimental waveforms of the light storage start-up under the different illumination conditions.
Energies 16 03057 g028
Figure 29. The experimental waveform of the photovoltaic input suddenly dropped under different illumination conditions.
Energies 16 03057 g029
Table 1. Four quadrant characteristics of the controlled current sources.
QuadrantΔVI2p
1>0>0absorb
2<0>0emit
3<0<0emit
4>0<0absorb
Table 2. Component parameter.
TitleValue
Input inductance L1 (µH)180
Output inductance L1 (µH)37
Input capacitance C1 (µF)2.2
Input capacitance C2 (µF)60
Ratio of the transformer2:1
Output capacitance C4 (µF)470
Original side inductance L7 (µH)400
Secondary side inductance L8 (µH)100
Table 3. Converter test main parameters.
System ParameterValue
Input terminal voltage (V)0~50
Output open-circuit voltage (V)54.6
Switching frequency (kHz)50
Input and output capacitors (µF)470
Input inductance (µH)180
Output inductance (µH)37
Disclaimer/Publisher’s Note: The statements, opinions and data contained in all publications are solely those of the individual author(s) and contributor(s) and not of MDPI and/or the editor(s). MDPI and/or the editor(s) disclaim responsibility for any injury to people or property resulting from any ideas, methods, instructions or products referred to in the content.

