

A Numerical Investigation of PVT System Performance with Various Cooling Configurations

Abstract
1. Introduction
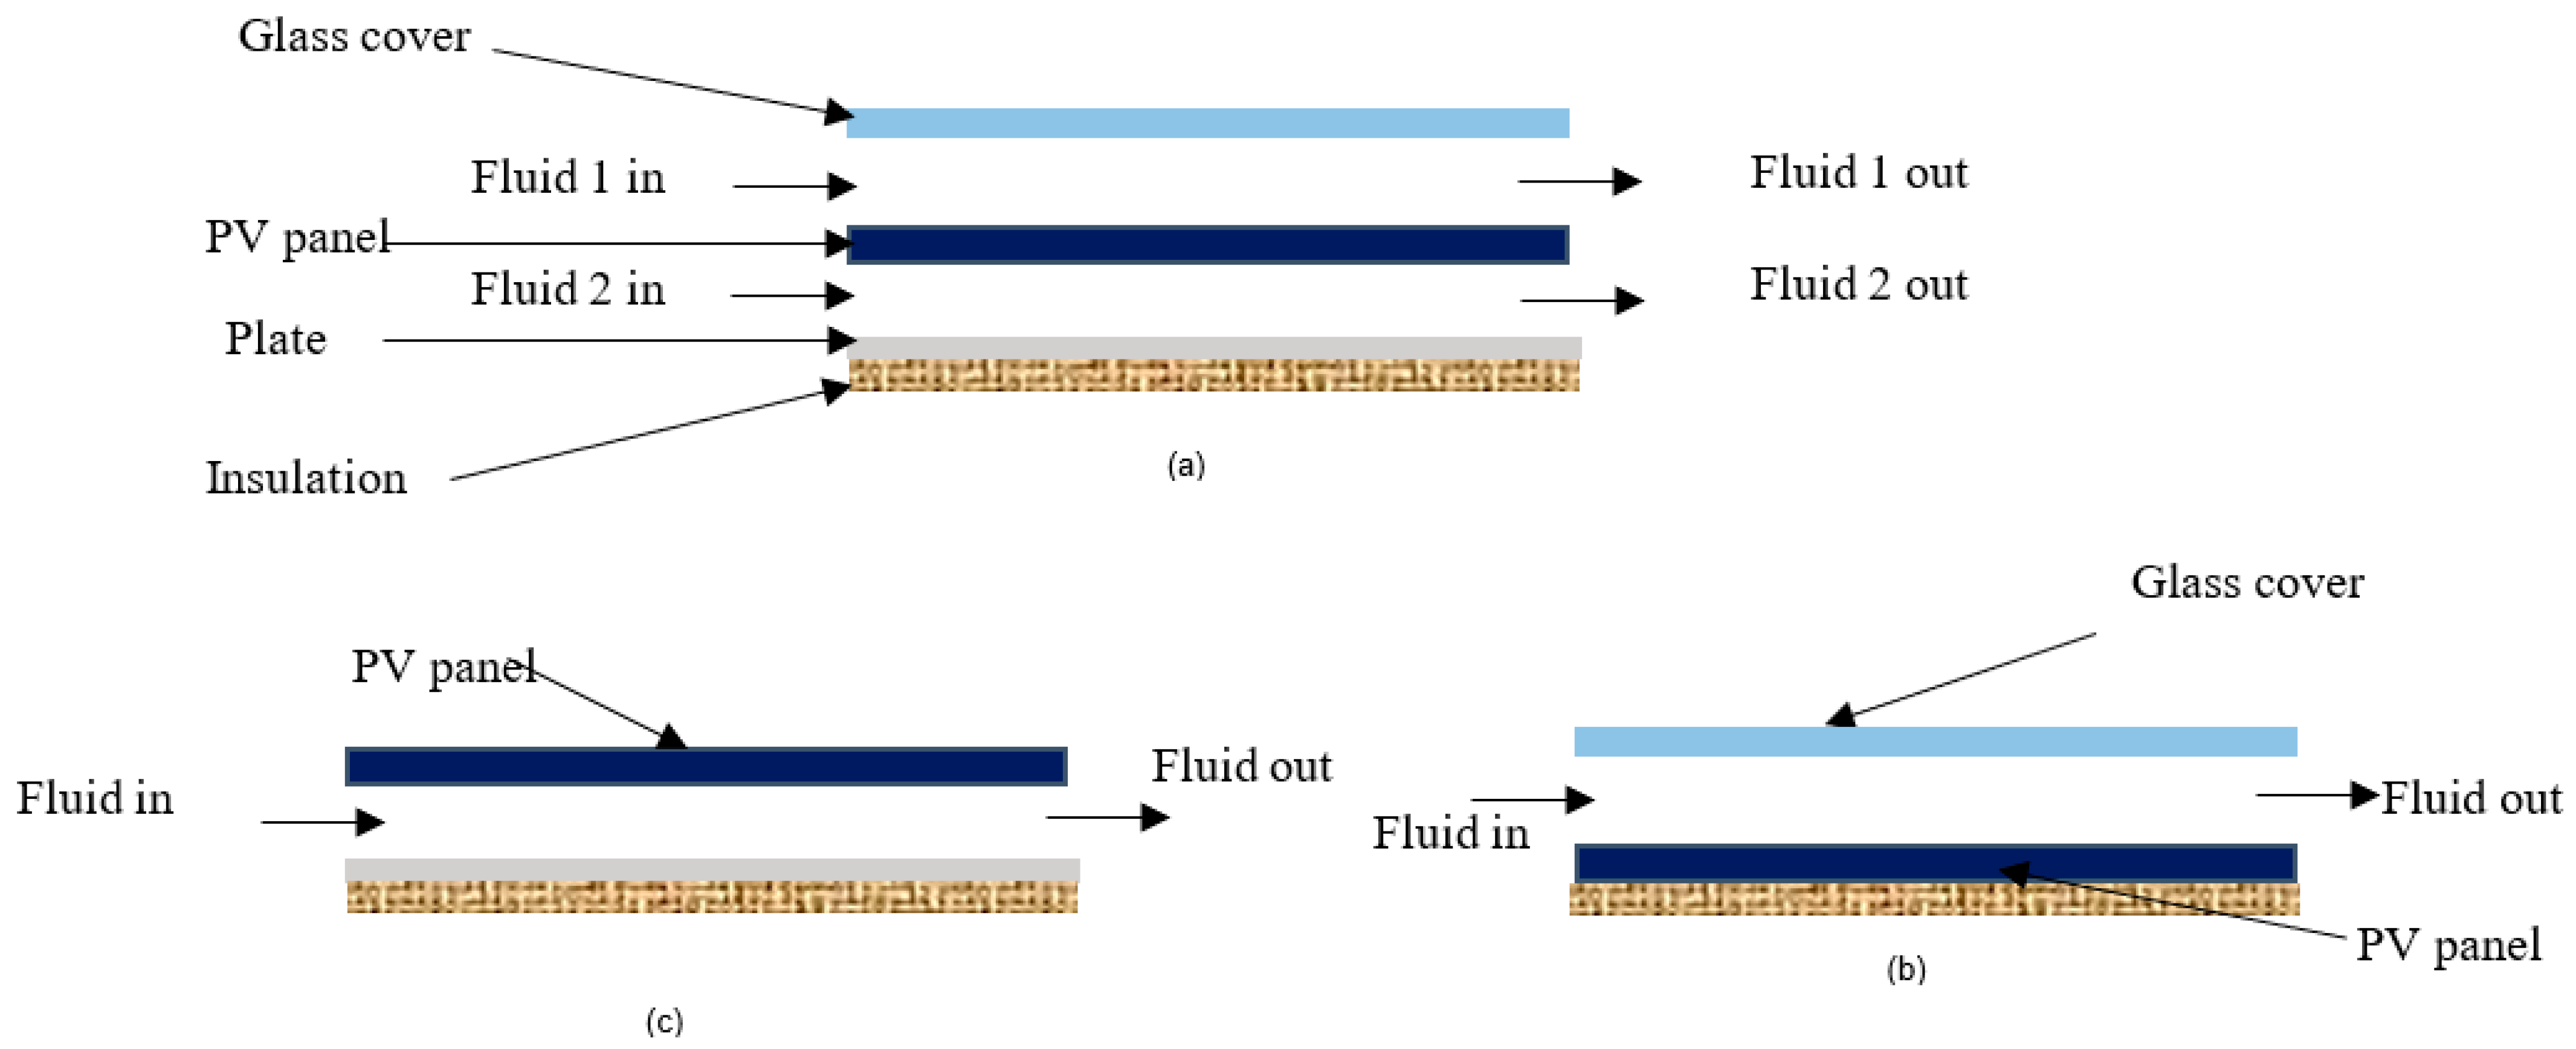
2. PVT System Details
- Two fluids are used to cool the PV panel, one on top and one on bottom.
- Air is on the top side, and water is on the bottom side. (Pattern 1)
- Air is present on both the top and bottom sides. (Pattern 2)
- One fluid (water or air) is used as coolant for PV panel.
- Air is on the top side. (Pattern 3)
- Air is on the bottom side. (Pattern 4)
- Water is on the bottom side. (Pattern 5)
3. Mathematical Model
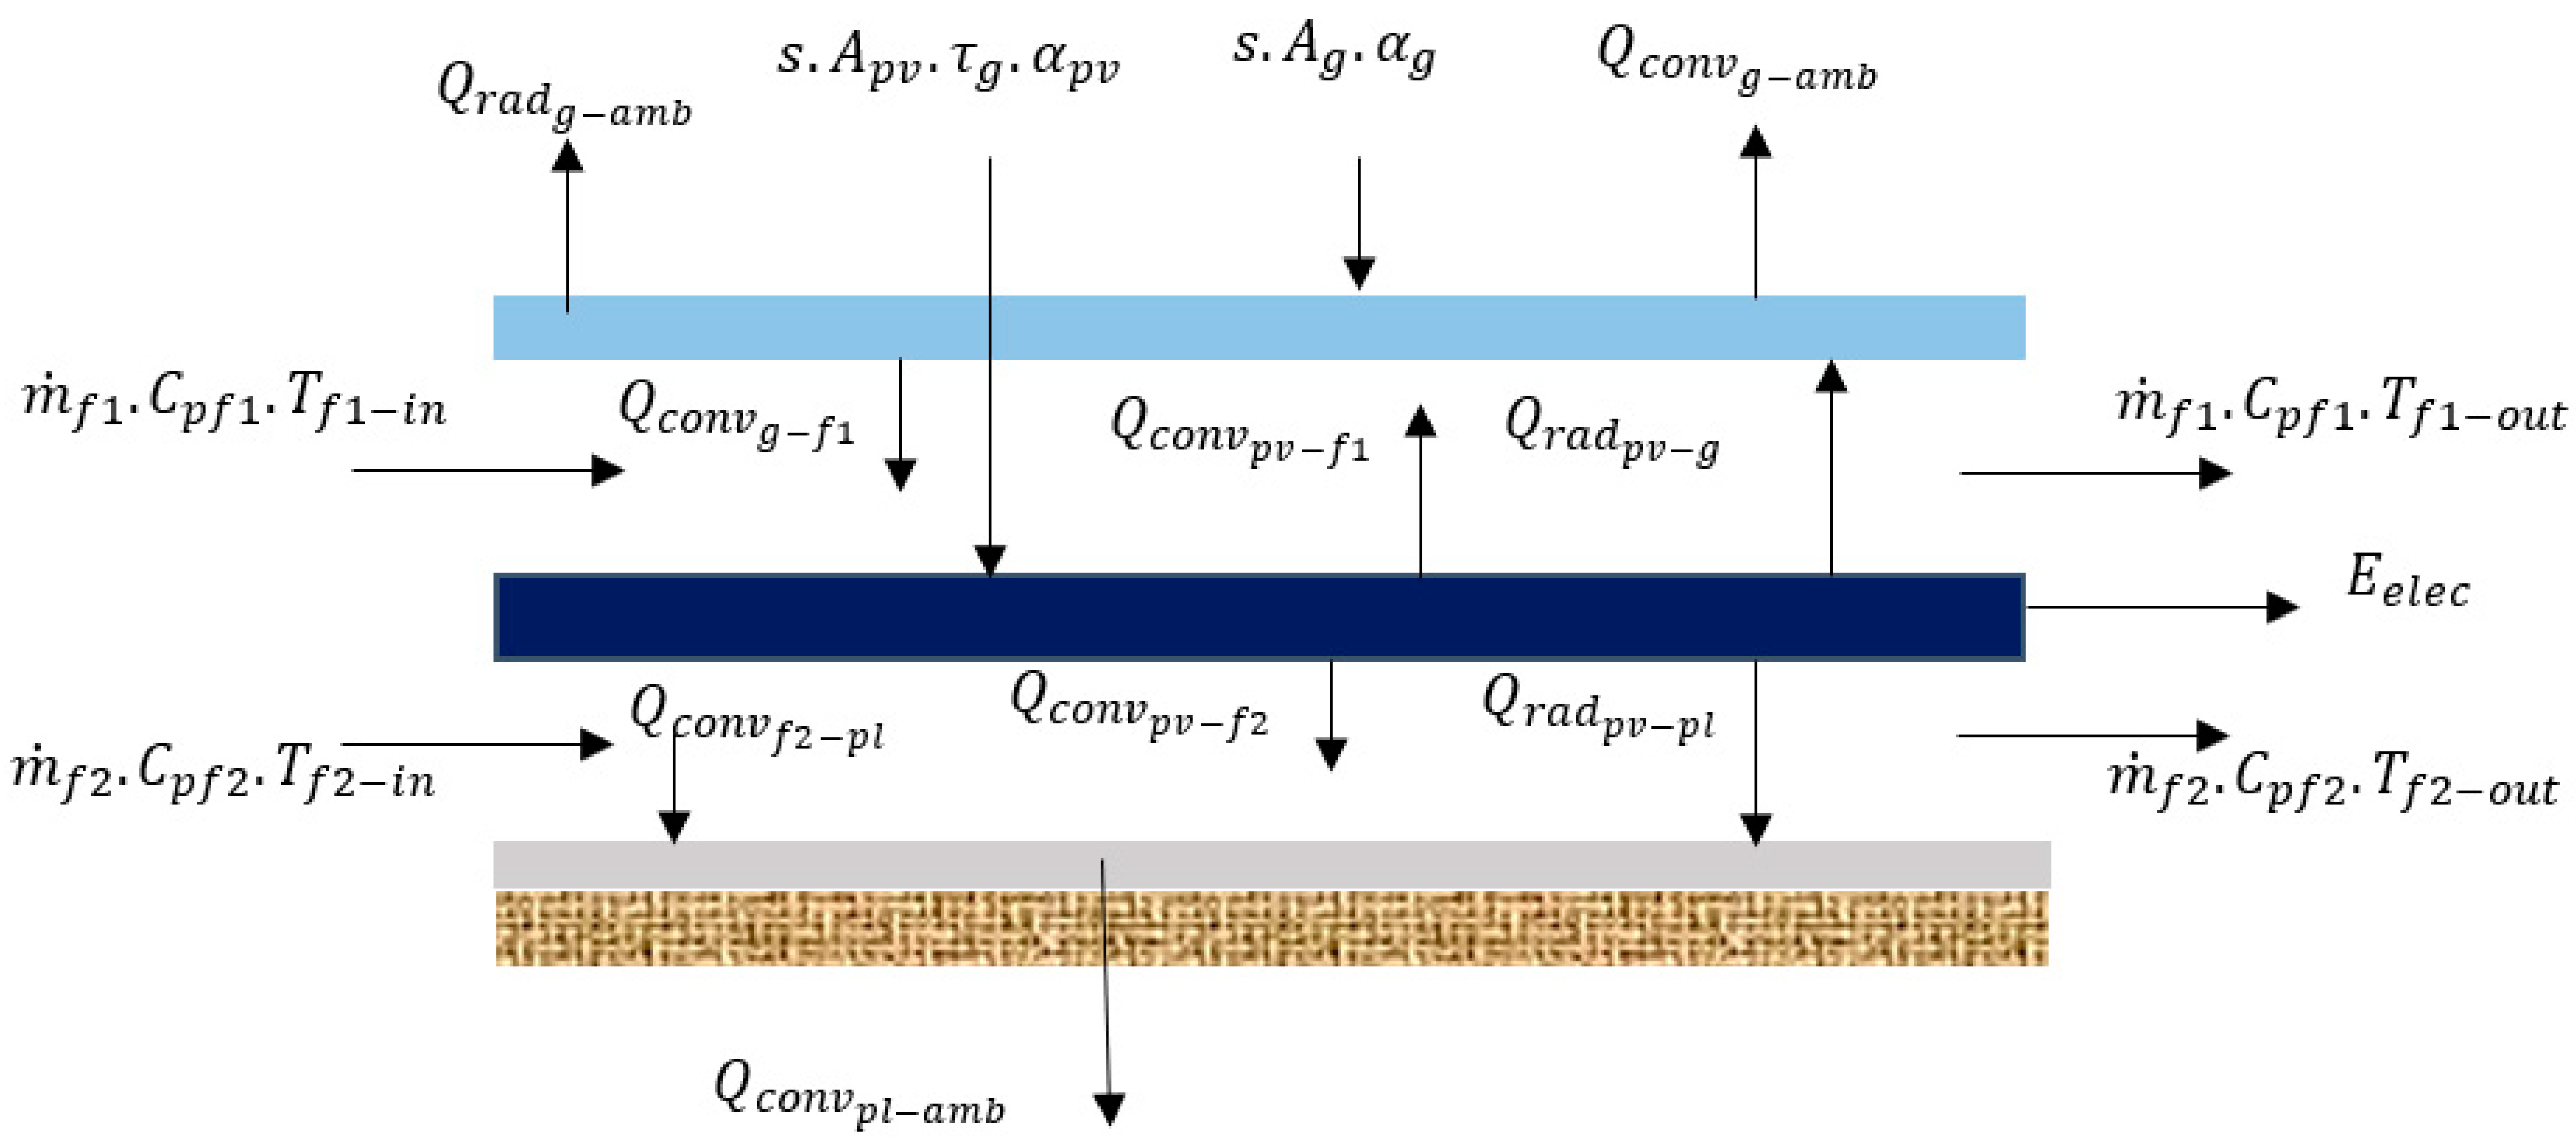
3.1. Energy Model
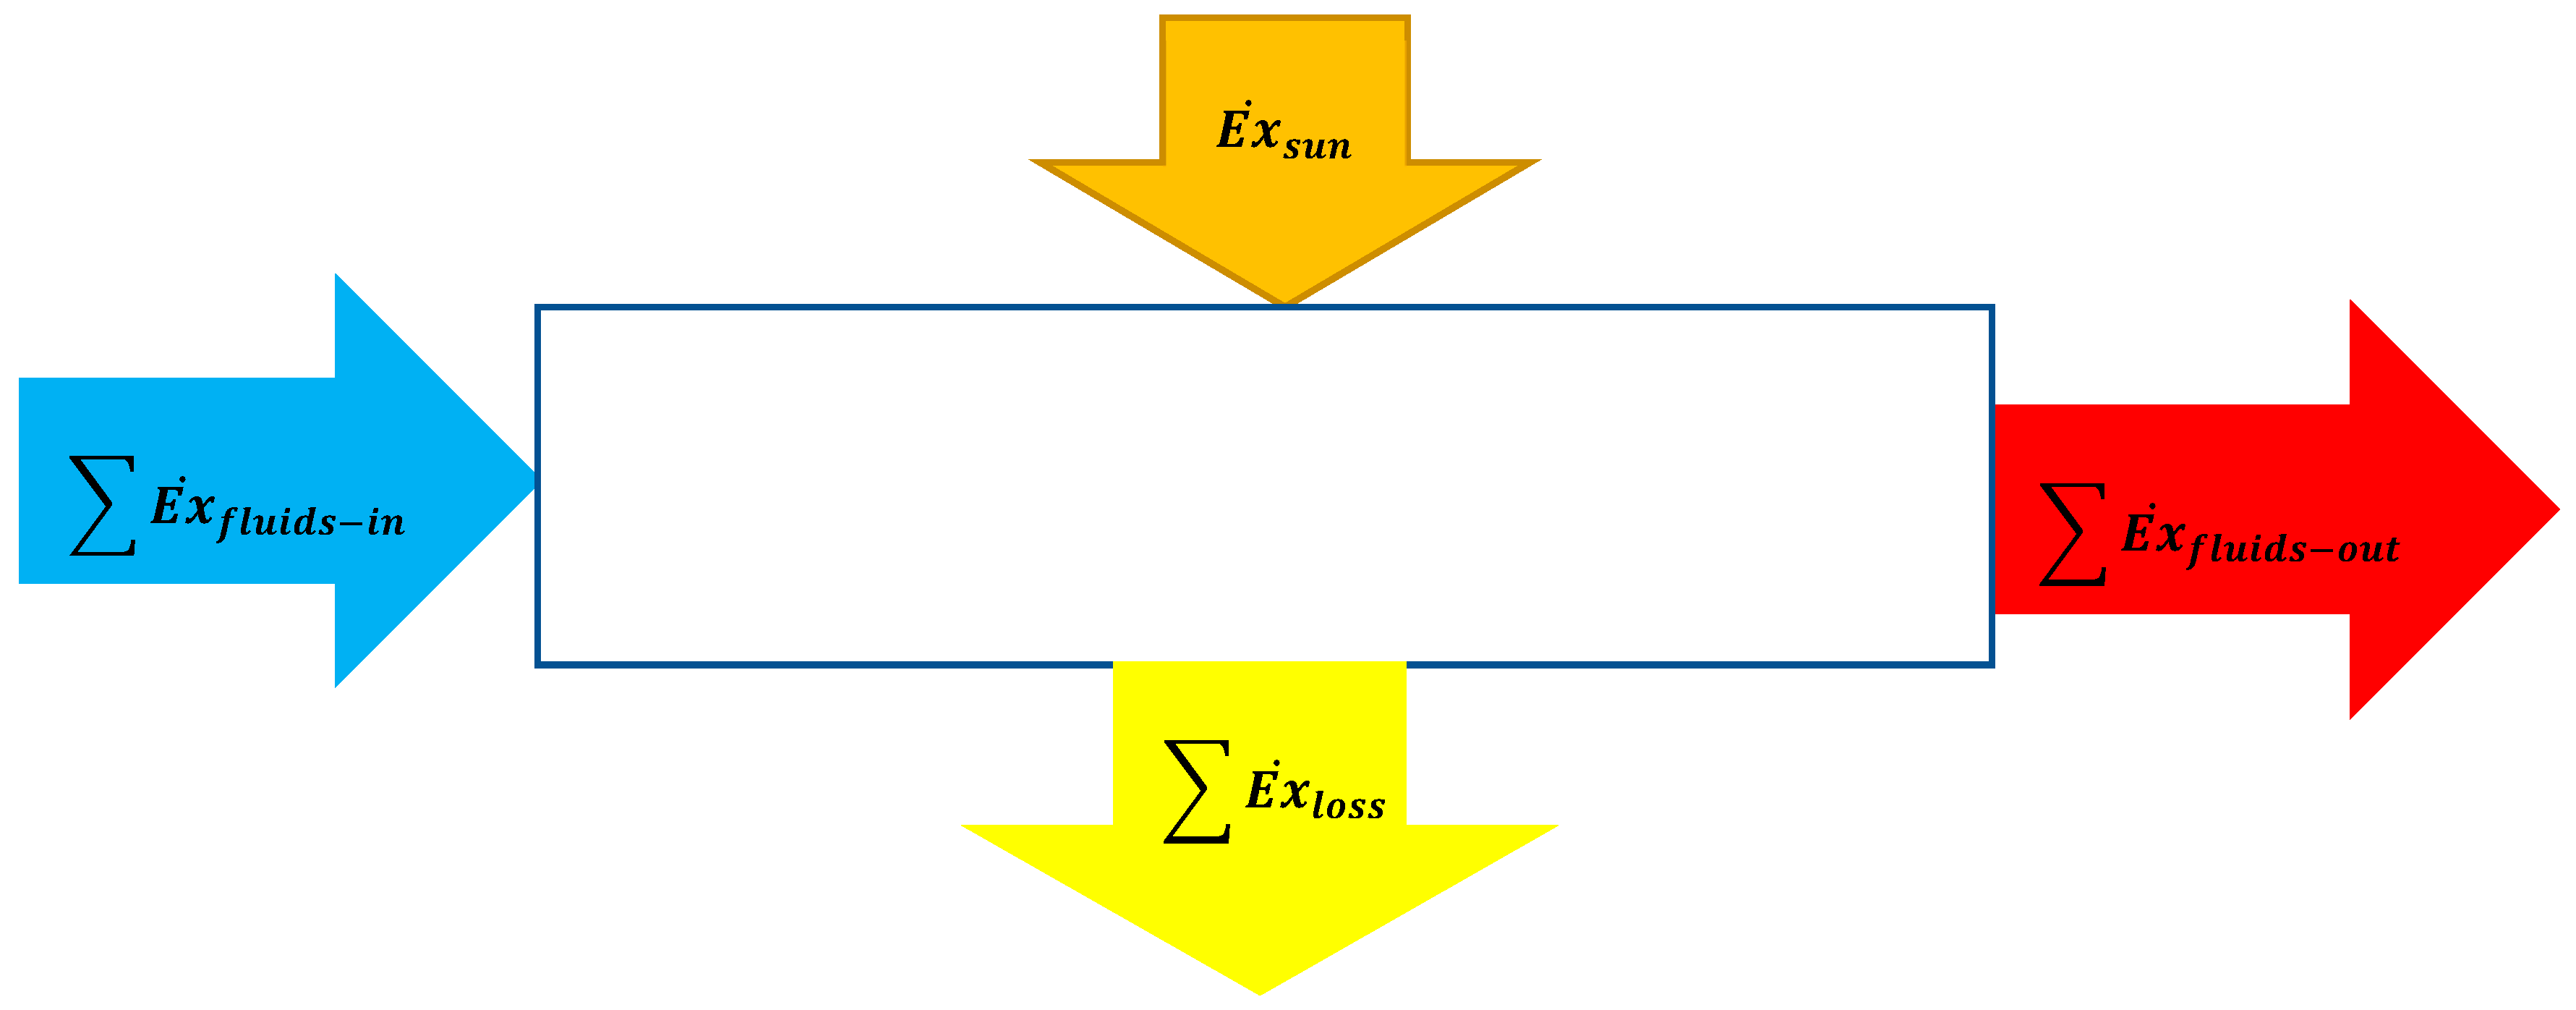
3.2. Exergy Model
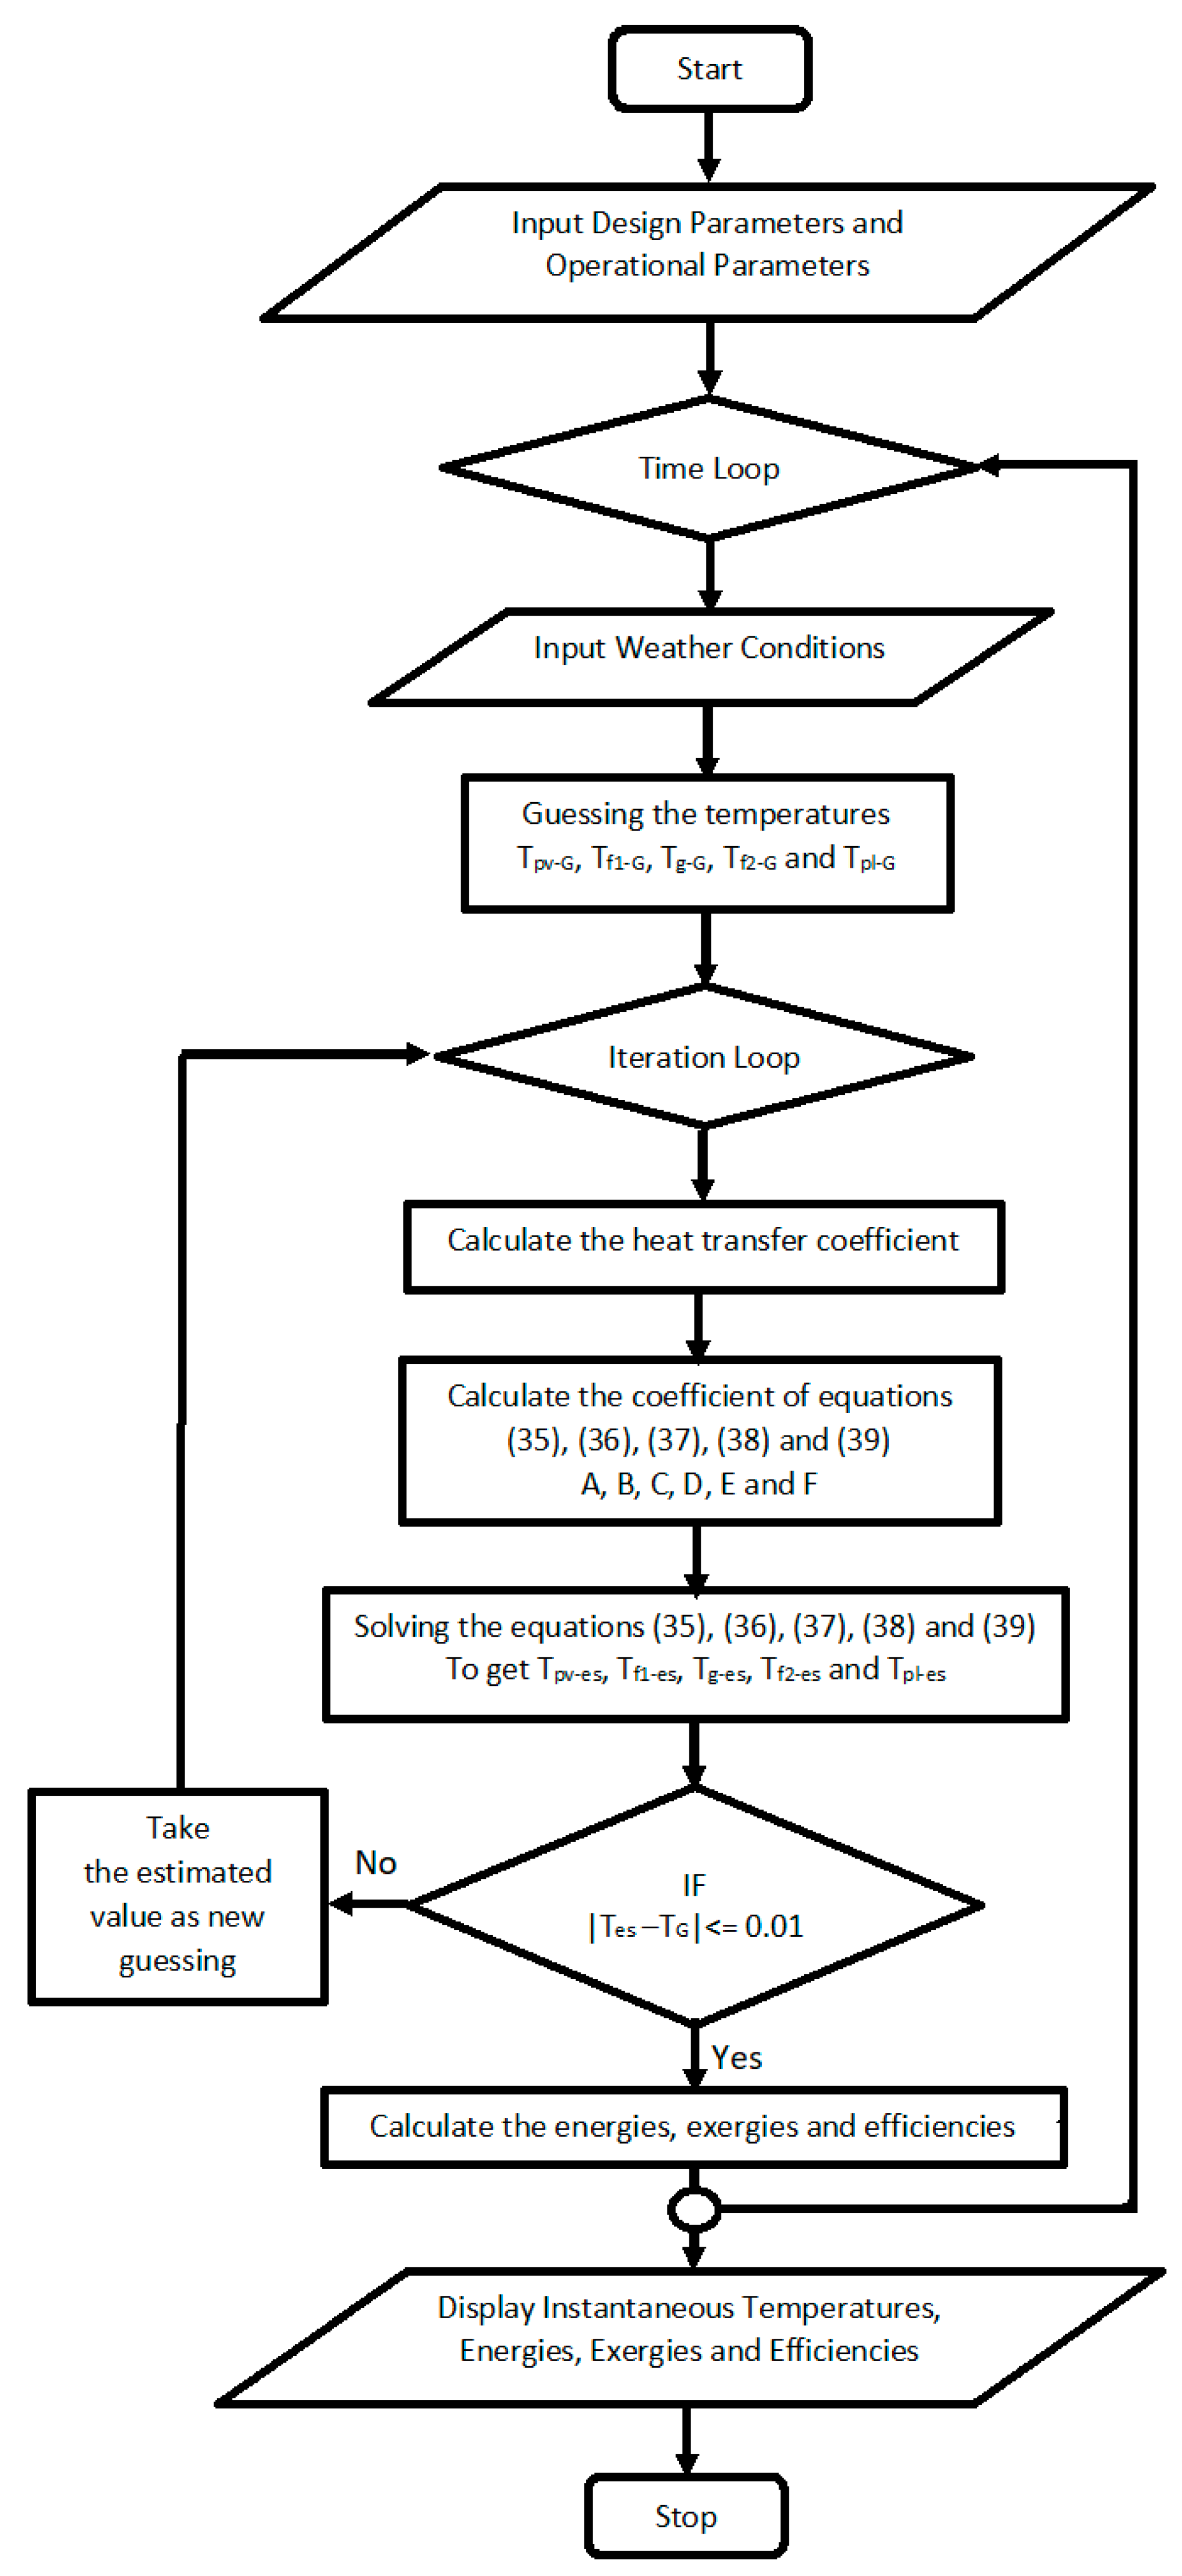
4. Solution Method
5. Results
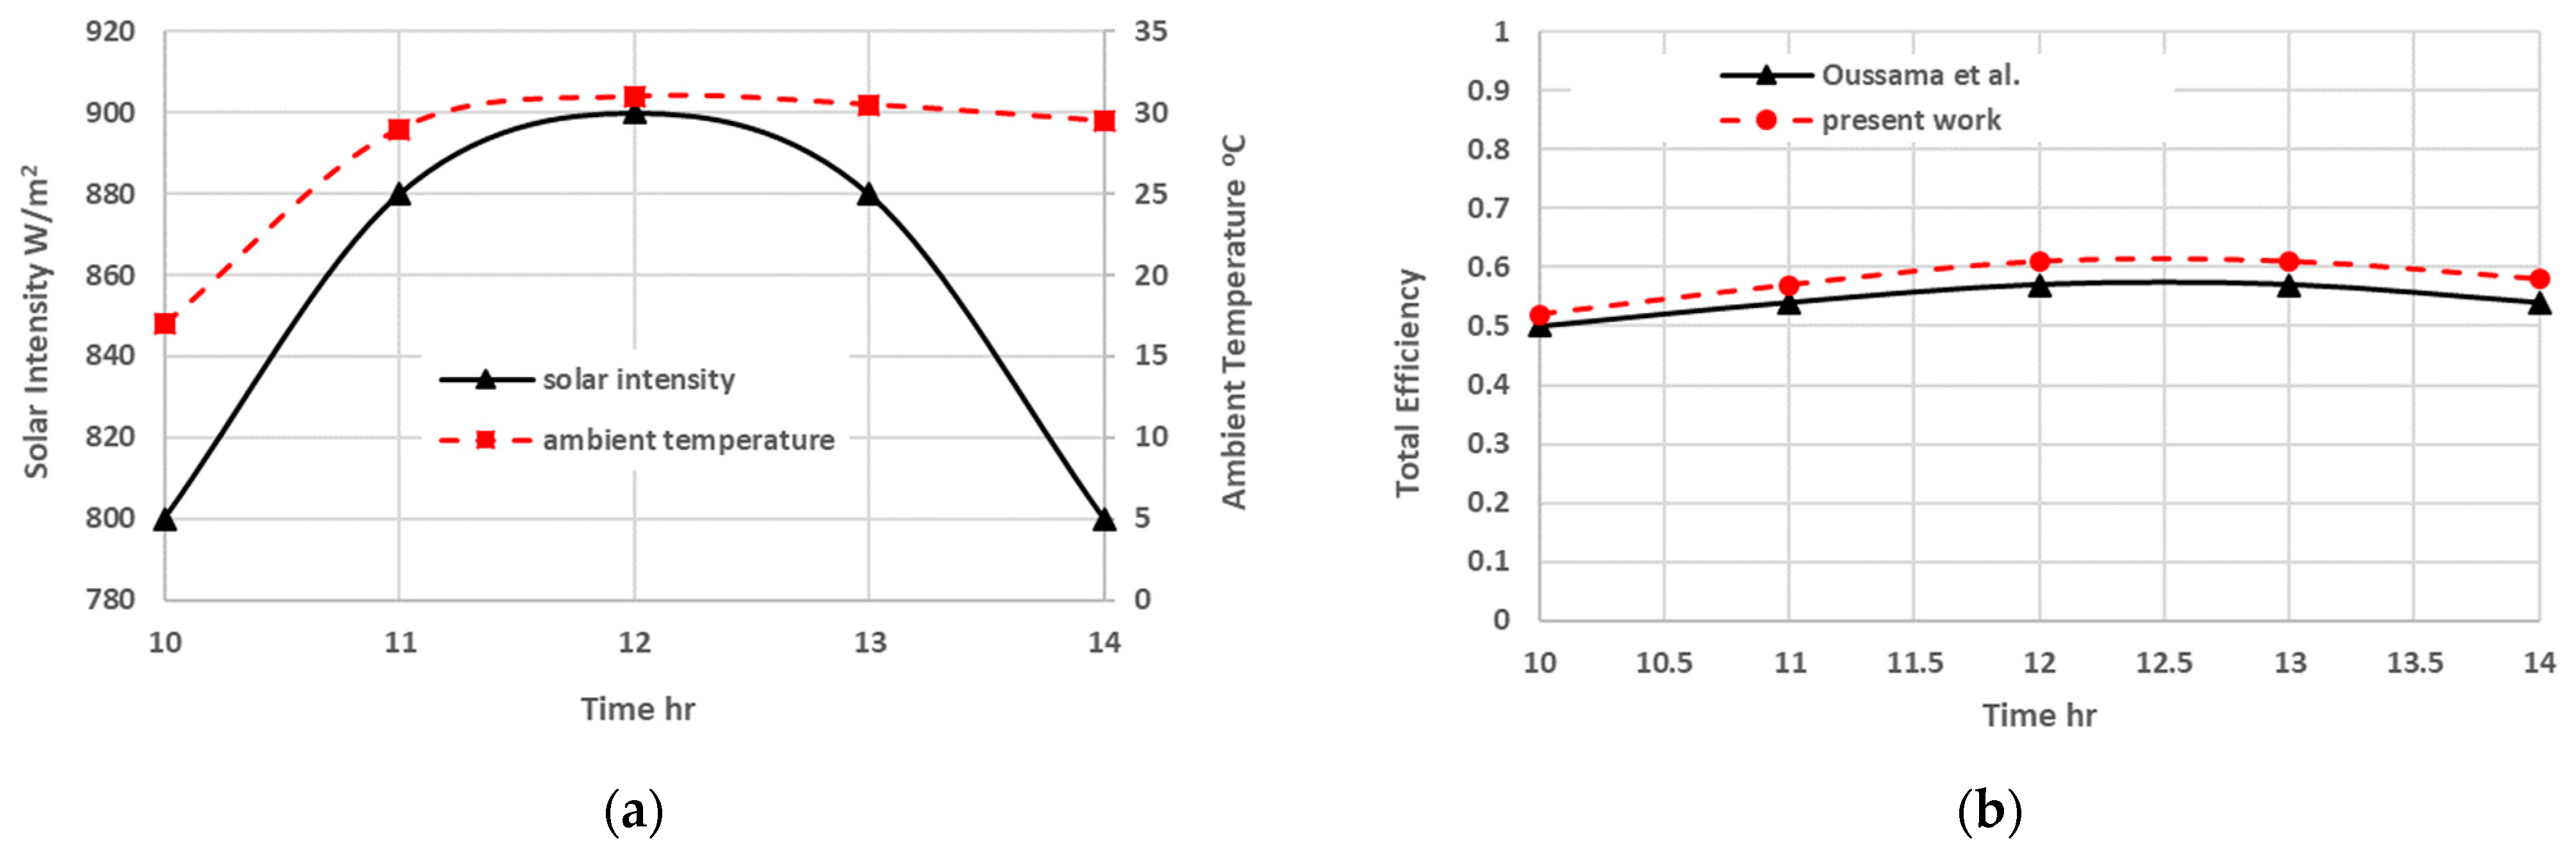
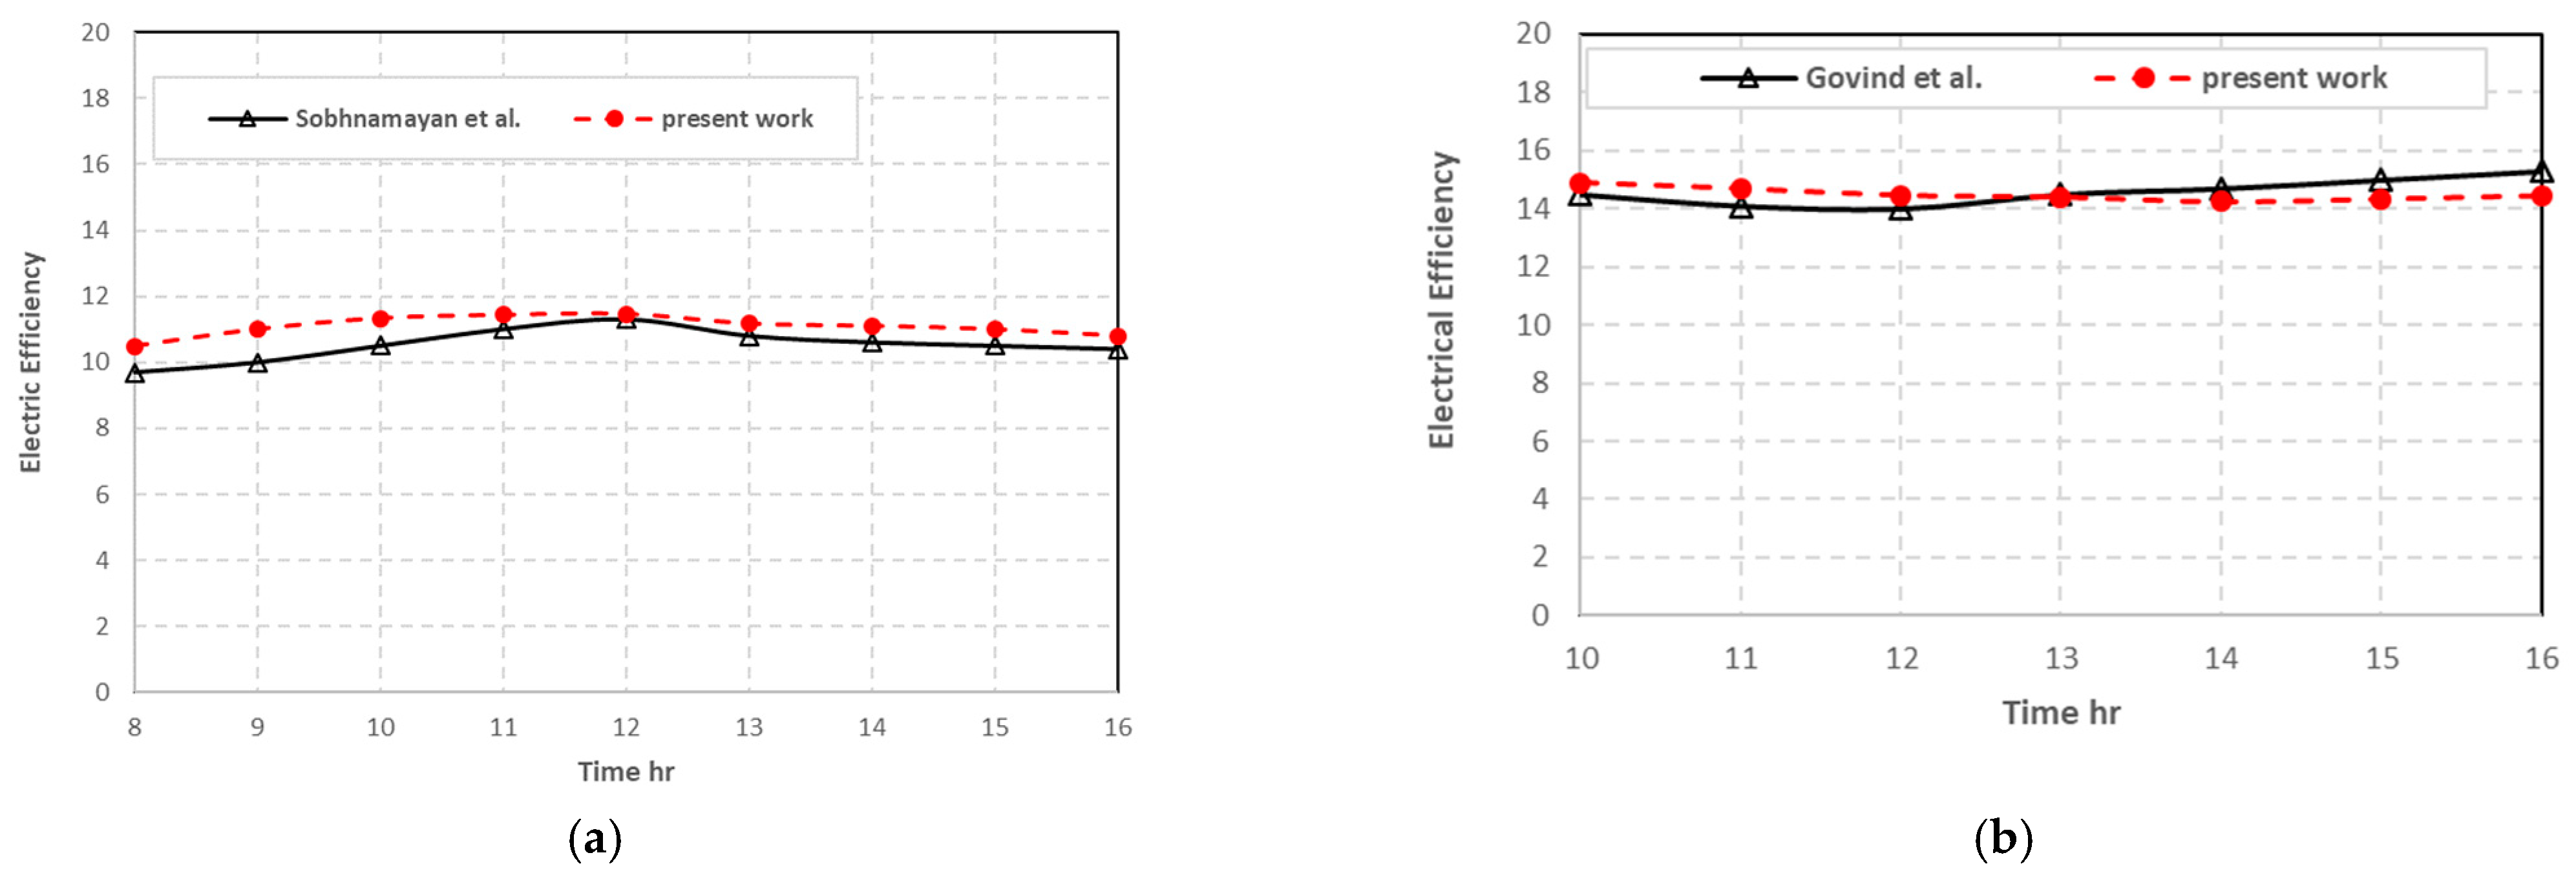
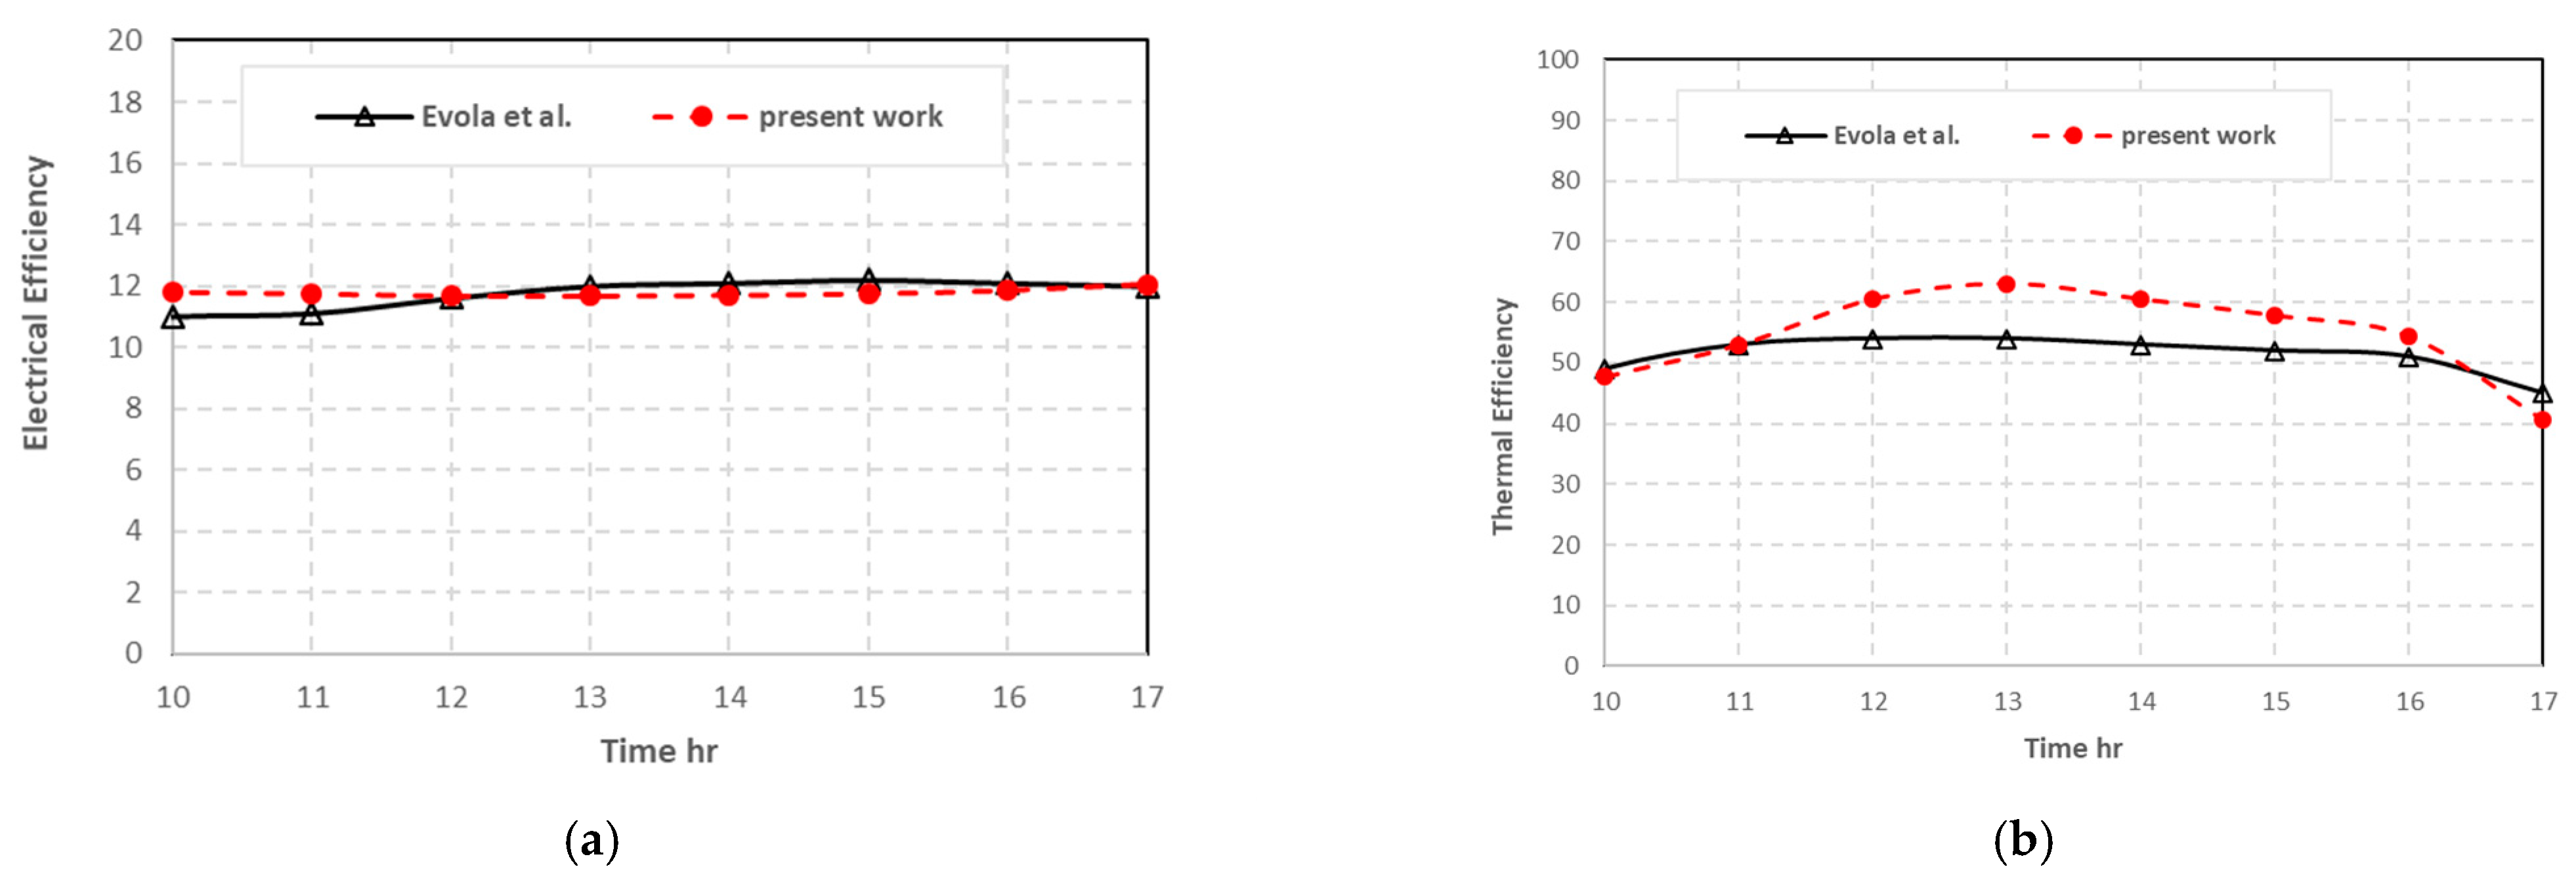
5.1. Validation of Current Model
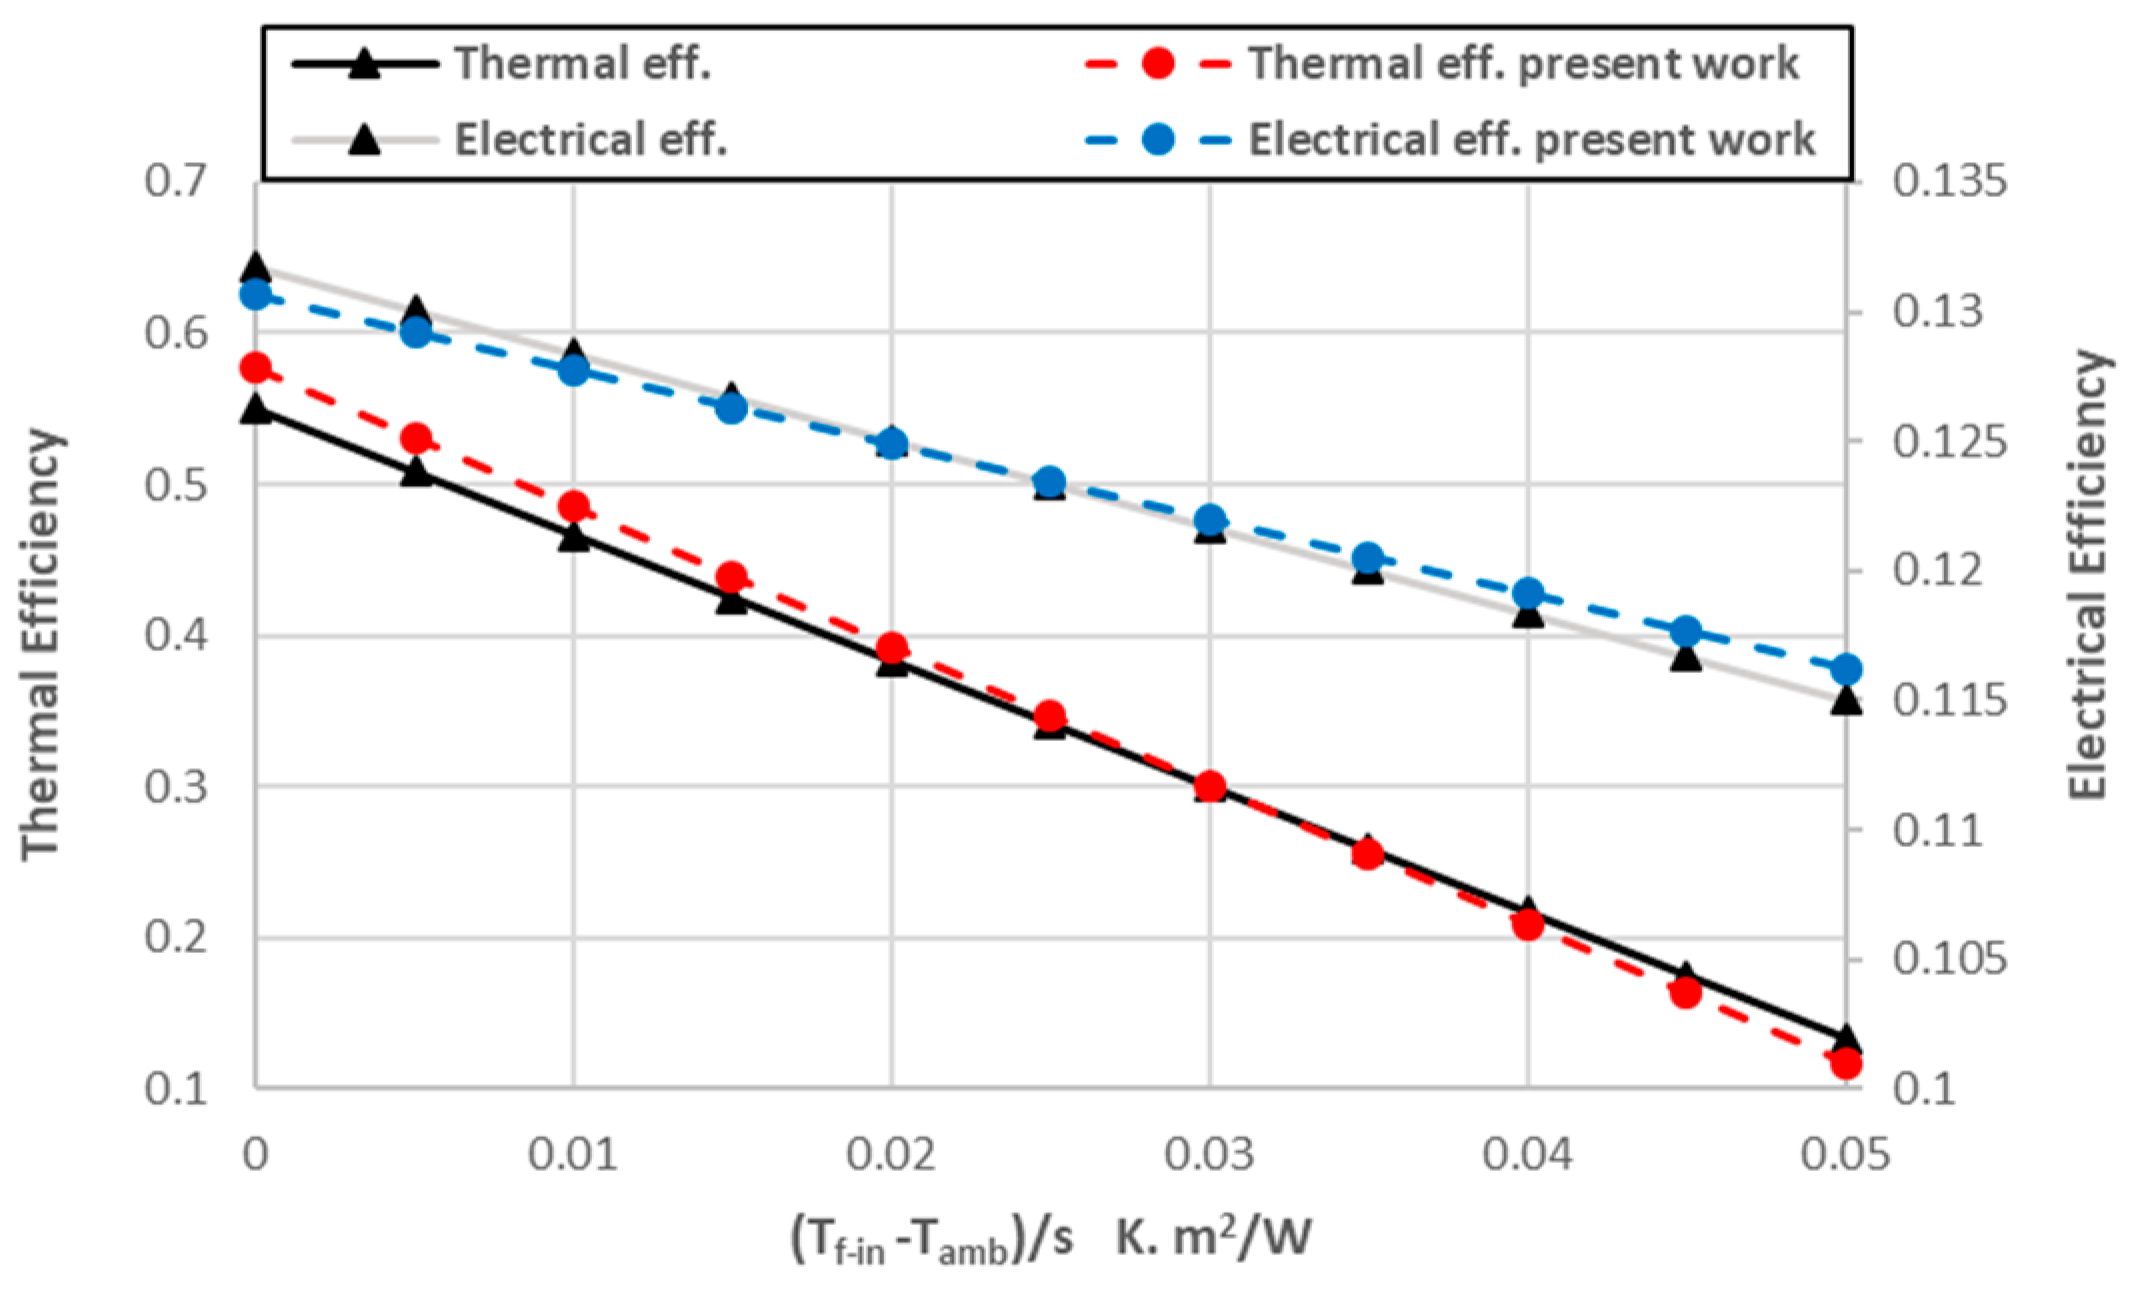
5.1.1. Comparison of Efficiencies
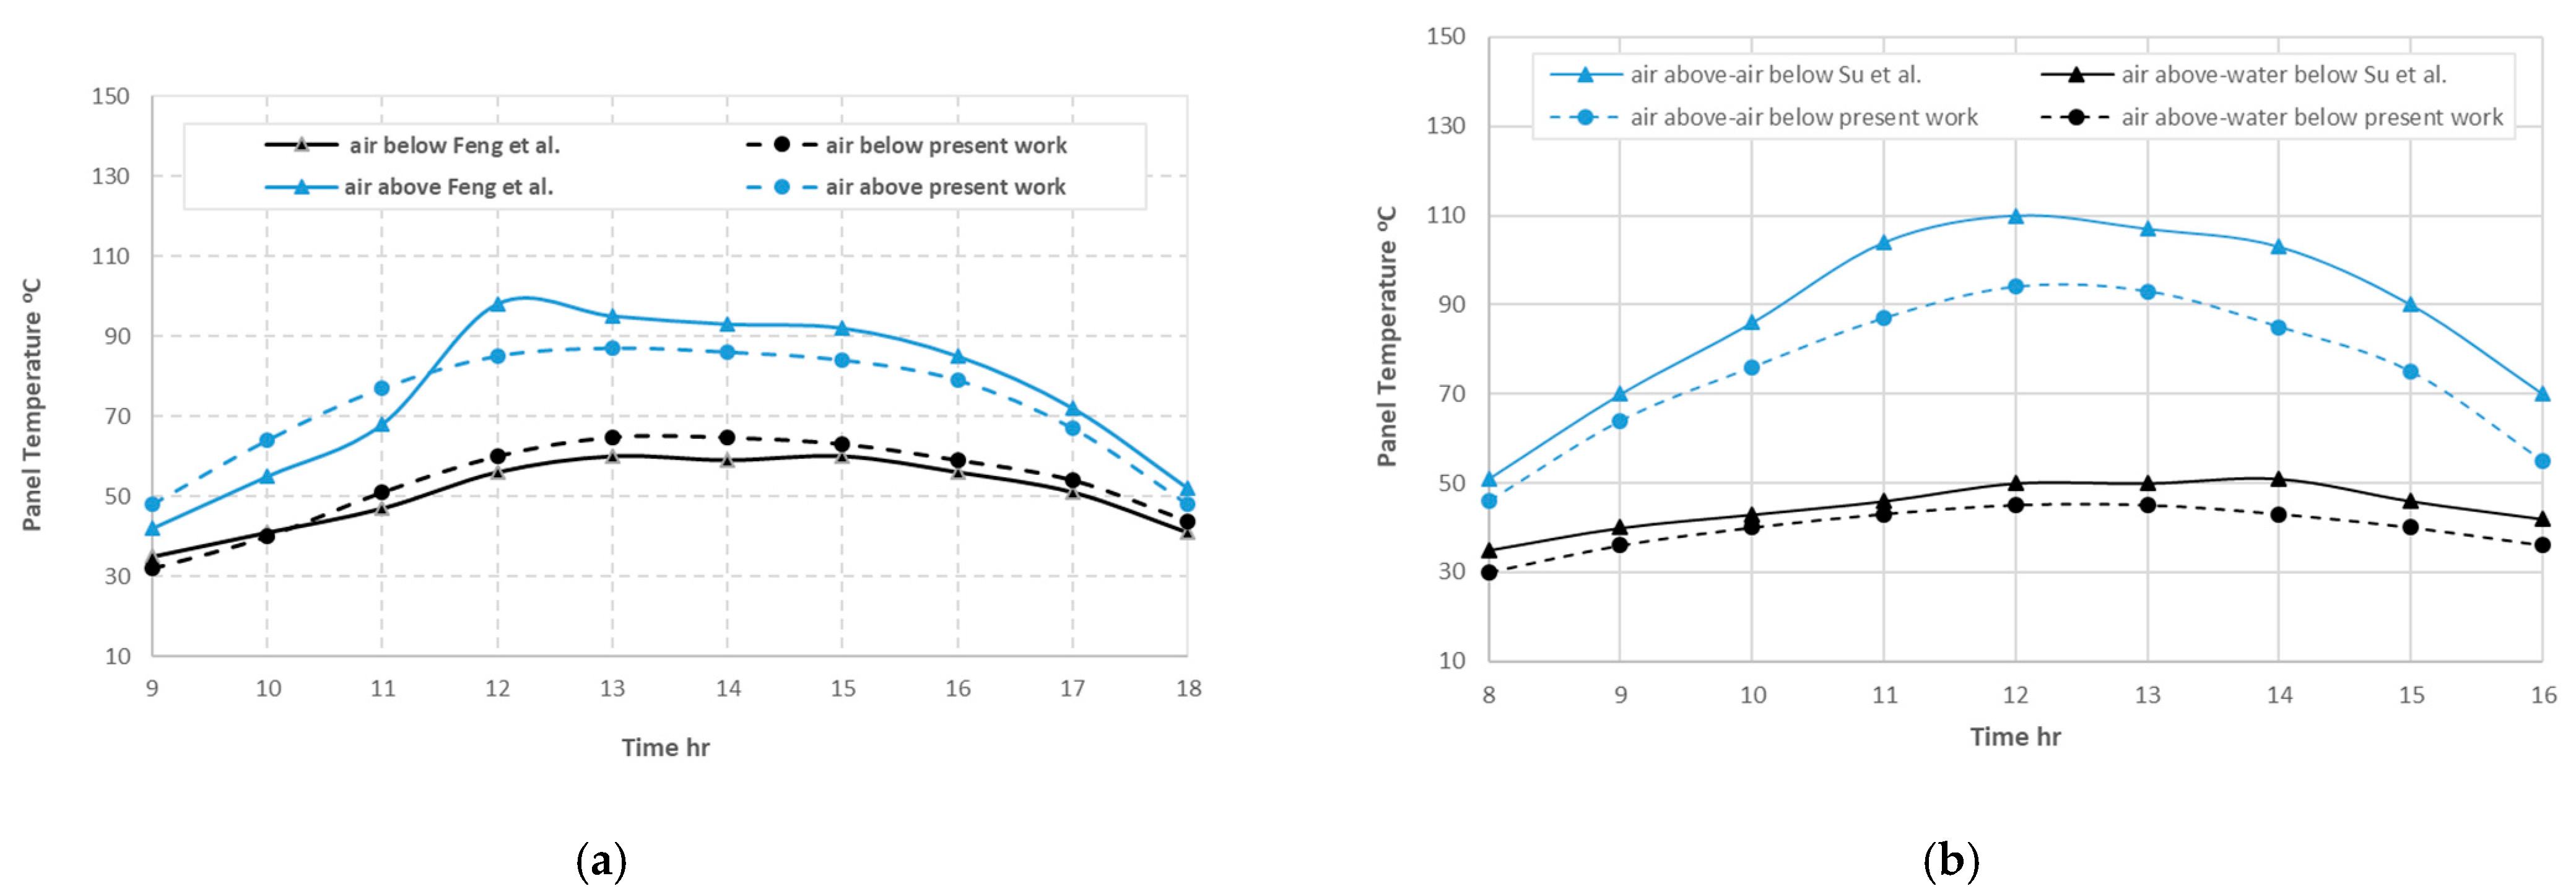
5.1.2. Comparison of Panel Temperatures
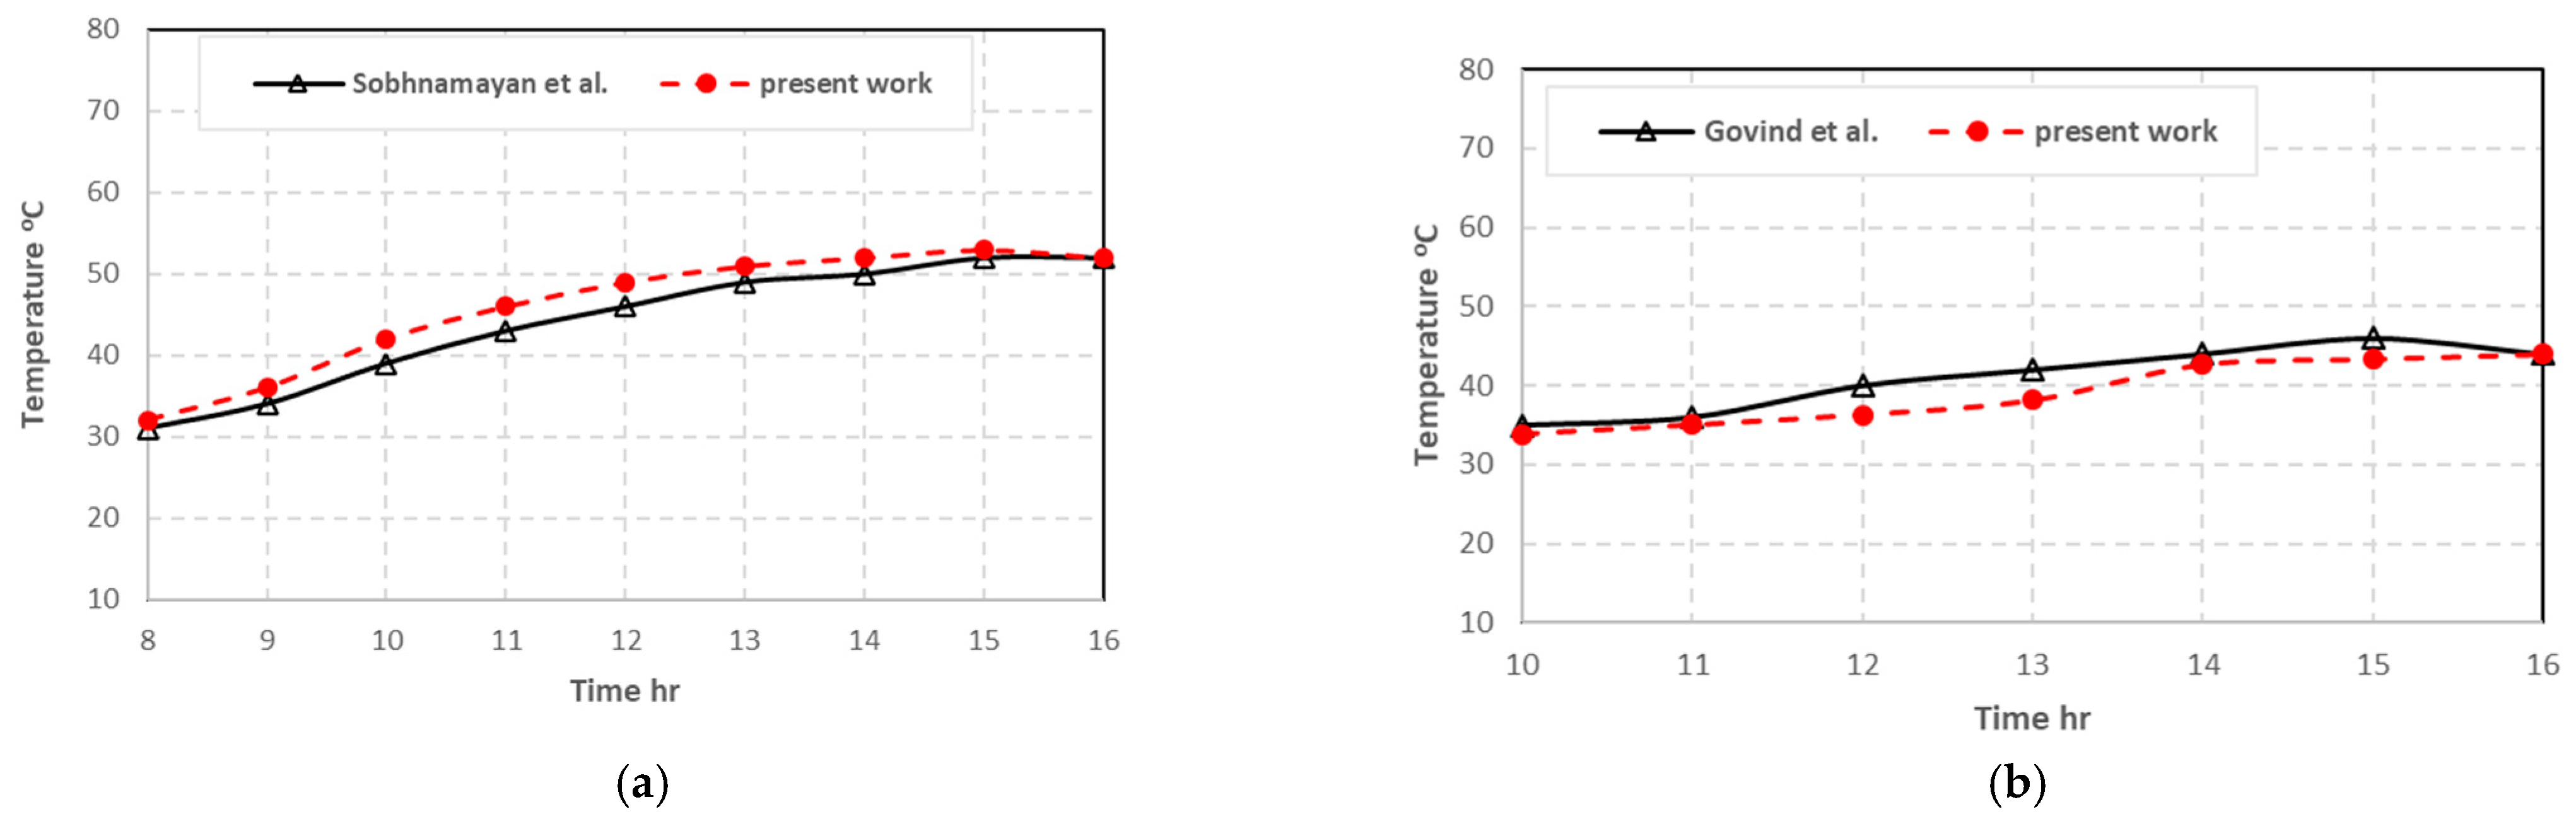
5.1.3. Comparison of Outlet Water Temperatures
5.2. Model Results
5.2.1. Specification of PV Module
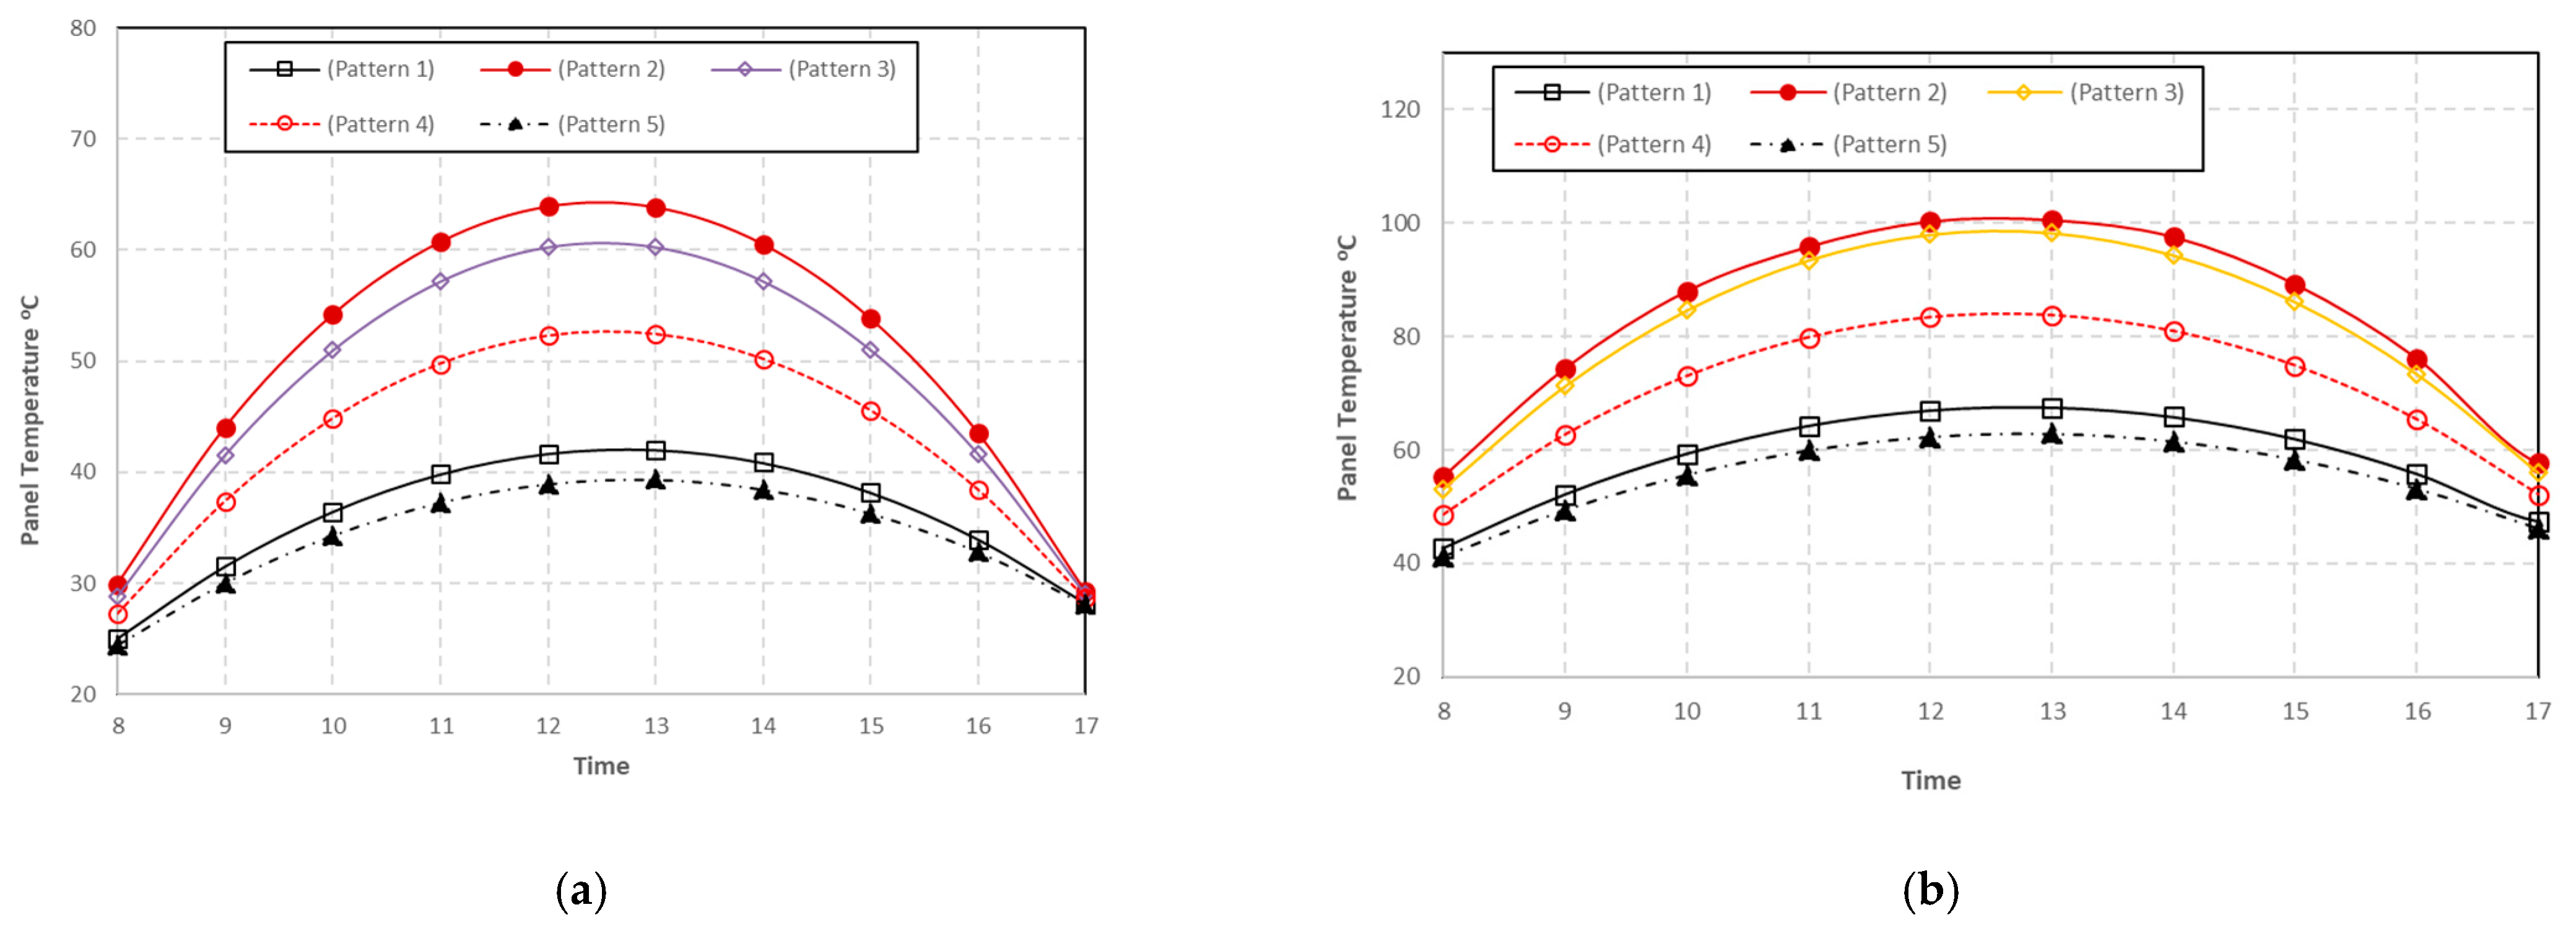
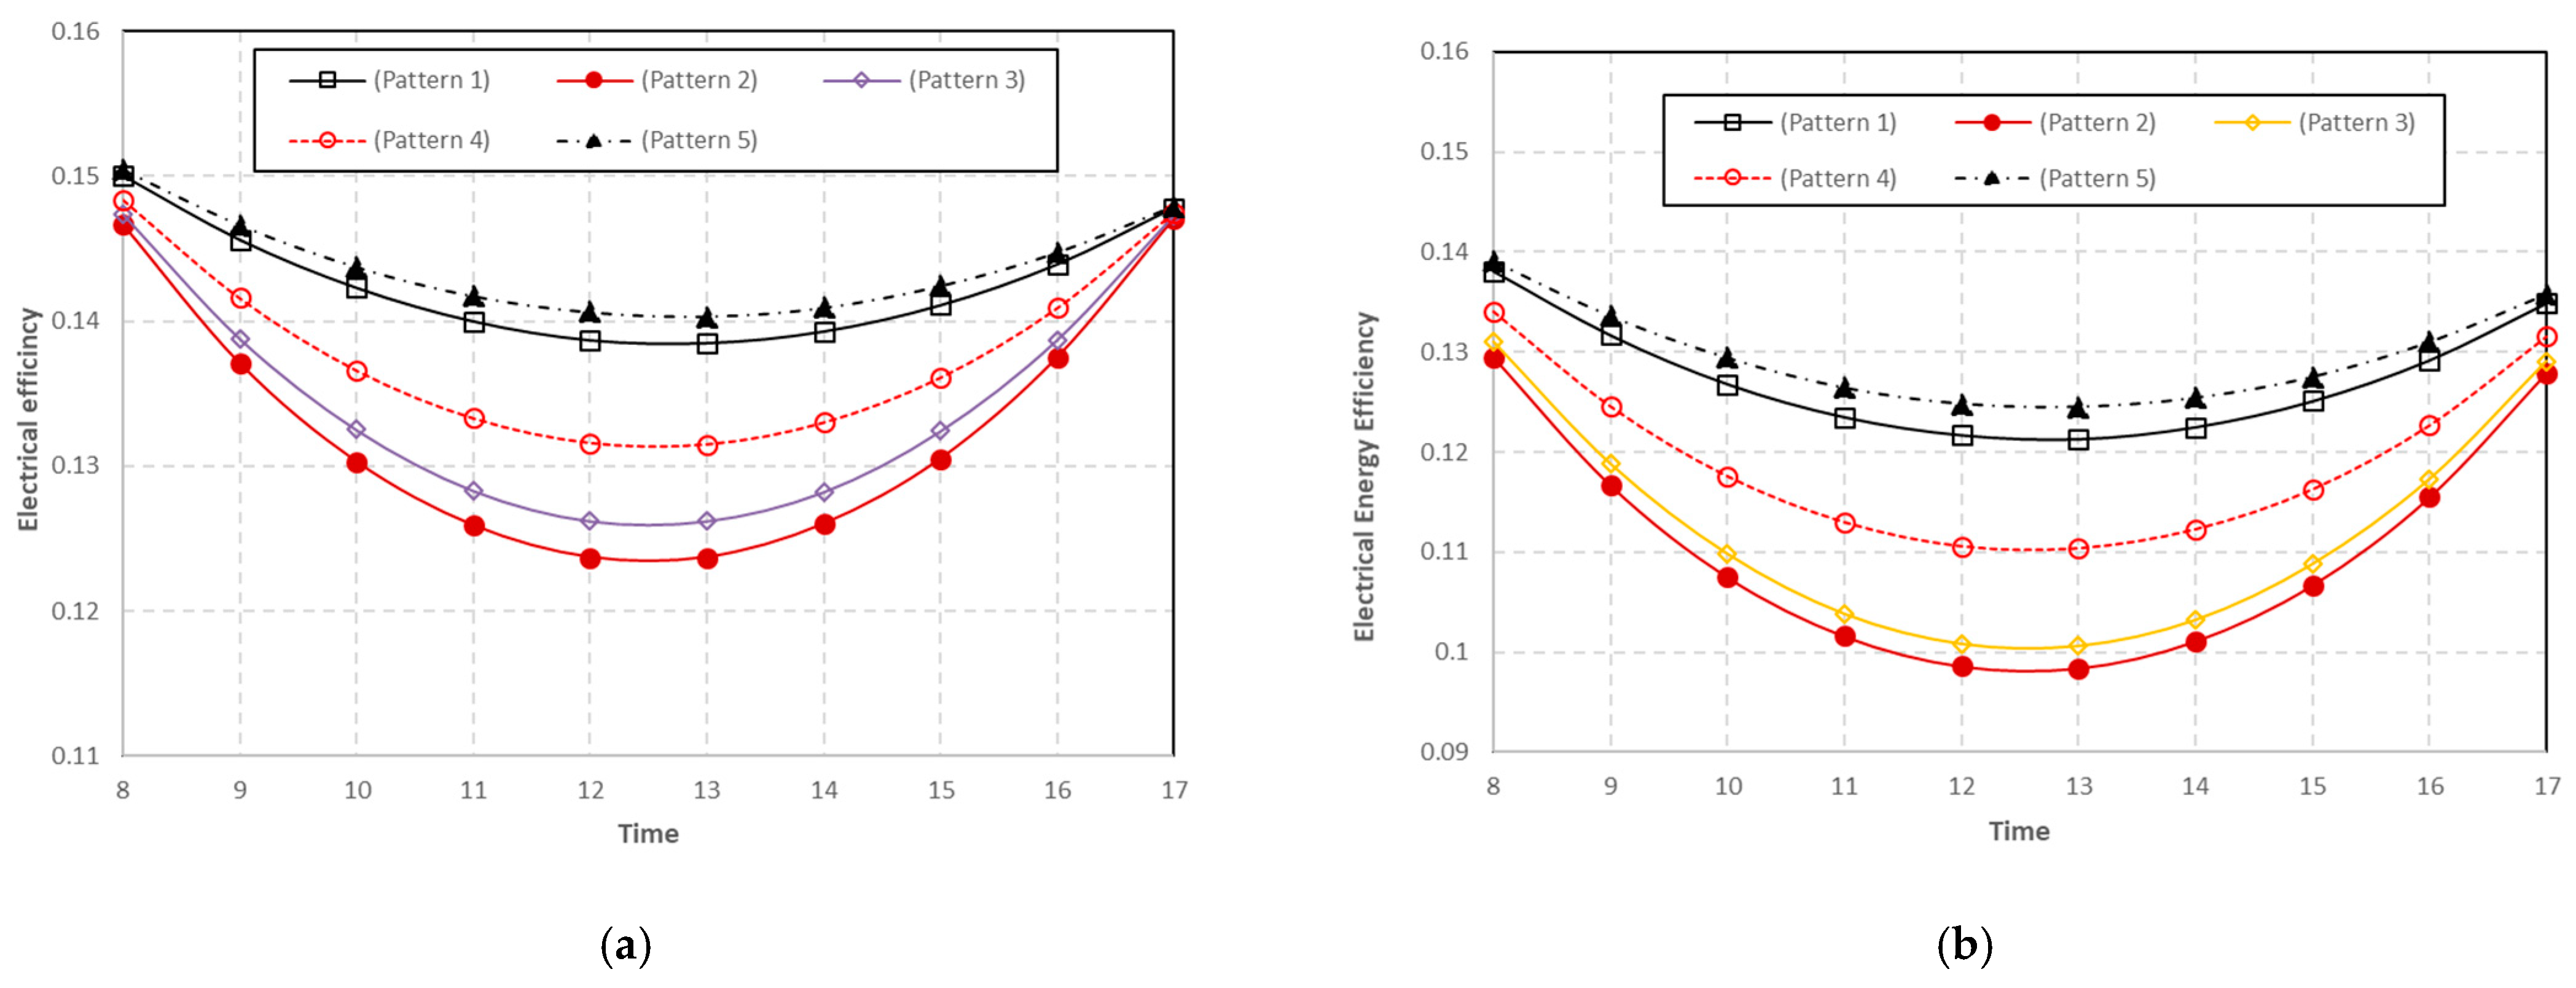
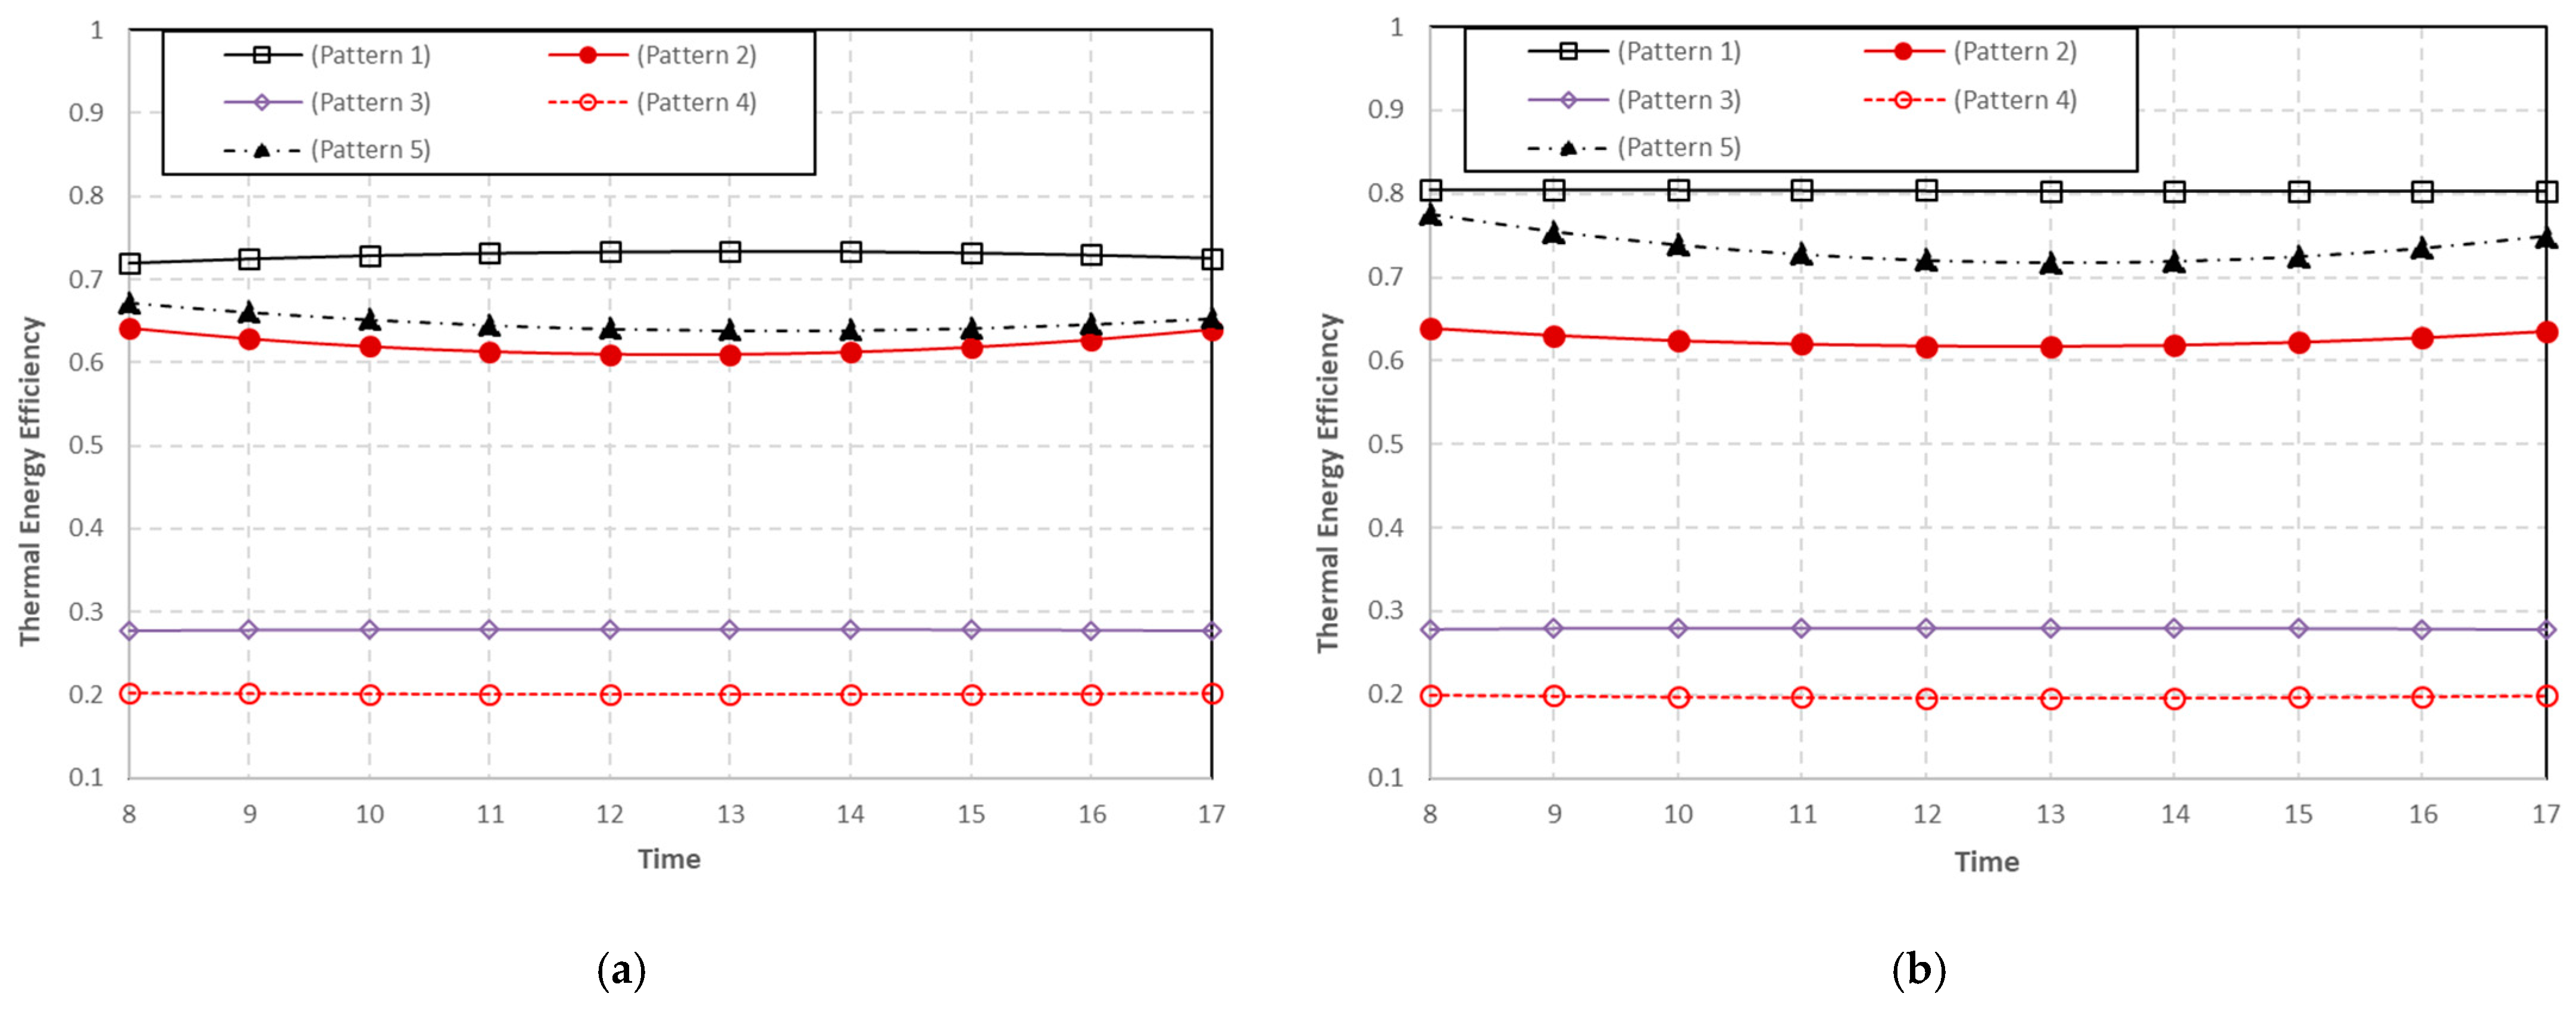
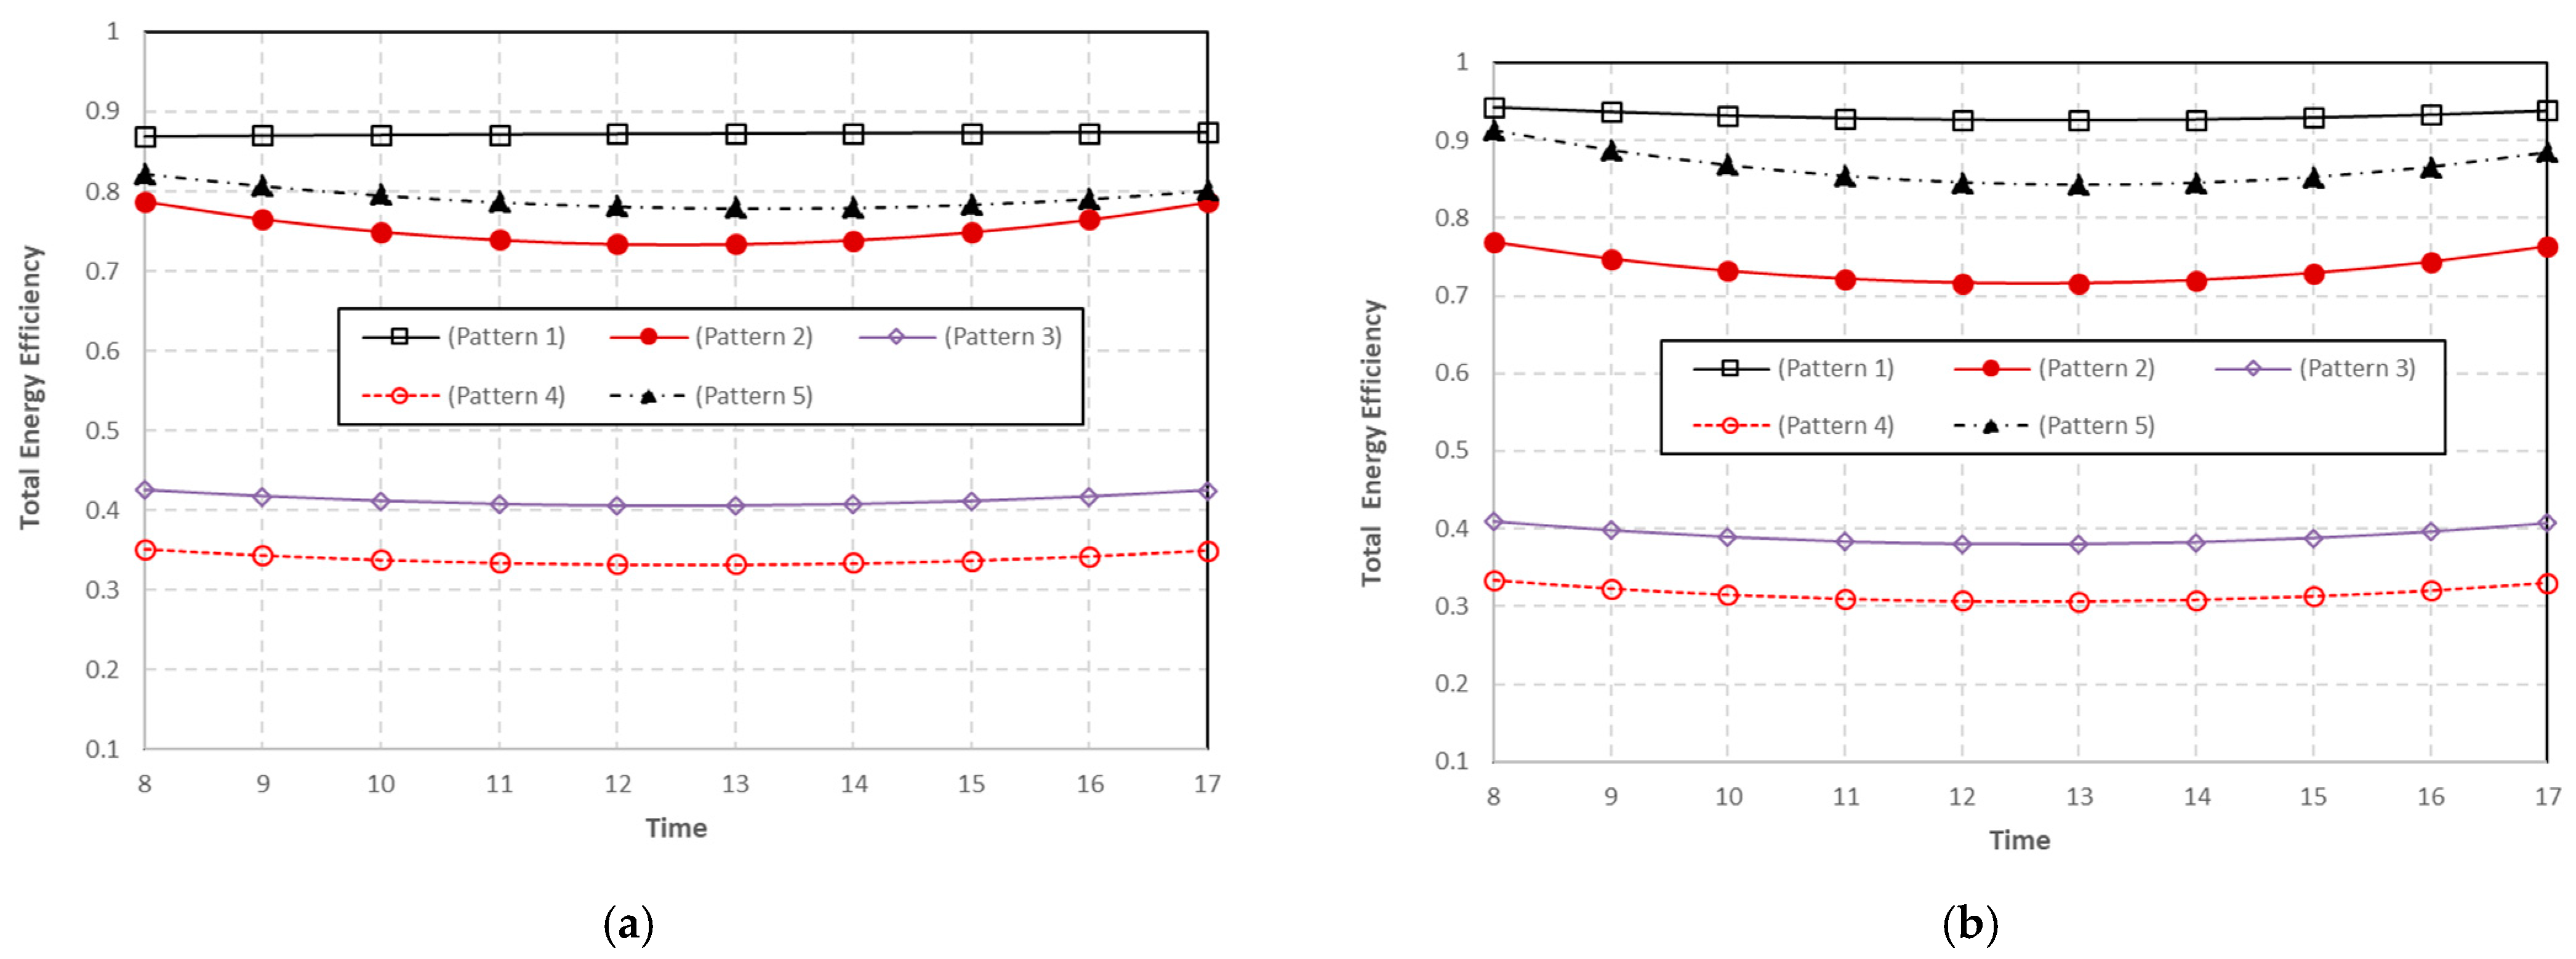
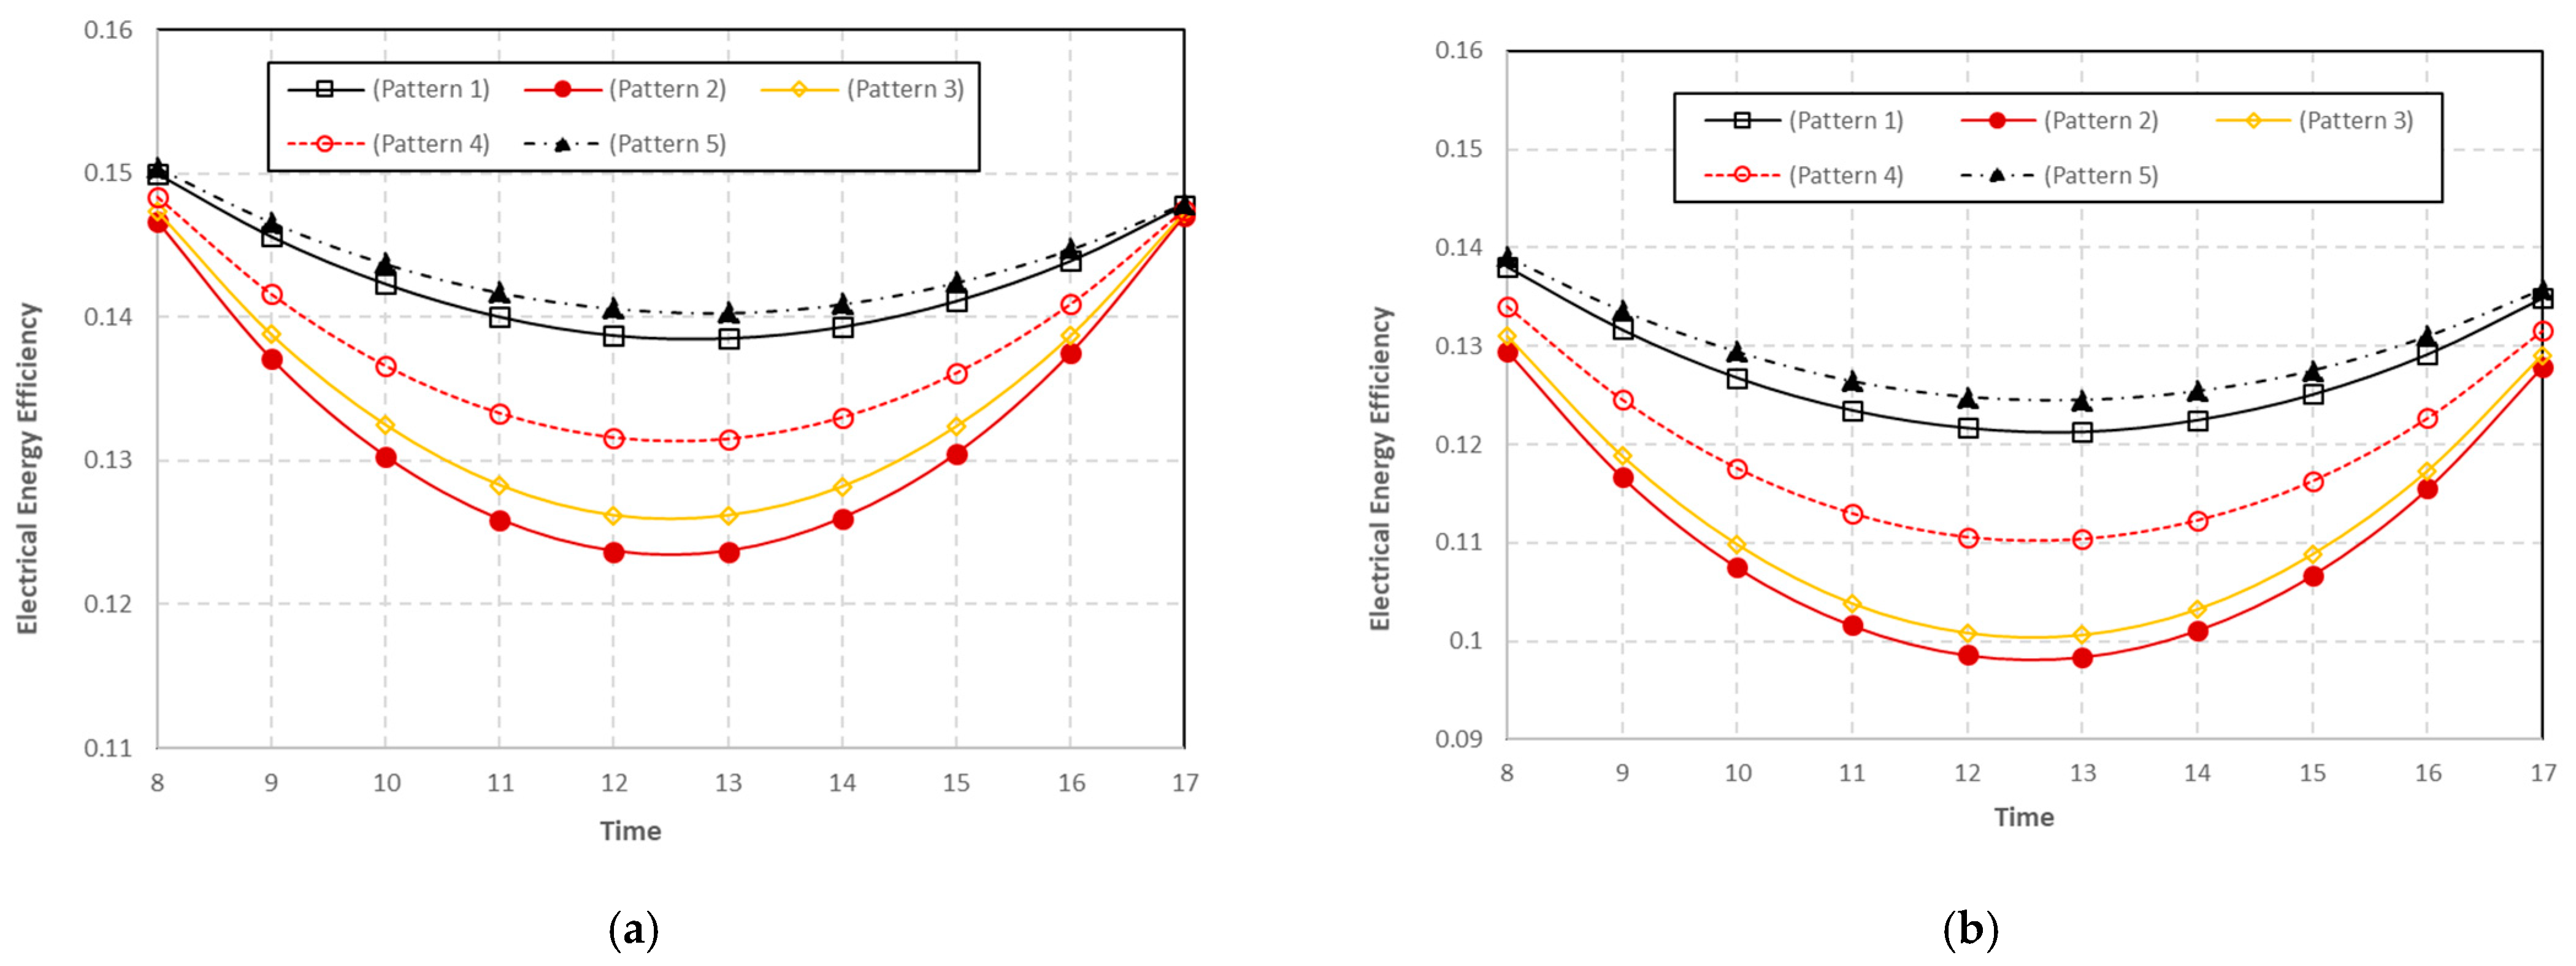
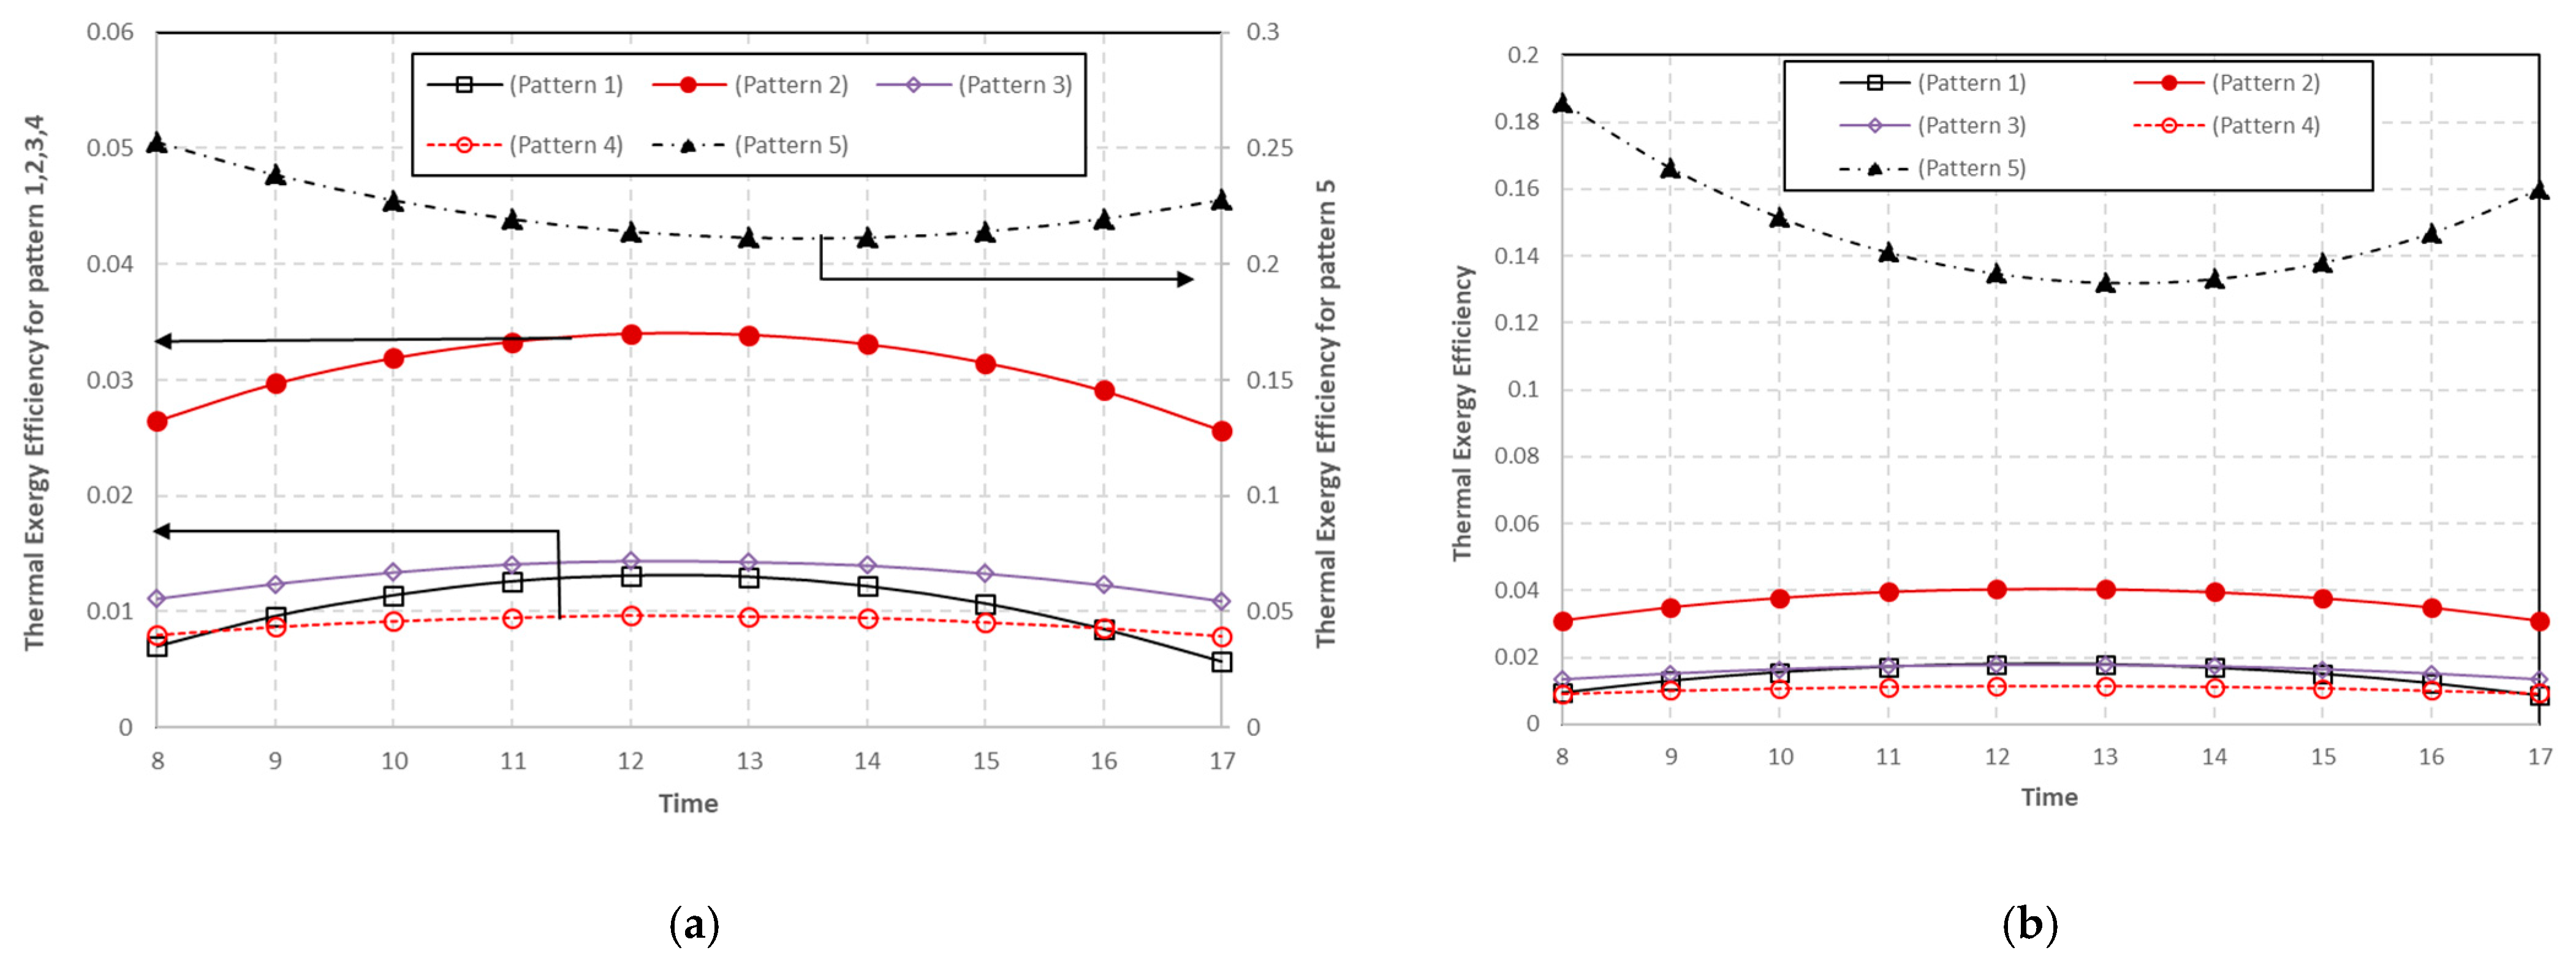
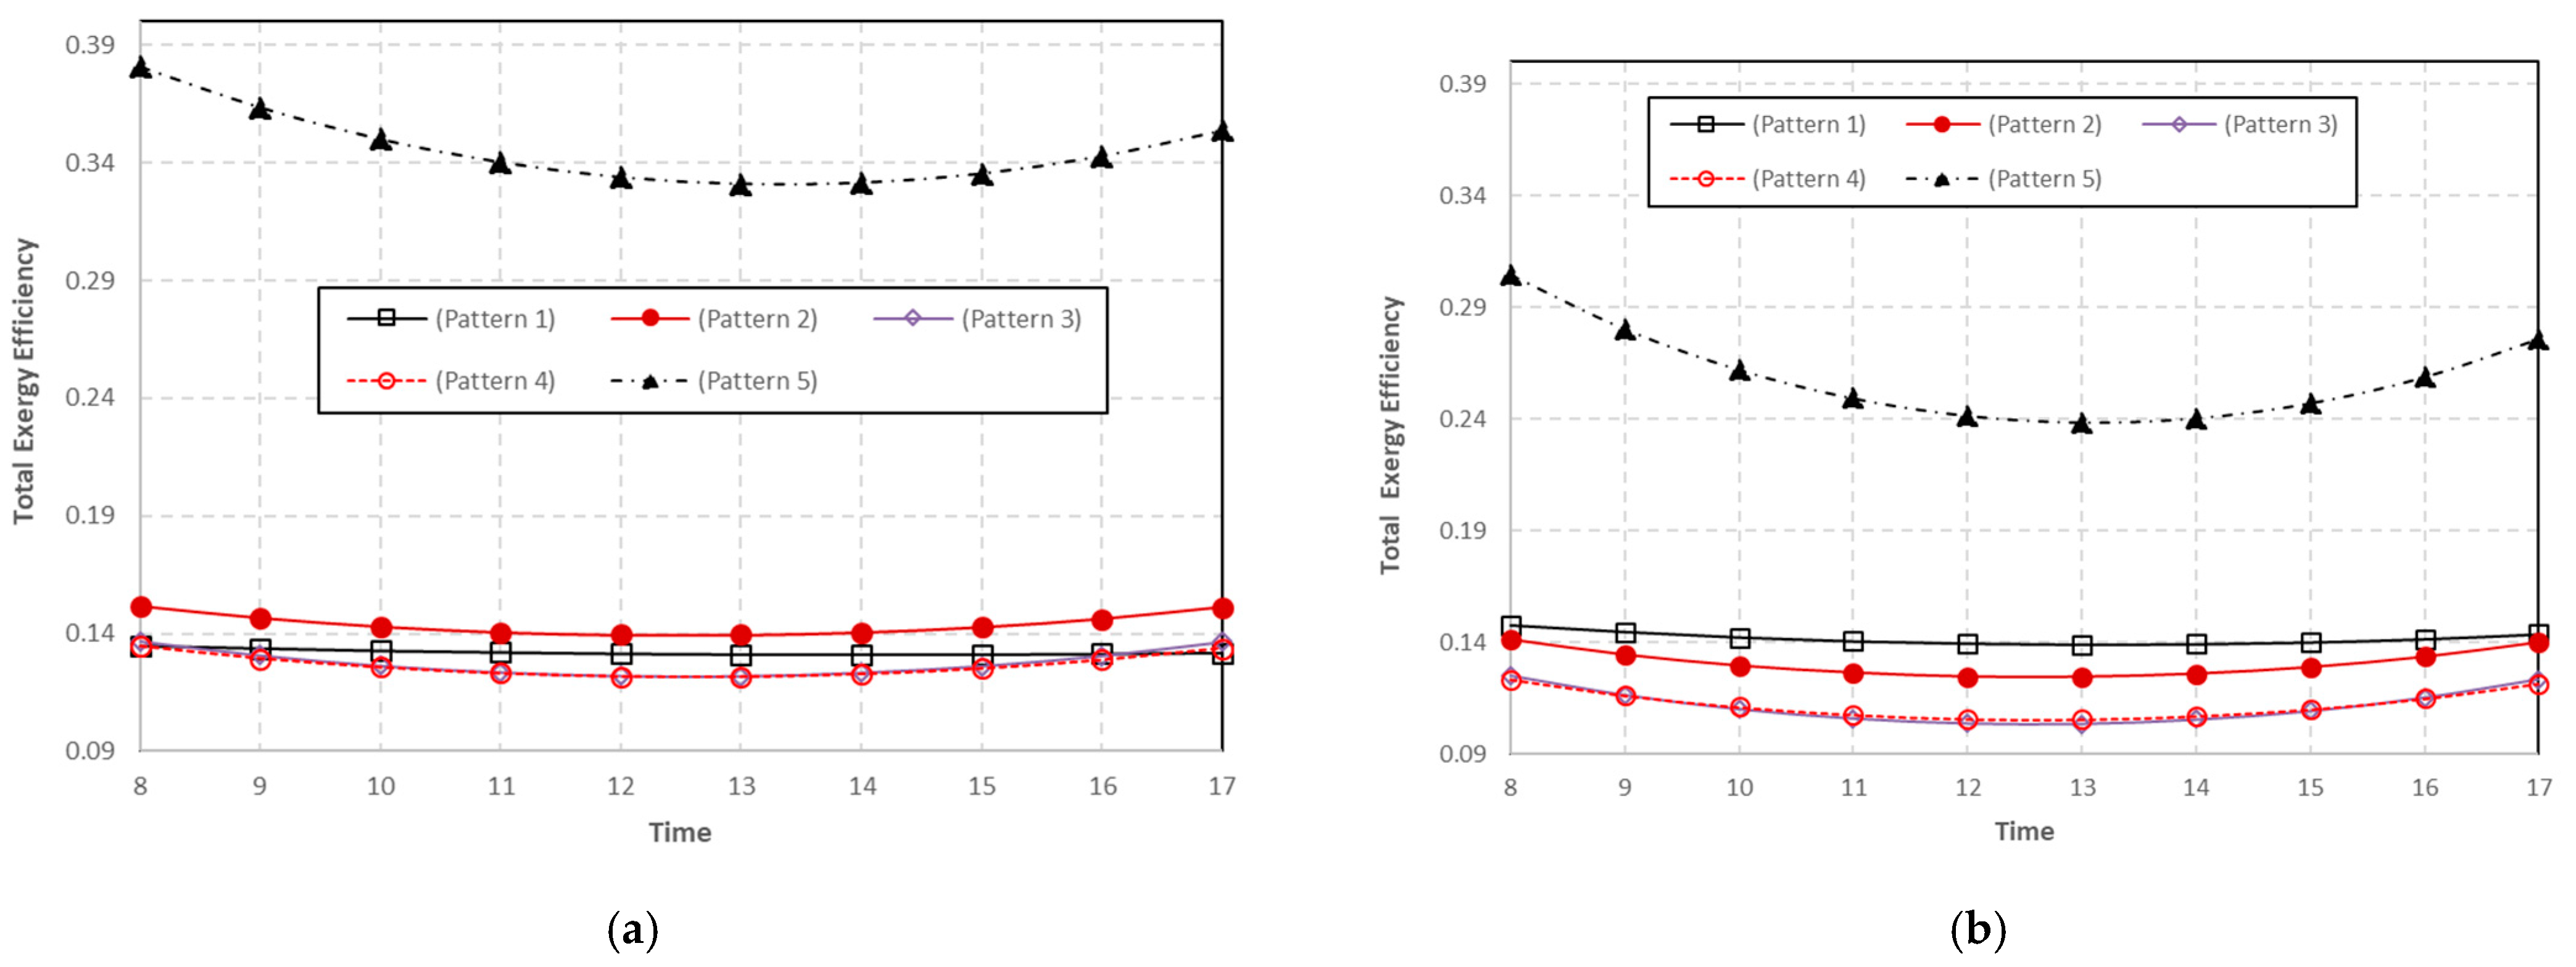
5.2.2. Comparison Cooling Configurations
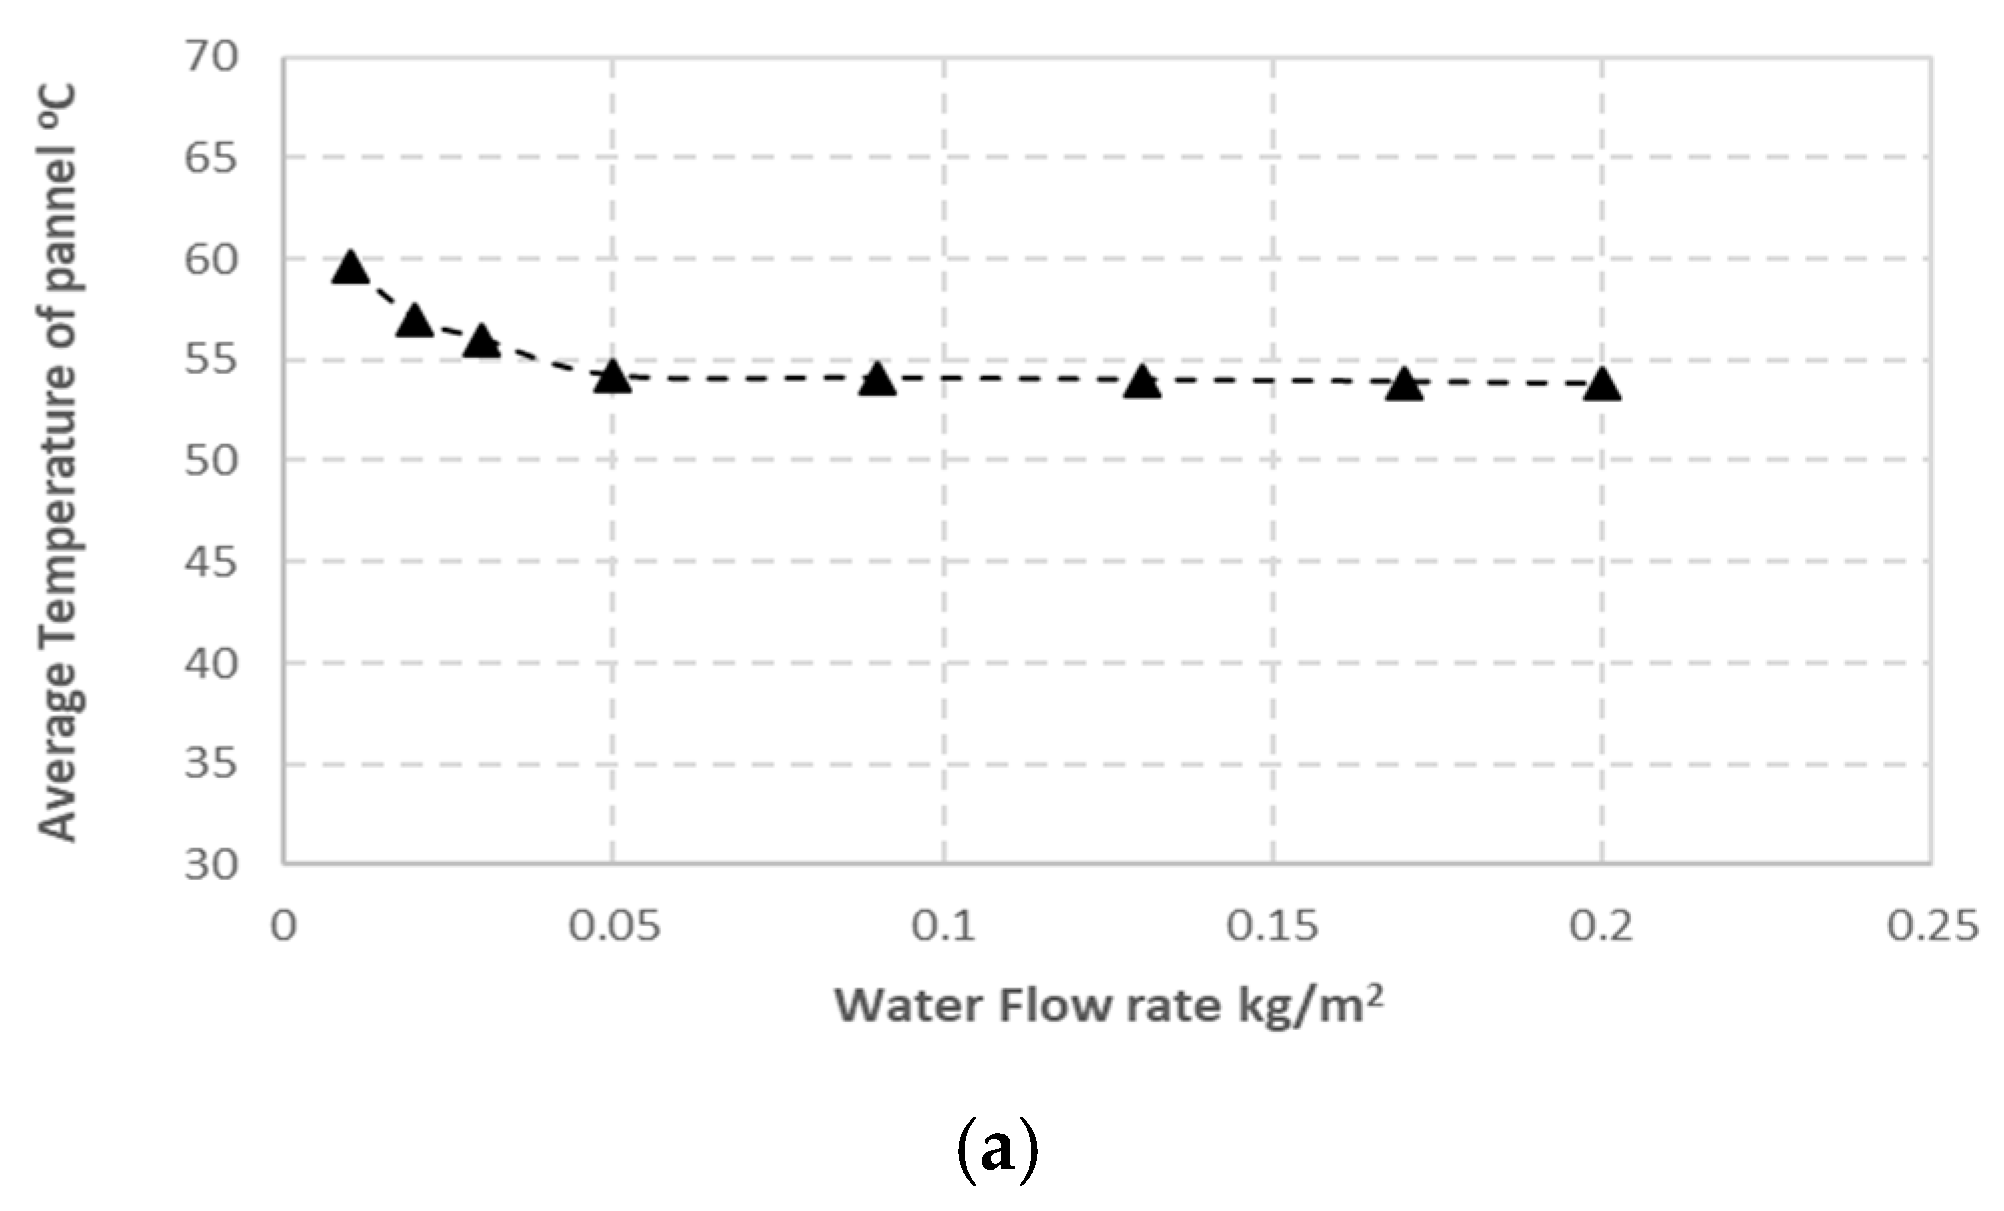
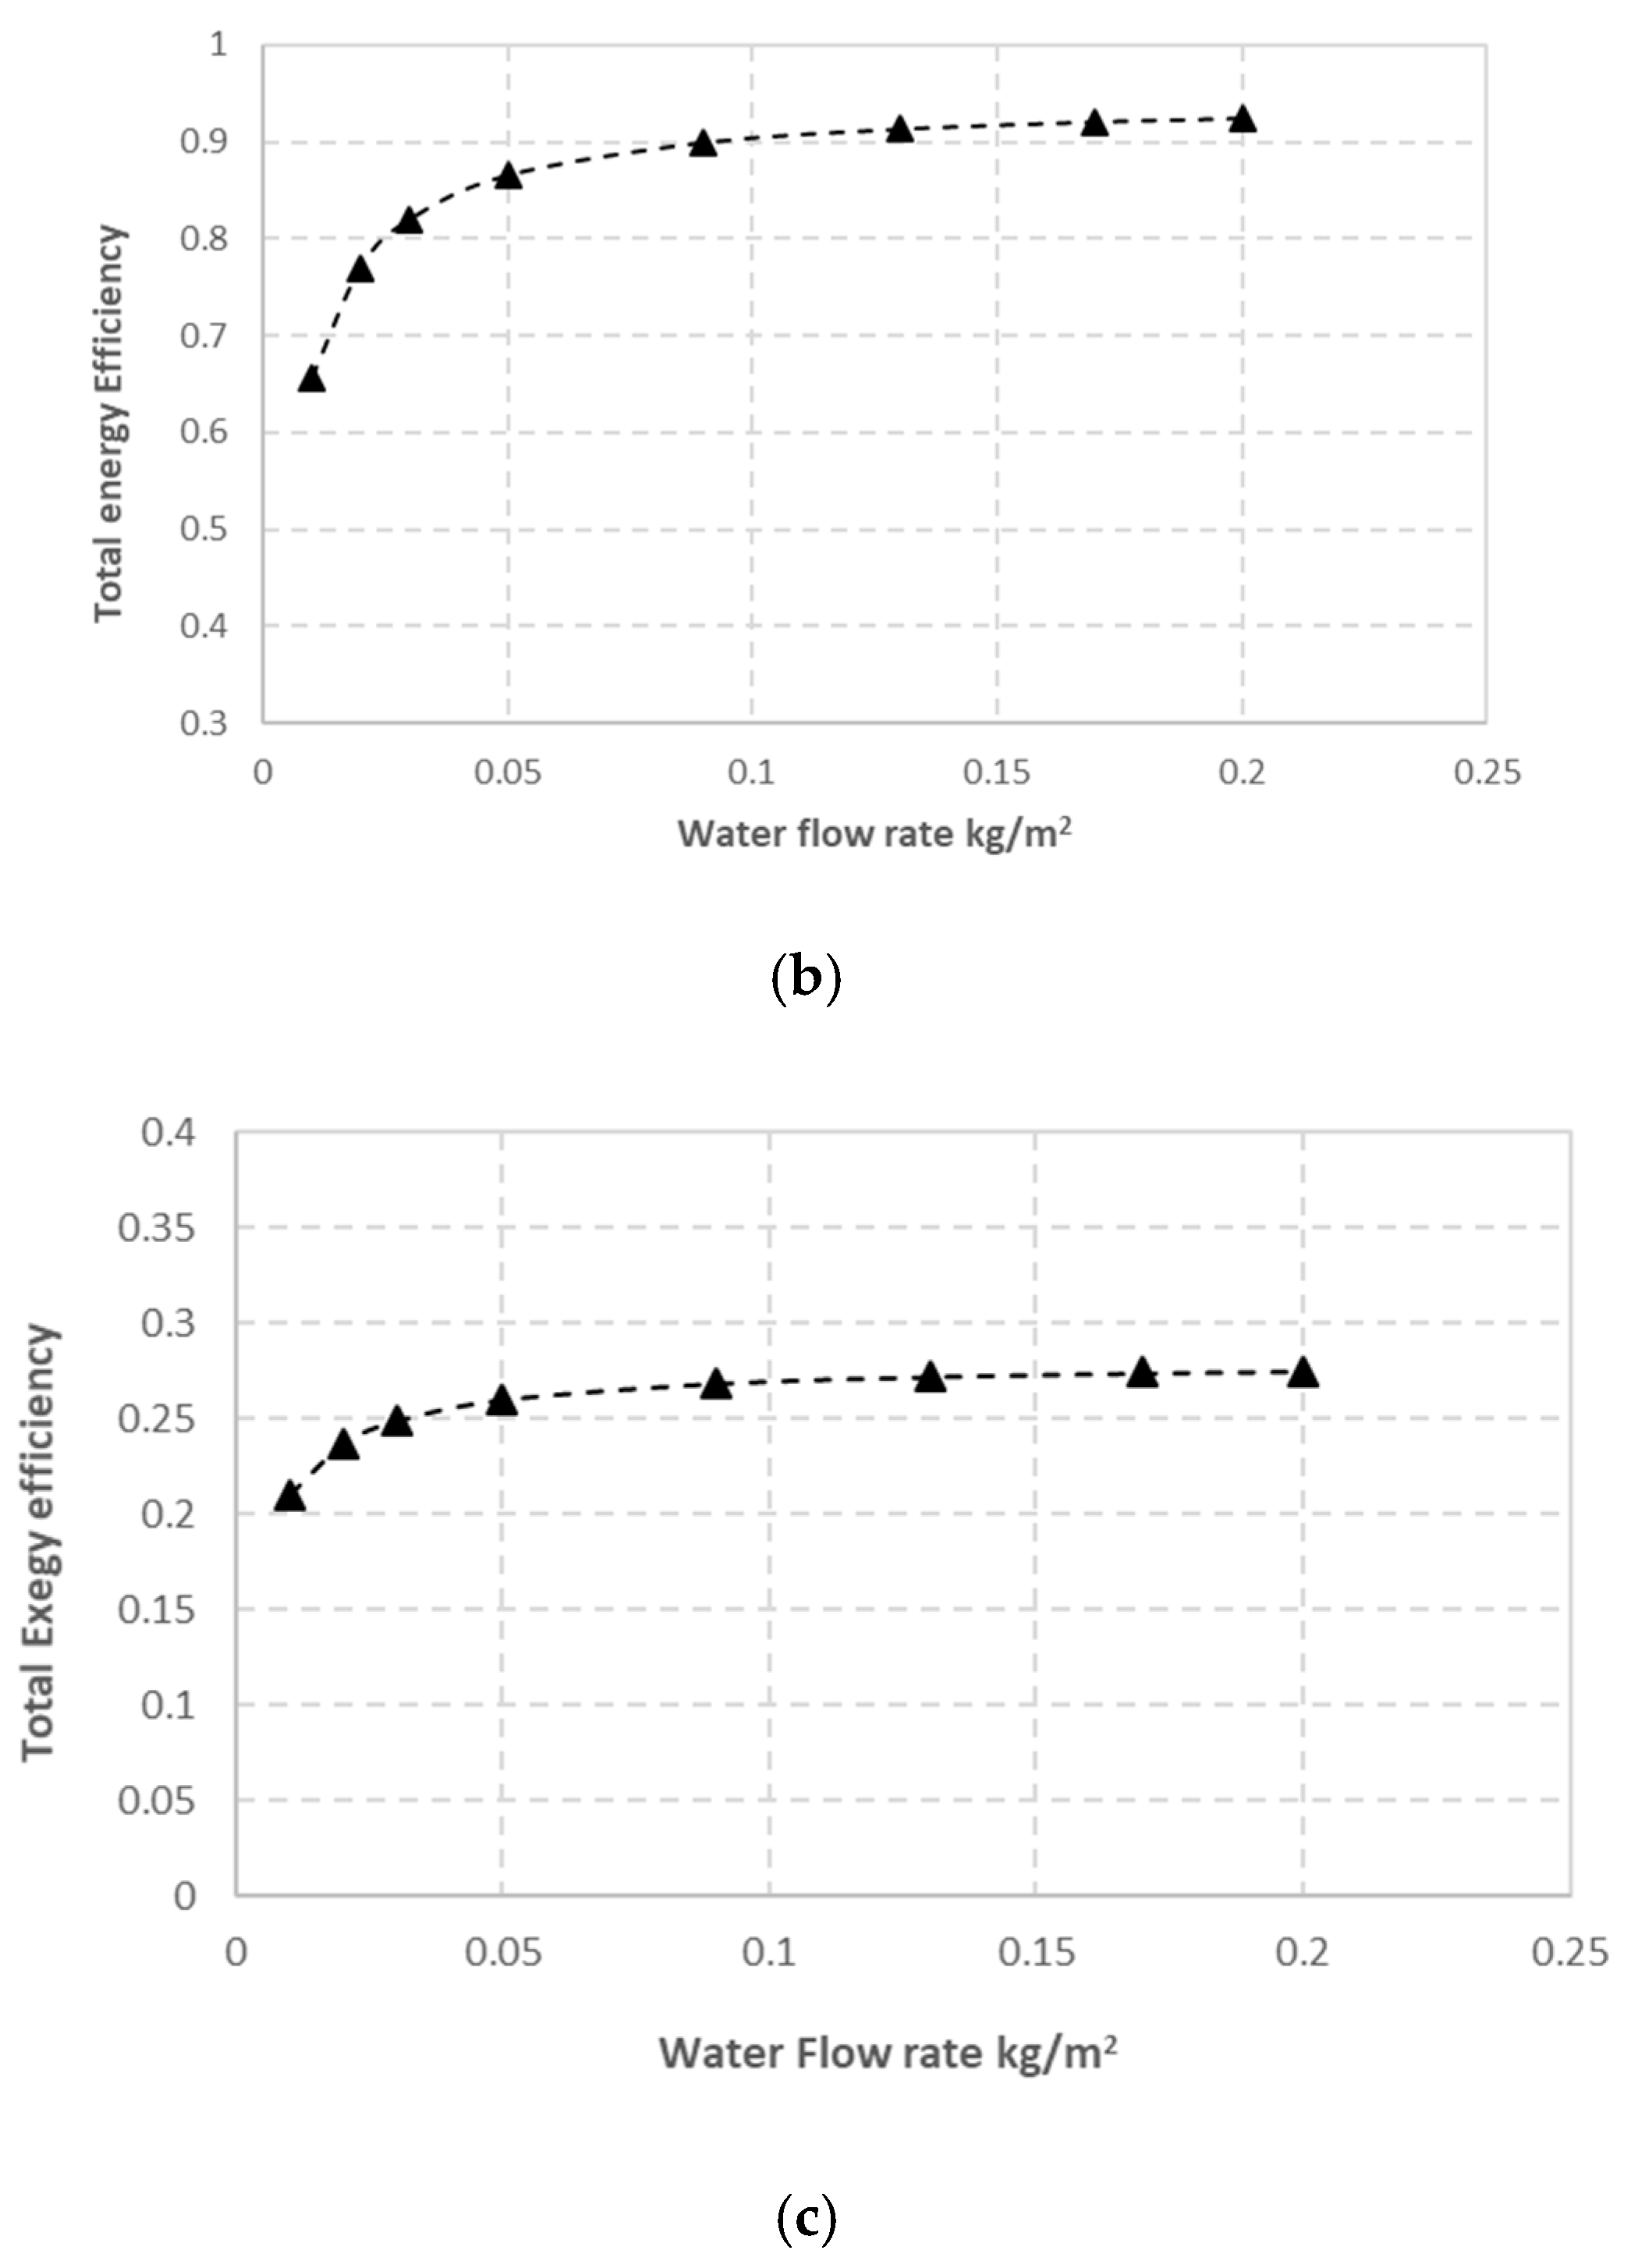
5.2.3. Effect of Water Flow Rate on PVT System
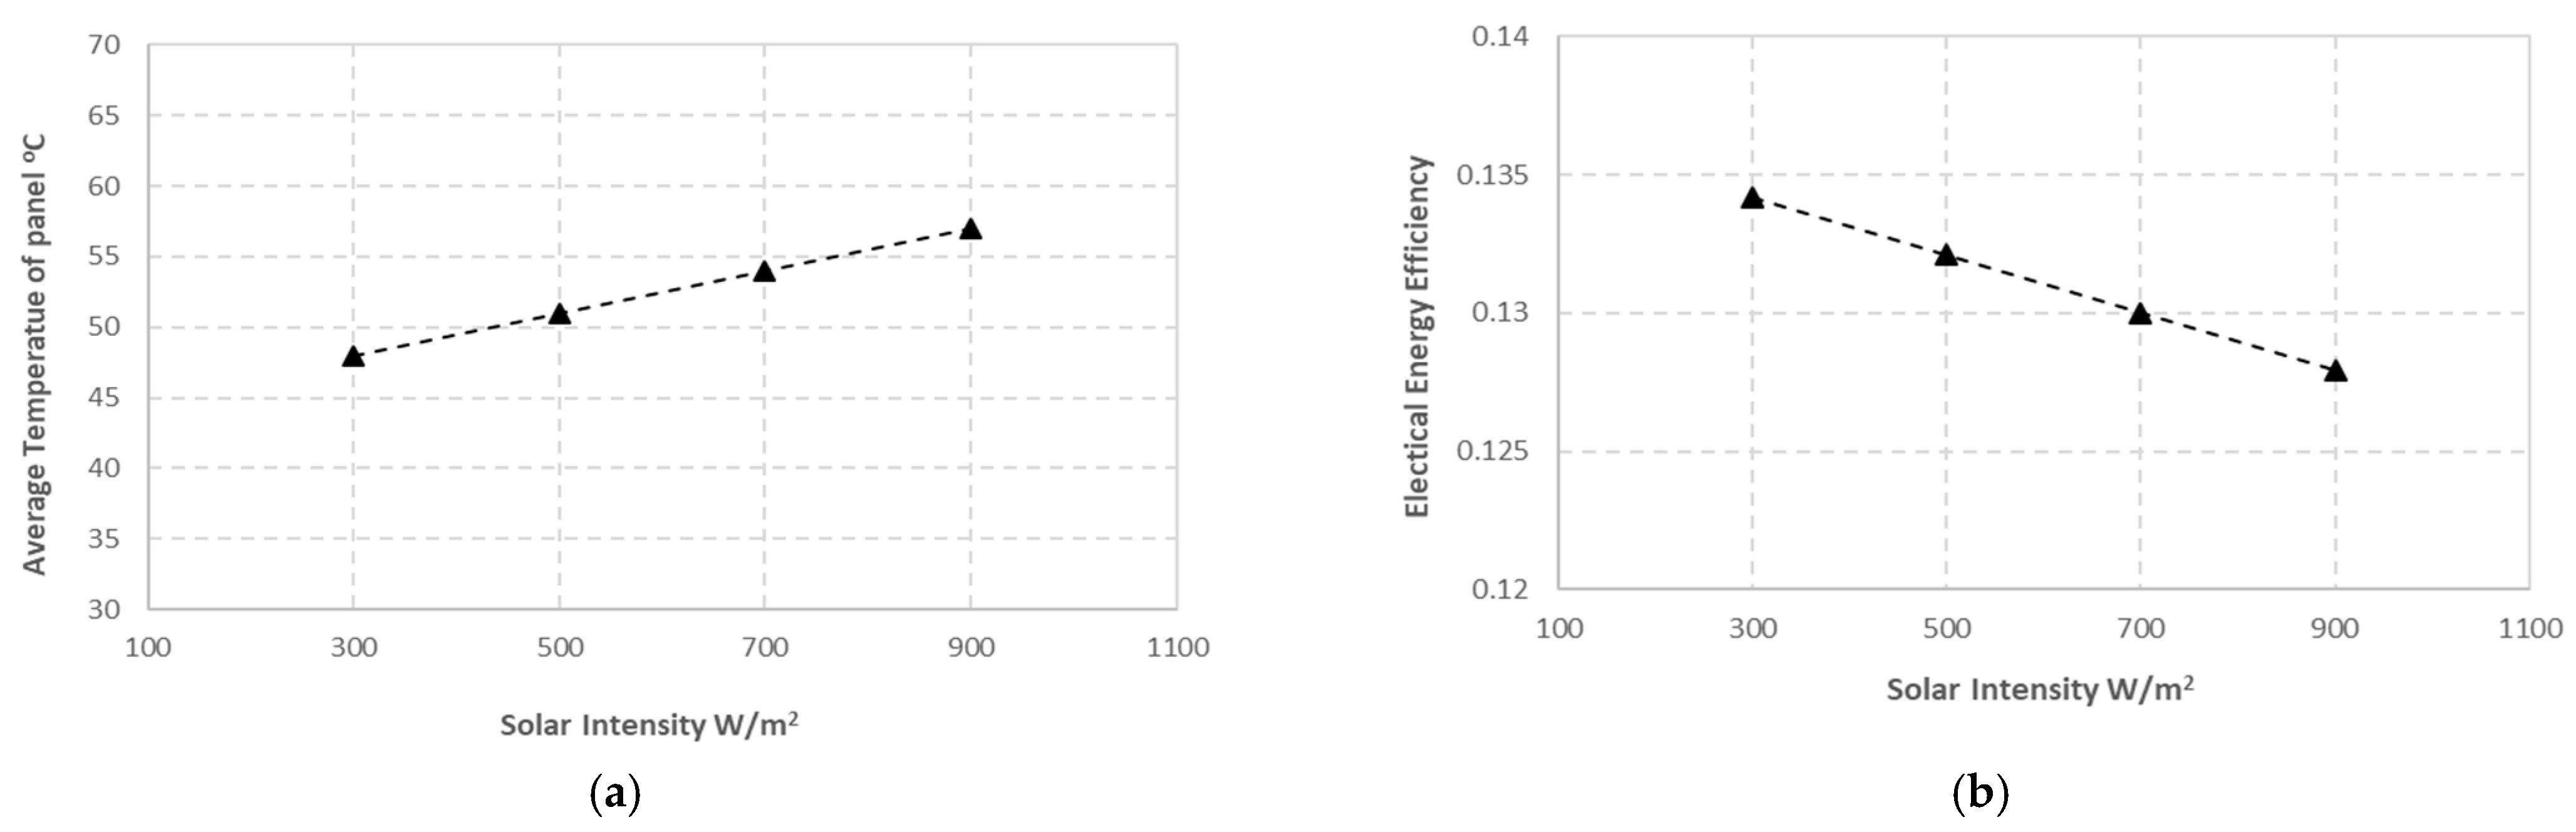
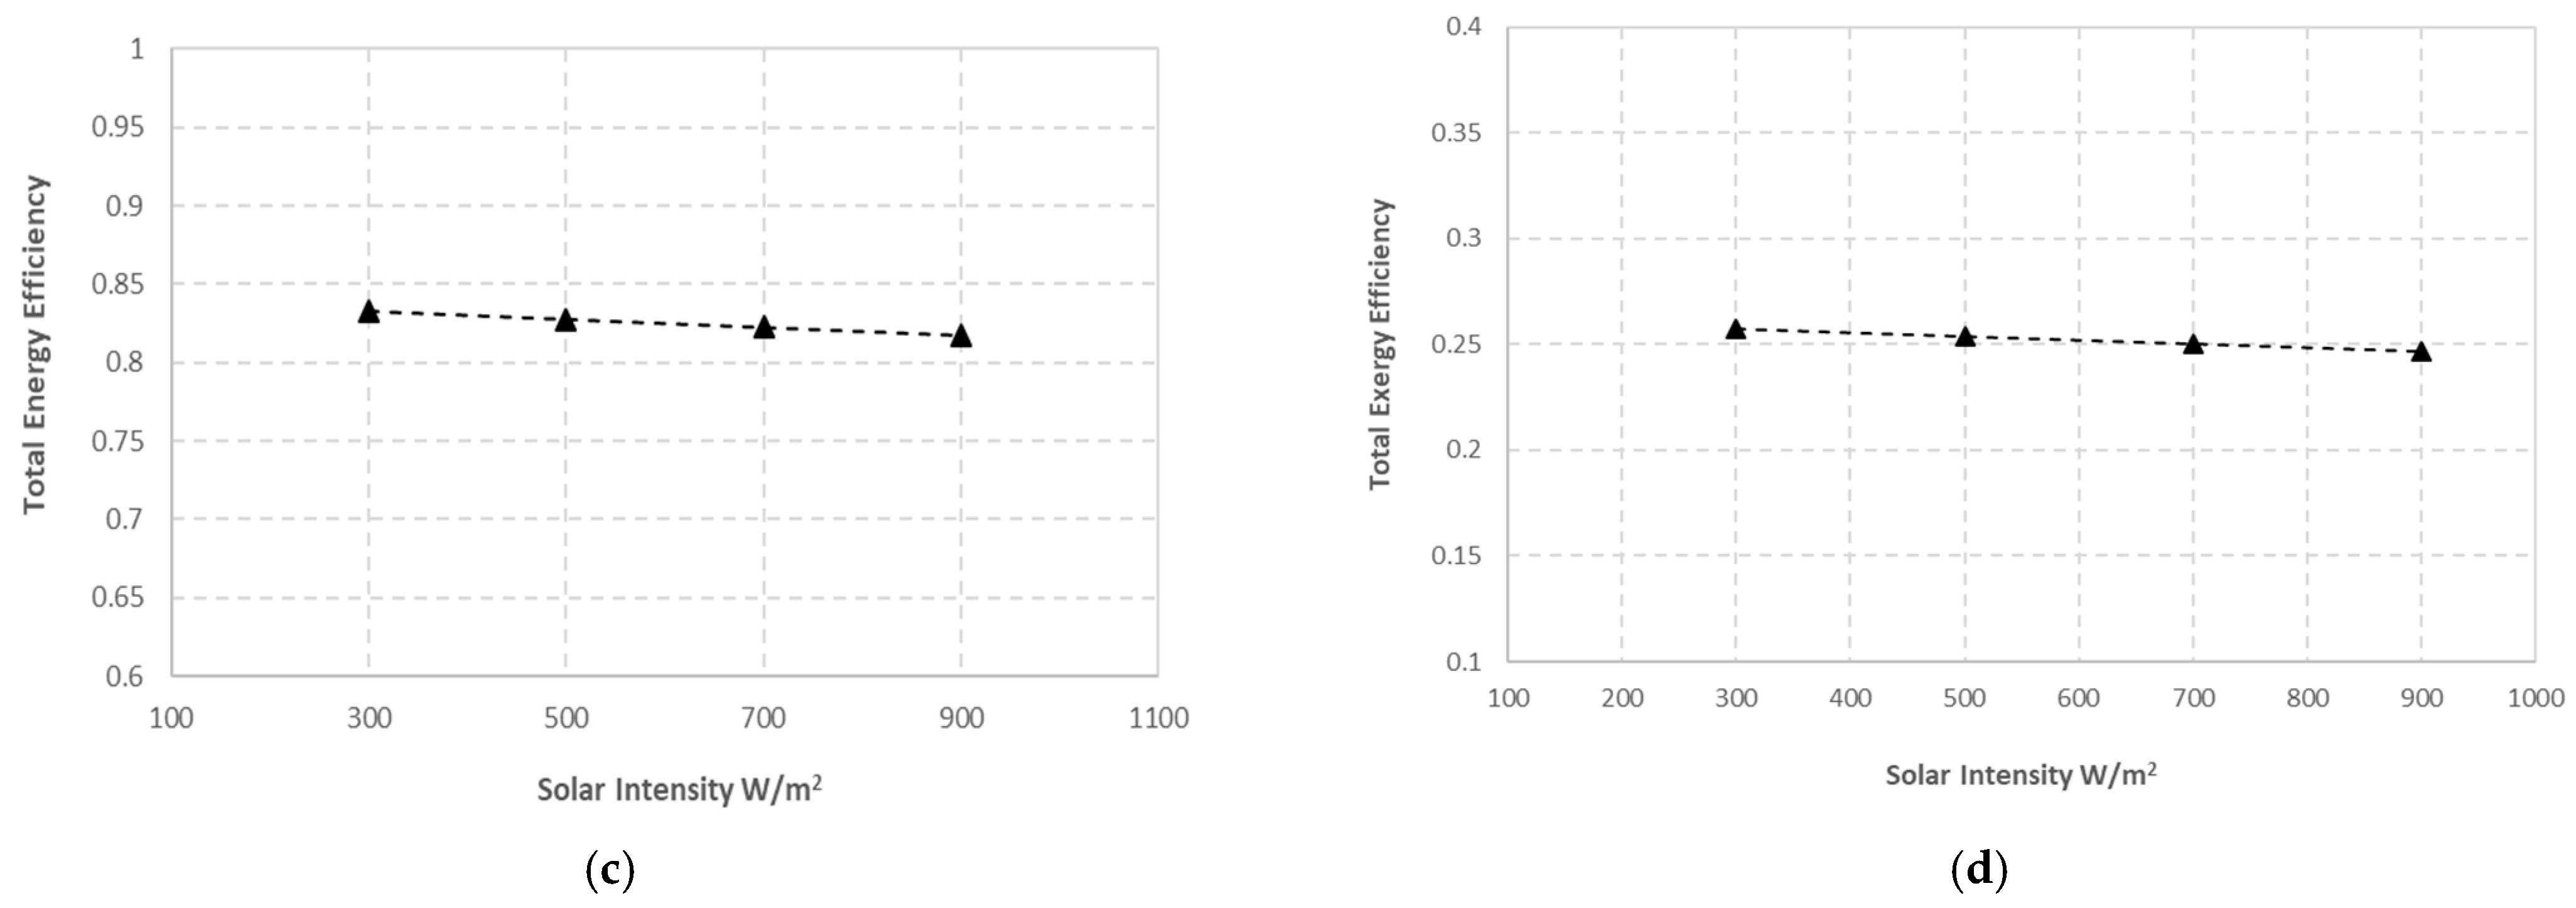
5.2.4. Effect of Solar Intensity
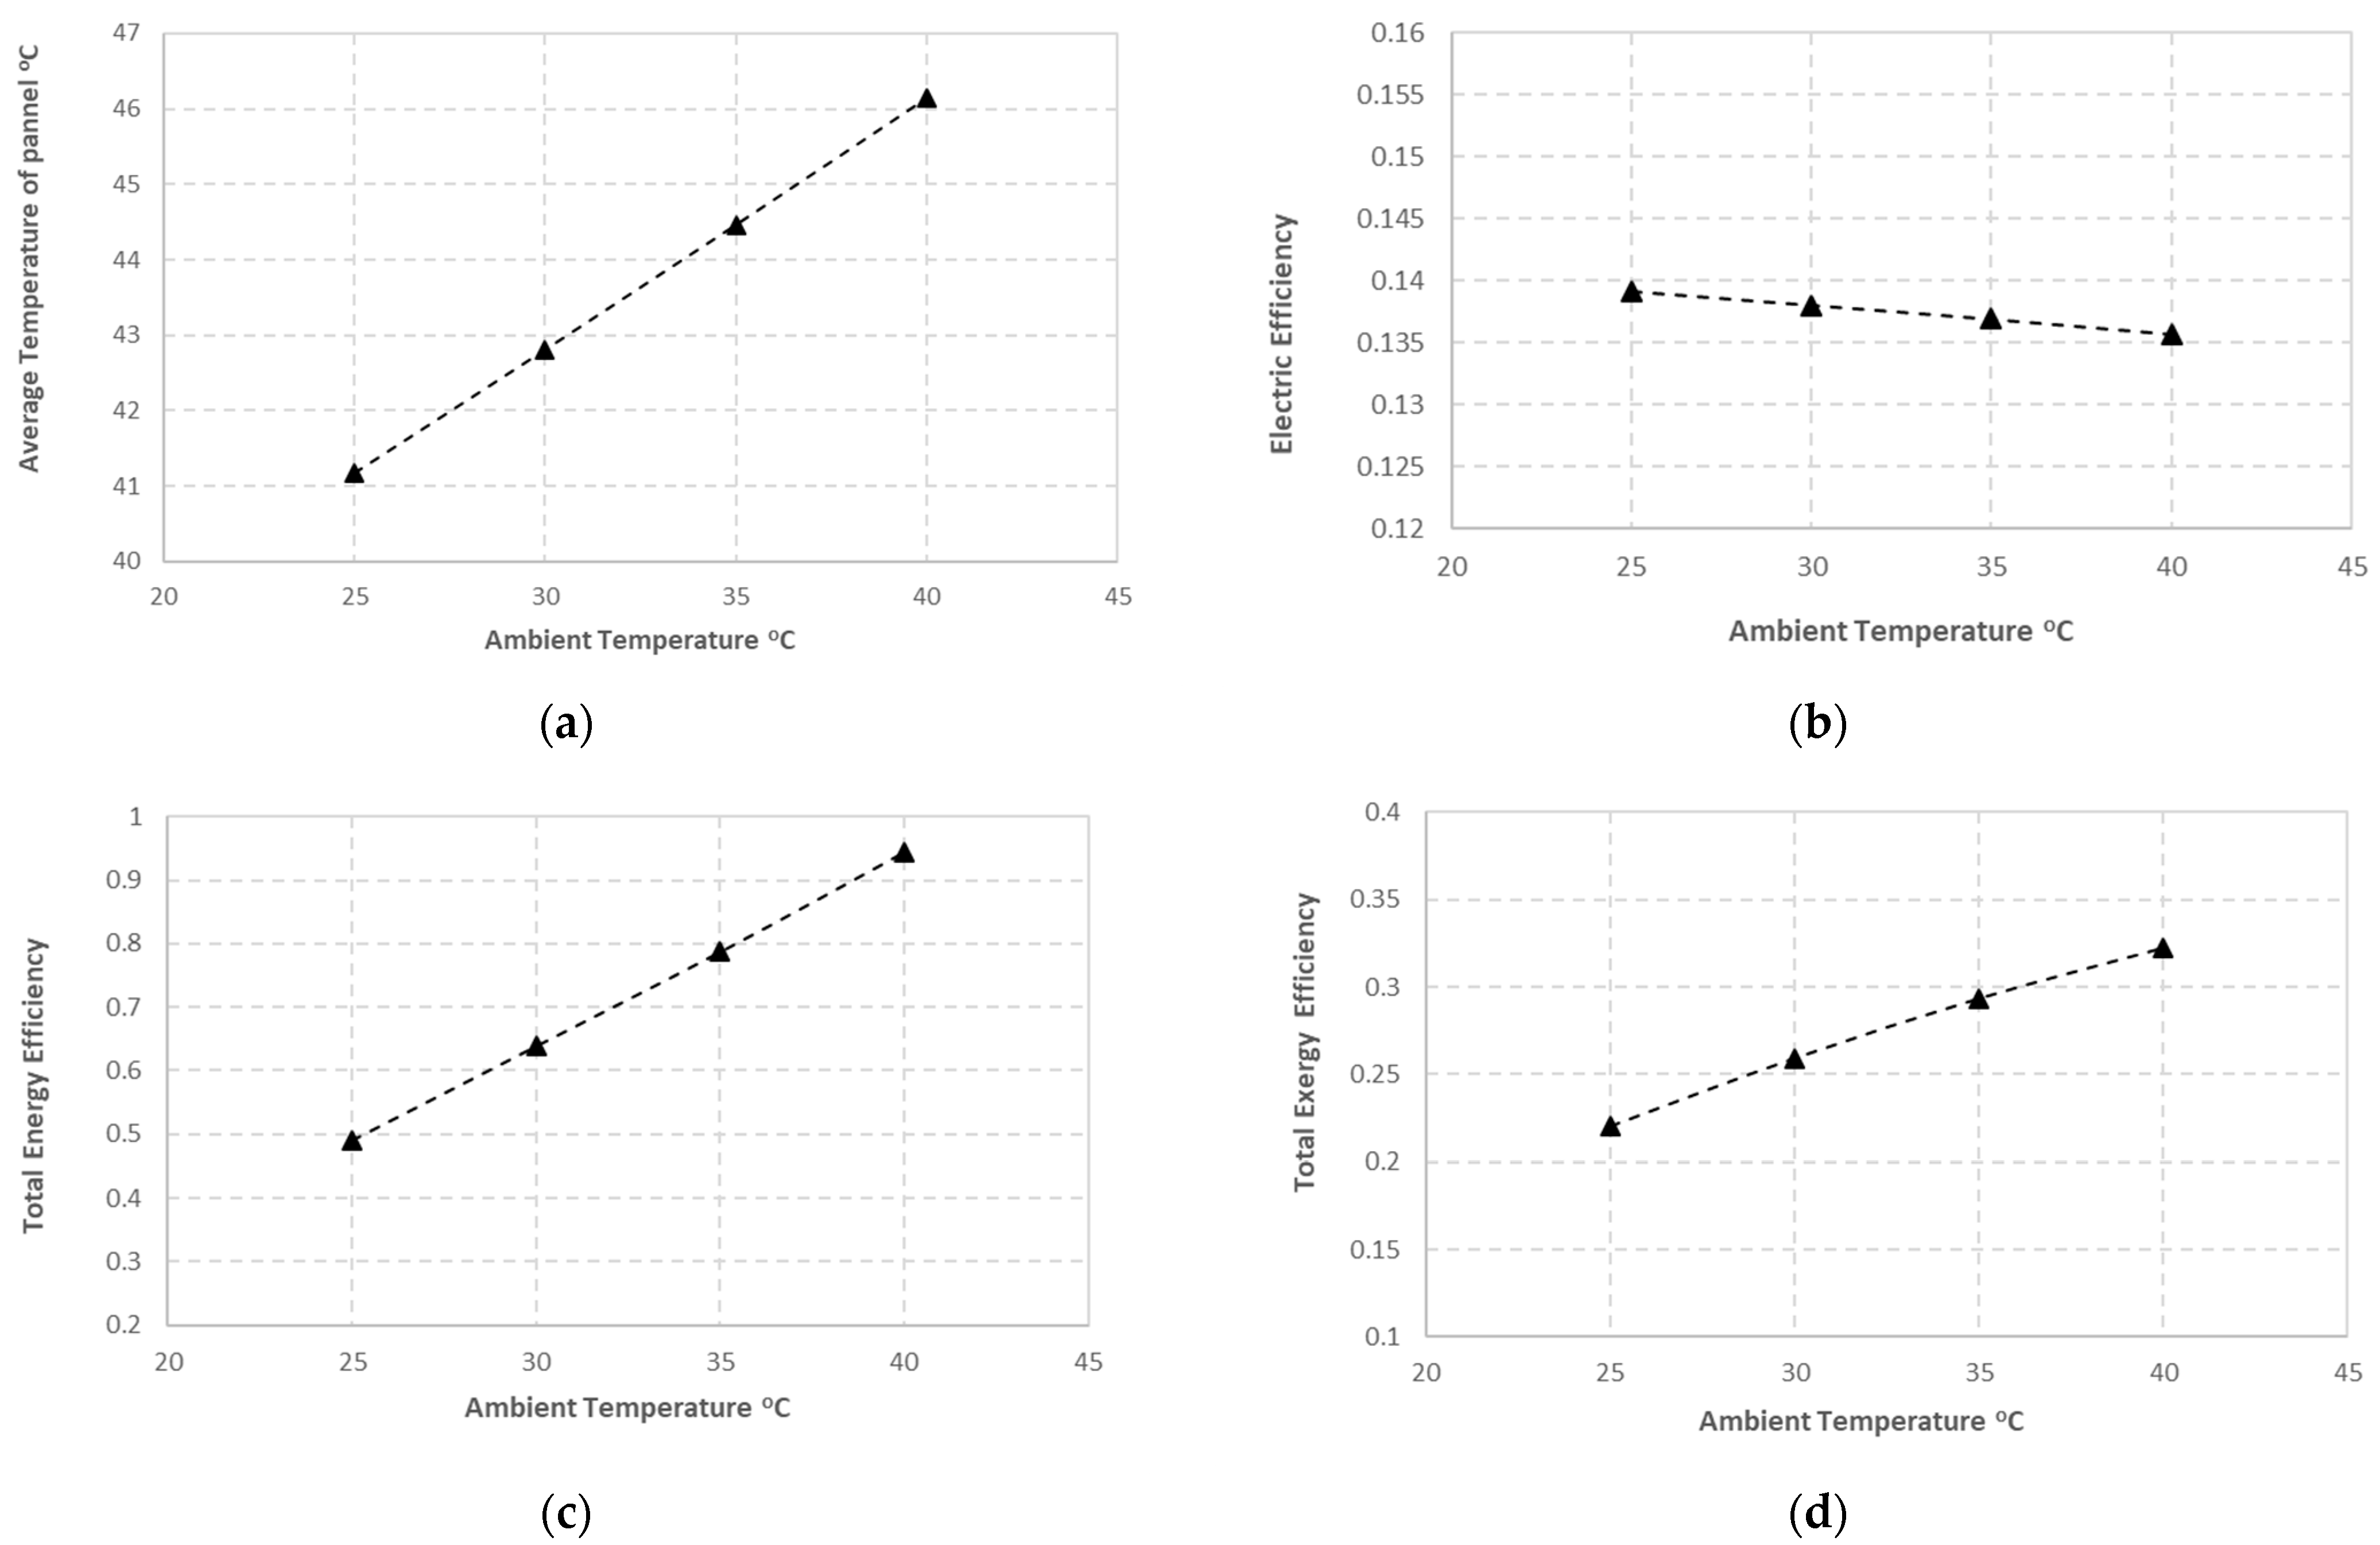
5.2.5. Effect of Ambient Temperature
6. Conclusions
- The best cooling system is using water at the bottom of the panel (pattern 5), followed by using air at the top of the panel and water at the bottom of the panel, and the worst is using air at the bottom and top of the panel (pattern 2). The average panel temperature of pattern 5 is 21 °C lower than the average panel temperature of pattern 2.
- The highest efficiency of total energy is achieved with 90% when water is used as coolant at the bottom of the panel and air at the top (pattern 1); 34% is the lowest efficiency of total energy when air is used as coolant at the bottom of the panel (pattern 4).
- The performance of the PVT system was improved by increasing the water flow rate up to 0.05 kg/s. Above 0.05 kg/s, the improvement is insignificant.
- An increase in solar radiation has no effect on the performance of the PVT system.
- Increasing the ambient temperature will increase the collector temperature, decreasing the electrical energy efficiency by up to 13.5% but increasing the total energy efficiency in the PVT system by up to 90%.
Funding
Data Availability Statement
Conflicts of Interest
Nomenclature
| A | Area (m2) | Subscripts | |
| D | Diameter | a | Air |
| Cp | Specific heat of fluid (J/kg·K) | amb | Ambient |
| Electric Power (W) | conv | Convection | |
| Exergy | eff | Effective | |
| h | Coefficient of heat transfer (W/m2·K) | f1 | Fluid 1 |
| i | interval | el | Electrical |
| Flow rate of mass (kg/s) | f2 | Fluid 2 | |
| k | Thermal conductivity (W/m·K) | g | Glass cover |
| Nu | Nusslet number | h | Hydraulic |
| P∗ | Power (W) | in | Input |
| Pr | Prandtl number | ins | Insulation |
| PV | Photovoltaic panel | loss | loss |
| PVT | Photovoltaic thermal | max | Maximum |
| q | Heat transfer per unit area (J/m2) | out | Outlet |
| s | Specific entropy (J/kg·K) | pl | plate |
| Re | Reynolds number | pv | Photovoltaic unit |
| t | Time (s) | rad | radiation |
| T | Temperature (K) | ref | Reference |
| th | Specific enthalpy (J/kg) | t | Time |
| x | Interval of length (m) | th | Thermal |
| V | Velocity (m/s) | W | Wind |
| w | Width (m) | w | Water |
| Greeks | |||
| α | Absorptivity | ||
| η | Energy Efficiency | ||
| ρ | Density (kg/m3) | ||
| ζ | Exergy efficiency | ||
| σ | Stefan-Boltzmann constant (W/m2·K4) | ||
| ε | Emissivity | ||
| μ | Dynamic viscosity (kg/m·s) | ||
| ᵟ | Thickness (m) | ||
| τ | Transmissivity of glass cover |
Appendix A
References
- Said, Z.; Arora, S.; Bellos, E. A review on performance and environmental effects of conventional and nanofluid-based thermal photovoltaics. Renew. Sustain. Energy Rev. 2018, 94, 302–316. [Google Scholar] [CrossRef]
- Bhargava, A.K.; Garg, H.; Agarwal, R.K. Study of a hybrid solar system—Solar air heater combined with solar cells. Energy Convers. Manag. 1991, 31, 471–479. [Google Scholar] [CrossRef]
- Agarwal, R.K.; Garg, H. Study of a photovoltaic-thermal system—Thermosyphonic solar water heater combined with solar cells. Energy Convers. Manag. 1994, 35, 605–620. [Google Scholar] [CrossRef]
- Garg, H.; Agarwal, R.; Joshi, J. Experimental study on a hybrid photovoltaic-thermal solar water heater and its performance predictions. Energy Convers. Manag. 1994, 35, 621–633. [Google Scholar] [CrossRef]
- Garg, H.; Agarwal, R. Some aspects of a PV/T collector/forced circulation flat plate solar water heater with solar cells. Energy Convers. Manag. 1995, 36, 87–99. [Google Scholar] [CrossRef]
- Garg, H.P.; Adhikari, R.S. Conventional hybrid photovoltaic/thermal (PV/T) air heating collectors: Steady-state simulation. Renew. Energy 1997, 11, 363–385. [Google Scholar] [CrossRef]
- Garg, H.P.; Adhikari, R.S. Optical design calculations for CPCs. Energy Int. J. 1998, 23, 907–909. [Google Scholar]
- Garg, H.P.; Adhikari, R.S. Transient simulation of conventional hybrid photovoltaic/thermal (PV/T) air heating collectors. Int. J. Energy Res. 1998, 22, 547–562. [Google Scholar] [CrossRef]
- Garg, H.P.; Adhikari, R.S. System performance studies on a photovoltaic/thermal (PV/T) air heating collector. Renew. Energy 1999, 16, 725–730. [Google Scholar] [CrossRef]
- Garg, H.P.; Adhikari, R.S. Performance analysis of a hybrid photovoltaic/thermal (PV/T) collector with integrated CPC troughs. Int. J. Energy Res. 1999, 23, 1295–1304. [Google Scholar] [CrossRef]
- Sopian, K.; Yigit, K.S.; Liu, H.T.; Kakaç, S.; Veziroglu, T.N. Performance analysis of photovoltaic thermal air heaters. Energy Convers. Manag. 1996, 37, 1657–1670. [Google Scholar] [CrossRef]
- Sopian, K.; Liu, H.; Kakac, S.; Veziroglu, T. Performance of a double pass photovoltaic thermal solar collector suitable for solar drying systems. Energy Convers. Manag. 2000, 41, 353–365. [Google Scholar] [CrossRef]
- Prakash, J. Transient analysis of a photovoltaic-thermal solar collector for co-generation of electricity and hot air/water. Energy Convers. Manag. 1994, 35, 967–972. [Google Scholar] [CrossRef]
- Rejeb, O.; Dhaou, H.; Jemni, A. A numerical investigation of a photovoltaic thermal (PV/T) collector. Renew. Energy 2015, 77, 43–50. [Google Scholar] [CrossRef]
- Al Harbi, Y.; Eugenio, N.N.; Al Zahrani, S. Photovoltaic-thermal solar energy experiment in Saudi Arabia. Renew Energy 1998, 15, 483–486. [Google Scholar] [CrossRef]
- Calise, F.; Figaj, R.D.; Vanoli, L. Experimental and Numerical Analyses of a Flat Plate Photovoltaic/Thermal Solar Collector. Energies 2017, 10, 491. [Google Scholar] [CrossRef]
- Hussain, M.I.; Kim, J.-H.; Kim, J.-T. Nanofluid-Powered Dual-Fluid Photovoltaic/Thermal (PV/T) System: Comparative Numerical Study. Energies 2019, 12, 775. [Google Scholar] [CrossRef]
- El Manssouri, O.; Hajji, B.; Tina, G.M.; Gagliano, A.; Aneli, S. Electrical and Thermal Performances of Bi-Fluid PV/Thermal Collectors. Energies 2021, 14, 1633. [Google Scholar] [CrossRef]
- Van Hoang, V.; Le, H.C.; Nguyen, B.T. Energy, Exergy Efficiency and Thermal-Electrical Production Assessment for an Active Water Heating System Using Four PV/T Module Models. Energies 2022, 15, 9634. [Google Scholar] [CrossRef]
- Charalambous, P.G.; Maidment, G.G.; Kalogirou, S.A.; Yiakoumetti, K. Photovoltaic thermal (PV/T) collectors: A review. Appl. Therm. Eng. 2007, 27, 275–286. [Google Scholar] [CrossRef]
- Ibrahim, A.; Othman, M.Y.; Ruslan, M.H.; Mat, S.; Sopian, K. Recent advances in flat plate photovoltaic/thermal (PV/T) solar collectors. Renew. Sustain. Energy Rev. 2010, 15, 352–365. [Google Scholar] [CrossRef]
- Kazem, H.A.; Chaichan, M.T.; Yousif, J.H. Evaluation of oscillatory flow Photovoltaic/Thermal system in Oman. Int. J. Comput. Appl. Sci. 2019, 6, 1. [Google Scholar]
- Fuentes, M.; Vivar, M.; de la Casa, J.; Aguilera, J. An experimental comparison between commercial hybrid PV-T and simple PV systems intended for BIPV. Renew. Sustain. Energy Rev. 2018, 93, 110–120. [Google Scholar] [CrossRef]
- Souliotis, M.; Arnaoutakis, N.; Panaras, G.; Kavga, A.; Papaefthimiou, S. Experimental study and Life Cycle Assessment (LCA) of Hybrid Photovoltaic/Thermal (PV/T) solar systems for domestic applications. Renew. Energy 2018, 126, 708–723. [Google Scholar] [CrossRef]
- Joshi, A.S.; Tiwari, A. Energy and exergy efficiencies of a hybrid photovoltaic–thermal (PV/T) air collector. Renew. Energy 2007, 32, 2223–2241. [Google Scholar] [CrossRef]
- Fakouriyan, S.; Saboohi, Y.; Fathi, A. Experimental analysis of a cooling system effect on photovoltaic panels’ efficiency and its preheating water production. Renew. Energy 2019, 134, 1362–1368. [Google Scholar] [CrossRef]
- Omer, K.A.; Zala, A.M. Experimental investigation of PV/thermal collector with theoretical analysis. Renew. Energy Focus 2018, 27, 67–77. [Google Scholar] [CrossRef]
- Hu, M.; Zhao, B.; Ao, X.; Zhao, P.; Su, Y.; Pei, G. Field investigation of a hybrid photovoltaic-photothermic-radiative cooling system. Appl. Energy 2018, 231, 288–300. [Google Scholar] [CrossRef]
- Manokar, A.M.; Winston, D.P.; Kabeel, A.; El-Agouz, S.; Sathyamurthy, R.; Arunkumar, T.; Madhu, B.; Ahsan, A. Integrated PV/T solar still- A mini-review. Desalination 2018, 435, 259–267. [Google Scholar] [CrossRef]
- Zondag, H.; de Vries, D.; van Helden, W.; van Zolingen, R.; van Steenhoven, A. The yield of different combined PV-thermal collector designs. Sol. Energy 2003, 74, 253–269. [Google Scholar] [CrossRef]
- Tiwari, A.; Sodha, M. Performance evaluation of solar PV/T system: An experimental validation. Sol. Energy 2006, 80, 751–759. [Google Scholar] [CrossRef]
- Nafey, A.; Fath, H.; El-Helaby, S.; Soliman, A. Solar desalination using humidification dehumidification processes. Part I. A Numer. Investig. Energy Convers. Manag. 2004, 45, 1243–1261. [Google Scholar] [CrossRef]
- Fine, J.P.; Dworkin, S.B.; Friedman, J. A methodology for predicting hybrid solar panel performance in different operating modes. Renew. Energy 2018, 130, 1198–1206. [Google Scholar] [CrossRef]
- Bambrook, S.; Sproul, A. A solvable thermal circuit for modelling PVT air collectors. Sol. Energy 2016, 138, 77–87. [Google Scholar] [CrossRef]
- Kazemiana, A.; Salarib, A.; Hakkaki-Fardb, A.; Maa, T. Numerical investigation and parametric analysis of a photovoltaic thermal system integrated with phase change material. Appl. Energy 2019, 238, 734–746. [Google Scholar] [CrossRef]
- Aberoumanda, S.; Ghamarib, S.; Shabanic, B. Energy and exergy analysis of a photovoltaic thermal (PV/T) system using nanofluids: An experimental study. Sol. Energy 2018, 165, 167–177. [Google Scholar] [CrossRef]
- Kazemiana, A.; Taherib, A.; Sardarabadib, A.; Maa, T.; Passandideh-Fardb, M.; Peng, J. Energy, exergy and environmental analysis of glazed and unglazed PVT system integrated with phase change material: An experimental approach. Sol. Energy 2020, 201, 178–189. [Google Scholar] [CrossRef]
- Nazri, N.S.; Fudholi, A.; Mustafa, W.; Hoy Yen, C.H.; Mohammad, M.; Ruslan, M.H.; Sopian, K. Exergy and improvement potential of hybrid photovoltaic thermal/ thermoelectric (PVT/TE) air collector. Renew. Sustain. Energy Rev. 2019, 111, 132–144. [Google Scholar] [CrossRef]
- Fudholia, A.; Zohria, M.; Rukmana, N.S.B.; Nazria, N.S.; Mustaphaa, M.; Yena, C.H.; Mohammada, M.; Sopian, K. Exergy and sustainability index of photovoltaic thermal (PVT) air collector: A theoretical and experimental study. Renew. Sustain. Energy Rev. 2019, 100, 44–51. [Google Scholar] [CrossRef]
- Sobhnamayan, F.; Sarhaddi, F.; Alavi, M.A.; Farahat, S.; Yazdanpanahi, J. Optimization of a solar photovoltaic thermal (PV/T) water collector based on exergy concept. Renew. Energy 2014, 68, 356–365. [Google Scholar] [CrossRef]
- Menon, G.S.; Murali, S.; Elias, J.; Aniesrani Delfiya, D.S.; Alfiya, P.V.; Samuel, M.P. Experimental investigations on unglazed photovoltaic-thermal (PVT) system using water and nanofluid cooling medium. Renew. Energy 2022, 188, 986–996. [Google Scholar] [CrossRef]
- Evola, G.; Marletta, L. Exergy and thermoeconomic optimization of a water-cooled glazed hybrid photovoltaic/thermal (PVT) collector. Sol. Energy 2014, 107, 12–25. [Google Scholar] [CrossRef]
- Shan, F.; Tang, F.; Cao, L.; Fang, G. Comparative simulation analyses on dynamic performances of photovoltaic–thermal solar collectors with different configurations. Energy Convers. Manag. 2014, 87, 778–786. [Google Scholar] [CrossRef]
- Su, D.; Jia, Y.; Huang, X.; Alva, G.; Tang, Y.; Fang, G. Dynamic performance analysis of photovoltaic–thermal solar collector with dual channels for different fluids. Energy Convers. Manag. 2016, 120, 13–24. [Google Scholar] [CrossRef]


| Time | Solar Intensity (W/m2) | Ambient Temperature (°C) | Inlet Water Temperature (°C) |
|---|---|---|---|
| 8 | 325 | 25 | 27 |
| 9 | 450 | 26 | 30 |
| 10 | 600 | 28 | 34 |
| 11 | 800 | 30 | 38 |
| 12 | 750 | 31 | 40 |
| 13 | 700 | 33 | 44 |
| 14 | 600 | 32 | 46 |
| 15 | 500 | 31 | 48 |
| 16 | 300 | 30 | 50 |
| Time | Solar Intensity (W/m2) | Ambient Temperature (°C) | Inlet Water Temperature (°C) |
|---|---|---|---|
| 10 | 600 | 33 | 33 |
| 11 | 750 | 33.5 | 34 |
| 12 | 900 | 36 | 35 |
| 13 | 850 | 35.8 | 37 |
| 14 | 750 | 35.5 | 42 |
| 15 | 600 | 34.8 | 43 |
| 16 | 450 | 32.5 | 44 |
| Time | Solar Intensity (W/m2) | Ambient Temperature (°C) | Inlet Water Temperature (°C) |
|---|---|---|---|
| 8 | 720 | 26 | 35 |
| 9 | 800 | 28 | 35 |
| 10 | 850 | 30 | 35 |
| 11 | 870 | 32 | 35 |
| 12 | 890 | 35 | 35 |
| 13 | 860 | 36 | 35 |
| 14 | 860 | 35 | 35 |
| 15 | 820 | 34 | 35 |
| 16 | 720 | 33 | 35 |
| 17 | 550 | 30 | 35 |
| Time | Solar Intensity (W/m2) | Ambient Temperature (°C) |
|---|---|---|
| 9 | 200 | 30 |
| 10 | 400 | 31 |
| 11 | 600 | 32 |
| 12 | 900 | 33 |
| 13 | 1000 | 34 |
| 14 | 950 | 35 |
| 15 | 900 | 37 |
| 16 | 800 | 36 |
| 17 | 600 | 35 |
| 18 | 300 | 34 |
| Time | Solar Intensity (W/m2) | Ambient Temperature (°C) |
|---|---|---|
| 8 | 130 | 7 |
| 9 | 220 | 12 |
| 10 | 430 | 15 |
| 11 | 550 | 18 |
| 12 | 680 | 20 |
| 13 | 600 | 22 |
| 14 | 280 | 22 |
| 15 | 260 | 22 |
| 16 | 100 | 21 |
| Type | Polycrystalline |
|---|---|
| Maximum Power | 300 Watt |
| Open circuit voltage | 45.7 V |
| Short circuit current | 8.55 A |
| 15.45% | |
| Cell size | 156 mm × 156 mm |
| Dimensions | 1956 × 992 × 50 mm |
| The thickness of solar cell | 0.3 mm |
| The thermal conductivity of solar cell | 0.036 W/M·K |
| The absorptivity of solar cell | 0.85 |
| The emissivity of solar cell | 0.97 |
| The length of fluid channel | 1956 mm |
| The width of fluid channel | 992 mm |
| The depth of fluid channel | 50 mm |
| The thermal conductivity of insulator | 0.035 W/m·K |
| The thickness of insulator | 50 mm |
| The thickness of glass cover | 0.5 mm |
| The thermal conductivity of glass cover | 1 W/m·K |
| The absorptivity of glass cover, | 0.06 |
| The transmissivity of glass cover | 0.84 |
| The emissivity of glass cover | 0.93 |
Disclaimer/Publisher’s Note: The statements, opinions and data contained in all publications are solely those of the individual author(s) and contributor(s) and not of MDPI and/or the editor(s). MDPI and/or the editor(s) disclaim responsibility for any injury to people or property resulting from any ideas, methods, instructions or products referred to in the content. |
© 2023 by the author. Licensee MDPI, Basel, Switzerland. This article is an open access article distributed under the terms and conditions of the Creative Commons Attribution (CC BY) license (https://creativecommons.org/licenses/by/4.0/).
Share and Cite
Soliman, A.M. A Numerical Investigation of PVT System Performance with Various Cooling Configurations. Energies 2023, 16, 3052. https://doi.org/10.3390/en16073052
Soliman AM. A Numerical Investigation of PVT System Performance with Various Cooling Configurations. Energies. 2023; 16(7):3052. https://doi.org/10.3390/en16073052
Chicago/Turabian StyleSoliman, Ahmed Mohamed. 2023. "A Numerical Investigation of PVT System Performance with Various Cooling Configurations" Energies 16, no. 7: 3052. https://doi.org/10.3390/en16073052
APA StyleSoliman, A. M. (2023). A Numerical Investigation of PVT System Performance with Various Cooling Configurations. Energies, 16(7), 3052. https://doi.org/10.3390/en16073052