Article

Statistical Analysis of the Interdependence between the Technical and Functional Parameters of Electric Vehicles in the European Market

1
Automotive Engineering and Transports Department, Technical University of Cluj-Napoca, 400114 Cluj-Napoca, Romania
2
PACS Faculty, Babes-Bolyai University of Cluj-Napoca, 71 General Traian Mosoiu St., 400347 Cluj-Napoca, Romania
*
Author to whom correspondence should be addressed.
Energies 2023, 16(7), 2974; https://doi.org/10.3390/en16072974
Submission received: 27 February 2023 / Revised: 20 March 2023 / Accepted: 22 March 2023 / Published: 24 March 2023
(This article belongs to the Section E: Electric Vehicles)

Abstract

:
The vehicle market at the European level (and also elsewhere) has registered a high dynamic for the adoption of electric vehicles as the future means of transport. Government policies and decisions fully support this move, but there are still massive barriers to entry into the EV market due to consumer attitudes and perceptions. Consumer attitudes and perceptions will be decisive in the market success of future electric vehicle models, given that consumers are particularly interested in the vehicles’ technical and dynamic performance. The pressure from customers’ demands for performance leaves its mark not only on the increase of performance and technical parameters, but directly contributes to the generation of interdependence between these parameters. This article presents a comparative statistical analysis of 203 electric vehicle models (from various construction categories), present in the European vehicle market (between the years 2019 and 2022), to highlight the direct and indirect links (interdependencies) between technical and performance parameters depending on the constructive class (type). The goal of this article is to determine whether there is a relationship between the three key performance metrics for electric vehicles—autonomy, top speed, and acceleration—and five significant technical/constructive metrics for these vehicles—battery capacity, energy efficiency, electric motor power, fast charging speed, and vehicle weight (brand and year of availability in the market). Based on the analyzed data, it can be stated that the design and construction of an electric vehicle model currently takes into account both performance and technical parameters, with a strong link between the weight of the vehicle and the energy capacity of the battery (+0.687) being highlighted and also the relationship between autonomy and vehicle weight (+0.355). The conclusions of this study can be used in the future by manufacturers for the development of new models of electric vehicles (new generic platforms and chassis) by classifying/standardizing these vehicles into specific classes, corresponding to the requirements of different classes of consumers or identifying constructive solutions specific to each type of consumer.

1. Introduction

There is no longer any doubt that humanity is currently facing the worldwide effects of climate change due to the massive industrial pollution of the last two centuries. The pollution is mainly due to the large-scale use of fossil fuels, both in industrial processes and especially in fueling vehicles used for transport equipped with internal combustion engines. However, it must be said that, from a historical point of view, the transport of goods and passengers has made its full contribution to the development of society by connecting economies and the circulation of commodities, goods, and people on a global level. Contemporary pollution is the product of both the accumulation over time of polluting emissions caused by industrial activity and the high levels due to the current fields of transport. According to a study conducted by the European Environmental Agency (EEA), using data for the 2019 year, road transport is responsible for 71.7% of emissions in the EU-27 transportation sector, with passenger cars playing the largest role, accounting for 60.6% of emissions (heavy-duty trucks and buses together represent 27.1% of road transport emissions) [1]. Pollutant emissions due to means of transport have an effect not only on climate change (through greenhouse gas emissions), but also, unfortunately, on human health [2,3]. Both gasoline and diesel engine emissions contain substances that have a direct impact on human health, especially in large urban agglomerations, where the population density and the intensity of use of means of transport are high. That is why efforts are being made for urban passenger transport systems to be based on non-polluting means of transport, using electricity as the main energy source [4].
In this context, at the European Union level (and also elsewhere), measures have been taken by adopting common European policies to reduce emissions due to the transport sector. Starting from the adoption of the Euro norms regarding the emission limits specific to internal combustion engines (CO2, NOx, HC, PM) and until the last decision regarding the adoption of a deadline regarding the manufacture of internal combustion engines (2035), all these decisions aim to drastically reduce the use of fossil fuels in transport and implicitly reduce the pollution caused by them. The application of these policies is based on the adoption of electric vehicles as a future sustainable means of transport. An electric vehicle uses electric energy stored in a battery (BEV—Battery Electric Vehicle) or produced (FCEV—Fuel Cell Electric Vehicle) as its energy source, with local emissions being zero from this point of view, a property that favors the implementation and use of electric vehicles in urban passenger transport systems (bicycle, car–taxi, bus) [5]. The solution for the adoption of electric vehicles in large urban agglomerations (despite the permanent development of internal combustion engines in terms of energy efficiency and reduction of pollutant emissions [6,7,8]) is given by the possibility of the local elimination of pollutant emissions, but the limited storage capacity of electricity in the batteries has a direct effect on the travel autonomy (the maximum distance that can be traveled until a new battery recharge). There is continuous research on how to increase the specific capacity (kWh/kg) and the efficiency of the battery [9,10,11], along with finding technological solutions to implement these technologies in medium and heavy transport vehicles [12,13,14]. The conclusions of this research emphasize the necessity to design the vehicle with the right battery capacity by analyzing operational patterns and transport potential for a successful exploitation.
In fact, research related to increasing the performance of electric vehicles must consider the direct/dependent links between the constructive, functional, and operating parameters, as shown in Figure 1.
It should not be neglected that the electrical energy required to charge the battery has its own pollution footprint, the footprint that depends directly on the energy mix of energy production [15,16]. At the European Union level (reference year 2019), the average emission for electricity production is 275 gCO2e/kWh, with a maximum of 719 gCO2e/kWh in the case of Poland and a minimum of 52 gCO2e/kWh in the case of France [17], and for these reasons, continuous efforts are made to ensure that the electricity used to charge electric vehicles comes from sustainable sources, which would lead to the elimination of the indirect effects of pollution due to the production of electricity [18].
Always, the adoption of new and/or emerging technologies is directly related to the attitudes and perception of consumers, and also to their political support decisions. Numerous studies have been conducted regarding the adoption of electric vehicles, all starting from the need to identify the barriers to entry and the mass adoption of electric vehicles by consumers, along with other studies that have analyzed the impact of political and economic support decisions (in the form of purchase subsidies) [19,20,21,22]. The resulting conclusions showed that, on the one hand, the subsidies granted, exemptions from local taxes, and the benefits of using electric vehicles in urban traffic (free parking, for example) are decisive in the purchase of an electric vehicle, while, on the other hand, the costs involved in the subsidies granted by the authorities for the purchase of electric vehicles are not always effective from the point of view of economic efficiency [4].
In general, it can be concluded that the barriers to entry and the mass adoption of electric vehicles in the vehicle market depend on purchase price, autonomy/range, national/local politics, values of subsidies, benefits of use, battery life cycle, total cost of ownership (TCO), exploitation costs, availability of recharging stations, age, gender, average distance for a trip, frequency of use, model, and number of seats, with slight variations in weight and/or importance for different geographical areas [19,23,24,25]. It is observed that some of the market barriers are directly related to the direct/indirect intervention of political decision-makers (the economic and policies component) and others are related to the manufacturers of electric vehicles (the component related to the required technical performances).
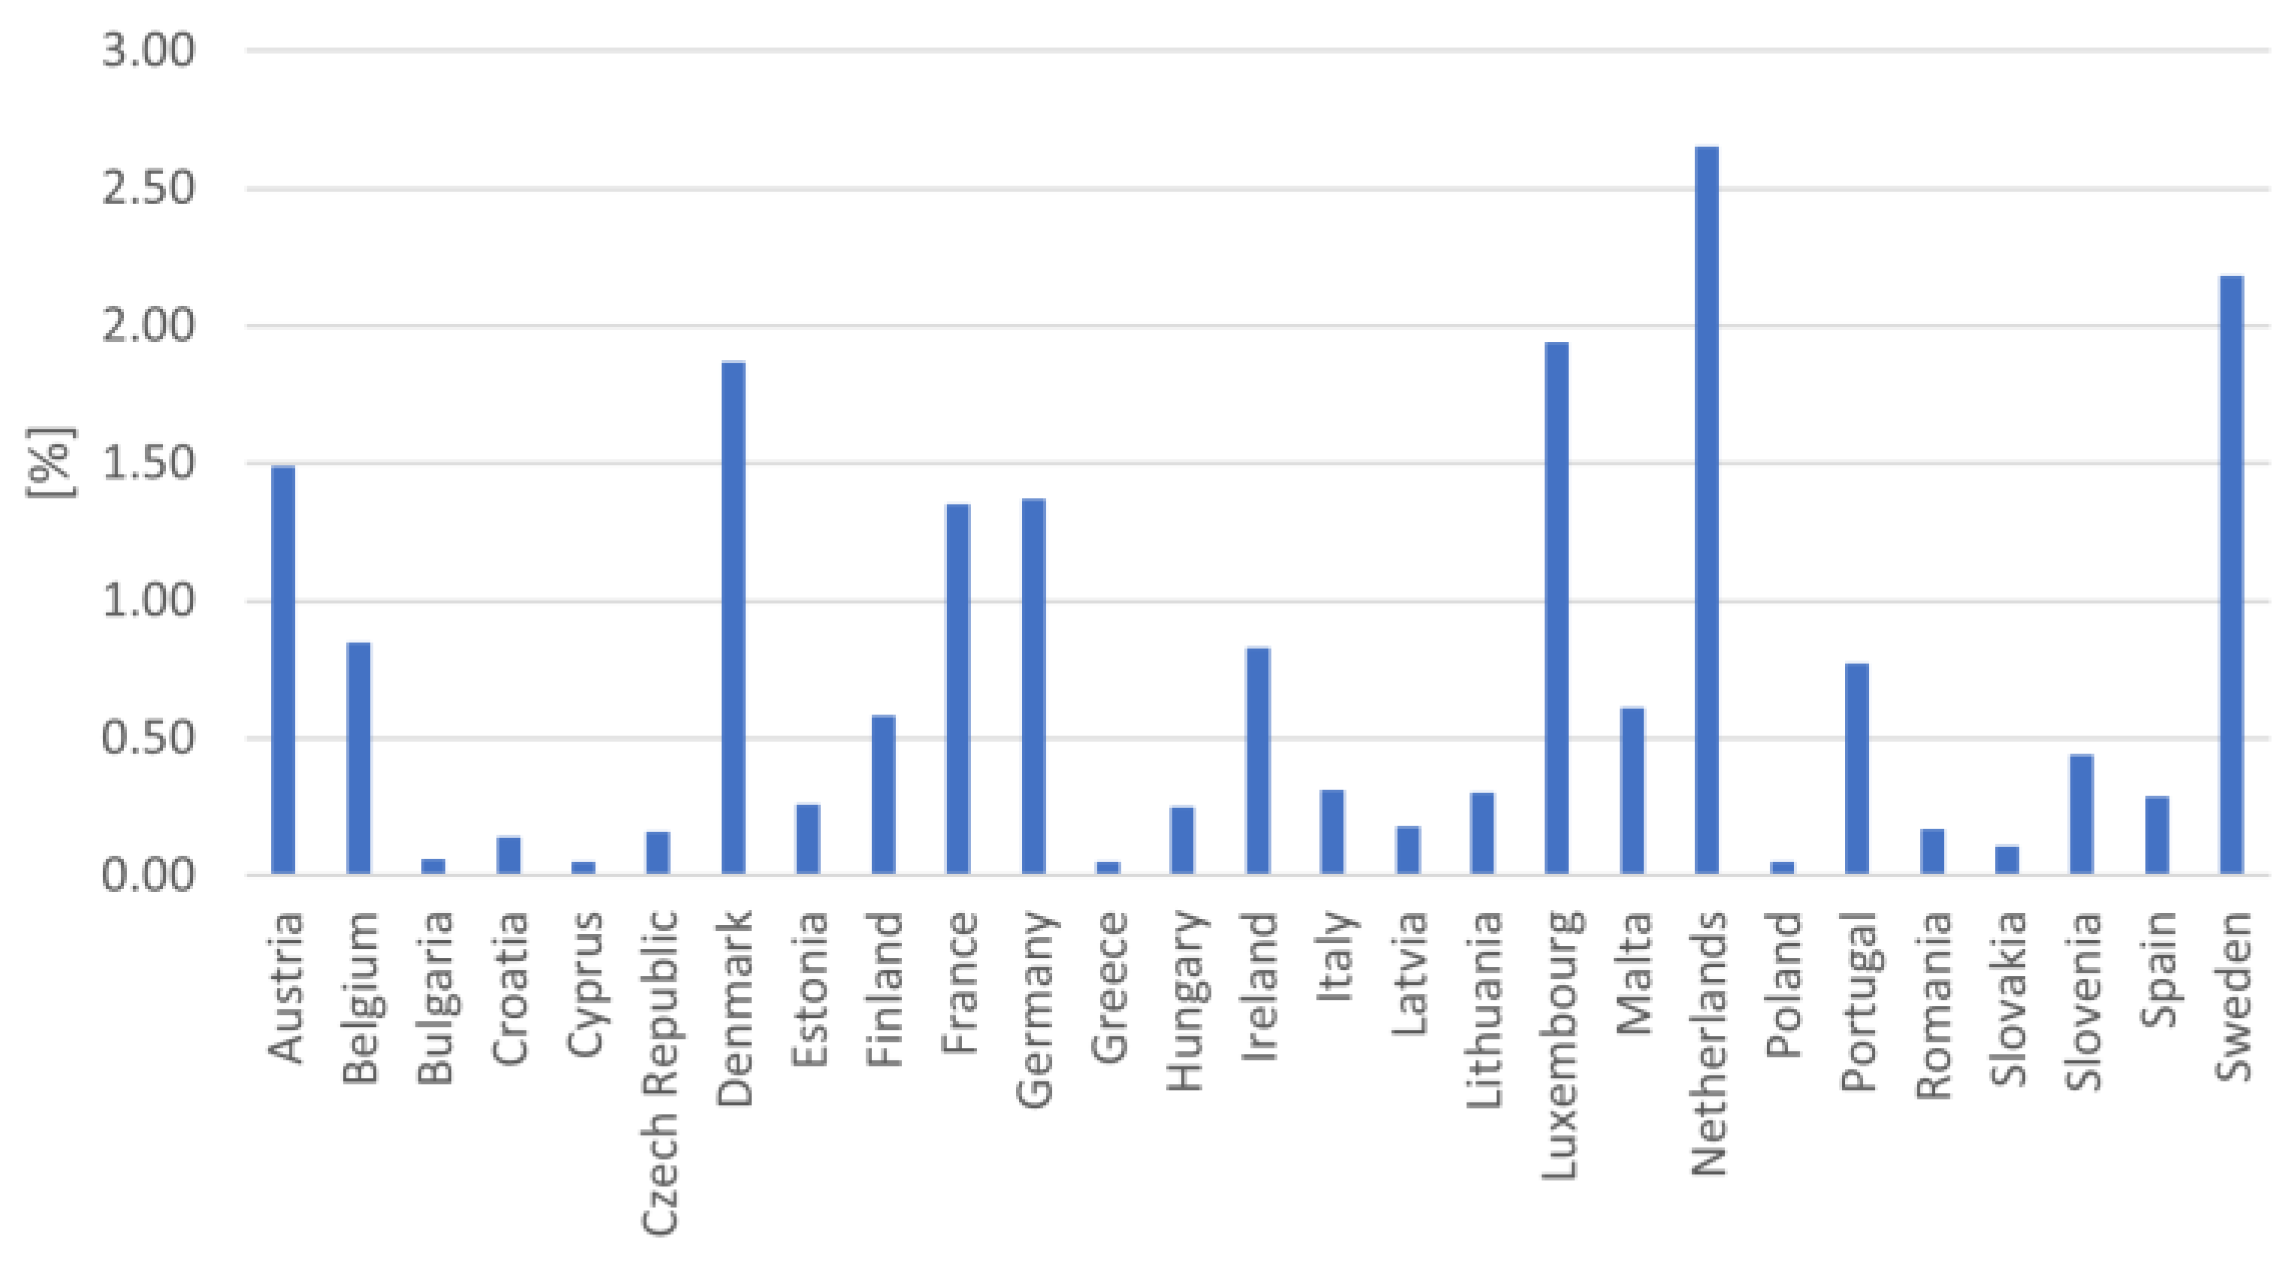
From the point of view of the electric vehicle market, as one of the leading promoters worldwide of the adoption and use of electric vehicles, at the European Union level (through the common policies adopted), the market is constantly expanding, with the number of new electric vehicles registered having increased during the past five years (Figure 2 and Figure 3). From the point of view of the analysis of each country in the European Union, the weight of the adoption of electric cars in the total vehicle fleet is, on average, only 0.72% (with a maximum value of 2.65% in the case of the Netherlands and a minimum value of 0.05% in the case of Greece), with the weights presented in Figure 4.
However, these values are relatively small compared to the number of vehicles in circulation at the European Union level, something that requires firmer and more direct actions regarding the identification (and implementation) of the necessary measures to increase the share of electric vehicles in the vehicle market together with the elimination of old and polluting vehicles.
If most articles published in specialized journals worldwide are directly related to research to improve the energy efficiency of energy sources (battery and fuel cell) and components of electric vehicles (both at the micro and macro level), there are few studies regarding the comparative analysis of the technical performances of electric vehicles in the vehicle market (Table 1).
This can be explained by the emergency (demands) of a market with a small number of models present in past years at the entry into the market of electric vehicles, the design of electric vehicles only by modifying the powertrain (e.g., without major modification of body manufacturing shape and technologies), the use of batteries and electrical motors available in the market), and the lack of exact deadlines for the elimination of internal combustion engines from the construction of new vehicles, etc.
This article aims to present a picture of the performance of electric vehicles available in the European market under the current circumstances, with the recent massive increase of different models and manufacturers of electric vehicles on the auto market, and taking into account the arguments raised above, through comparative statistical analysis (direct and indirect) of the links between certain technical performance parameters (energy capacity of the battery, engine power, weight, year of manufacture, construction class, autonomy, acceleration, maximum speed). The conclusions of this study can be used in the future by manufacturers for the development of new models of electric vehicles by classifying/standardizing them in specific classes specific to this means of transport corresponding to the requirements of different classes of consumers or identifying constructive solutions particular to each type of consumer.

2. Materials and Methods

Two types of statistical analyses were performed in order to assess the performance of electric vehicles in the European market: a primary analysis regarding the evolution over time of the performance parameters and a multivariate comparative analysis to identify the degree of correlation of the technical–constructive parameters considered in the study (battery energy capacity, fast charging speed, electric engine power, energy efficiency, vehicle weight, maximum speed, acceleration, autonomy). It should be mentioned that in this study, the energy efficiency of an electric vehicle was defined as (kWh/km) units and the fast charging capacity, as the fast charging speed of the battery, was expressed in (km/1 charging hour) units. Based on the available data, statistical analyses were performed on 203 types of electric vehicles from 6 construction categories of vehicles (Table 2), covering 34 manufacturing brands for the reference years 2019–2022 [44,45,46]. Only the 203 types of vehicles considered in this study had all available information related to the parameters analyzed in this article, even if the number of electric vehicle models in the market was greater. The statistical processing was carried out using the SPSS v.23 software, software that automatically allows statistical processing and analysis on various levels of the data. For a better understanding of the results obtained, the discussion will be carried out at the end of each considered statistical analysis (primary and multivariate comparative).

2.1. Primary Statistical Analysis

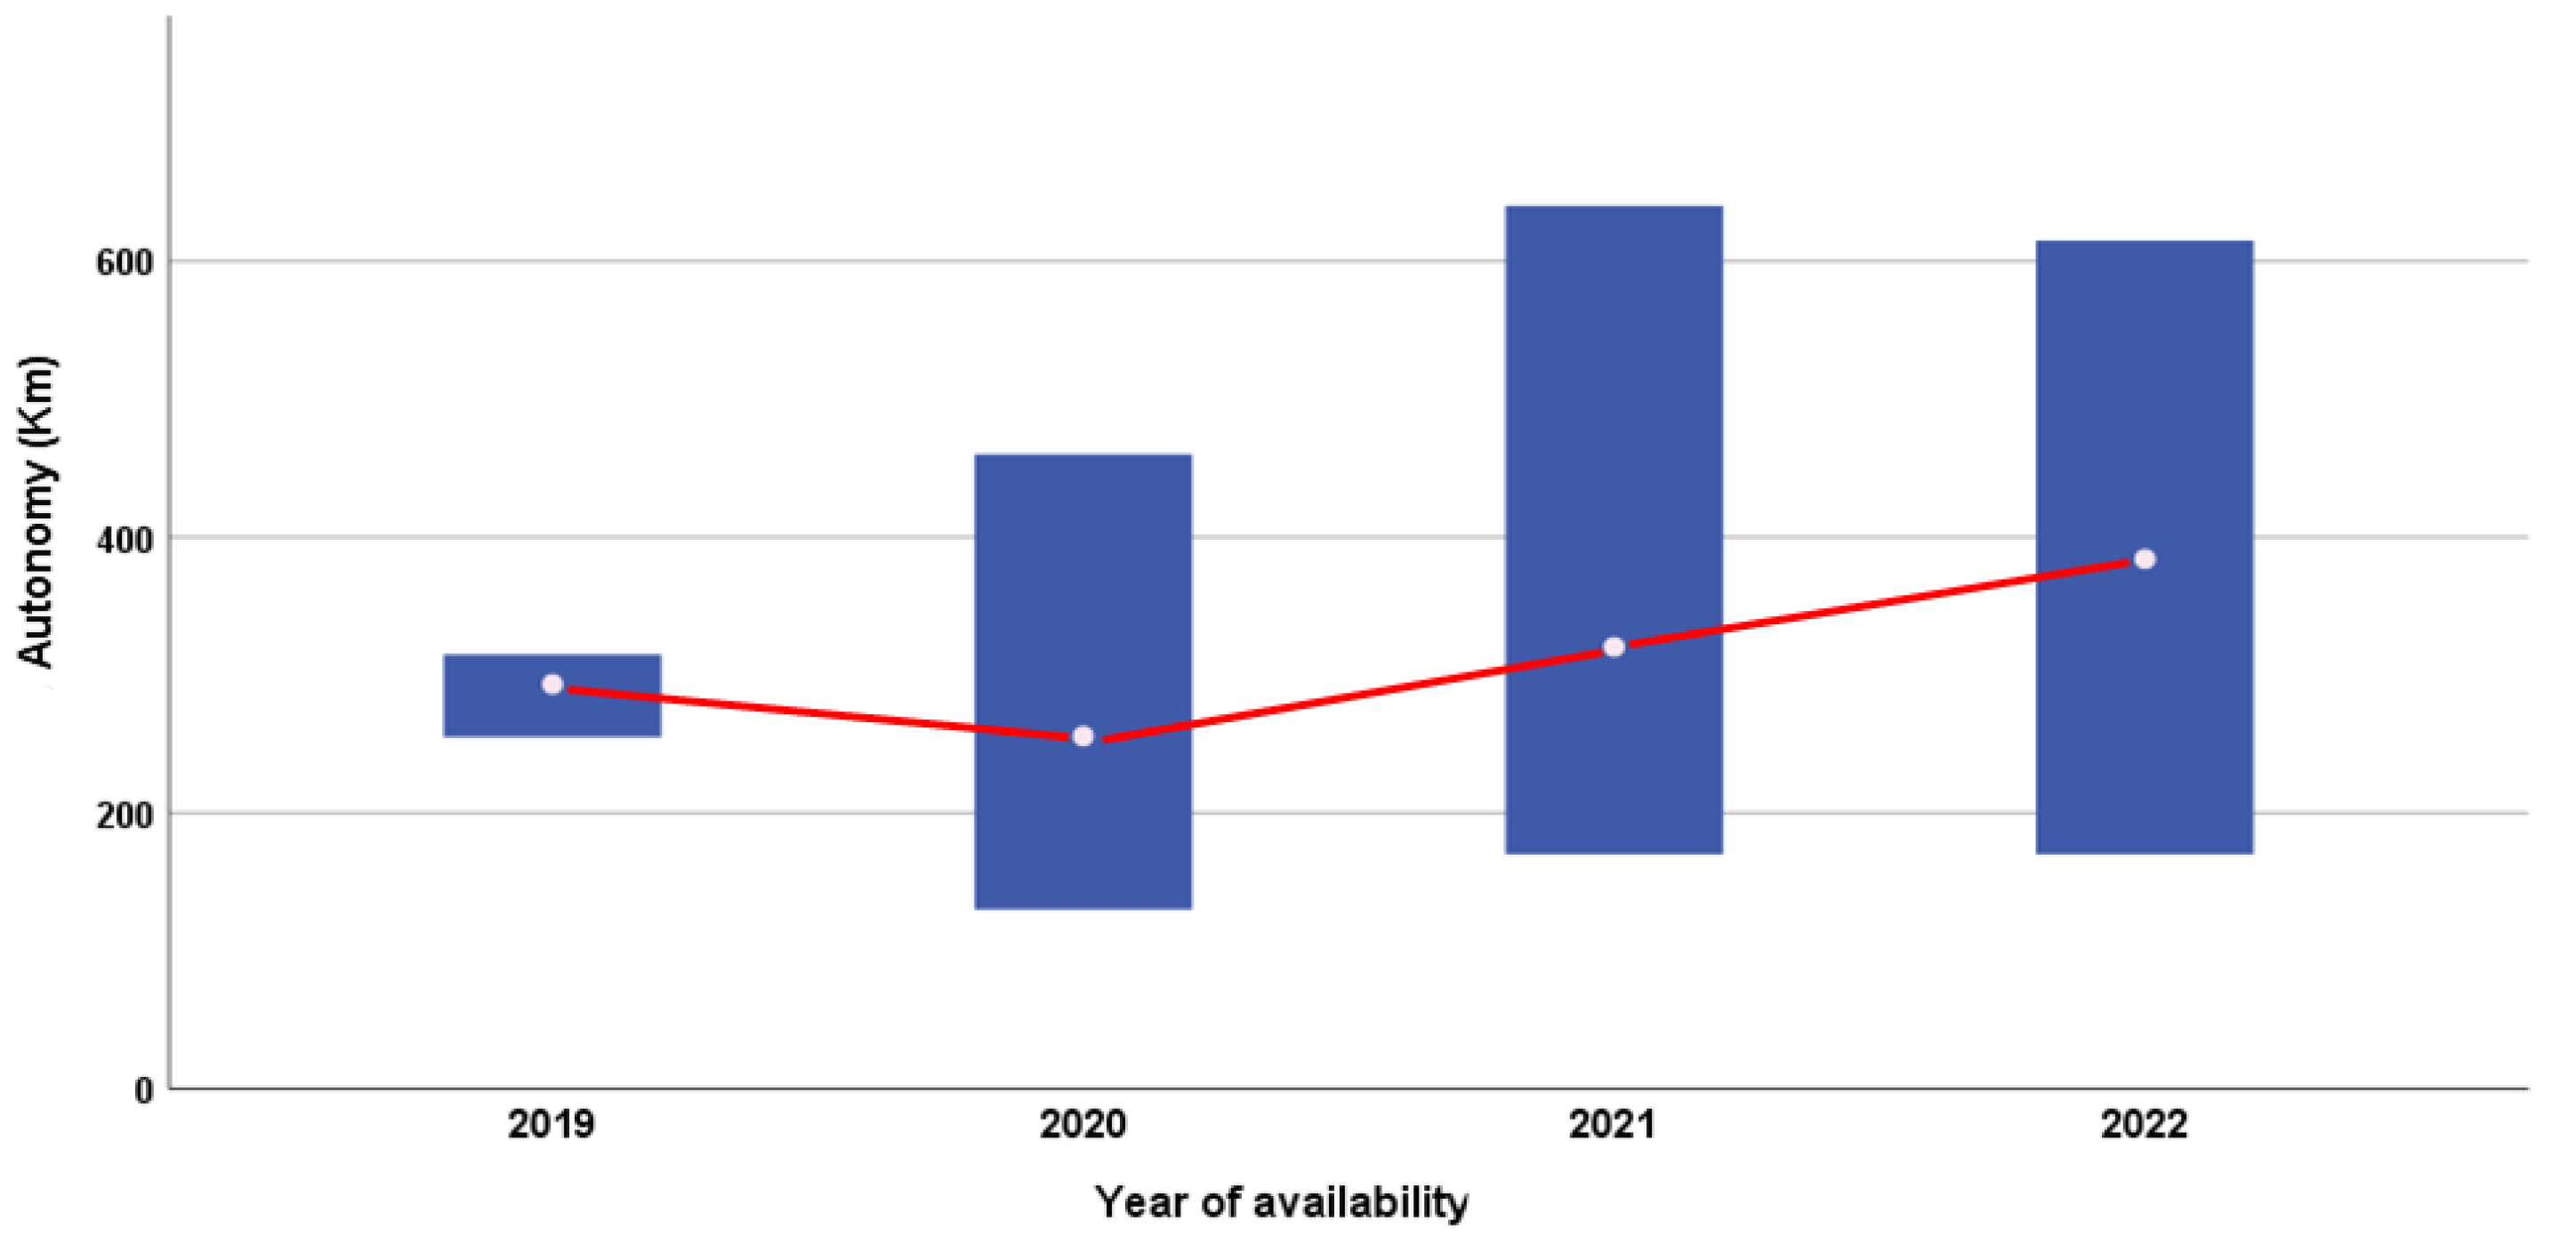
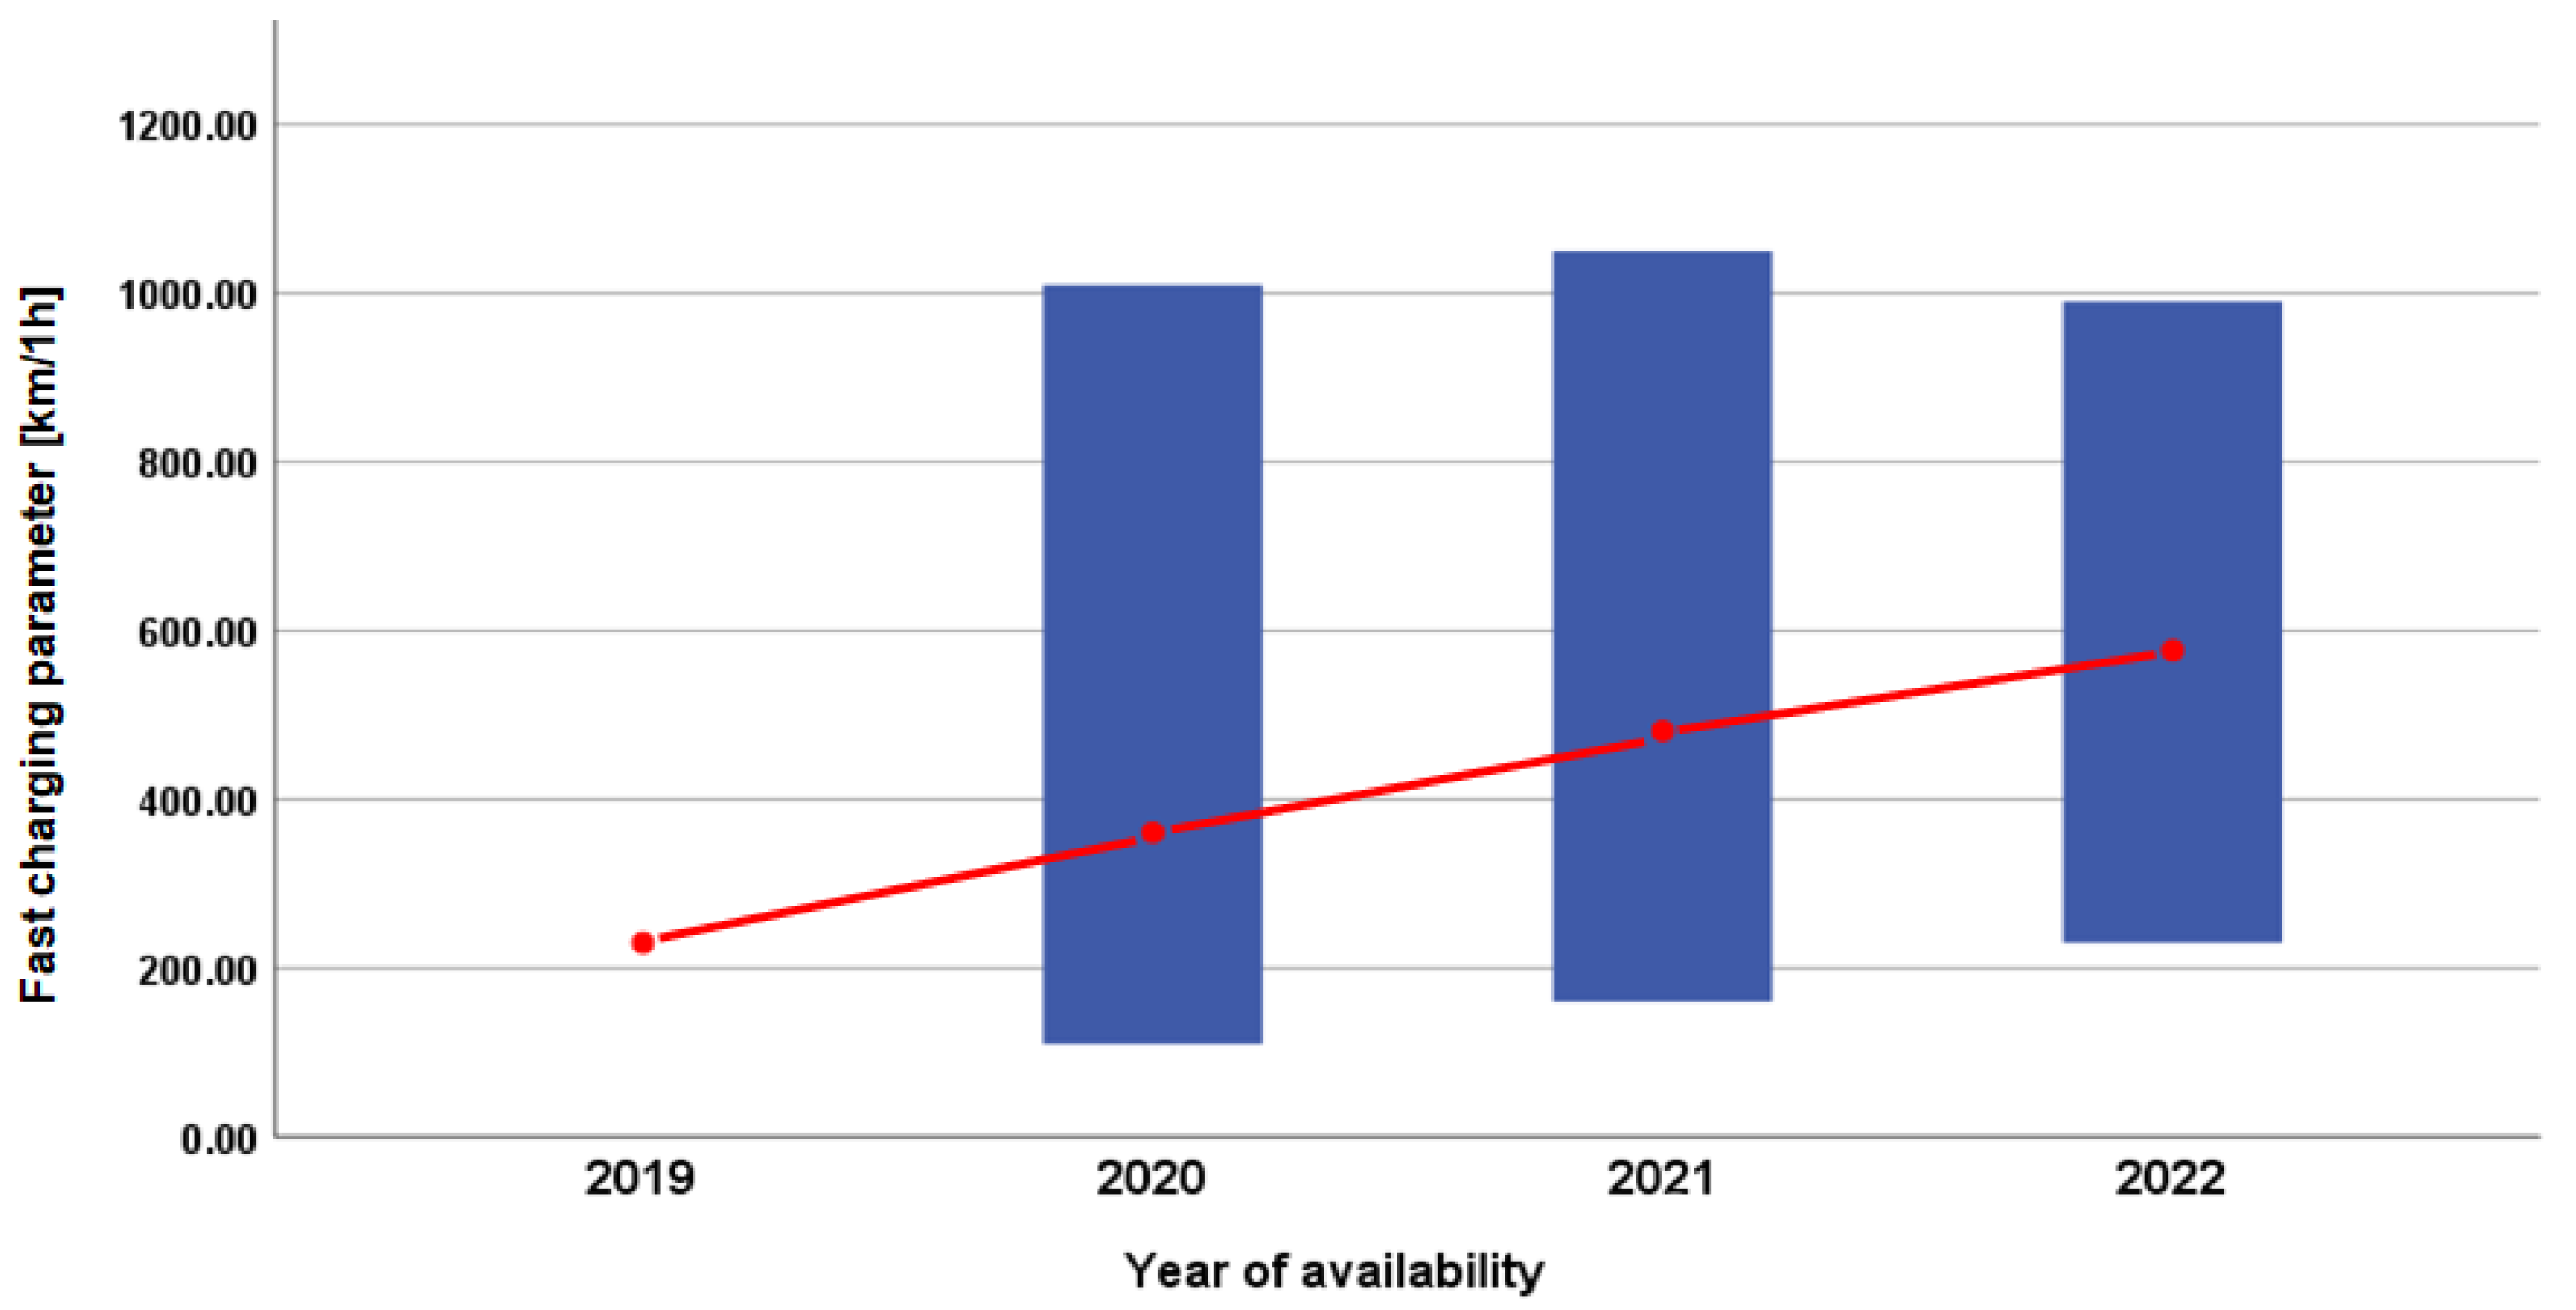
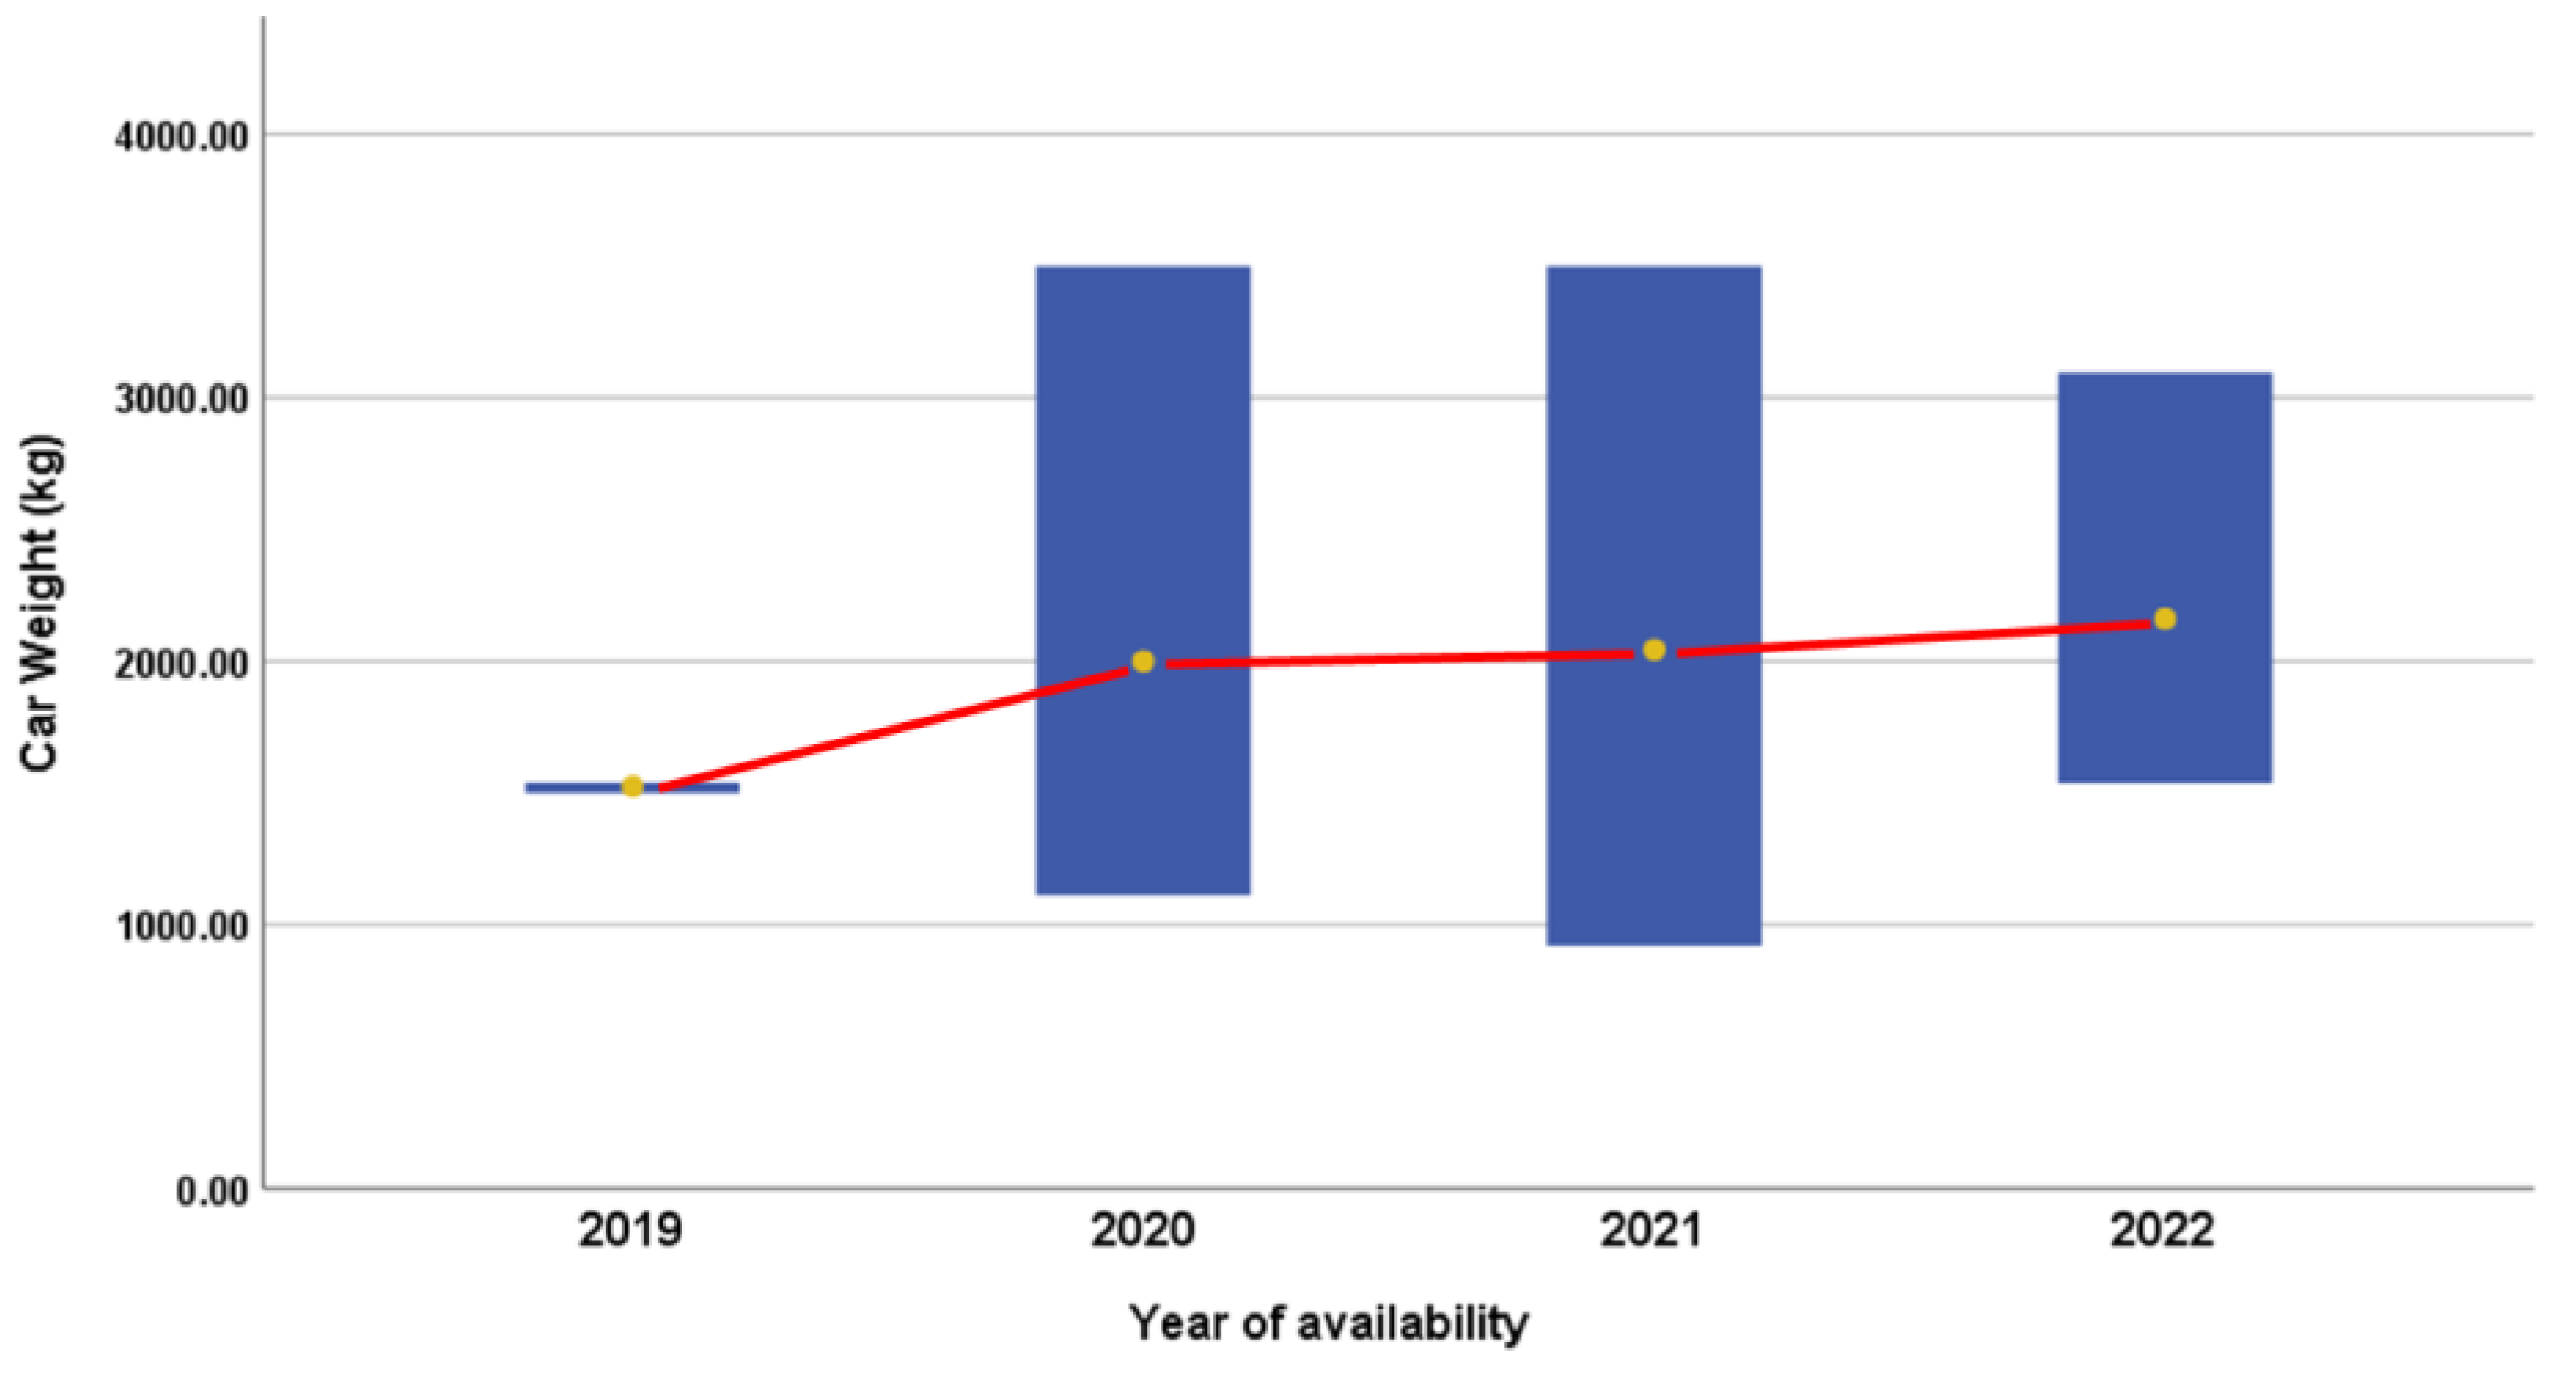
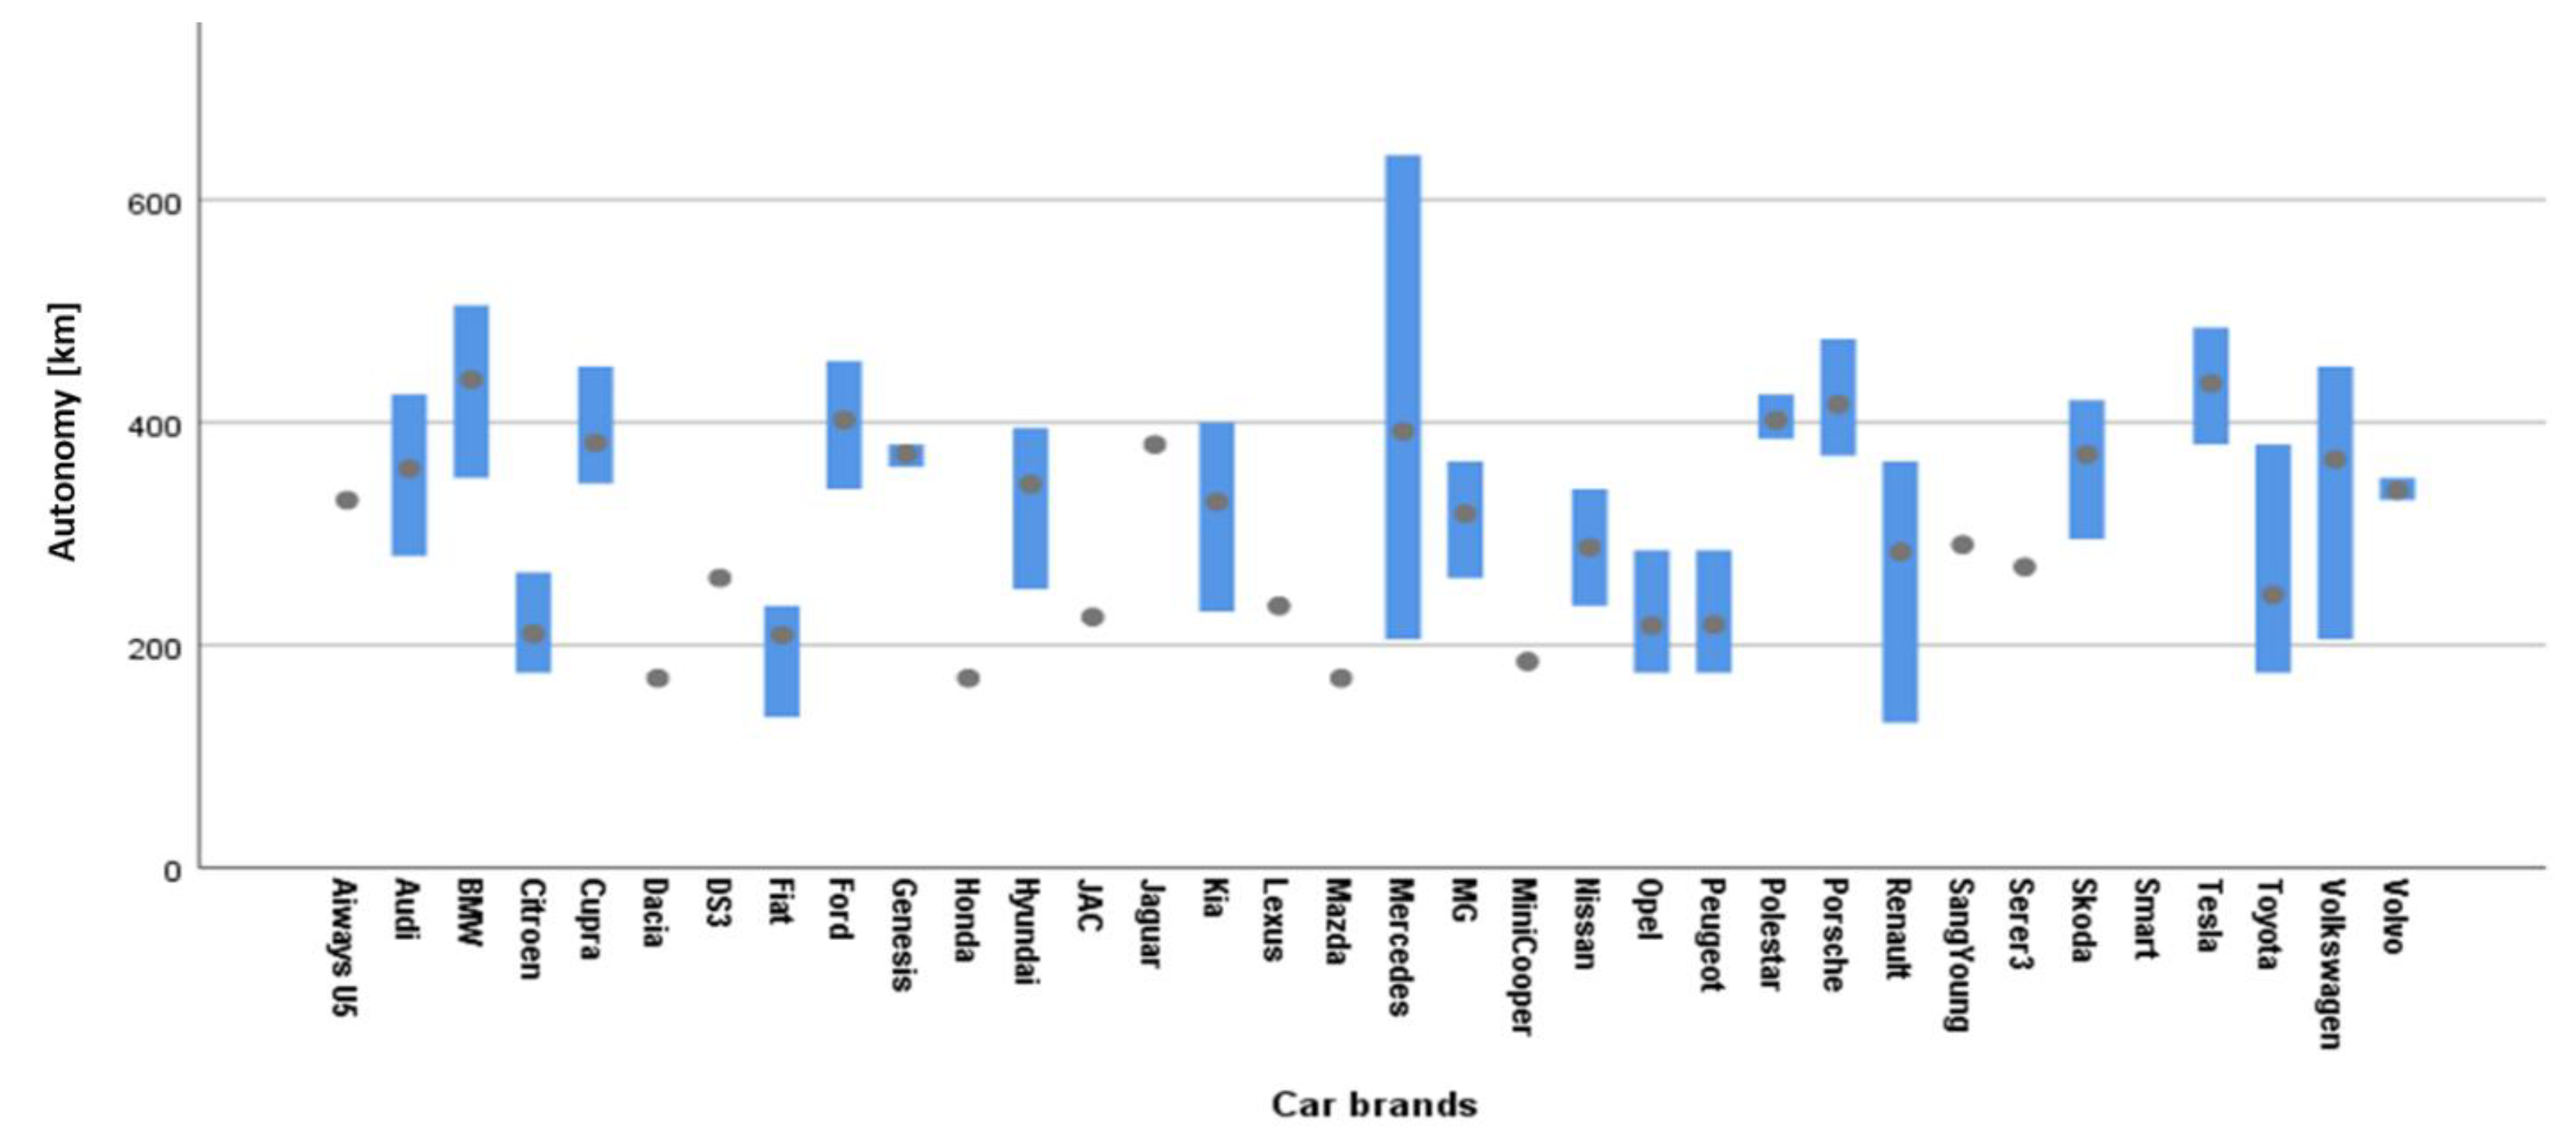
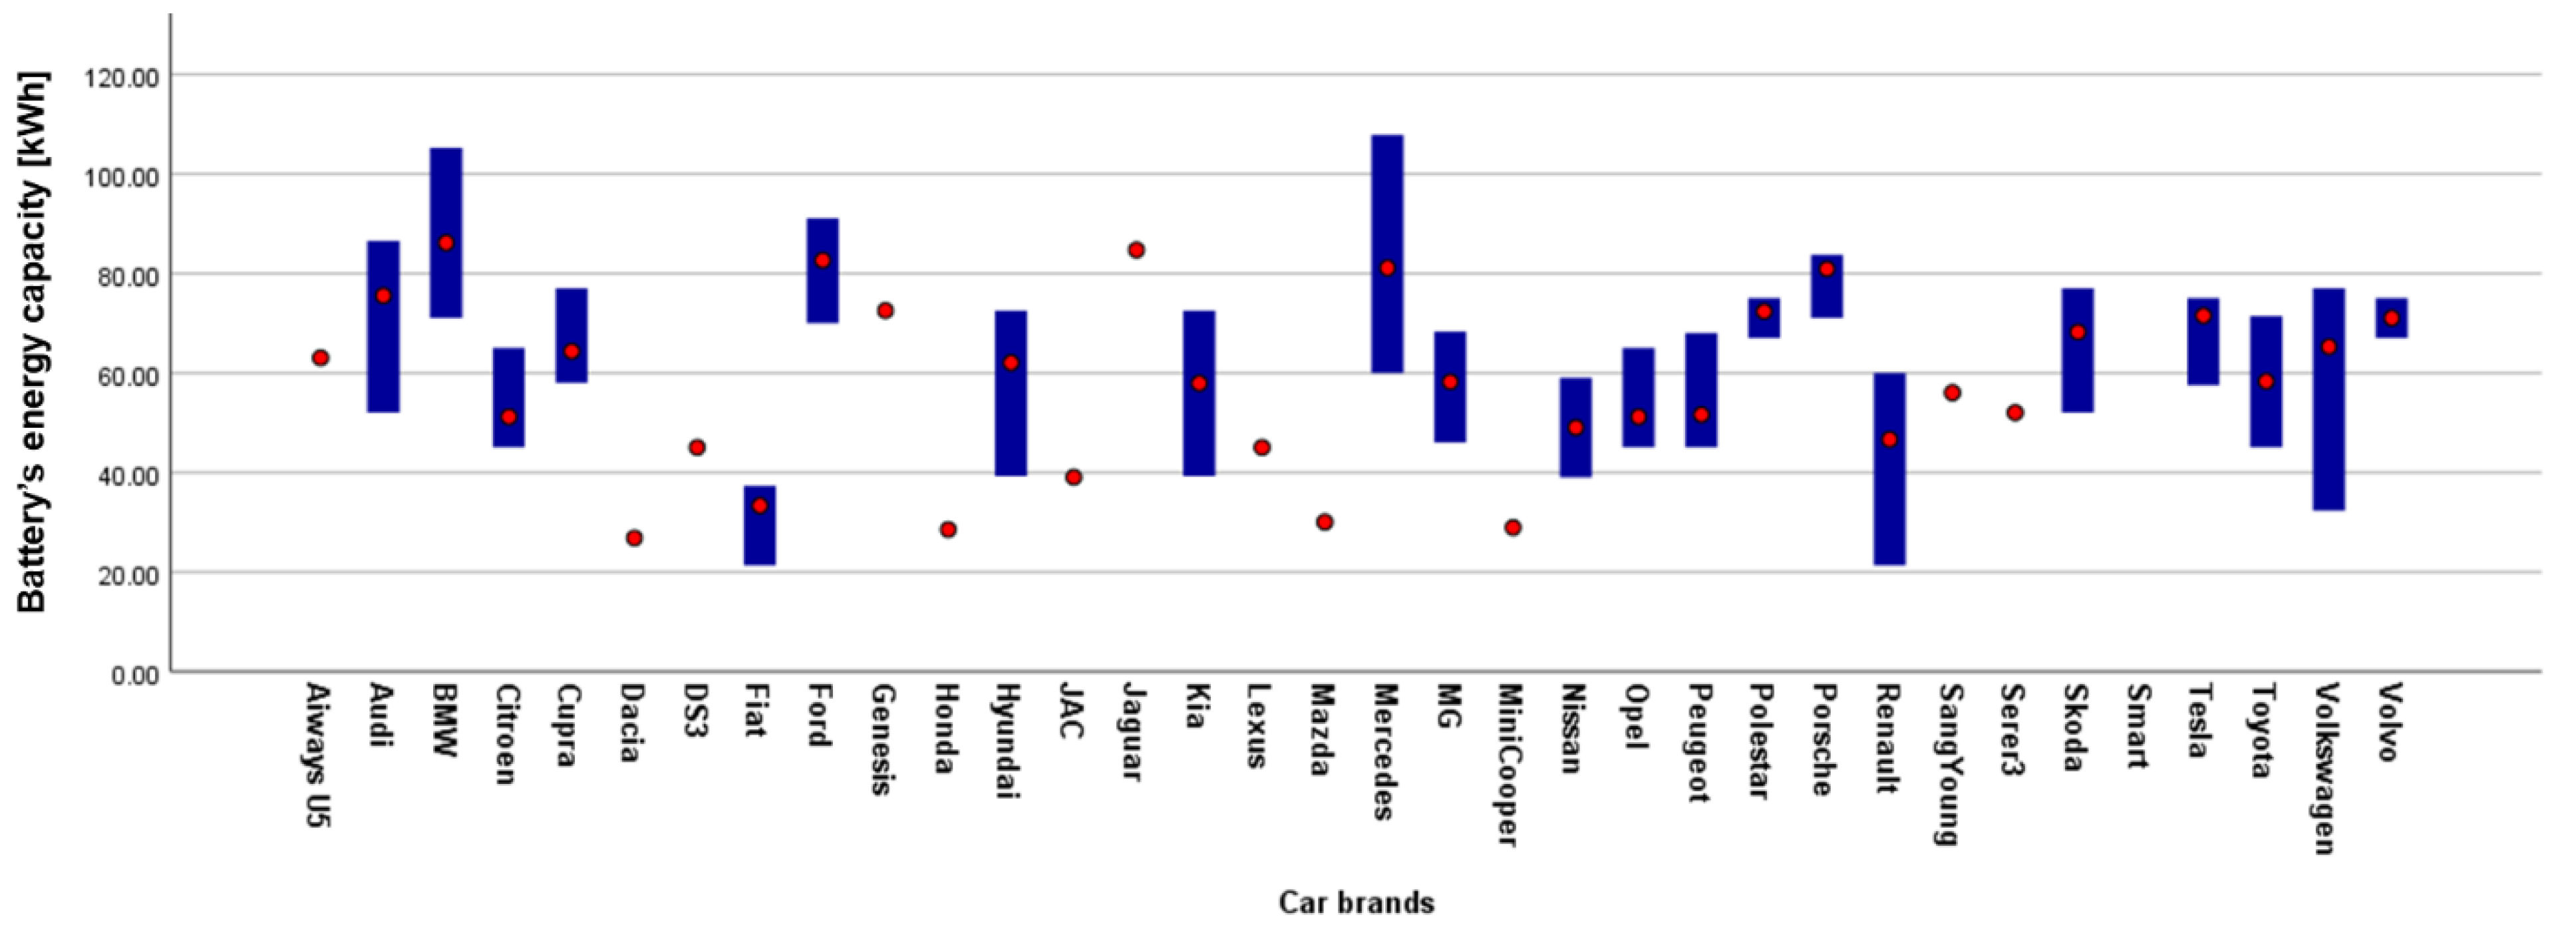
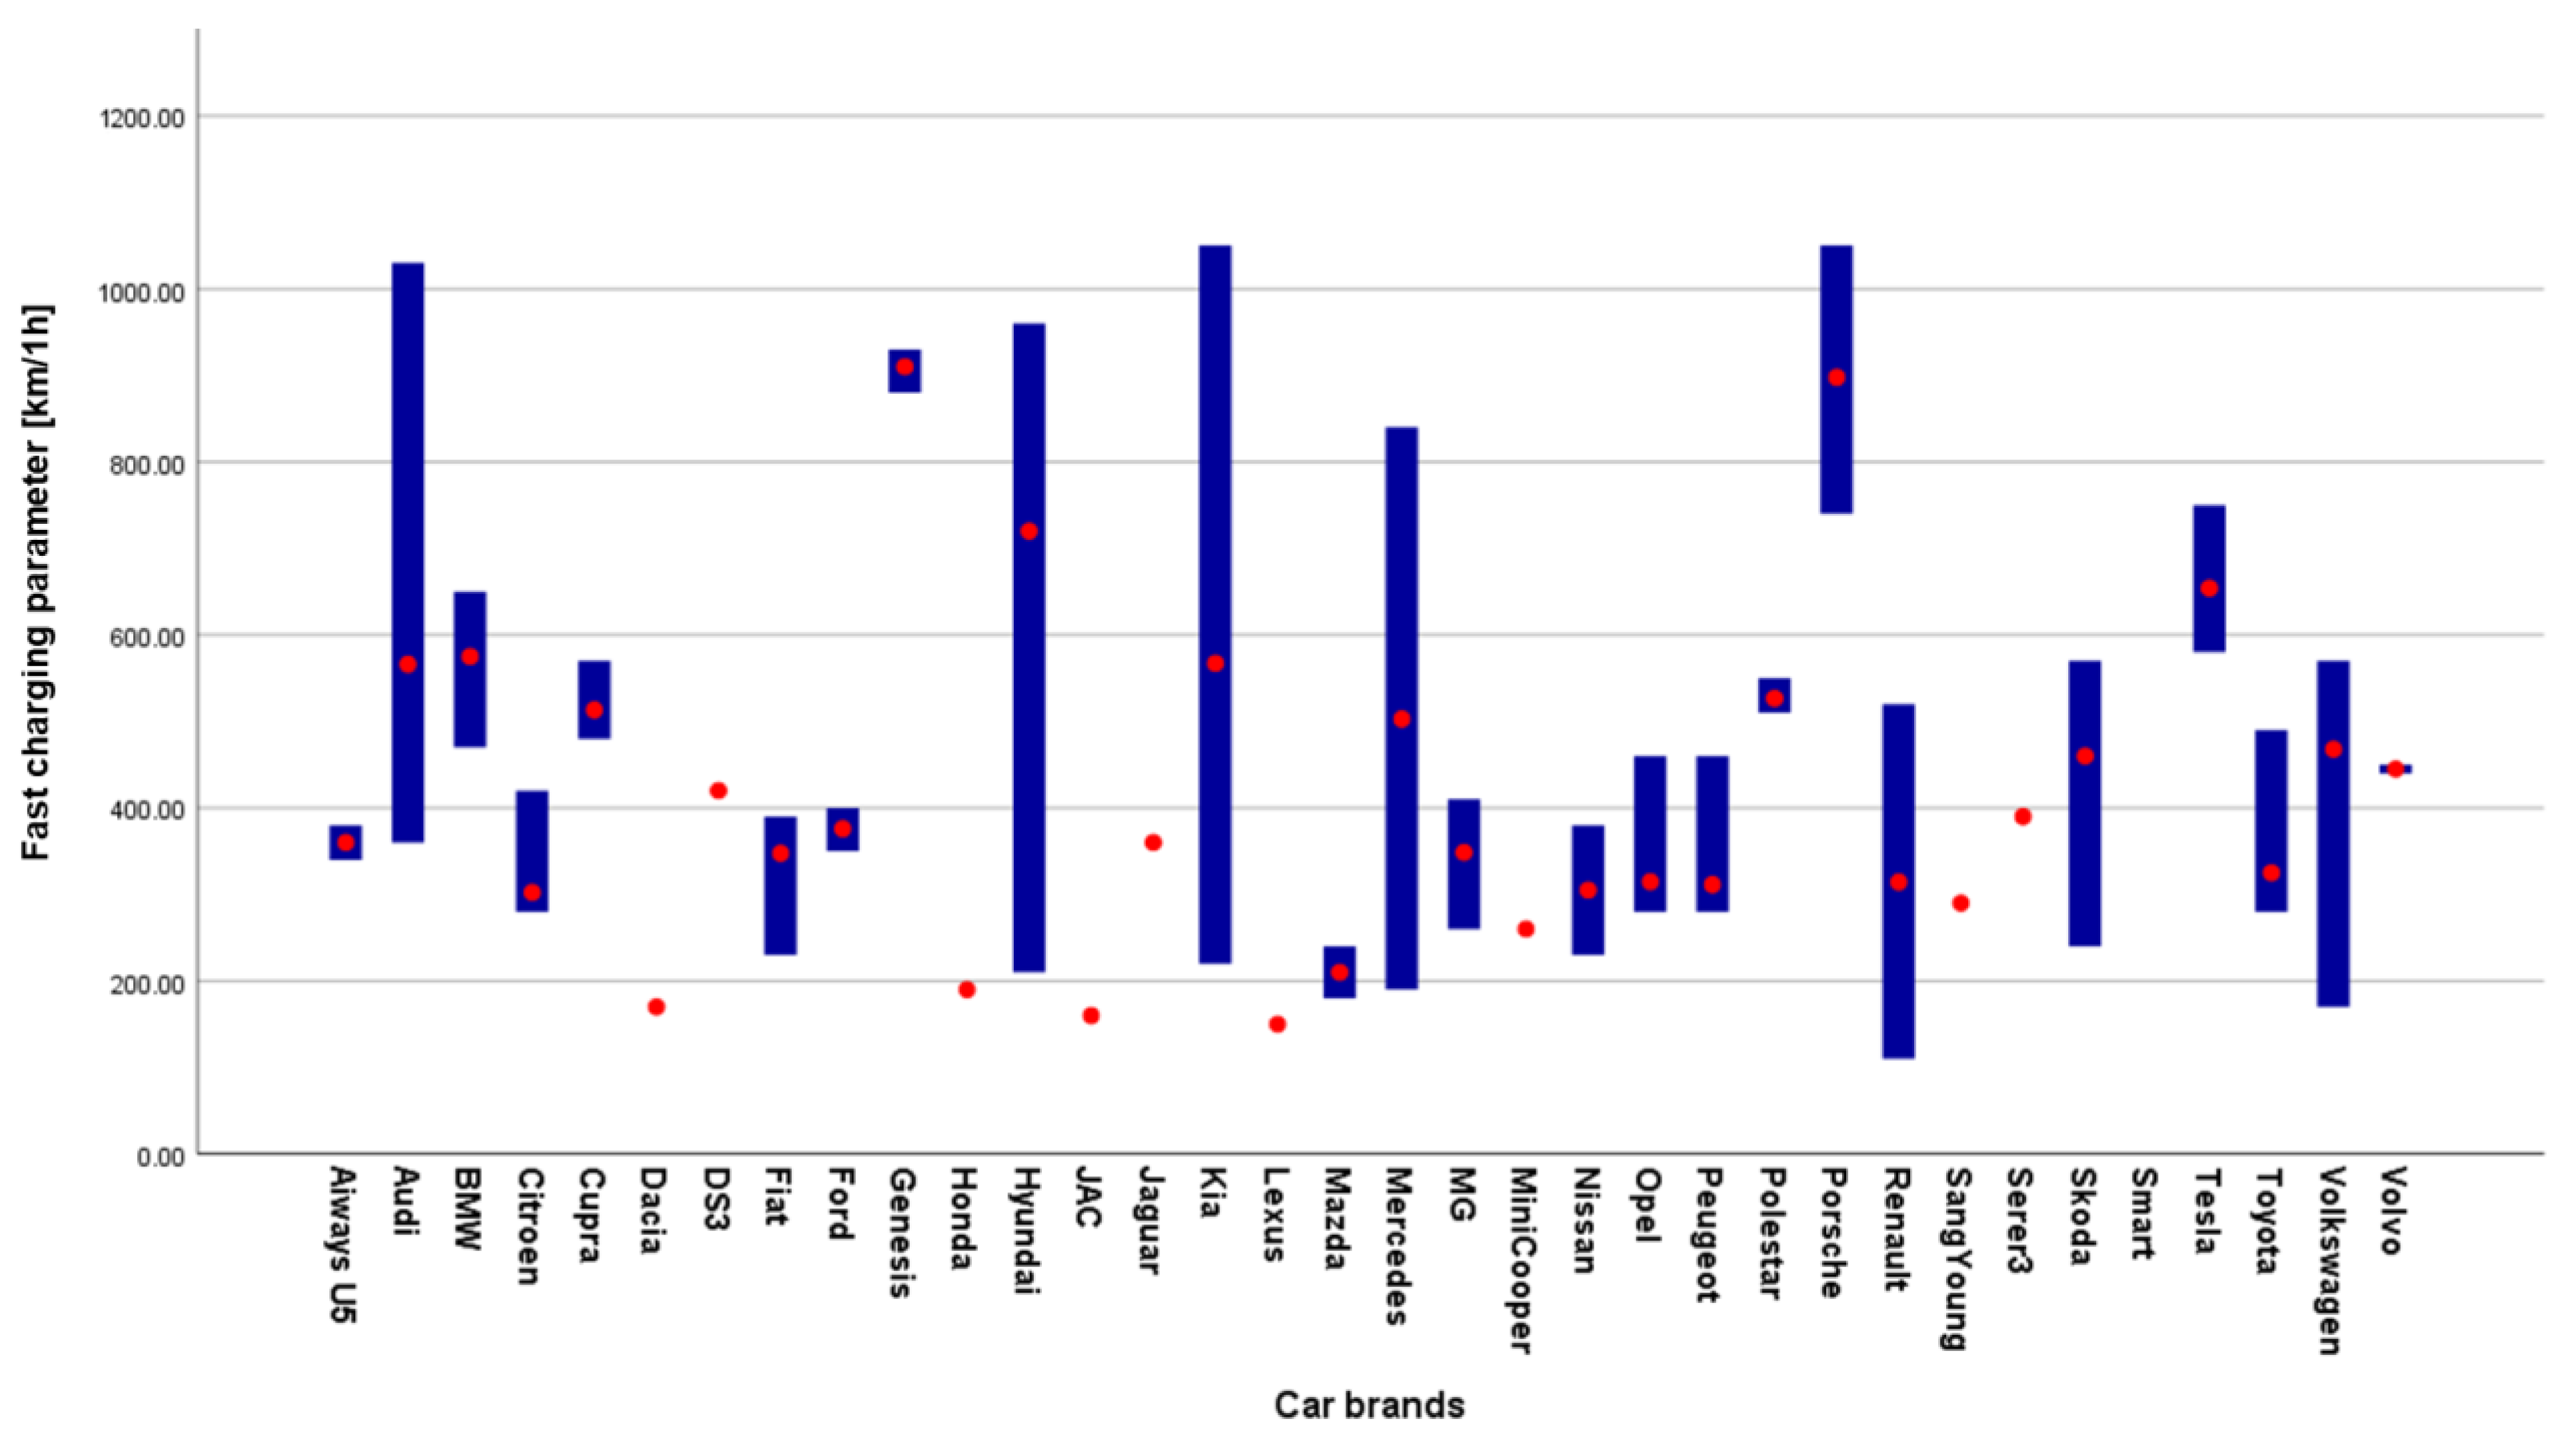
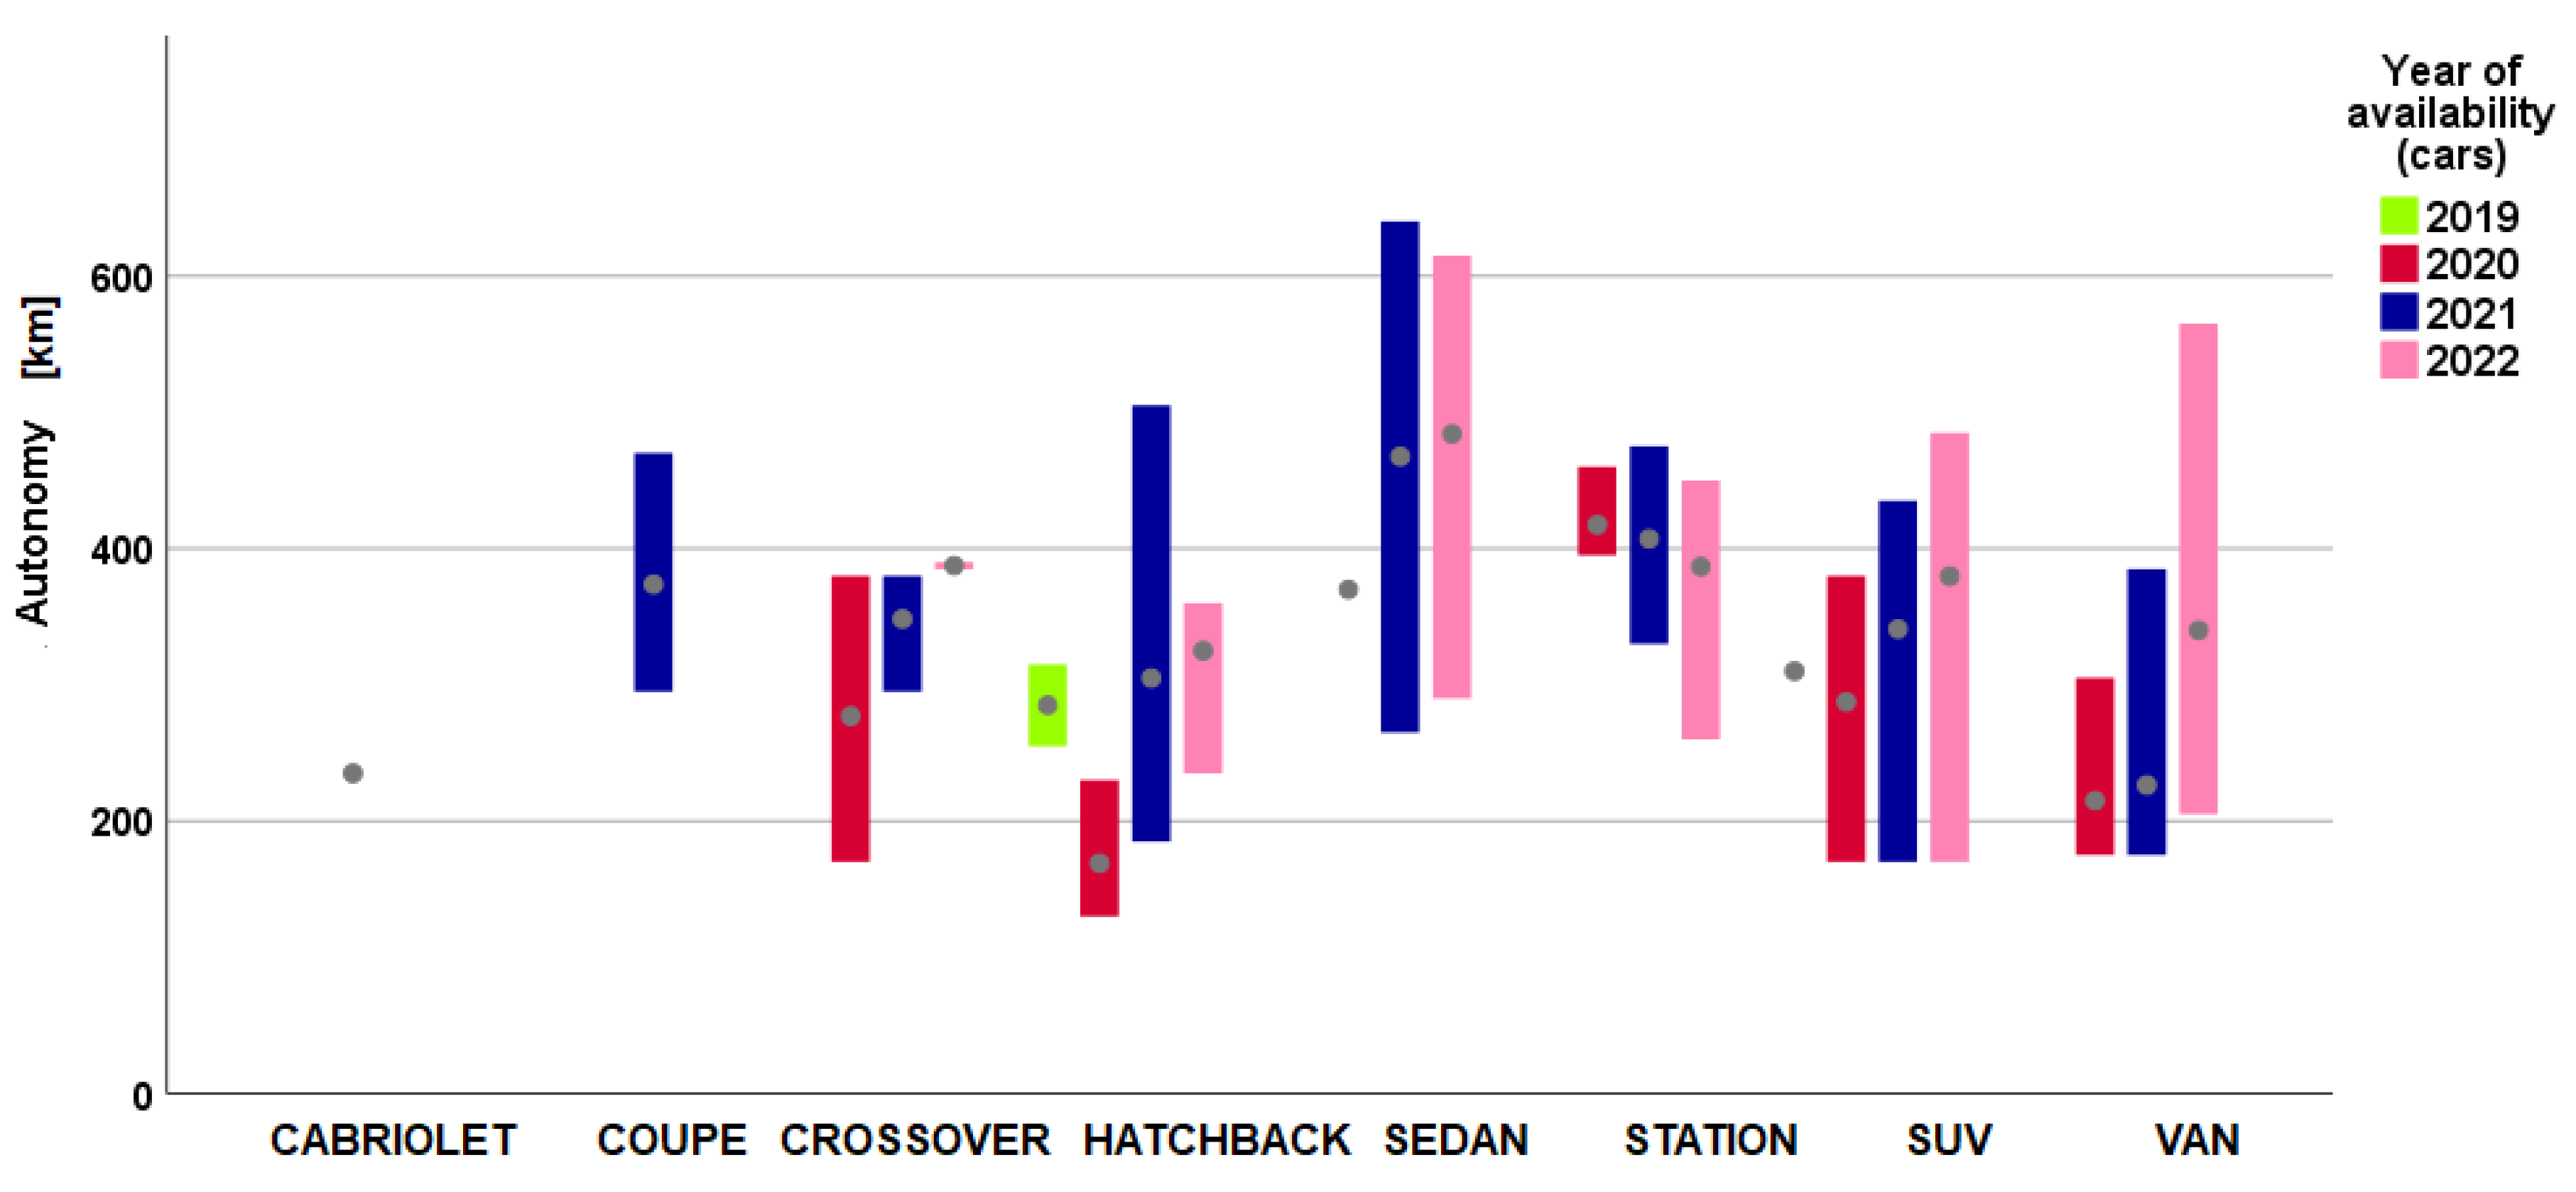
The primary statistical analysis shows how the different construction brands, the years of availability in the market, and the performance parameters required by customers (autonomy, battery energy capacity, energy efficiency, fast charging speed, and vehicle weight) relate to each other in the European electrics’ vehicle market. The resulting diagrams are presented in Figure 5, Figure 6, Figure 7, Figure 8 and Figure 9 with reference to the years of availability in the market and in Figure 10, Figure 11, Figure 12, Figure 13 and Figure 14 with reference to the constructive marks (brands). Figure 15, Figure 16, Figure 17, Figure 18 and Figure 19 present the same type of analysis of the evolution of the technical parameters of electric vehicles in the European market, taking into account the construction type.
The following general conclusions can be drawn by analyzing the variation of the mean values of the considered parameters depending on the year of entry into the European market of electric vehicles. The evolution trend is generally upward, with the only downward evolution during the considered time interval (2019–2022) being associated with a small decrease in energy efficiency. Compared to the reference year, 2019, for electric vehicle models built in 2022, it can be seen that the autonomy increased by 25.9% (Figure 5), the energy capacity of the battery by 47.9% (Figure 6), fast charging speed by 163.4% (Figure 8), and the weight of vehicles by 40% (Figure 9). These values show the primary interest of the manufacturers towards the fast charging speed parameter, perceived as an express demand from the market and customers. The energy efficiency of the models built in the last three analyzed years remained relatively constant with an average value of 19.8 kWh/km, representing an increase of 18.5% compared to 2019 (Figure 7).
From the point of view of the analysis of the autonomy parameter depending on the brand, the average value of all considered vehicles is 302.8 km. The maximum average value of autonomy is found in BMW models (438 km) and the minimum average value of 170 is found in Dacia, Honda, and Mazda models (Figure 10).
The energy capacity of the battery is normally correlated with the vehicle class, and the variation depending on the brand is presented in Figure 11. The average value for EVs in the European market is 57.9 kWh, with maximum average values for BMW models (86.13 kWh) and minimum average values for Dacia models (26.8 kWh). Values close to the maximum average value can also be found for the Jaguar (84 kWh), Ford (82.6 kWh), Porsche, and Mercedes Benz (81 kWh) brands.
When analyzing the energy efficiency values depending on the brand, it can be seen that the maximum average value is Toyota (24.7 kWh/km), with this value 29.3% more compared to the average of all the vehicles considered in this study. Values close to the maximum value are also obtained by Citroen (24.5 kWh/km), Peugeot (24 kWh/km), and Opel (23.9 kWh/km). The Fiat and Dacia brands have the minimum average value with 16 kWh/km. The variation depending on the brands of the fast charging speed parameter (expressed as how many kilometers can be traveled after one hour of fast charging of the battery) is presented in Figure 13. The average value is 415.5 km/1 h and the maximum average value is found in the Genesis and Porsche (910 and 897.8 km/1 h, respectively) models. From the point of view of minimum average values, Lexus shows a value of only 150 km/1 h, JAC 160 km/1 h, and Dacia 170 km/1 h—values far below the average in the European market.
The weight of the analyzed electric vehicles depends directly on the construction class (type), with the analysis of the results by brands presented in Figure 14. The general average for all types considered in this study was 1896.2 kg, with minimum average values of 921 kg (Dacia models) and maximum average values of 2548 kg (Mercedes models). Values over 2000 kg were identified for the following models: Audi, Citroen, Ford, Genesis, Jaguar, Polestar, Porsche, Skoda, Toyota, and Volvo.
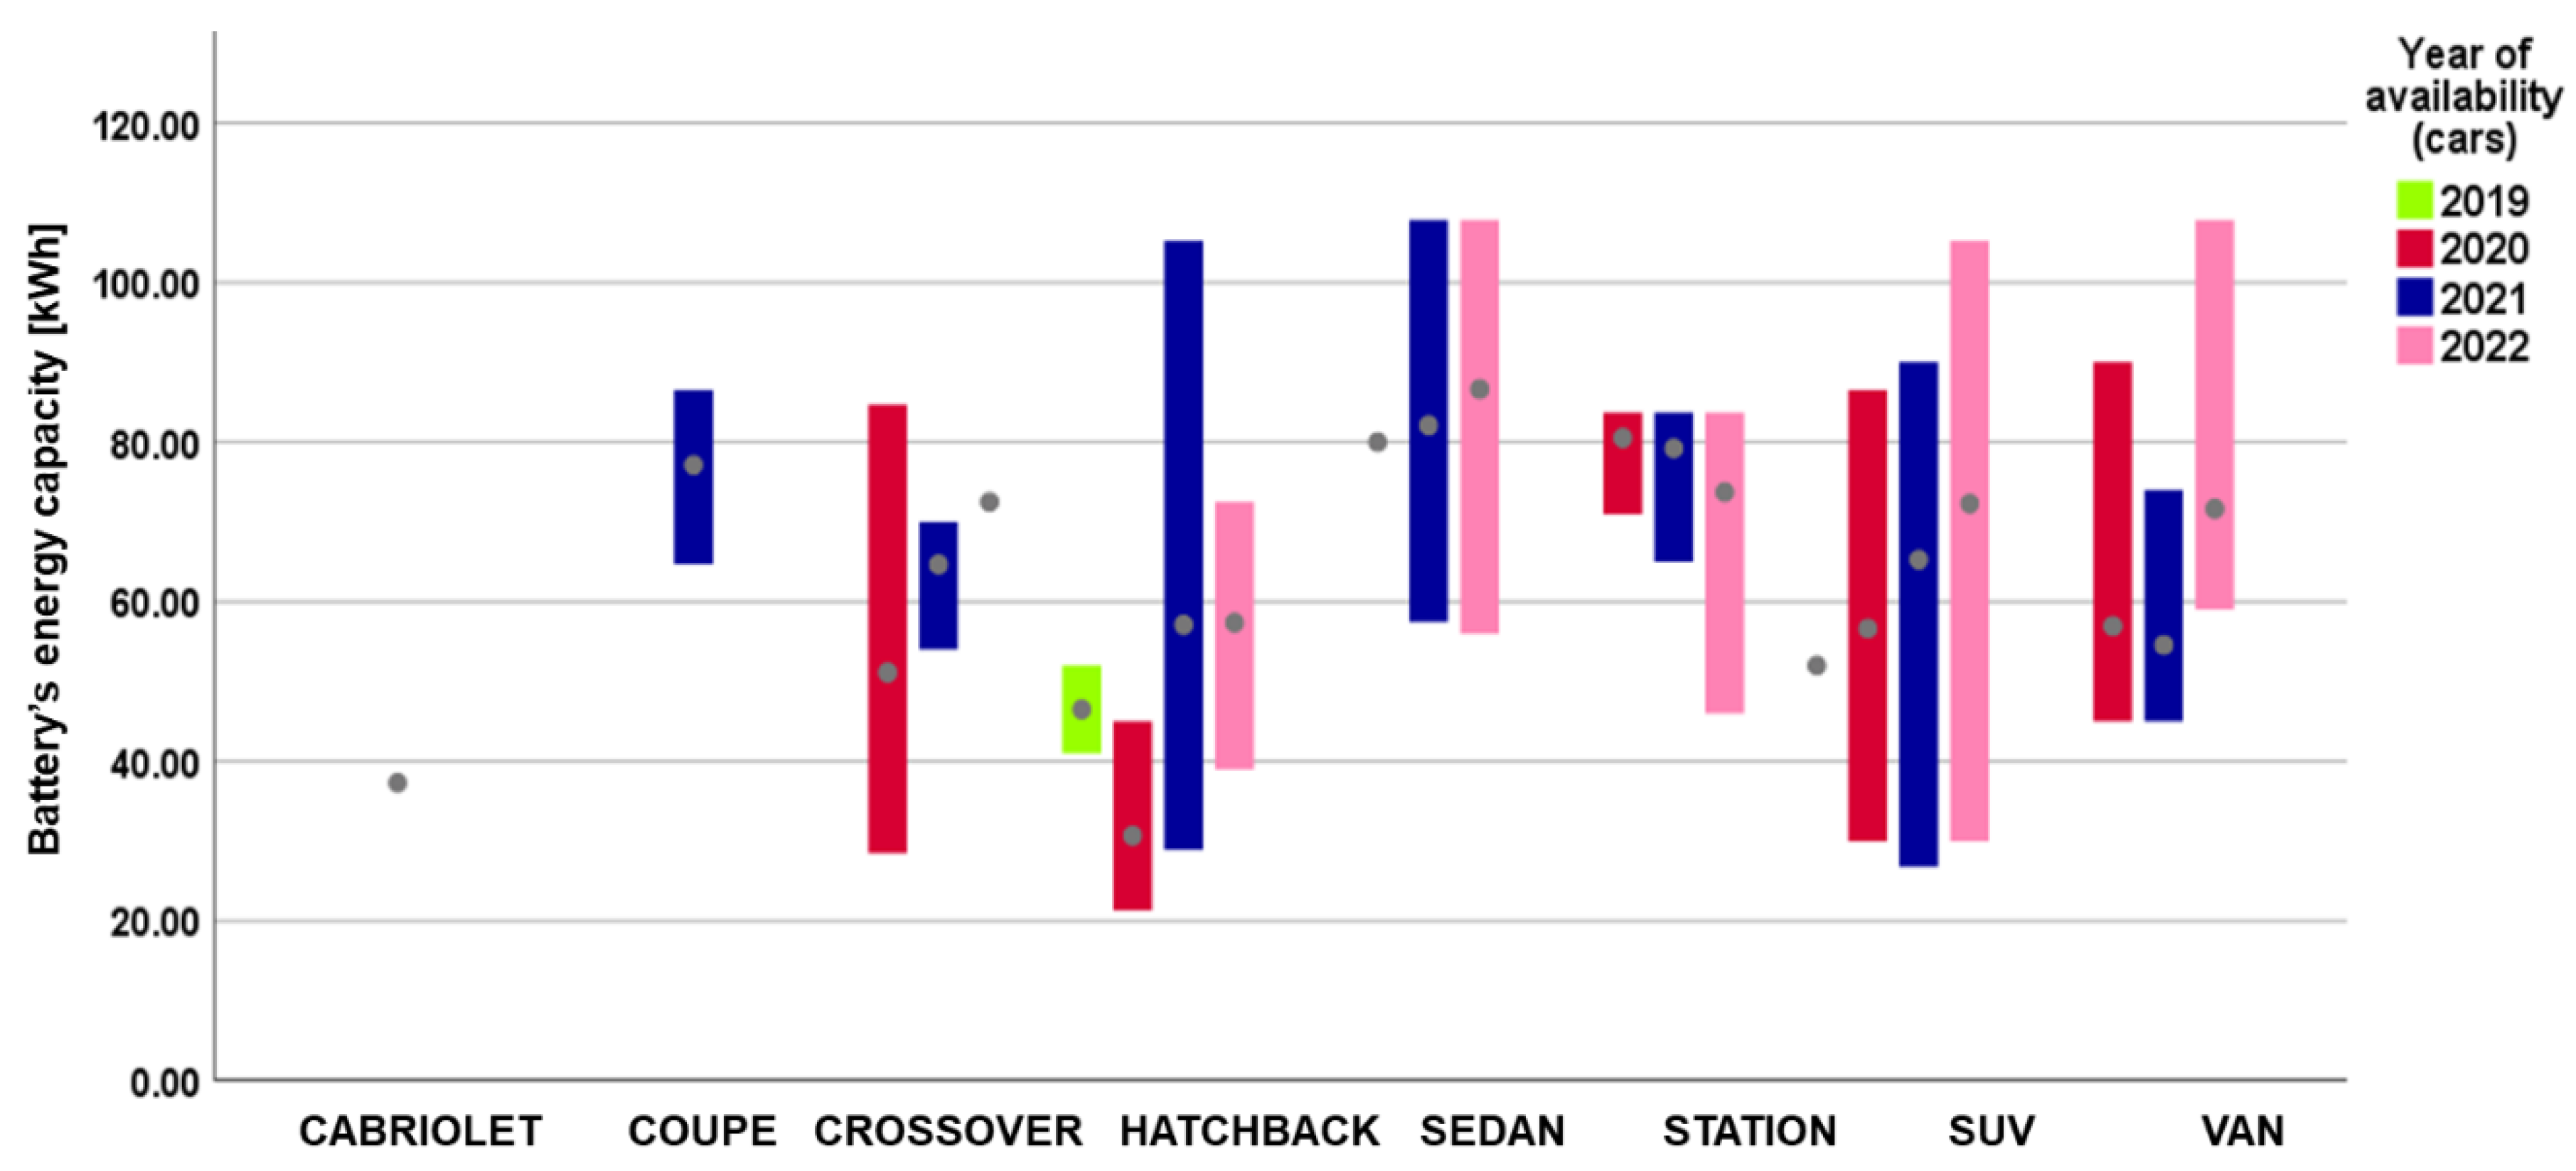
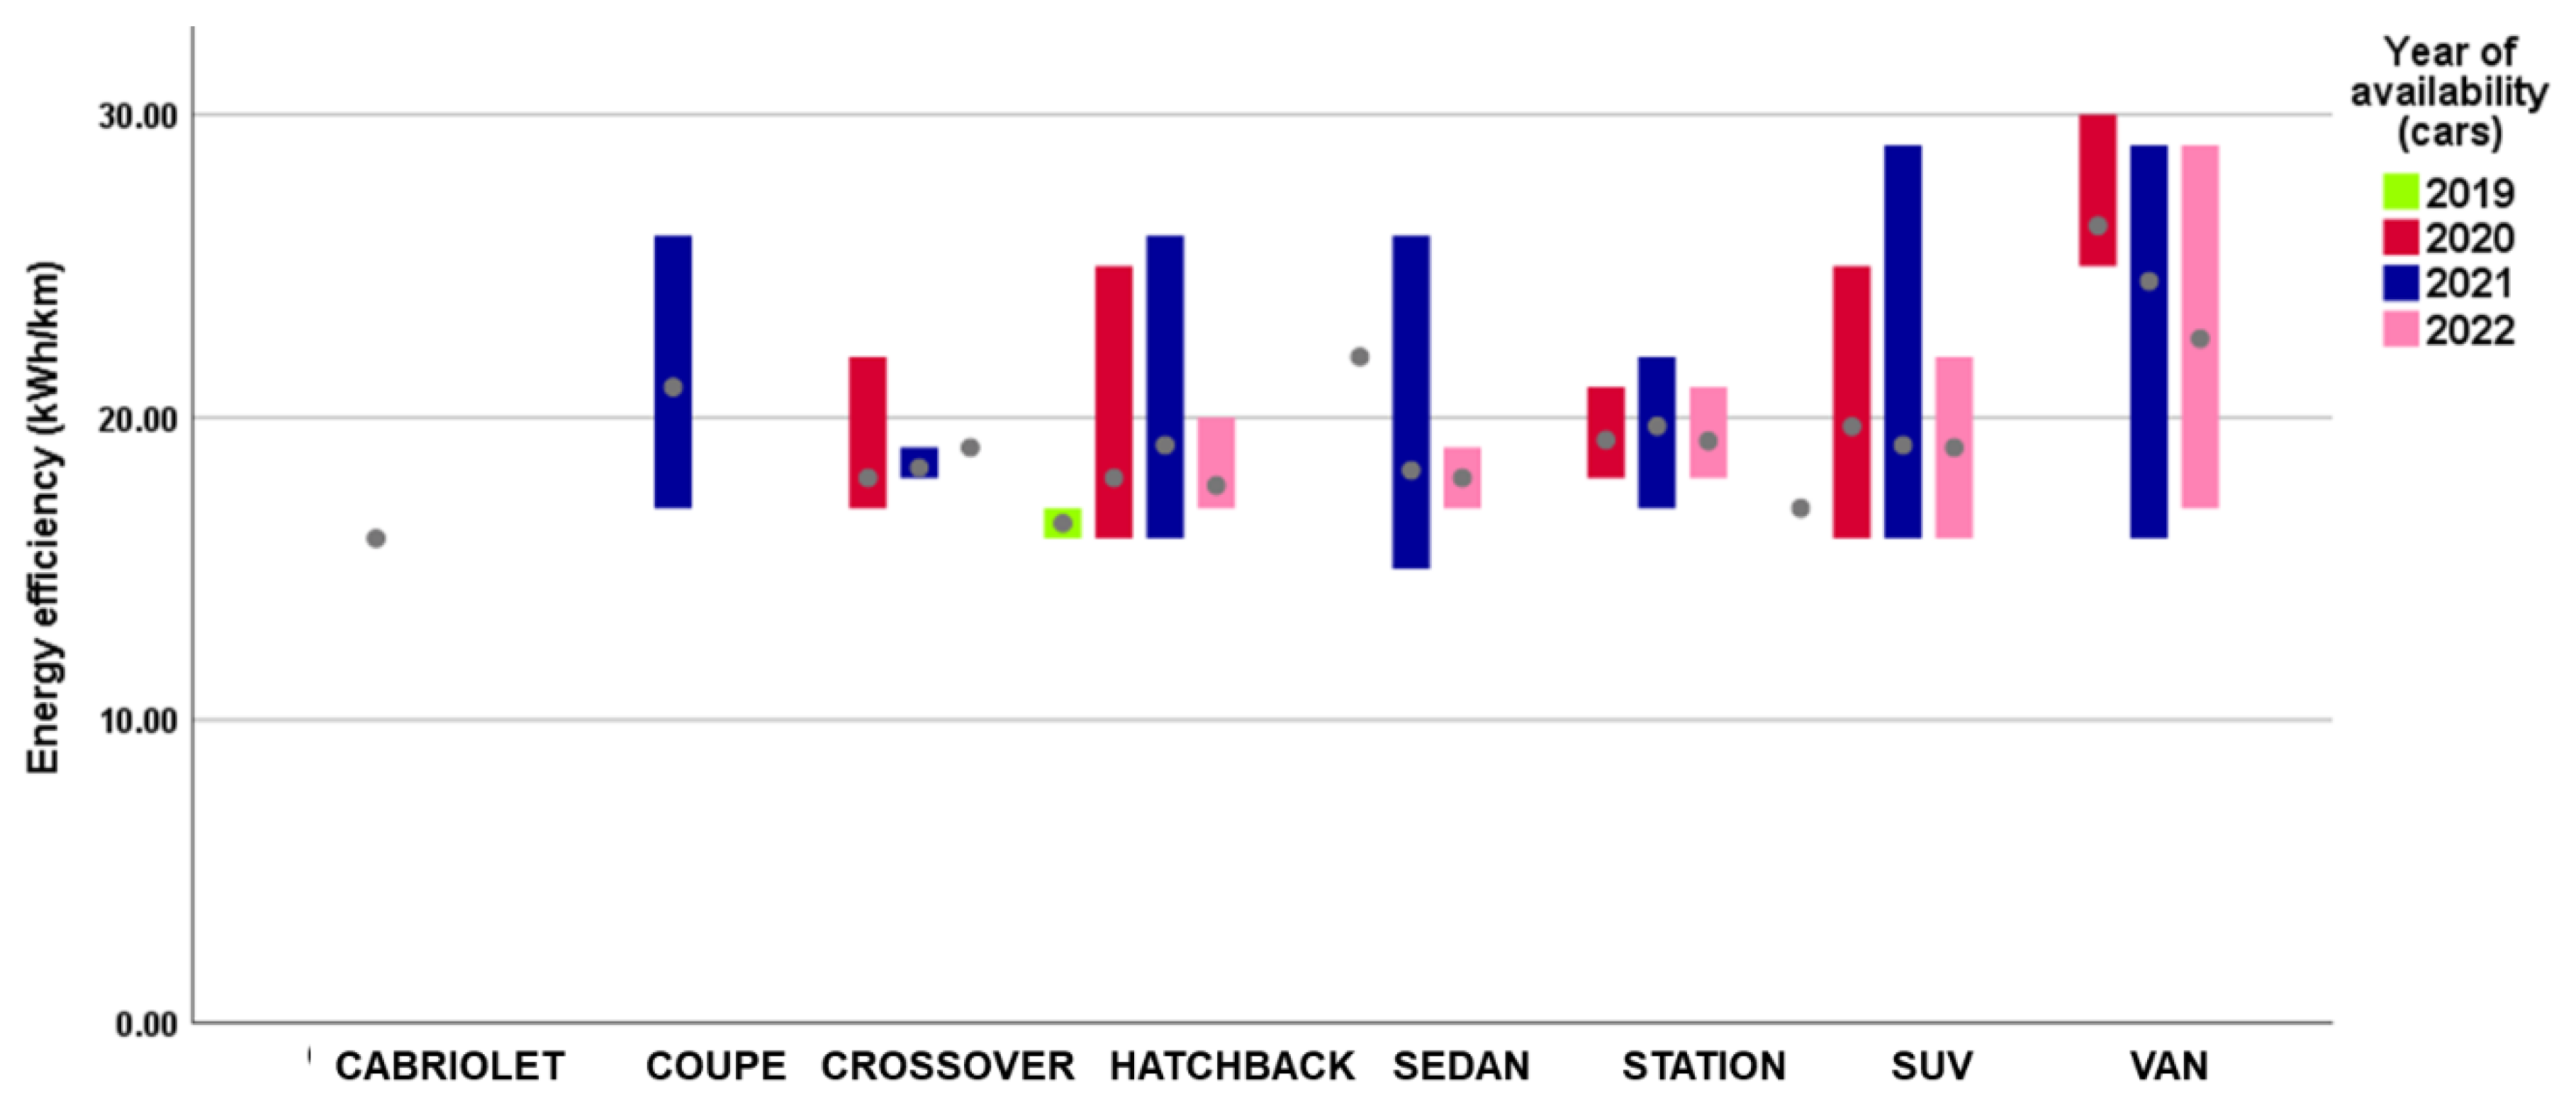
Analyzing the development and variation of the performance and technical parameters of electric vehicles from the point of view of the type (construction class), it is observed that for all the parameters considered (for each type), there are changes along with the evolution over time. From the point of view of the variation of autonomy, the general trend is increasing (Figure 15), with the exceptions regarding the Station class (decrease by 3.23% between 2019 and 2020) and Van class (decrease by 3.7% between 2019 and 2020). The SUV class registered an increase of 21.8% and the highest increase was recorded in the Hatchback class with 91.6%. For the models from the year 2022, the highest average value of the autonomy is 520 km for the Sedan class, followed at a great distance by the autonomy for the Station (389 km) and Crossover (388 km) classes. The lowest value is recorded by the Van class (208 km). By analyzing the results presented in Figure 16, it can be seen that the tendency to increase the energy capacity of the battery registered an increasing trend for almost all construction classes. The exception is the Station class, where in 2021 the average value of the energy capacity of the battery was 84 kWh, but in 2022 the value dropped to 75 kWh (−10.7%). The highest average energy capacity value is found in the Sedan class (92 kWh) and the lowest in the Van class (60 kWh). The average values of energy efficiency depending on the construction classes generally show positive variations over the 2019–2022 period considered in this study (Figure 17). The only negative variation is that registered in the SUV segment, where there is a decrease of −4.06%. For the latest models of electric vehicles present in the vehicle market in 2022, the highest average energy efficiency value is for the Van class with 29 kWh/km, followed by a group of three construction classes with relatively close values: Station (19.4 kWh/km), SUV (19.16 kWh/km), and Crossover (19.0 kWh/km).
The fast-charging parameter increased exponentially for the models built after 2019 because it was one of the influencing factors of the massive entry into the EV market, which corroborated with the development of fast-charging process management technologies (Figure 18). If in 2019, the maximum average value of the parameter was 230 km/1 h for the Hatchback class, in 2020, average values of 955 km/1 h were reached for the Crossover class (with maximum values of over 1000 km/1 h for luxury sedan vehicles). This trend, related to the exponential growth of charging stations at the European Union level and the implementation of GIS systems that provide the driver with information about the remaining autonomy and the optimal place to charge the vehicle depending on the chosen destination, provides an important premise for EVs to become the majority in the future of personal transport.
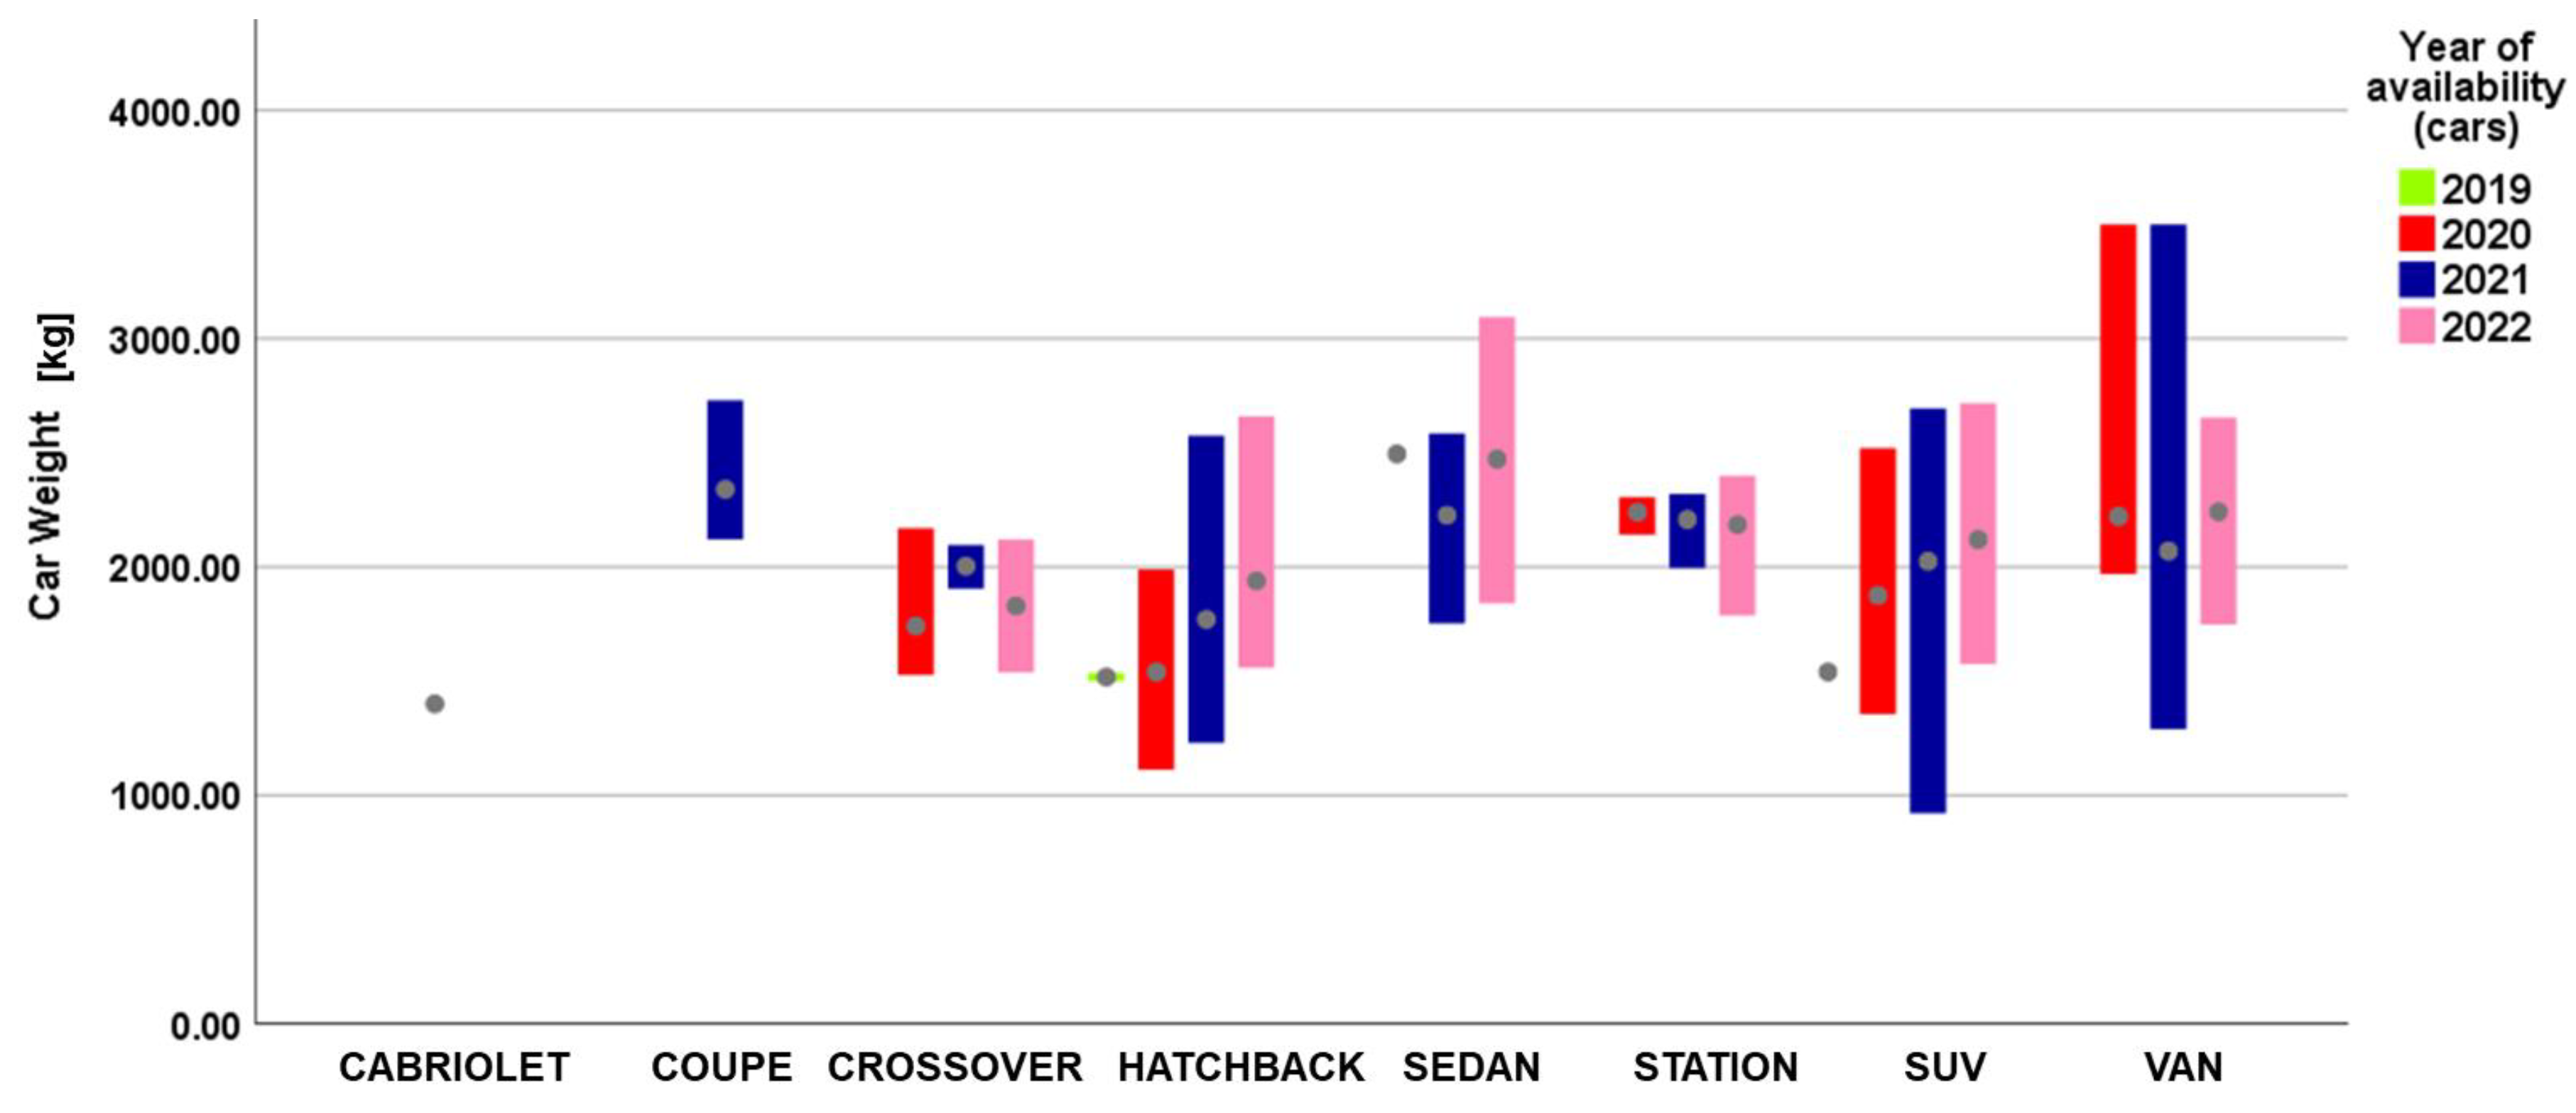
From the point of view of the variation of the weight parameter, in the Crossover class, it increased in 2021 (from 1672 kg to 2002 kg), followed by a decrease of −8.7% in 2022. In the Station models, the weight remained relatively the same, while for the SUV and Van classes, the weight increased by 5.3% and 8.2%, respectively, in 2022 compared to 2020 (Figure 19). However, as a general conclusion, it can be observed that the min–max variation of the weight limits of the vehicles built in 2022 is smaller than in the other years analyzed, which explains the decision of the manufacturers to use a smaller number of platforms in the development of models used by EV.

2.2. Multivariate Statistical Correlation Analysis

It was decided to use a multivariate comparative statistical analysis technique to identify and understand the way in which the performance parameters of electric vehicles show interdependence (and its magnitude). In this regard, the analysis of the interdependence of electric vehicle technical and performance parameters assumed the following:
  • A first statistical correlation analysis, in which we wanted to highlight the causal interdependence (causal link) between a series of performance parameters (autonomy, maximum speed, acceleration) and a series of technical parameters (battery capacity, energy efficiency, fast charging speed, weight, electric motor power) of the electric vehicle. The statistical correlation method based on the Pearson correlation coefficient is a technique used to measure the degree of the linear relationship between two continuous variables. The Pearson correlation coefficient is based on the covariance and standard deviation of the two variables and ranges from −1 to +1. The formula used for calculating the Pearson correlation coefficient is:
r x y = i n x i x ¯ · y i y ¯ i n x i x ¯ 2 · i n y i y ¯ 2
where:
  • rxy is the Pearson correlation coefficient;
  • n is the number of observation pairs (sample size);
  • xi are the individual values of the x variable;
  • yi are the individual values of the y variable;
  • x ¯ is the arithmetic mean of all x values;
  • y ¯ is the arithmetic mean of all y values.
The interpretation of the Pearson correlation coefficient is as follows:
  • If rxy = 1, there is a perfect positive relationship between the two variables.
  • If rxy = −1, there is a perfect negative relationship between the two variables.
  • If rxy is close to 0, there is no linear relationship between the two variables.
  • If rxy is positive, then the two variables are positively associated, meaning that if one increases, the other also increases.
  • If rxy is negative, then the two variables are negatively associated, meaning that if one increases, the other decreases.
In the context of predicting interdependencies between variables, the Pearson correlation coefficient can be used to determine whether there is a linear relationship between two variables and to predict the values of one variable based on the values of the other variable. Moreover, the use method has several advantages regarding the analysis of the degree of interdependence between the performance and technical parameters of an electric vehicle. These advantages include:
  • (a)
    Accuracy: statistical correlation analysis measures the degree of the linear relationship between two variables, which means that it can be used to precisely evaluate the interdependence between the commercial performance of the electric vehicle and its technical parameters. Thus, the prediction model can be highly accurate in estimating the performance of the electric vehicle.
    (b)
    Ease of use: statistical correlation analysis is a metric and simple method that is easy to understand, which makes the prediction model accessible and easy to understand and interpret for specialists in the automotive industry.
    (c)
    Scalability: the prediction model is scalable and can be applied to a wide range of electric vehicles, regardless of their size or performance.
    (d)
    Identification of significant relationships: the model can identify significant relationships between commercial performance and technical parameters, so electric vehicle manufacturers can adjust and make improvements to their vehicle design and specifications to increase their performance and efficiency.
2.
Construction of a causal model and continuous interdependence of the technical and performance parameters of electric vehicles (based on the links/interdependence between them), and model moderated/influenced by customer needs and requests (fast charging and constructive type).
In terms of this study’s methodology, it should be noted that in order to ease, standardize, and facilitate data processing and analysis, a process of recoding the experimentally collected data (values) was used by creating ordinal classes (four classes of values—Table 3). Thus, the experimental data were entered into the four data classes measured at the ordinal level (class 1—small values, class 2—medium values, class 3—high values, class 4—very high values). Practically, the process of statistical data processing was facilitated by reducing the large range of experimental data (values) to only four types of values.

2.2.1. Research Hypotheses

From the point of view of the research objectives, this study starts with the following hypotheses:
H1. 
There is a significant and positive relationship between the 3 performance parameters of electric vehicles (autonomy, maximum speed, and acceleration) and the 5 technical parameters of these vehicles (battery capacity, energy efficiency, weight, fast charging speed, and electric motor power). To test this hypothesis, statistical correlation analysis was used, between the 3 performance parameters of electric vehicles and the 5 technical parameters mentioned above.
H2. 
There is a significant, positive and negative, relationship between the 5 technical parameters of electric vehicles (battery capacity, energy efficiency, weight, electric motor power, and fast charging speed), and to test this hypothesis, the analysis used statistical correlation between the following variables: (1) battery capacity, (2) energy efficiency, (3) weight, (4) electric motor power, (5) fast charging speed.
H3. 
Customer requests significantly influence both performance parameters and technical parameters of electric vehicles. For this hypothesis, we started from the premise that the performance parameters (and indirectly the technical parameters of electric vehicles) are influenced by customer requests in terms of performance criteria and comfort. It was considered that at the time of their launch (availability) in the market, electric vehicles take into account the requirements and requests of customers vis-à-vis the performance of the vehicle (in terms of comfort, autonomy, maximum speed, and acceleration). It should be noted that with the increase in the level of comfort (vehicles with a larger passenger compartment), the technical parameters of electric vehicles (weight) also increase.

2.2.2. Data Analysis and Interpretation

1.
Hypothesis H1.
The statistical correlation analysis results (Table 4) show that the relationship between the three performance parameters of electric vehicles and the five technical parameters considered is statistically significant (a positive correlation link).
It can be seen that the links between the technical and performance parameters are different, as well as the intensity. In this sense, both the electric power of the engine and the battery capacity can be considered the main technical parameters that have the highest interdependence relationships, among all the performance parameters analyzed (in the case of the relationship between battery capacity and autonomy, the Pearson coefficient is 0.606, while in the case of the relationship between the electric power of the engine and acceleration, the Pearson coefficient is 0.633). As a result of the interdependence of the technical parameters on the performance parameters, it can be concluded that greater autonomy, speed, and acceleration of an electric vehicle require not only a larger battery (greater electrical capacity), but also a higher electric motor power. Instead, all these increases in performance parameters have a price to pay, namely, the increase in the weight of these vehicles (in the case of weight, as can be seen from Table 3, the Pearson coefficient is positive and statistically significant, 0.518). From this point of view, the great challenge for builders/producers is to reduce weight while maintaining or increasing the autonomy, maximum speed, and acceleration of the vehicle, respectively, and maintaining a high level of energy efficiency of the electric vehicle.
2.
Hypothesis H2.
According to the statistical correlation analysis (Table 5), the link between the five technical parameters studied (battery capacity, energy efficiency, charging speed, weight, and electric motor power) is predominantly positive and statistically significant (with the exception of energy efficiency). The analysis also reveals that the interdependence between these parameters, as well as their intensity, varies. In this sense, the battery capacity of electric vehicles seems to be the technical parameter that creates the highest level of interdependence compared to the rest of the parameters. As for the intensity, the highest interdependence (connection) is observed between the battery capacity and the vehicle weight (Pearson coefficient of 0.687—Table 5). In second place, as the intensity of the link between the technical parameters is taken into the analysis, is the interdependence between the battery capacity and the fast charging speed (Pearson coefficient of 0.564). From a technical point of view, this analysis highlights, once again, the problem of the weight of electric vehicles. The statistically negative interdependence (relationship) between vehicle weight and efficiency (Pearson coefficient of −0.181) highlights the issue of decreasing electric vehicle energy efficiency with increasing weight—any increase in battery capacity leads to an increase in vehicle weight, and the increase in vehicle weight leads to a decrease in energy efficiency (increase in energy consumption). Practically, the energy efficiency of electric vehicles decreases with an increase in the energy capacity of the battery due to the increase in the total weight of the vehicles.
3.
Hypothesis H3.
It can be seen that both the performance parameters (Table 6) and the technical parameters (Table 7) of electric vehicles have a primarily positive evolution over time (based on the year of market commercialization). Starting from the premise that the year of introduction of electric vehicles to the market essentially represents and highlights customer requests for a certain level of performance (in terms of maximum speed, autonomy, and acceleration) and comfort at the time, the statistical analysis reveals two major aspects, namely (see Table 6 and Table 7):
1. Customer needs and demands are increasingly high in terms of the performance of electric vehicles. In this sense, the requests of the customers rather aim at the level of maximum acceleration (Pearson coefficient of 0.413), autonomy (Pearson coefficient of 0.397), and less at the maximum speed reached (Pearson coefficient of 0.297).
2. Increasingly high customer needs and requests regarding the technical parameters of electric vehicles. In this sense, the highest customer requests are for fast charging speed (Pearson coefficient of 0.374) and less for increasing the weight of the vehicle. The second technical parameter targeted by customers is the energy efficiency of the vehicle (Pearson coefficient of 0.325).
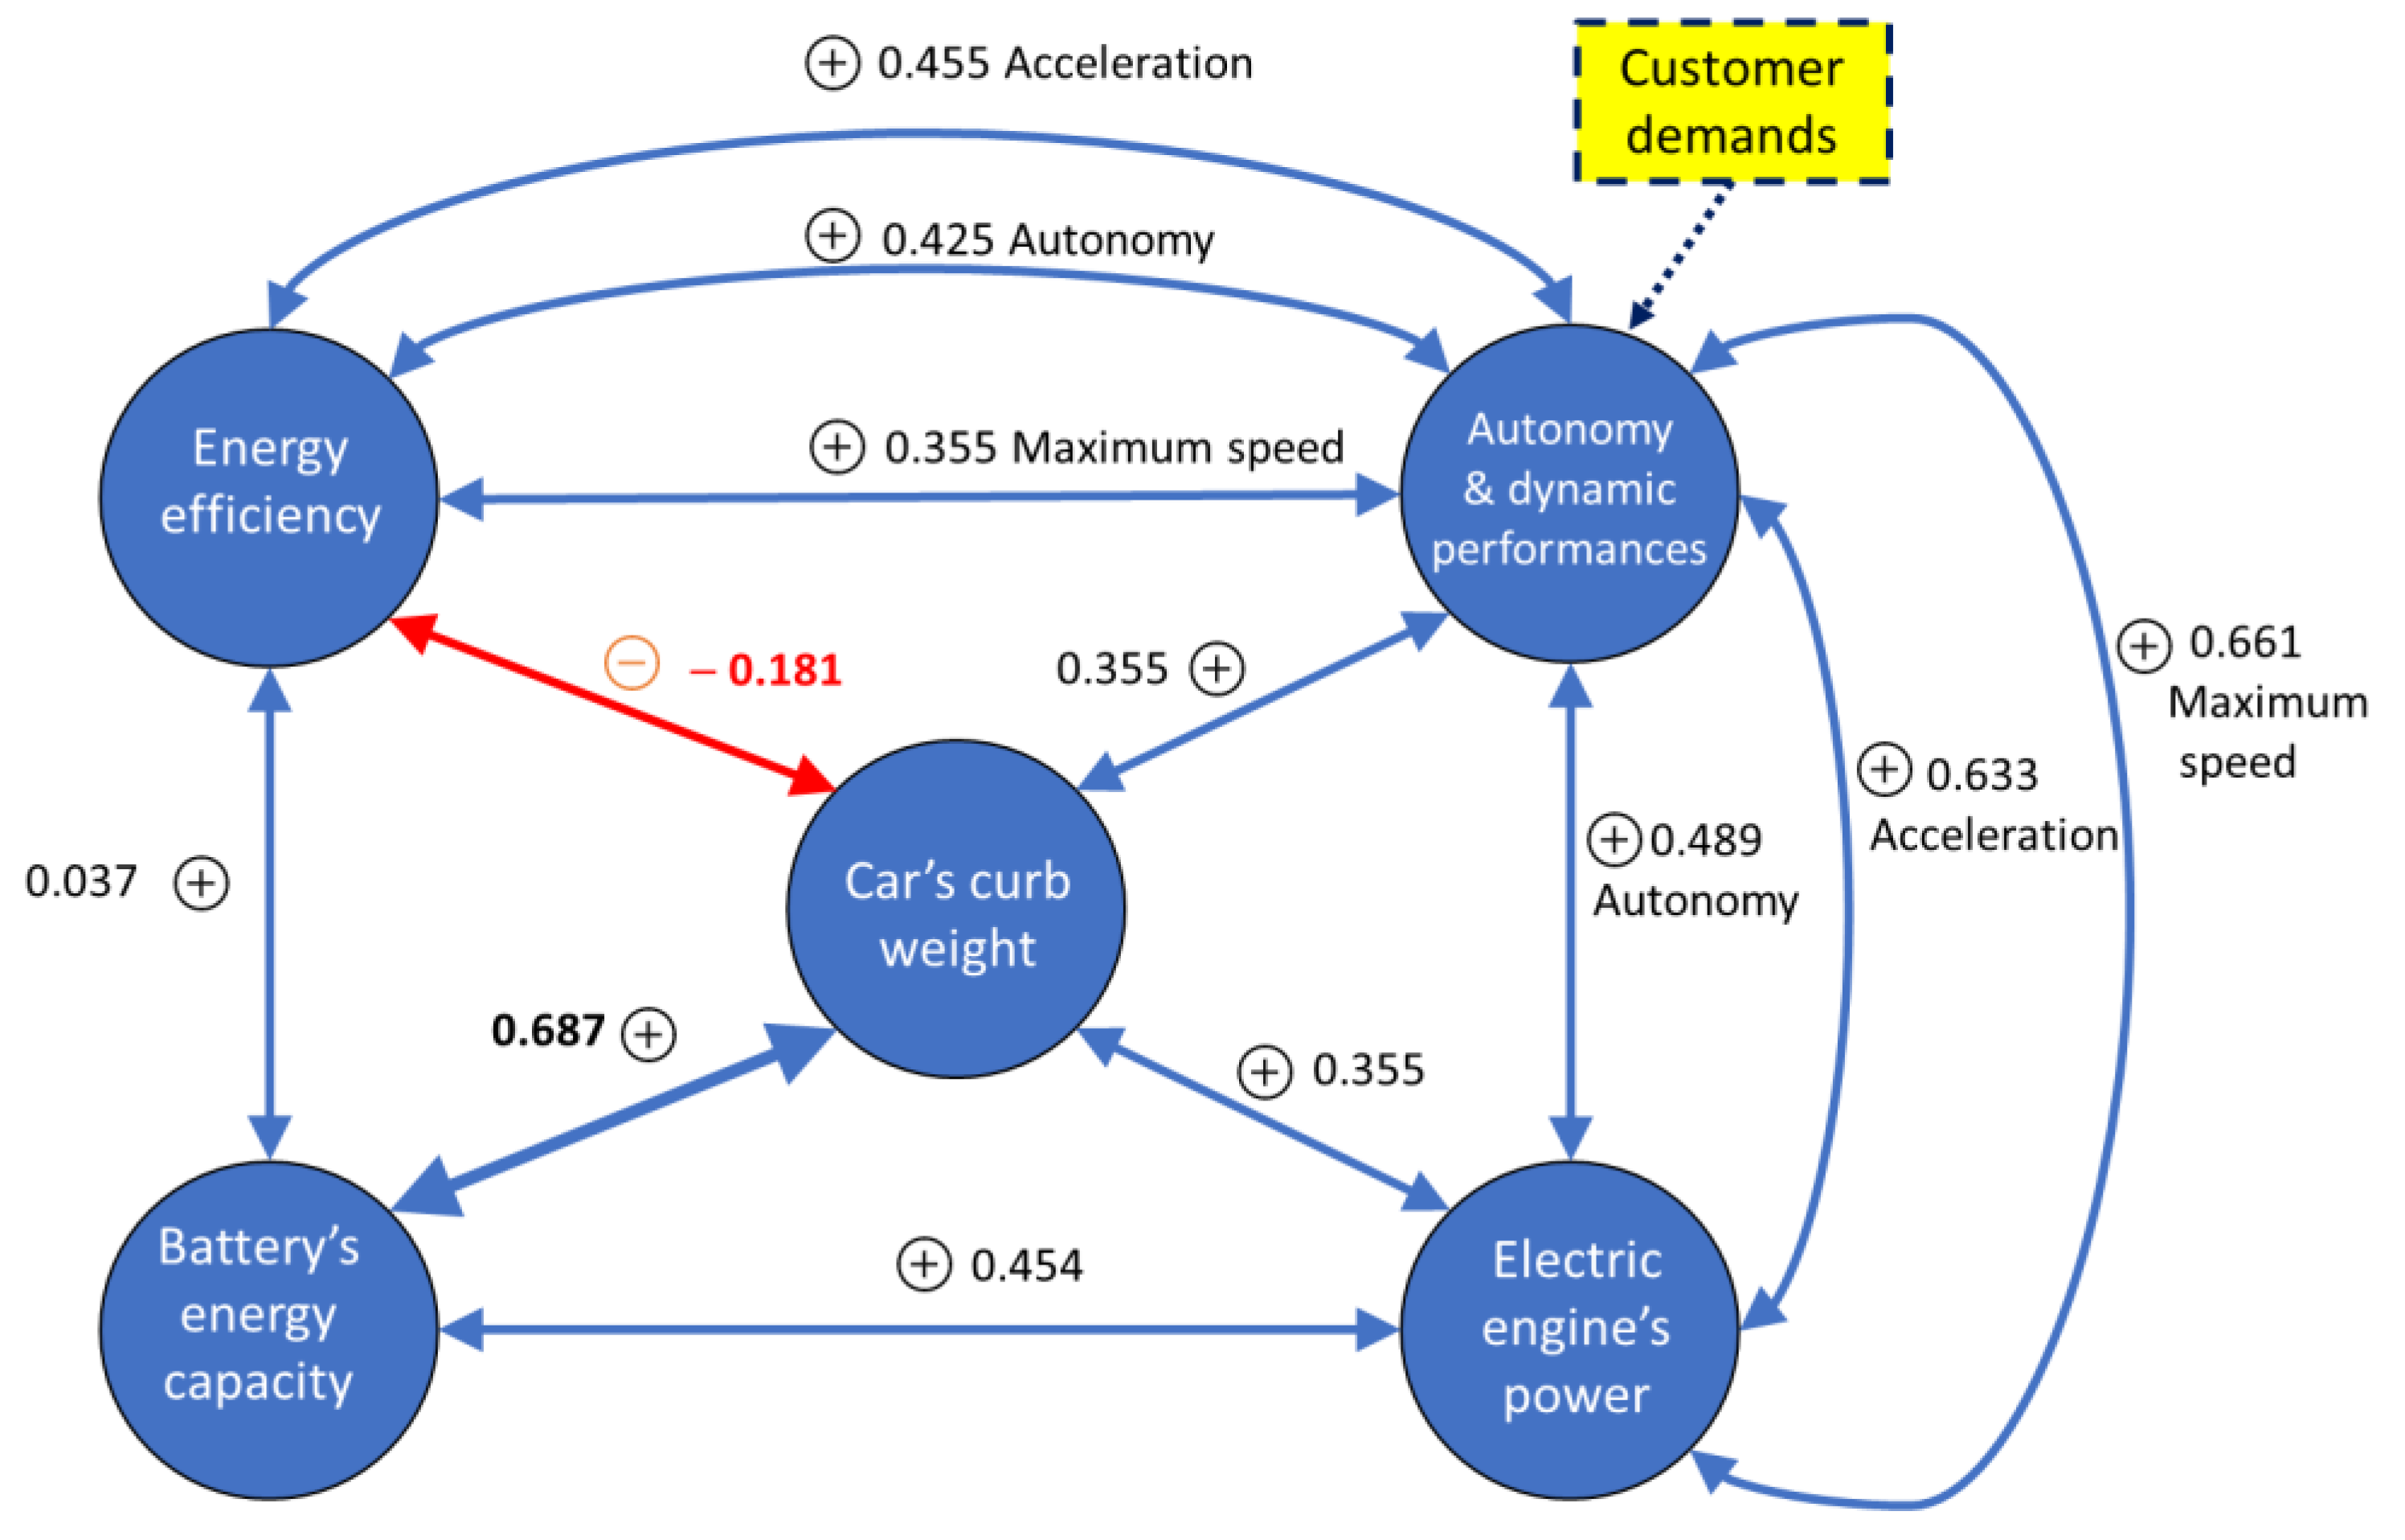
Based on the analysis of the validation of the study hypotheses, we can highlight a general model of continuous interdependence of the considered parameters (Figure 20). Practically, based on the results of the statistical correlation analysis, the model tries to highlight the causal nature of the interdependence of the performance and technical parameters of electric vehicles. The ever-increasing pressures of customer demands (expectations) can be found in the first phase in the increase of vehicle performance parameters (in terms of autonomy, acceleration, and maximum speed), while the increase in the performance of electric vehicles will finally be found in the increase of technical parameters. Customer requests, in essence, create a continuous cycle of interdependencies between performance and technical parameters of electric vehicles. In this sense, increasing the performance parameters contributes to increasing the electric power of the traction motor, and increasing this parameter contributes to the need to increase the electric capacity of the battery, resulting in an increase in vehicle weight. In turn, increasing the electric capacity of the battery contributes to increasing the energy efficiency of the vehicle, but it also contributes to decreasing this parameter (by increasing the total vehicle’s weight). Finally, increasing the energy efficiency of the vehicle will contribute to increasing the performance parameters.
From another point of view, the proposed interdependence model highlights the interference and the (mediating) role that customer requests play in relation to the performance and technical parameters of electric vehicles. In reality, the pressure from consumers’ expectations for performance not only affects the growth of technical and performance characteristics, but also directly fuels the development of interdependence between these parameters. There is a moderating effect of the performance parameters in the sense that the technical parameters of the vehicles are influenced by the customer requirements through the performance parameters. The moderating role of the three most important performance parameters cannot fail to appear since they are, in fact, some of the main criteria for the purchase of electric vehicles.
The interdependencies between the parameters appear to be statistically significant, positive, and of variable intensity, but it should be noted that the intensity of the interdependence between the performance and technical parameters varies. For the highest (intense) connections, respectively, the greatest influence appears to exist between the performance parameters and the electric power of the engine or the electric capacity of the battery. Last, but not least, it must remember the negative implications that appear due to the interdependence between the parameters. In this sense, as can be seen from the proposed model (Figure 20), due to the positive or negative character of the interdependence relationships between the parameters (highlighted on the three levels), a series of negative aspects appear, which in turn constitute a great challenge for electric vehicle manufacturers.
First of all, there is a problem related to weight, namely, the interdependence between weight and the energy efficiency of electric vehicles. As a result, both the increase in performance characteristics (due to customer demand and pressure) and the growth in other technical factors (such as the battery’s electric capacity, the electric motor’s power, and the charging speed) unavoidably result in an increase in the weight of the vehicle. However, once the weight of the vehicle increases, the energy efficiency decreases. This creates a great challenge for electric vehicle manufacturers, in the sense that they have to maintain a high level of energy efficiency, considering the positive interdependence relationship between energy efficiency and performance parameters (the positive influence it especially has on autonomy and acceleration of the electric vehicle). The simplest solution for vehicle manufacturers would be to reduce the weight of the vehicle. This solution, from a certain point of view, means resorting to a compromise against reducing some performance and technical parameters. Reducing one of the performance parameters (reduction of range, acceleration, or maximum speed) cannot be considered a viable solution considering the growing pressures of customers for the ever-higher performances required of electric vehicles (respectively, the fact that the performance parameters of vehicles constitute the main criteria for choosing and purchasing vehicles).
A compromise solution would be one related to reducing the technical parameters, by trying to reduce the electric capacity of the battery or the electric power of the engine, in the hope of reducing the weight of the vehicle. However, this is not viable considering the positive interdependence between the electric capacity of the battery and the electric power of the motor with the performance parameters.
A solution to reduce the speed of fast charging is reflected by the elimination of the systems related to this process and the reduction of the weight of the vehicle. From a certain standpoint, this solution should also be avoided, given that an increasing number of customers consider this technical parameter when deciding whether to purchase an electric vehicle. As a result, compromise solutions that reduce performance parameters and techniques do not appear to be viable or efficient.
Another option, which is much more expensive and complicated but more effective, and which basically presents itself as a great challenge and a future path for vehicle manufacturers, is to increase the technical parameters without increasing the vehicle’s weight. Practically, this solution involves increasing the battery capacity, increasing the power of the electric motor, and increasing the fast charging speed without increasing the vehicle’s weight. This requires continuous technological development and investment in new technologies that will ultimately lead to (performing) batteries with high electrical capacities and light weight, light high power electric motors, respectively, with high fast charging speeds that through technical solutions (specific systems of battery thermal management) do not contribute to weight gain.
One solution for improving the performance of electric batteries is to increase the electrical capacity of lithium-ion cells by combining new materials such as nickel, iron, manganese, aluminum, and silicon, while another possible option would be to develop technology for the production of solid-state type batteries. Solid-state batteries could be the next big change and revolution in terms of impacting the automotive industry. In general, the technology involves replacing the liquid electrolyte previously used in the cells with a solid equivalent. This type of battery would have a number of benefits, such as: (1) increased safety (the solid electrolyte is more stable); (2) extremely high energy capacity (estimation from current research shows that this type of battery would be up to 10 times denser in terms of energy); (3) geometric constructive dimensions and reduced weight.
The second problem that arises is related to the fast charging speed. The positive interdependence between this parameter and the performance parameters leads to the increase in performance having the effect of increasing the charging speeds of the batteries. On the other hand, there is a clear positive evolution of this parameter over time (Table 6), and this shows that there is great pressure from customers, being an important criterion in the process of choosing and purchasing electric vehicles. The problem that arises is that high fast charging speeds put more thermal stress on the battery and will ultimately lead to premature battery destruction (reduced life cycles).
The immediate remedy of this problem depends on the identification of efficient (why not intelligent) cooling solutions, but which do not contribute substantially to the increase in the total weight of the electric vehicle. Another solution would be the development of technologies related to the manufacture of batteries that allow high charging speeds without heating up. Therefore, no matter which solution is chosen, the problem of charging speed remains a big and topical challenge for electric vehicle manufacturers.

3. Conclusions

The aim of this paper was to use statistical methods to analyze the interdependence between a series of performance and technical parameters of vehicles present in the European vehicle market between the years 2019 and 2022. Based on the available data, statistical analyses were performed on 203 types of electric vehicles from 6 construction categories of vehicles, covering 34 manufacturing brands.
Basically, the goal of this analysis was to determine whether there was a relationship between the three key performance metrics for electric vehicles—autonomy, top speed, and acceleration—and five significant technical/constructive metrics for these vehicles—battery capacity, energy efficiency, electric motor power, fast charging speed, and vehicle weight (brand and year of availability in the market). The analysis also attempted to illustrate the statistical correlation and interdependence between the five technological factors that the authors studied and which, in general, characterize an electric vehicle. In addition, the analysis concentrated on creating a statistical model to describe these connections and interdependencies as well as their weight and importance. Thus, it was found that the connection between the performance and technical parameters of electric vehicles is highlighted at three major levels of interdependence, namely:
(1)
A first level aiming at an interdependence due to market demands (requests) of customers and the performance and technical parameters of electric vehicles. The positive interdependence shows an increase over time of both the performance parameters of electric vehicles (especially in terms of autonomy and acceleration) and the technical parameters (especially related to the fast charging speed).
(2)
A second level of interdependence between performance parameters and technical parameters of electric vehicles (positive interdependence). In this case, the greatest interdependence refers to the connection between the autonomy of electric vehicles, vehicle’s curb weight, and energetic capacity of the battery (+0.355 and +0.687, respectively), and between the dynamics of an electric vehicle (acceleration and maximum speed) and the power of the electric motor (+0.633 and +0.661, respectively). The only negative interdependence in the model is between vehicle’s curb weight and energy efficiency (−0.181) (see Figure 20).
(3)
A third level of interdependence, with the negative link between the weight and the energy efficiency of electric vehicles, which highlights the need to continue research and the development of new solutions by the automotive industry to improve this problem.
The novelty of the research presented in this article is given by the analysis of the interdependencies between the performance and technical parameters, an approach that contributes not only to a better understanding of the directions for improving the parameters of electric vehicles, but also helps to substantiate some solutions regarding the efficient development of these type of vehicles. In this sense, the results of the analysis presented in this article promote the idea that any design and construction activity of new models of electric vehicles must consider the influences and continuous interdependence links that appear due to market (customer) demands, minimum performance requirements, and technical–constructive parameters (depending on the three levels of interdependence). However, it must be emphasized that the present article does not take into account economic and social variables and parameters regarding the use of electric vehicles. This limitation can constitute future development directions (approaches) of this research, with an emphasis on the influences that the energy and power grid management can bring in terms of massive EV market penetration, the use of machine learning techniques to optimize the EV functional parameters, and the massive use of renewable energy in the charging process, etc.

Author Contributions

Conceptualization, F.M., I.A.C. and H.R.; methodology, F.M.; validation, I.A.C. and H.R.; statistical analysis, I.A.C. and H.R.; investigation, F.M., I.A.C. and H.R.; writing—original draft preparation, F.M., I.A.C. and H.R.; writing—review and editing, F.M. and H.R.; supervision, F.M. All authors have read and agreed to the published version of the manuscript.

Funding

This research was funded by the Technical University of Cluj-Napoca through the internal grant to support the publication of articles.

Data Availability Statement

Data is unavailable due to privacy.

Conflicts of Interest

The authors declare no conflict of interest.

References

  1. European Environmental Agency. Decarbonising Road Transport—The Role of Vehicles, Fuels and Transport Demand; EEA Report No 2; European Environmental Agency: Copenhagen, Denmark, 2022; Available online: https://www.eea.europa.eu/publications/transport-and-environment-report-2021 (accessed on 24 July 2022).
  2. Mainka, A.; Żak, M. Synergistic or Antagonistic Health Effects of Long- and Short-Term Exposure to Ambient NO2 and PM2.5: A Review. Int. J. Environ. Res. Public Health 2022, 19, 14079. [Google Scholar] [CrossRef] [PubMed]
  3. Lee, J.; Costello, S.; Balmes, J.R.; Holm, S.M. The Association between Ambient PM2.5 and Low Birth Weight in California. Int. J. Environ. Res. Public Health 2022, 19, 13554. [Google Scholar] [CrossRef] [PubMed]
  4. Sechel, I.C.; Mariasiu, F. Efficiency of Governmental Policy and Programs to Stimulate the Use of Low-Emission and Electric Vehicles: The Case of Romania. Sustainability 2022, 14, 45. [Google Scholar] [CrossRef]
  5. Wang, Y.; Wen, Y.; Xu, Y.; Shi, L.; Yang, X. Health Benefits Quantification for New-Energy Vehicles Promotion: A Case Study of Beijing. Int. J. Environ. Res. Public Health 2022, 19, 13876. [Google Scholar] [CrossRef]
  6. Tornatore, C.; Marchitto, L. Advanced Technologies for the Optimization of Internal Combustion Engines. Appl. Sci. 2021, 11, 10842. [Google Scholar] [CrossRef]
  7. Burnete, N.V.; Mariasiu, F.; Depcik, C.; Barabas, I.; Moldovanu, D. Review of thermoelectric generation for internal combustion engine waste heat recovery. Prog. Energy Combust. Sci. 2022, 91, 101009. [Google Scholar] [CrossRef]
  8. Ximinis, J.; Massaguer, A.; Massaguer, E. NOx Emissions below the Prospective EURO VII Limit on a Retrofitted Heavy-Duty Vehicle. Appl. Sci. 2022, 12, 1189. [Google Scholar] [CrossRef]
  9. Houache, M.S.E.; Yim, C.-H.; Karkar, Z.; Abu-Lebdeh, Y. On the Current and Future Outlook of Battery Chemistries for Electric Vehicles—Mini Review. Batteries 2022, 8, 70. [Google Scholar] [CrossRef]
  10. Andre, D.; Kim, S.-J.; Lamp, P.; Lux, S.F.; Maglia, F.; Paschos, O.; Stiaszny, B. Future generations of cathode materials: An automotive industry perspective. J. Mater. Chem. A 2015, 3, 6709–6732. [Google Scholar] [CrossRef]
  11. Fang, H. Challenges with the Ultimate Energy Density with Li-ion Batteries. IOP Conf. Ser. Earth Environ. Sci. 2021, 781, 042023. [Google Scholar] [CrossRef]
  12. Link, S.; Plötz, P. Technical Feasibility of Heavy-Duty Battery-Electric Trucks for Urban and Regional Delivery in Germany—A Real-World Case Study. World Electr. Veh. J. 2022, 13, 161. [Google Scholar] [CrossRef]
  13. Nykvist, B.; Olsson, O. The feasibility of heavy battery electric trucks. Joule 2021, 5, 901–913. [Google Scholar] [CrossRef]
  14. Mauler, L.; Dahrendorf, L.; Duffner, F.; Winter, M.; Leker, J. Cost-effective technology choice in a decarbonized and diversified long-haul truck transportation sector: A U.S. case study. J. Energy Storage 2022, 46, 103891. [Google Scholar] [CrossRef]
  15. Krim, Y.; Sechilariu, M.; Locment, F.; Alchami, A. Global Cost and Carbon Impact Assessment Methodology for Electric Vehicles’PV-Powered Charging Station. Appl. Sci. 2022, 12, 4115. [Google Scholar] [CrossRef]
  16. Wang, R.; Song, Y.; Xu, H.; Li, Y.; Liu, J. Life Cycle Assessment of Energy Consumption and CO2 Emission from HEV, PHEV and BEV for China in the Past, Present and Future. Energies 2022, 15, 6853. [Google Scholar] [CrossRef]
  17. Environmental Europe Agency. Greenhouse Gas Emission Intensity of Electricity Generation in Europe. 2020. Available online: https://www.eea.europa.eu/data-and-maps/indicators/overview-of-the-electricity-production-3/assessment (accessed on 26 October 2022).
  18. Lieutenant, K.; Borissova, A.V.; Mustafa, M.; McCarthy, N.; Iordache, I. Comparison of “Zero Emission” Vehicles with Petrol and Hybrid Cars in Terms of Total CO2 Release—A Case Study for Romania, Poland, Norway and Germany. Energies 2022, 15, 7988. [Google Scholar] [CrossRef]
  19. Emanovic, M.; Jakara, M.; Baric, D. Challenges and Opportunities for Future BEVs Adoption in Croatia. Sustainability 2022, 14, 8080. [Google Scholar] [CrossRef]
  20. Manutworakit, P.; Choocharukul, K. Factors Influencing Battery Electric Vehicle Adoption in Thailand—Expanding the Unified Theory of Acceptance and Use of Technology’s Variables. Sustainability 2022, 14, 8482. [Google Scholar] [CrossRef]
  21. Lévay, P.Z.; Drossinos, Y.; Thiel, C. The effect of fiscal incentives on market penetration of electric vehicles: A pairwise comparison of total cost of ownership. Energy Policy 2017, 105, 524–533. [Google Scholar] [CrossRef]
  22. Ling, Z.; Cherry, C.R.; Wen, Y. Determining the Factors That Influence Electric Vehicle Adoption: A Stated Preference Survey Study in Beijing, China. Sustainability 2021, 13, 11719. [Google Scholar] [CrossRef]
  23. Kim, M.K.; Oh, J.; Park, J.H.; Joo, C. Perceived value and adoption intention for electric vehicles in Korea: Moderating effects of environmental traits and government supports. Energy 2017, 159, 799–809. [Google Scholar] [CrossRef]
  24. Yang, C.; Tu, J.C.; Jiang, Q. The Influential Factors of Consumers’ Sustainable Consumption: A Case on Electric Vehicles in China. Sustainability 2020, 12, 3496. [Google Scholar] [CrossRef] [Green Version]
  25. Wróblewski, P.; Lewicki, W. A Method of Analyzing the Residual Values of Low-Emission Vehicles Based on a Selected Expert Method Taking into Account Stochastic Operational Parameters. Energies 2021, 14, 6859. [Google Scholar] [CrossRef]
  26. Novotny, A.; Szeberin, I.; Kovács, S.; Máté, D. National Culture and the Market Development of Battery Electric Vehicles in 21 Countries. Energies 2022, 15, 1539. [Google Scholar] [CrossRef]
  27. Sendek-Matysiak, E.; Pyza, D.; Łosiewicz, Z.; Lewicki, W. Total Cost of Ownership of Light Commercial Electrical Vehicles in City Logistics. Energies 2022, 15, 8392. [Google Scholar] [CrossRef]
  28. Pang, H.; Zhang, F. Experimental Data-Driven Parameter Identification and State of Charge Estimation for a Li-Ion Battery Equivalent Circuit Model. Energies 2018, 11, 1033. [Google Scholar] [CrossRef] [Green Version]
  29. Celik, B.; Sandt, R.; dos Santos, L.C.P.; Spatschek, R. Prediction of Battery Cycle Life Using Early-Cycle Data, Machine Learning and Data Management. Batteries 2022, 8, 266. [Google Scholar] [CrossRef]
  30. Yuan, J.; Qin, Z.; Huang, H.; Gan, X.; Li, S.; Li, B. State of Health Estimation and Remaining Useful Life Prediction for a Lithium-Ion Battery with a Two-Layer Stacking Regressor. Energies 2023, 16, 2313. [Google Scholar] [CrossRef]
  31. Domalanta, M.R.B.; Paraggua, J.A.D.R. A Multiphysics Model Simulating the Electrochemical, Thermal, and Thermal Runaway Behaviors of Lithium Polymer Battery. Energies 2023, 16, 2642. [Google Scholar] [CrossRef]
  32. Qiang, H.; Hu, Y.; Tang, W.; Zhang, X. Research on Optimization Strategy of Battery Swapping for Electric Taxis. Energies 2023, 16, 2296. [Google Scholar] [CrossRef]
  33. Soontornnon, N.; Kimata, Y.; Tominaga, Y. Improvement of the Electrode–Electrolyte Interface Using Crosslinked Carbonate-Based Copolymers for Solid-State Lithium-Ion Batteries. Batteries 2022, 8, 273. [Google Scholar] [CrossRef]
  34. Sangeetha, E.; Ramachandran, V. Different Topologies of Electrical Machines, Storage Systems, and Power Electronic Converters and Their Control for Battery Electric Vehicles—A Technical Review. Energies 2022, 15, 8959. [Google Scholar] [CrossRef]
  35. Glucina, M.; Andelic, N.; Lorencin, I.; Car, Z. Estimation of Excitation Current of a Synchronous Machine Using Machine Learning Methods. Computers 2023, 12, 1. [Google Scholar] [CrossRef]
  36. Al-Gabalawy, M.; Elmetwaly, A.H.; Younis, R.A.; Omar, A.I. Temperature prediction for electric vehicles of permanent magnet synchronous motor using robust machine learning tools. J. Ambient. Intell. Humaniz. Comput. 2022. [Google Scholar] [CrossRef]
  37. Thi, M.T.; Kim, C.; Kwon, S.; Kang, H.; Ko, J.M.; Kim, J.; Choi, W. Investigation of the Properties of Anode Electrodes for Lithium–Ion Batteries Manufactured Using Cu, and Si-Coated Carbon Nanowall Materials. Energies 2023, 16, 1935. [Google Scholar] [CrossRef]
  38. Li, T.; An, J.; Zhang, D.; Diao, X.; Liu, C.; Liu, W. Research on Interval Optimal Scheduling Strategy of Virtual Power Plants with Electric Vehicles. World Electr. Veh. J. 2022, 13, 235. [Google Scholar] [CrossRef]
  39. Savari, G.F.; Sathik, M.J.; Raman, L.A.; El-Shahat, A.; Hasanien, H.M.; Almakhles, D.; Aleem, S.H.; Omar, A.I. Assessment of charging technologies, infrastructure and charging station recommendation schemes of electric vehicles: A review. Ain Shams Eng. J. 2023, 14, 101938. [Google Scholar] [CrossRef]
  40. Mohammed, S.S.; Ahamed, T.P.I.; Aleem, S.H.E.A.; Omar, A.I. Interruptible charge scheduling of plug-in electric vehicle to minimize charging cost using heuristic algorithm. Electr. Eng. 2022, 104, 1425–1440. [Google Scholar] [CrossRef]
  41. Awad, M.; Ibrahim, A.M.; Alaas, Z.M.; El-Shahat, A.; Omar, A.I. Design and analysis of an efficient photovoltaic energy-powered electric vehicle charging station using perturb and observe MPPT algorithm. Front. Energy Res. 2022, 10, 969482. [Google Scholar] [CrossRef]
  42. Sebastián, R. Improved Operation and Stability of a Wind-Hydro Microgrid by Means of a Li-Ion Battery Energy Storage. Energies 2022, 15, 9230. [Google Scholar] [CrossRef]
  43. Rahman, A.; Myo Aung, K.; Ihsan, S.; Raja Ahsan Shah, R.M.; Al Qubeissi, M.; Aljarrah, M.T. Solar Energy Dependent Supercapacitor System with ANFIS Controller for Auxiliary Load of Electric Vehicles. Energies 2023, 16, 2690. [Google Scholar] [CrossRef]
  44. EV Specifications—Specifications, News and Comparisons. Available online: https://www.evspecifications.com/ (accessed on 1 May 2022).
  45. Electric Vehicle Database. Available online: https://ev-database.org (accessed on 1 May 2022).
  46. Ultimate SPECS. Available online: https://www.ultimatespecs.com/car-specs/ (accessed on 1 May 2022).
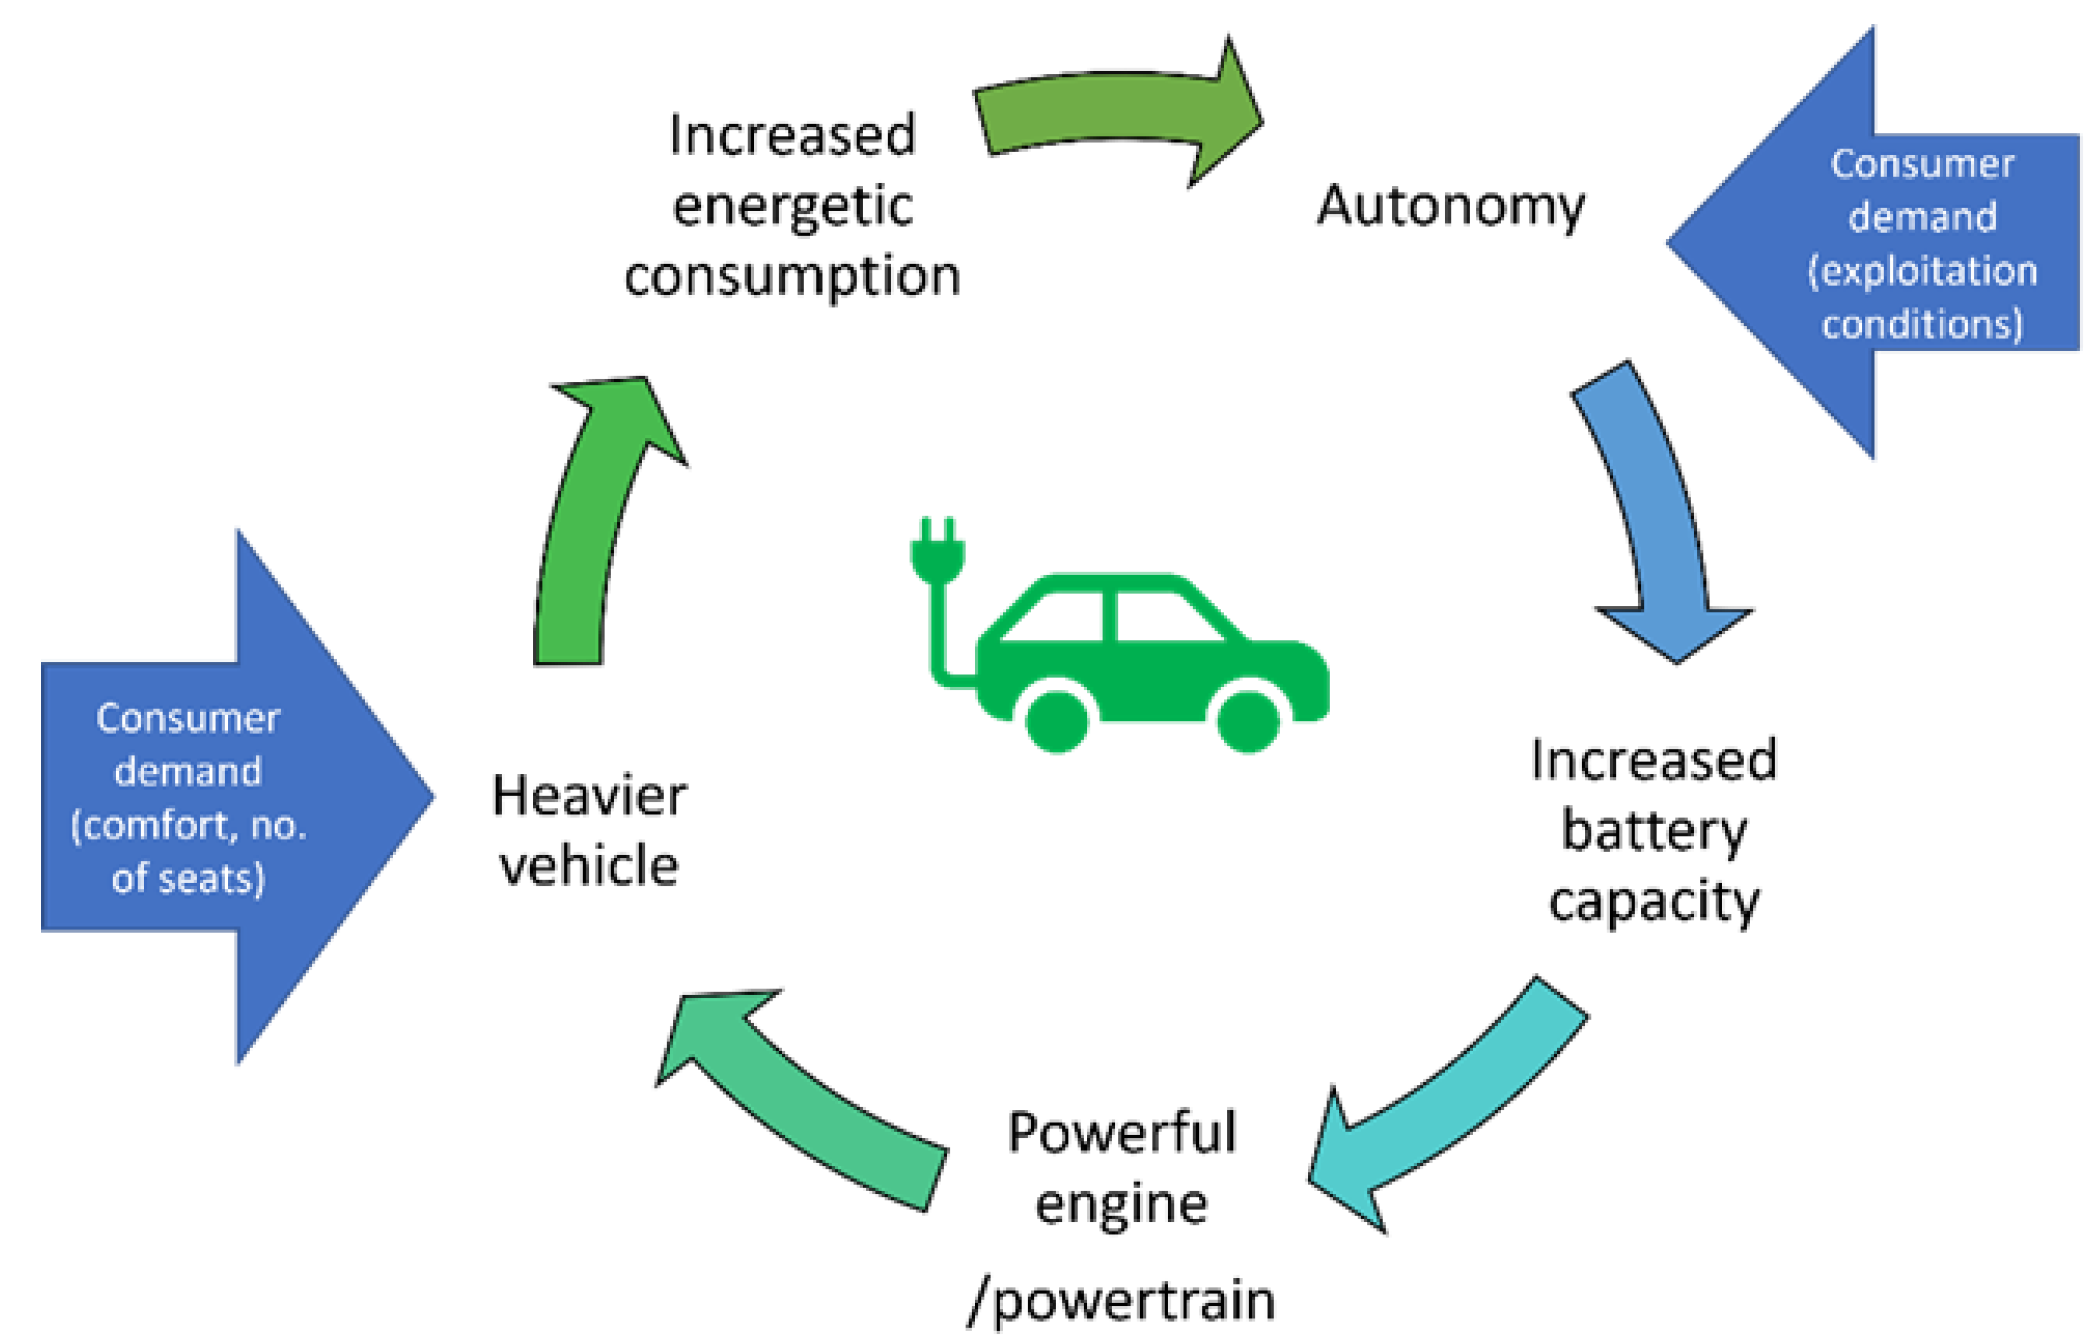
Figure 1. Continued dependence between the main performance parameters of electric vehicles and interference of consumer demands.
Energies 16 02974 g001
Figure 2. Dynamics of new registered electric vehicle passenger vehicles as a percentage of the total number of registrations at the European level (source [25]).
Energies 16 02974 g002
Figure 3. Total number of electric vehicle passenger vehicles (M1) and vans (N1) in 2021 at the European level (source [25]).
Energies 16 02974 g003
Figure 4. Electric vehicle passenger vehicles (M1) and vans (N1) as a percentage of the total fleet in 2021 at the European level (source [25]).
Energies 16 02974 g004
Figure 5. Range bar variation (min, max, mean) representation of autonomy vs. year of availability in market.
Energies 16 02974 g005
Figure 6. Range bar variation (min, max, mean) representation of battery’s energetic capacity vs. year of availability in market.
Energies 16 02974 g006
Figure 7. Range bar variation (min, max, mean) representation of energy efficiency vs. year of availability in market.
Energies 16 02974 g007
Figure 8. Range bar variation (min, max, mean) representation of fast charging speed vs. year of availability in market.
Energies 16 02974 g008
Figure 9. Range bar variation (min, max, mean) representation of vehicle weight vs. year of availability in market.
Energies 16 02974 g009
Figure 10. Range bar variation (min, max, mean) representation of autonomy vs. brands of cars.
Energies 16 02974 g010
Figure 11. Range bar variation (min, max, mean) representation of battery’s energetic capacity vs. brands of cars.
Energies 16 02974 g011
Figure 12. Range bar variation (min, max, mean) representation of energy efficiency vs. brands of cars.
Energies 16 02974 g012
Figure 13. Range bar variation (min, max, mean) representation of fast charging speed vs. brands of cars.
Energies 16 02974 g013
Figure 14. Range bar variation (min, max, mean) representation of vehicle weight vs. brands of cars.
Energies 16 02974 g014
Figure 15. Range bar variation (min, max, mean) representation of autonomy vs. type of cars.
Energies 16 02974 g015
Figure 16. Range bar variation (min, max, mean) representation of battery’s energetic capacity vs. type of cars.
Energies 16 02974 g016
Figure 17. Range bar variation (min, max, mean) representation of energy efficiency vs. type of cars.
Energies 16 02974 g017
Figure 18. Range bar variation (min, max, mean) representation of fast charging speed vs. type of cars.
Energies 16 02974 g018
Figure 19. Range bar variation (min, max, mean) representation of vehicle weight vs. type of cars.
Energies 16 02974 g019
Figure 20. Model of continuous interdependence between the performance and technical parameters of electric cars.
Energies 16 02974 g020
Table 1. Literature studies on EV adoption issues.
Direction of StudyTopicsRef.
Consumer
attitudes
  • Challenges and opportunities for future BEVs adoption
[19]
  • Factors influencing Battery Electric Vehicle adoption
[20]
  • Survey study on influence factors
[22]
  • Effects of environmental traits and government support to adoption intention
[23]
  • EV and influential factors of consumers’ sustainable consumption
[24]
Barriers to
integration
  • Effect of fiscal incentives on market penetration of electric vehicles
[21]
  • TCO and residual values of EV passenger cars
[25]
  • National culture and market development
[26]
  • Total cost of ownership
[27]
Energy efficiency of battery
  • State of charge estimation
[28]
  • Cycle life
[29]
  • State of health estimation and remaining useful life
[30]
  • Thermal stresses
[31]
  • Optimization objective function based on the battery’s state of charge
[32]
EV components
  • Electrode–electrolyte interface
[33]
  • Electric machine topologies
[34]
  • Optimization of synchronous electric machine
[35]
  • Temperature prediction for electric vehicles of permanent magnet synchronous motor
[36]
  • Anode electrodes performances for Li-Ion batteries
[37]
Integration in power grids
  • Charging schedule strategy
[38]
  • Charging technologies, infrastructure, and charging station schemes
[39]
  • Charge scheduling of plug-in electric vehicles
[40]
Use of sustainable energy
  • Application of a photovoltaic energy-powered electric vehicle charging station
[41]
  • Li-Ion battery energy storage integrated into a wind–hydro microgrid
[42]
  • Solar energy supercapacitor system for auxiliary load of EVs
[43]
Table 2. Types (class) of electric vehicle considered.
Type/ClassFrequencyPercentage
(%)
Cumulative Percentage
(%)
Hatchback2914.314.3
Coupe42.016.3
Sedan115.421.7
Cabriolet10.522.2
Sport Utility Vehicle7737.960.1
Crossover104.965.0
Van5125.190.1
Station209.9100.0
Total203100.0-
Table 3. Class-coding parameter data values.
ParameterClass 1Class 2Class 3Class 4
Battery energy capacity (kWh)<2728–5455–80>80
Fast charging speed (km/1 h)100–300301–600601–900>900
Electric engine power (kW)<150151–250251–350>350
Energy efficiency (kWh/km)>2722–2716–2110–15
Car weight
(kg)
<15001501–20002001–2500>2500
Maximum speed (km/h)<130131–180181–230>230
Acceleration
(m/s2)
>12.08.1–12.04.1–8.0<4.0
Autonomy
(km)
<150151–300301–450>451
Table 4. Correlation coefficients between the technical and performance parameters of electric vehicles.
ParameterAutonomy
(km)
Maximum Speed
(km/h)
Acceleration
(m/s2)
Battery energy capacity
(kWh)
Pearson Correlation0.606 **0.434 **0.462 **
Sig. (2-tailed)0.0000.0000.000
N203203203
Energetic efficiency
(Wh/km)
Pearson Correlation0.425 **0.359 **0.455 **
Sig. (2-tailed)0.0000.0000.000
N203203203
Electric engine power
(kW)
Pearson Correlation0.489 **0.661 **0.633 **
Sig. (2-tailed)0.0000.0000.000
N203203203
Fast charging
speed
(km/1 h)
Pearson Correlation0.401 **0.409 **0.425 **
Sig. (2-tailed)0.0000.0000.000
N203203203
Car weight
(kg)
Pearson Correlation0.518 **0.309 **0.332 **
Sig. (2-tailed)0.0000.0000.000
N203203203
** Correlation is significant at the 0.01 level (2-tailed).
Table 5. Correlation coefficients between the technical parameters.
ParameterBattery Energy Capacity (kWh)Energy
Efficiency
(kWh/km)
Electric Engine Power
(kW)
Car Weight
(kg)
Fast Charging Speed
(km/1 h)
Battery energy capacity (kWh)Pearson Corr.10.0370.454 **0.687 **0.564 **
Sig.
(2-tailed)
0.5970.0000.0000.000
N203203203203203
Energy efficiency
(kWh/km)
Pearson Corr.0.03710.299 **−0.181 **0.391 **
Sig.
(2-tailed)
0.597 0.0000.0100.000
N203203203203203
Electric engine power
(kW)
Pearson Corr.0.454 **0.299 **10.355 **0.488 **
Sig.
(2-tailed)
0.0000.000 0.0000.000
N203203203203203
Car
weight
(kg)
Pearson Corr.0.687 **−0.181 **0.355 **10.385 **
Sig.
(2-tailed)
0.0000.0100.000 0.000
N203203203203203
Fast charging speed
(km/1 h)
Pearson Corr.0.564 **0.391 **0.488 **0.385 **1
Sig.
(2-tailed)
0.0000.0000.0000.0000.000
N203203203203203
** Correlation is significant at the 0.01 level (2-tailed).
Table 6. Correlation coefficients between the performance parameters and the year of commercialization.
Years
(2019–2022)
Years
(2019–2022)
Pearson Correlation1
Sig. (2-tailed)
N203
Autonomy
(km)
Pearson Correlation0.397 **
Sig. (2-tailed)0.000
N203
Maximum
speed
(km/h)
Pearson Correlation0.297 **
Sig. (2-tailed)0.000
N203
Acceleration
(m/s2)
Pearson Correlation0.413 **
Sig. (2-tailed)0.000
N203
** Correlation is significant at the 0.01 level (2-tailed).
Table 7. Correlation coefficients between the technical parameters and the year of commercialization.
Years
(2019–2022)
Battery energy
capacity
(kWh)
Pearson Correlation0.244 **
Sig. (2-tailed)0.000
N203
Energy
efficiency
(kWh/km)
Pearson Correlation0.325 **
Sig. (2-tailed)0.000
N203
Electric engine
power
(kW)
Pearson Correlation0.259 **
Sig. (2-tailed)0.000
N203
Fast charging
speed
(km/h)
Pearson Correlation0.374 **
Sig. (2-tailed)0.000
N203
Car
weight
(kg)
Pearson Correlation0.194 **
Sig. (2-tailed)0.000
N203
** Correlation is significant at the 0.01 level (2-tailed).
Disclaimer/Publisher’s Note: The statements, opinions and data contained in all publications are solely those of the individual author(s) and contributor(s) and not of MDPI and/or the editor(s). MDPI and/or the editor(s) disclaim responsibility for any injury to people or property resulting from any ideas, methods, instructions or products referred to in the content.