
Solar Energy Dependent Supercapacitor System with ANFIS Controller for Auxiliary Load of Electric Vehicles

 ,
,  and
and
Abstract
1. Introduction
2. Development Methodology of AI OSSC
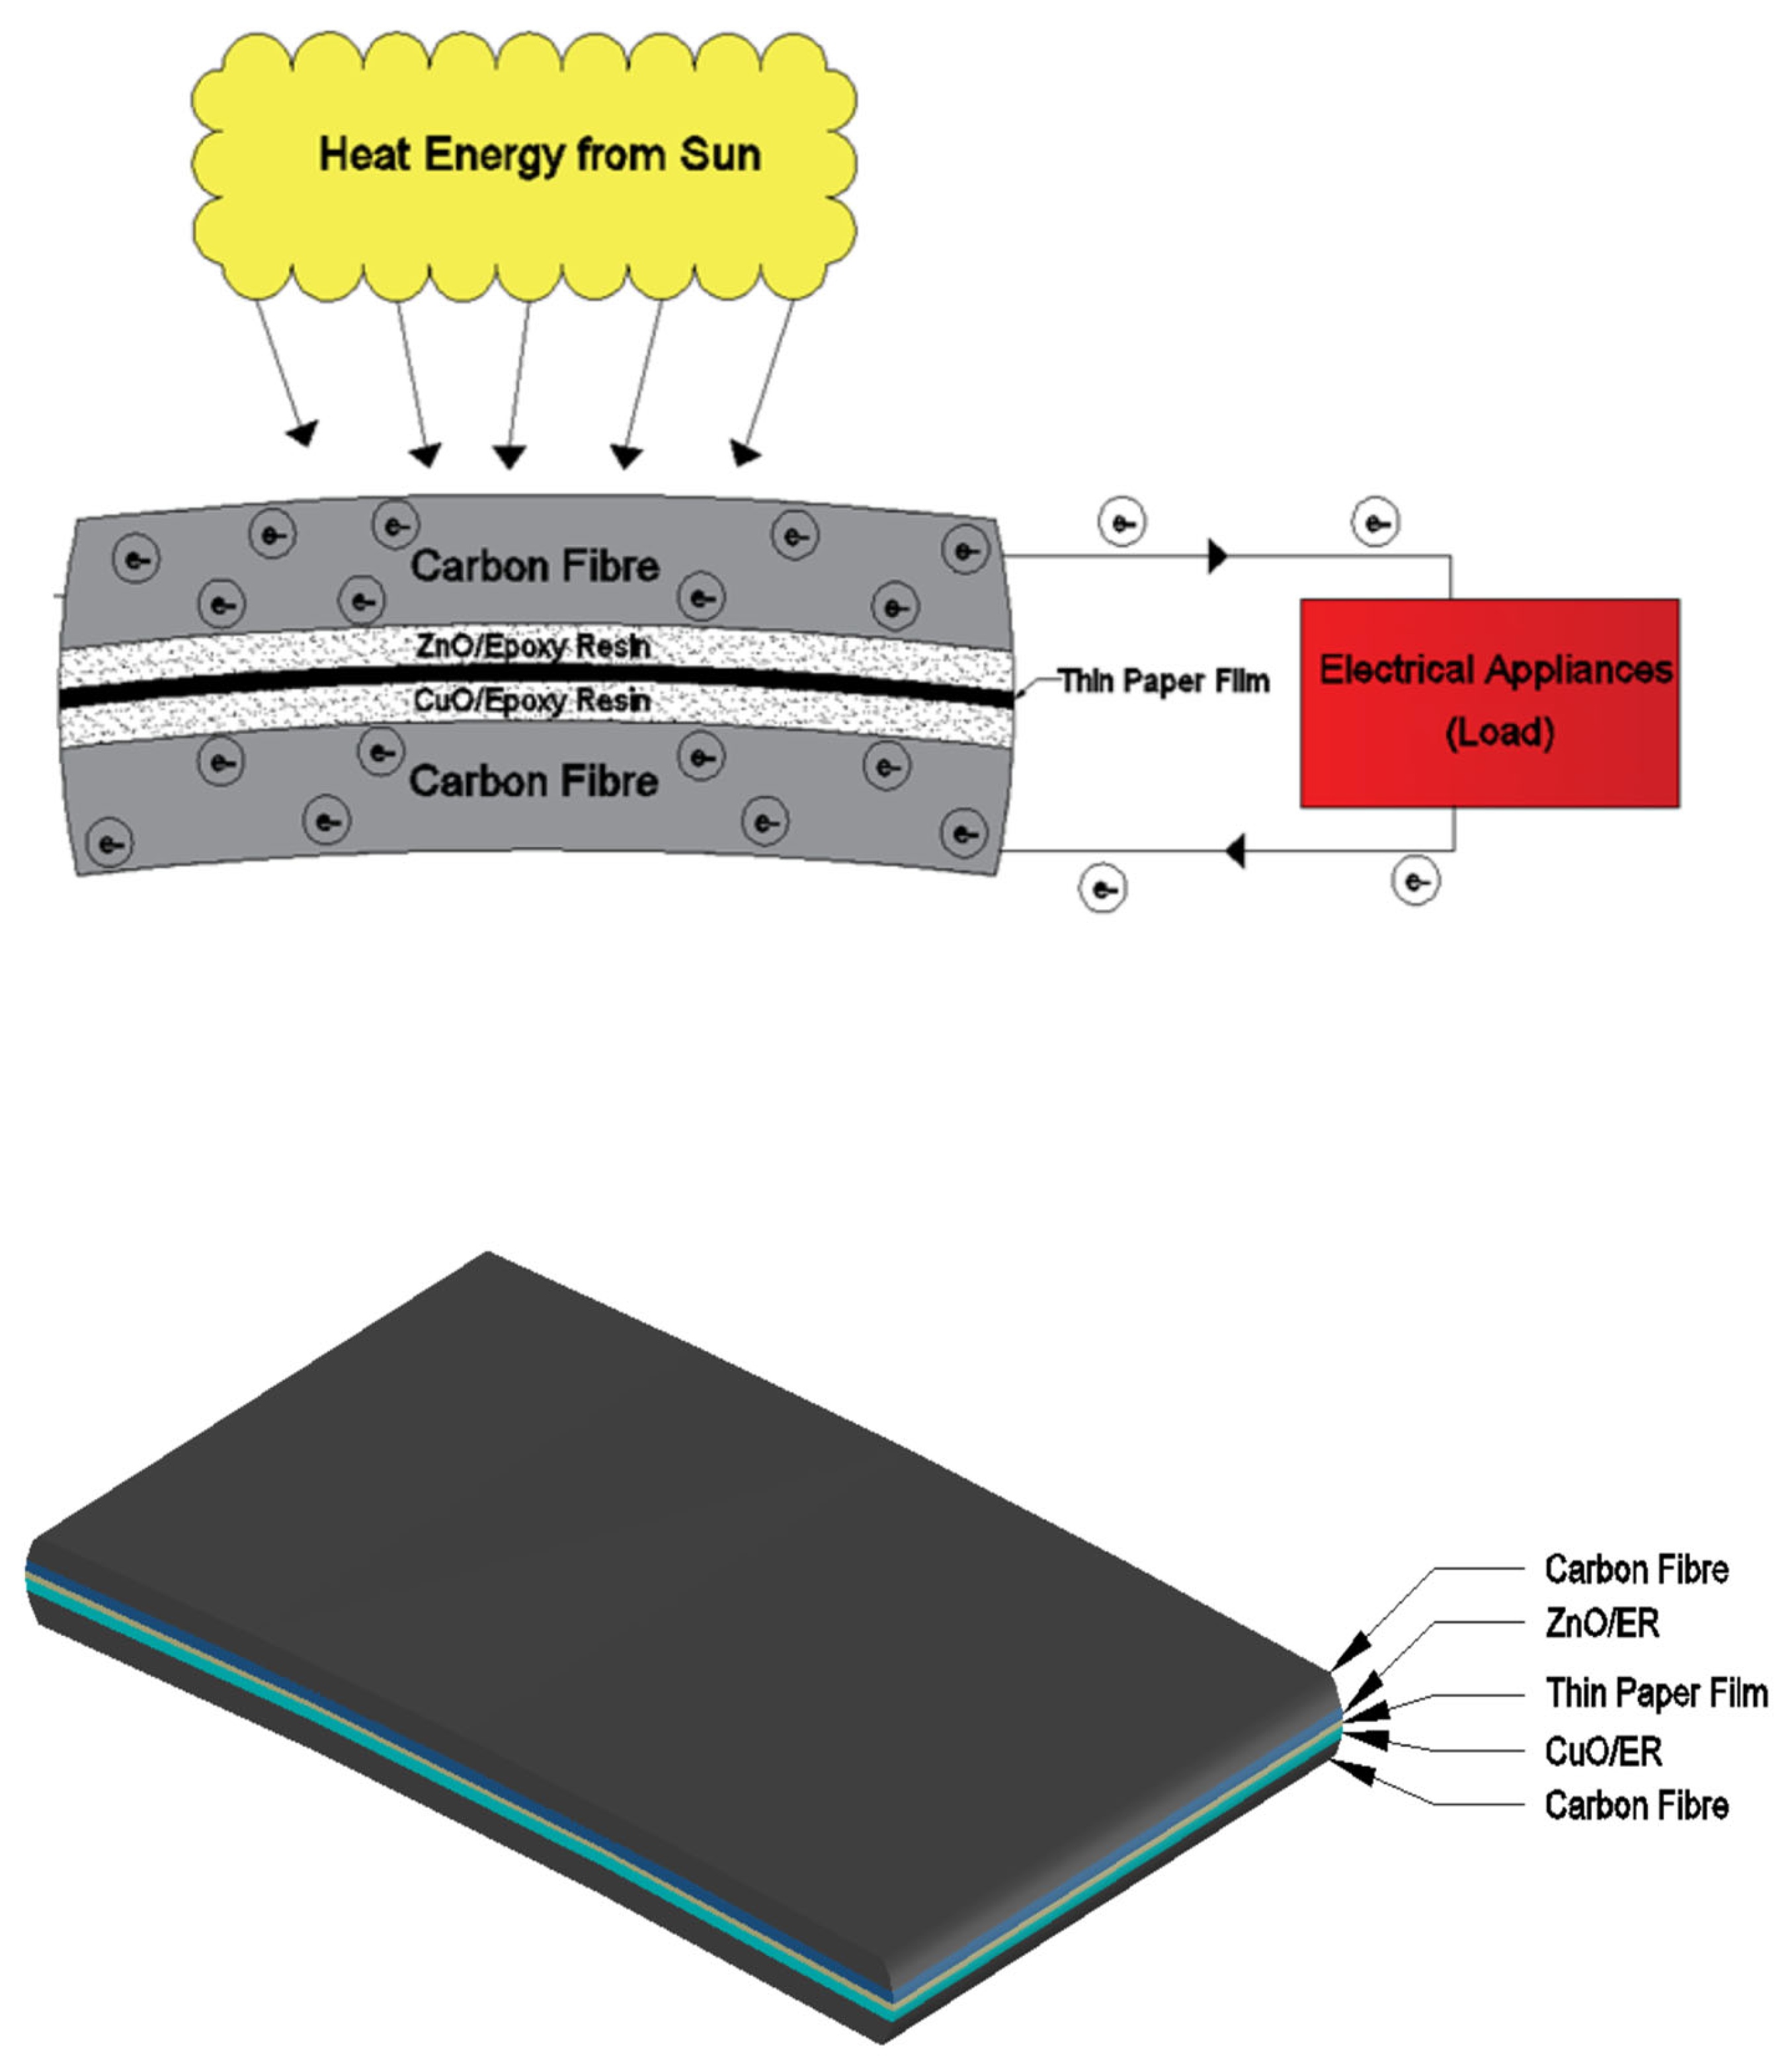
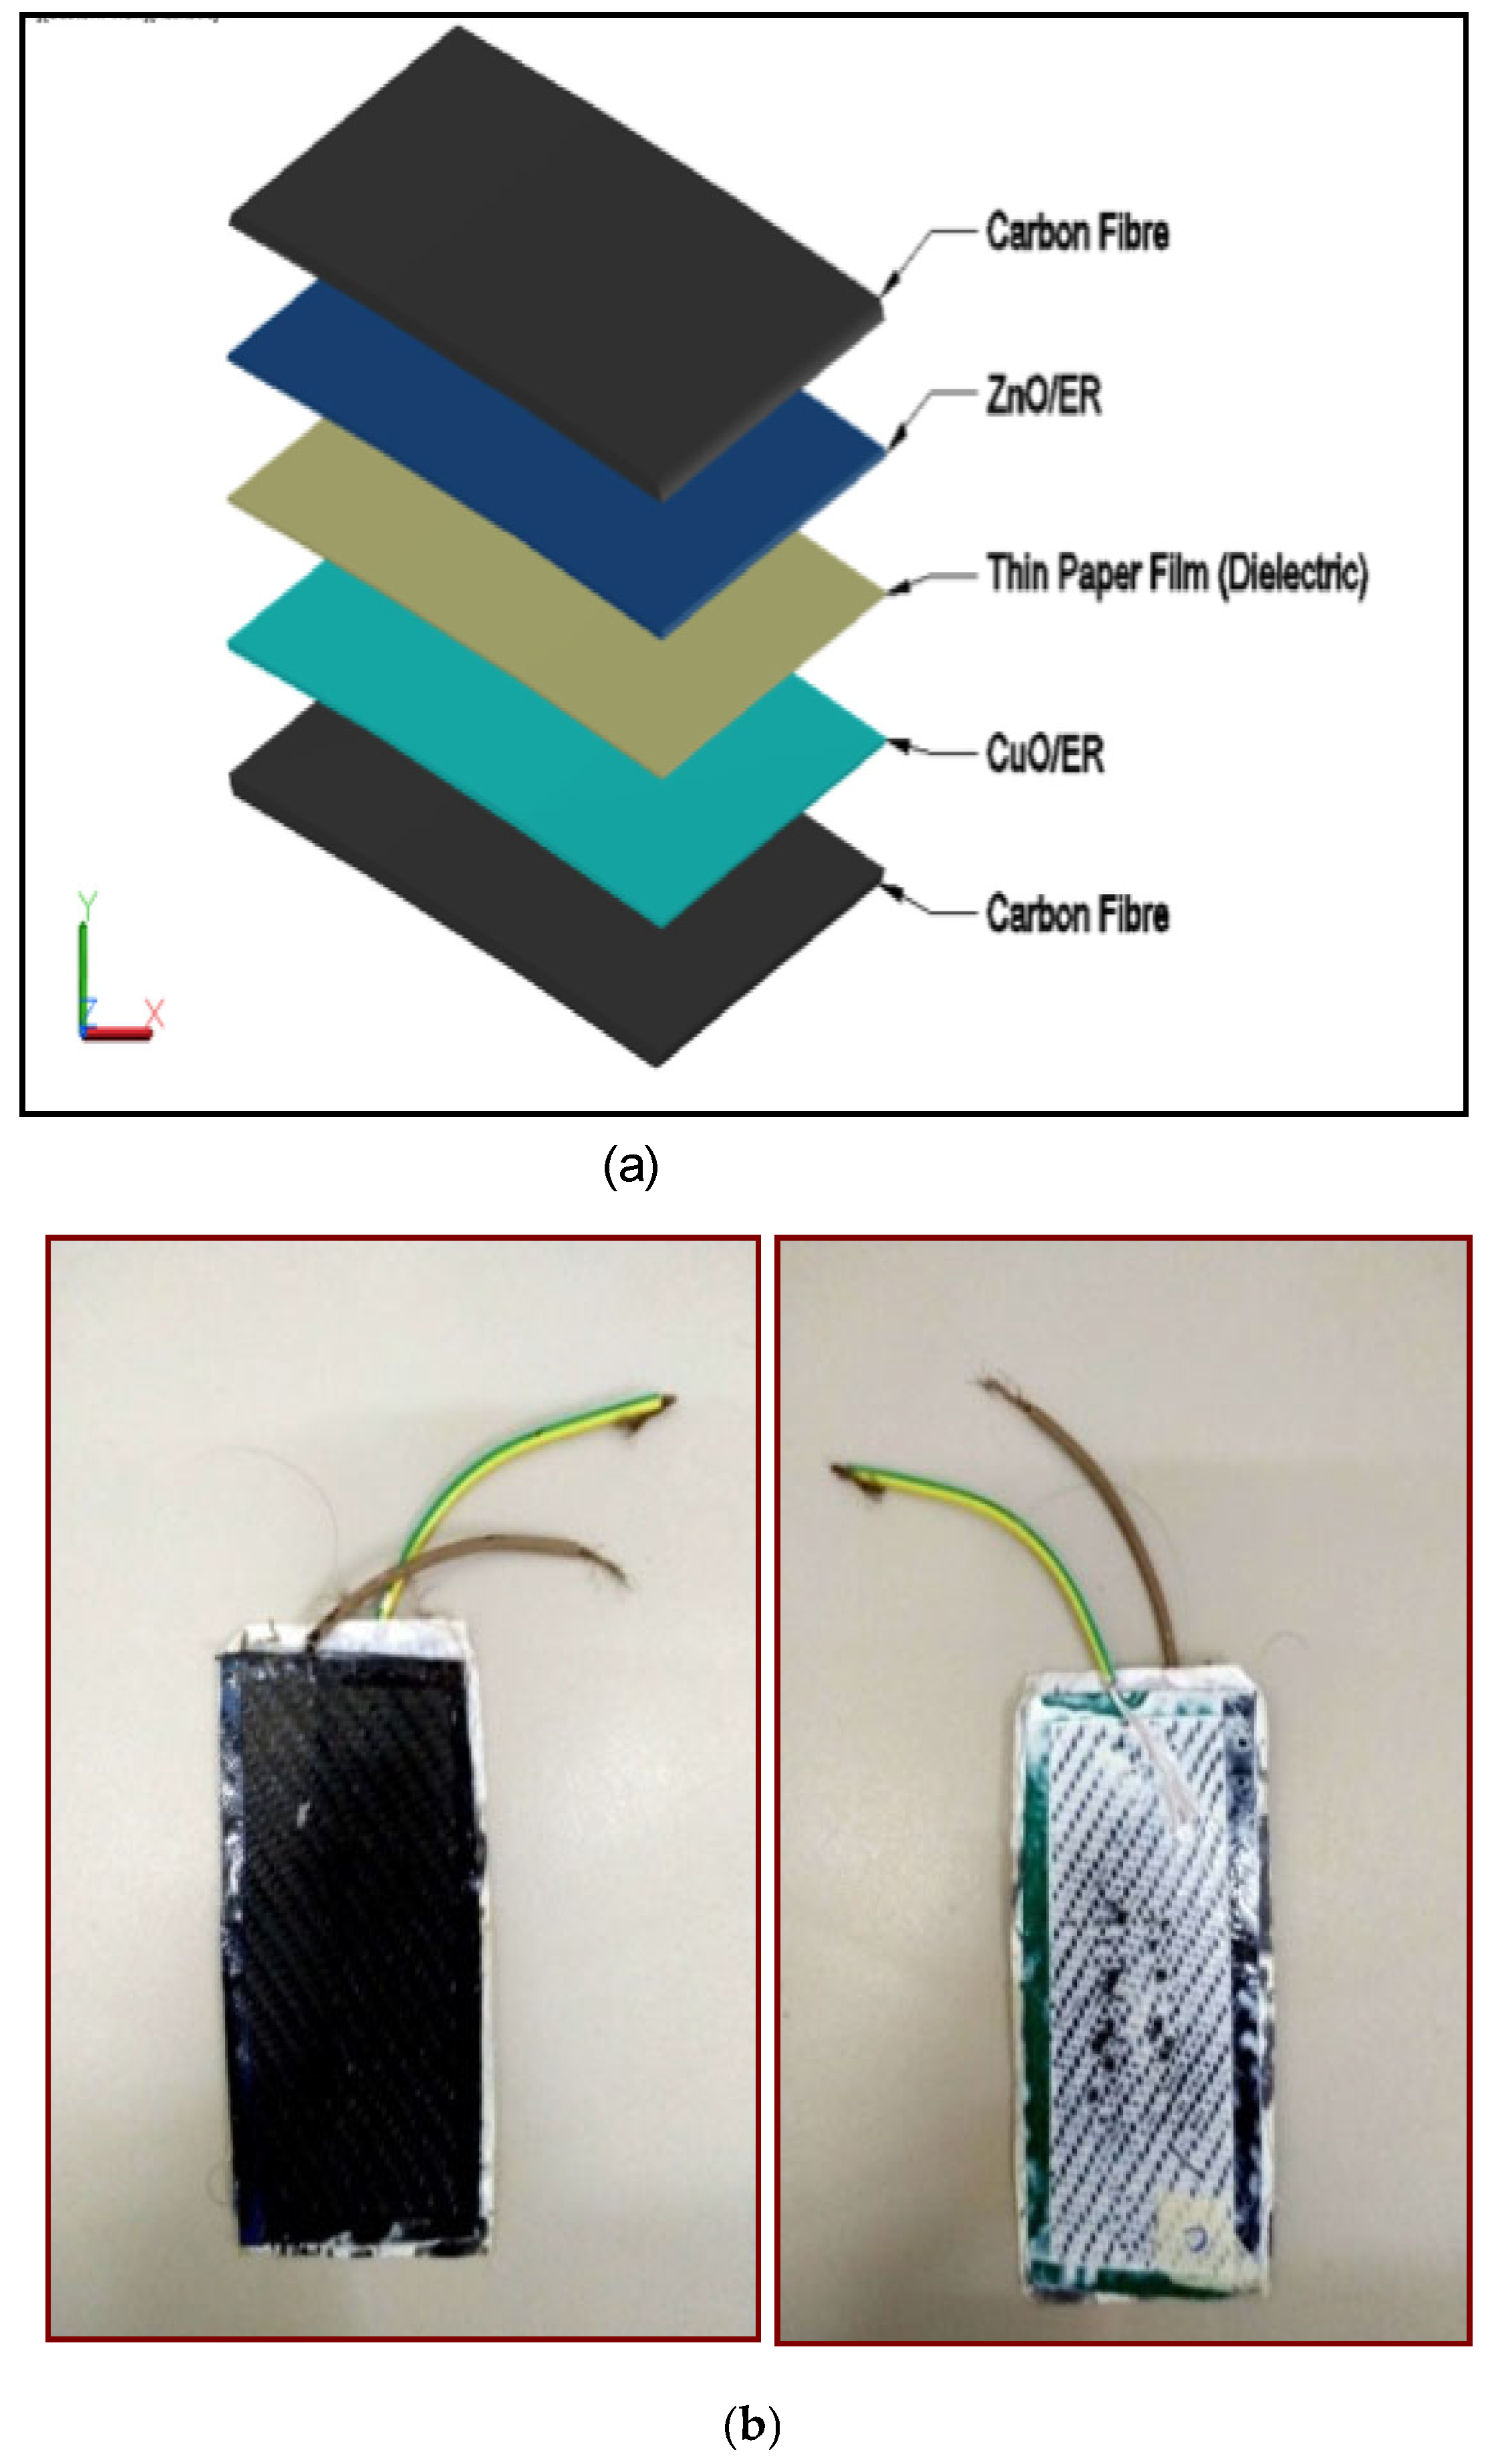
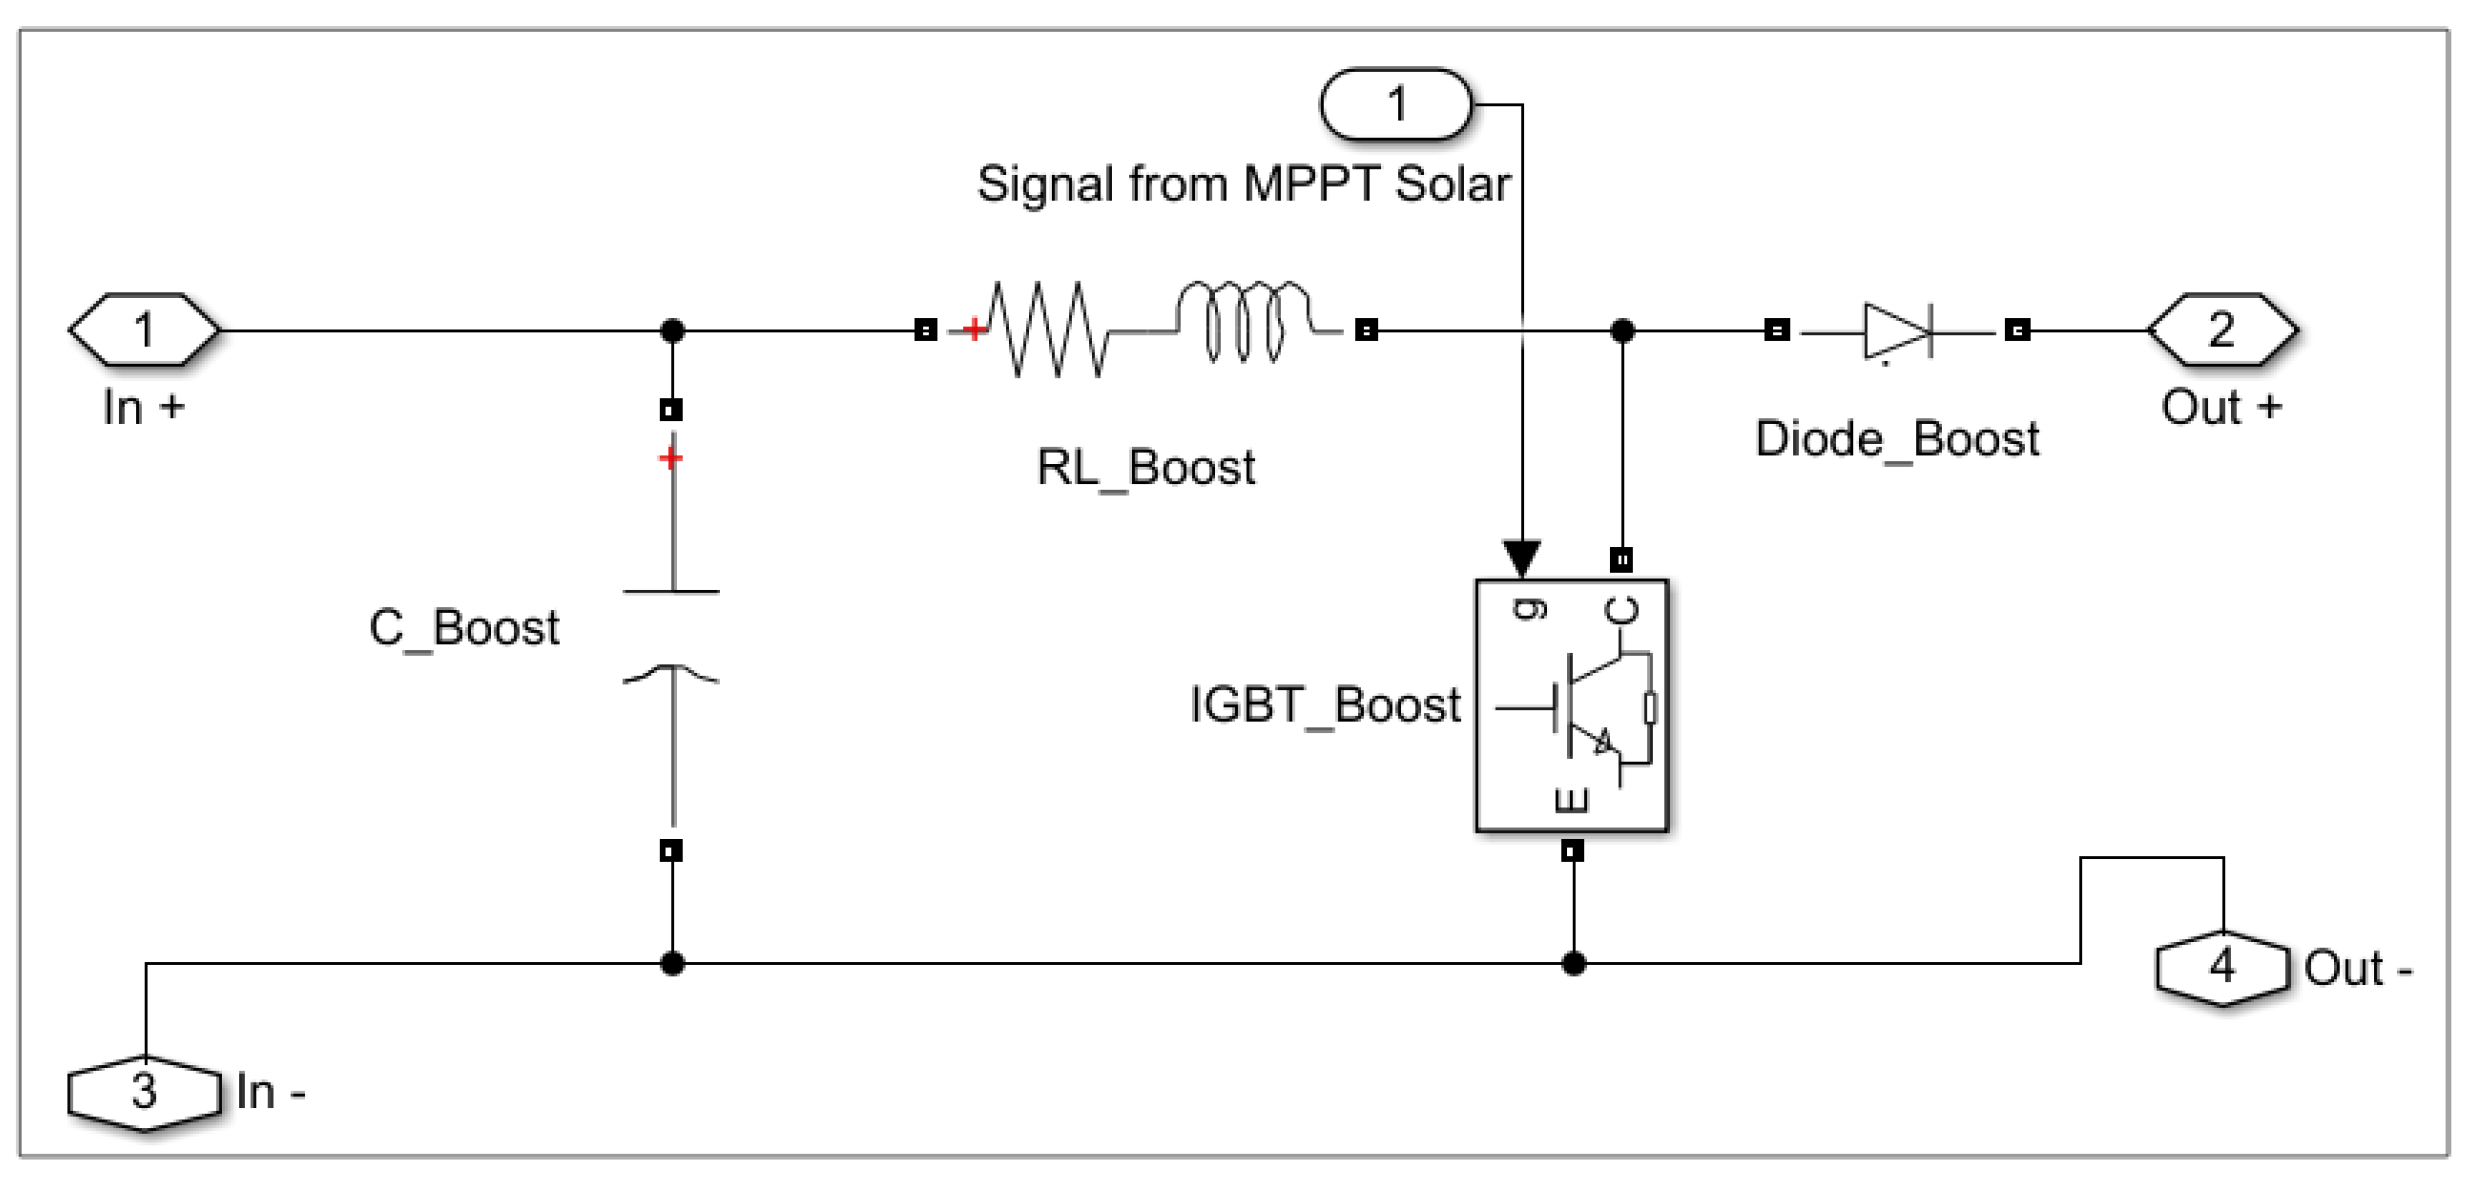
2.1. Development of the OSSC System
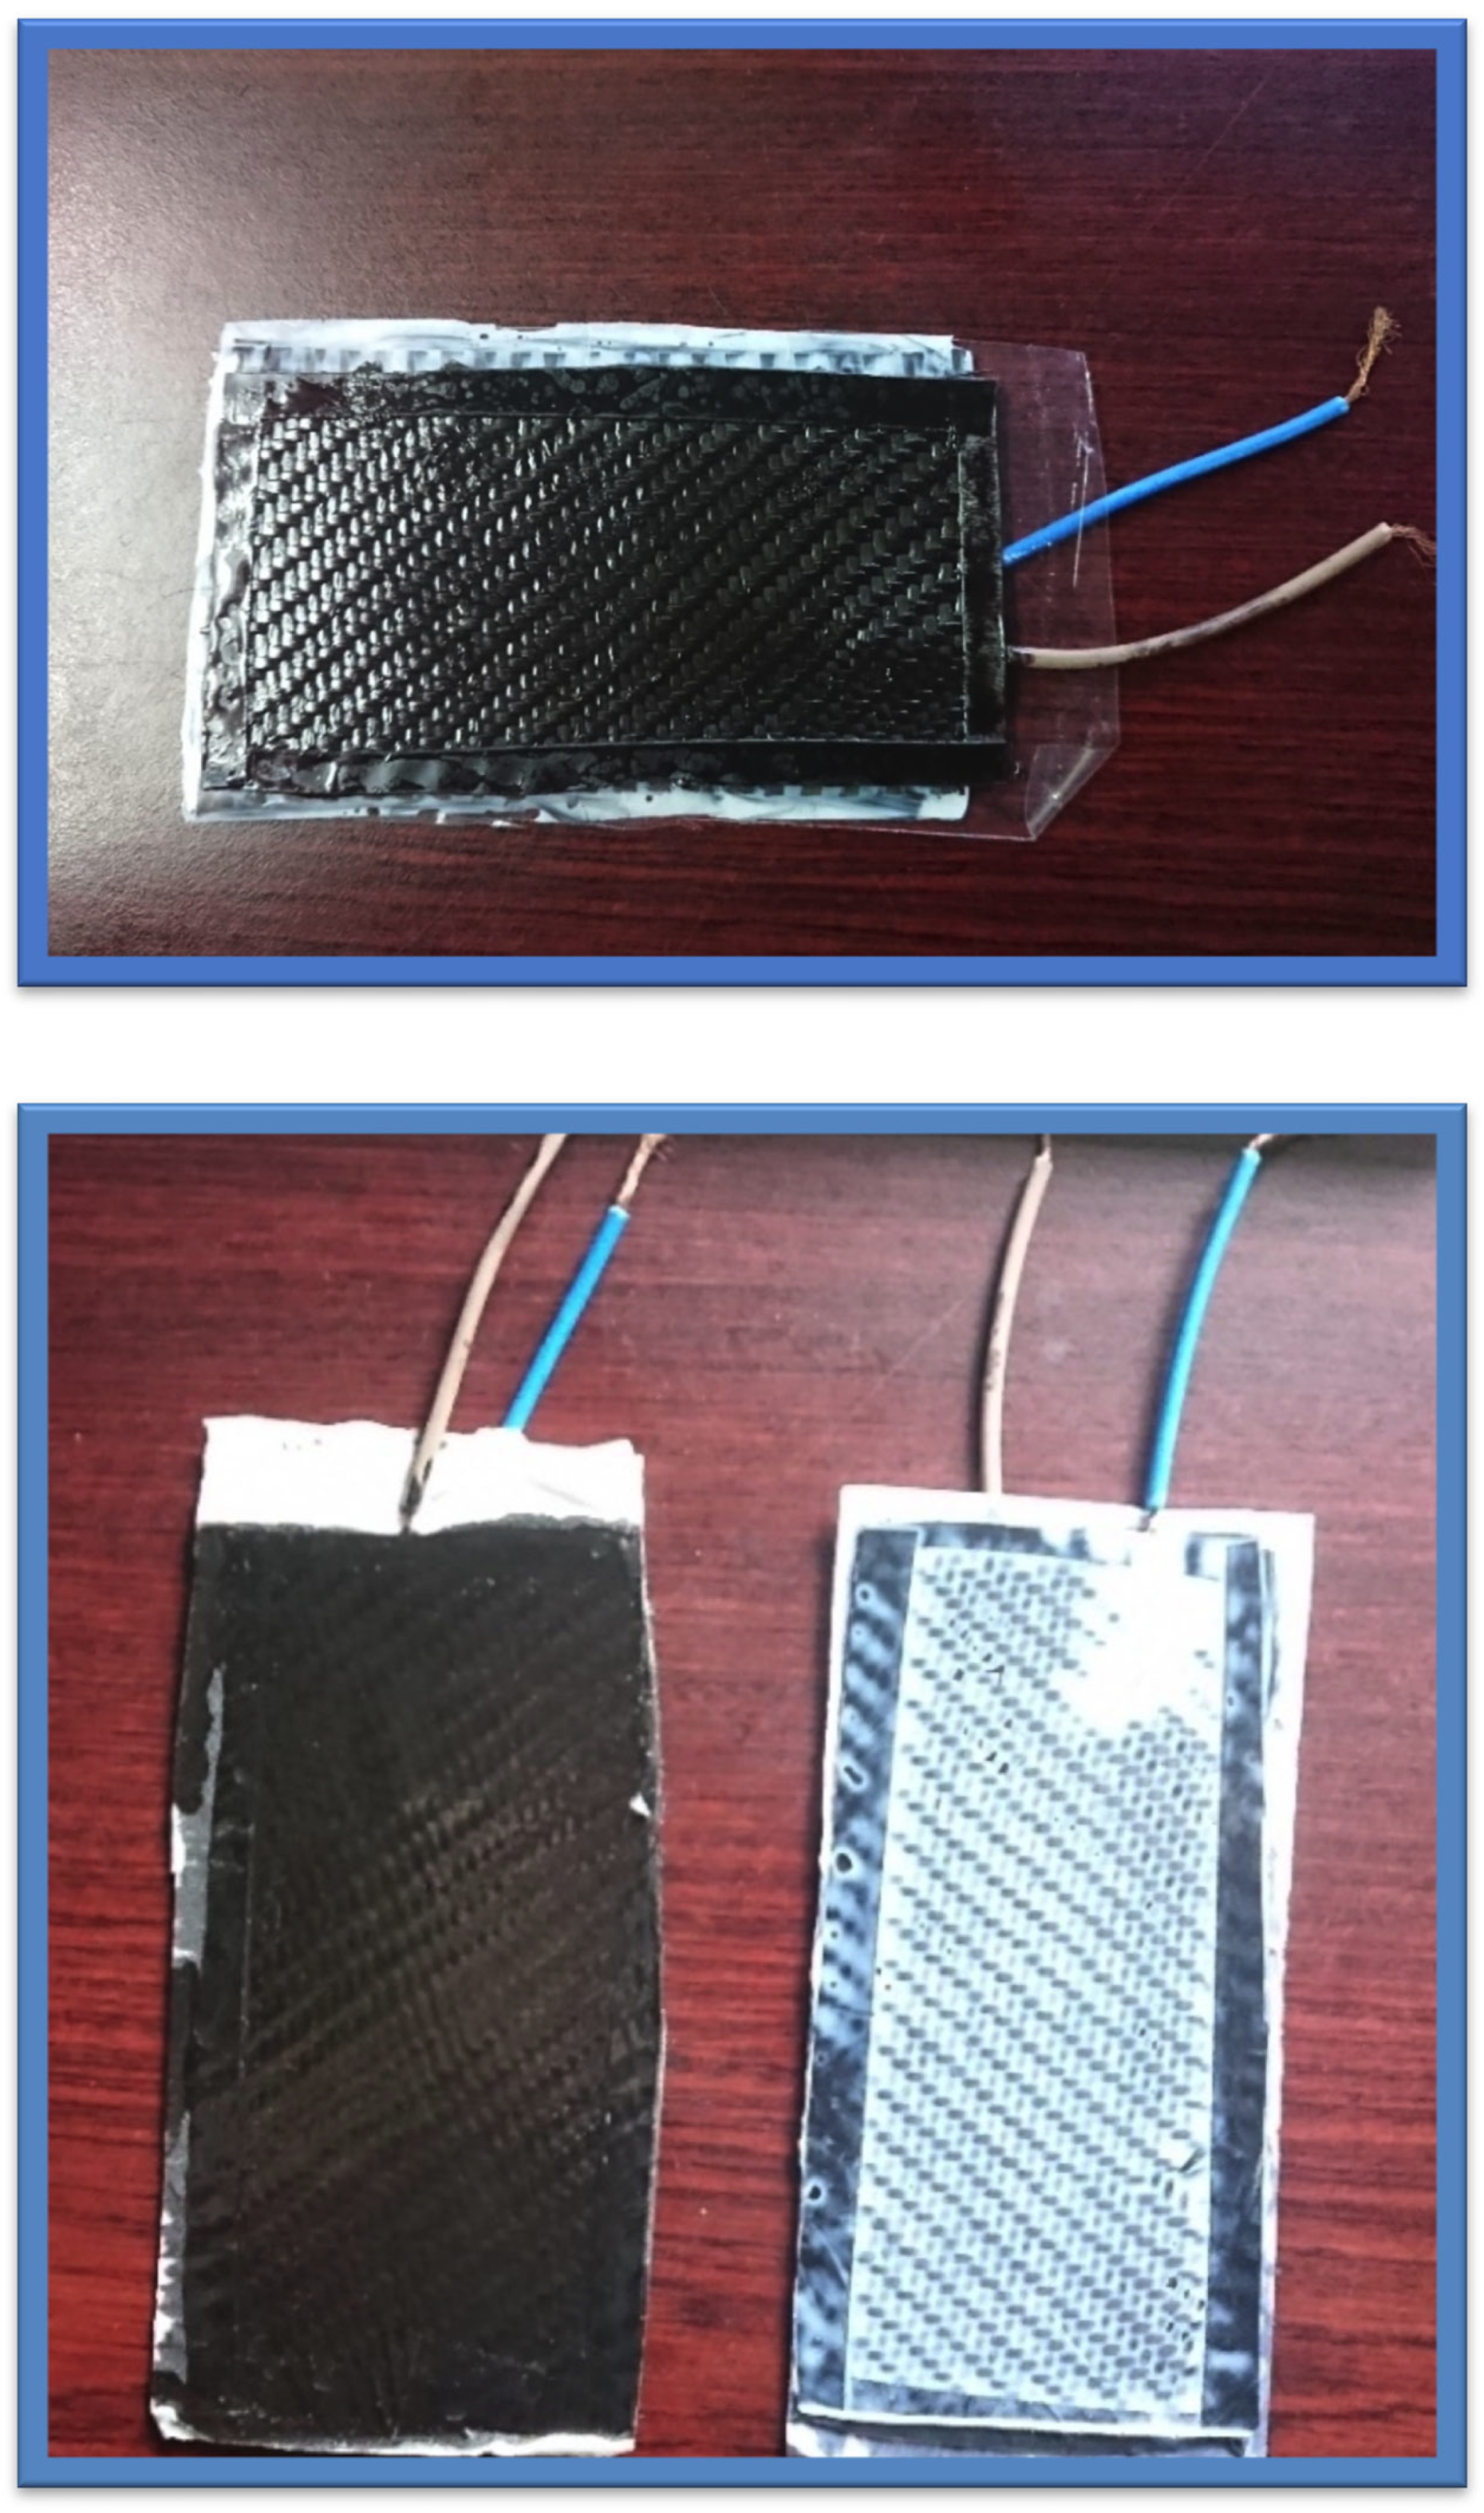
2.1.1. Development Process of the OSSC
2.1.2. PV Cells
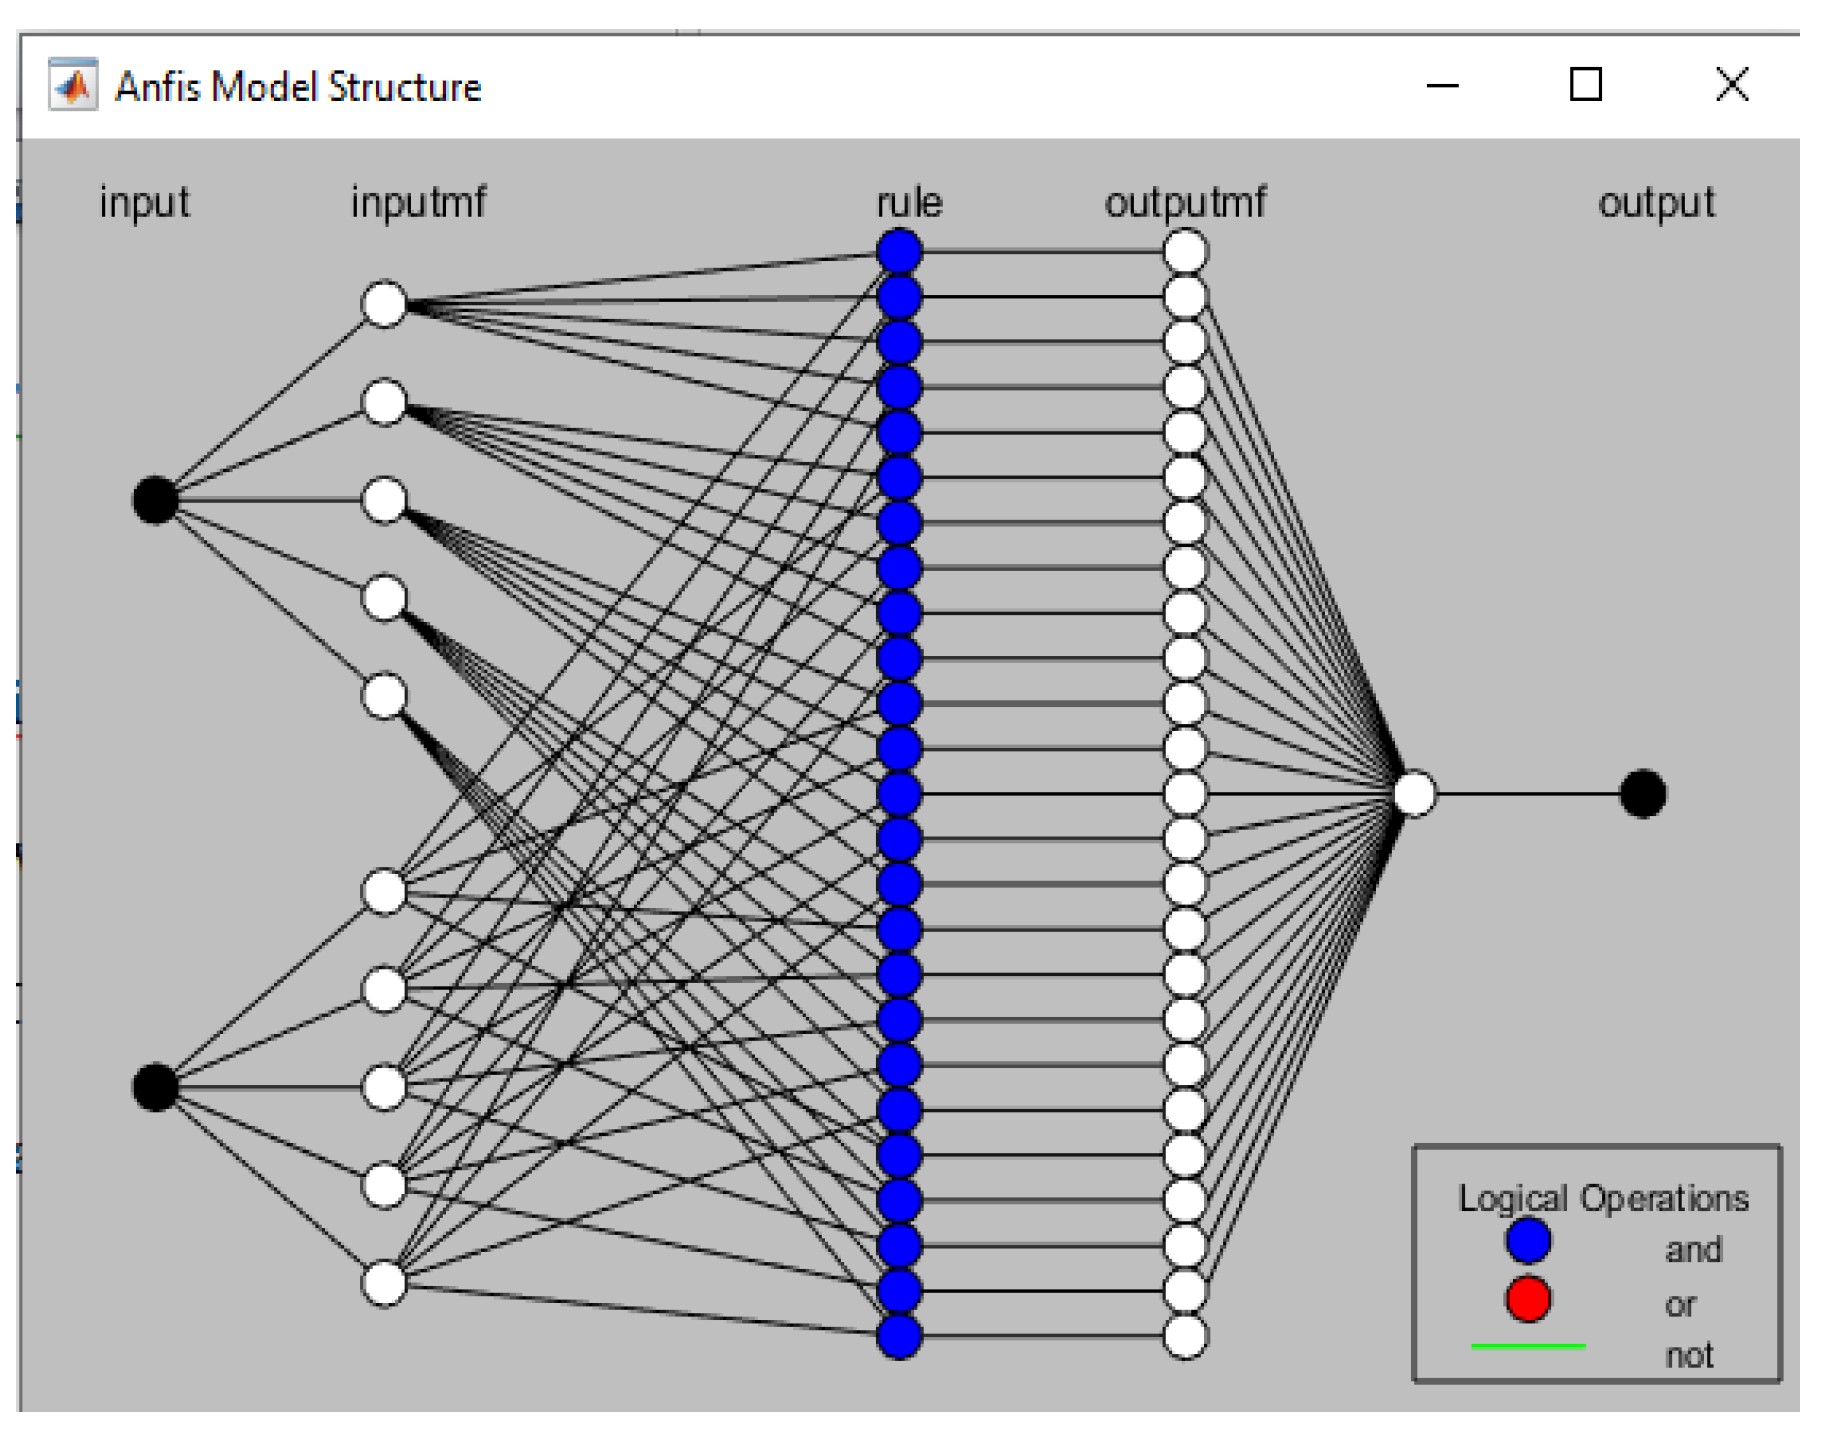
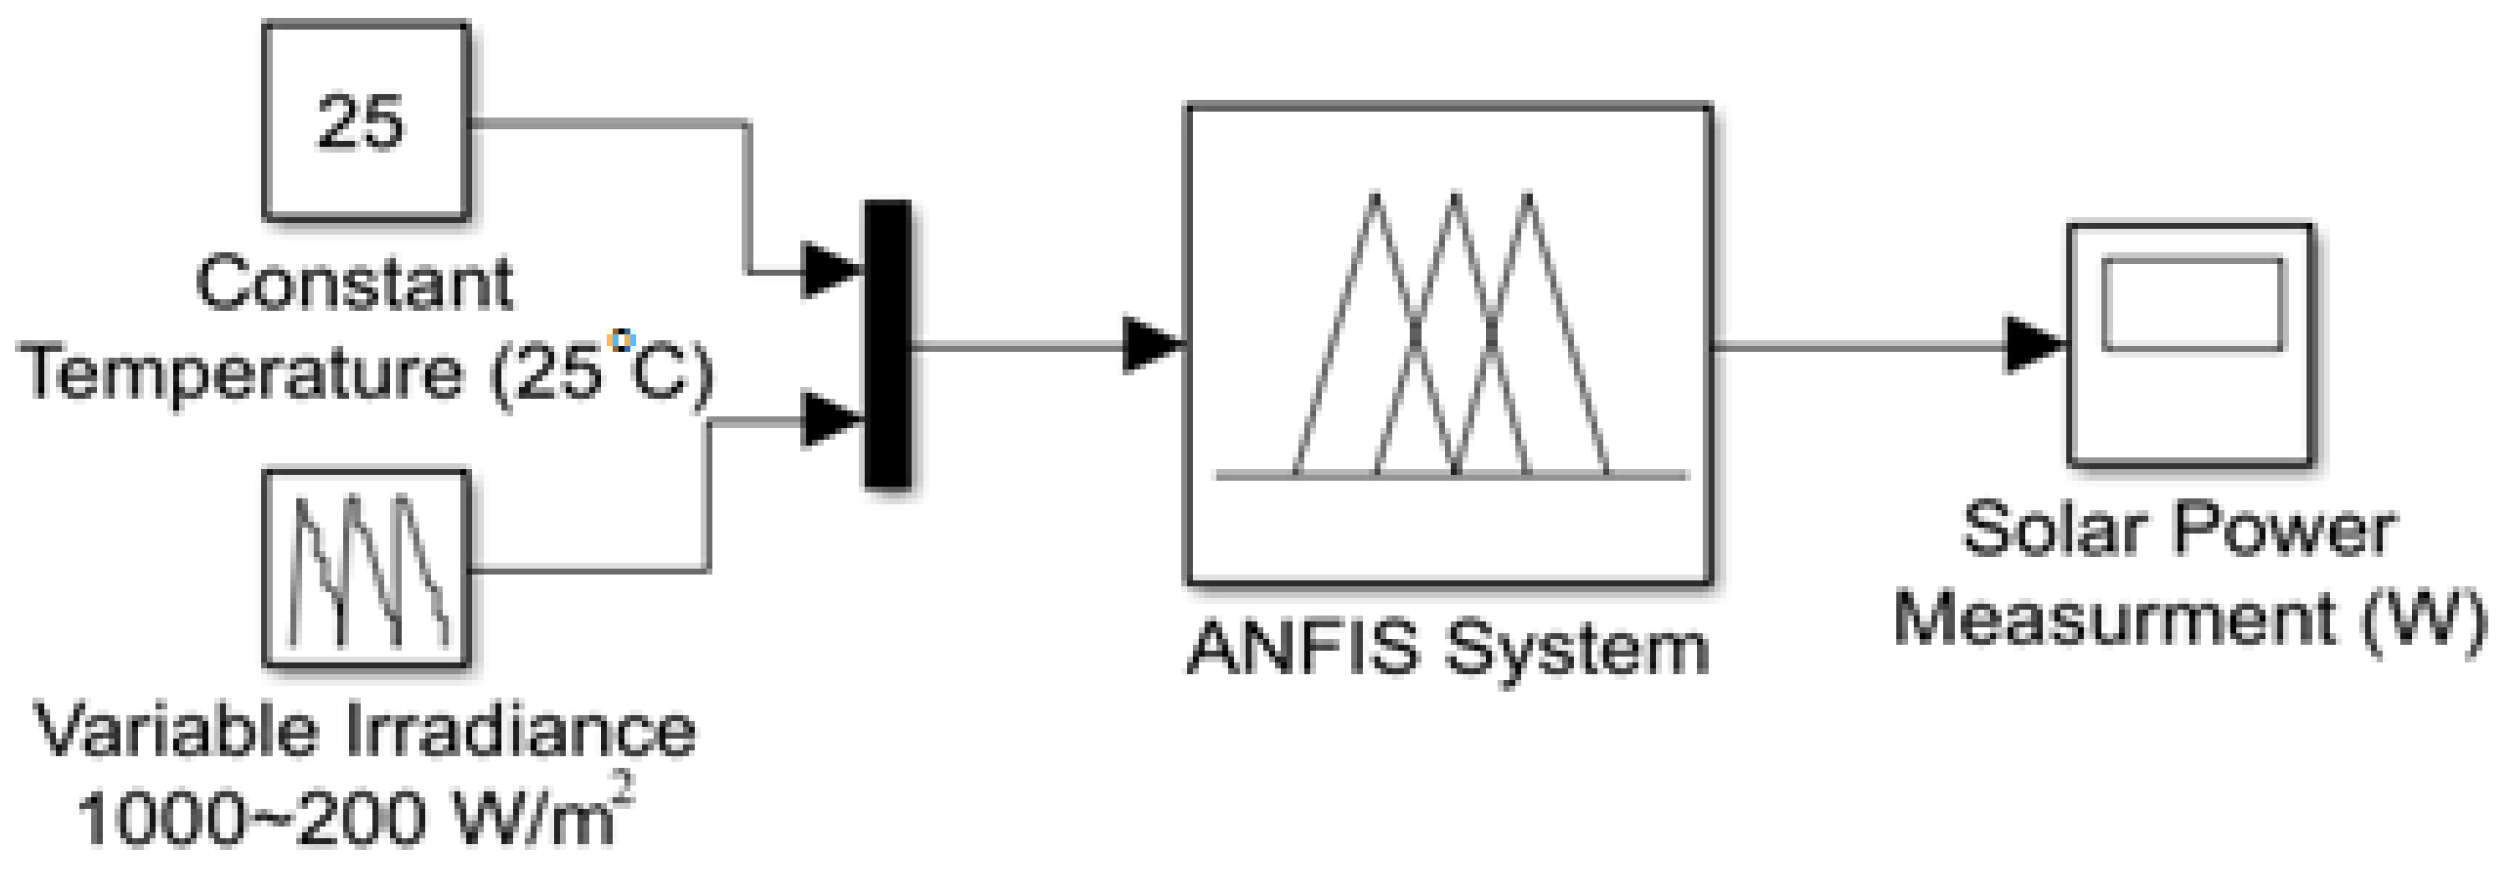
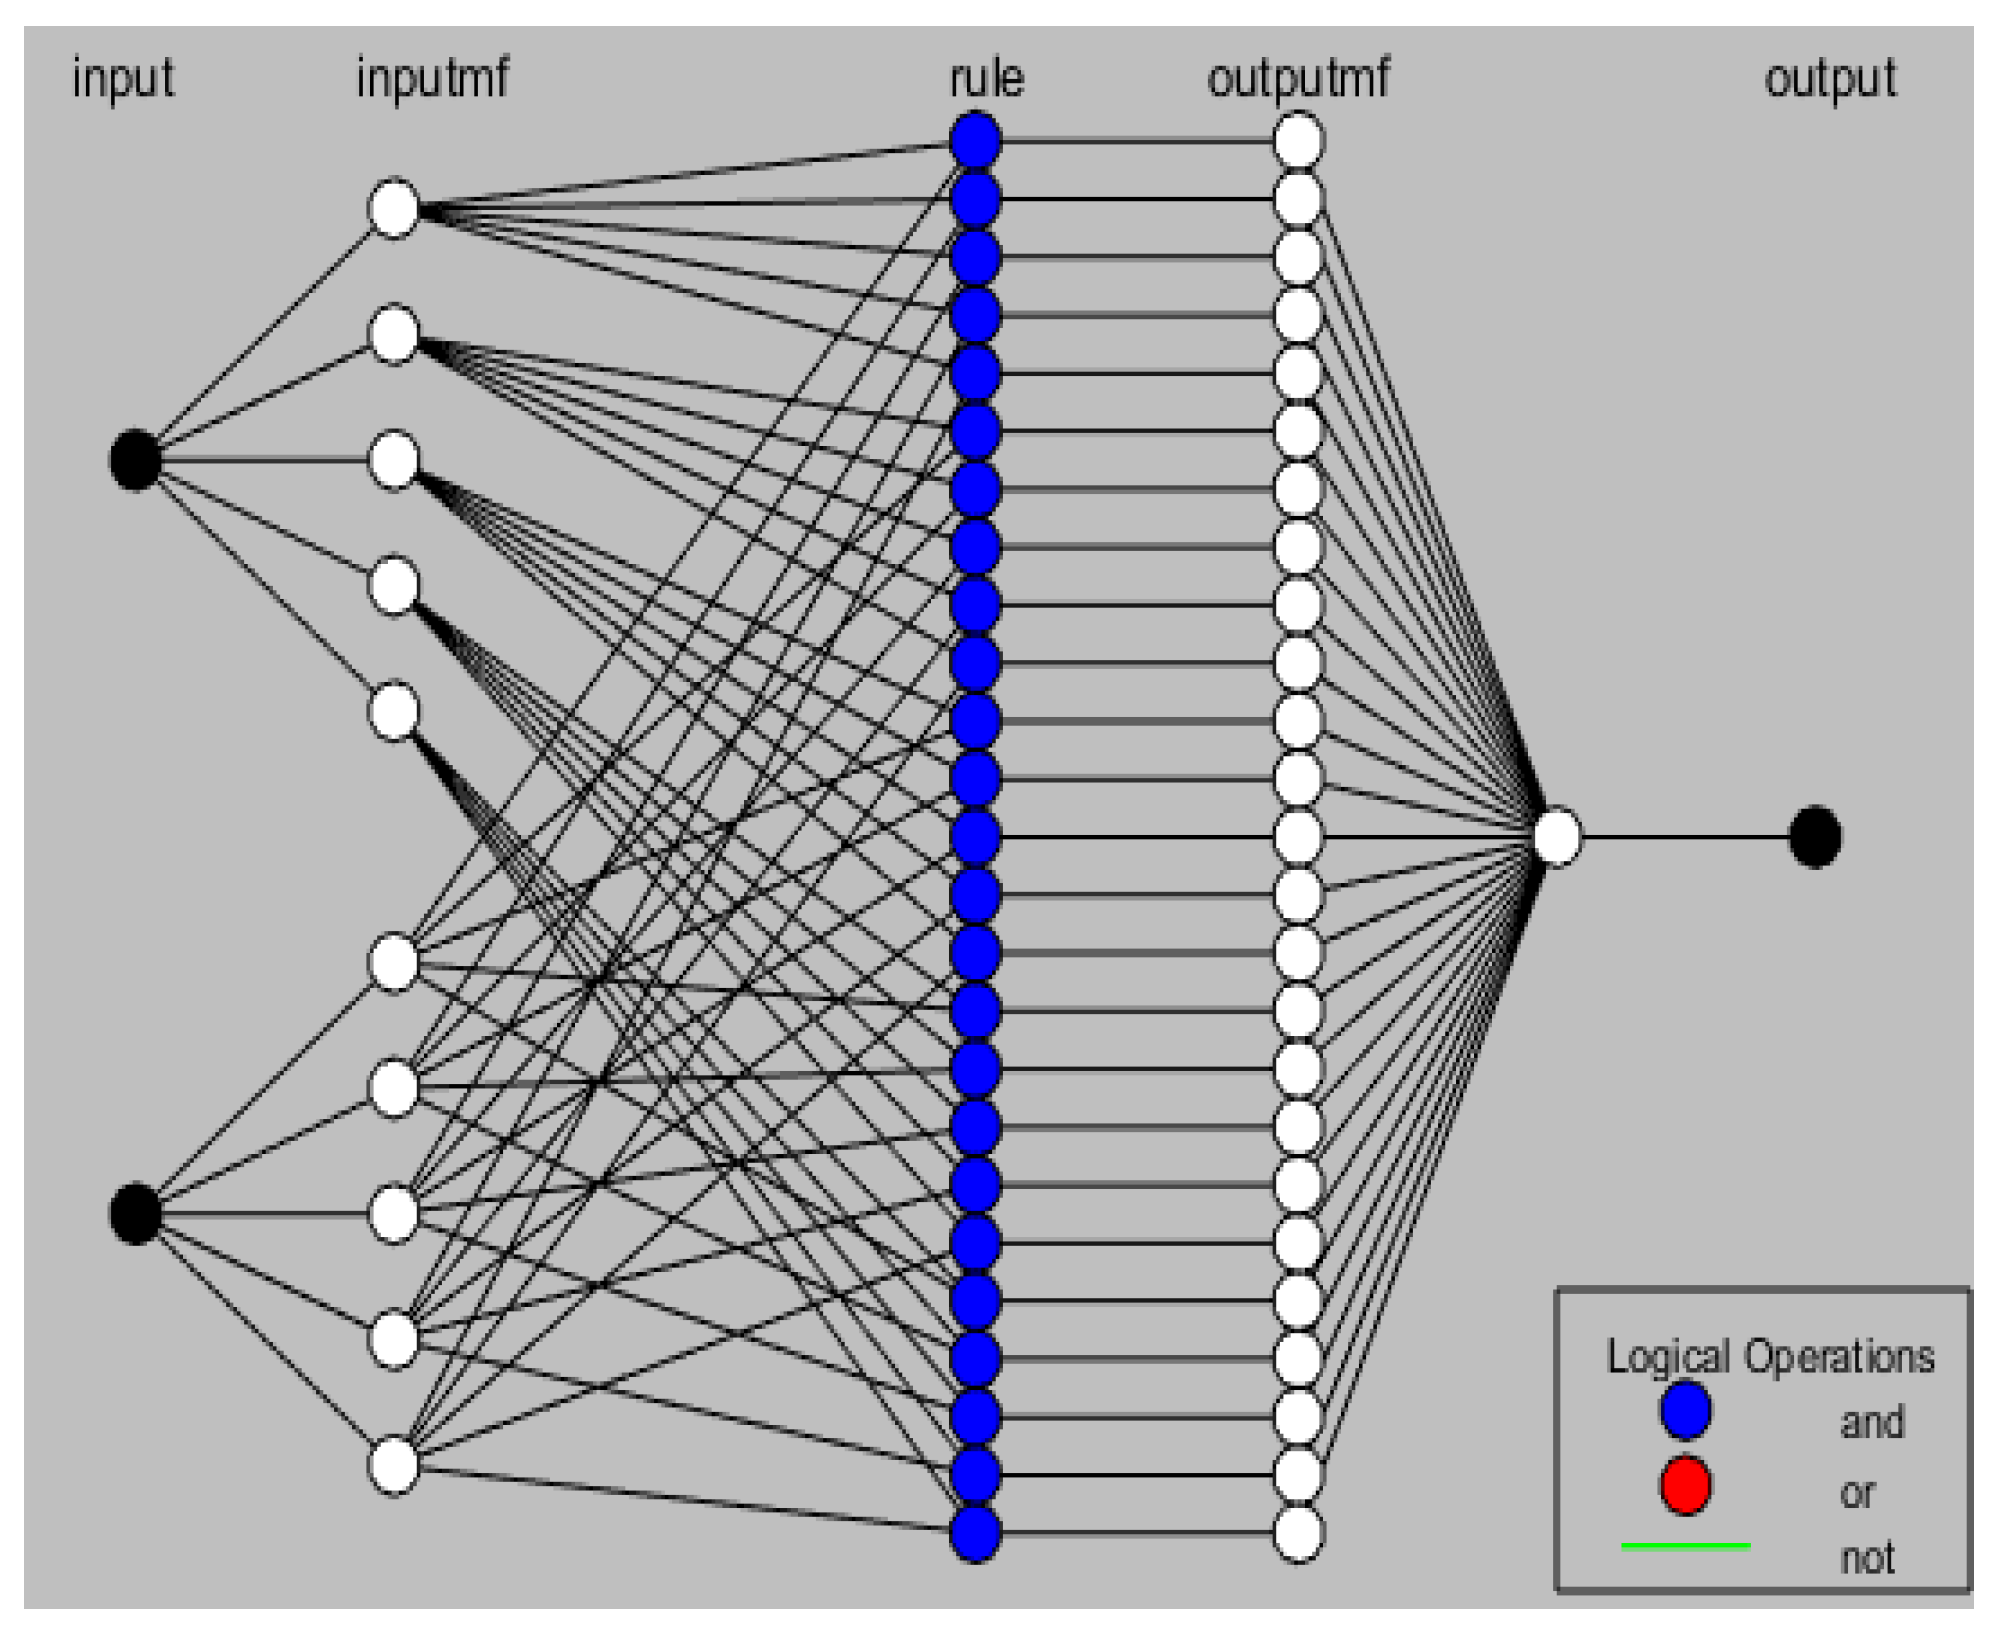
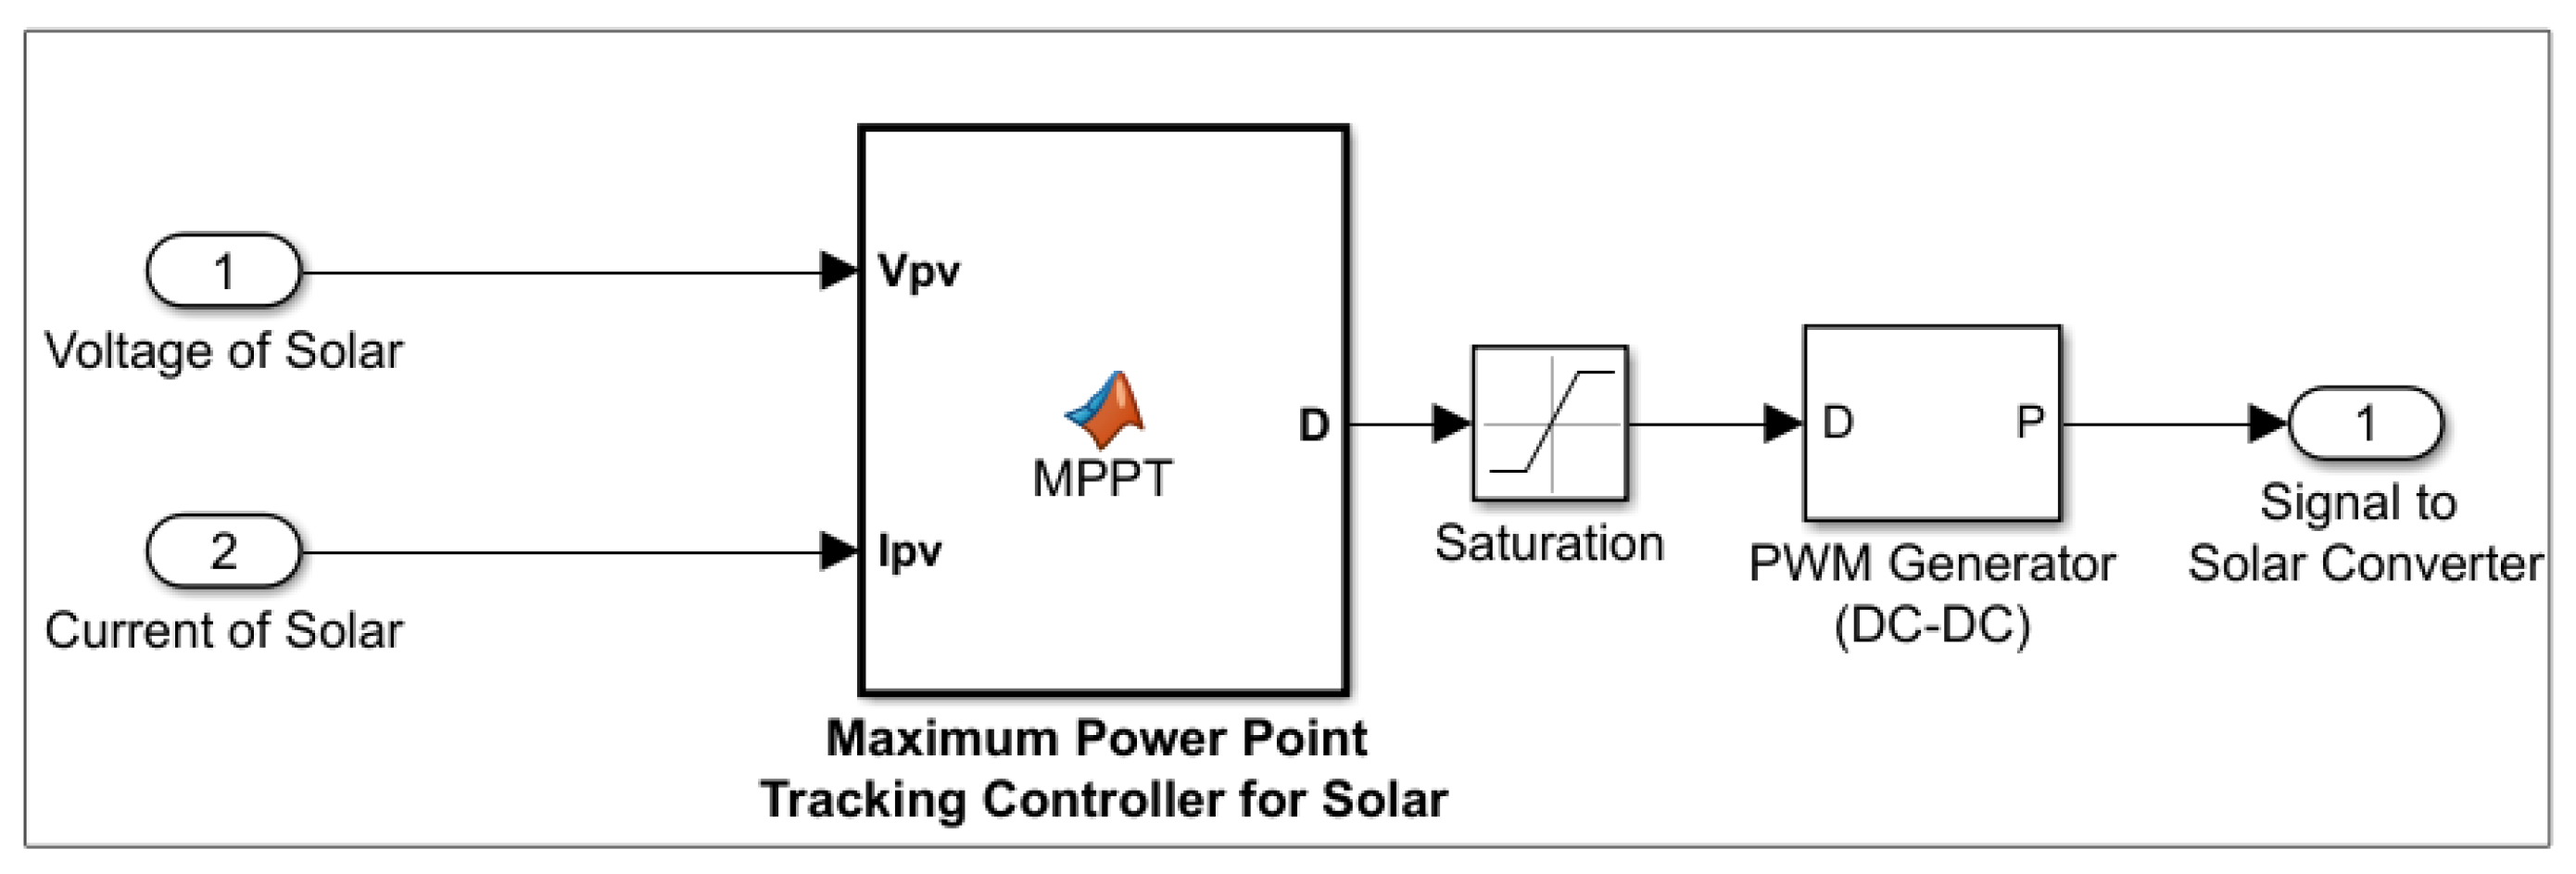
2.2. ANFIS PV OSSC
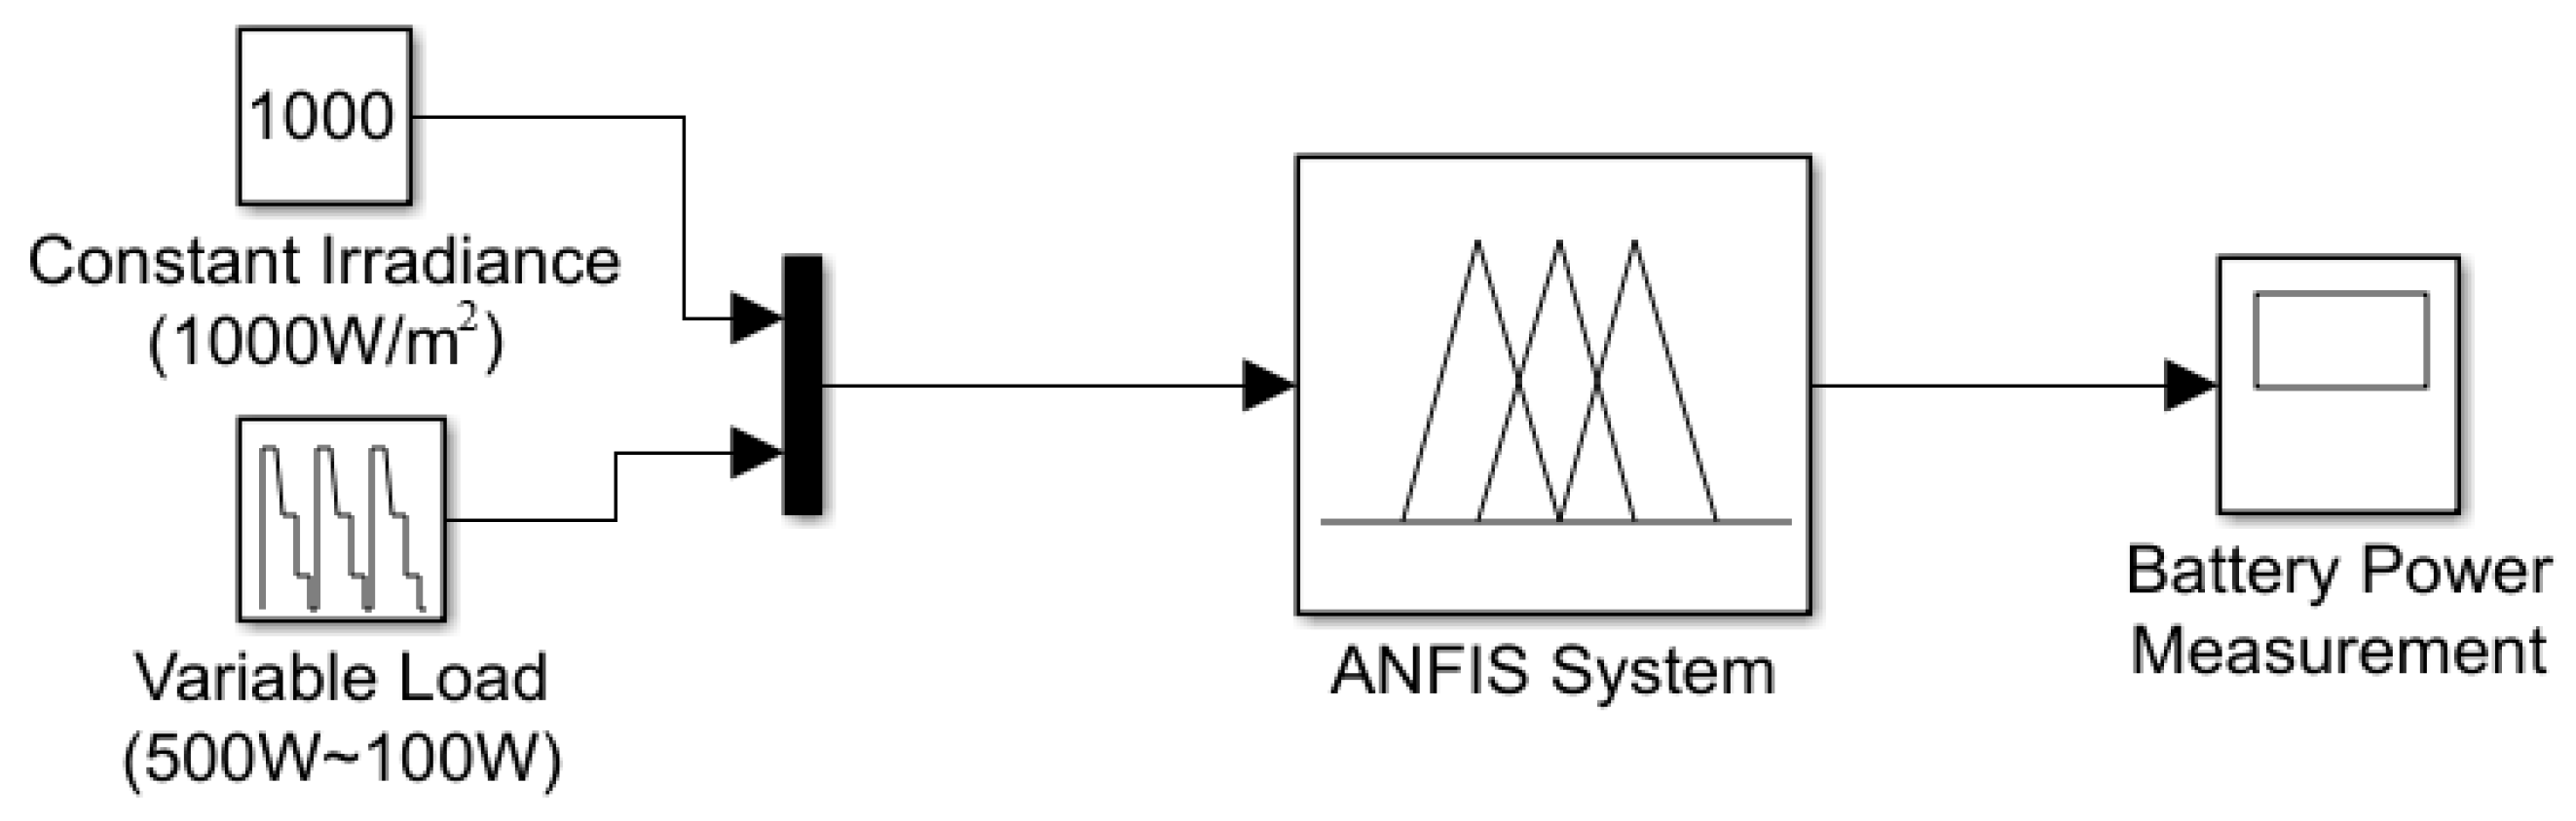
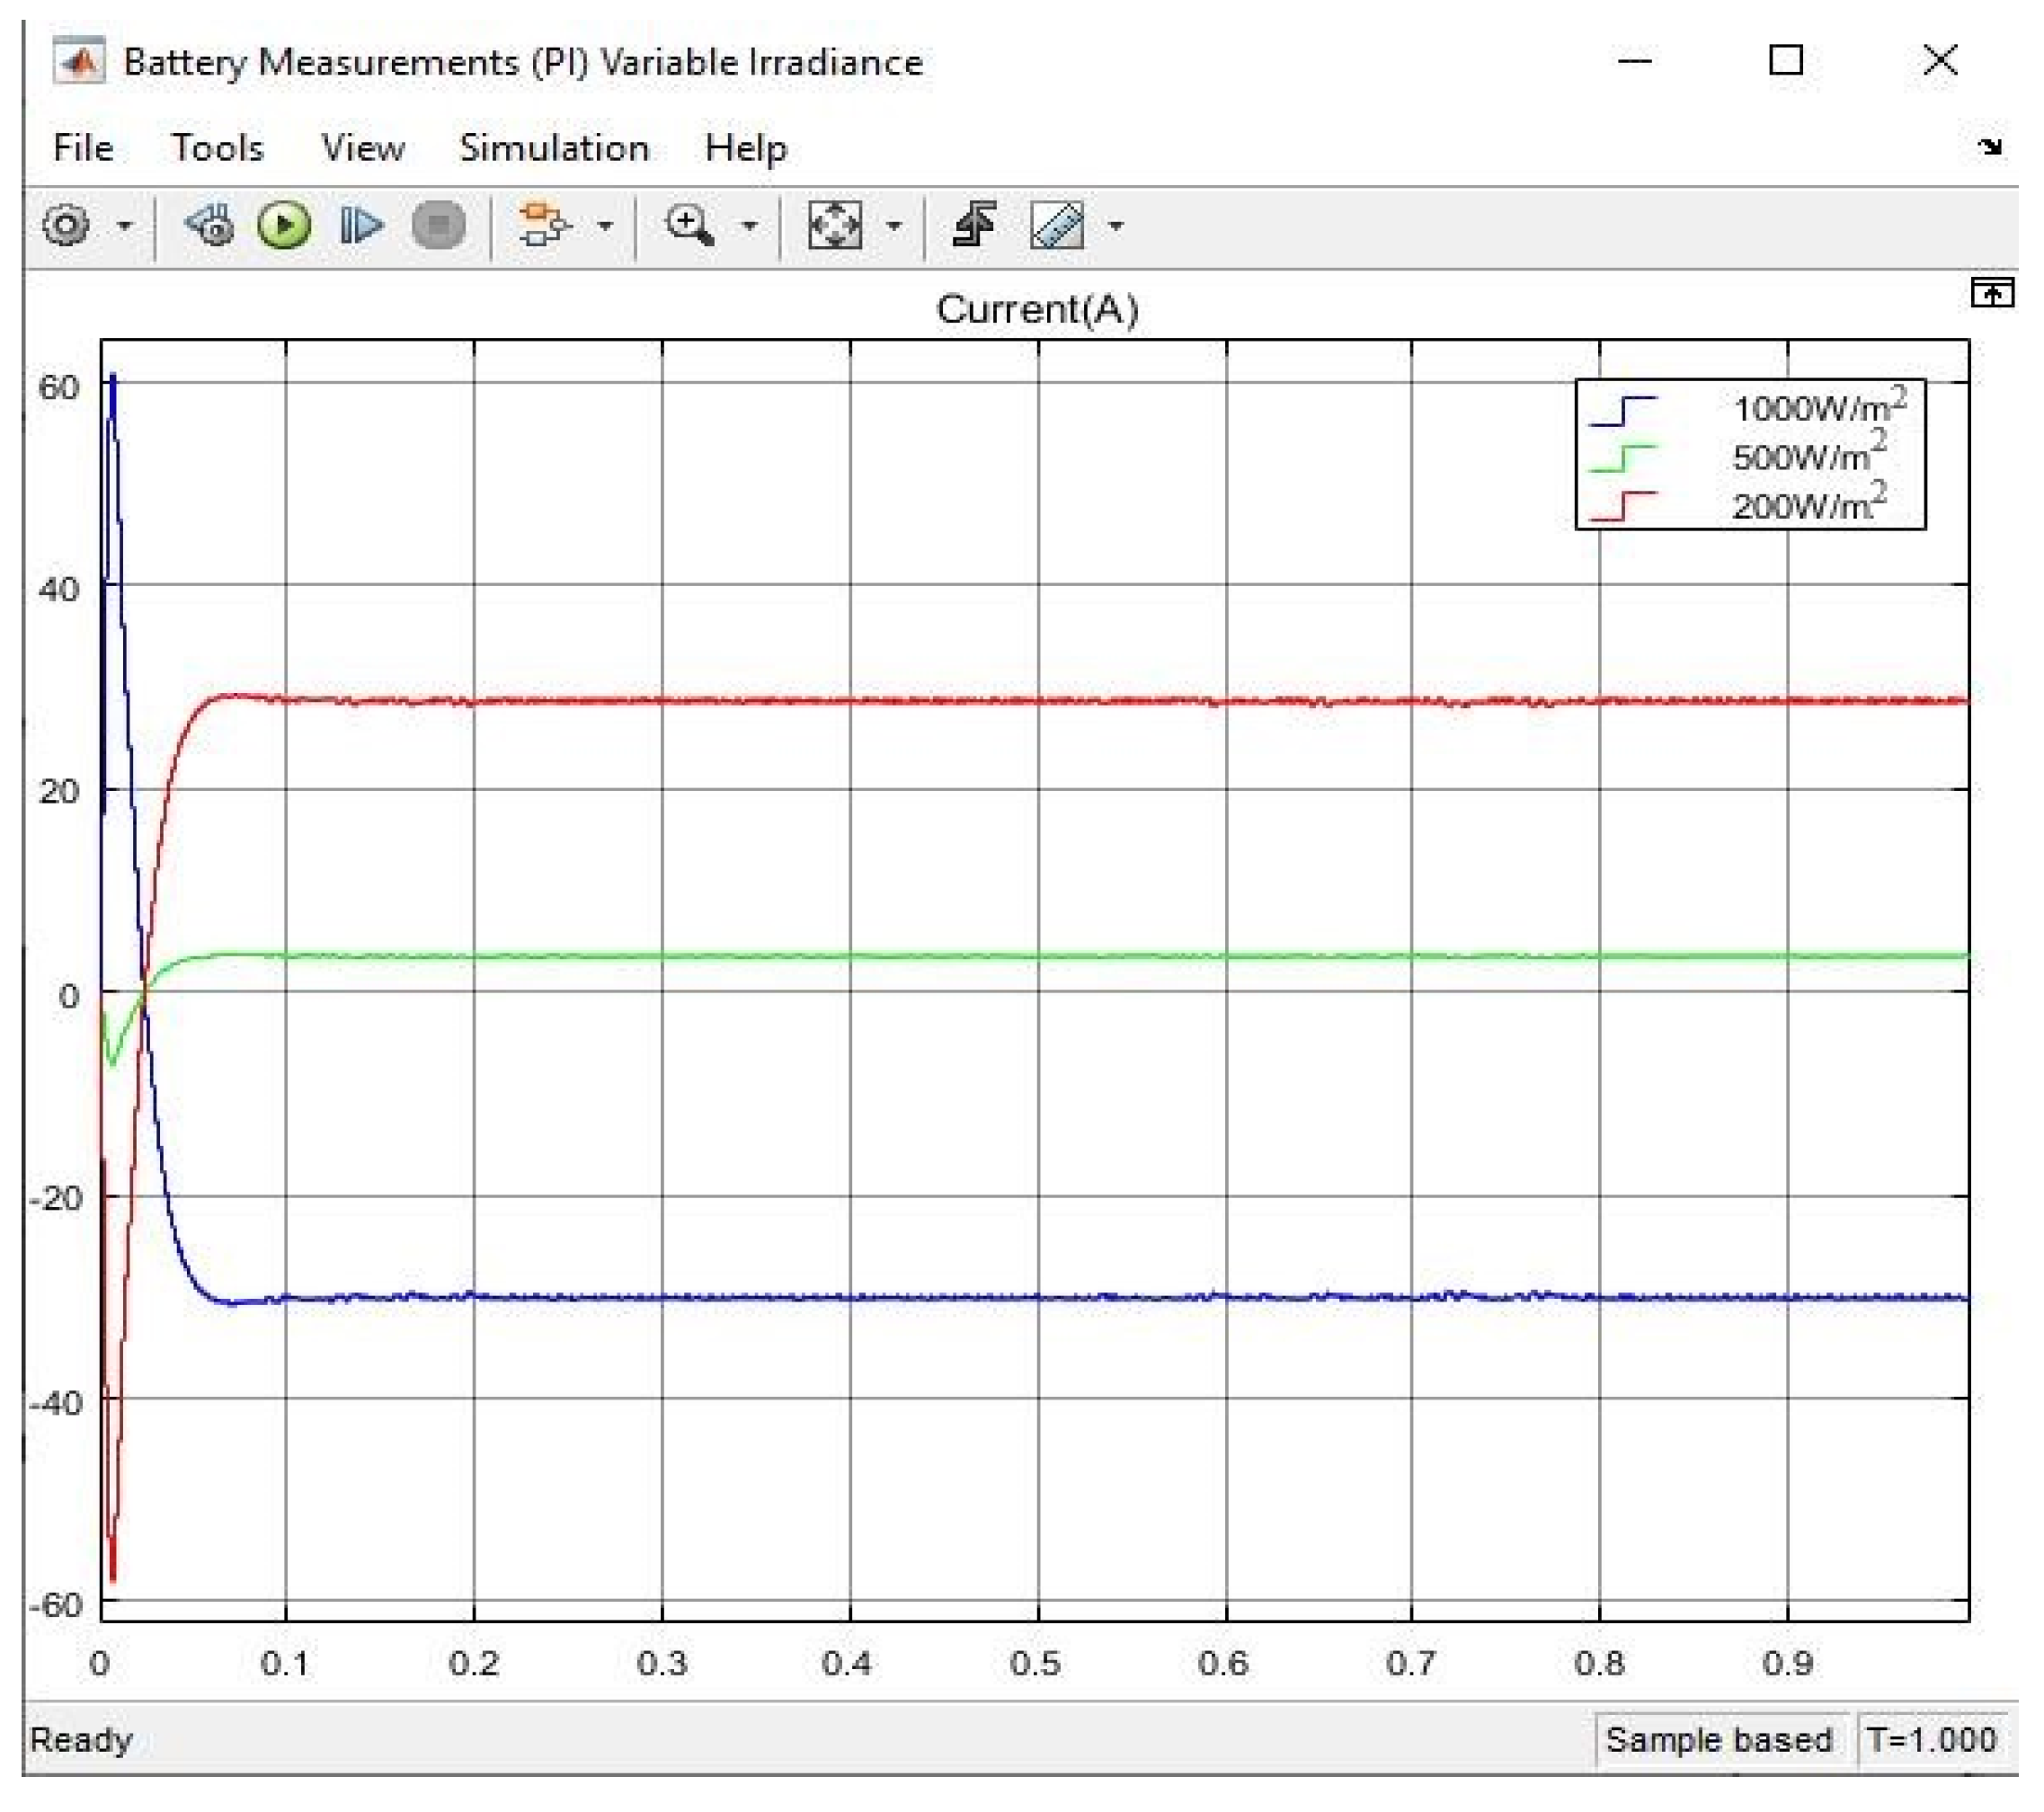
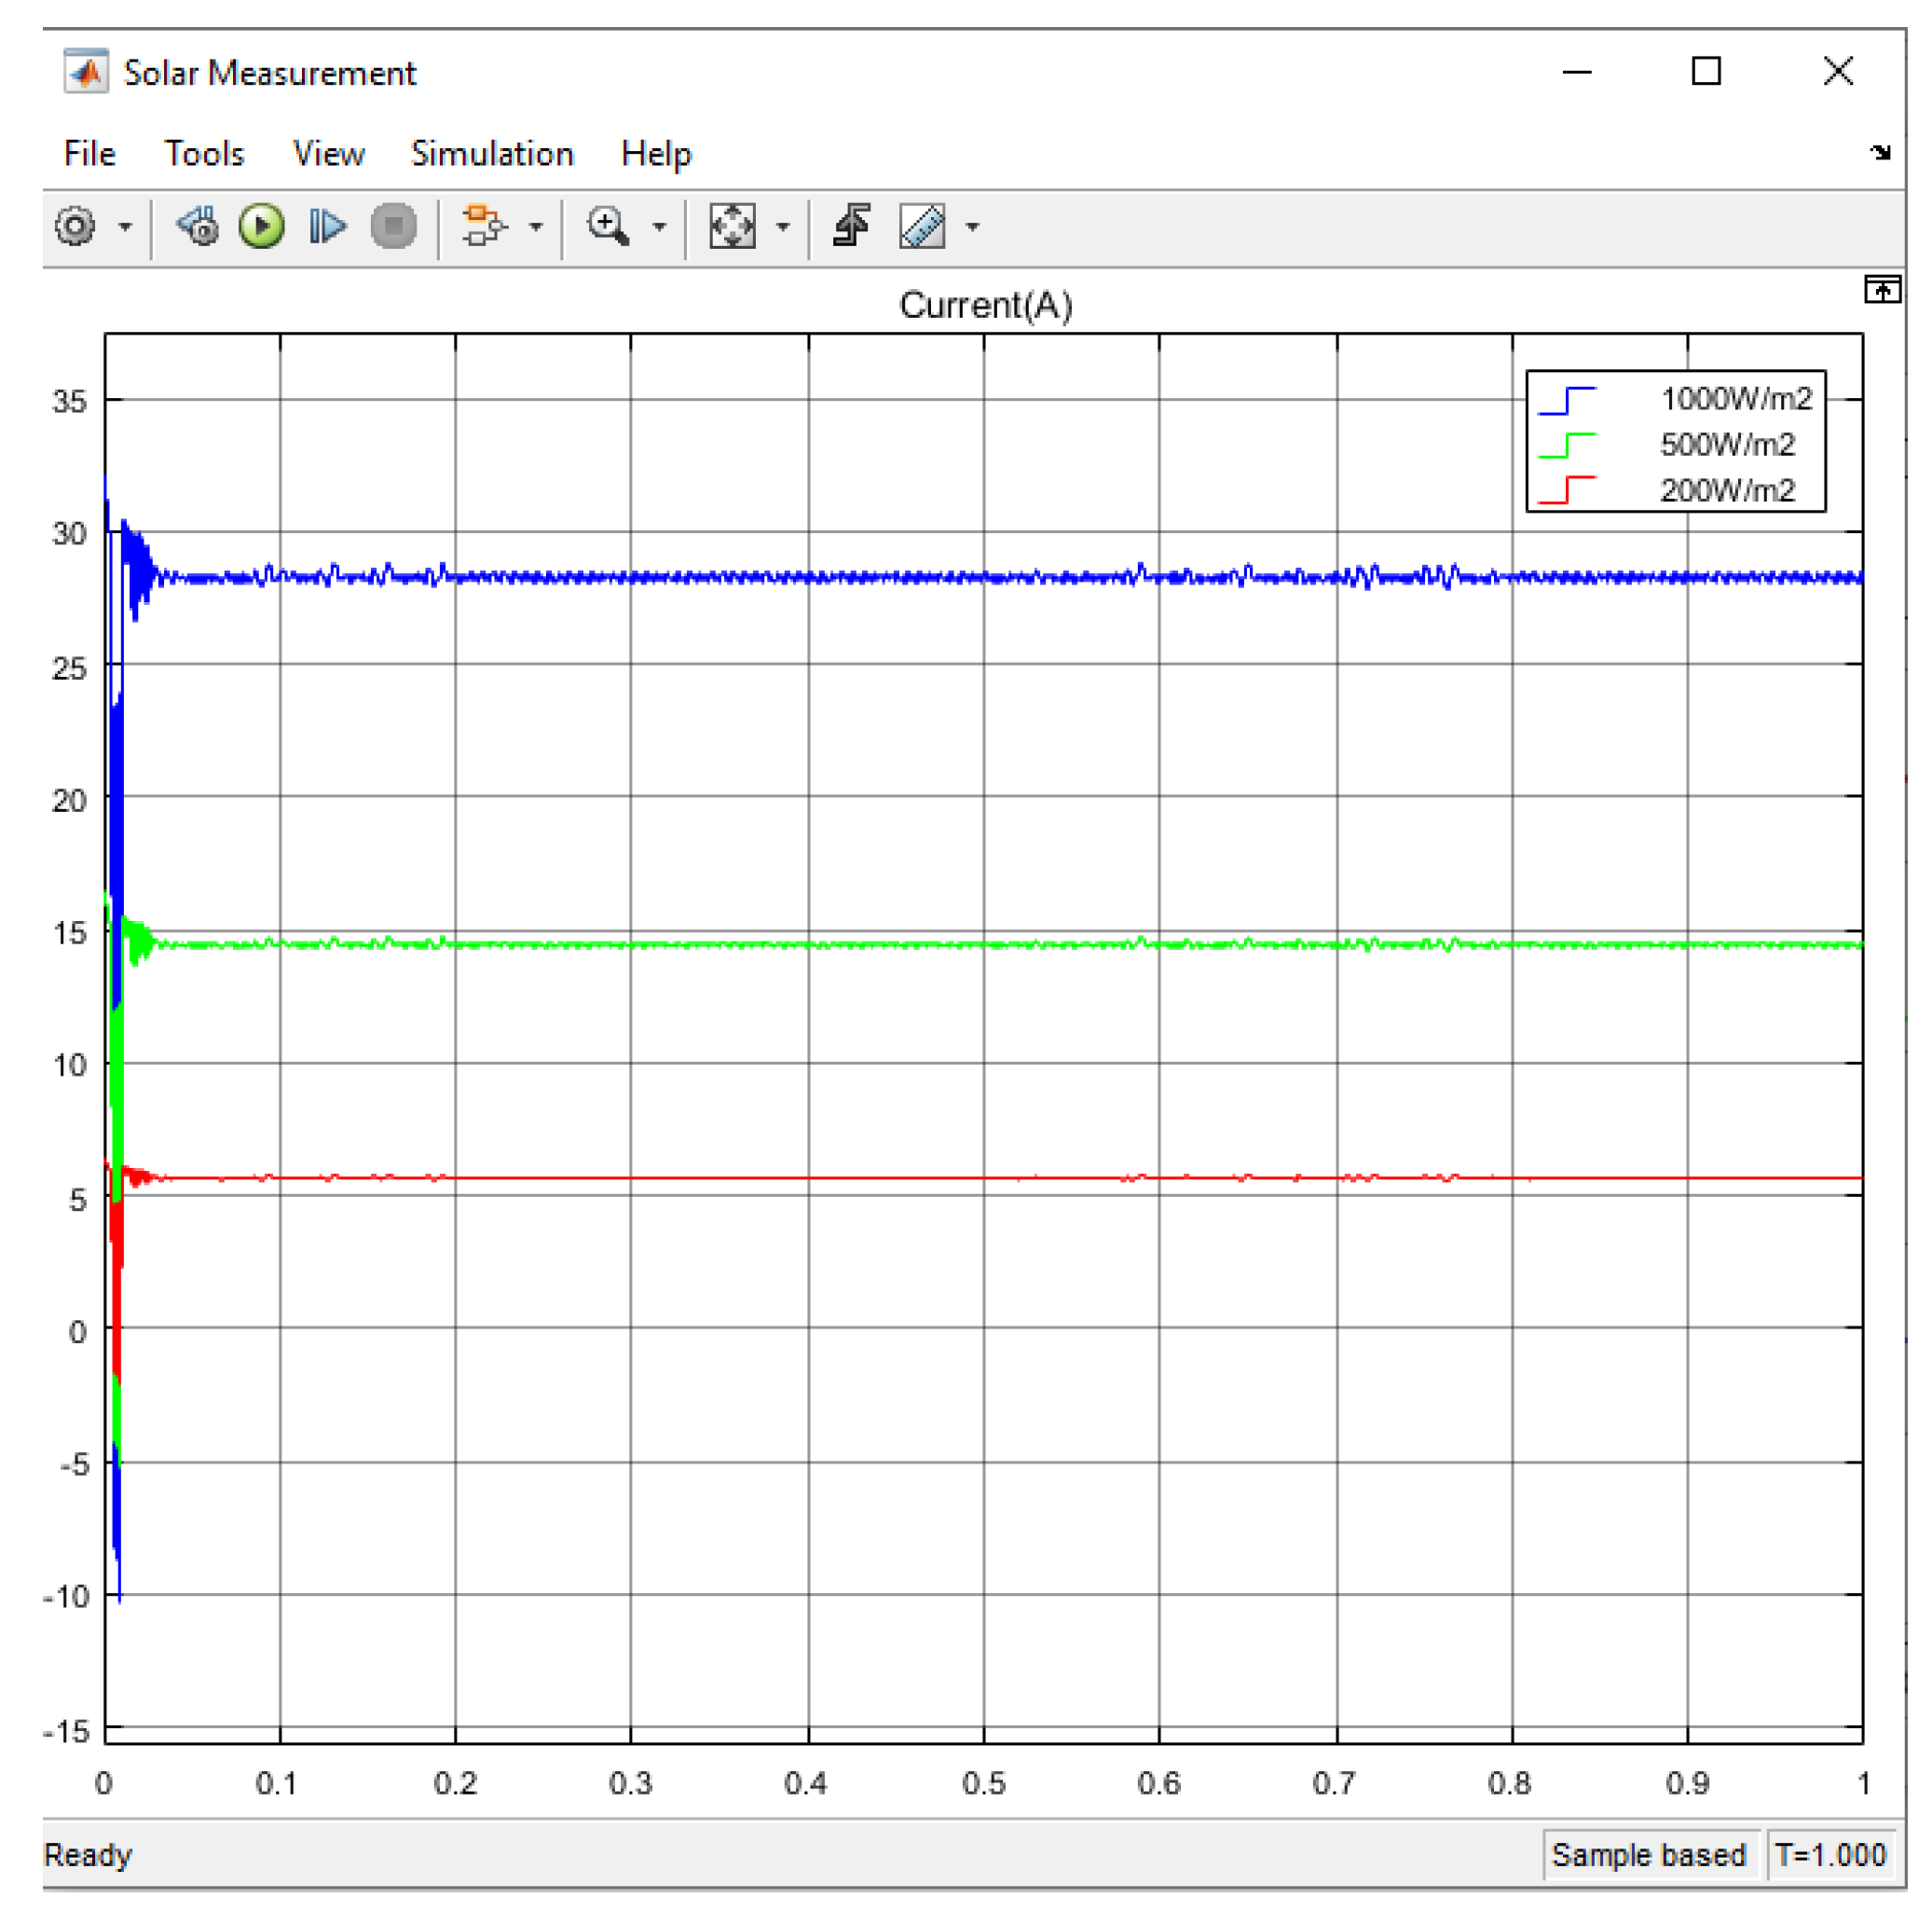
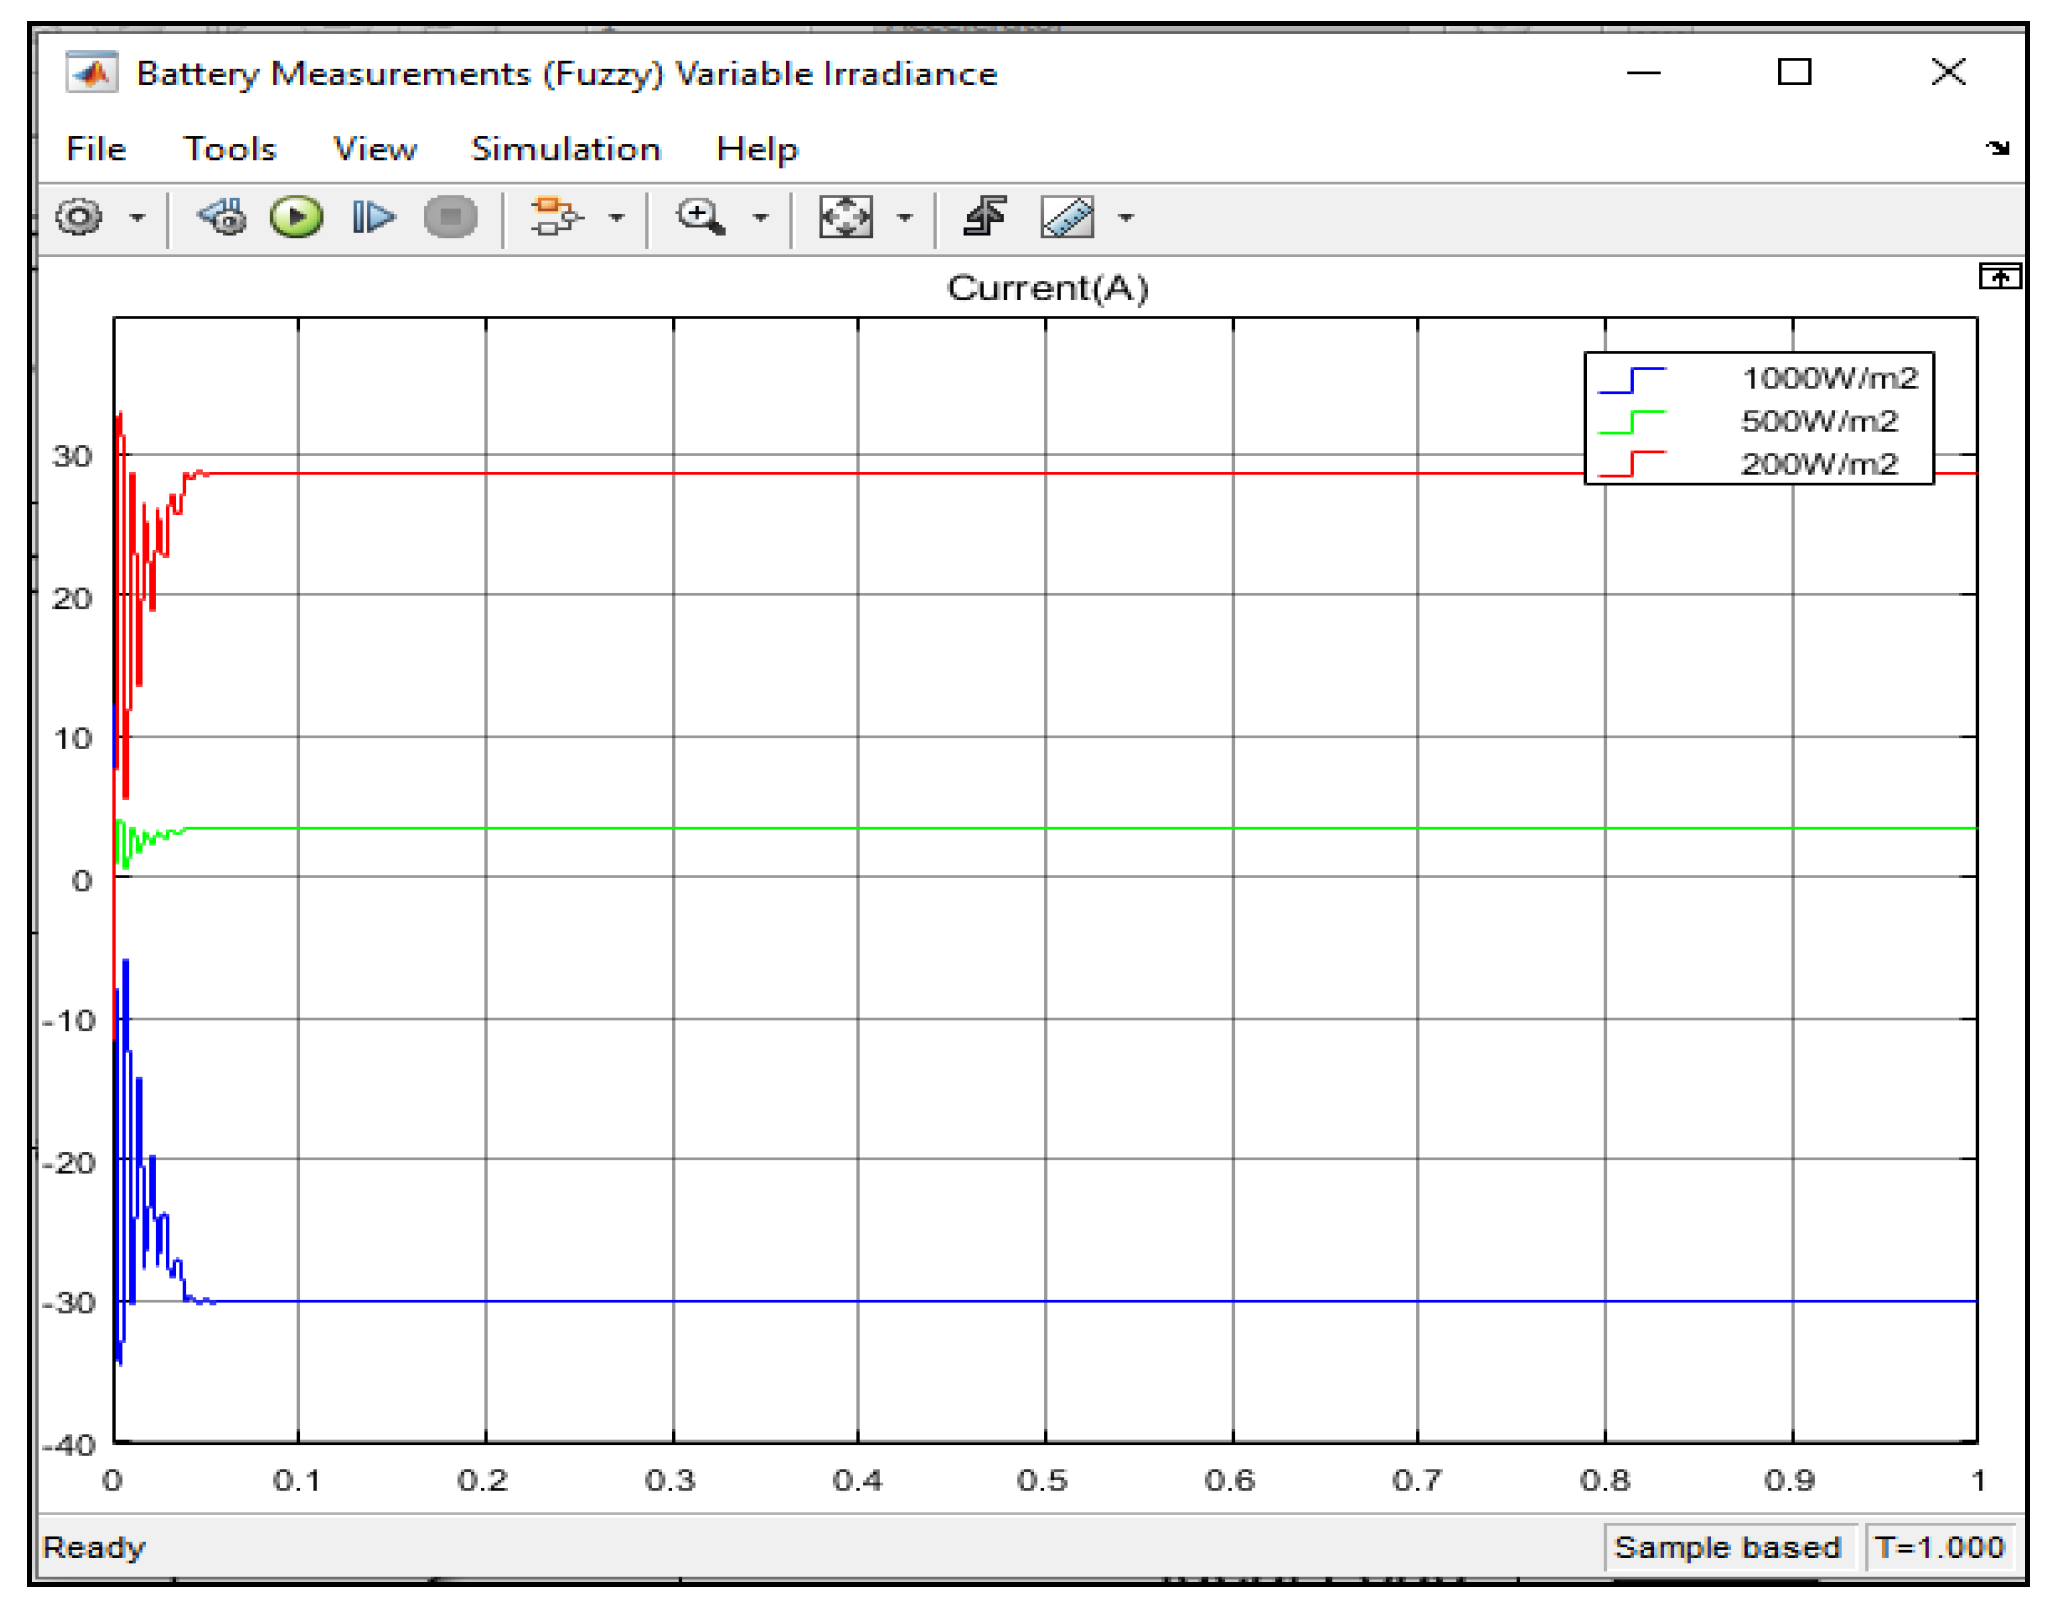
2.3. Variable Load and Variable Irradiance
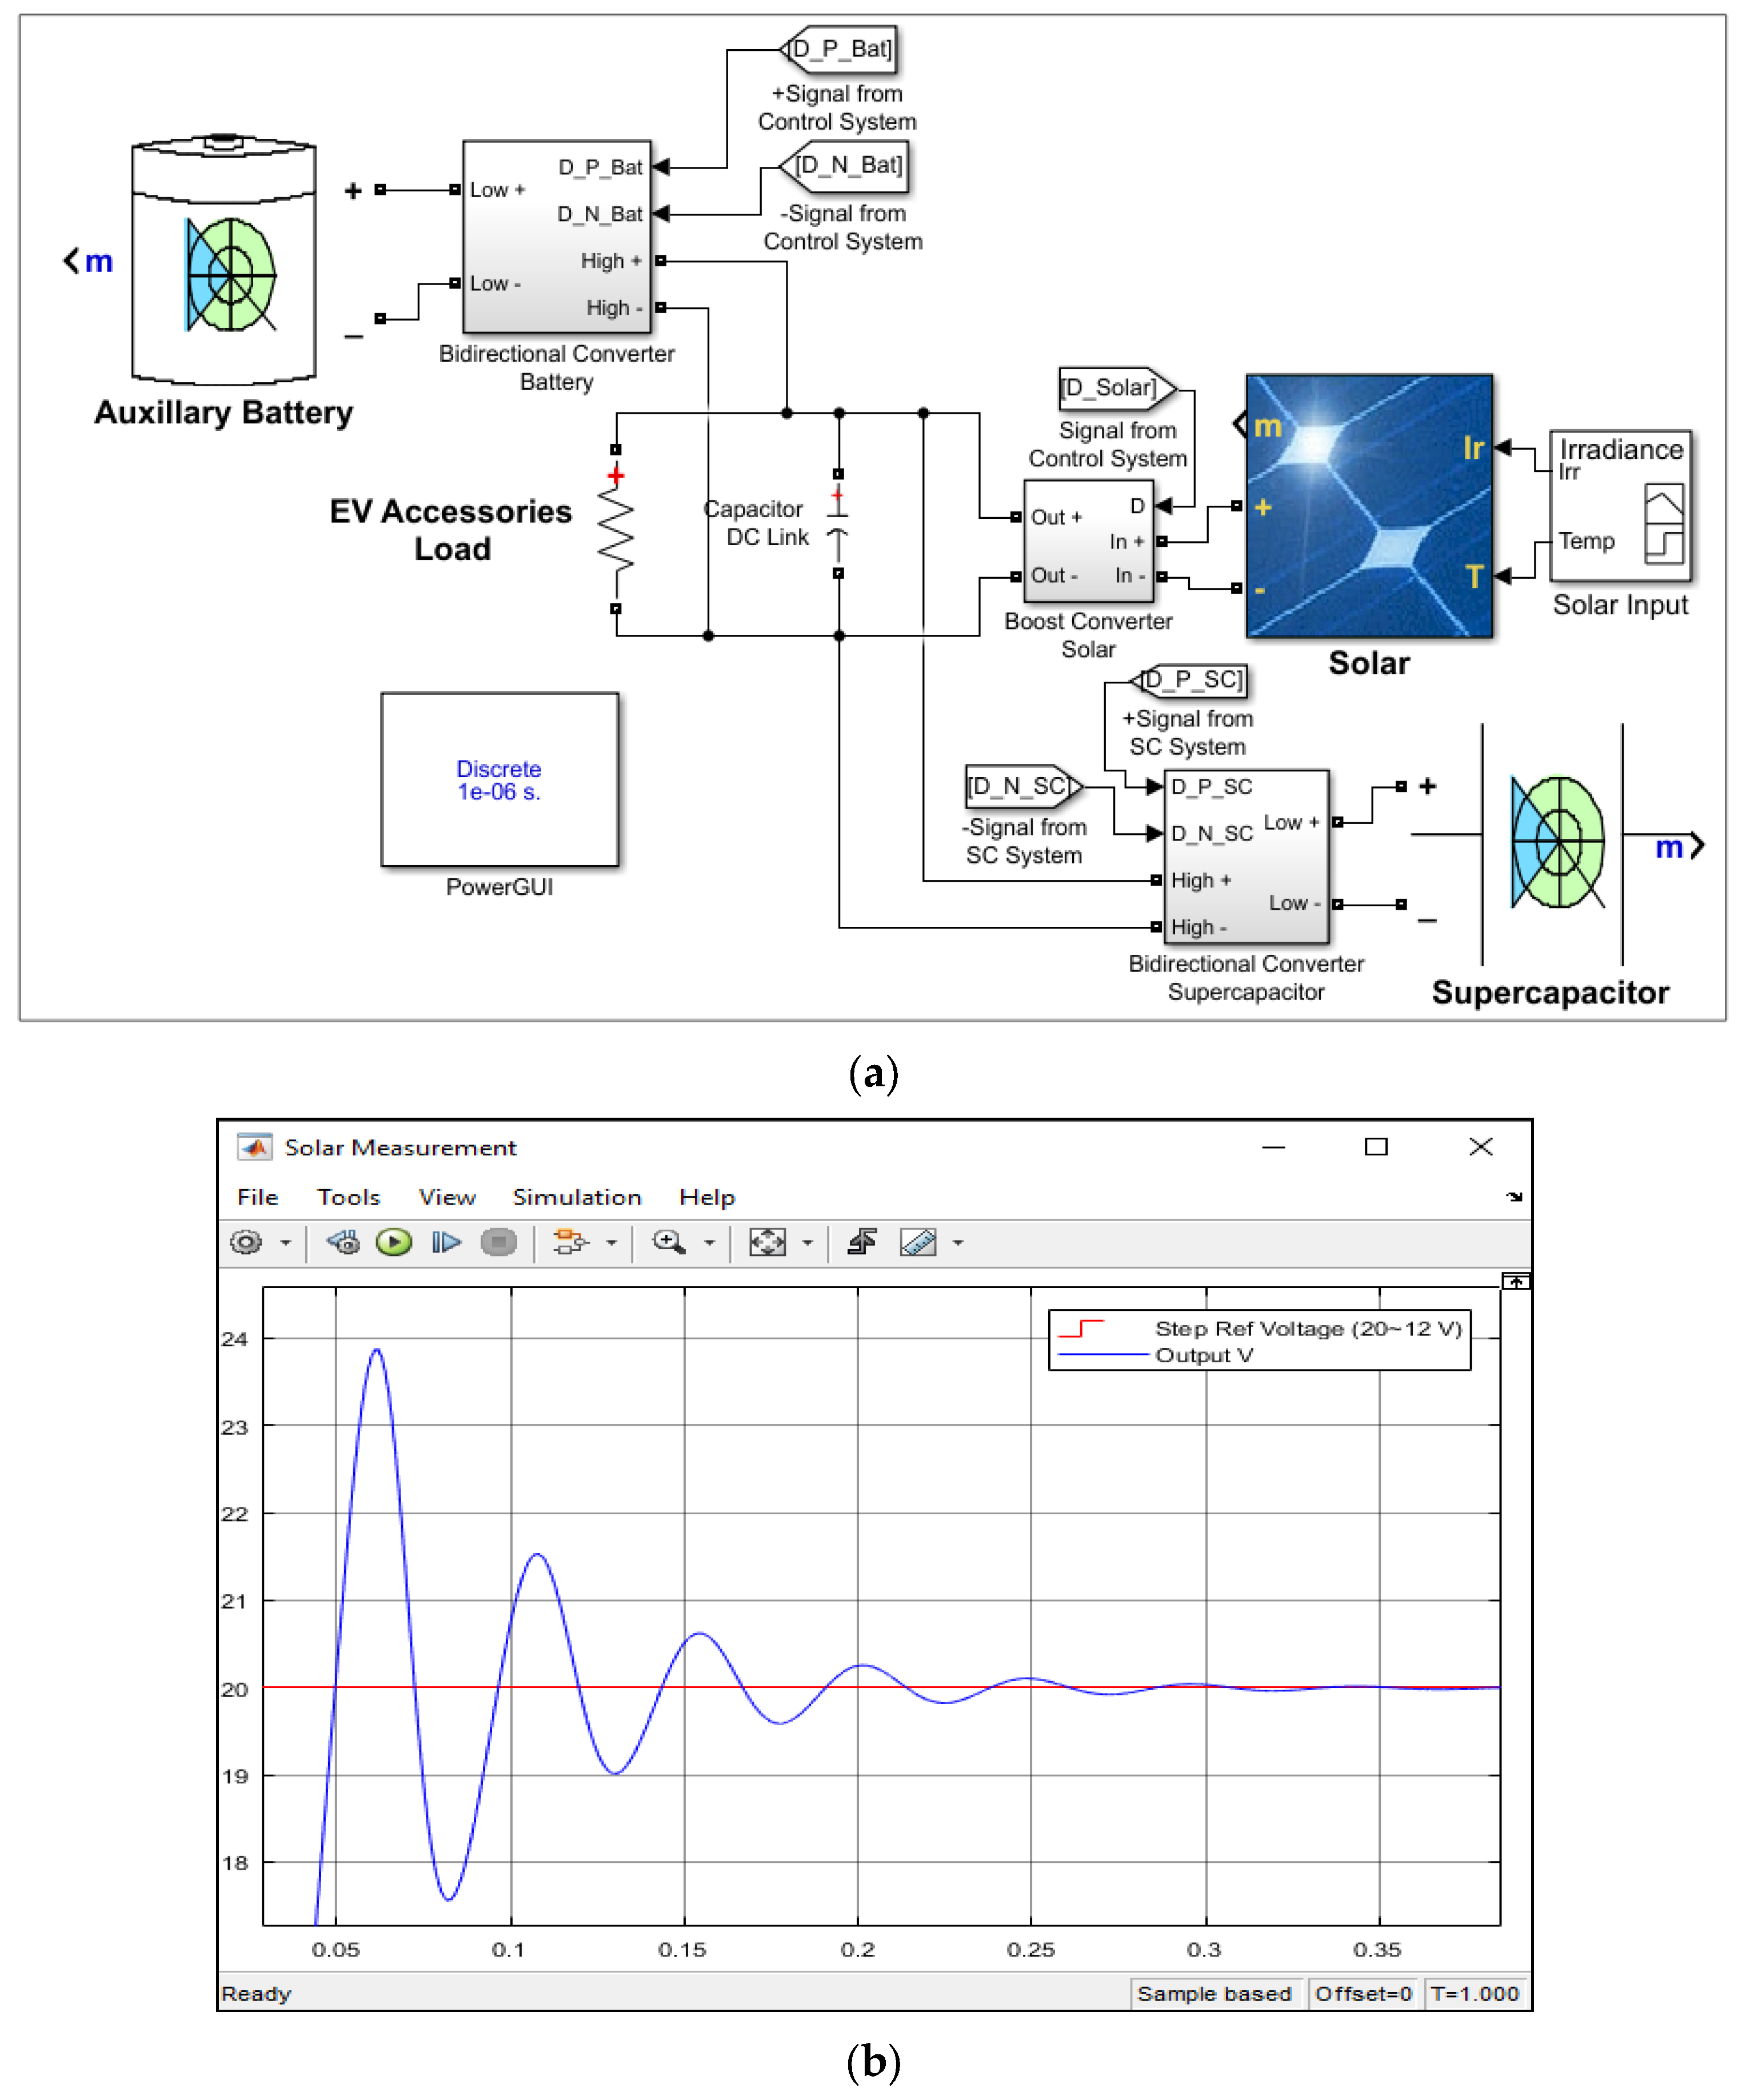
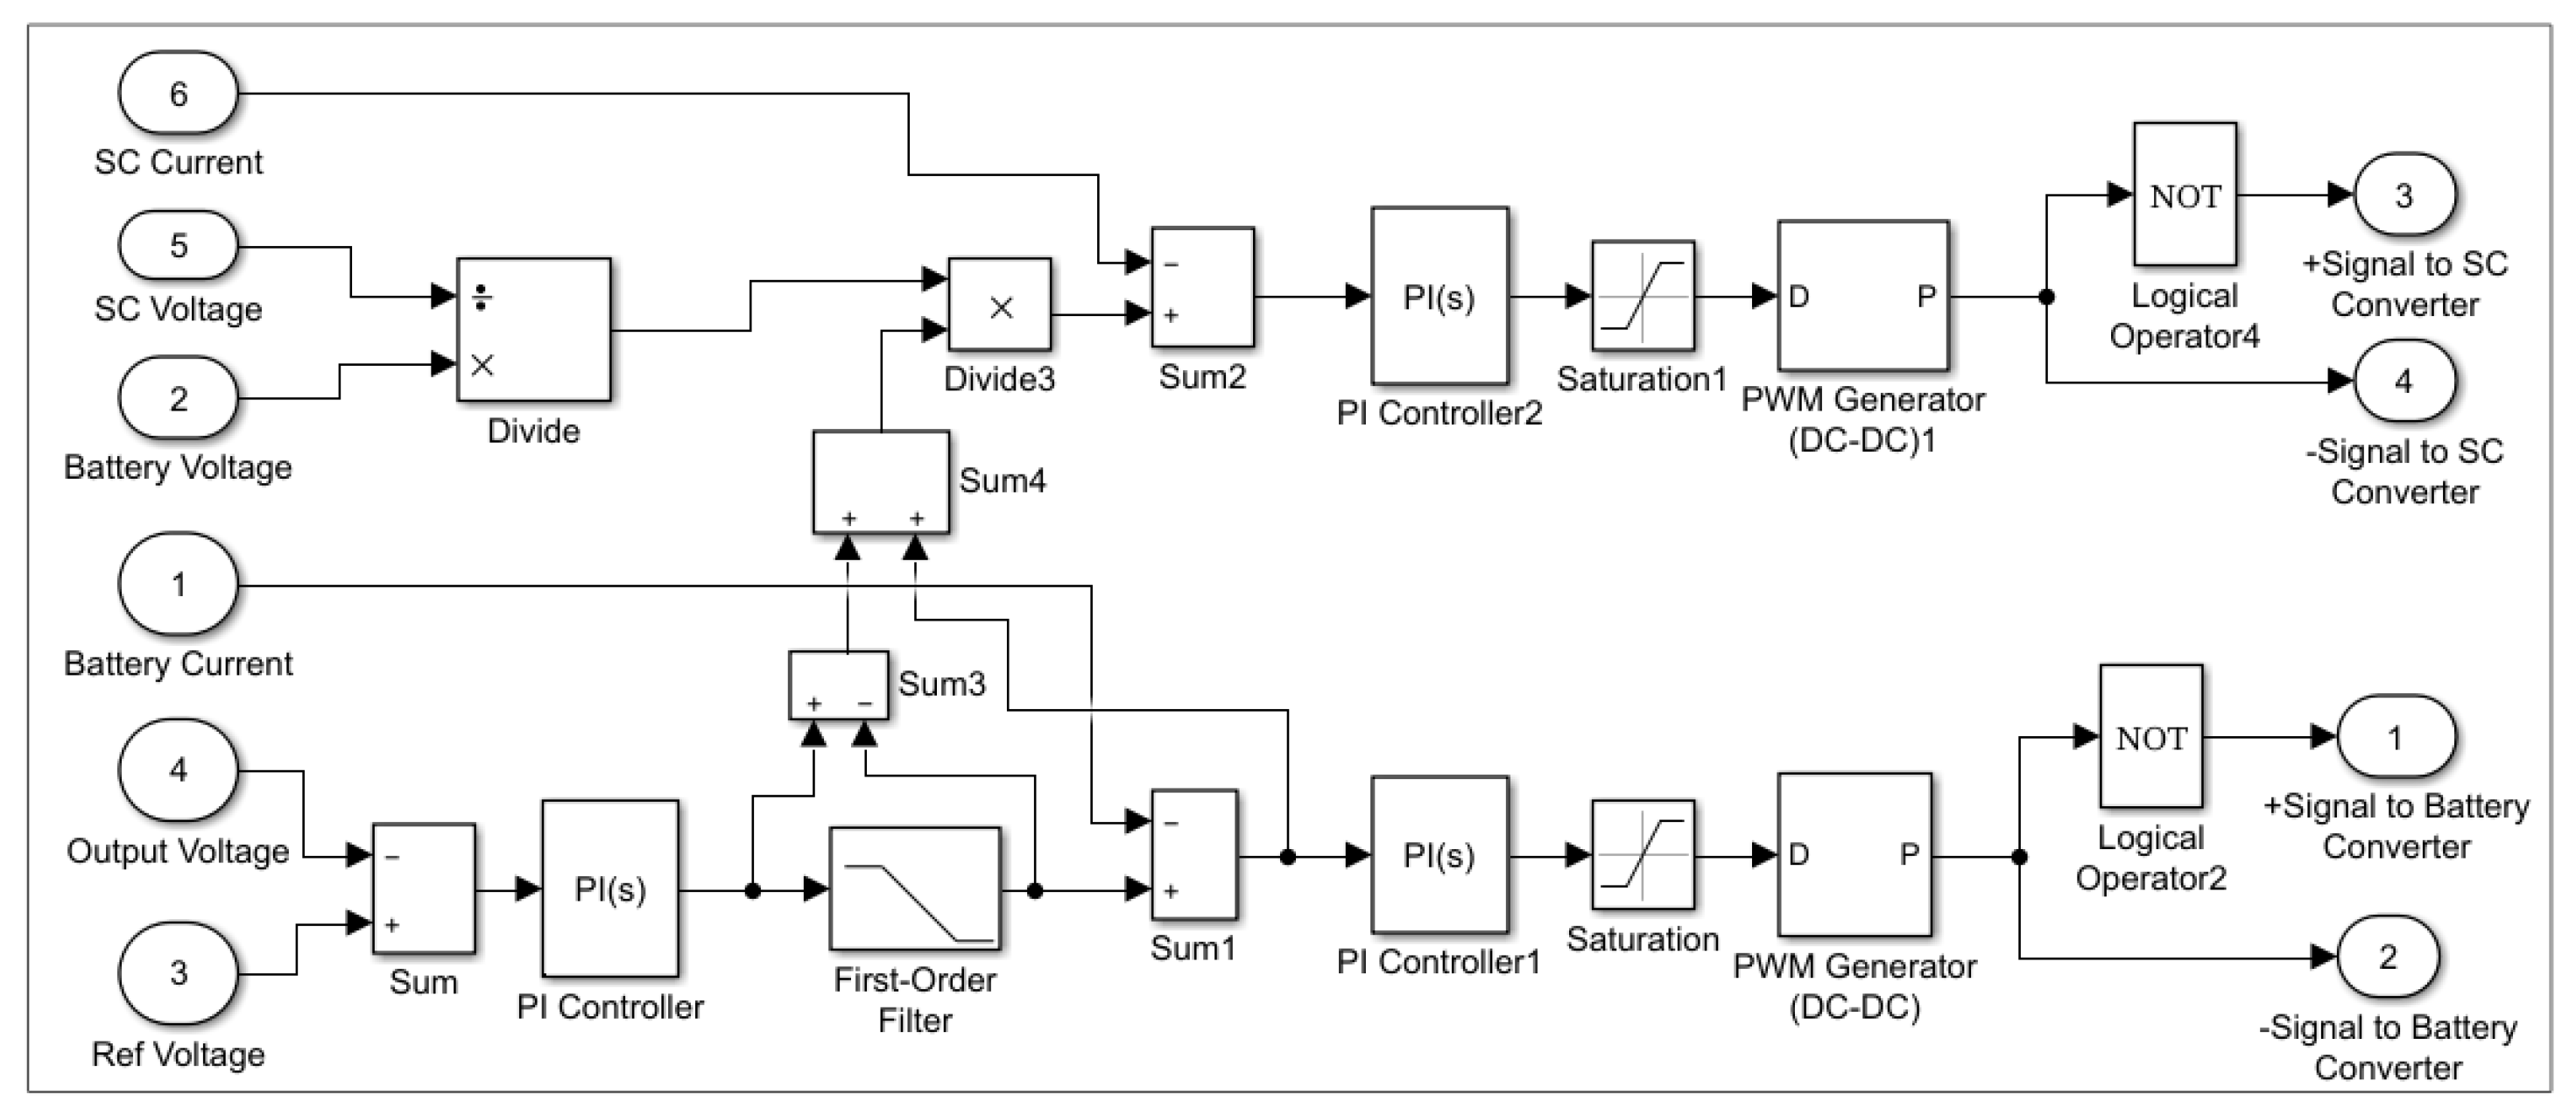
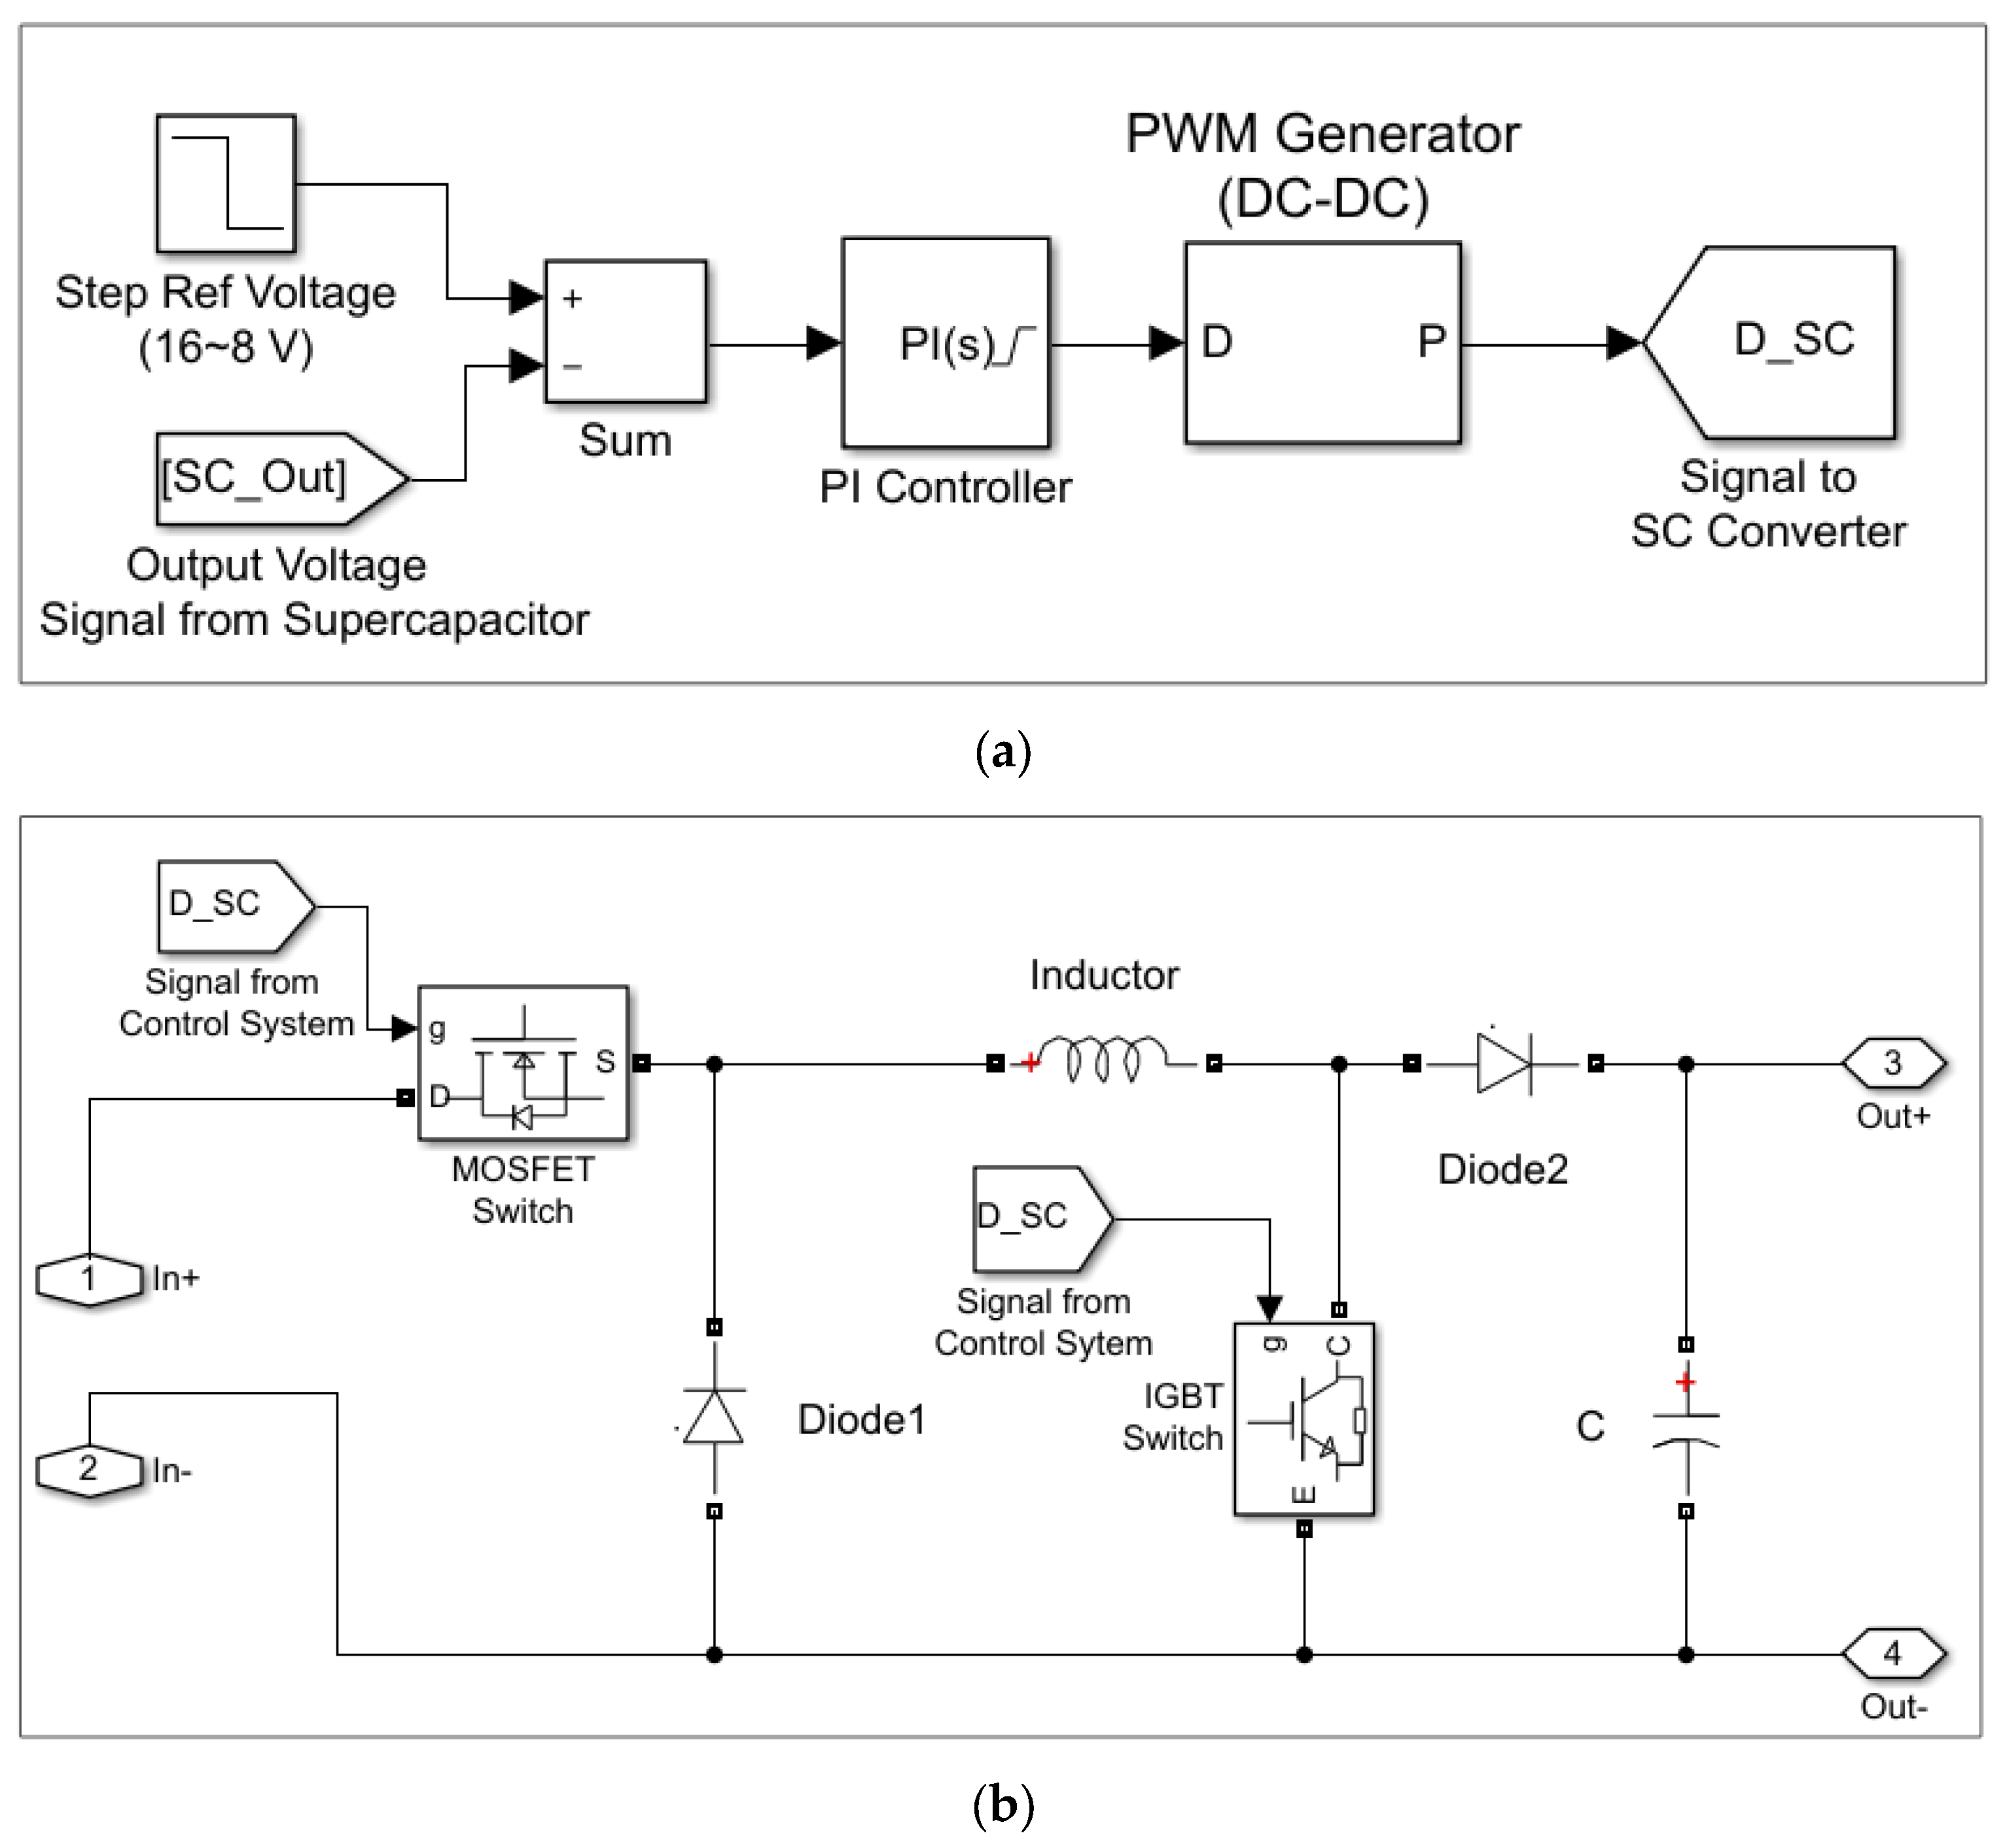
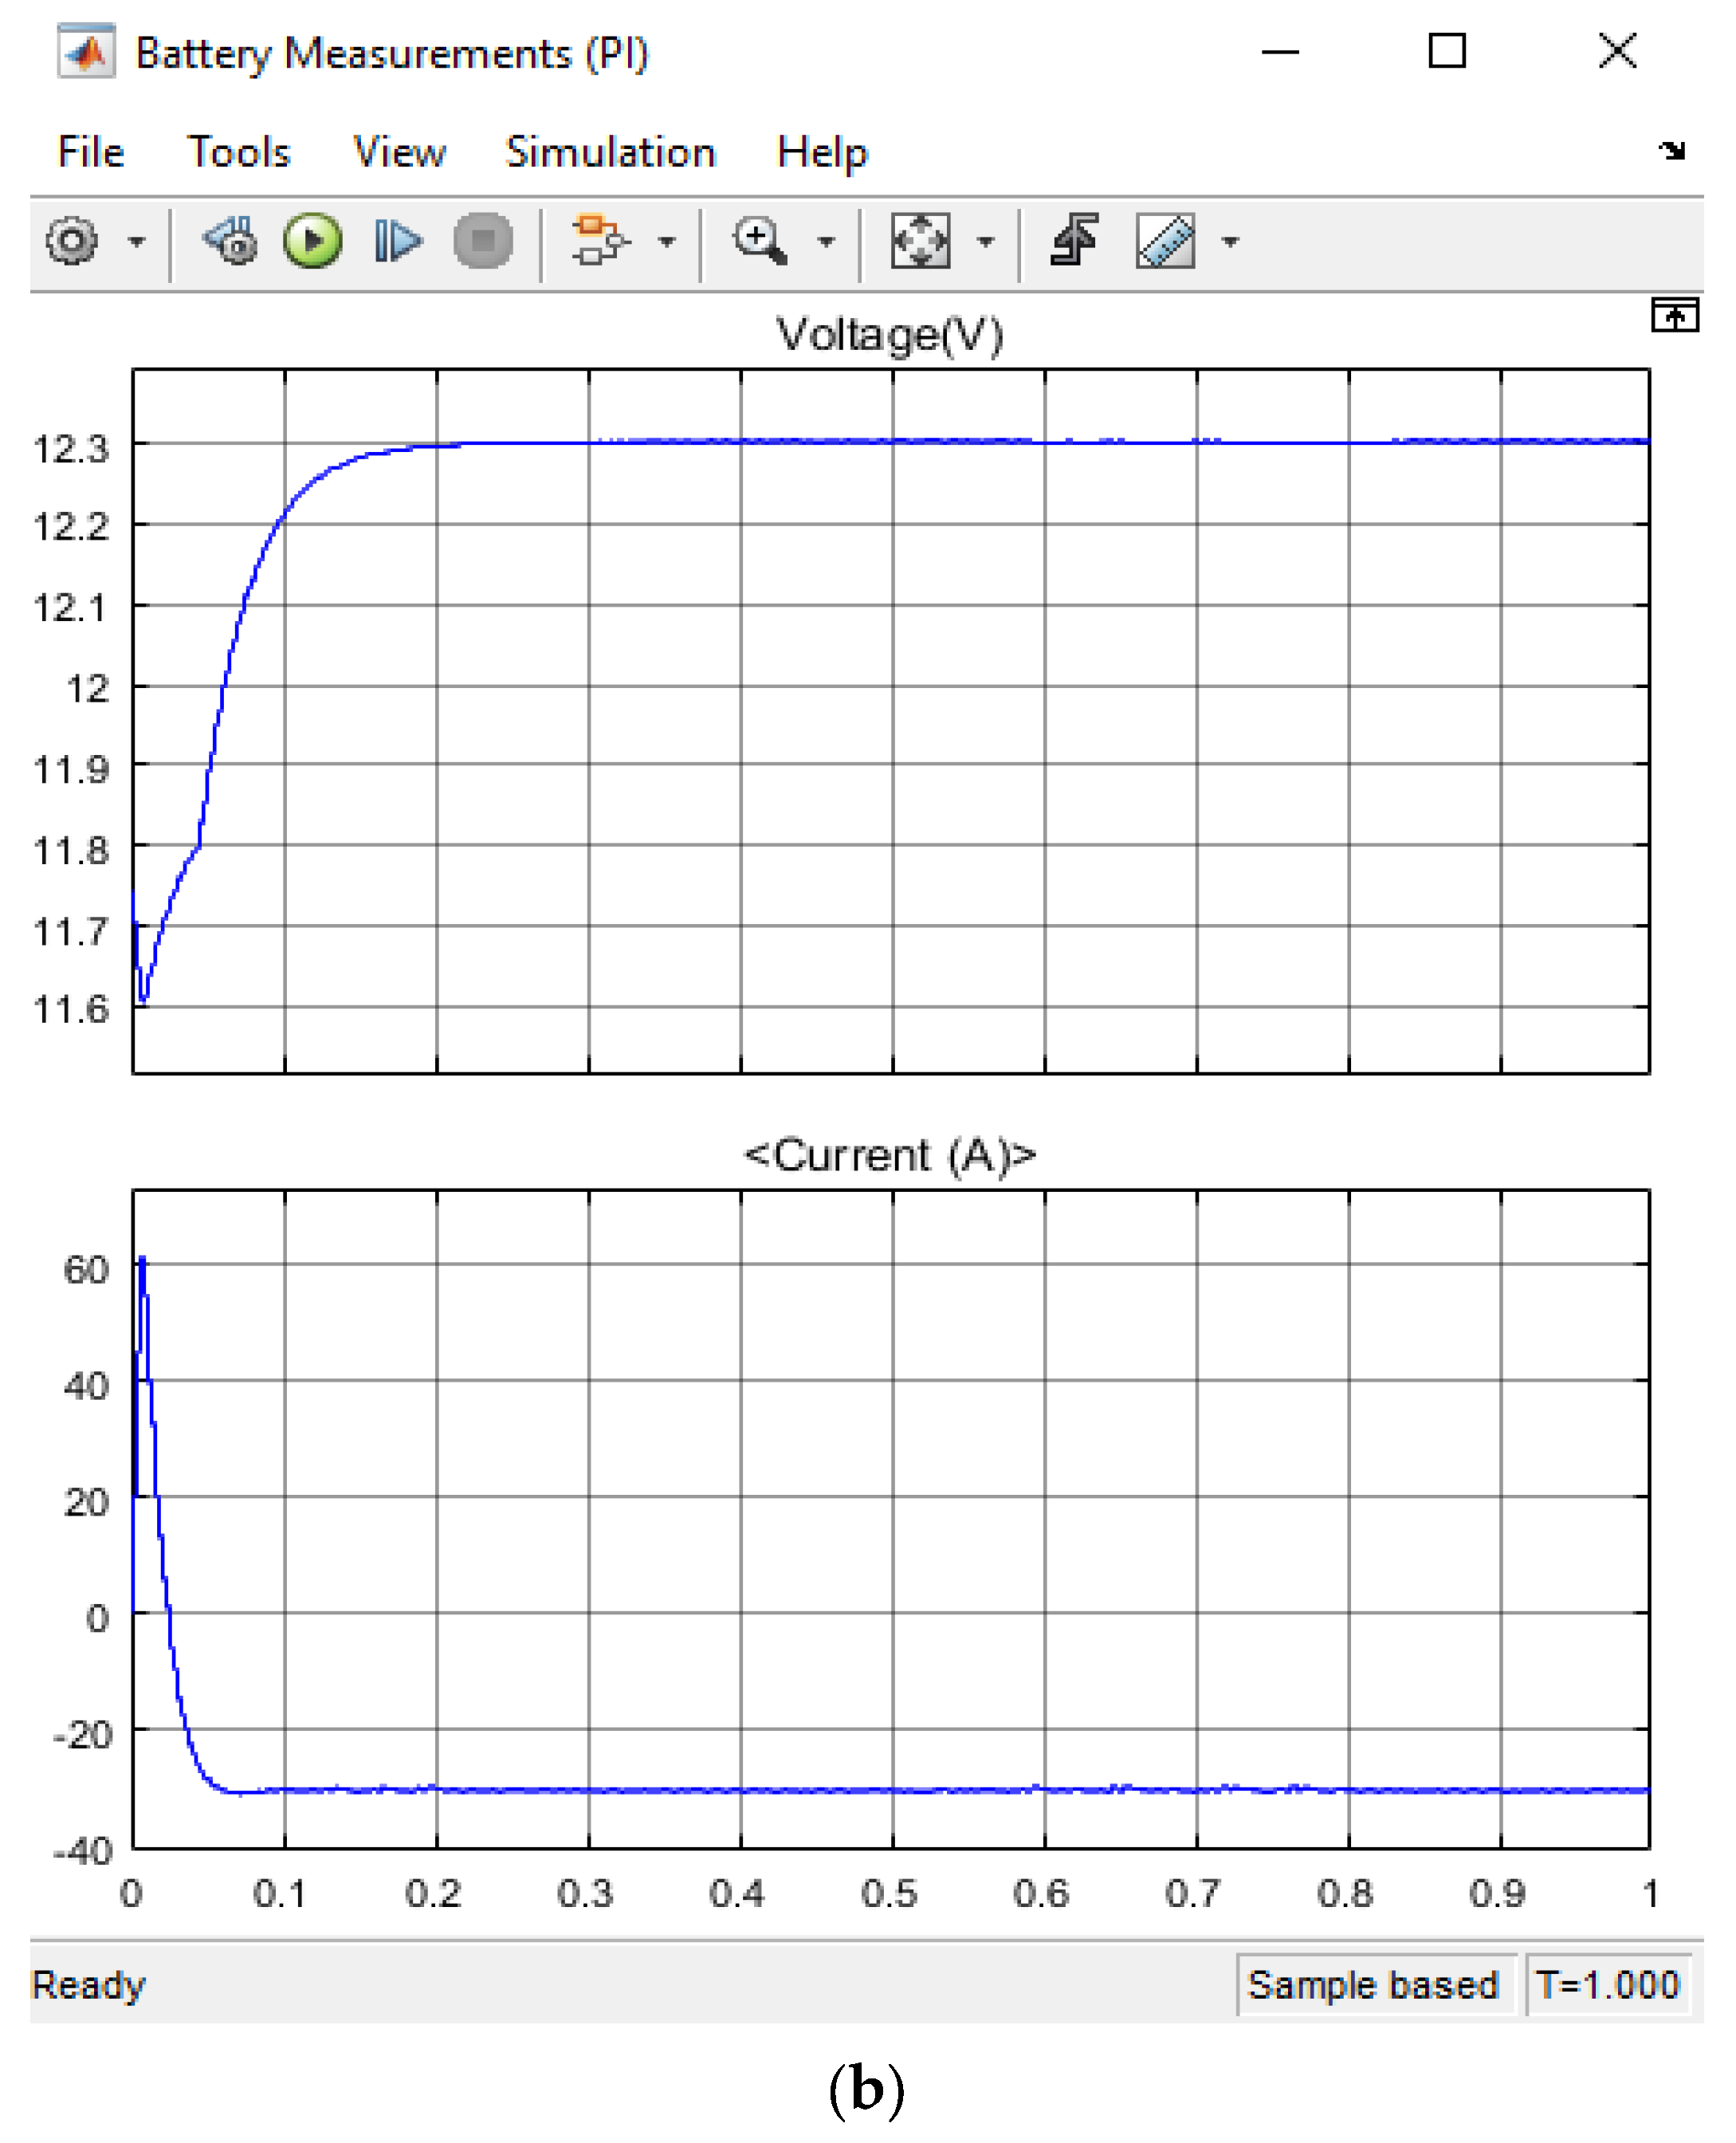
2.4. OSSC with PI Controller
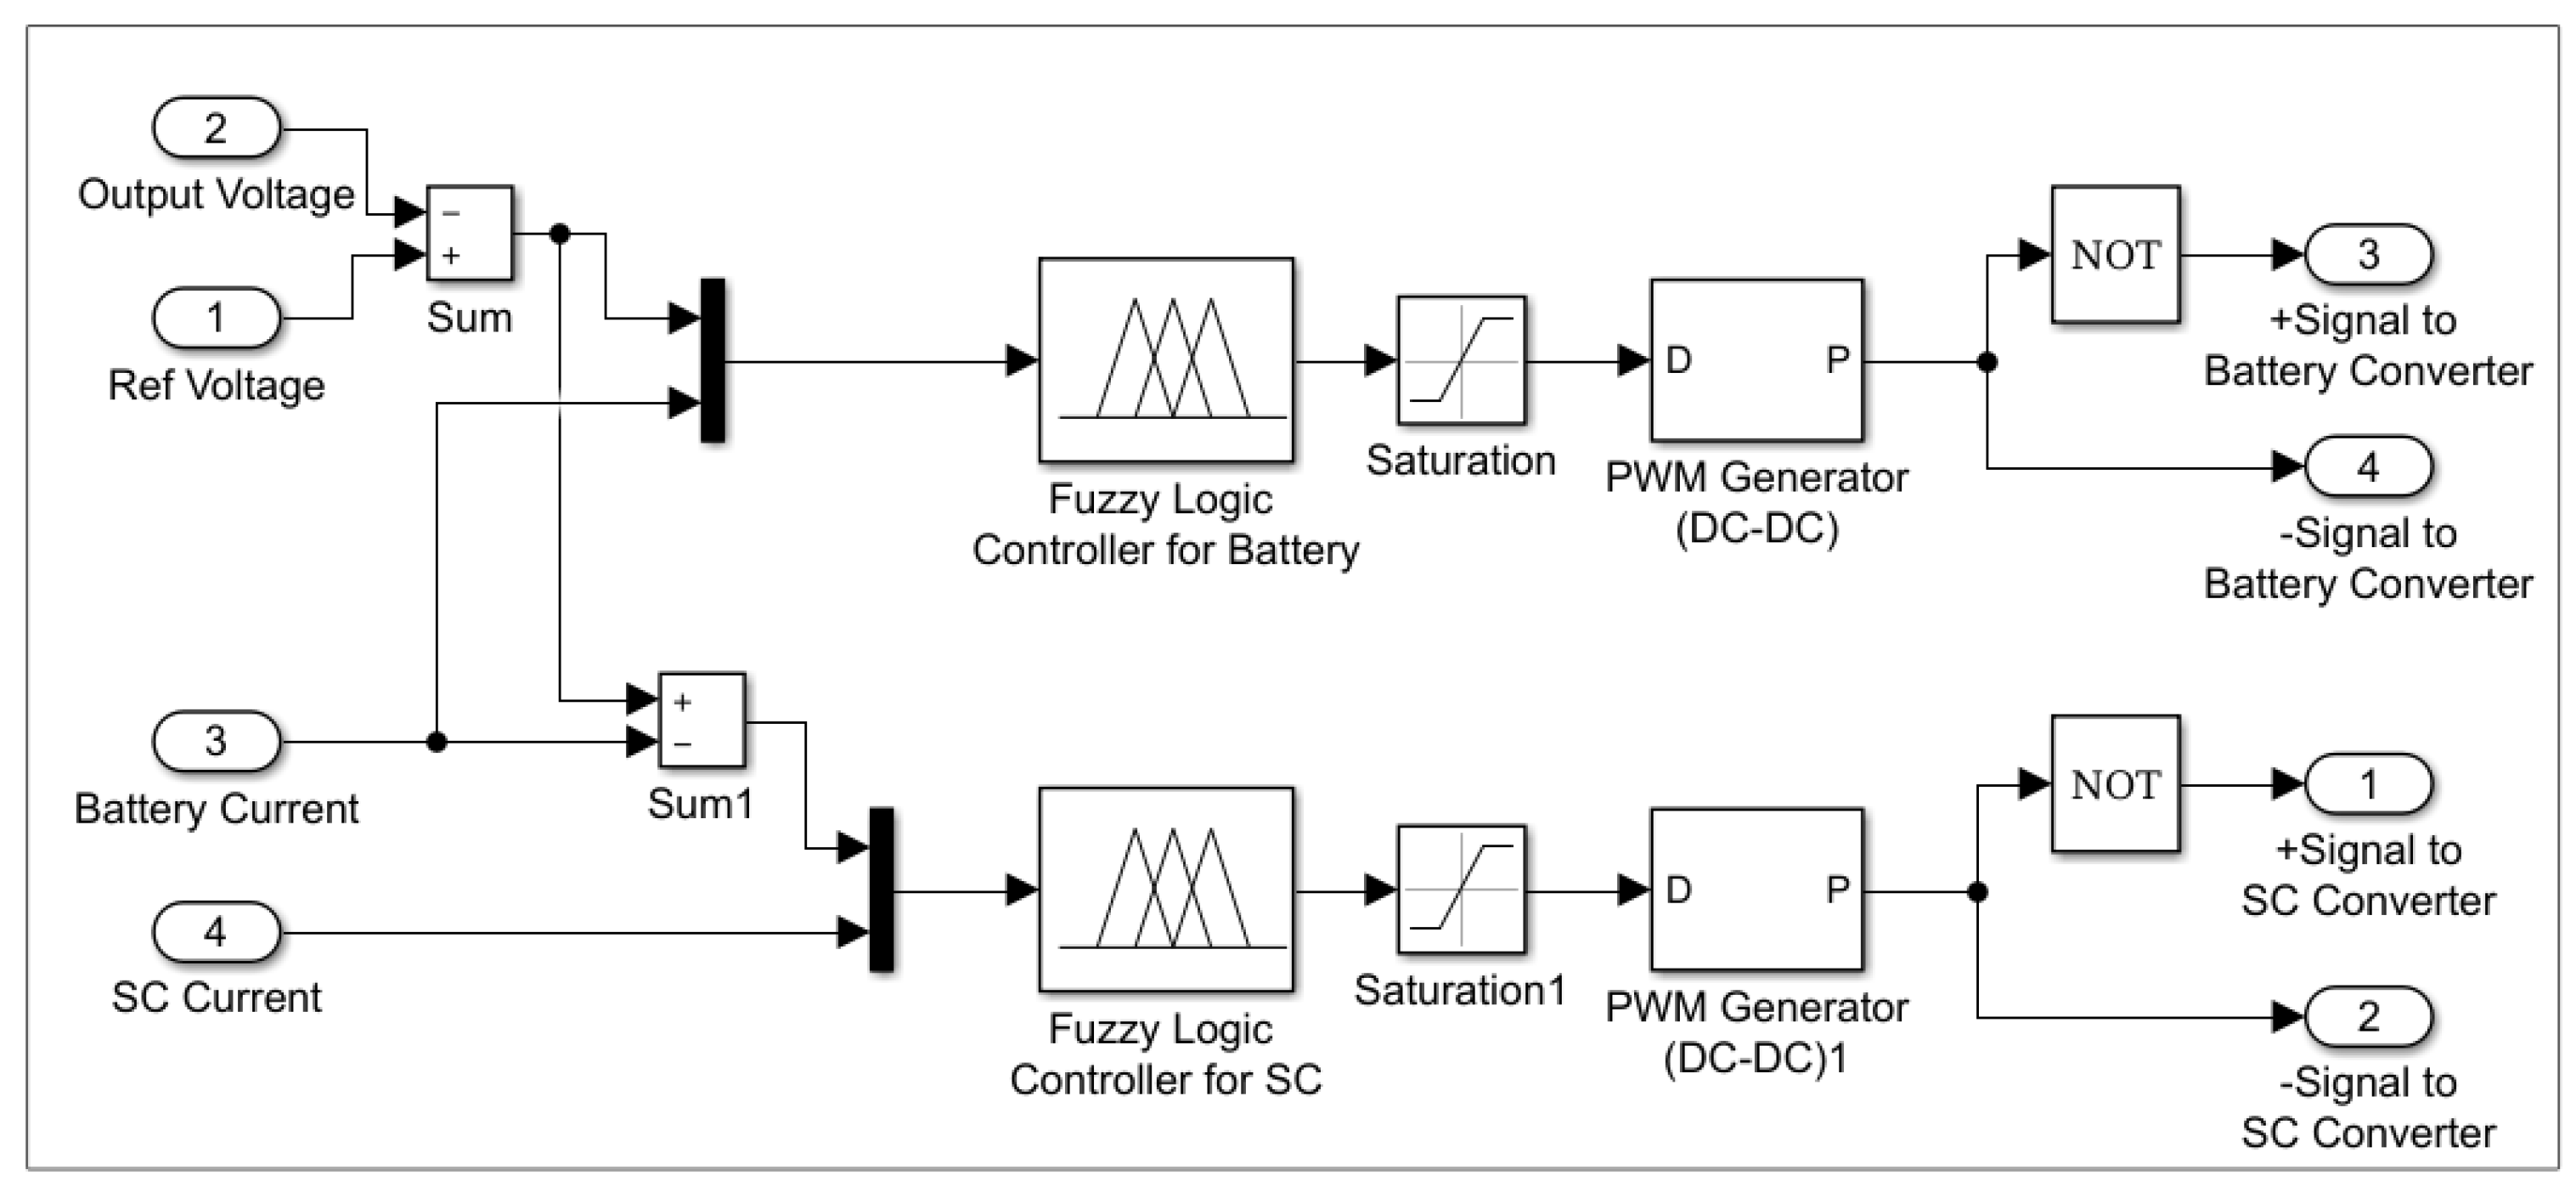
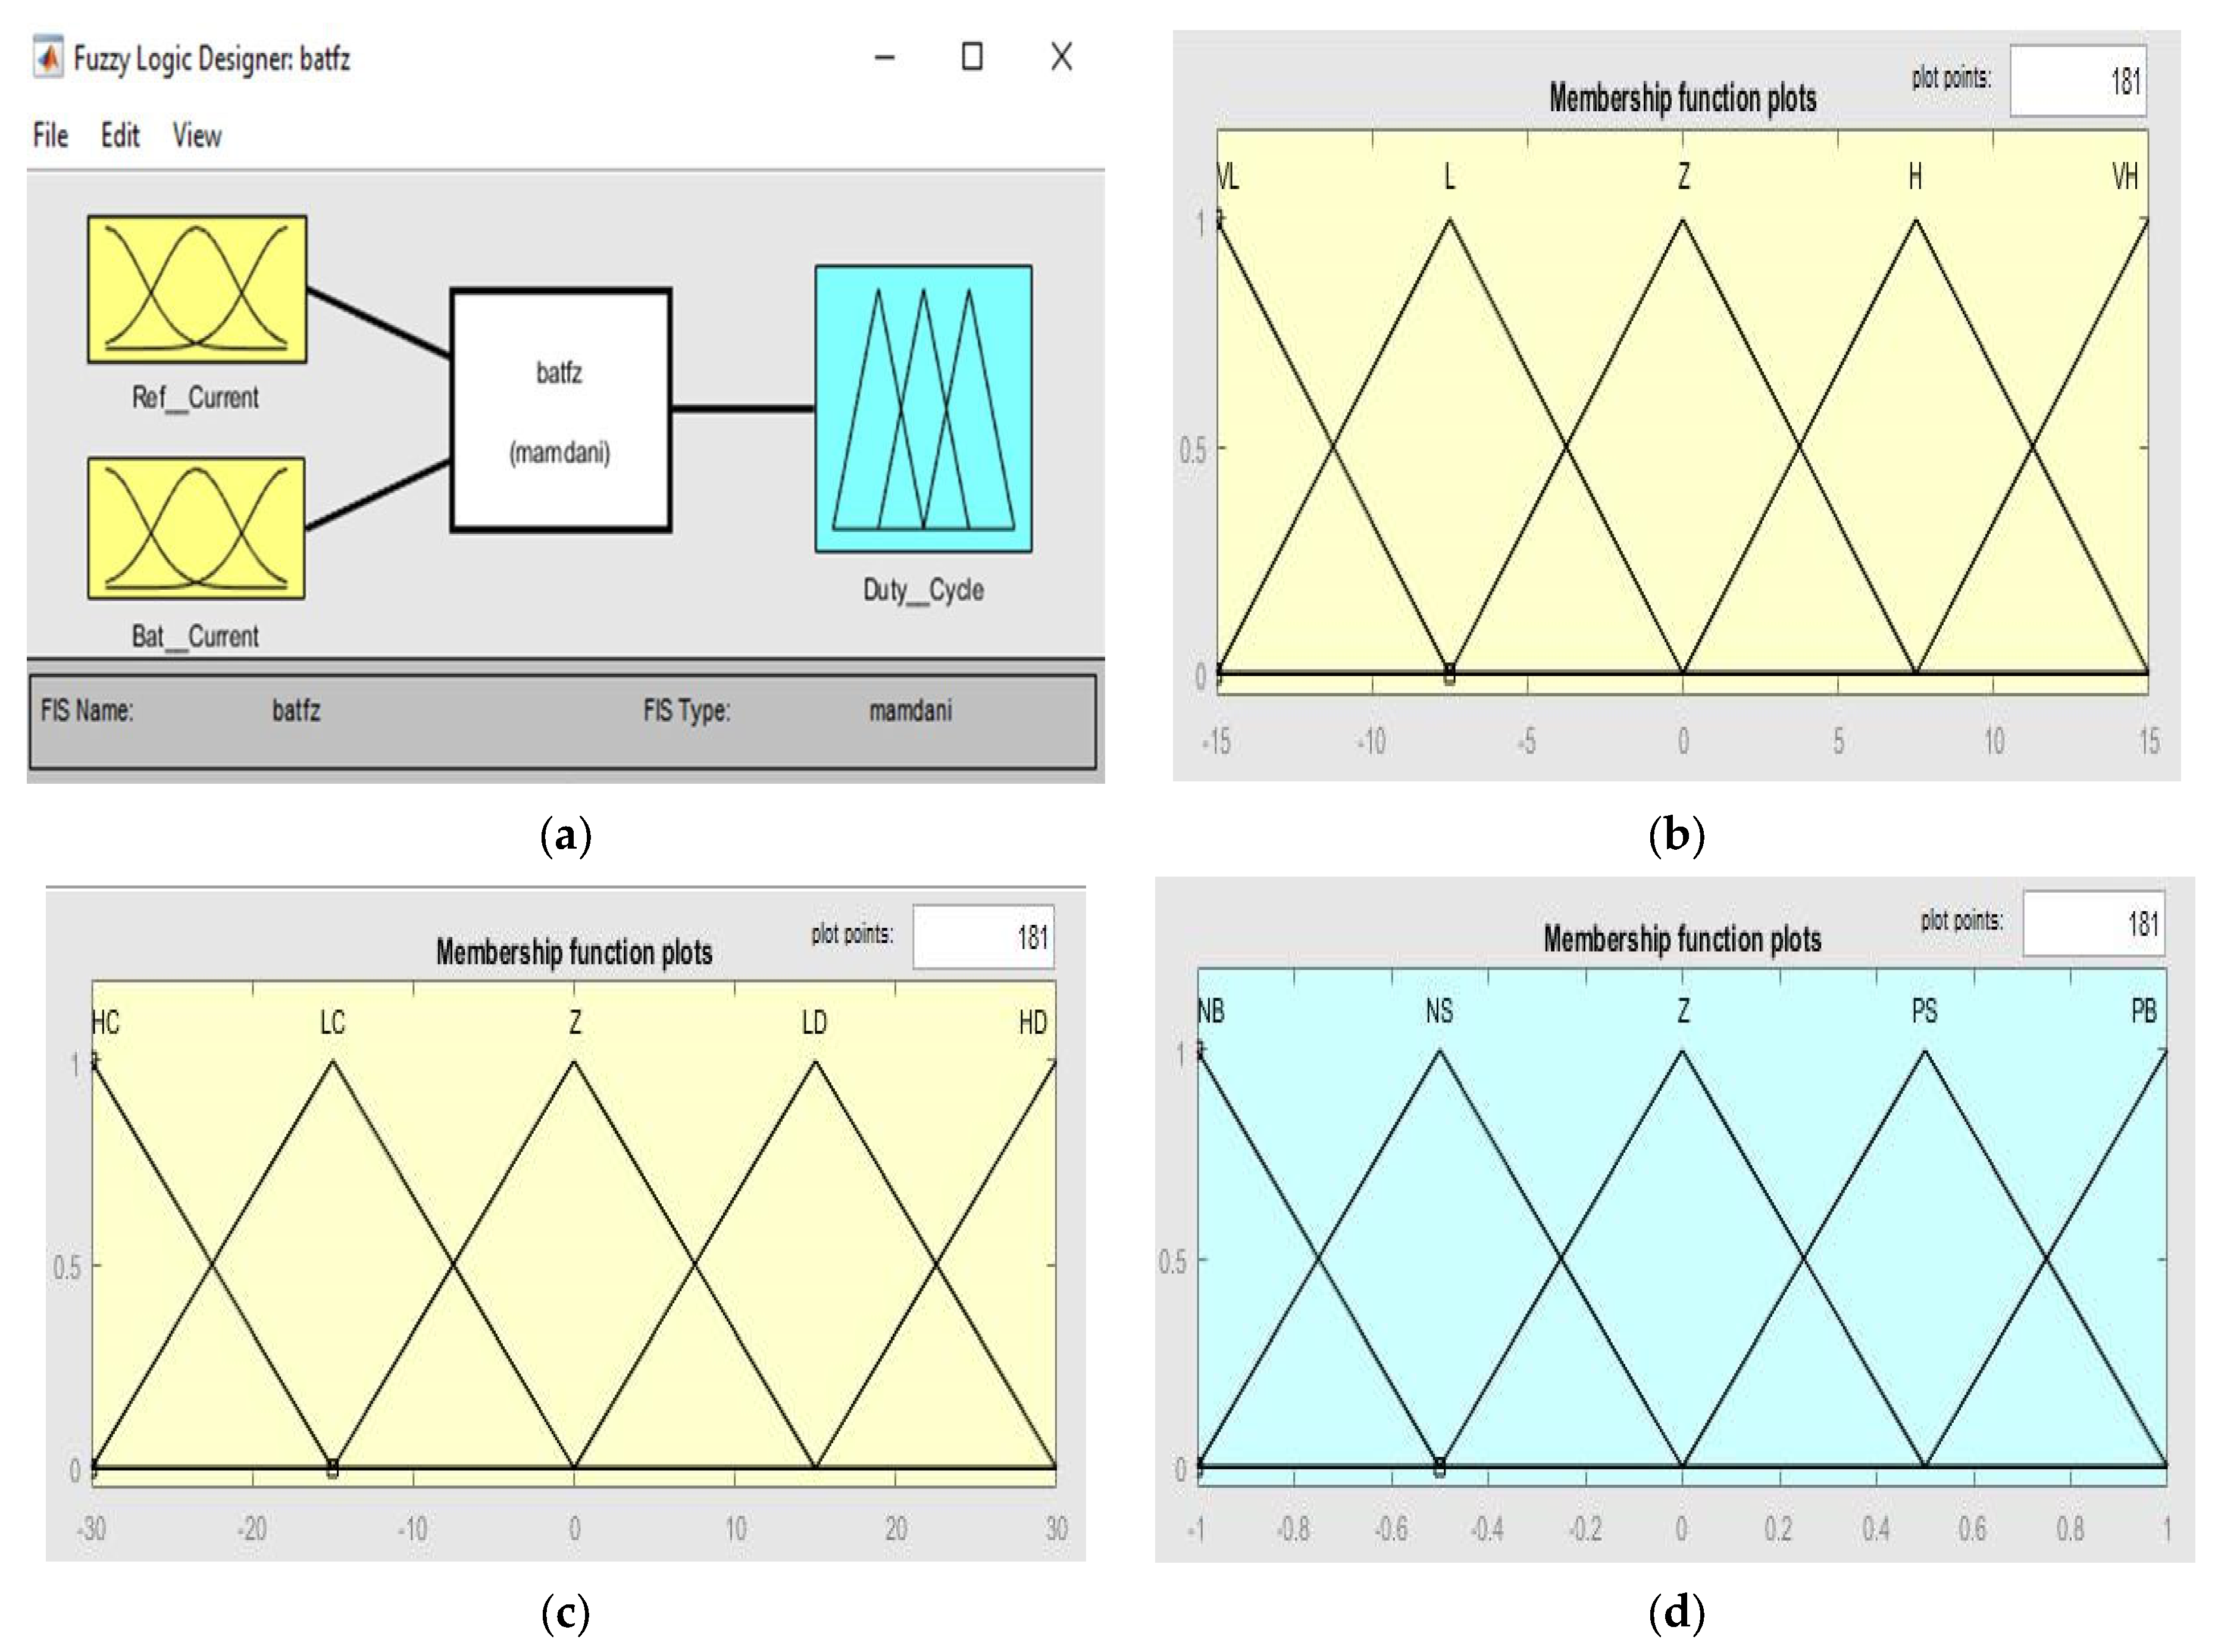
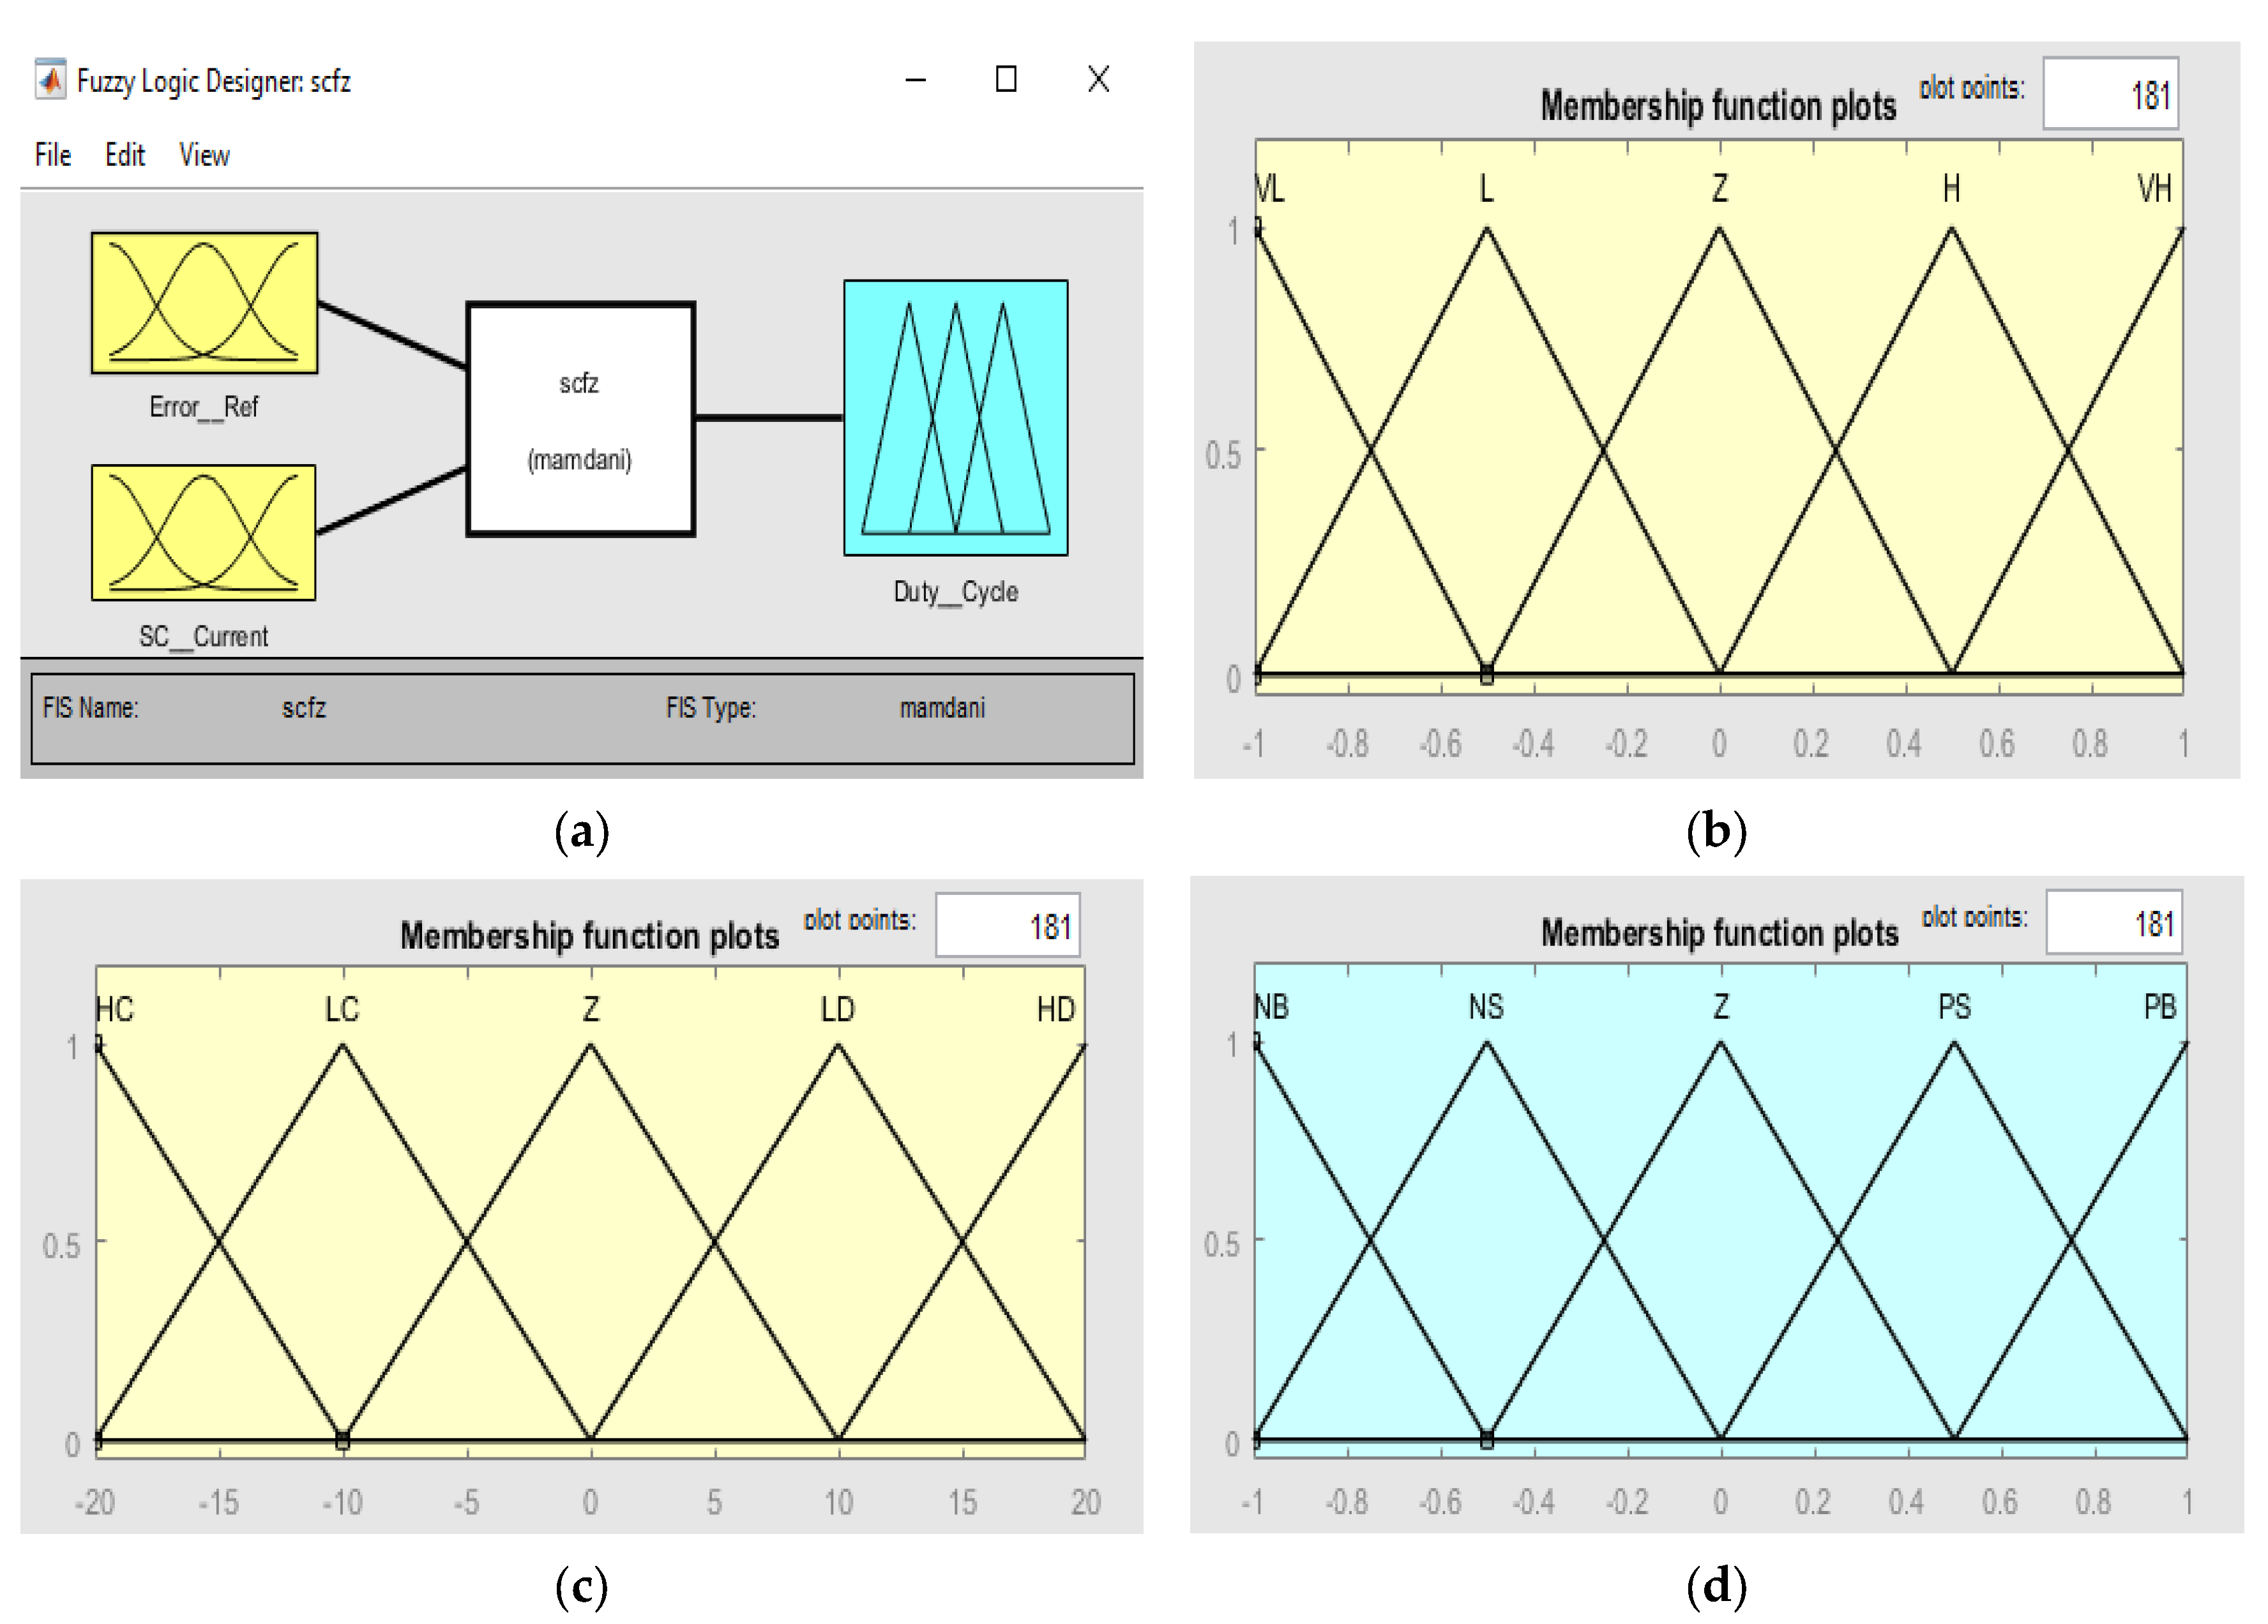
2.5. OSSC with FL Controller
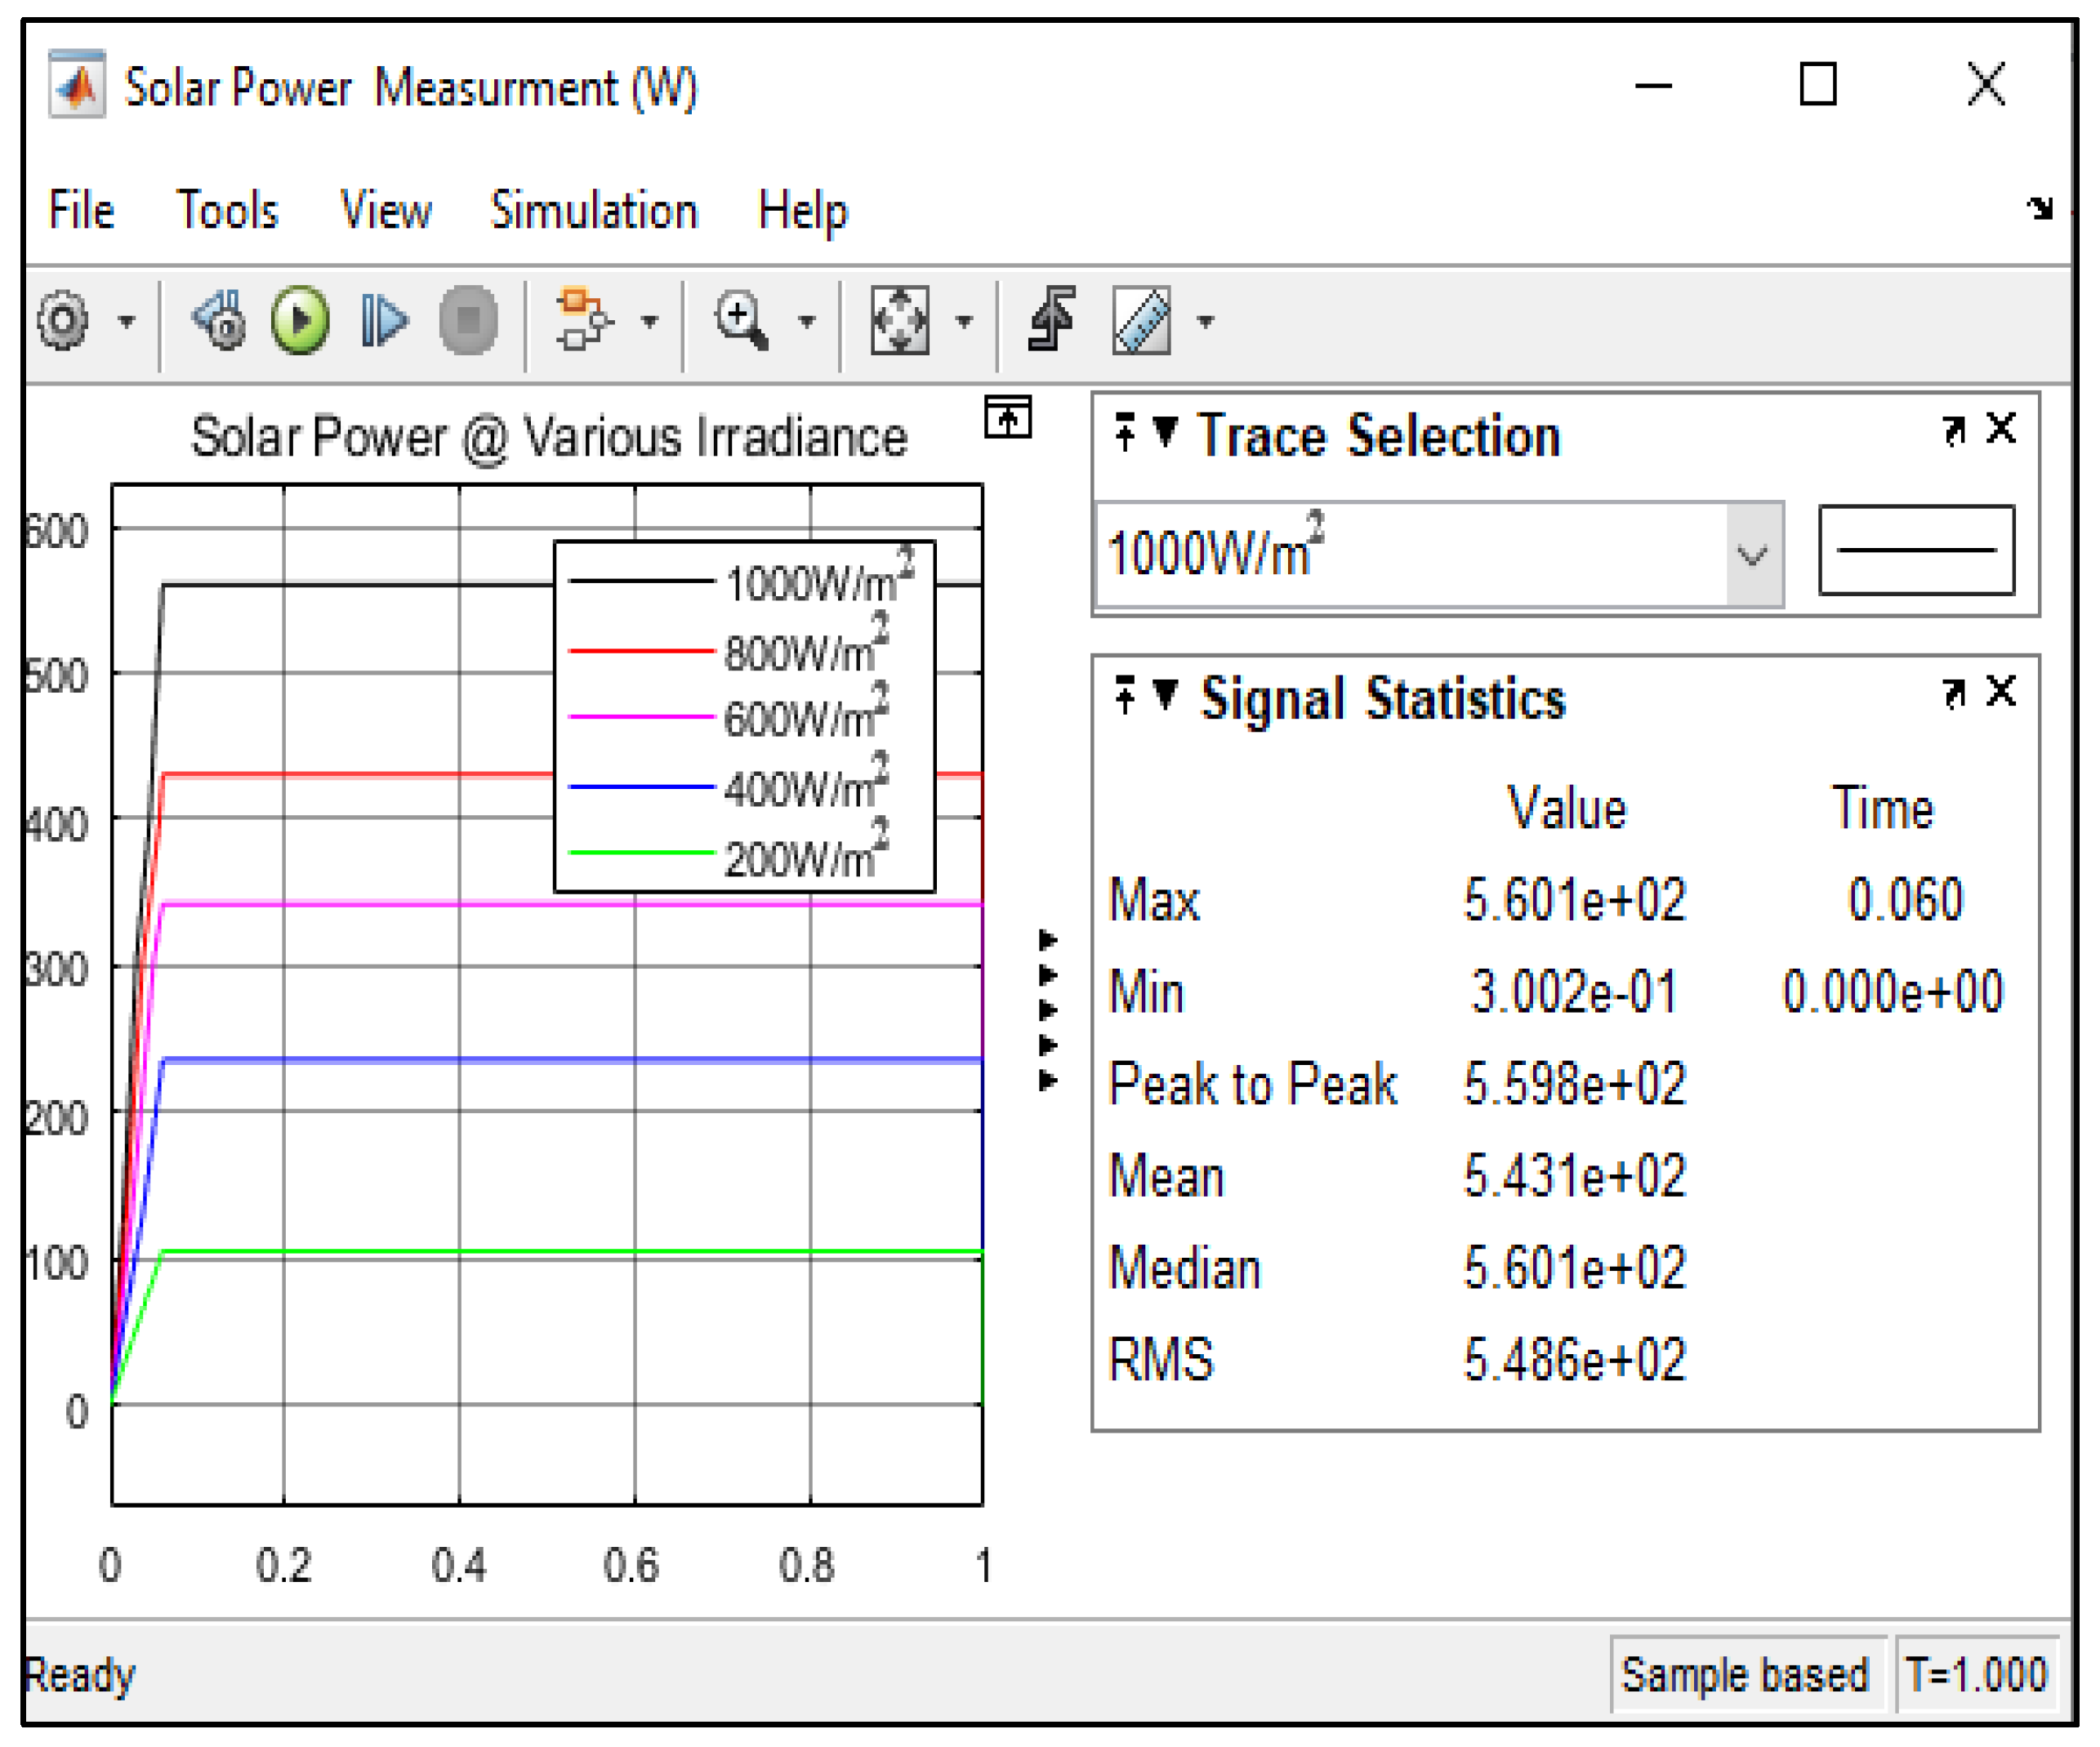
3. Experimental Study of OSSCs with ANFISs
4. Conclusions
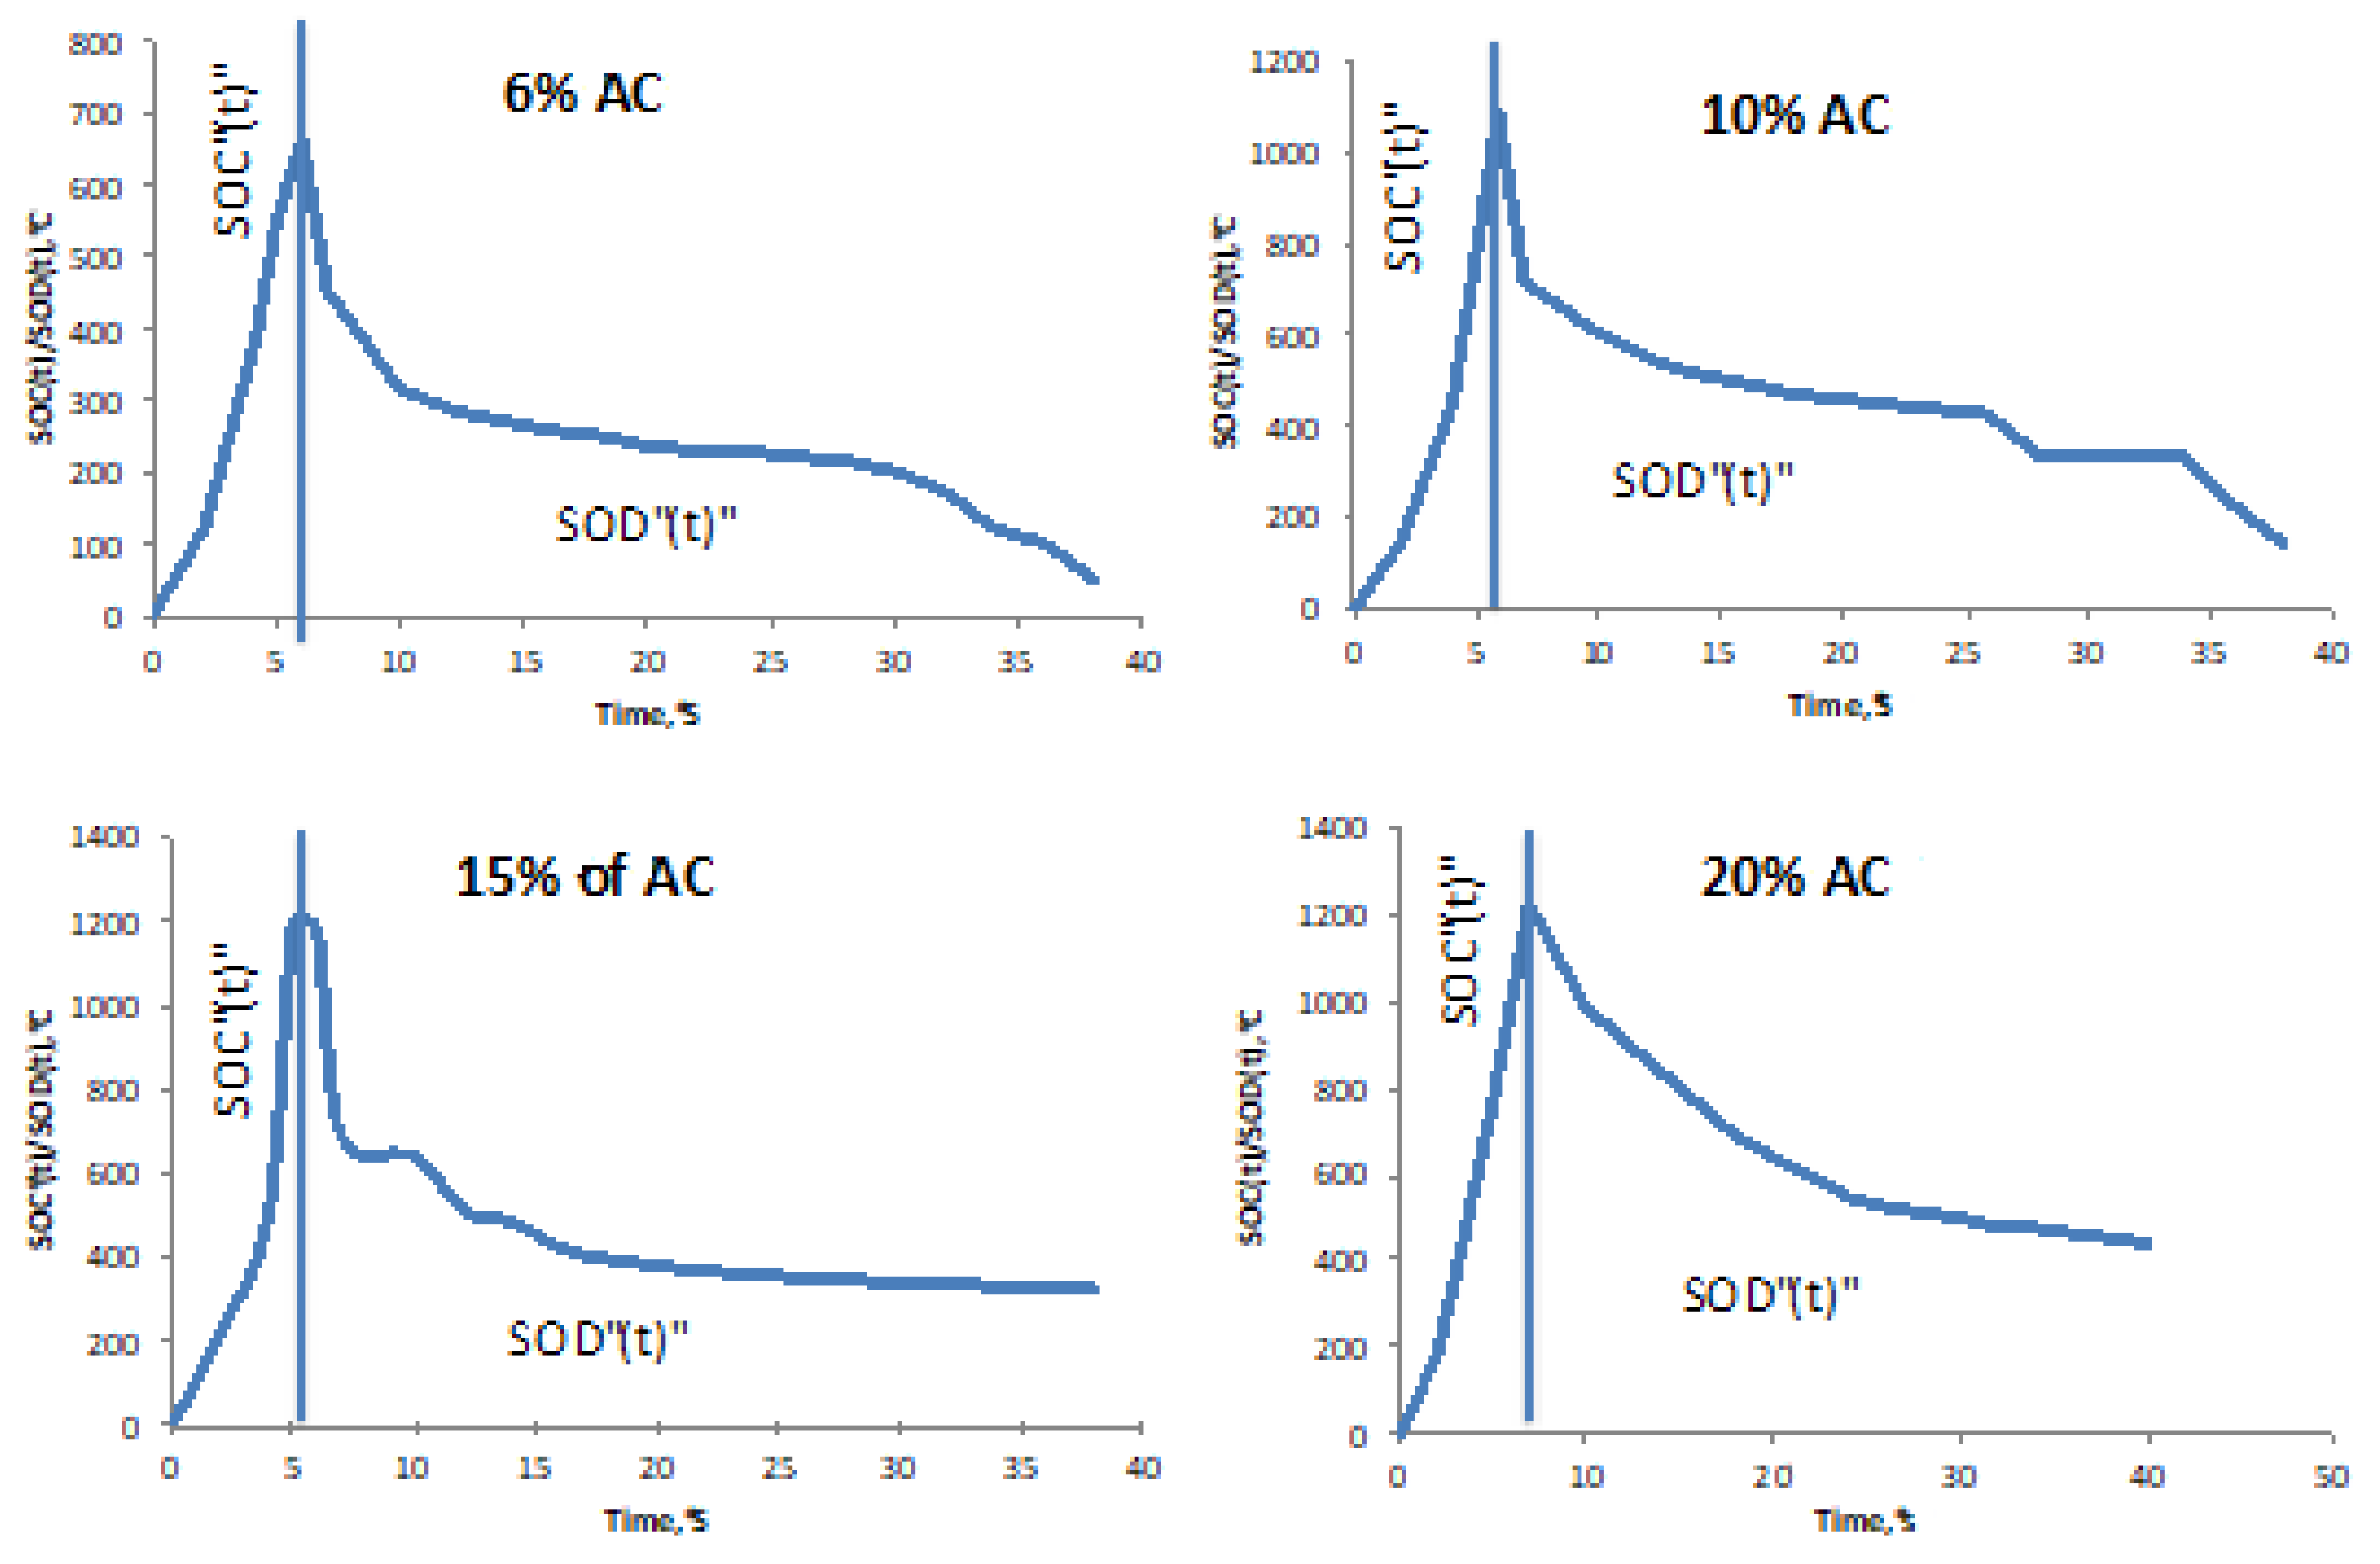
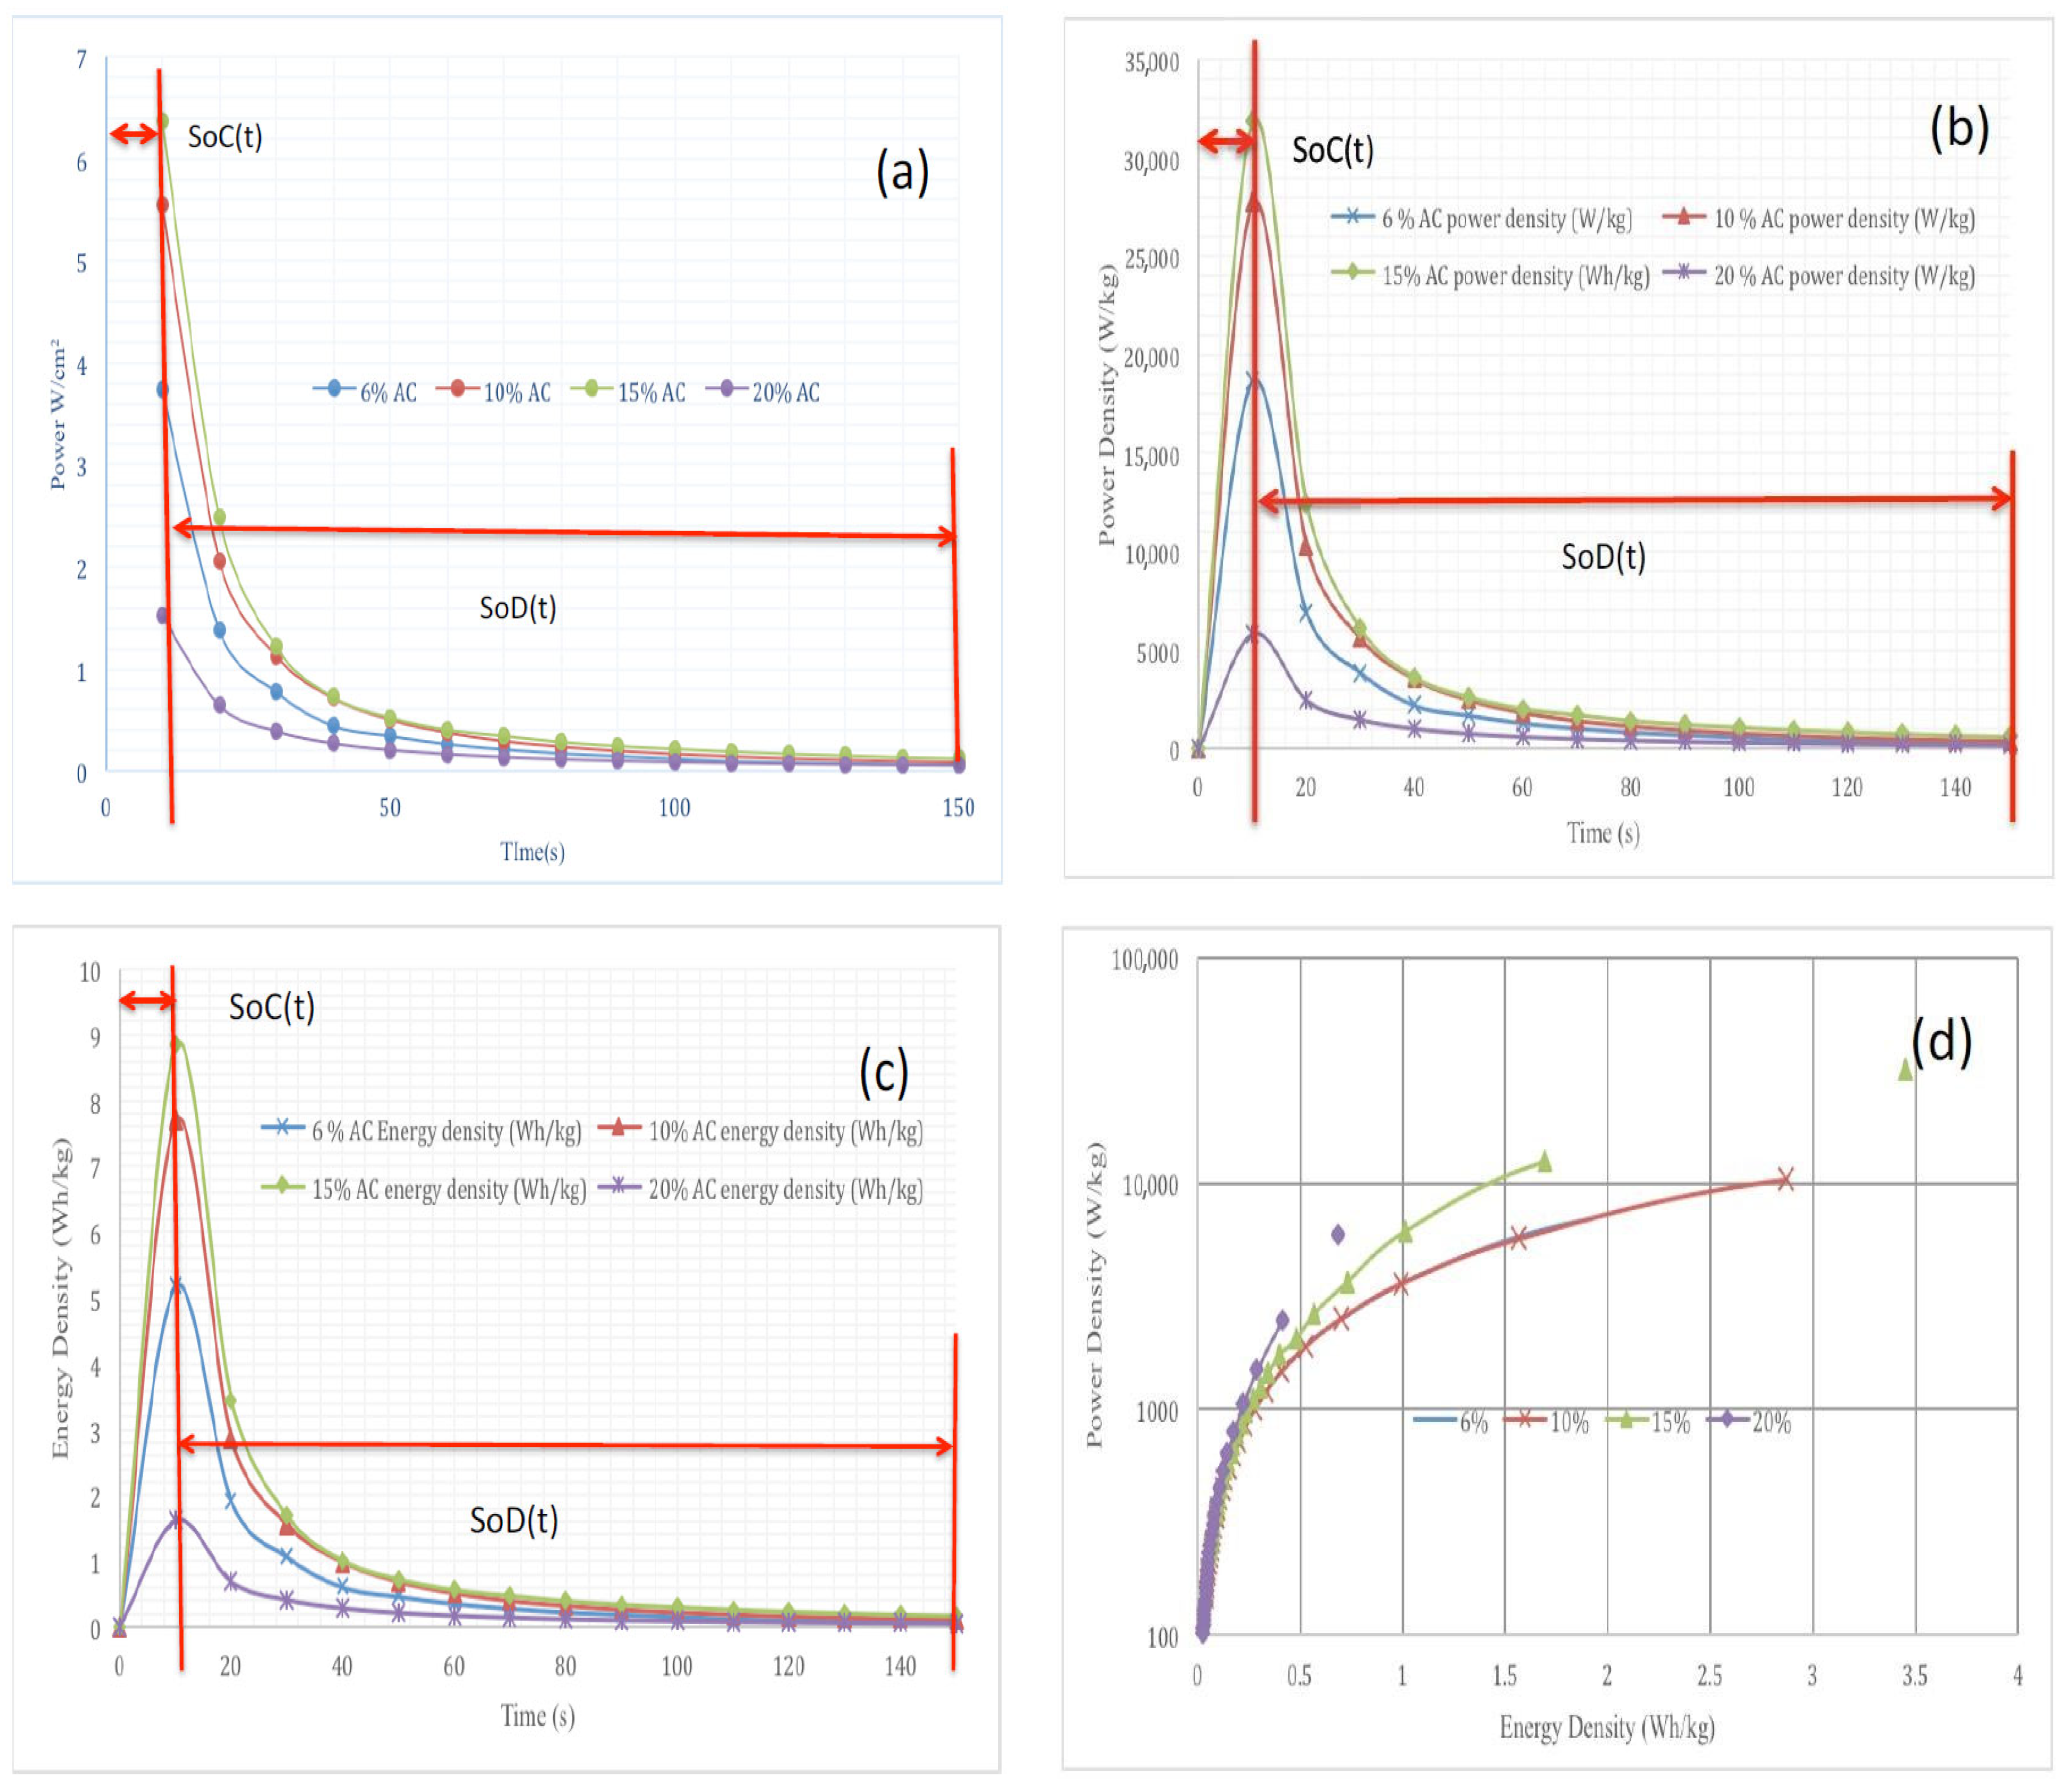
- The OSSC of a size of 2 m2 has a solar energy conversion efficiency between 13–15%, power generation of 2800 W/day, a power density of 33 kW/kg, an energy density of 13 kW·h/kg, and capacitance of 11.17 μF/cm2 at a temperature range of 25~32 °C and irradiance of 1000 W/m2.
- An OSSC for EVs is a promising, multifaceted structure that can reduce power consumption and emission due to its lightweight structure and reduction of traction.
- An ANFIS has produced better energy control compared to a PID controller and FLC using an OSSC at an irradiance of 1000 W/m2 with an increase of 16% and 29%, respectively.
- The OSSC with a size of 1 m2 produced a power of 65,000 W. It was not only able to meet the vehicle’s electrical load demand but also able to charge the EV battery with a voltage of 120 V and 540 A. However, an ANFIS will not allow an OSSC to store high power.
Author Contributions
Funding
Data Availability Statement
Acknowledgments
Conflicts of Interest
References
- Babalola, P.; Atiba, O. Solar powered cars—A review. IOP Conf. Ser. Mater. Sci. Eng. 2021, 1107, 012058. [Google Scholar] [CrossRef]
- Arulious, J.A.; Earlina, D.; Harish, D.; Priya, P.S.; Rexy, A.I.; Mary, J.S.N. Design of solar powered electric vehicle. J. Phys. Conf. Ser. 2021, 2070, 012105. [Google Scholar] [CrossRef]
- Sarker, A.K.; Azad, A.K.; Rasul, M.G.; Doppalapudi, A.T. Prospect of Green Hydrogen Generation from Hybrid Renewable Energy Sources: A Review. Energies 2023, 16, 1556. [Google Scholar] [CrossRef]
- Shah, R.M.R.A.; McGordon, A.; Rahman, M.; Amor-Segan, M.; Jennings, P. Characterisation of micro turbine generator as a range extender using an automotive drive cycle for series hybrid electric vehicle application. Appl. Therm. Eng. 2021, 184, 116302. [Google Scholar] [CrossRef]
- Allafi, W.; Uddin, K.; Zhang, C.; Sha, R.M.R.A.; Marco, J. On-line scheme for parameter estimation of nonlinear lithium ion battery equivalent circuit models using the simplified refined instrumental variable method for a modified Wiener continuous-time model. Appl. Energy 2017, 204, 497–508. [Google Scholar] [CrossRef]
- Meng, H.; Li, Y.-F. A review on prognostics and health management (PHM) methods of lithium-ion batteries. Renew. Sustain. Energy Rev. 2019, 116, 109405. [Google Scholar] [CrossRef]
- Kim, Y.-M.; Lee, J.-H.; Kim, S.-J.; Favrat, D. Potential and Evolution of Compressed Air Energy Storage: Energy and Exergy Analyses. Entropy 2012, 14, 1501–1521. [Google Scholar] [CrossRef]
- Bezerra, M.L.H.; Zareipour, H. Six Days Ahead Forecasting of Energy Production of Small Behind-the-Meter Solar Sites. Energies 2023, 16, 1533. [Google Scholar] [CrossRef]
- Parveen, N.; Ansari, S.A.; Ansari, M.Z.; Ansari, M.O. Manganese oxide as an effective electrode material for energy storage: A review. Environ. Chem. Lett. 2022, 20, 283–309. [Google Scholar] [CrossRef]
- Rahman, A.; Rashid, M.; Mohiuddin, A.K.M.; Hawlader, M.N.A. Nano-Battery Technology for Ev-Hev Panel: A Pioneering Study. IIUM Eng. J. 2015, 16, 57–68. [Google Scholar] [CrossRef]
- Chen, H.; Lu, F.; Guo, F. Power management system design for small size solar-electric vehicle. In Proceedings of the 7th International Power Electronics and Motion Control Conference, Harbin, China, 2–5 June 2012; pp. 2658–2662. [Google Scholar] [CrossRef]
- Li, Z.; Khajepour, A.; Song, J. A comprehensive review of the key technologies for pure electric vehicles. Energy 2019, 182, 824–839. [Google Scholar] [CrossRef]
- Ganji, B.; Kouzani, A.Z. A study on look-ahead control and energy management strategies in hybrid electric vehicles. In Proceedings of the IEEE ICCA 2010, Xiamen, China, 9–11 June 2010; pp. 388–392. [Google Scholar] [CrossRef]
- Shah, R.M.R.A.; Jones, R.P.; Cheng, C.; Picarelli, A.; Aziz, A.R.A.; Al Qubeissi, M. Model-Based Energy Path Analysis of Tip-In Event in a 2WD Vehicle with Range-Extender Electric Powertrain Architecture. Energies 2021, 14, 5696. [Google Scholar] [CrossRef]
- Liu, Z.; Wang, Y.; Feng, J. Vehicle-type strategies for manufacturer’s car sharing. Kybernetes 2022. [Google Scholar] [CrossRef]
- Clement, K.; Haesen, E.; Driesen, J. Coordinated charging of multiple plug-in hybrid electric vehicles in residential distribution grids. In Proceedings of the 2009 IEEE/PES Power Systems Conference and Exposition, Seattle, WA, USA, 15–18 March 2009; pp. 1–7. [Google Scholar] [CrossRef]
- Sawant, S.; Shah, R.M.R.A.; Rahman, M.; Aziz, A.R.A.; Smith, S.; Jumahat, A. System Modelling of an Electric Two-Wheeled Vehicle for Energy Management Optimization Study. Evergreen 2021, 8, 642–650. [Google Scholar] [CrossRef]
- Kötz, R.; Carlen, M. Principles and applications of electrochemical capacitors. Electrochim. Acta 2000, 45, 2483–2498. [Google Scholar] [CrossRef]
- Burke, A. Ultracapacitors: Why, how, and where is the technology. J. Power Sources 2000, 91, 37–50. [Google Scholar] [CrossRef]
- Geim, A.K.; Novoselov, K.S. The rise of graphene. Nat. Mater. 2007, 6, 183–191. [Google Scholar] [CrossRef]
- McDonough, J.R.; Choi, J.W.; Yang, Y.; La Mantia, F.; Zhang, Y.; Cui, Y. Carbon nanofiber supercapacitors with large areal capacitances. Appl. Phys. Lett. 2009, 95, 243109. [Google Scholar] [CrossRef]
- Xu, N.; Riley, J. Nonlinear analysis of a classical system: The double-layer capacitor. Electrochem. Commun. 2011, 13, 1077–1081. [Google Scholar] [CrossRef]
- Gow, J.; Manning, C. Development of a photovoltaic array model for use in power-electronics simulation studies. IEE Proc. -Electr. Power Appl. 1999, 146, 193. [Google Scholar] [CrossRef]
- Huang, B.; Deng, H.-X.; Lee, H.; Yoon, M.; Sumpter, B.G.; Liu, F.; Smith, S.C.; Wei, S.-H. Exceptional Optoelectronic Properties of Hydrogenated Bilayer Silicene. Phys. Rev. X 2014, 4, 021029. [Google Scholar] [CrossRef]
- Andersen, T.R.; Dam, H.F.; Hösel, M.; Helgesen, M.; Carlé, J.E.; Larsen-Olsen, T.T.; Gevorgyan, S.A.; Andreasen, J.W.; Adams, J.; Li, N.; et al. Scalable, ambient atmosphere roll-to-roll manufacture of encapsulated large area, flexible organic tandem solar cell modules. Energy Environ. Sci. 2014, 7, 2925. [Google Scholar] [CrossRef]
- Bagher, A.M. Comparison of Organic Solar Cells and Inorganic Solar Cells. Int. J. Renew. Sustain. Energy 2014, 3, 53. [Google Scholar] [CrossRef]
- Singh, U.; Rizwan, M. Analysis of Fuzzy Logic, ANN and ANFIS based Models for the Forecasting of Wind Power. In Proceedings of the 2018 2nd IEEE International Conference on Power Electronics, Intelligent Control and Energy Systems (ICPEICES), Delhi, India, 22–24 October 2018; pp. 1–7. [Google Scholar] [CrossRef]
- Yang, G.R.; Wang, X.-J. Artificial Neural Networks for Neuroscientists: A Primer. Neuron 2020, 107, 1048–1070. [Google Scholar] [CrossRef]
- Jang, J.-S.R. ANFIS: Adaptive-network-based fuzzy inference system. IEEE Trans. Syst. Man Cybern. 1993, 23, 665–685. [Google Scholar] [CrossRef]


| Attributes | Organic PV | Inorganic PV |
|---|---|---|
| Life cycle | 10,000 h | 10 years |
| Efficiency | ~10% | ~25% |
| Cost impact | low | high |
| Transparency | transparent | opaque |
| Integration | easy | difficult |
| Flexibility | flexible | solid |
| Weight | very light | heavy |
| Input Parameter | Output | |
|---|---|---|
| Temperature (°C) | Irradiance (W/m2) | Psolar (W) |
| 25 | 1000 | 957.1 |
| 25 | 800 | 729.1 |
| 25 | 600 | 584.1 |
| 25 | 400 | 388.4 |
| 25 | 200 | 180.8 |
| Input Parameters | Output | |
|---|---|---|
| Irradiance (W/m2) | Load (W) | Pbatt (W) |
| 1000 | 500 | −375.6 |
| 1000 | 400 | −453.4 |
| 1000 | 300 | −525.4 |
| 1000 | 200 | −610.8 |
| 1000 | 100 | −705.3 |
| Irradiance (W/m2) | Experimental (i) (W) | Simulink Model (ii) (W) | ANFIS Model (iii) (W) | Errors (%) | |
|---|---|---|---|---|---|
| (i) vs. (ii) | (i) vs. (iii) | ||||
| 1000 | 959.976 | 957.1 | 972.3 | 0.271 | 1.296 |
| Mathematical Model (i) (W) | Simulink Model (ii) (W) | ANFIS Model (iii) (W) | Errors (%) | ||
|---|---|---|---|---|---|
| (i) vs. (ii) | (i) vs. (iii) | ||||
| Irradiance (W/m2) | |||||
| 1000 | 976 | 957.1 | 972.3 | 5.83% | 1.72% |
| 600 | 584 | 584.5 | 594.1 | ||
| 200 | 192 | 180.8 | 182.6 | ||
| Load (W) | |||||
| 500 | −397.17 | −375.6 | −377.1 | 6.85% | 1.35% |
| 300 | −564.03 | −525.4 | −532.6 | ||
| 100 | −730.85 | −705.3 | −703.4 | ||
| PI Controller | Transfer Function |
|---|---|
| Solar reference | Kp = 1.45, Ki = 3099 |
| Battery signal | Kp = 4.5, Ki = 60 |
| Supercapacitor signal | Kp = 0.5, Ki = 15,000 |
| Switching frequency | 15 kHz |
| Switching Frequency | Values (at 5 kHz) |
|---|---|
| Converter inductance | 0.352 mH |
| Converter capacitance | 2200 µF |
| Converter resistance | 50 mOhm |
| Diode resistance | 0.1 mOhm |
| IGBT resistance | 1 mOhm |
| Battery_Current | ||||||
|---|---|---|---|---|---|---|
| HC | LC | Z | LD | HD | ||
| Ref_current | VH | (−0.5~0.5) R:1 | (0~1) R:2 | (0~1) R:3 | (0.5~1) R:4 | (0.5~1) R;5 |
| H | (−1~0) R:6 | (−0.5~0.5) R: 7 | (0~1) R:8 | (0~1) R:9 | (0.5~1) R:10 | |
| Z | (−1~0) R:11 | (−1~0) R:12 | (−0.5~0.5) R:13 | (0~1) R:14 | (0~1) R:15 | |
| L | (−1~−0.5) R:16 | (−1~0) R:17 | (−1~0) R:18 | (−0.5~0.5) R:19 | (0~1) R:20 | |
| VL | (−1~−0.5) R:21 | (−1~−0.5) R:22 | (−1~0) R:23 | (−1~0) R:24 | (−0.5~0.5) R:25 | |
| Rate of Error (∆e) | ||||||
|---|---|---|---|---|---|---|
| HC | LC | Z | LD | HD | ||
| Error (e) | VH | (−0.5~0.5) R:1 | (0~1) R:2 | (0~1) R:3 | (0.5~1) R:4 | (0.5~1) R:5 |
| H | (−1~0) R:6 | (−0.5~0.5) R:7 | (0~1) R:8 | (0~1) R:9 | (0.5~1) R:10 | |
| Z | (−1~0) R:11 | (−1~0) R:12 | (−0.5~0.5) R:13 | (0~1) R:14 | (0~1) R:15 | |
| L | (−1~−0.5) R:16 | (−1~0) R:17 | (−1~0) R:18 | (−0.5~0.5) R:19 | (0~1) R:20 | |
| VL | (−1~−0.5) R:21 | (−1~−0.5) R:22 | (−1~0) R:23 | (−1~0) R:24 | (−0.5~0.5) R:25 | |
| OSSC | ANFIS | PID | FLC | % of ANFIS Over | ||
|---|---|---|---|---|---|---|
| PID | FLC | |||||
| Current | Maximum (A) | 45 | 38 | 32 | 16 | 29 |
| Stabilised (A) | 45 | 10 | 27 | 77 | 40 | |
| Overshoot (ms) | 0.03 | 0.07 | 0.03 | 133 | 0 | |
| Temperature (°C) | Irradiance (W/m2) | Power (W) | Current (A) | ||
|---|---|---|---|---|---|
| FLC | ANFIS | FLC | ANFIS | ||
| 25 | 1000 | 450.5 | 560.1 | 36 | 45 |
| 25 | 800 | 424.94 | 430.2 | 33.9 | 36.81 |
| 25 | 600 | 342.07 | 345.49 | 27.4 | 27.63 |
| 25 | 400 | 230.48 | 234.69 | 18.43 | 18.72 |
| 25 | 200 | 105.71 | 107.93 | 8.46 | 8.63 |
| AC (%) | Voltage (Voc) | Capacitance C (µF/cm2) | Current Density Jsc (A/cm2) | Power Density Pms (KW/kg) | Energy Density Ems (W·h/kg) |
|---|---|---|---|---|---|
| 6 | 2.414 | 13.356 | 2.234 | 18.691 | 5.198 |
| 10 | 2.649 | 16.356 | 3.013 | 27.747 | 7.707 |
| 15 | 2.438 | 20.156 | 3.584 | 31.859 | 8.85 |
| 20 | 2.154 | 11.27 | 1.312 | 5.863 | 1.623 |
Disclaimer/Publisher’s Note: The statements, opinions and data contained in all publications are solely those of the individual author(s) and contributor(s) and not of MDPI and/or the editor(s). MDPI and/or the editor(s) disclaim responsibility for any injury to people or property resulting from any ideas, methods, instructions or products referred to in the content. |
© 2023 by the authors. Licensee MDPI, Basel, Switzerland. This article is an open access article distributed under the terms and conditions of the Creative Commons Attribution (CC BY) license (https://creativecommons.org/licenses/by/4.0/).
Share and Cite
Rahman, A.; Myo Aung, K.; Ihsan, S.; Raja Ahsan Shah, R.M.; Al Qubeissi, M.; T. Aljarrah, M. Solar Energy Dependent Supercapacitor System with ANFIS Controller for Auxiliary Load of Electric Vehicles. Energies 2023, 16, 2690. https://doi.org/10.3390/en16062690
Rahman A, Myo Aung K, Ihsan S, Raja Ahsan Shah RM, Al Qubeissi M, T. Aljarrah M. Solar Energy Dependent Supercapacitor System with ANFIS Controller for Auxiliary Load of Electric Vehicles. Energies. 2023; 16(6):2690. https://doi.org/10.3390/en16062690
Chicago/Turabian StyleRahman, Ataur, Kyaw Myo Aung, Sany Ihsan, Raja Mazuir Raja Ahsan Shah, Mansour Al Qubeissi, and Mohannad T. Aljarrah. 2023. "Solar Energy Dependent Supercapacitor System with ANFIS Controller for Auxiliary Load of Electric Vehicles" Energies 16, no. 6: 2690. https://doi.org/10.3390/en16062690
APA StyleRahman, A., Myo Aung, K., Ihsan, S., Raja Ahsan Shah, R. M., Al Qubeissi, M., & T. Aljarrah, M. (2023). Solar Energy Dependent Supercapacitor System with ANFIS Controller for Auxiliary Load of Electric Vehicles. Energies, 16(6), 2690. https://doi.org/10.3390/en16062690