Article

Enhanced Performance of Combined Photovoltaic–Thermoelectric Generator and Heat Sink Panels with a Dual-Axis Tracking System

by
Bagus Radiant Utomo
1,2,
Amin Sulistyanto
2,
Tri Widodo Besar Riyadi
2 and
Agung Tri Wijayanta
1,3,*
1
Research Group of Sustanable Thermofluids, Universitas Sebelas Maret, Jl. Ir. Sutami 36A, Kentingan, Surakarta 57126, Indonesia
2
Department of Mechanical Engineering, Faculty of Engineering, Universitas Muhammadiyah Surakarta, Jl. A. Yani Tromol Pos 1 Pabelan, Kartasura, Surakarta 57102, Indonesia
3
Department of Mechanical Engineering, Faculty of Engineering, Universitas Sebelas Maret, Jl. Ir. Sutarmi 36A, Kentingan, Surakarta 57126, Indonesia
*
Author to whom correspondence should be addressed.
Energies 2023, 16(6), 2658; https://doi.org/10.3390/en16062658
Submission received: 16 January 2023 / Revised: 6 March 2023 / Accepted: 10 March 2023 / Published: 12 March 2023

Abstract

:
The photovoltaic panel has become the most promising alternative technology for energy demand. Solar trackers have been used to improve the efficiency of a photovoltaic panel to maximize the sun’s exposure. In high temperatures, however, the photovoltaic efficiency is significantly reduced. This study observes photovoltaic/thermoelectric generator performance driven by a dual-axis solar tracking system. A photovoltaic/thermoelectric generator panel was built and equipped with angle and radiation sensors. A microcontroller processes the sensor signal and drives the motor to follow the sun’s movement in two-axis directions. Thermocouples are mounted on the photovoltaic and thermoelectric generator surfaces to monitor the temperature. The result shows that the temperature of the photovoltaic/thermoelectric generator is lower than that of the photovoltaic one. However, a contradiction occurred in the output power. The efficiency of the combined photovoltaic/thermoelectric generator was 13.99%, which is higher than the photovoltaic panel at 10.64% and the thermoelectric generator at 0.2%. The lower temperature in the photovoltaic/thermoelectric generator is responsible for increasing its performance. Although the thermoelectric generator contributes modest efficiency, its role in reducing the temperature is essential. Analyses of some cooling techniques for photovoltaic panels prove that the combined thermoelectric generator and heat sink improves photovoltaic performance with simplified technology.

1. Introduction

Over the last decades, solar energy has emerged as a promising energy source technology to partially address the growing global energy demand and environmental concerns of fossil fuel power generation [1]. Solar energy as renewable energy is an effective way to solve energy problems [2,3]. The amount of energy Earth receives from the sun is almost 1.8 × 10¹¹ MW, which is one thousand times higher than the overall energy consumption of all energy sources [4]. The photovoltaic panel is the most popular technology to directly convert solar radiation into electricity [5,6,7]. However, the overall efficiency of conventional photovoltaic (PV) technology can convert solar energy into electricity by approximately 17–18% [8,9]. Single-axis and dual-axis solar tracking systems have been used to increase the efficiency of solar energy extraction by optimizing the operation of photovoltaic panels [10]. Fathabadi [11] reported the effect of using fixed and dual-axis solar trackers on PV performance. Experiments conducted on the KC200GT-type photovoltaic panel show that using a dual-axis tracker produces higher electrical power and solar energy absorption of 24.59%.
Combining photovoltaic panels and thermoelectric generators (TEGs) has also increased solar energy utilization efficiency [12,13]. The thermoelectric generator changes the temperature difference on both sides to produce electricity [14,15]. The advantages of a thermoelectric generator are that it is free from gas emissions, has broad application capabilities, is free from maintenance operations, has clean energy production, has a long life, and has high reliability [16]. Sark [17] studied a combination of photovoltaic panels with a roof-integrated thermoelectric generator. The thermoelectric generator module used has a figure of merit of 0.004 K−1 at a temperature of 300 K. The addition of a thermoelectric generator module to a photovoltaic panel produces an efficiency of between 8% and 23%. Ahsan et al. [18] used a polycrystalline photovoltaic panel and a thermoelectric generator Bi2Te3 type SP1848-27145 which produced 10.81 W of power, compared to a photovoltaic panel only without a TEG, which produced power of 8.78 W. Adding a thermoelectric generator to the photovoltaic panel also increases the efficiency by 2.4%.
Although a TEG system can convert heat into electrical energy, it can affect photovoltaic conversion efficiency. Each one-degree increase in the photovoltaic surface temperature will reduce PV efficiency by 0.2–0.5% [19,20]. Therefore, the photovoltaic cooling technique is essential in overcoming the increasing temperature effect [21,22,23]. Three groups of photovoltaic cooling technology include passive cooling, which does not require extra energy; active cooling, which requires additional energy consumption; and combined active and passive cooling [24]. The last technique is the most effective method of maintaining photovoltaic efficiency [25]. Sutanto et al. [26] reported the effect of the cooling ratio on the performance of photovoltaic panels. Experiments use a 50 Wp polycrystalline photovoltaic panel at an optimal angle of 25.5°, using a ground surface, floating, and thermosiphon-floating–cooling media. The result showed that photovoltaic performance with floating–cooling experienced a power increase of 4.52% and an efficiency increase of 4.53% compared to the implementation of photovoltaics at ground level. The performance of photovoltaic panels with thermosiphon-floating coolers experienced a power increase of 7.86% and increased efficiency of 7.76% compared to photovoltaic performance with floating coolers. Grubišić-Čabo et al. [27] analyzed a passive air-based photovoltaic cooling technique. Experiments were carried out on dual-photovoltaics of 260 Wp to produce 520 Wp, which use an aluminum fin cooler on the back of the photovoltaic panel. The results show that using aluminum fin coolers reduces the photovoltaic panels’ surface temperature and increases the power output by 5%. Kidegho et al. [28] investigated a 13 Wp polycrystalline photovoltaic combined with a clamped thermoelectric generator with a pressure of 4.8 kPa, using air and water as the thermoelectric generator cooling system. The result showed that using a hybrid photovoltaic/thermoelectric generator with air cooling produced an additional power of 19.7%. In comparison, a combined photovoltaic/thermoelectric generator (PV-TEG) with water cooling produced extra power of 24.85%.
Based on a study in the literature on increasing photovoltaic efficiency via different cooling methods, the application of a thermoelectric generator and a heat sink as a passive cooling system in a photovoltaic panel with a dual-axis tracking system has yet to be found. Because the role of cooling is crucial for increasing efficiency, it is necessary to develop a cooling method for hybrid solar panels with a solar tracker. This study aimed to investigate the effect of TEG and heat sink on the performance of photovoltaic panels driven by a dual-axis solar tracking system. An experiment apparatus was built to adapt the TEG attachment, tracking system, and data observation. Calculations were made on efficiency. The theoretical consideration section presents the working principle of photovoltaic and thermoelectric generators. The experimental methods describe the development of panel manufacturing, including the experimental procedure, tool calibration, and uncertainty analysis of the measured data. The result section reports the data obtained via observation and the calculation. The results of this study are expected to increase the understanding of the cooling system in solar panel design using a solar tracker to extract more solar energy in a combined PV-TEG and heat sink. Table 1 shows the power and efficiency of some PV systems.

2. Theoretical Consideration

2.1. Photovoltaic Panels

A photovoltaic panel is essential in solar energy generation systems where sunlight is converted directly into electrical energy [29]. French physicist Edmond Becquerel discovered the photovoltaic panel in 1839 and used it for industrial applications in 1954 [30]. Figure 1 shows the working mechanism of a photovoltaic panel. When two semiconductor layers, p-type and n-type, absorb photon energy from the sun, an electric potential occurs between the semiconductor layers. The electrons will be free to cross the junction and jump to the p-type semiconductor leaving a static positive charge. At the same time, the holes move across the junction, leaving a static negative charge behind. Free electrons and holes will combine and disappear. At a certain level, a depletion zone forms at the p-n junction where migration is no longer possible. Separating positive static and negative charges creates an electric field across the depletion zone. The generation of an electric field provides the force or voltage needed to move current through an external circuit.

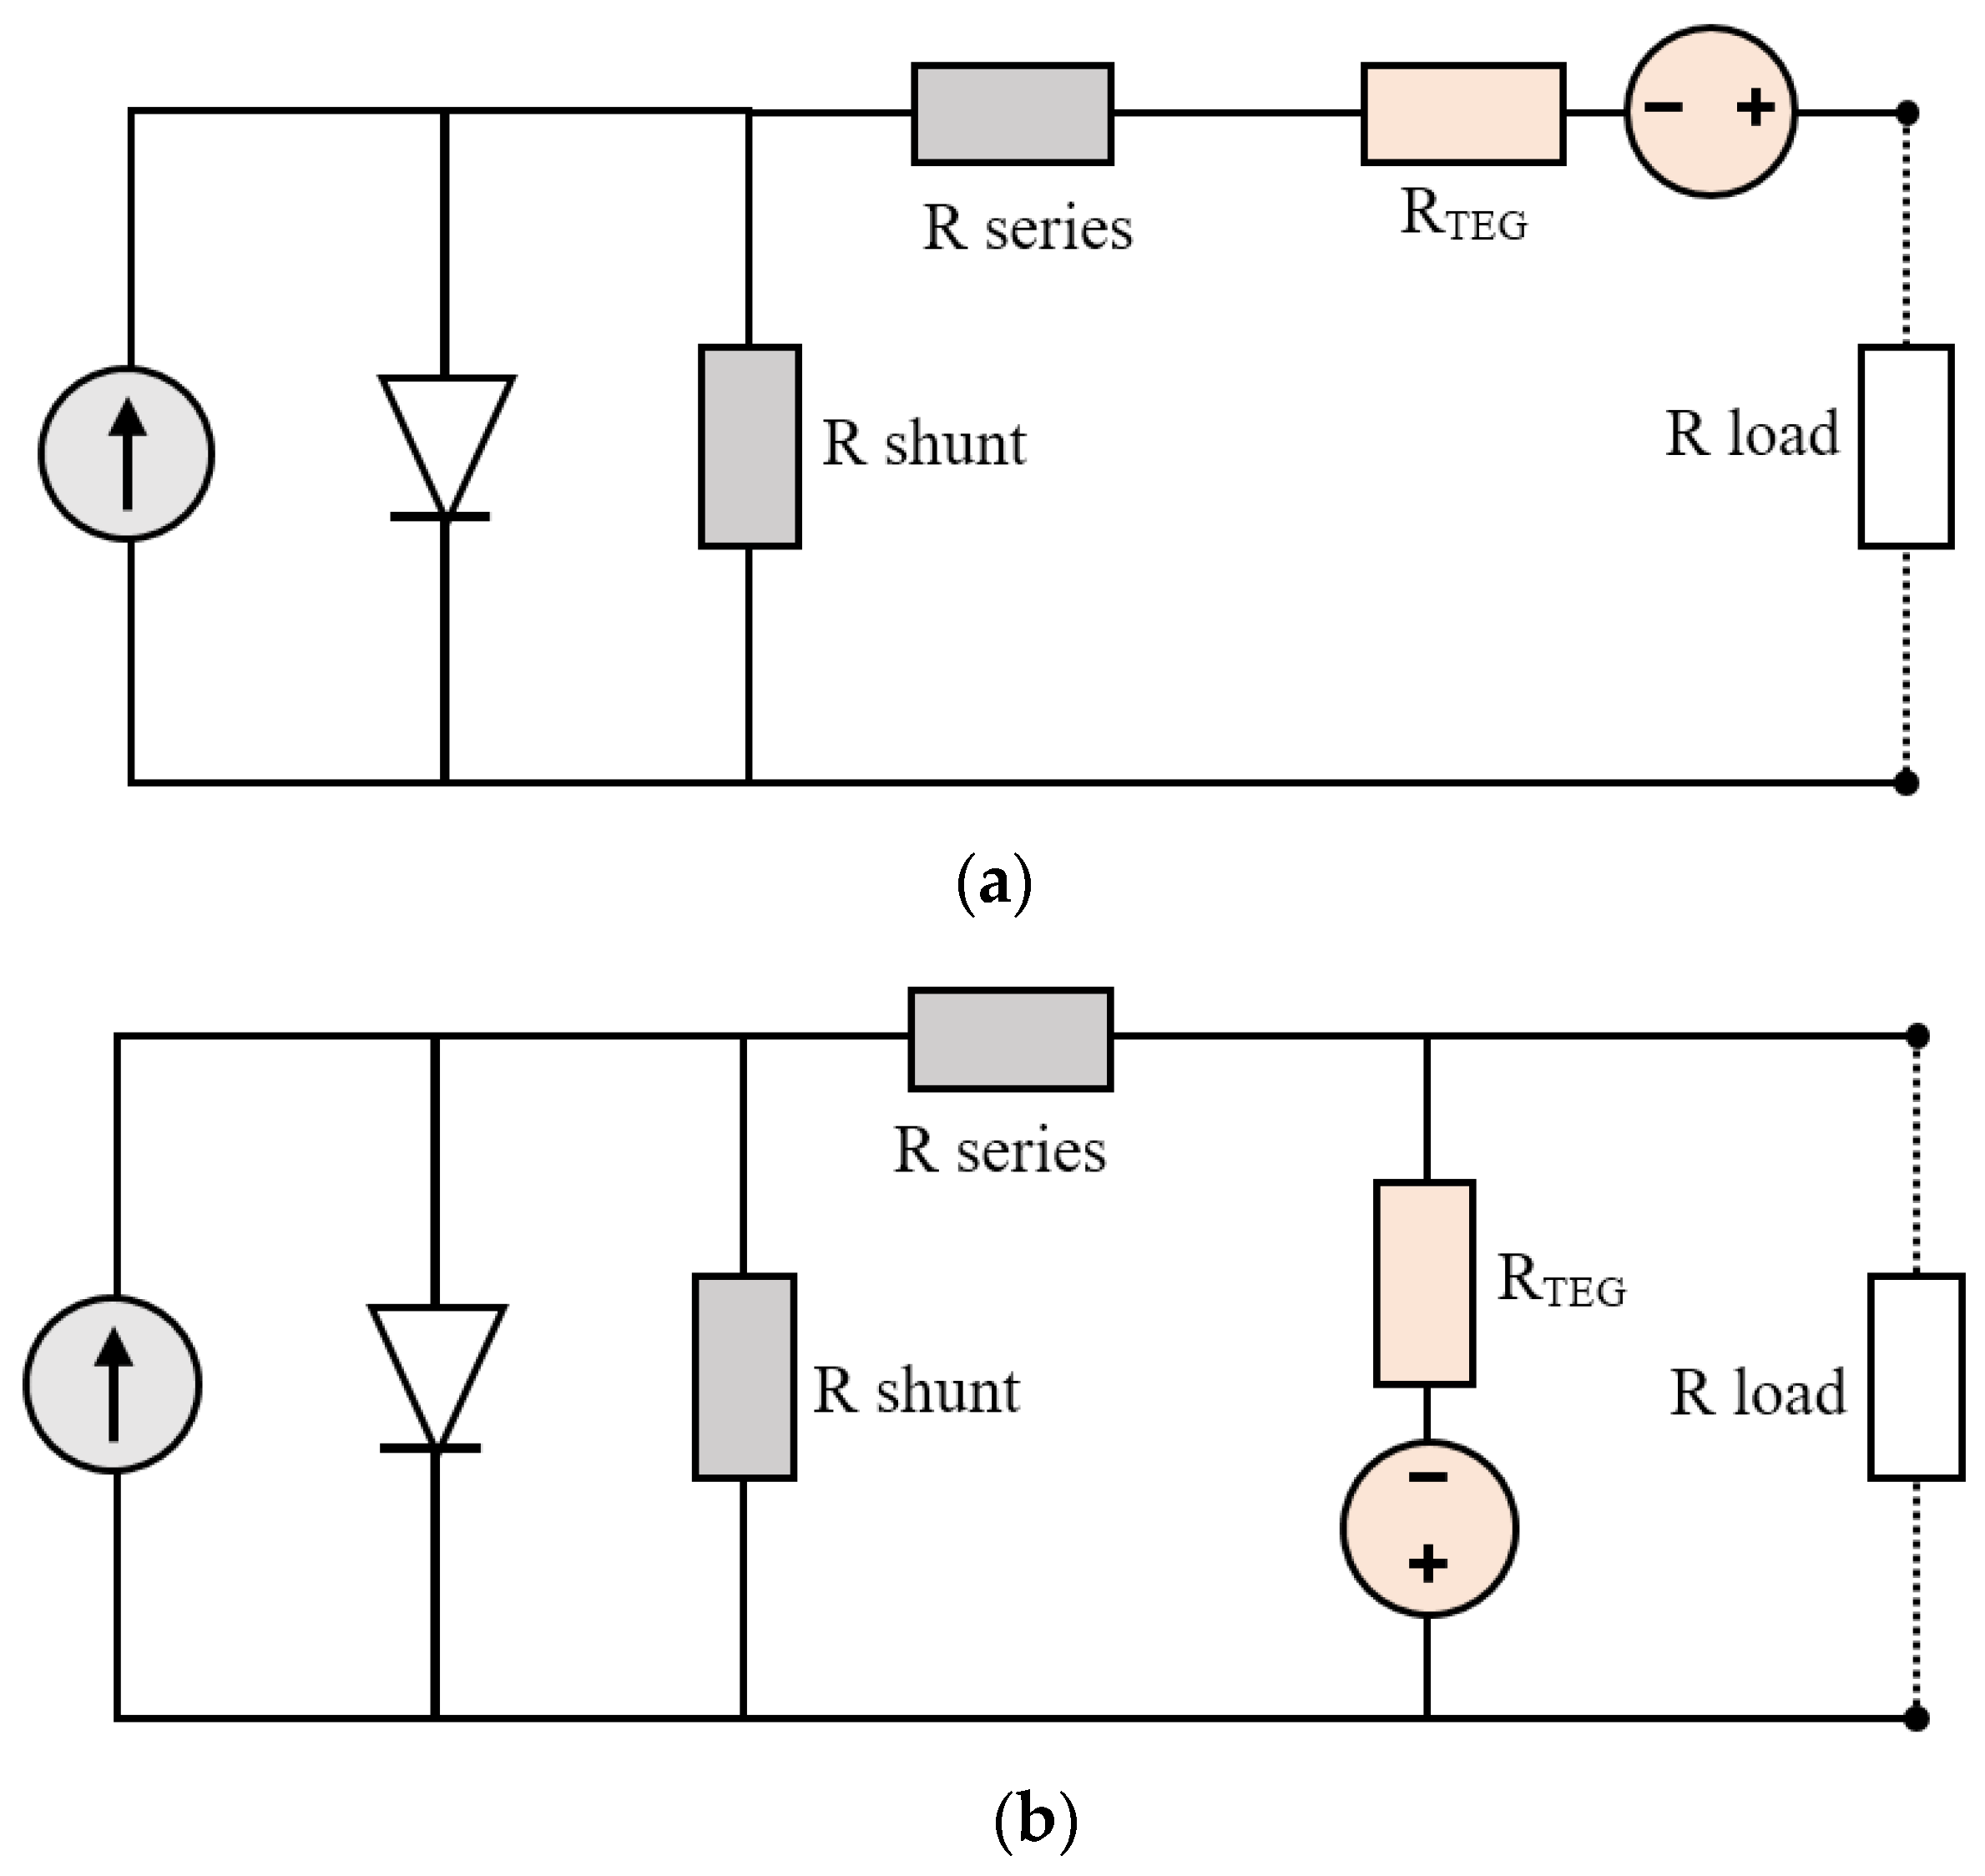
2.2. Combined Photovoltaic/Thermoelectric Generator Panels

Increasing the efficiency of the thermoelectric generator must be a significant concern to maximize the hybrid photovoltaic/thermoelectric generator (PV-TEG) system. Therefore, evaluating the heat flow and temperature distribution across the thermoelectric generator is necessary. The schematic diagram of a combined PV-TEG system is shown in Figure 2 [32]. The transport of solar energy is assumed to be one dimension only, perpendicular to the PV surface. Consequently, the energy transport in the transverse direction is ignored. Solar radiation is directed at the surface of a photovoltaic panel. Solar radiation transmits the glass enclosure with τ g transmission and is absorbed by αs absorbance and effective thermal emittance ε. The solar radiation received by the photovoltaic panels is converted into electricity, and the heat energy is absorbed and transmitted to the hot side of the thermoelectric generator module. Some of the heat energy is lost to the surrounding environment.
The heat flowing to the hot side of the thermoelectric generator is the sum of contributions from the Seebeck effect, Fourier conduction, and Joule heating without consideration for heat loss, as defined by Equation (1) [32].
Q h = N s   ( α T h I + T h T c R t e I 2 R e 2 )
where α is the Seebeck coefficient of the thermoelectric generator, Ns is the number of semiconductor pairs, and I is the electric current flowing in the TEG module. Rte and Re are the thermal and electrical resistance of the thermoelectric (TE) semiconductor couple, respectively, which can be determined by Equations (2) and (3) [32,33].
R te = L λ A T E
R e = ρ L A T E
where ATE and L represent the cross-sectional area and length of the TEG semiconductor, respectively. λ and ρ are the thermal and electrical conductivity of the TEG semiconductor. The total heat at the cold side of the TEG module is formulated using Equations (4) and (5) [32].
Q c = N α T c I + T h T c R t e I 2 R e 2
Q c = T c T h e a t s i n k R c
where Rc is the total thermal resistance of the interface and the substrate on the TEG cold side. The heat dissipated by the heat sink is defined by Equation (6) [32].
Q c = T c T a R h s
where Rhs is the thermal resistance of the heat sink, which is related to the air convection coefficient, area, and shape of the heat sink.
The energy generated by the TEG depends on the temperature difference between the hot and cold sides of the TEG. The efficiency of a thermoelectric generator can be defined as the ratio of the electrical energy generated by TEG, symbolized as PTEG, to the thermal energy Qh entering the surface of the hot side of the thermoelectric generator. Considering the temperature dependence of the TEG property, the TEG efficiency calculation is carried out by first determining the figure of merit (ZT). The Harman method can be used to determine ZT. This method is conducted by applying a direct current to the terminals of a thermoelectric circuit over a period of time and measuring the voltage across the terminals [33,34,35,36]. The TEG module works as a thermoelectric cooler and starts pumping heat from one side to the other due to the Peltier effect. The temperature difference between the TEG surfaces generates an electricity generator due to the Seebeck effect. When a current flows across the TEG circuit, the voltage caused by the flowing current between the terminals is called the Joule voltage, VJ, and the generated voltage due to the temperature difference induced by the Seebeck effect is called the Seebeck voltage, VS. The voltage difference between VJ and VS. is called the Harman voltage. The figure of merit can be defined by Equation (7) [37,38,39].
ZT = V s V j
The TEG efficiency is calculated by Equation (8) [40].
η TEG = T T h . 1 + Z T 1 1 + Z T + T c T h
where ∆T is the temperature difference between the hot and cold sides, Th is the hot side temperature, Tc is the cold side temperature, and ZT is the temperature-dependent figure of merit.
The equivalent model used to combine the power of the PV and TEG is shown in Figure 3a,b, where both modules can be electrically connected in series or parallel circuits [22]. The total efficiency of the combined PV-TEG system can be calculated based on the power generated by the photovoltaic panel and the thermoelectric generators. Equation (9) expresses the energy the system produces, where the electrical power loss is negligible. Equation (10) is the formula to calculate the electrical efficiency of a photovoltaic panel which depends on the output of electric power and the amount of solar energy per area unit [41].
P P V - T E G = P P V + P T E G
η P V - T E G = P P V - T E G A . G
where Ppv and PTEG are the output power of the photovoltaic module and thermoelectric generator, respectively. A is the area of the PV cell. G is the input energy of solar irradiation on the surface above the photovoltaic module per area unit [18].

3. Experimental Methods

3.1. Photovoltaic/Thermoelectric Generator Panels

The equipment of the PV-TEG panels with a dual-axis tracking system used for the experiment is shown in Figure 4. The main component of the panel consists of two photovoltaic modules. One PV module was operated without any cooling systems; the second was operated by a thermoelectric generator module and an aluminum heat sink with a dimension of 40 × 40 × 11 mm. A thermal paste was inserted between the thermoelectric generator and the heat sink to increase heat absorption. The paste thickness was 0.5 mm, and its thermal conductivity was 1.2–2.0 W/m.K. This work used an HY1-49 photovoltaic panel made of monocrystalline materials. The parameter specification of the photovoltaic panel is given in Table 2. An SP1848 27145 SA-type thermoelectric generator module, made of Bi2Te3 and containing 220 semiconductor couples, was also used. The parameter specification of the TEG is given in Table 3 [14,42,43]. The TEG module was stacked to the rear surface of the PV module. The TEG was positioned in the middle of the PV area. As the surface area of the TEG area was 40 × 40 mm2 and the PV was 110 × 60 mm2, a part of the PV surface remained uncovered.
An MPU5060 sensor with gyroscope ranges of 250, 500, 1000, and 2000/s and acceleration ranges of 2, 4, 6, 8, and 16 g was utilized for reading angles on the system tracker. The solar radiation received by the photovoltaic panel was measured using a BH1750 light intensity sensor with the specifications in Table 4. Because the BH1750 sensor has a solar radiation output in a unit of lux, it is necessary to convert from illuminance units to spectral irradiance by multiplying the flux by 0.0079 W/m2 per lux to produce the solar radiation in a unit of W/m2 [44]. A K-type thermocouple cable with operating temperatures from –200 to 1250 °C was used to measure the temperature of the photovoltaic surface and the temperature of the TEG hot and cold sides. A MAX6675 temperature sensor with operating temperatures of 0–1024 °C and an accuracy of 0.25 was used to read the temperature signal of the thermocouple cable and this was sent to the Arduino Mega 2560 microcontroller as the data logger.
A MAX471 sensor with a voltage range of 0–25 V and a current range of 0–3 A was used to measure the electrical power output of the photovoltaic/thermoelectric generator system. A Light Dependent Resistor (LDR) was used to detect the sun’s position by reading the light intensity in the form of resistance. The LDR has a bright resistance of 5–10 kOhm and a dark resistance of 0.5 MOhm. Two motors with a torque of 10 kg-cm and a rotational speed of 3.33 m/s were used to drive the panel’s axis to follow the sun’s movement after receiving resistance signals from the LDR. The Arduino UNO microcontroller with 2 kb SRAM, 1 kb EEPROM, and a clock speed of 16 Hz was used as a tracker system microcontroller through the coding commands uploaded to Arduino. The Arduino MEGA 2560 microcontroller with 8 kb SRAM, 4 kb EEPROM, and 16 Hz clock speed was used to control the data logger system through coding commands uploaded to Arduino. In this work, the external load used in the photovoltaic/thermoelectric generator panel was a battery with specifications of 4 V 4 Ah.

3.2. Experimental Procedures

This research was conducted in Indonesia with latitude S 7°34′36.83″ and longitude E 111°25′55.56″. The weather on the day of testing showed clear, cloudless conditions. Figure 5 shows the schematic diagram of the experimental tools consisting of two PV systems. One system was only a PV panel; another was a combined photovoltaic panel, thermoelectric generator, and heat sink. Both PV systems were united in a panel driven by a dual-axis tracking system. The heat sink was made of aluminum, with a dimension of 4 × 4 × 1 mm. The number of the fin in the heat sink was 130. A solar radiation sensor was installed in the photovoltaic panel to measure solar radiation intensity. For temperature measurement, thermocouples were mounted on the surface of both photovoltaic panels, the heat sink, and the TEG hot and cold sides. Three thermocouples were used to measure the temperature on each surface. The result data were averaged. A Light Dependent Resistor (LDR) was placed between the two photovoltaic panels. The tracking control system processed the data signal from the LDR in the form of resistance and sent it to the Arduino microcontroller. Two motors in the vertical and horizontal axes drove the motor according to the specified conditions after receiving the signal from the microcontroller. An angle sensor was mounted on the panel to observe the sun’s position regarding the altitude and azimuth angles. A data logger was used to store the output data, which included the angle, solar radiation, temperature, and power. Data collection was carried out from 05:00 to 18:00 West Indonesia Time.

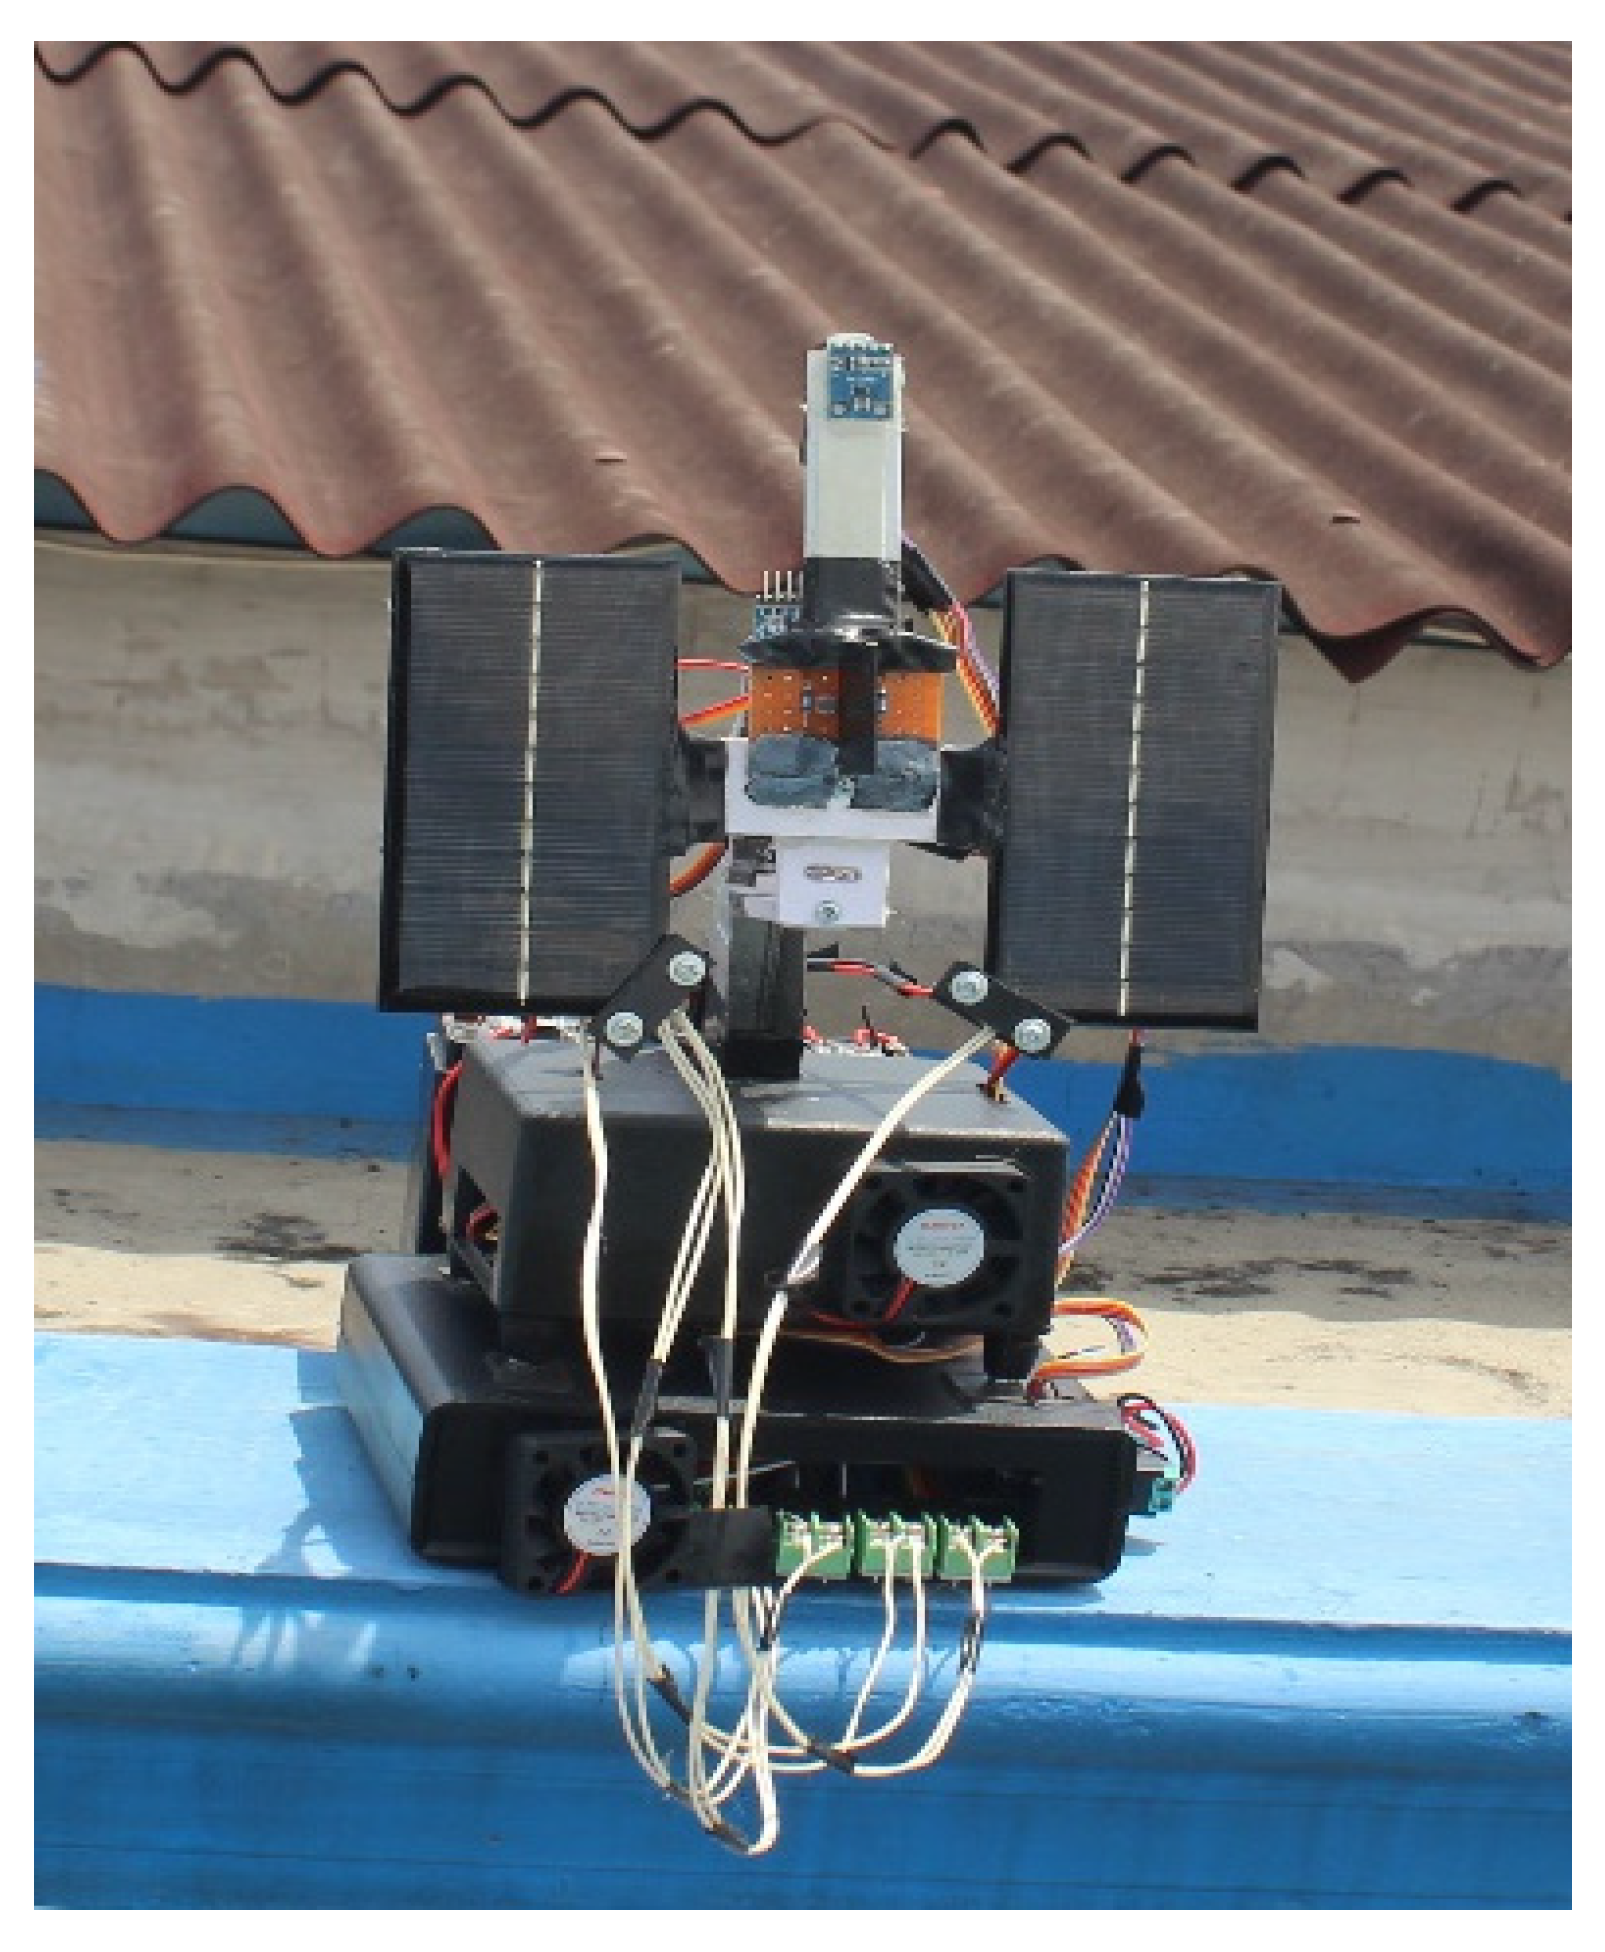
3.3. Solar Tracking Mechanism

This work used a dual-axis tracking system to control the panel movement. The panel was equipped with two couples of Light Dependent Resistors. The LDR east and west were mounted to the vertical axis, whereas the LDR north and south were attached to the horizontal axis. The LDRs captured the sunlight intensity as a resistance signal, and subsequently sent it to the Arduino microcontroller. The microcontroller actuated the motors based on the resistance difference. The vertical axis movement was driven by the resistance difference received by LDR east and LDR west. Similarly, the resistance difference between LDR north and LDR south drove the horizontal axis movement.

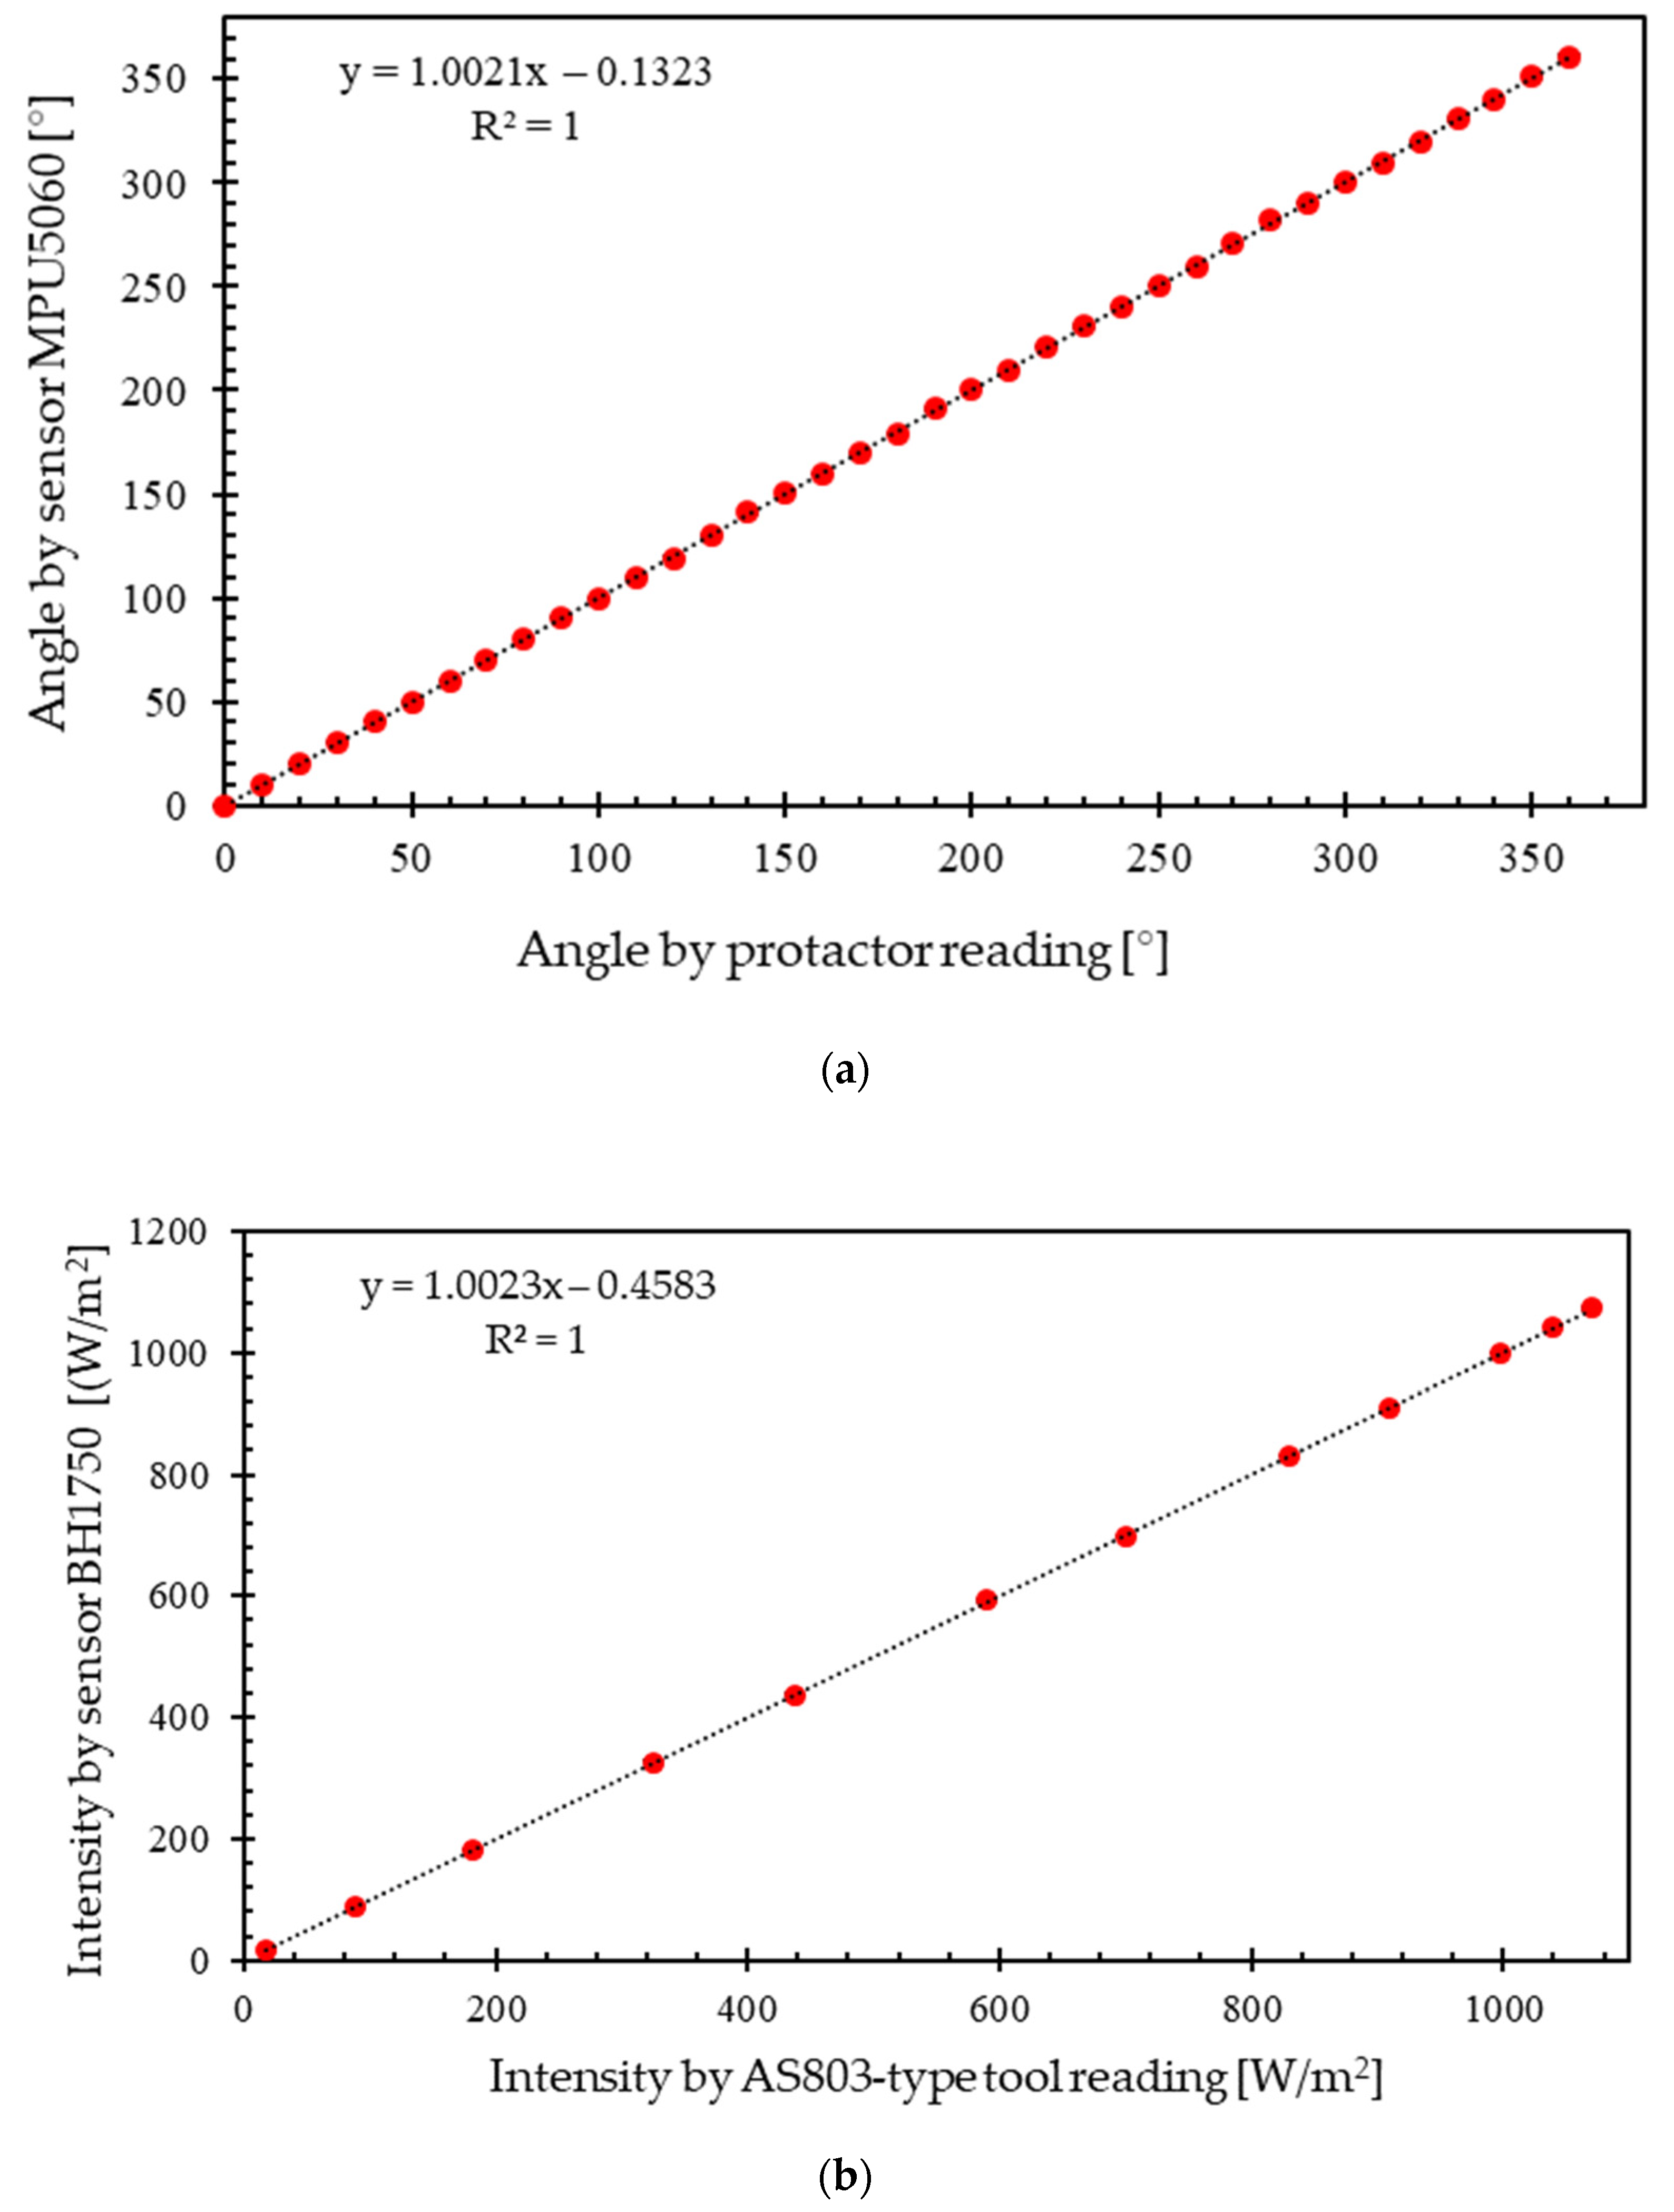
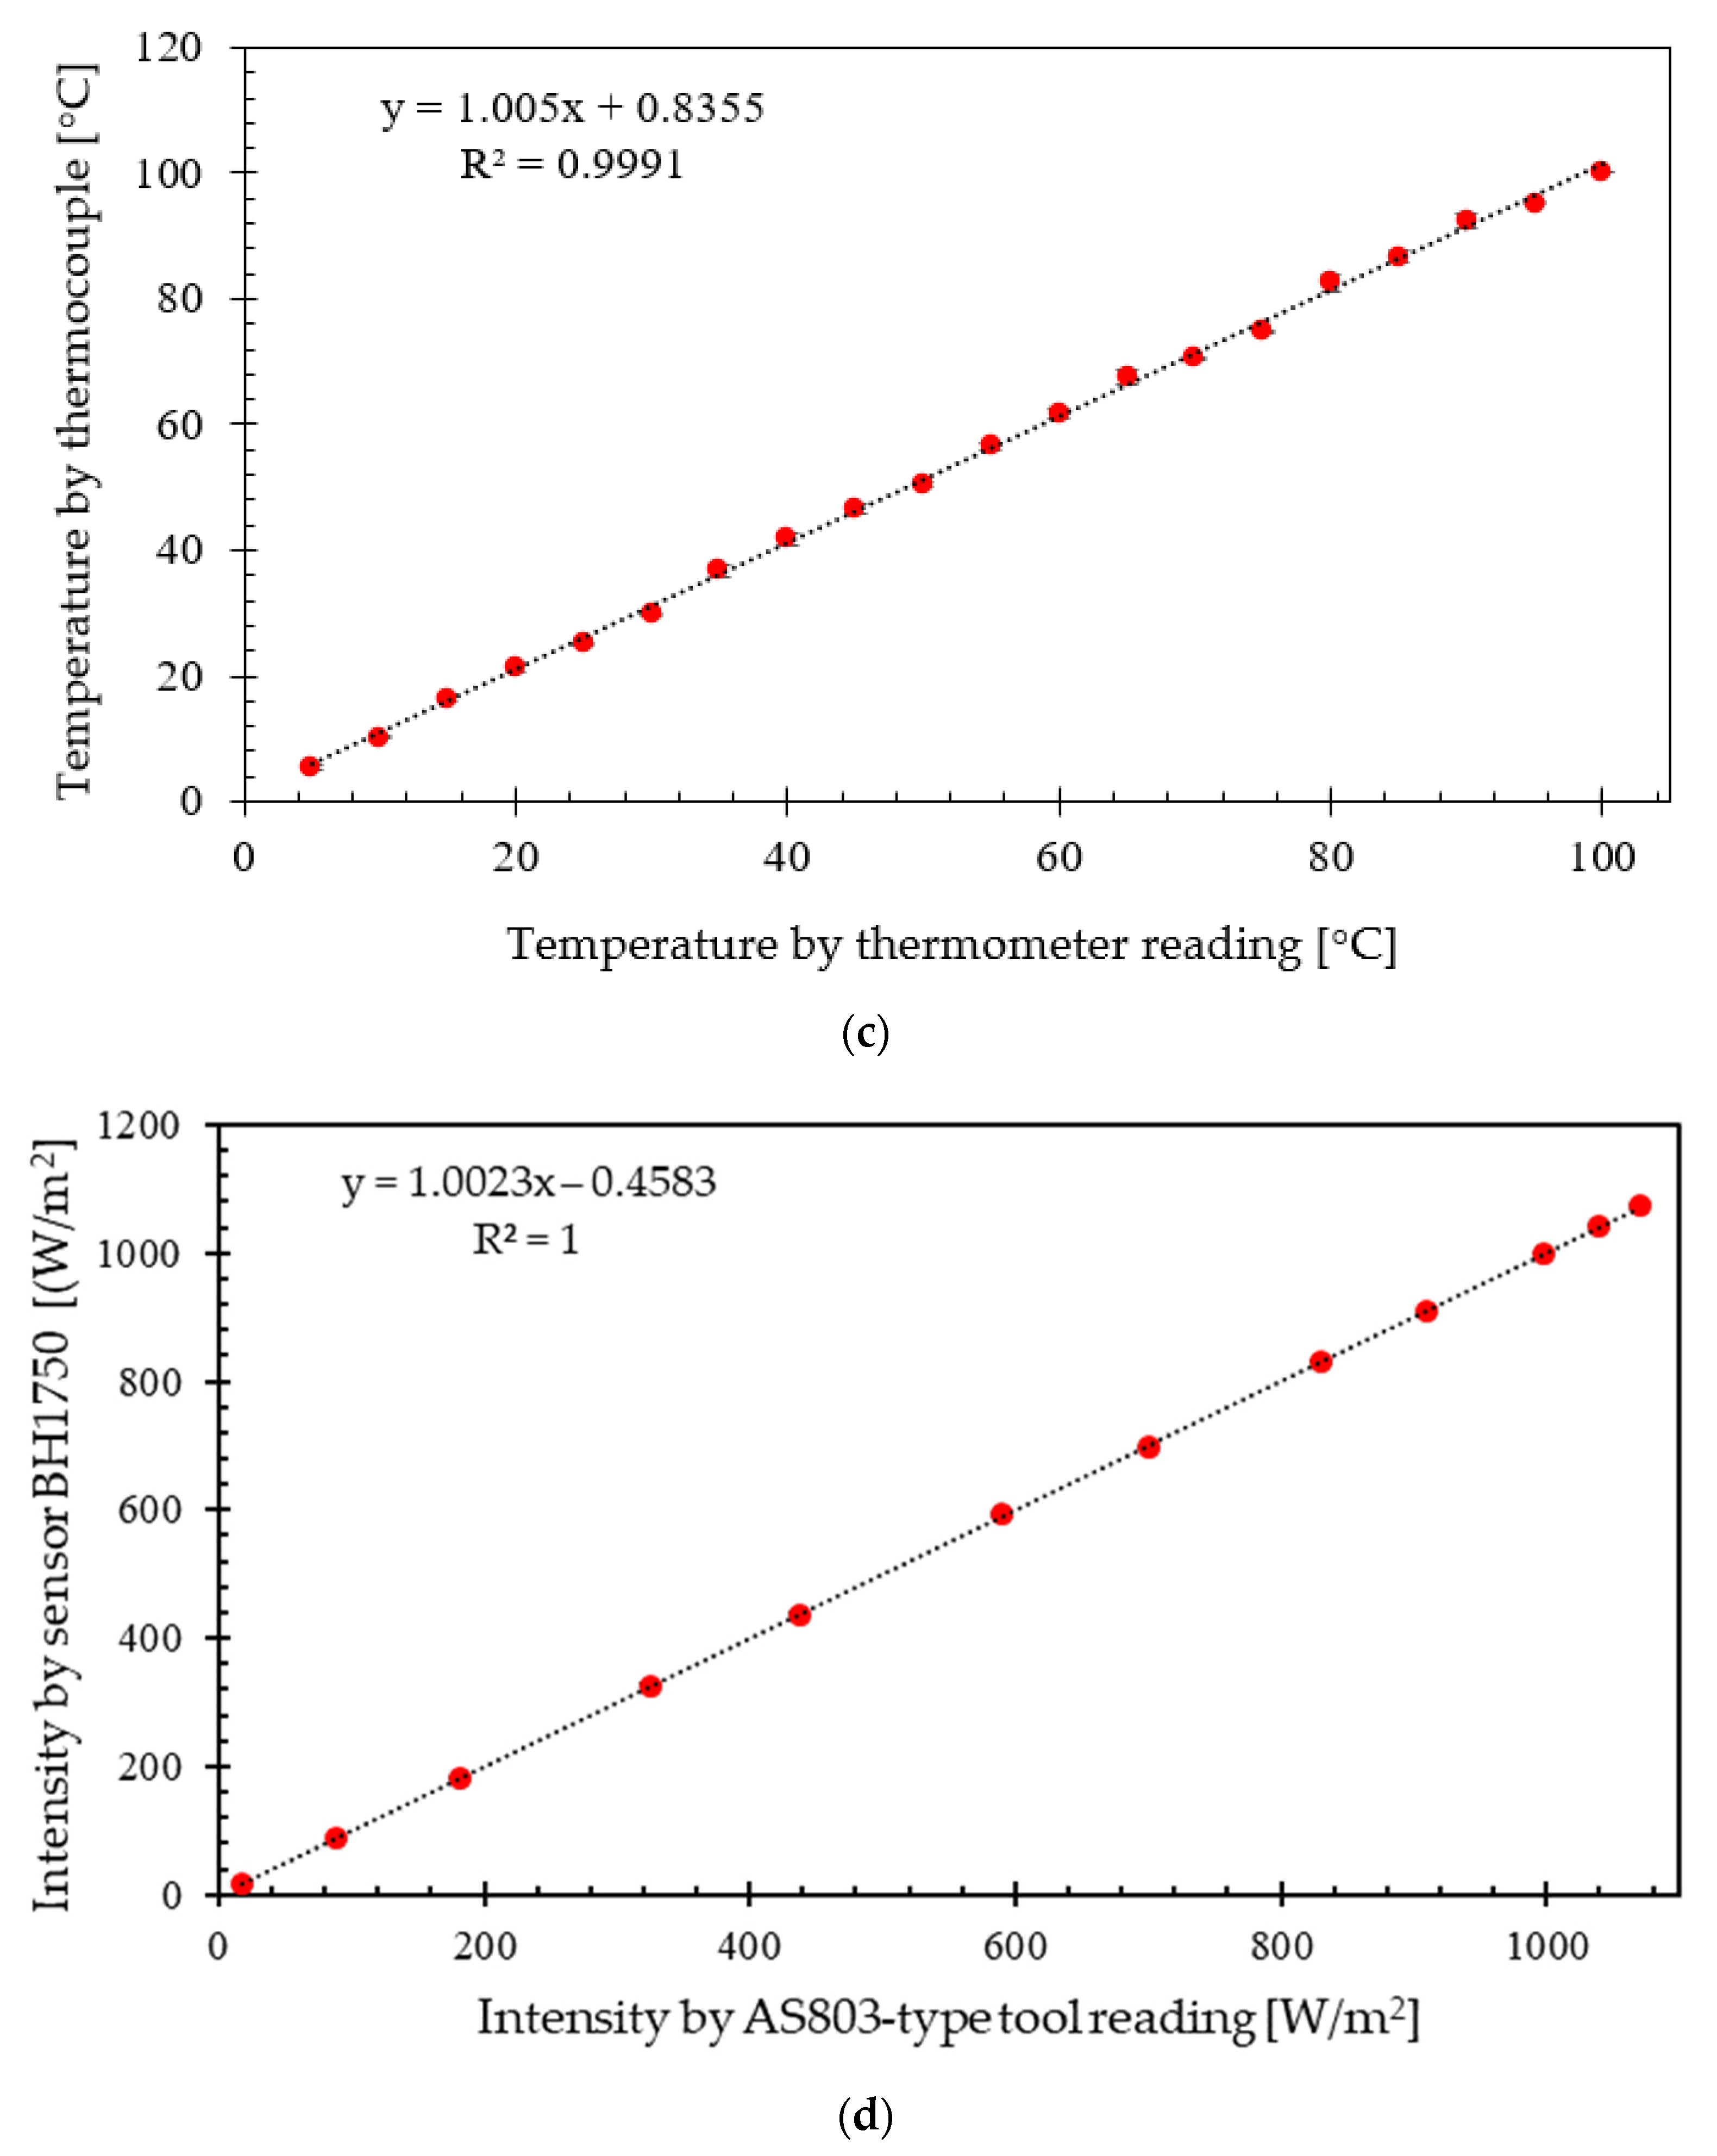
3.4. Tool Calibration

An Arduino-based data logger was built as a microcontroller to read the measured angles, solar radiation, temperature, and electrical output data, which were then stored on a micro-SD. All tools were calibrated before being used for the measurement. The MPU5060 sensor used for measuring the altitude and azimuth angles was calibrated by a protractor of 360°. The result of sensor calibration is shown in Figure 6a. The calibration of the BH1750 sensor used to measure the solar radiation intensity was conducted using AS803-type tools. Figure 6b shows the result of the solar radiation calibration. The temperature calibration of the thermocouple was carried out using a standard thermometer by measuring the temperature of water from cold conditions in the form of ice to boiling conditions. The result of the temperature calibration is shown in Figure 6c. The MAX471 sensor used to measure the electrical output of the PV and PV-TEG systems was calibrated using a WH5000 multimeter. Both tools were connected to a 12VDC 2A lamp charged by the LW-301KDS DC power supply. The result of the power calibration is shown in Figure 6d.

3.5. Uncertainty Analysis

An uncertainty analysis was conducted to support the data analysis using a formula described by Moffat [45]. The uncertainty analysis was calculated to estimate the error of the experimental data. Experimental errors typically exist in the measurement, and the value depends on the tool’s accuracy. If there is an N number of the observed data, their mean denoted using x ¯ is calculated using Equation (11). The symbol i is any integer value from 1 to N. The standard of deviation (SD) representing the level of scatter data about the mean value is given in Equation (12). The uncertainty, which is symbolized using σ m , was determined using the deviation standard of the mean value, as provided in Equation (13). The results of the uncertainty analysis for all tools are given in Table 5.
x ¯ = x 1 + x 2 + x 3 + + x n N = 1 N i = 1 N x i
S D = i = 1 N ( x i x ¯ ) 2 N 1
σ m = i = 1 N ( x i x ¯ ) 2 N ( N 1 ) = S D N

4. Results and Discussion

4.1. Harman Methods

Before conducting the experimental work using the combined PV-TEG panels, it is necessary to identify the figure of merit (ZT) value of the TEG using the Harman method. The test was performed by connecting a thermoelectric generator to an external source with a constant direct current of 10 mA. After reaching a constant voltage output, the power was turned off. The voltage drop was monitored during the thermoelectric generator operation. The result of the Harman test is shown in Figure 7. The voltage curve shows two voltage profiles: the Joule voltage and the Seebeck voltage. The Joule and Seebeck voltages were used to calculate the figure of merit (ZT) using Equation (7). The calculation result indicates that the figure of merit value of the thermoelectric module is 0.407.

4.2. Solar Angles

Figure 8 shows the altitude and azimuth angles obtained via the movement of the dual-axis tracking systems. The altitude and azimuth angle data display the movement of the vertical axis and the horizontal axis following the sun’s movement. For comparison purposes, the angle data obtained from the calculation are added to the figure. The measurement results show that the altitude angle reaches its peak at 12:00, called the zenith point, the perpendicular line to Earth’s surface. The altitude curve demonstrates that the dual-axis tracker panel can move its horizontal axis to follow the sun’s motion according to the altitude angle from the east to the zenith point, and it ends in the west. The azimuth angle increases slowly from 06:00 to approximately 10:00 and then rises sharply until 14:00. From here, the azimuth angle increases gradually to 18:00. The azimuth curve indicates that the horizontal axis of the panel has moved following the sun from the east to the west. The comparison between the altitude and azimuth angles obtained from the experimental and the calculation results shows a difference with a maximum value of 3.51 and 6.4°. The altitude and azimuth angle measurement data in this study agree with the results conducted by Fathabadi [11].

4.3. Solar Irradiation

Figure 9 shows the solar radiation measured using the BH1750 sensor attached to the photovoltaic panel. The data obtained by calculation [47] are included in the figure for comparison purposes. The result shows that solar radiation starts to rise at 05:00 and reaches a peak at 12:00. The solar radiation then decreases to zero at 18:00 as the day darkens. As a comparison, the calculated data show a similar trend to the current experimental result. A slight difference only occurs at the peak of solar radiation. This difference is caused by the input for calculating the elevation angle that does not consider the geographic latitude and longitude angles, causing the sun’s orbit difference. The intensity of solar radiation obtained in this study is in line with research by Das [48] and McCormick et al. [49].

4.4. Temperature Profile

Figure 10 shows the temperature profile measured on the PV and PV-TEG panels, including the surface of the TEG hot and cold sides. The temperature of the heat sink is not displayed in the figure because it is similar to the TEG cold side. The surface temperature of the PV and PV-TEG panels increases at around 05:00 and peaks at 12:00. The temperature then drops to the environment temperature at about 29.30–30.34 °C at 18:00 h. This temperature fluctuates according to the sunlight from its rise until it sets. Comparing the PV temperatures, the temperature of the PV alone is higher than that of the PV-TEG panel. The high magnification image shows that the maximum temperature of PV and PV-TEG is 53.36 °C and 51.65 °C, respectively. The lower temperature in the PV-TEG occurs due to heat absorbed by the TEG module and the heat sink installed under the photovoltaic panel. The temperature of the TEG cold side is much lower than that of the TEG hot side. The maximum temperature of the TEG hot and cold sides is 48.71 °C and 44.49 °C, respectively, which produce a maximum temperature difference of 4.22 °C. The temperature difference between the TEG hot and cold sides produces electrical energy due to the Seebeck effect. The decrease in the photovoltaic surface temperature due to the TEG attachment in this study is similar to that reported by Sharaf et al. [50], Idoko et al. [51], and Khan et al. [18].

4.5. Power Output

Figure 11 shows the power generated by the PV and the PV-TEG panels. The power comparison indicates that the PV-TEG produces a greater power than the PV panel alone. The maximum power on the PV-TEG panel is 1.12 W, whereas the PV panel is 0.81 W. The power difference between the PV and PV-TEG panels is 0.31 W. The thermoelectric generator itself produces maximum power of 0.22 W. This discrepancy proves that the additional power of the PV-TEG panel is not only obtained from the addition of TEG power but also the increased PV power due to the lower temperature. The increasing power due to decreasing temperature has also been reported by Sutanto et al. [26]. In contrast, the expanding power due to the addition of TEG is in line with that observed by Khan et al. [18].

4.6. Efficiency

Figure 12 shows the efficiency of the PV, PV-TEG, and TEG panels. The result shows that the highest efficiency of all systems occurs at 12:00. The total efficiency of the PV-TEG panel is higher than that of either the PV or TEG panels. The average efficiency of the PV, PV-TEG, and TEG panels is 6.77%, 9.67%, and 0.14%, respectively. In comparison, the maximum efficiency of PV-TEG and PV systems is 13.99% and 10.64%, respectively. This result shows that adding TEG increases the PV’s total efficiency. As a comparison, the maximum efficiency of TEG is only 0.2%. The TEG efficiency is low since it is determined by dividing the amount of heat by the amount of electrical energy. Differently, the total PV efficiency is calculated from the light intensity energy and electrical energy ratio. The enhanced efficiency of the PV-TEG, therefore, comes from the addition of power associated with a decreased temperature of the PV. The increased PV efficiency with the addition of TEG in this work is in line with the study by Khan et al. [18], although Khan’s work did not apply a solar tracker.
Table 6 compares the performance of several cooling techniques in photovoltaic systems. Sutanto et al. [26] used a floating–cooling system on the PV surface. The results showed that the floating method could reduce the PV surface temperature by between 2.4 and 29 °C to increase the PV efficiency by 7.76%. Sutanto also uses the thermosiphon-floating–cooling technique to lower the temperature between 3.2 and 34 °C to increase the PV efficiency by 4.53%. Dida et al. [52] used a water-cooling evaporative cooling system. The result showed that the PV temperature decreased by 17.1 °C to increase efficiency by 1.46%. Adipour et al. [53] developed a PV-PCM cooling system to reduce the temperature by 9.1 °C and increase the efficiency by 4.6%. The fin cooling system was developed by Čabo et al. [27]. The PV temperature decreased by 1–2 °C, and the PV efficiency increased by 0.4%. A cooling system with TEG was developed by Babu and Ponnambalam [33] and Khan et al. [18] to reduce the PV surface temperature by 2–3 °C so that the PV efficiency would increase by 1.4–6% depending on the amount of TEG used. In this work, adding TEG and a heat sink reduced the PV surface temperature by 1.5 °C and increased PV efficiency by 3.36%.
The analysis of various existing PV cooling systems proves that thermosiphon-floating media produces better temperature reduction and generates higher power and efficiency. However, thermosyphon-floating media cooling is categorized as active cooling, which requires additional energy and other equipment in its operation [24,26,51]. Meanwhile, the TEG and heat sink for the cooling systems are categorized as passive cooling, so they do not require additional energy. Therefore, adding a combined passive heat sink and TEG combination in this study becomes a simple solution to increase photovoltaic power and efficiency without requiring extra energy. In addition, using the TEG–heat sink system requires only simple equipment and low costs. It is worth noting that the improvement in the total efficiency of PV in this work is due to the contributions of the cooling technique and the solar tracker. Further detailed analysis is required to separate each component’s contribution to the efficiency improvement. However, the use of a combined TEG–heat sink for the cooling system on the PV operated using a solar tracker has shown a significant improvement.

5. Conclusions

This work has successfully attached the thermoelectric generator and heat sink on a photovoltaic panel driven by a dual-axis solar tracking system. An LDR sensor was mounted on the PV panel to receive the signal from the sun. A microcontroller controls the panel axis rotation in the vertical and horizontal direction, following the sun’s movement in altitude and azimuth angles. The solar radiation, PV temperature, and electrical power were measured using calibrated tools. The result shows that the temperature of the PV-TEG is lower than that of the PV alone. The power and efficiency of the PV-TEG, however, are higher than those of the PV. The enhanced performance of the PV-TEG comes from the contribution of the TEG extra power and the higher power of the PV with a lower temperature. This study compares many different cooling techniques of the PV. Combining TEG and heat sink as the PV cooling system is a simple tool and it is less expensive to increase the PV efficiency driven by a solar tracker. This method’s disadvantage might be the extra energy required to drive the solar tracker. Further work is recommended to use the power generated by the PV and TEG to support the tracking system, including self-cooling if a water block is used on the TEG cold side. The combined TEG and heat sink in this work is expected to improve the design of the PV with a low-cost cooling system.

Author Contributions

Conceptualization, T.W.B.R. and A.T.W.; Methodology, A.T.W.; Software, A.S.; Validation, B.R.U.; Formal analysis, B.R.U.; Investigation, B.R.U. and A.S.; Data curation, B.R.U. and A.S.; Writing—original draft, B.R.U. and T.W.B.R.; Supervision, T.W.B.R. and A.T.W.; Project administration, T.W.B.R.; Funding acquisition, T.W.B.R. and A.T.W. All authors have read and agreed to the published version of the manuscript.

Funding

The authors gratefully acknowledge the facilities in the Research Group of Sustainable Thermofluids, Universitas Sebelas Maret, Indonesia (through HGR UNS 2023 type A), and the Institute of Research and Innovation, Universitas Muhammadiyah Surakarta, Indonesia.

Conflicts of Interest

The authors declare no conflict of interest.

Nomenclature

ATECross-section of TEG element [m2]
LDRLight dependent resistor [-]
PPower [W]
PVPhotovoltaic [-]
PPV Output power of PV [W]
PPV-TEGCombined power of PV and TEG [W]
PTEG Output power of TEG [W]
RcThermal resistance at the cold side of TEG [K]
ReElectrical resistance of TEG element [Ω]
RteThermal resistance of TEG element [K/W]
TaAmbient temperature [K]
TcTemperature at the TEG cold side [K]
ThTemperature at the TEG hot side [K]
Theat sinkTemperature at the heat sink [K]
TPVSTemperature at the PV surface [K]
TPVRTemperature at the PV rear [K]
TEGThermoelectric generator [-]
QInput energy per area unit of PV [W]
QhHeat flux at the TEG hot side [K]
QcHeat flux at the TEG cold side [K]
NsNumber of semiconductor pairs
VJVoltage due to Joule effect [V]
VSVoltage due to Seebeck effect [V]
PVPhotovoltaic panel
TEGThermoelectric generator
τ g Transmittance
αSeebeck coefficient
asAbsorbance
ε Thermal emittance
η P V - T E G Efficiency of PV-TEG [%]
η T E G Efficiency of TEG [%]
ρ Electrical resistivity
λThermal conductivity
∆TTemperature gradient
NNumber of measurement
x ¯ Mean of value
SDStandard of deviation
σ m Uncertainty of mean
Bi2Te3Bismuth telluride

References

  1. Foteinis, S.; Savvakis, N.; Tsoutsos, T. Energy and Environmental Performance of Photovoltaic Cooling Using Phase Change Materials under the Mediterranean Climate. Energy 2023, 265, 126355. [Google Scholar] [CrossRef]
  2. Wang, L.; Xu, S.; Gong, Y.; Ning, J.; Zhang, X.; Zhao, Y. High Resolution Photovoltaic Power Generation Potential Assessments of Rooftop in China. Energy Rep. 2022, 8, 14545–14553. [Google Scholar] [CrossRef]
  3. Zhang, F.; Han, C.; Wu, M.; Hou, X.; Wang, X.; Li, B. Global Sensitivity Analysis of Photovoltaic Cell Parameters Based on Credibility Variance. Energy Rep. 2022, 8, 7582–7588. [Google Scholar] [CrossRef]
  4. Shoaib, M.; Kakati, P.; Dandotiya, D.; Ramesh, C.S. A Comprehensive Review on Various Cooling Techniques to Decrease an Operating Temperature of Solar Photovoltaic Panels. Energy Nexus 2022, 8, 100161. [Google Scholar] [CrossRef]
  5. Ali, M.; Cebula, A.; Su, M. A Cooling Design for Photovoltaic Panels e Water-Based PV/T System. Energy 2022, 256, 124654. [Google Scholar] [CrossRef]
  6. Khorrami, N.; Rajabi, M.; Dehghan, M. A Novel Spectrally Selective Radiation Shield for Cooling a Photovoltaic Module. Sustain. Energy Technol. Assess. 2021, 46, 101269. [Google Scholar] [CrossRef]
  7. Zhao, Y.; Gong, S.; Zhang, C.; Ge, M.; Xie, L. Case Studies in Thermal Engineering Performance Analysis of a Solar Photovoltaic Power Generation System with Spray Cooling. Case Stud. Therm. Eng. 2022, 29, 101723. [Google Scholar] [CrossRef]
  8. Mahmood, D.M.N.; Aljubury, I.M.A. Results in Engineering Experimental Investigation of a Hybrid Photovoltaic Evaporative Cooling (PV/EC) System Performance under Arid Conditions. Results Eng. 2022, 15, 100618. [Google Scholar] [CrossRef]
  9. Sripadmanabhan, S.; Aravind, C.; Chong, K.; Saidur, R.; Faizal, M.; Abubakar, S.; Paiman, S. A Review on Various Configurations of Hybrid Concentrator Photovoltaic and Thermoelectric Generator System. Sol. Energy 2020, 201, 122–148. [Google Scholar] [CrossRef]
  10. Awasthi, A.; Shukla, A.K.; Murali Manohar, S.R.; Dondariya, C.; Shukla, K.N.; Porwal, D.; Richhariya, G. Review on Sun Tracking Technology in Solar PV System. Energy Rep. 2020, 6, 392–405. [Google Scholar] [CrossRef]
  11. Fathabadi, H. Novel High Ef Fi Cient of Fl Ine Sensorless Dual-Axis Solar Tracker for Using in Photovoltaic Systems and Solar Concentrators. Renew. Energy 2016, 95, 485–494. [Google Scholar] [CrossRef]
  12. Shittu, S.; Li, G.; Tang, X.; Zhao, X.; Ma, X.; Badiei, A. Analysis of Thermoelectric Geometry in a Concentrated Photovoltaic- Thermoelectric under Varying Weather Conditions. Energy 2020, 202, 117742. [Google Scholar] [CrossRef]
  13. Soltani, S.; Kasaeian, A.; Lavajoo, A.; Loni, R.; Naja, G. Exergetic and Enviromental Assessment of a Photovoltaic Thermal- Thermoelectric System Using Nano Fl Uids: Indoor Experimental Tests. Energy Convers. Manag. 2020, 218, 112907. [Google Scholar] [CrossRef]
  14. Widodo, T.; Riyadi, B.; Radiant, B.; Effendy, M.; Tri, A.; Al-kayiem, H.H. International Journal of Thermal Sciences Effect of Thermal Cycling with Various Heating Rates on the Performance of Thermoelectric Modules. Int. J. Therm. Sci. 2022, 178, 107601. [Google Scholar] [CrossRef]
  15. Bjørk, R.; Nielsen, K.K. The Performance of a Combined Solar Photovoltaic (PV) and Thermoelectric Generator (TEG) System. Sol. Energy 2015, 120, 187–194. [Google Scholar] [CrossRef] [Green Version]
  16. Shittu, S.; Li, G.; Zhao, X.; Ma, X.; Golizadeh, Y.; Fan, Y. Comprehensive Study and Optimization of Concentrated Photovoltaic- Thermoelectric Considering All Contact Resistances. Energy Convers. Manag. 2020, 205, 112422. [Google Scholar] [CrossRef]
  17. Van Sark, W.G.J.H.M. Feasibility of Photovoltaic—Thermoelectric Hybrid Modules. Appl. Energy 2011, 88, 2785–2790. [Google Scholar] [CrossRef] [Green Version]
  18. Ahsan, M.; Khan, I.; Khan, M.I.; Kazim, A.H.; Shabir, A. An Experimental and Comparative Performance Evaluation of a Hybrid Photovoltaic-Thermoelectric System. Front. Energy Res. 2021, 9, 1–9. [Google Scholar] [CrossRef]
  19. Nabil, T.; Mansour, T.M. Results in Engineering Augmenting the Performance of Photovoltaic Panel by Decreasing Its Temperature Using Various Cooling Techniques. Results Eng. 2022, 15, 100564. [Google Scholar] [CrossRef]
  20. Kumar, N.; Gaur, M.K.; Malvi, C.S. Application of Phase Change Materials for Cooling of Solar Photovoltaic Panels: A Review. Mater. Today Proc. 2021, 47, 6759–6765. [Google Scholar] [CrossRef]
  21. Rabelo, M.; Yousuf, H.; Kim, J.; Dao, V.; Phong, D. Progressive Cooling Techniques for Photovoltaic Module Efficiency and Reliability: Comparative Evaluation and Optimization. Energy Rep. 2022, 8, 8534–8545. [Google Scholar] [CrossRef]
  22. Shittu, S.; Li, G.; Golizadeh, Y.; Ma, X.; Zhao, X.; Ayodele, E. Advancements in Thermoelectric Generators for Enhanced Hybrid Photovoltaic System Performance. Renew. Sustain. Energy Rev. 2019, 109, 24–54. [Google Scholar] [CrossRef]
  23. Omri, M.; Selimefendigil, F.; Smaoui, H.T.; Kolsi, L. Case Studies in Thermal Engineering Cooling System Design for Photovoltaic Thermal Management by Using Multiple Porous Deflectors and Nanofluid. Case Stud. Therm. Eng. 2022, 39, 102405. [Google Scholar] [CrossRef]
  24. Mahdavi, A.; Farhadi, M.; Gorji-bandpy, M.; Mahmoudi, A. A Review of Passive Cooling of Photovoltaic Devices. Clean. Eng. Technol. 2022, 11, 100579. [Google Scholar] [CrossRef]
  25. Ramkiran, B.; Sundarabalan, C.K.; Sudhakar, K. Sustainable Passive Cooling Strategy for PV Module: A Comparative Analysis. Case Stud. Therm. Eng. 2021, 27, 101317. [Google Scholar] [CrossRef]
  26. Sutanto, B.; Setyo, Y.; Tri, A.; Iacovides, H. International Journal of Thermal Sciences Enhancing the Performance of Floating Photovoltaic System by Using Thermosiphon Cooling Method: Numerical and Experimental Analyses. Int. J. Therm. Sci. 2022, 180, 107727. [Google Scholar] [CrossRef]
  27. Grubišić-Čabo, F.; Nižetić, S.; Marinić Kragić, I.; Čoko, D. Further Progress in the Research of Fin-Based Passive Cooling Technique for the Free-Standing Silicon Photovoltaic Panels. Int. J. Energy Res. 2019, 43, 3475–3495. [Google Scholar] [CrossRef]
  28. Kidegho, G.; Njoka, F.; Muriithi, C.; Kinyua, R. Evaluation of Thermal Interface Materials in Mediating PV Cell Temperature Mismatch in PV–TEG Power Generation. Energy Rep. 2021, 7, 1636–1650. [Google Scholar] [CrossRef]
  29. Al-Ezzi, A.S.; Ansari, M.N.M. Photovoltaic Solar Cells: A Review. Appl. Syst. Innov. 2022, 5, 67. [Google Scholar] [CrossRef]
  30. Lincot, D. The New Paradigm of Photovoltaics: From Powering Satellites to Powering Humanity. Comptes Rendus Phys. 2017, 18, 381–390. [Google Scholar] [CrossRef]
  31. Simya, O.K.; Radhakrishnan, P.; Ashok, A.; Kavitha, K.; Althaf, R. Engineered Nanomaterials for Energy Applications. Handb. Nanomater. Ind. Appl. 2018, 751–767. [Google Scholar] [CrossRef]
  32. Zhu, W.; Deng, Y.; Wang, Y.; Shen, S.; Gulfam, R. High-Performance Photovoltaic-Thermoelectric Hybrid Power Generation System with Optimized Thermal Management. Energy 2016, 100, 91–101. [Google Scholar] [CrossRef]
  33. Babu, C.; Ponnambalam, P. The Theoretical Performance Evaluation of Hybrid PV-TEG System. Energy Convers. Manag. 2018, 173, 450–460. [Google Scholar] [CrossRef]
  34. Tenorio, H.C.R.L.; Vieira, D.A.; De Souza, C.P.; De Macedo, E.C.T.; Freire, R.C.S. A Thermoelectric Module Thermal-Cycling Testing Platform with Automated Measurement Capabilities. In Proceedings of the 2016 IEEE International Instrumentation and Measurement Technology Conference Proceedings, Taipei, Taiwan, 23–26 May 2016. [Google Scholar] [CrossRef]
  35. Barako, M.T.; Park, W.; Marconnet, A.M.; Asheghi, M.; Goodson, K.E. A Reliability Study with Infrared Imaging of Thermoelectric Modules under Thermal Cycling. In Proceedings of the 13th InterSociety Conference on Thermal and Thermomechanical Phenomena in Electronic Systems, San Diego, CA, USA, 30 May–1 June 2012; pp. 86–92. [Google Scholar] [CrossRef]
  36. Hatzikraniotis, E.; Zorbas, K.T.; Samaras, I.; Kyratsi, T.; Paraskevopoulos, K.M. Efficiency Study of a Commercial Thermoelectric Power Generator (TEG) under Thermal Cycling. J. Electron. Mater. 2010, 39, 2112–2116. [Google Scholar] [CrossRef]
  37. Barako, M.T.; Park, W.; Marconnet, A.M.; Asheghi, M.; Goodson, K.E. Thermal Cycling, Mechanical Degradation, and the Effective Figure of Merit of a Thermoelectric Module. J. Electron. Mater. 2013, 42, 372–381. [Google Scholar] [CrossRef]
  38. Castillo, E.E.; Hapenciuc, C.L.; Borca-Tasciuc, T. Thermoelectric Characterization by Transient Harman Method under Nonideal Contact and Boundary Conditions. Rev. Sci. Instrum. 2010, 81, 044902. [Google Scholar] [CrossRef] [PubMed]
  39. Williams, N.P.; Power, J.; Trimble, D.; O’Shaughnessy, S.M. An Experimental Evaluation of Thermoelectric Generator Performance under Cyclic Heating Regimes. Heat Mass Transf. 2022. [Google Scholar] [CrossRef]
  40. Champier, D. Thermoelectric Generators: A Review of Applications. Energy Convers. Manag. 2017, 140, 167–181. [Google Scholar] [CrossRef]
  41. Kanagaraj, N. Photovoltaic and Thermoelectric Generator Combined Hybrid Energy System with an Enhanced Maximum Power Point Tracking Technique for Higher Energy Conversion Efficiency. Sustainability 2021, 13, 3144. [Google Scholar] [CrossRef]
  42. Nagaraj, N.N.A.M.; Kumar, L.S. Electrical Energy Harvesting Using Thermo Electric Generator for Rural Communities in India. Int. J. Energy Power Eng. 2019, 13, 663–667. [Google Scholar]
  43. Atmoko, N.T.; Veza, I.; Widodo, T.; Riyadi, B. Study on the Energy Conversion in the Thermoelectric Liquefied Petroleum Gas Cooking Stove with Different Cooling Methods. Int. J. Eng. Trends Technol. 2021, 69, 185–193. [Google Scholar] [CrossRef]
  44. Nouman, A.S.; Chokhachian, A.; Santucci, D.; Auer, T. Prototyping of Environmental Kit for Georeferenced Transient Outdoor Comfort Assessment. ISPRS Int. J. Geo-Inf. 2019, 8, 76. [Google Scholar] [CrossRef] [Green Version]
  45. Robert, J. Moffat Describing the Uncertainties in Experimental Results. Exp. Therm. Fluid Sci. 1988, 1, 3–17. [Google Scholar] [CrossRef] [Green Version]
  46. Hoffman, T. Altitude and Azimuth Angle. Available online: https://www.suncalc.org/ (accessed on 11 November 2022).
  47. First Rays LLC. Solar Intensity Calculator. Available online: https://firstrays.com/natural-sunlight-intensity/ (accessed on 11 November 2022).
  48. Das, S. Materials Today: Proceedings Short Term Forecasting of Solar Radiation and Power Output of 89.6 kWp Solar PV Power Plant. Mater. Today Proc. 2021, 39, 1959–1969. [Google Scholar] [CrossRef]
  49. Mccormick, P.G.; Suehrcke, H. The e Ff Ect of Intermittent Solar Radiation on the Performance of PV Systems. Sol. Energy 2018, 171, 667–674. [Google Scholar] [CrossRef]
  50. Sharaf, M.; Yousef, M.S.; Huzayyin, A.S. Review of Cooling Techniques Used to Enhance the Efficiency of Photovoltaic Power Systems. Environ. Sci. Pollut. Res. 2022, 29, 26131–26159. [Google Scholar] [CrossRef]
  51. Idoko, L.; Anaya-Lara, O.; McDonald, A. Enhancing PV Modules Efficiency and Power Output Using Multi-Concept Cooling Technique. Energy Rep. 2018, 4, 357–369. [Google Scholar] [CrossRef]
  52. Dida, M.; Boughali, S.; Bechki, D.; Bouguettaia, H. Experimental Investigation of a Passive Cooling System for Photovoltaic Modules Efficiency Improvement in Hot and Arid Regions. Energy Convers. Manag. 2021, 243, 114328. [Google Scholar] [CrossRef]
  53. Adibpour, S.; Raisi, A.; Ghasemi, B.; Sajadi, A.R.; Rosengarten, G. Experimental Investigation of the Performance of a Sun Tracking Photovoltaic Panel with Phase Change Material. Renew. Energy 2021, 165, 321–333. [Google Scholar] [CrossRef]
Figure 1. Principle of photovoltaic effect for a photon to electrical energy conversion (e: electron, and h: hole) [31].
Energies 16 02658 g001
Figure 2. Schematic diagram of the photovoltaic/thermoelectric generator panels [32].
Energies 16 02658 g002
Figure 3. Equivalent circuit of an electrically connected PV-TEG in (a) series and (b) parallel.
Energies 16 02658 g003
Figure 4. Experimental setup.
Energies 16 02658 g004
Figure 5. The schematic diagram of the experimental data measurement.
Energies 16 02658 g005
Figure 6. The calibration of tools used to measure (a) altitude–azimuth angles, (b) solar radiation intensity, (c) temperature, and (d) electrical power.
Energies 16 02658 g006aEnergies 16 02658 g006b
Figure 7. The voltage profile of the TEG obtained via the Harman method.
Energies 16 02658 g007
Figure 8. Measured and calculated data [46] of the altitude and azimuth angle in the dual-axis solar tracking system.
Energies 16 02658 g008
Figure 9. Solar radiation measured on the PV panel compared to the data obtained via calculation [47].
Energies 16 02658 g009
Figure 10. The temperature on the surface of the PV, PV-TEG, and TEG hot and cold sides.
Energies 16 02658 g010
Figure 11. Power output of PV, PV-TEG, and TEG.
Energies 16 02658 g011
Figure 12. Efficiency of PV, PV-TEG, and TEG.
Energies 16 02658 g012
Table 1. Power and efficiency of some PV systems.
AuthorType PVSystem CoolingPowerEfficiency
Sark [17]Not mentionedTEGNot mentioned8–23%
Ahsan et al. [18]PolycrystallineTEGIncreases by 19%Increases by 2.4%
Sutanto et al. [26]PolycrystallineFloating and thermosiphon-floating The floating PV increases by 4.52% from PV ground; thermosiphon-floating PV increases by 7.86% from PV.The floating PV increases by 4.53% from PV ground; thermosiphon-floating PV increases by 7.76% from PV.
Grubišić-Čabo et al. [27]Not mentionedFin and passive air-based coolerIncreases by 5%Not mentioned
Kidegho et al. [28]PolycrystallineTEG combination air and water coolerAir cooling increases by 19.7%; water cooling increases by 24.85%. Not mentioned
Table 2. The manufacturer’s specification of the photovoltaic panel.
ParametersUnitValue
Dimensionmm110 × 60
Max. working voltageV5
Max. working currentmA200
Table 3. The manufacturer’s specification of the thermoelectric generator.
ParametersUnitValue
Dimensionmm40 × 40 × 3.9
Operation temperature°C0–150
Seebeck coefficientV/K0.054
Working voltage at ΔT 100 °CV6.4
Working current at ΔT 100 °CA0.969
Table 4. The manufacturer’s specification of the BH1750 sensor.
ParametersSpecification
Working voltage4.5 V
Operation temperature40–80 °C
Accuracy+/− 20%
Sensor’s build16 bitAD
ChipROHM
Table 5. Uncertainty of mean analysis of the measured data.
ParametersUncertainty of Mean
Angle±0.176°
Solar radiation±0.759 W/m2
Temperature±0.574 C
Voltage±0.043 V
Power±0.067 W
Efficiency±0.250%
Table 6. Comparison of some cooling systems in photovoltaic panel.
ReferenceType PVCooling SystemTemperature Reduction Solar TrackerEfficiency Increase
Čabo et al. [27]Polycrystalline 520 WpFin cooling2 °CNo0.40%
Babu and Ponnambalam [33]CrystallineTEGNot mentioned No6%
Dida et al. [52]Polycrystalline 80 WEvaporative water cooling17.1 °CNo1.46%
Adibpour et al. [53]Monocrystalline 60 W PV-PCM system9.1 °CYes6.80%
Khan et al. [18]PolycrystallineTEG3 °CNo1.40%
Sutanto et al. [26]Polycrystalline 50 WpFloating and thermosiphon-floating1–4 °CNo7.76%
Present work Monocrystalline 5 VTEG and heat sink4.23 °CYes3.35%
Disclaimer/Publisher’s Note: The statements, opinions and data contained in all publications are solely those of the individual author(s) and contributor(s) and not of MDPI and/or the editor(s). MDPI and/or the editor(s) disclaim responsibility for any injury to people or property resulting from any ideas, methods, instructions or products referred to in the content.

