Article

A Multiphysics Model Simulating the Electrochemical, Thermal, and Thermal Runaway Behaviors of Lithium Polymer Battery

by
Marcel Roy B. Domalanta
1 and
Julie Anne D. R. Paraggua
1,2,*
1
Laboratory of Electrochemical Engineering (LEE), Department of Chemical Engineering, University of the Philippines Diliman, Quezon City 1101, Philippines
2
Energy Engineering Program, National Graduate School of Engineering, College of Engineering, University of the Philippines Diliman, Quezon City 1101, Philippines
*
Author to whom correspondence should be addressed.
Energies 2023, 16(6), 2642; https://doi.org/10.3390/en16062642
Submission received: 10 February 2023 / Revised: 4 March 2023 / Accepted: 8 March 2023 / Published: 10 March 2023
(This article belongs to the Section D2: Electrochem: Batteries, Fuel Cells, Capacitors)

Abstract

:
Lithium-ion batteries (LIBs) have circumvented the energy storage landscape for decades. However, safety concerns about liquid–electrolyte-based LIBs have challenged their mobilization. Lithium polymer (LiPo) batteries have gained rising interest due to their high thermal stability. Despite an array of commercially available LiPo batteries, limited studies have ventured into modeling. Numerical simulations allow low-cost optimization of existing battery designs through parameter analysis and material configuration, leading to safer and more energy-efficient batteries. This work examined the electrochemical, thermal, and thermal runaway behavior of a lithium cobalt oxide cathode, graphite anode, and poly(vinylidene fluoride-hexafluoropropylene) electrolyte pouch-type LiPo battery using COMSOL Multiphysics®, and validated results with experimental data. The simulated potential curve exhibited strong agreement with experiment data, while the temperature profile during discharge displayed qualitative discrepancies rationalized by the reversible heat generation. Thermal runaway simulations via oven tests revealed that the highest heat generation is from the cathode–electrolyte reaction, while the solid electrolyte interface decomposition initiates the heat generation process. These results suggest a thorough selection of cathode and electrolyte material to heighten battery safety. Overall, the developed models can be utilized as design tools to investigate various chemistries and designs to estimate the behavior and performance of batteries.

1. Introduction

Energy demand is increasing as new technologies are being developed rapidly. Researchers make vigorous efforts to tap into energy storage to keep up with the rise in energy demand. Nearly all portable devices operate with batteries, and though no holy grail battery has been developed, there are boundless areas for improvement in their design and structure. Among these batteries, lithium-ion batteries (LIBs) have been the focus of studies because of their high energy capacity [1]. LIBs deliver energy by intercalating and de-intercalating lithium ions in a rocking chair mechanism (Figure S1). Lithium polymer (LiPo) batteries that use gel polymer electrolytes (GPEs) are of increasing interest because of their non-leakage, flexibility, stability, and lower resistance between electrode and electrolyte compared to solid electrolytes, and because of their high ionic conductivity [2]. As a result of heightened interest, numerous studies on the material modification and venturing of new materials have paved the way for different LiPo battery designs and frameworks. Despite an increase in diverse LiPo batteries, there is a limited volume of studies about simultaneously modeling these batteries’ behaviors.
LiPo batteries have been a common trend in portable energy storage, such as mobile phones and personal computers. However, LiPo batteries experience different and dynamic environmental changes throughout their life cycle. Thermal and electrochemical effects can propagate to terrible scenarios such as short circuits and thermal runaway, leading to fatal results such as explosions [3]. LIB simulation and modeling are found to be advantageous in improving battery management systems [4]. To understand the fundamental electrochemical and thermal characteristics and predict the behavior of batteries under certain conditions, developing an accurate and reliable model of the battery is essential to prevent undesirable outcomes.
A battery model presents the electrochemical behavior of the cell. The electrochemical kinetics and mass transfer demonstrate their synchronous relationship with electrical parameters such as current and voltage. Studies have proposed many mathematical models to illustrate and understand the diverse chemical reactions, circuit parameters, and effects of the state of charge (SOC) on the battery’s dynamics [5]. Depending on which parameters must be analyzed, battery models are often developed using electrochemical and/or equivalent electrical circuit models. LiPo batteries have been studied with equivalent electrical circuit models to define the cell’s relationship between temperature and SOC [6]. An electrochemical model approach to LIBs was used to accurately predict the cell’s potential difference and heat generation during charging and discharging [7]. The battery model utilizes the pseudo-2-dimensional model by Newman et al., a well-established framework for comprehending the electrochemical behavior of the cell [8,9,10,11,12]. This model was modified to fine-tune the experimental design and establish safety parameters such as allowable charging rates and conditions (see Figure S2).
With a very complex and dynamic mechanism, an electrochemical model cannot solely describe the complete behavior of the battery and consider all the battery system parameters. The thermal model utilizes LIBs’ strong affinity to temperature to relate LIBs’ performance and electrochemical–thermal behavior. Understanding the correlation between the geometrical framework and thermal behavior of batteries under different conditions, such as charging and/or discharging, allows manufacturers to optimize the battery’s design and structure. The size of the battery and other physical dimensions, such as the thickness of electrodes, significantly impacts the heat generation and temperature variation inside the battery. Thus, these physical dimensions play a substantial role in the battery’s thermal management system and performance. Challenges, such as the non-uniformity of current density distribution and high heat generation, decrease specific energy and power, reduce life cycle, and make the battery ineffective, unreliable, and dangerous [4,13,14]. Therefore, it is essential to develop a well-grounded model to obtain insights into the battery’s thermal mechanism to enhance performance, longevity, and safety.
A thermal runaway can be triggered by various abuses, such as (i) mechanical, where the battery is subjected to compressions or sudden or prolonged physical impact, (ii) electrical, during improper dis/charging or external short, and (iii) thermal, where the battery is exposed to external or internal heating [15]. Thermal runaway occurs when the battery loses its ability to control temperature escalation and when the generated heat cannot be dissipated immediately. The temperature increases on its own as oxygen builds up in the cell and serves as a precursor to fire [14,15,16,17]. Once a battery cell reaches a specific onset temperature, thermal runaway propagates from a series of heat generations from the cell’s side reactions to a series of decomposition reactions. The onset temperature is a key parameter of the thermal stability of the cell. The first stage decomposes the SEI layer within the temperature range 363.15 K–393.15 K. As the temperature increases to the tipping point of about 403.15 K, the separator breaks down and triggers a short circuit between the electrodes, causing uncontrollable electrode–electrolyte reactions. Finally, at temperatures above 473.15 K, the electrolyte breaks down and the temperature spike occurs [18,19,20]. This series of reactions often bulks up the battery cell due to the discharge of gases and raises the internal battery pressure, which could prompt an explosion and fire at worst. To mitigate thermal runaway, research pursuits aim to increase the onset temperature and the tipping point temperature while reducing the temperature peak.
Battery management systems must suppress thermal runaways to avoid fire and/or battery explosion. Furthermore, as the demand for electrochemical battery storage transition from mobile use to transportation and even health care, user safety is an important factor in battery performance. Thus, there have been rigorous efforts to assist with the experimental optimization of battery design for safety purposes through the analysis of thermal mechanisms by using mathematical models [7,8,21,22,23]. One study by Hatchard et al. simulated the thermal runaway of a lithium cobalt oxide (LCO) battery using a Fortran numerical model [24]. Although their model validated cylindrical oven test results, prismatic-type batteries lacked experimental comparison. Another study capturing LCO batteries under thermal runaway was conducted by Zhang et al. using a multiphysics model [20]. Although the temperature profile shows close agreement, the validation was referenced to previous literature findings. Other studies consider using a thermal resistance model for thermal runaway such as the works of Chen et al. [24]. Thermal runaway has been successfully modelled. However, thermal runaway is factored by multiple phenomena such as electrochemical and thermal behaviors.
To address the challenges in the venture for novel materials for reliable and safe energy storage technologies, endeavors for modeling and optimization should be given equal and utmost importance. Thus far, little effort has been made to design a robust yet straightforward mathematical model to understand the behavior of commercially available battery models. Additionally, studies that have modeled commercially available batteries often validate experimental results with past literature, lacking validation from actual battery tests.
This study reports the first multiphysics model for a commercially available mobile LiPo battery with an LCO, LiCoO2, cathode, a graphite anode, and a poly(vinylidene fluoride-hexafluoropropylene) (PVdF-HFP) electrolyte, investigating the electrochemical, thermal, and thermal runaway (through external heating) behaviors and validating them with experimental results. The mathematical model can be utilized further to understand the battery’s behavior under different conditions. The model also intends to create opportunities for improving battery design and optimizing battery material composition for enhanced performance and heightened safety.

2. Materials and Methods

2.1. Experimental Methods

A commercial LiPo battery, GEB 585460, produced by General Electronics Battery Co., Ltd. (Shenzhen, China), was used as the framework battery for the study. The schematics of the experimental research are illustrated in Figure S3. The battery specifications are summarized in Table 1.
The electrochemical analysis was performed using an AUTOLAB PGSTAT302N potentiostat. Working voltage at a constant ambient temperature was determined using the potentiostat under galvanostatic discharge operation, where the working electrode was placed on the positive terminal of the cell and counter and reference electrodes on the negative terminal. Thermal analysis by analyzing the battery’s time-dependent temperature during discharge was performed using two K-type stainless steel thermocouples (WRNT-10) situated at the center of the battery cell on two sides, as illustrated in Figure S4. The temperature was logged using a Fluke 2625A HYDRA data logger. The average temperature from the thermocouples designates the average battery surface temperature. The electrochemical and thermal analysis of the battery was conducted simultaneously at a discharge rate of 1.0 C. Thermal runaway experimental analysis was carried out on an oven test coupled with an identical 2-thermocouple arrangement in the thermal analysis to measure the battery surface temperature. The oven tests for the battery proceeded at two temperature points—at (i) 403.15 K, where the PVdF separator breaks down [25], and at (ii) 423.15 K, where the onset temperature of thermal runaway of LCO-graphite takes place [19].

2.2. Numerical Methods

The electrochemical model provides the necessary insights to understand the relationship between the current distribution along with the battery phases, the different current densities, and the battery’s overpotential. The fundamental equations for the electrochemical model of the LiPo battery are summarized in Table 2.
The equations summarized in Table 2 are referred to as the pseudo-2-dimensional (P2D) model. The model was solved in one direction (1D), while the 2-dimensionality arises from the spherical particle coordinates in the mass transport [8,9].
Ionic conductivity can be determined as a function of lithium-ion concentration in the electrolyte phase using Equation (12) [12].
κ = 4.1253 × 10 4 + 5.007 × 10 3 c Li E 4.7212 × 10 3   ( c Li E ) 2 + 1.5094 × 10 3 ( c Li E ) 3 1.6018 × 10 4   ( c Li E ) 4
The lithium diffusion coefficient in the electrolyte phase as a function of temperature and lithium concentration in the electrolyte phase is expressed in Equation (13) [4].
D Li E = 10 [ 4.43 ( 54 T 229 0.005 c Li E ) 0.00022 c Li E ] 4
The equilibrium potential of the electrodes, expressed as the open circuit potential (OCP), is expressed as a function of the surface state of charge. The equations were obtained from literature based on experimental fitting with units of volts [26]. The OCP of the electrodes can be determined from the stoichiometric coefficient, which designates the ratio of the solid-phase lithium-ion concentration on the local electrode surface to the maximum available lithium-ion concentration the electrode can hold [27]. The OCP, as a function of lithiation for the cathode and anode, is illustrated in Figure 1, established from their respective theoretical equations [26].
For the positive electrode, the equilibrium potential is expressed in Equation (14), where the surface state of charge of the LCO cathode, x p , is the stoichiometric coefficient, x, of LixCoO2 [26].
U eq , p = 4.04596 + exp ( 42.30027 x p + 16.56714 ) 0.04880 arctan ( 50.01833 x p 26.48897 ) 0.05447 arctan ( 18.99678 x p 12.32362 ) exp ( 78.24095 x p 78.68074 ) .
For the negative electrode, the equilibrium potential is expressed in Equation (15), where the surface state of charge of the graphite anode, x n , is the stoichiometric coefficient, y, of LiyC6 [26].
U eq , n = 0.13966 + 0.68920 exp ( 49.20361 x n ) + 0.41903 exp ( 254.40067 x n ) exp ( 49.97886 x n 43.37888 ) 0.028221 arctan ( 22.52300 x n 3.65328 ) 0.01308 arctan ( 28.34801 x n 13.43960 )
The cell’s total current density can be computed by taking the sum of the current density from both the solid and electrolyte phase.
The thermal model allows us to understand the battery’s thermal behavior under various conditions. Heat generation develops from the chemical reactions inside the battery cell. The thermal model enables the prediction of the battery’s thermal distribution. The equations for satisfying the energy balance for LiPo battery thermal modeling are summarized in Table 3.
As the battery was allowed to dissipate heat to the environment, the heat transfer in the battery predominantly accounts for the convective heat transfer to the surrounding air and the radiative heat transfer through the surface areas. However, heat transfer through radiation is negligible and is often assumed to be zero for ease of computation. Thus, according to Newton’s cooling law, the boundary conditions for the thermal model are described as follows (Equations (24) and (25)):
λ T | x = 0 = h ( T amb T )
λ T | x = L = h ( T T amb )
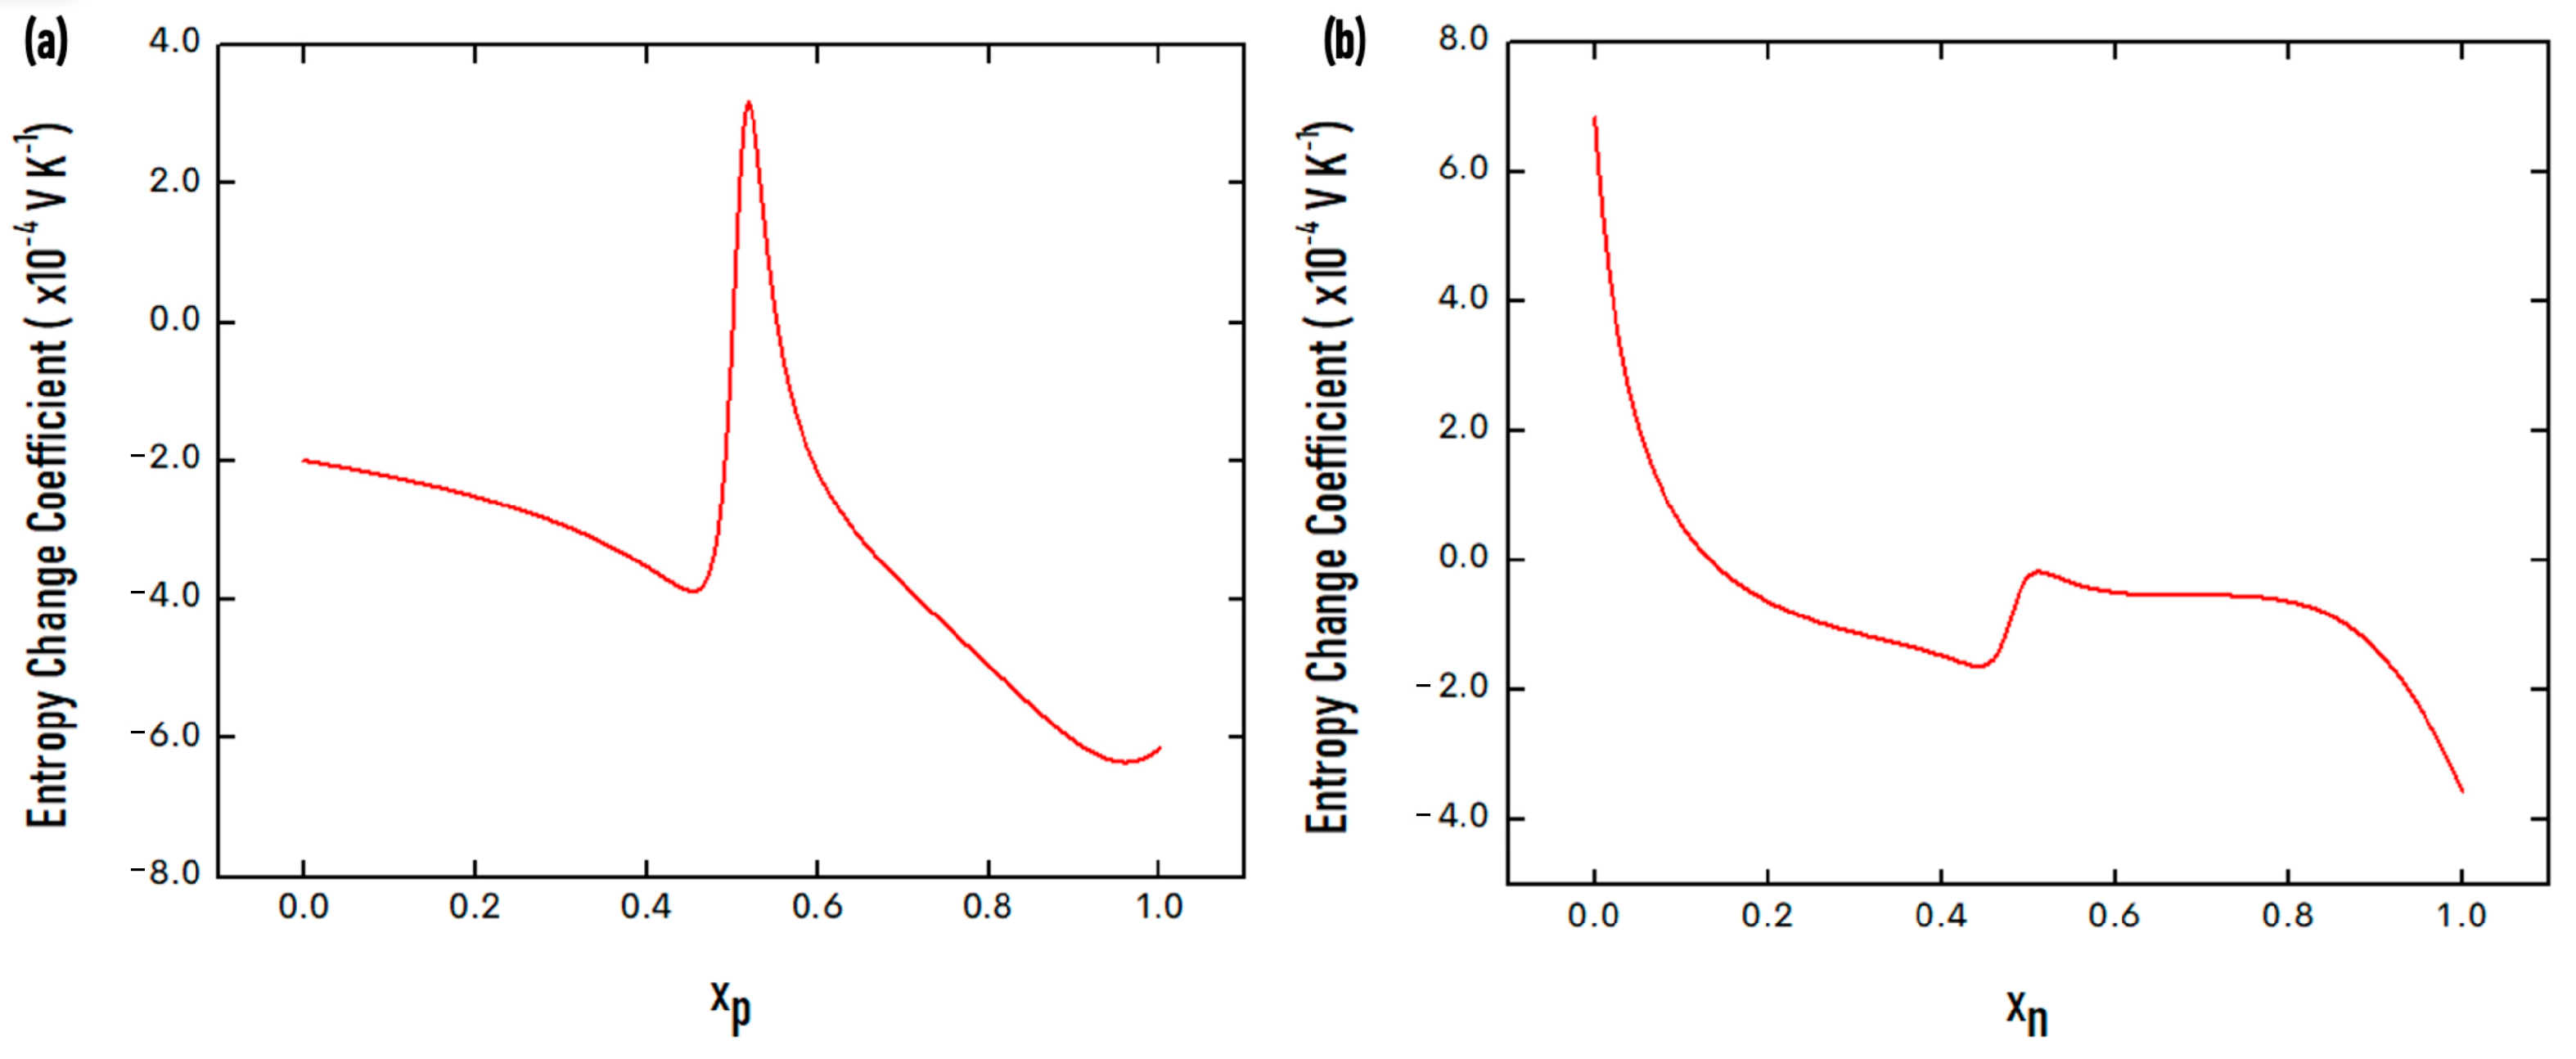
The entropic coefficients to account for the reversible heat (Equation (19)) use literature-derived values grounded on experimental work. The entropic coefficient equations are a function of the degree of lithiation or the surface state of charge and are expressed in volts per Kelvin [29,30,31]. The entropic coefficient as a function of lithiation is illustrated in Figure 2. For the positive electrode, the entropic coefficient is expressed in Equation (26), where the degree of lithiation of the LCO cathode, x p , is the stoichiometric coefficient, x, of LixCoO2 [26]. The equation was derived from fitting experimental works of the variation of half-cell potential vs. Li/Li+ to the curves of Guo et al. [26].
U eq , p T = 1 1000 · 0.19952 + 0.92837 x p 1.36455 x p 2 + 0.61154 x p 3 1 5.66148 x p + 11.47636 x p 2 9.82431 x p 3 + 3.04876 x p 4
For the negative electrode, the entropic coefficient is expressed in Equation (27), where the degree of lithiation of the graphite anode, x n , is the stoichiometric coefficient, y, of LiyC6 [32]. The equation was based on the experimental data reported by Reynier et al. [33] by determining the variation of the half-cell potential vs. Li/Li+ and fitted to the works of Rheinfeld et al. [32].
U eq , n T = 3.8149 × 10 4 x n 5 + 1.058 × 10 3 x n 4 1.1235 × 10 3 x n 3 + 5.5727 × 10 4 x n 2 1.242 × 10 3 x n + 9.0095 × 10 6 x n 5 2.9967 x n 4 + 3.2192 x n 3 1.4066 x n 2 + 1.8475 × 10 1 x n + 1.3198 × 10 2
The thermal model uses a 3-dimensional approach to heighten model reliability. The overall heat energy balance expressed in Equation (16) was used as the foundation of the thermal analysis up to the thermal runaway modeling. The thermal model neglects the negligible heat dissipation from radiative heat transfer [23]. The irreversible heat generation is limited to active polarization heat and ohmic heat. In this study, the heat of mixing and enthalpy heating were not considered because of their insignificant amount. The effect of the heat of mixing is negligible for LIBs because of the constrained concentration gradients present [34].
The heat coming from the battery’s electrochemical model is vital to the heat generation for the thermal model. In contrast, the thermal model’s temperature distribution affects the electrochemical model’s current density. This coupling of both models allows a synergistic approach to investigate the multiple physical phenomena of the battery’s dynamics. The physical and thermodynamic parameters used in the coupled electrochemical-thermal models are summarized in Table 4.
Thermal runaway occurs when there is a spontaneous increase in the cell’s temperature due to heat generation from multiple chemical reactions. Thermal runaway is one of the battery failure modes that can inflict serious harm to the user. Recognizing and predicting when a battery cell will undergo thermal runaway is vital. Table 4 summarizes the framework equations for thermal runaway modeling for a LiPo battery.
Table 5 summarizes the framework equations for thermal runaway modeling for a LiPo battery. The overall heat generation from the thermal runaway chemical reactions proposed by Kim et al.’s mathematical model was built from the Arrhenius equation’s principles [40]. The total heat from Equation (17) is then substituted to q T R , designated as the total thermal runaway heat generation. The total heat generation is the sum of the heat (Equation (28)) from (i) SEI decomposition reaction (Equation (29)), (ii) reaction of the negative electrode and the electrolyte (Equation (30)), (iii) reaction of the positive electrode and the electrolyte (Equation (31)), (iv) electrolyte decomposition (Equation (32)), and (v) the reaction between the binder and the negative electrode [41]. The reaction between the binder and negative electrode rarely occurs because lithium is consumed more quickly and more completely during the reaction between the electrolyte and the negative electrode [34]. Therefore, the heat from the exothermal reaction between the binder and the negative electrode was neglected in modeling.
The mathematical simulations were achieved using COMSOL Multiphysics 5.4 software coupling the batteries and fuel cells, and the heat transfer module. The models used the same geometry and material composition as the commercial LiPo battery for experimental analysis. The P2D electrochemical and 3D thermal model, including the thermal runaway model, was coupled with temperature and heat generation variables. The thermal runaway used the ODE domain to model and solve the exothermic chemical reactions. The mathematical model uses the backward differentiation formula as the time-stepping method with a maximum order of five and a minimum order of two, using a relative tolerance of 10−6 and an absolute error tolerance of 10−8, as suggested by the work of Zhang et al. [20]. Working voltage and discharge time were analyzed for the electrochemical model, while temperature as a function of time was analyzed for thermal and thermal runaway models. The electrochemical and thermal model employed a discharge C-rate of 1.0 C. For the thermal runaway model, the heat generation rate as a function of time was also investigated.
The simulation was run using a computer workstation with an Intel(R) Core i5-10300H CPU at 2.50 GHz, 2496 Mhz, 4 Cores, and 8 Logical Processors. The schematic illustration of the models’ geometries is presented in Figure S5. The convergence of the computational solution of the partial differential equations is highly dependent on the number and geometry of the grids and the mesh analysis due to the battery’s high aspect ratio via the finite element method. To provide reliability and evaluate the computational speed and quality of the model, a preliminary grid sensitivity study was conducted at varying physics-controlled mesh at COMSOL Multiphysics. The RMSE, comparing experimental and simulated discharge potentials at a different mesh, was calculated using a 1 C discharge rate and 100 s time step computation, tabulated in Table 6. The grid independence study demonstrates that the RMSE was roughly 0.06 V, and the lowest RMSE was achieved using a normal mesh type. As such, a normal physics-controlled mesh was utilized in the study as fine mesh would require four times the computational time with roughly the same results as a coarse-type running half the duration of the normal-type while finer mesh results in computer memory overcapacity.

3. Results and Discussion

3.1. Electrochemical Behavior

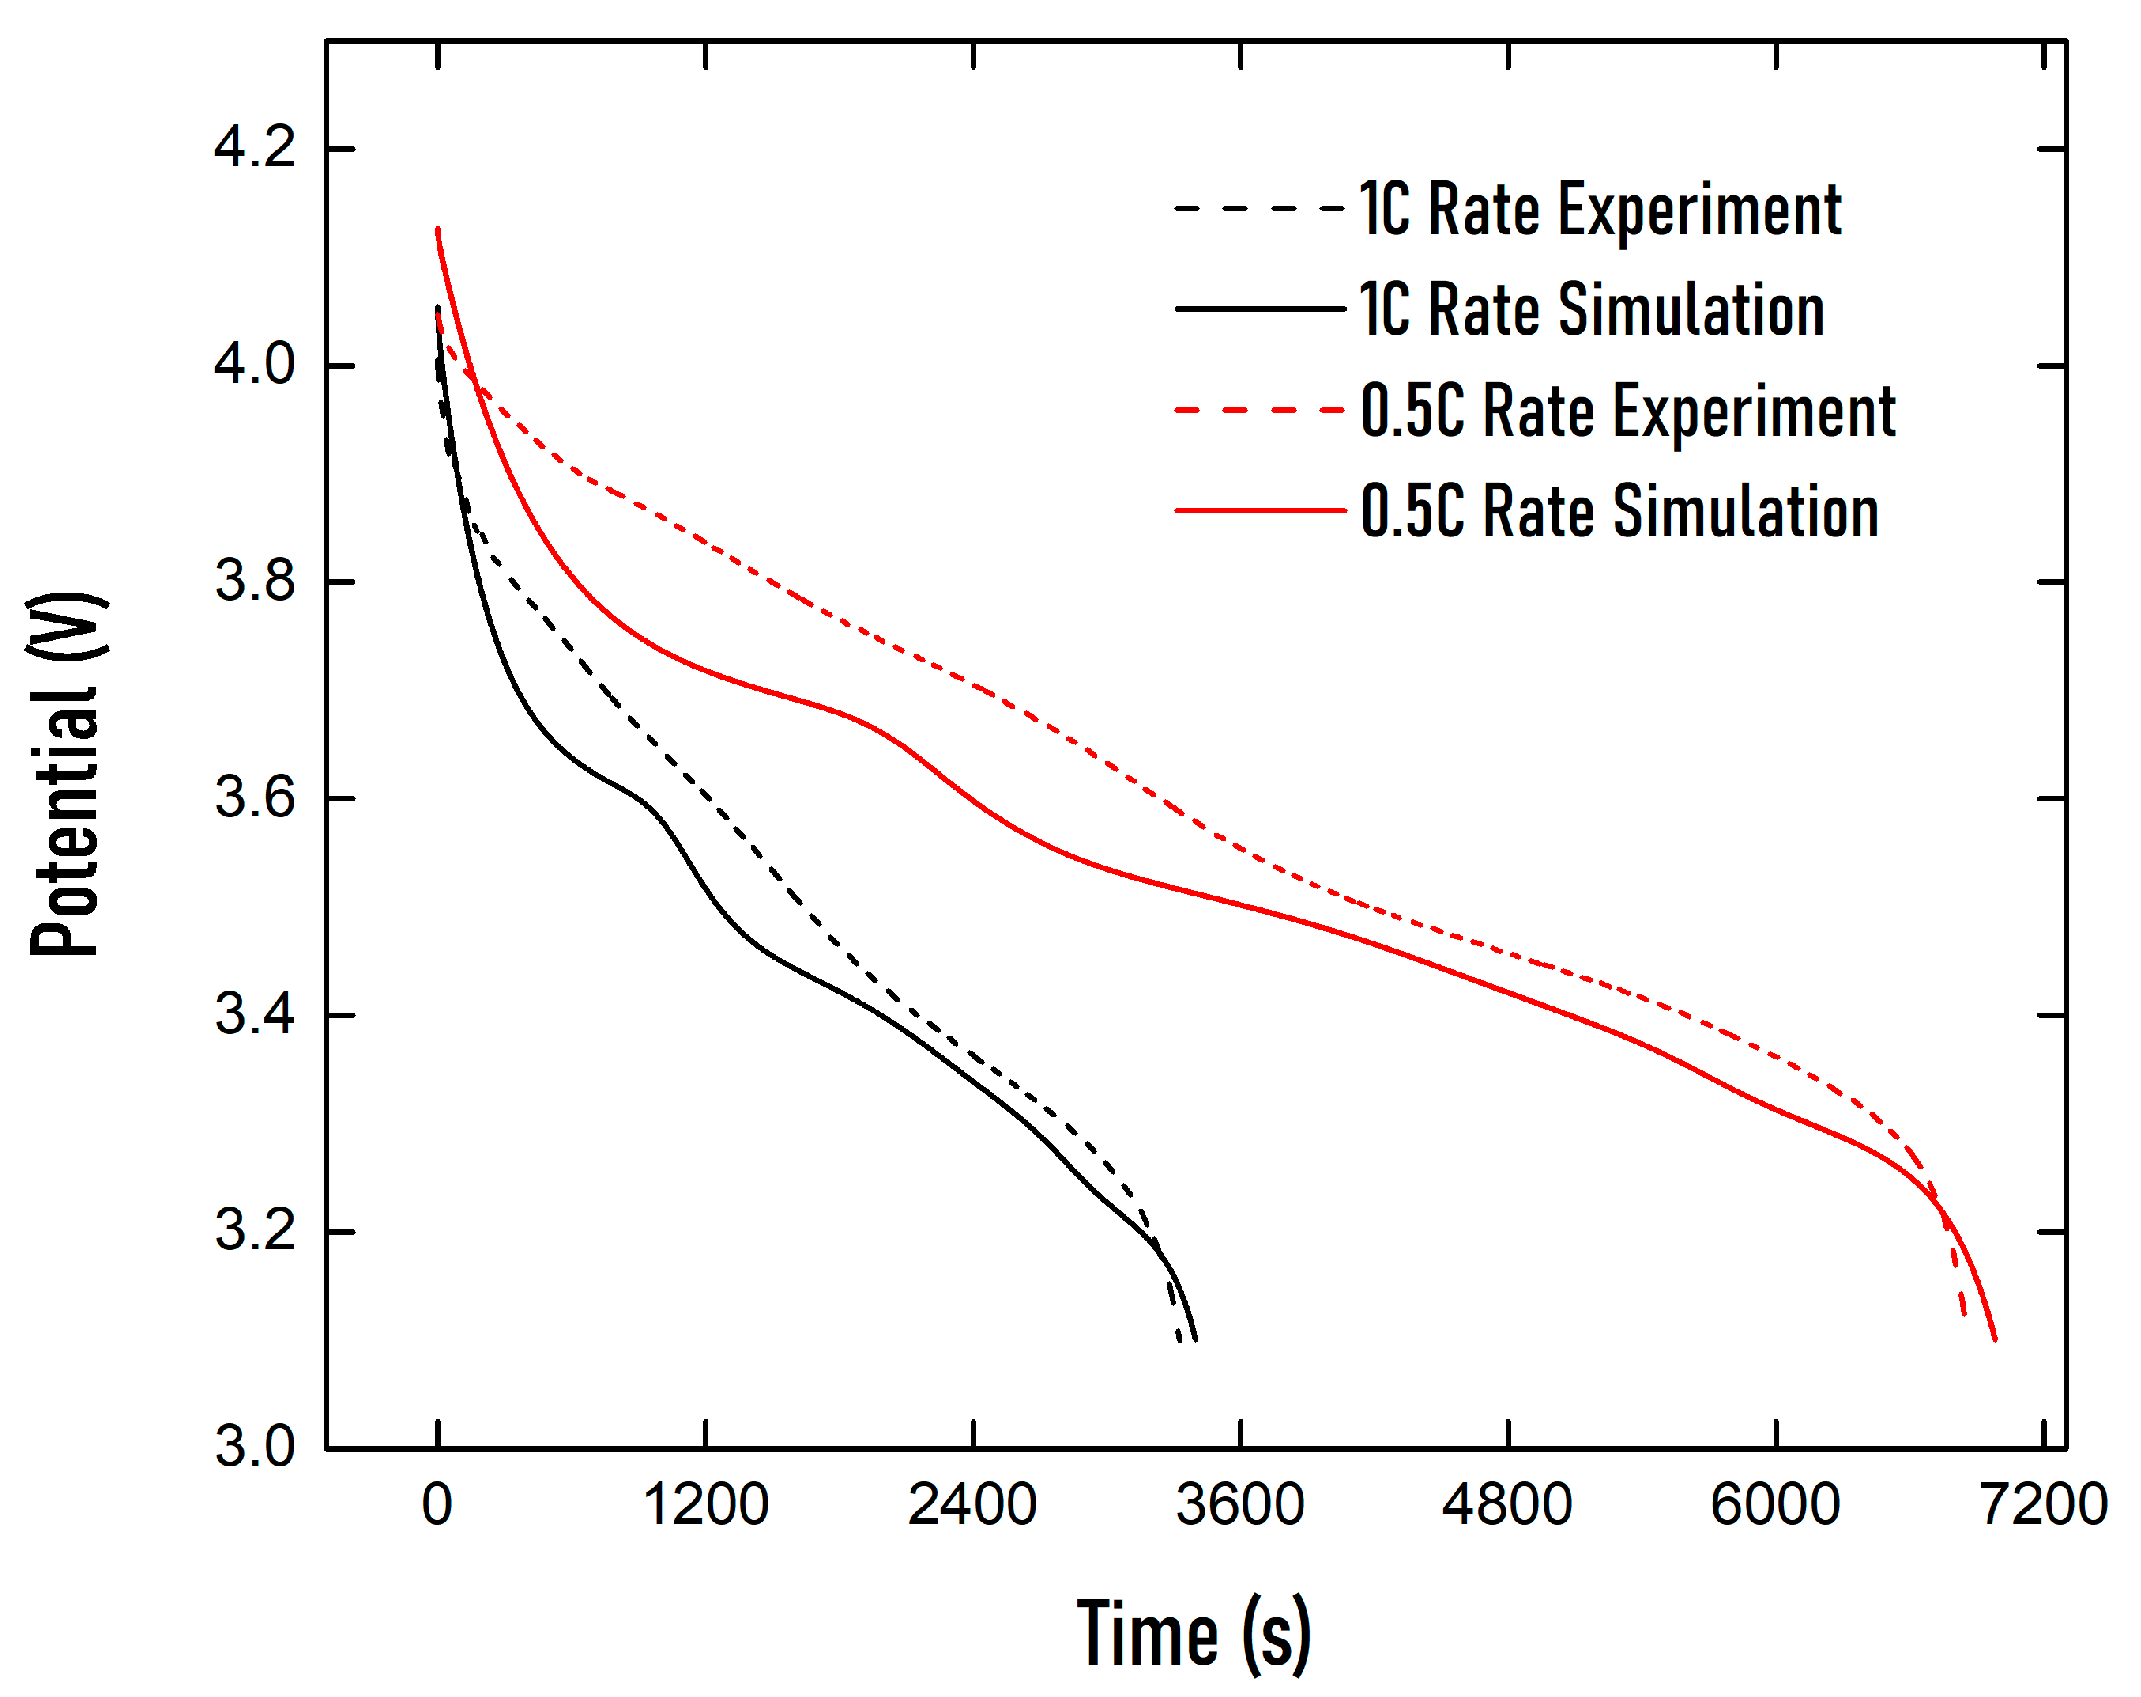
The discharge curve for both the experiment and the simulation can be seen in Figure 3. The calculated RMSE for the 1.0 C rate is 0.06 while the 0.5 C rate is 0.07, demonstrating that the generated model can be used as a reliable first approximation for battery behavior prediction. Figure 3 shows that the experimental discharge curve for both the 0.5 C and 1.0 C rate tests drops to the cut-off voltage earlier than the simulation. This may be factored by an overestimate of the specific surface of the cell affected by the imposed current density [43]. Additionally, it could be attributed to the aging of the cell since it was cycled for a certain period prior to the experiments [44]. However, in general, the current model is able to represent the electrochemical behavior of the cell during discharge. Nonetheless, incorporating descriptions of bulk lithium diffusion and surface kinetics may enhance the accuracy of the simulation.
In both C-rates, a slight decrease in simulated working potential can be seen at t = 1000 s for 1.0 C and t = 2000 s for 0.5 C, this abrupt change in slope denotes that a two-step discharge profile is evident for the battery chemistry [45,46,47]. This phenomenon was not profound in the experimental discharge except for a very minimal curve observed at 0.5 C at t = 4000 s. The voltage plateau defines the operating voltage the battery is suited for. The voltage plateaus are observed in both C-rates, but the plateau at the 0.5 C rate is more defined. A decrease in the voltage plateau is evident as an increase in the discharge rate was imposed. This is primarily due to higher polarization at the higher discharge C-rate, which leads to more significant polarization heat generation, further propagating to higher battery temperature operation.
To investigate the battery behavior at higher-discharge rates, a discharge profile for a 10 C rate was simulated, which can be seen in Figure S6a. Compared to both the simulated profile of the 0.5 and 1.0 C-rates in Figure 3, it is evident that there are higher activation losses as the C-rate increases. Figure S6b shows the distribution of the average lithium-ion concentration inserted at the electrodes during the simulated 10 C discharge rate at various times. A slight decrease in curvature can be seen on the negative electrode near the separator, especially during the early stages of discharge. As the position moves further from the separator, the average lithium-ion concentration becomes flat as it diffuses evenly. During the end of discharge, all lithium ions inserted from the negative electrode transfer to the positive electrode. The distribution of the average lithium-ion concentration in the electrolyte can be seen in Figure S6c during the 10 C simulated discharge. At the onset of the discharge process, the lithium-ion concentration in the electrolyte increases drastically in the negative electrode. The opposite can be seen in the positive electrode, where a sharp decrease is evident. The incremental change in lithium-ion concentration decreases slightly as time increases, and the difference becomes less profound as the end of discharge draws near. Furthermore, it is evident that, as the distance draws closer to the separator, the lithium-ion concentration of the negative electrode decreases, which is opposite to the case of the positive electrode.

3.2. Thermal Behavior

The electrochemical and thermal behaviors were simultaneously analyzed experimentally and computationally. The calculated RMSE was 1.5153 K using a timestep of 100 s for the 1.0 C discharge. Figure 4 illustrates the average battery surface temperature during 1.0 C discharge. The experimental and simulated battery surface temperature starts at about 303.5 K and reaches a maximum temperature of 311 K at the end of discharge, corresponding to nearly a 7.50 K increase in cell temperature. It can be seen in Figure 4 that the simulated results do not agree well with the experimental results, thus having a maximum temperature difference of around 3.0 K at about t = 600 s. It should not be demerited that the RMSE of 1.5 K can be at par with modern simulations with RMSE values ranging from 1.0 K [48] to 1.75 K [49]. The sources of discrepancy can be traced to various factors. One of these is that the electrochemical and thermal properties used in the literature from several years ago may no longer hold accurate values for modern batteries. Another factor is that most models of batteries have been focused on cylindrical batteries, such as 18650 and coin-type batteries, and less on pouch-type batteries [50].
Other sources of error may be due to the limitations of the simulated model itself. The generated model presumed uniform heat generation within the active battery material, which may cause inaccuracies. Assuming homogeneity of the system in calculating the thermodynamic properties may also factor into the errors. The thermodynamic property of the active battery material used is a volumetric average of the component materials’ properties. This assumption considers the active cell material to be a unified body that speeds up the calculation by reducing the number of grids [51]. A study by Capron examined the effects of homogenous cells and discrete cells, where the cell is split into smaller regions [48]. It was found that both the discharge curve and surface temperature profile of the cell have good agreement, with experimental results validating the reliability of a homogeneous cell with a simpler simulation design. However, the temperature profile of the internal region of the cell was captured fully using the discrete model. The merit of multiple layering is that it allows the determination of the point-by-point temperature gradient of the battery during operation, and portrays the temperature flow pattern at a certain time [13]. This analysis would require high-precision thermal cameras to determine experimental battery temperature and compare it with 3D simulation [52].
The accuracy of selecting the thermal boundary condition may also contribute to the discrepancies. Furthermore, the entropic change coefficient is a crucial parameter in predicting the heat generation inside the battery. The literature-provided entropic change coefficients were usually additionally fitted to experimental curves to heighten accuracy [26]. Unlike the graphite anode with various available entropic change coefficient equations, such as in the works of Rheinfeld et al. and Guo et al., the LCO has been given less attention. Currently, the fundamental entropic change coefficient used for the LCO cathode is a modification of what was used back in the 1990s. [53] This study, however, was limited to using the commonly used theoretical equations for its parameters and comparing the results to experimental data. Recent experimental studies of the LCO cathode have shown endothermic heat release from SOC > 0.8 and exothermic heat release from SOC < 0.8 [54]. This scenario cannot be reflected in Figure 2a, which shows that modern commercial batteries require rigorous experimental determination of critical electrochemical and thermal parameters to secure the model’s reliability and accuracy.
The electrochemical and thermal models were coupled with temperature and heat generation. The simulation results of the discharge and temperature profile of the 1.0 C rate can be seen in an overlapping figure in Figure S7. A slight increase in working potential at around t = 800 s may be due to the sudden temperature decrease of the battery owing to the endothermic reaction.
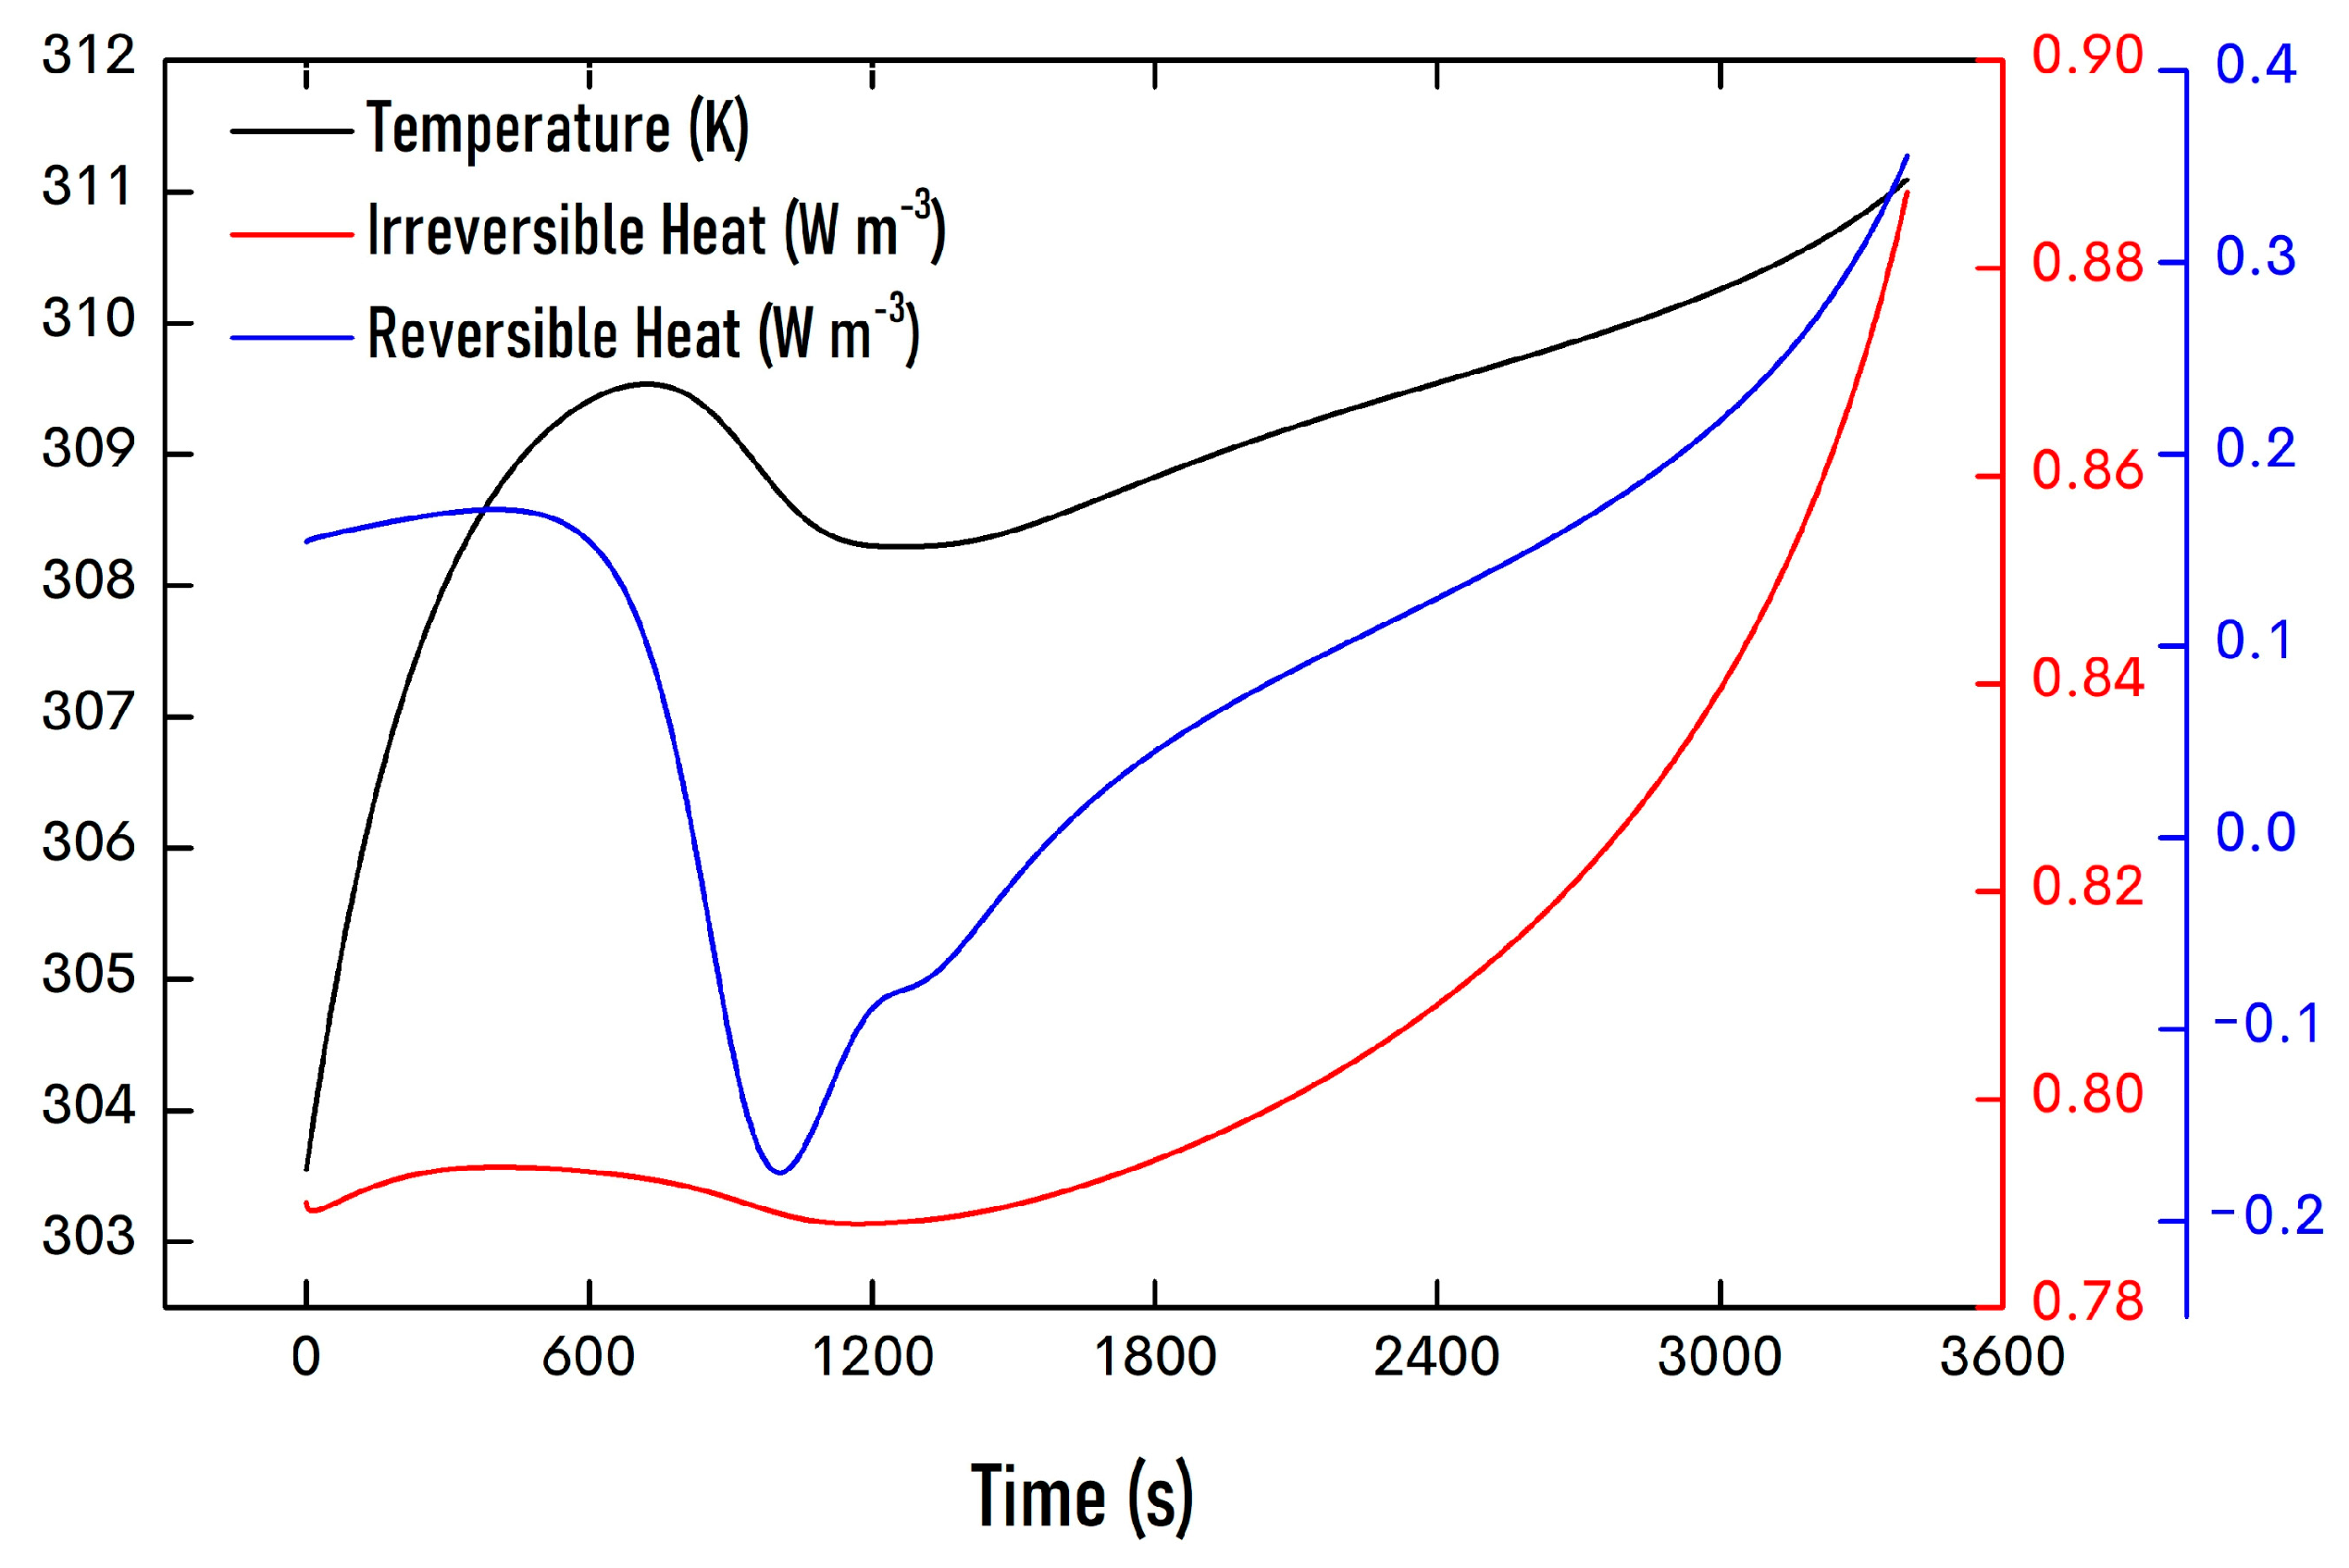
The general heat balance equation of Equation (16) determines the battery temperature. It is factored heavily on the heat generation coming from the battery consisting of the reversible heat generation and irreversible heat generation denoted in Equations (19) and (20), respectively. The effects of these two primary heat sources on the average battery surface temperature can be seen in Figure 5, where the values were determined using numerical simulation. The simulations exhibit an average heat generation of 0.90 W m−3 during 1 C discharge. As C rate increases, current density and ohmic heating also increase, thus resulting in greater energy lost as heat. This effect was validated as the average total heat generation at 10 C discharge rose to 13.20 W m−3, roughly fifteen times that of 1 C. Additionally, 0.5 C discharge presented an average total heat generation of 0.39 W m−3, which is around half that of 1 C discharge. This value is expected since the lower current density imposes lower ohmic heating. Determining the optimum and maximum operating C-rate of the battery to prevent overheating is, thus, of high importance.
During discharge, the surface SOC of the positive electrode increases while the surface SOC of the negative electrode decreases. During the initial discharge, both electrodes exhibit a negative entropic change coefficient in the regions where the SOC of the positive electrode ranges from 0.4 (initial) to 0.5 and of the negative electrode from 0.76 (initial) to 0.1. This negative entropic change coefficient exhibits exothermic heat release; the reversible heat generation and the irreversible heat generation both rise as t increases to 550 s and 600 s, respectively. The combined effect of the two heat sources explains the rapid temperature rise from the initial to t = 750 s. This initial temperature rise effect is consistent with those reported in the literature [55].
After the initial temperature rise associated with the increase in both reversible and irreversible heat, the simulated temperature drops from t = 750 s to t = 1200 s. This is mainly due to the reversible heat drop to a negative value designating an endothermic reaction. Unlike the irreversible heat that is always associated with heat production, reversible heat may either absorb or release heat. The entropic change coefficient of the positive electrode exhibits a positive value around SOC = 0.5 to 0.55, indicating an endothermic reaction. The battery heat absorption can be seen when the reversible heat suddenly drops after t = 550 s, and a negative reversible heat generation value is present at t = 800 s to t = 1600 s. Furthermore, as the battery temperature increases, the rising temperature gradient between the cell and surrounding accelerates heat dissipation of the battery, which in turn prevents temperature rise. In line with experimental results, from t = 1500 s to t = 2500 s, a slow temperature increase was present. Additionally, a stagnant temperature of about 308.5 K from t = 1800 s to t = 2400 s was observed. This phenomenon may be explained by a combination of possible endothermic heat by the electrodes and increased heat dissipation through convection. The former can be determined experimentally through potentiometric and calorimetric techniques [56].
During the final stage of discharge, the local surface SOC of the positive electrode reaches 1.0 while that of the negative electrode drops to zero. Despite the entropic heat coefficient of the negative electrode having a positive value signifying endothermal reaction, the negative exothermal value of the positive electrode holds a more significant amount than the reversible heat generation. The reversible heat generation rises from t = 1000 s until it becomes positive again at t = 1600 s. In return, the temperature rises back up from t = 1200 s, due to an escalation of both irreversible heat generation and reversible heat generation. The irreversible heat quickly increases due to a sharp surge in the magnitude of the overpotential as the discharge comes to an end. Consequently, the battery temperature also rises.
Overall, the thermal model provides viable results for a quick-glance view of the battery’s temperature profile during operation. The simulation can be improved by (i) incorporating a non-homogeneous active battery by developing a layer-by-layer cell to impose point-by-point temperature mapping, (ii) determining experimentally the physical properties of cell materials (i.e., thermal conductivity) to improve the accuracy and specificity of the model, (iii) including non-uniform heat generation to account for temperature gradients within the active material and, more importantly, (iv) fine-tuning the entropic change coefficient of the electrodes by joint experimental and numerical optimization to alter the overall curve of the temperature profile to tolerably match the experimental results.

3.3. Thermal Runaway Behavior

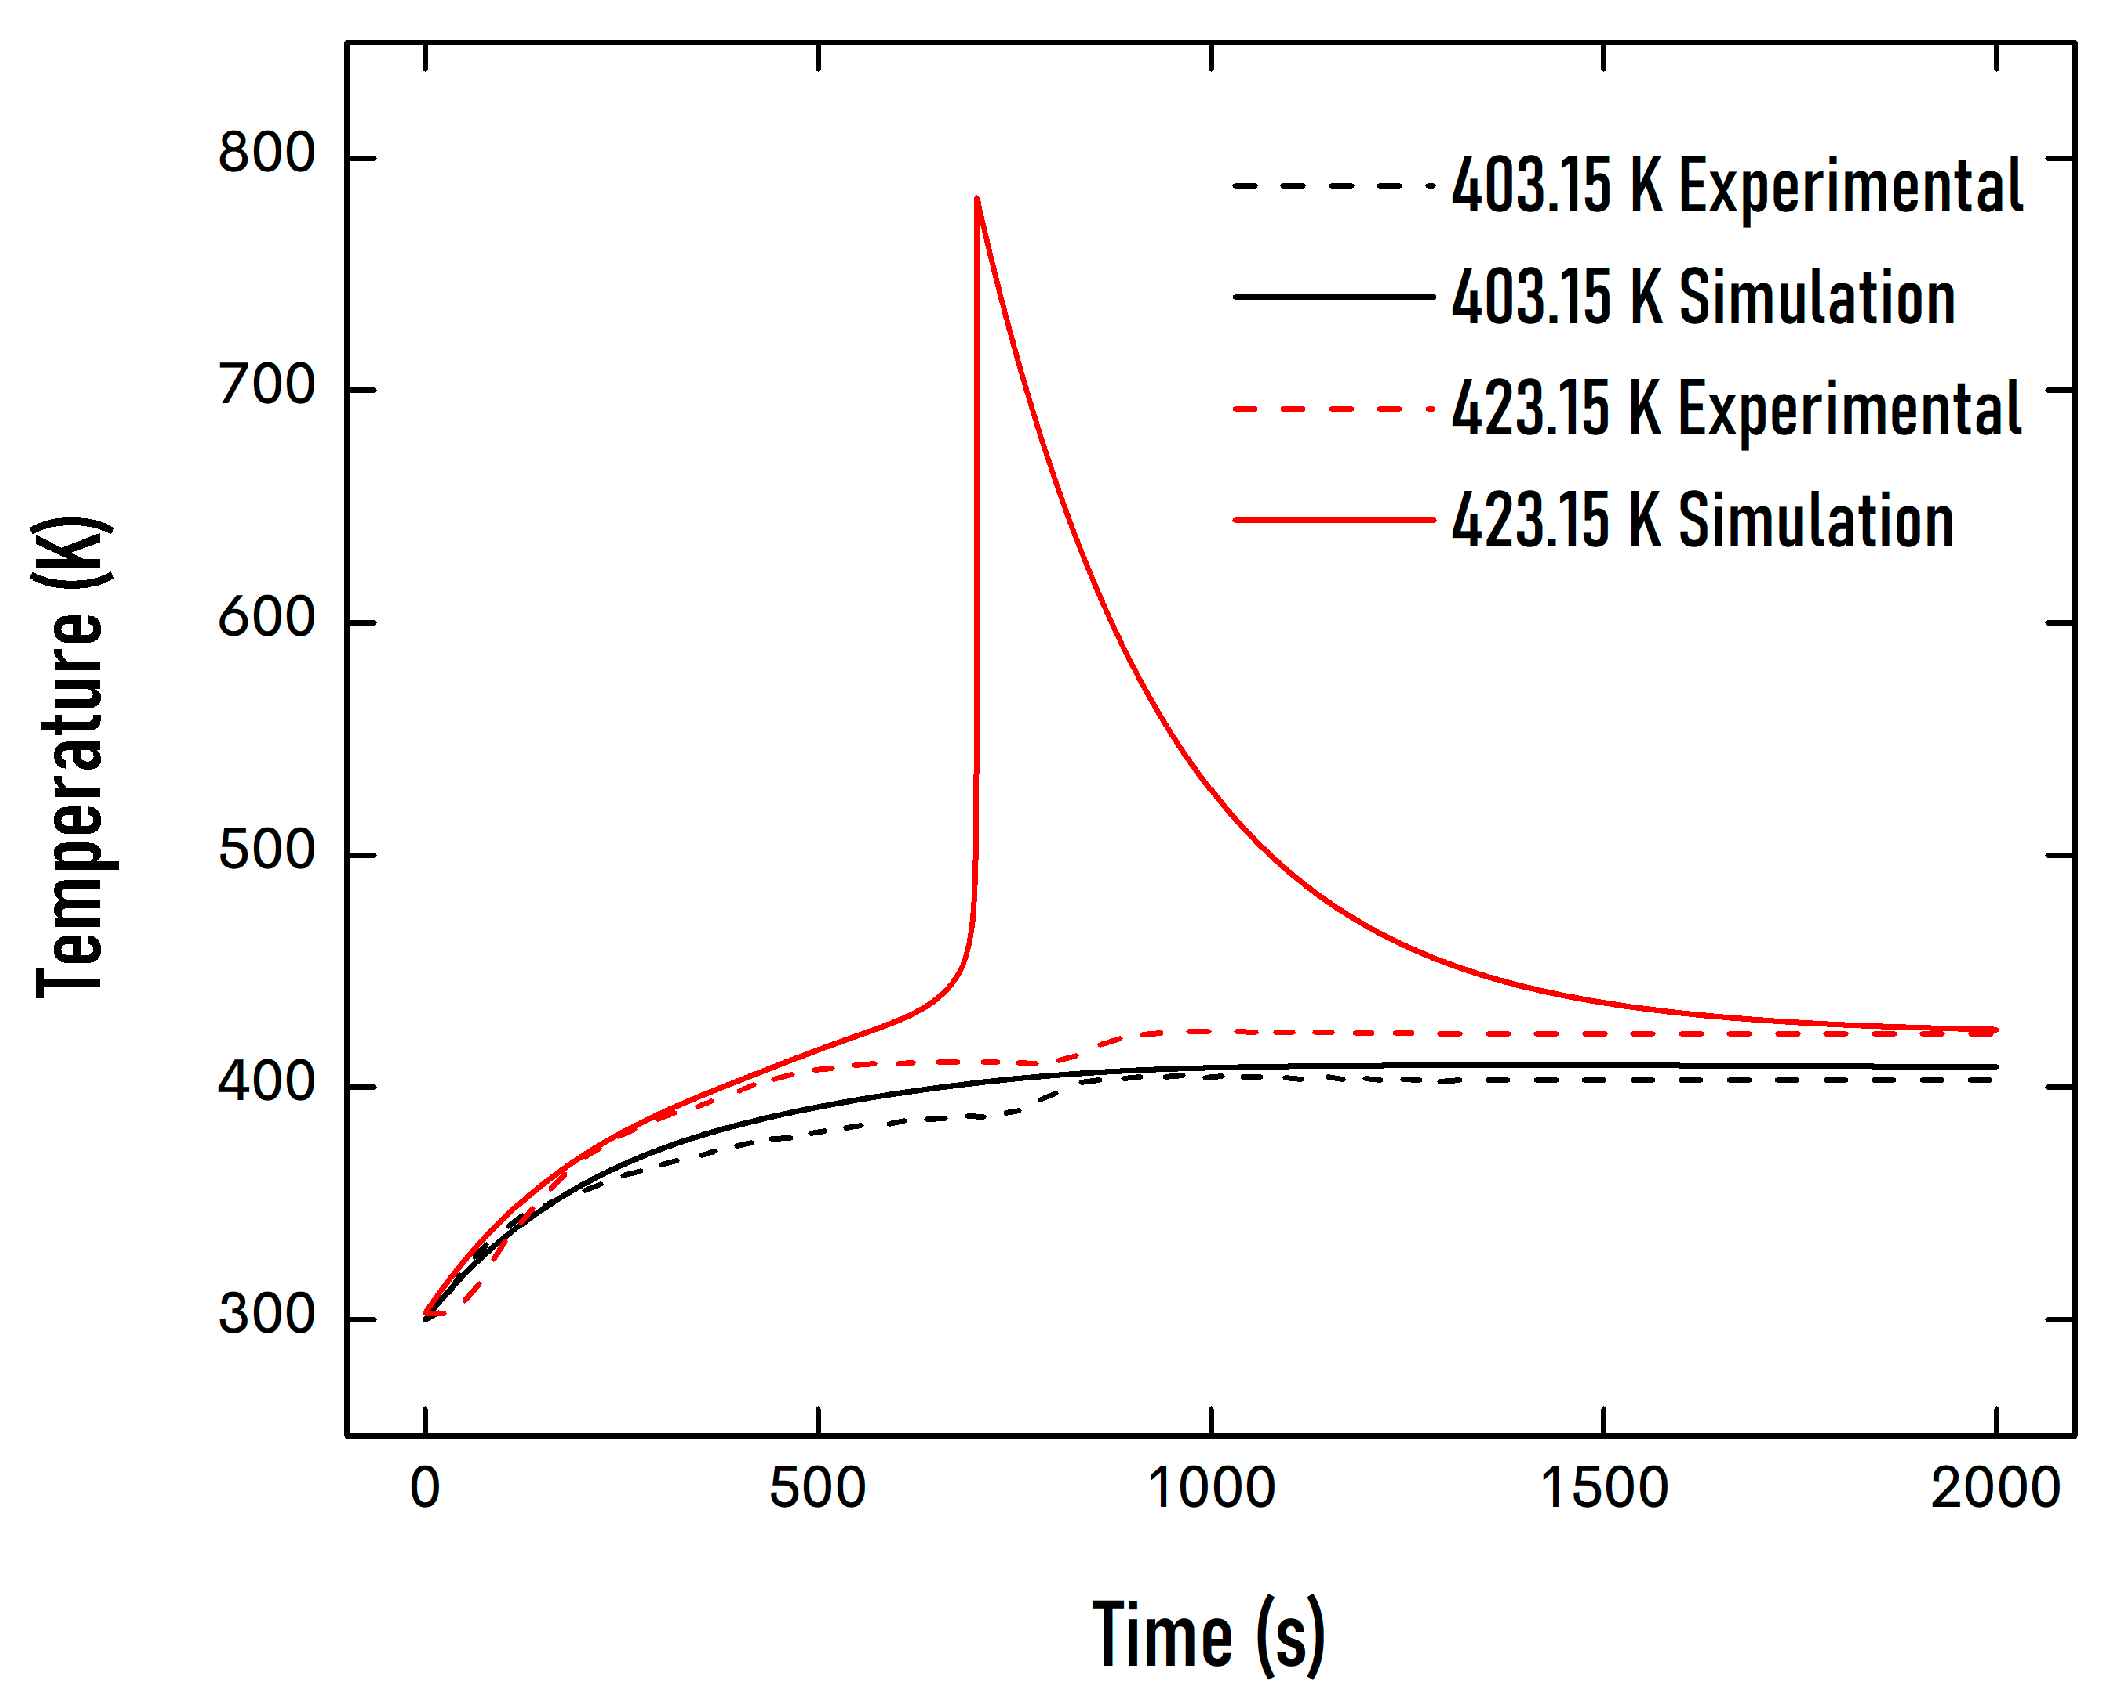
Figure 6 shows the experimental and simulated evolution of the average battery surface temperature during the oven tests conducted at 403.15 and 423.15 K. The initial battery temperature was approximately 301.15 K for both tests. During the 403.15 K oven test, a considerable temperature spike was not observed in the experimental and simulated data. The 403.15 K oven test has an RMSE value of 3.04 K using a timestep of 100 s. The principal error was in the t = 500 to 700 s region, where a maximum temperature difference of 9 K was observed. As seen in Figure 6, both experimental results developed a slight temperature increase at around t = 700 s. As both of the experimental results have a higher average surface temperature above their respective oven temperature, thermal runaway was triggered by the thermal abuse of external heating of the oven. This may indicate a sudden heat generation due to SEI decomposition and/or anode–electrolyte reaction, indicating the presence of the tipping point temperature.
The simulated battery temperature during the 423.15 K oven test showed an accelerated temperature peak starting at around t = 650 s and ultimately peaking at about t = 700 s. The temperature at the peak was about 773.15 K, which is 350 K higher than the oven temperature, indicating the occurrence of thermal runaway. However, the runaway spike effect was not reflected in the 423.15 K experimental battery oven test. This non-occurrence may be due to (1) the theoretical equations primarily based on cylindrical type cells, (2) homogenous average battery thermodynamic properties, (3) the no-vent condition imposed in the model, and (4) thermal expansion and mechanical stresses not considered in the model. The theoretical equations were adapted from the works of Hatchard et al., where the simulated temperature profile was compared with experimental data using 18650 cylindrical cells [57]. In their study, a temperature spike was not observed during an oven test performed at 423.15 K. However, their model showed otherwise, which is reflected in this study. Despite the difference, the authors stressed that the equations might be applied to pouch-type cells without comparison to experimental results from such geometry. Furthermore, the differences in cell radii and thicknesses could affect the occurrence of thermal runaway owing to the differences in the surface area-to-volume ratio, which consequently affects the dissipation of the internal heat generation. The thermodynamic properties of the cell play a crucial role in the accuracy of both the thermal and thermal runaway models. The model used in this study assumes homogeneous average thermodynamic properties in the active battery material in a block-type geometry rather than the actual layer-by-layer of a pouch-type battery. This assumption results in faster numerical computation by sacrificing the accuracy of internal heat transfer [58]. To improve model reliability, a layer-by-layer geometry of the pouch cell can be carried out to account for the series of active cell materials as conducted by Macdonald et al. for an LFP battery [59]. The results of their work were in close agreement with the experimental findings of Joachin et al. [60]. These studies highlight the importance of incorporating geometry-specific conditions to improve results; however, they also challenge the model to a longer computational time and greater complexity of the simulation equations.
The venting conditions of a 18650 cell were studied by Coman et al. The simulations of thermal runaway with and without venting electrolyte were compared to determine the effect of gas pressure. The venting parameter, which is another heat dissipation factor in the cell, changes when a temperature spike occurs [41]. The simulation results under gas-venting conditions corresponded well with the experimental time of the temperature spike. However, the simulated value of the temperature spike overshoots the experimental result by around two-fold, regardless of whether venting or no-vent conditions were imposed. Furthermore, imposing the vent condition requires experimental determination of the ejecta properties specific to the battery electrolyte. Overall, the venting condition is a powerful addition to the model to improve the agreement of the time of occurrence of thermal runaways.
The volumetric changes in battery configuration during thermal runaway can also deviate from its behavior. The expansion of the battery due to thermal stresses changes the heat transfer mechanism, as illustrated by the study of Xu et al., in which thermal gradients were affected by thermal expansion [61]. However, as in many studies, Xu et al. did not consider the temperature variations on volume changes of the battery geometry during operation. Additionally, simulations with and without thermal expansion consideration were not compared. The mechanical abuse of the cell components alters the temperature profile during thermal runaway [62]. In another study, Liu et al. developed a thermal runaway model due to short-circuit from mechanical abuse overloading [7]. An auxiliary mechanical model was added to the conventional thermal runaway model and resulted in a temperature difference graph similar to the experimental results. The added mechanical stress in the model indirectly affects the thermal runaway model through the short-circuit model, adding another heat generation variable.
The high temperature difference between the simulated and experimental results during thermal runaway makes it impractical to compute the RMSE for the 423.15 K oven test. The difference in temperature profiles of the two simulated oven tests demonstrates that different exothermic reactions occurred at the battery, where the severity of one reaction may have a more significant impact depending on the temperature the battery was exposed to. The 403.15 K oven test demonstrated sluggish exothermic reactions as the heat generated by the runaway reactions is quickly released in time without a temperature spike reflected in Figure 6. However, the simulated 423.15 K oven test illustrates more intensive exothermic reactions leading to intensive heat accumulation, ultimately raising the cell temperature at an accelerated pace, as seen in Figure 6. A supplementary oven test at 443.15 K (Figure S8) illustrates the non-occurrence of a temperature spike for the experiment. Furthermore, results showed a higher simulated temperature peak compared to the 423.15 K oven test due to the higher oven temperature. Moreover, the occurrence of a temperature spike at simulation occurred earlier than during the 423.15 K oven test.
To verify that the heat generation due to thermal runaway was within the active cell component, a 3D temperature distribution of the battery at pre- and post-thermal runaway was developed. Figure S9 shows the temperature distribution of the battery surface during the 423.15 K oven test. The temperature profile before thermal runaway (Figure S9a) shows that a higher temperature was observed at the current collectors than the battery material; this may be due to the difference in thermal conductivity and geometry of the current collectors and the metal cover of the battery. The temperature gradient demonstrates possible heat transfer from the current collector to active battery material. As the battery proceeds to be further heated, triggering a temperature spike due to thermal runaway, the active battery material experiences higher temperatures than the current collectors (Figure S9b). The homogenous average thermodynamic properties of the active battery material assumed in this model may affect the temperature distribution, as developing a layer-by-layer model could provide a different temperature profile at the cross-section of the battery that can hinder the speed of occurrence of thermal runaway. Furthermore, the effect of the series of exothermic reactions increases the battery temperature above that of the oven temperature and begins heat transfer to the current collector.
The simulated temperature profile of the thermal runaway by oven test is qualitatively analogous to the works of Hatchard et al. [57]. Compared to their works, this study has different quantitative values, such as the time of temperature spike and maximum cell temperature. Differences arose due to the differences in (1) cell configurations in which Hatchard et al. used 18650 cells, (2) oven test temperatures, and (3) employed thermodynamic parameters. Despite being quantitatively different, qualitative similarities are present in which a temperature spike indicates the presence of thermal runaway. Experimental literature findings, such as the polymer PVdF breaking down at 403.15 K [25], have been reflected by the presence of SEI decomposition. Thermal runaway can occur in LiPo batteries at 423.15 K [19] and be observed in the developed simulation. However, thermal runaway may not happen even at 423.15 K, depending on battery geometry [57].
The temperature the battery is exposed to plays a critical factor in determining the occurrence and severity of the exothermic reactions. Figure 7 shows the comparison between the dimensionless chemical parameters representing the degree of these reactions during the oven tests at 403.15 and 423.15 K. The SEI decomposition reaction degree is characterized by c S E I in Equation (30).  c S E I , which represents the dimensionless amount of Li-containing meta-stable species in the SEI, had an initial value of 0.15 [34]. Liu et al. proposed that the SEI decomposes exothermically at 363.15–393.15 K [34]. On the one hand, the SEI decomposition during the 403.15 K oven test started at t = 100 s, became more defined at around t = 400 s, and was completed around t = 1200 s. On the other hand, during the 423.15 K oven test, SEI decomposition started earlier around t = 80 s, became profound at t = 200 s, and ended earlier around t = 600 s. The time of occurrence of the SEI decomposition and the corresponding rate of reaction depend on the oven temperature.
The anode–electrolyte reaction occurs as the reaction proceeds to temperatures above the 393.15 K threshold of the SEI decomposition. The dimensionless c a parameter represents the amount of Li intercalated within the graphite carbon with an initial value set at 0.75. The anode–electrolyte reaction during the 403.15 K oven test began around t = 175 s and proceeded sluggishly. Meanwhile, the 423.15 K oven test showed the anode–electrolyte reaction earlier, at around t = 135 s and declined slowly thereafter. The value of  c a drastically decreased as t approached 520 s, dropped quickly at t = 650 s, and ultimately reached a zero value at t = 700 s. This rapid decrease is due to the temperature spike as observed in Figure 6, where the anode–electrolyte reaction accelerates due to the high battery temperature.
The cathode–electrolyte reaction is represented by α c e , which is the conversion degree of the reaction. The α c e has an initial value of 0.04. Figure 7 shows the evolution of the value of α c e . The cathode–electrolyte reaction during the 403.15 K oven test started around t = 310 s and then increased slowly. A considerable increase was observed around t = 650 s, where the corresponding battery temperature was approximately 438.15 K. The conversion degree reached unity, indicating the completeness of the reaction during the 423.15 K oven test at t = 700 s, where the temperature peaked as seen in Figure 6. The cathode–electrolyte reaction accelerated as the temperature was increased, especially when a threshold temperature was met.
The electrolyte decomposition reaction, which occurs when the temperature of the cell is about 473.15 K, is represented by the dimensionless concentration of electrolytes, c e , with an initial value of unity. Electrolyte decomposition did not occur for the 403.15 K oven test as the cell temperature did not meet the threshold criterion. A sharp decline in c e was observed for the 423.15 K oven test at t = 700 s, where the temperature spike occurred. The elevated battery temperature triggered the electrolyte decomposition reaction and exhausted the reaction quickly for about 50 s.
The 403.15 K oven test demonstrated two immediate exothermic reactions, namely the SEI decomposition and anode–electrolyte reactions. On one hand, the cathode–electrolyte reaction for the 403.15 K oven test was extremely sluggish and is negligible. On the other hand, the 423.15 K oven test exhibited all four thermal runaway exothermic reactions. The anode–electrolyte, cathode–electrolyte, and electrolyte decomposition reactions occurred intensely. Extreme changes led to an increased spontaneous heat accumulation, ultimately spiking the cell temperature, and indicating thermal runaway.
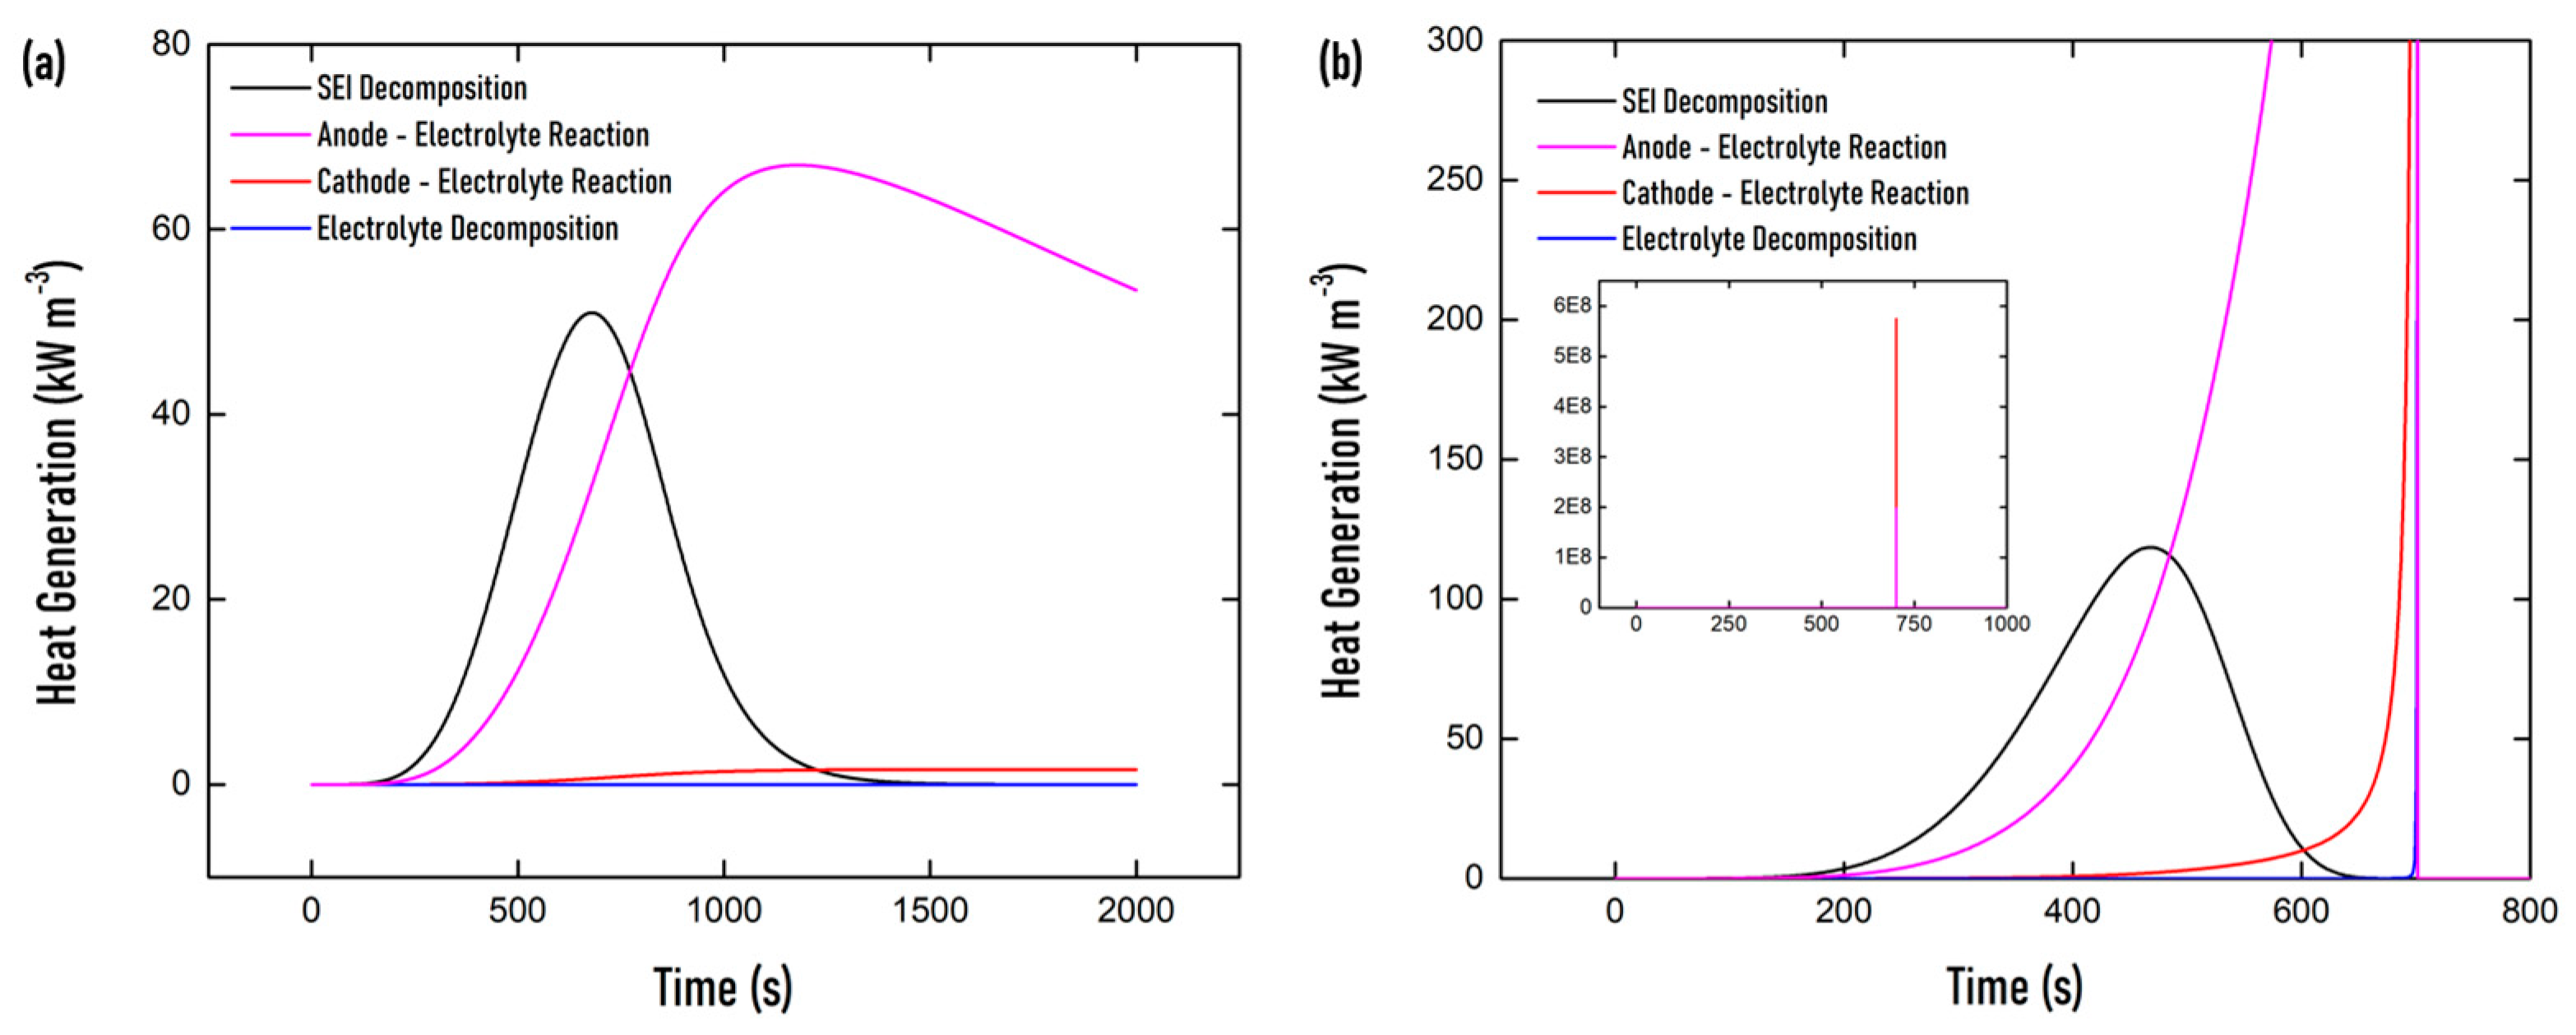
Figure 8a,b illustrate the exothermic reactions for the 403.15 and 423.15 K oven tests, respectively. Figure 8b has a superimposed graph in which the full range of heat generation is presented.
During the 403.15 K oven test, the SEI decomposition reaction and anode–electrolyte reaction mainly contributed to the heat generated in the cell seen in Figure 8a. The SEI decomposition proceeded and ended earlier than the anode–electrolyte reaction. The cathode–electrolyte reaction occurred at a sluggish pace of heat generation, while the electrolyte decomposition reaction did not proceed. The occurrence and severity of the exothermic reactions are analogous to the behavior of their respective dimensionless chemical parameters or reaction degree.
All four exothermic reactions occurred during the 423.15 K oven test, as seen in Figure 8b. Qualitatively, the SEI decomposition reaction was parallel with the results from the 403.15 K oven test with a slightly longer initial heat generation rise. The two electrode–electrolyte and electrolyte decomposition reactions occurred far more intensely. The cathode–electrolyte reaction gave off the maximum heat generation rate for all reactions at 5.7 × 10⁸ kW m−3, which was negligible in the 403.15 K oven test. Similar extreme heat generation was determined by Shelke et al., where a heat generation of about 107 kW m−3 was experienced for an NMC battery undergoing thermal runaway at around 573 K [63]. The same occurrence was exhibited by the model of Zhang et al., where maximum heat generation (3 × 10⁵ kW m−3) due to cathode–electrolyte reaction was achieved at 500 K [20]. The generated model exhibited higher heat generation primarily due to the higher temperature of thermal runaway occurrence and due to the different battery chemistry investigated.
The cathode–electrolyte reaction was the primary heat generation source of the thermal runaway. Selecting the appropriate cathode material with excellent thermal stability is critical to reducing the risk of thermal runaway, thus improving battery safety.

4. Conclusions

A multiphysics model was successfully developed for an LCO-graphite-PVdF-HFP pouch LiPo battery capturing the electrochemical, thermal, and thermal runaway behavior using COMSOL Multiphysics. The simulated model consisted of a P2D electrochemical model and a 3D thermal and thermal runaway model and was compared using experimental results using a commercial GEB 585460 LiPo battery.
Simulated electrochemical behavior was investigated and validated, showing competitive accuracy with a low RMSE of 0.06 V for 1 C discharge. The electrochemical model can be quickly adapted to different battery chemistries by simply modifying the physical material properties. Additionally, electrochemical behavior from geometric changes, such as electrode thickness, can be rapidly simulated and utilized to optimize battery design. Simulation results showed a two-step discharge phenomenon for the battery but were not apparent in the experimental cell. Working voltage plateau regions were shortened as the C-rate increased, demonstrated in both the simulation and experiment, due to higher polarization at higher discharge currents.
Simulated thermal behavior during discharge exhibited a viable RMSE of 1.5 K at 1 C discharge with an average heat generation of 0.90 W m−3. However, the model showed appreciable qualitative discrepancies from experimental results. A buffering of temperature rise was present in both the experiment and the simulation. The increase in the temperature gradient of the battery and sink increased the heat dissipation by convection and hindered temperature buildup. Another factor that affected the phenomenon was heat generation. The reversible and irreversible battery heat generation was successfully determined using the model. The simulated thermal profile showed a prominent decrease in average surface battery temperature, which was absent in the experiment. The temperature lowering by heat absorption was primarily due to the reversible heat generation, where the endothermic values were present in the simulation. The reversible heat is a vital function of the entropic change coefficient intrinsic in nature to the electrode material. As the electrochemical and thermal models were coupled by temperature and heat generation, both models’ veracity heavily relies on the accuracy of parameters determined in the literature used by the study.
The simulated thermal runaway model indicated that thermal abuse at 403.15 K in the oven test does not initiate thermal runaway and heavily relies on heat generation by SEI decomposition and anode–electrolyte reaction. Thermal abuse during the 423.15 K oven test triggered runaway and exhibited all four exothermic reactions in which the cathode–electrolyte reaction is the primary heat source reaching a heat generation of 5.7 × 10⁸ kW m−3. This entails the careful selection of cathode material to minimize the likelihood of thermal runaway is necessary.
The developed multiphysics model can serve as an initial bird’s-eye view of predicting battery behavior at various operational conditions. It is recommended to explore extended numerical simulations situated in thermal runaway, such as short circuit analysis, which explores the heat generation from cell puncture and separator breakdown, mechanical abuse that changes the volumetric configuration of the cell during thermal runaway, thus altering the heat transfer mechanism, a full 3D geometric model of the battery thus including layering effects in pouch-type and jelly-roll cells, a gas-pressure buildup that considers the venting mechanism leading to additional heat release conditions, and fire and explosion models that consider the magnitude of sudden pressure burst. Furthermore, developing a parametric study and a sensitivity analysis of the parameters used in the models is recommended to extend the optimization of battery design and enhance the reliability and quality of the model.

Supplementary Materials

The following supporting information can be downloaded at: https://www.mdpi.com/article/10.3390/en16062642/s1, Figure S1: Lithium-ion battery charge and discharge mechanism for an LCO-graphite battery cell illustrate the lithium ions’ intercalation and deintercalation.; Figure S2: Schematic diagram of the P2D electrochemical model.; Figure S3: Schematic diagram of the study.; Figure S4: Schematic illustration of the thermocouple positioning at one side of the battery during thermal and thermal runaway tests.; Figure S5: An illustration of the geometrical meshes of the multiphysics models used in the study.; Figure S6: Simulated results of 10 C discharge rate.; Figure S7: Simultaneous analysis of simulated working potential and average surface battery temperature during 1.0 C rate discharge.; Figure S8: Simulation and experimental average battery surface temperature vs. time during 443.15 K oven test; Figure S9: Three-dimensional temperature distribution simulation of 423.15 K oven test.

Author Contributions

Conceptualization, J.A.D.R.P.; supervision, J.A.D.R.P.; writing-review & editing, J.A.D.R.P.; formal analysis, M.R.B.D.; investigation, M.R.B.D.; methodology, M.R.B.D.; validation, M.R.B.D.; writing-original draft, M.R.B.D. All authors have read and agreed to the published version of the manuscript.

Funding

This research was funded by the Department of Science and Technology (DOST) through the Niche Centers in the Regions for R&D (NICER) Program, through the Advanced Batteries Center Program (REBCell Project), and by the Office of the Chancellor of the University of the Philippines Diliman, through the Office of The Vice Chancellor for Research and Development, through the Outright Research Grant (Project No. 222210 ORG).

Data Availability Statement

The data presented in this study is contained within the article and Supplementary Material.

Acknowledgments

Julie Anne D.R. Paraggua would like to acknowledge the Jerome and Iralyn Cainglet Professorial Chair in Chemical Engineering. Marcel Roy B. Domalanta would like to acknowledge the DOST Engineering Research and Development (ERDT) Scholarship program.

Conflicts of Interest

The authors declare no conflict of interest. The funders had no role in the design of the study; in the collection, analyses, or interpretation of data; in the writing of the manuscript; or in the decision to publish the results.

Abbreviations

AbbreviationMeaning
CSTConcentrated solution theory
GPEGel polymer electrolyte
LCOLithium Cobalt Oxide
LIBLithium-ion battery
LiPoLithium-polymer
OCPOpen circuit potential
ODEOrdinary differential equation
P2DPseudo-2-dimensional
PDEPartial differential equation
PVdF-HFPPoly(vinylidene fluoride-hexafluoropropylene)
RMSERoot mean square error
SEISolid electrolyte interface
SOCState of charge

List of Symbols

SymbolSI UnitMeaning
A s−1Frequency factor
a m−1Specific surface area
c mol·m−3Concentration
c a 1Dimensionless amount of lithium intercalated within the carbon
c e 1The dimensionless concentration of electrolytes
c p J·kg−1 K−1Specific heat at isobaric conditions
c S E I 1Dimensionless amount of lithium-containing meta-stable species in the SEI
D m2·s−1Diffusion coefficient
E a J·mol−1Activation energy
F C·mol−1Faraday constant
f ± 1The mean molar activity coefficient of an electrolyte
H J·kg−1Heat release
h W·m−3 K−1Heat transfer coefficient
i A·m−2Current density
i 0 A·m−2Exchange current density
km2.5·mol−0.5 s−1Reaction rate constant
LmLength
q W·m−3Volumetric heat generation
q r e j W·m−3Volumetric heat rejected
R J·mol−1 K−1Ideal gas constant
r MRadial position across a spherical particle
r p MRadius of the particle
T KTemperature
t STime
t L i 1Transference number of lithium-ion
U e q VEquilibrium cell potential
W kg·m−3Specific material content
x mAxial position along x-axis
z 1Dimensionless measure of the SEI layer thickness
z 0 1Reference dimensionless measure of the SEI layer thickness
Greek symbols
α 1Transfer coefficient
α c e 1Cathode–electrolyte conversion degree
ε 1Volume fraction
η VOverpotential
κ S·m−1Ionic conductivity
κ D S·m−1Diffusional conductivity
λ W·m−1 K−1Thermal conductivity
ρ kg·m−3Density
σ S·m−1Electronic conductivity
ϕ VElectric potential

List of Superscripts

SuperscriptMeaning
EElectrolyte phase
SSolid phase

List of Subscripts

SubscriptMeaning
Label
e … of the electrolyte decomposition
ambAmbient condition
a c Anode specific carbon content
effEffective (accounts for tortuosity by Bruggeman correlation)
p Cathode specific positive active content
L Length of the battery cell
Species
A… of the anode
a e … of the anode–electrolyte interaction
a n s … of the anode–separator interface
B… of the battery model
C… of the cathode
c e … of the cathode–electrolyte interaction
c a c c … of the cathode–current collector interface
Li… of the lithium-ion
ohm… from ohmic heat
pol… from active polarization
rev… from reversible reactions
SEI… of the SEI decomposition
TR… of the thermal runaway model

References

  1. Treptow, R.S. Lithium Batteries: A Practical Application of Chemical Principles. J. Chem. Educ. 2003, 80, 1015. [Google Scholar] [CrossRef]
  2. Xu, P.; Chen, H.; Zhou, X.; Xiang, H. Gel Polymer Electrolyte Based on PVDF-HFP Matrix Composited with RGO-PEG-NH2 for High-Performance Lithium Ion Battery. J. Membr. Sci. 2020, 617, 118660. [Google Scholar] [CrossRef]
  3. Jia, Y.; Uddin, M.; Li, Y.; Xu, J. Thermal Runaway Propagation Behavior within 18650 Lithium-Ion Battery Packs: A Modeling Study. J. Energy Storage 2020, 31, 101668. [Google Scholar] [CrossRef]
  4. Xu, M.; Zhang, Z.; Wang, X.; Jia, L.; Yang, L. A Pseudo Three-Dimensional Electrochemical–Thermal Model of a Prismatic LiFePO4 Battery during Discharge Process. Energy 2015, 80, 303–317. [Google Scholar] [CrossRef]
  5. Gandolfo, D.; Brandão, A.; Patiño, D.; Molina, M. Dynamic Model of Lithium Polymer Battery—Load Resistor Method for Electric Parameters Identification. J. Energy Inst. 2015, 88, 470–479. [Google Scholar] [CrossRef]
  6. Devillers, N.; Péra, M.-C.; Jemei, S.; Gustin, F.; Bienaimé, D. Complementary Characterization Methods for Lithium-Ion Polymer Secondary Battery Modeling. Int. J. Electr. Power Energy Syst. 2015, 67, 168–178. [Google Scholar] [CrossRef]
  7. Liu, B.; Zhao, H.; Yu, H.; Li, J.; Xu, J. Multiphysics Computational Framework for Cylindrical Lithium-Ion Batteries under Mechanical Abusive Loading. Electrochim. Acta 2017, 256, 172–184. [Google Scholar] [CrossRef]
  8. Doyle, M.; Newman, J. The Use of Mathematical Modeling in the Design of Lithium/Polymer Battery Systems. Electrochim. Acta 1995, 40, 2191–2196. [Google Scholar] [CrossRef]
  9. Doyle, M.; Fuller, T.; Newman, J. Modeling of Galvanostatic Charge and Discharge of the Lithium/Polymer/Insertion Cell. J. Electrochem. Soc. 1993, 140, 1526–1533. [Google Scholar] [CrossRef]
  10. Fuller, T.F.; Doyle, M.; Newman, J. Simulation and Optimization of the Dual Lithium Ion Insertion Cell. J. Electrochem. Soc. 1994, 141, 1. [Google Scholar] [CrossRef] [Green Version]
  11. Thomas, K.E.; Newman, J.; Darling, R.M. Mathematical Modeling of Lithium Batteries. In Advances in Lithium-Ion Batteries; van Schalkwijk, W.A., Scrosati, B., Eds.; Springer US: Boston, MA, USA, 2002; pp. 345–392. ISBN 978-0-306-47508-5. [Google Scholar]
  12. Doyle, M.; Newman, J.; Gozdz, A.S.; Schmutz, C.N.; Tarascon, J.-M. Comparison of Modeling Predictions with Experimental Data from Plastic Lithium Ion Cells. J. Electrochem. Soc. 1996, 143, 1890–1903. [Google Scholar] [CrossRef]
  13. Ghalkhani, M.; Bahiraei, F.; Nazri, G.-A.; Saif, M. Electrochemical–Thermal Model of Pouch-Type Lithium-Ion Batteries. Electrochim. Acta 2017, 247, 569–587. [Google Scholar] [CrossRef]
  14. Yang, X.; Hu, X.; Chen, Z.; Chen, Y. Effect of Ambient Dissipation Condition on Thermal Behavior of a Lithium-Ion Battery Using a 3D Multi-Partition Model. Appl. Therm. Eng. 2020, 178, 115634. [Google Scholar] [CrossRef]
  15. Feng, X.; Ren, D.; He, X.; Ouyang, M. Mitigating Thermal Runaway of Lithium-Ion Batteries. Joule 2020, 4, 743–770. [Google Scholar] [CrossRef]
  16. Svoboda, V. BATTERIES|Fast Charging. In Encyclopedia of Electrochemical Power Sources; Garche, J., Ed.; Elsevier: Amsterdam, The Netherlands, 2009; pp. 424–442. ISBN 978-0-444-52745-5. [Google Scholar]
  17. Warner, J.T. Lithium-Ion Battery Chemistries: A Primer; Elsevier: Amsterdam, The Netherlands, 2019; ISBN 978-0-12-814779-5. [Google Scholar]
  18. Wang, Q.; Ping, P.; Zhao, X.; Chu, G.; Sun, J.; Chen, C. Thermal Runaway Caused Fire and Explosion of Lithium Ion Battery. J. Power Sources 2012, 208, 210–224. [Google Scholar] [CrossRef]
  19. Uchida, I.; Ishikawa, H.; Mohamedi, M.; Umeda, M. AC-Impedance Measurements during Thermal Runaway Process in Several Lithium/Polymer Batteries. J. Power Sources 2003, 119, 821–825. [Google Scholar] [CrossRef]
  20. Zhang, L.; Zhao, P.; Xu, M.; Wang, X. Computational Identification of the Safety Regime of Li-Ion Battery Thermal Runaway. Appl. Energy 2020, 261, 114440. [Google Scholar] [CrossRef]
  21. Domalanta, M.R.B.; Castro, M.T.; Ocon, J.D.; del Rosario, J.A.D. An Electrochemical-Thermal Multiphysics Model for Lithium Polymer Battery. Chem. Eng. Trans. 2022, 94, 145–150. [Google Scholar] [CrossRef]
  22. Cai, L.; White, R.E. Mathematical Modeling of a Lithium Ion Battery with Thermal Effects in COMSOL Inc. Multiphysics (MP) Software. J. Power Sources 2011, 196, 5985–5989. [Google Scholar] [CrossRef]
  23. Abada, S.; Marlair, G.; Lecocq, A.; Petit, M.; Sauvant-Moynot, V.; Huet, F. Safety Focused Modeling of Lithium-Ion Batteries: A Review. J. Power Sources 2016, 306, 178–192. [Google Scholar] [CrossRef]
  24. Chen, J.; Ren, D.; Hsu, H.; Wang, L.; He, X.; Zhang, C.; Feng, X.; Ouyang, M. Investigating the Thermal Runaway Features of Lithium-Ion Batteries Using a Thermal Resistance Network Model. Appl. Energy 2021, 295, 117038. [Google Scholar] [CrossRef]
  25. Allen, J. Review of Polymers in the Prevention of Thermal Runaway in Lithium-Ion Batteries. Energy Rep. 2020, 6, 217–224. [Google Scholar] [CrossRef]
  26. Guo, M.; Sikha, G.; White, R.E. Single-Particle Model for a Lithium-Ion Cell: Thermal Behavior. J. Electrochem. Soc. 2011, 158, A122. [Google Scholar] [CrossRef]
  27. Han, X.; Ouyang, M.; Lu, L.; Li, J. Simplification of Physics-Based Electrochemical Model for Lithium Ion Battery on Electric Vehicle. Part I: Diffusion Simplification and Single Particle Model. J. Power Sources 2015, 278, 802–813. [Google Scholar] [CrossRef]
  28. Lamorgese, A.; Mauri, R.; Tellini, B. Electrochemical-Thermal P2D Aging Model of a LiCoO2/Graphite Cell: Capacity Fade Simulations. J. Energy Storage 2018, 20, 289–297. [Google Scholar] [CrossRef]
  29. Thomas, K.E.; Bogatu, C.; Newman, J. Measurement of the Entropy of Reaction as a Function of State of Charge in Doped and Undoped Lithium Manganese Oxide. J. Electrochem. Soc. 2001, 148, A570. [Google Scholar] [CrossRef]
  30. Richter, F.; Gunnarshaug, A.; Burheim, O.S.; Vie, P.J.S.; Kjelstrup, S. Single Electrode Entropy Change for LiCoO2 Electrodes. ECS Trans. 2017, 80, 219. [Google Scholar] [CrossRef] [Green Version]
  31. Viswanathan, V.V.; Choi, D.; Wang, D.; Xu, W.; Towne, S.; Williford, R.E.; Zhang, J.G.; Liu, J.; Yang, Z. Effect of Entropy Change of Lithium Intercalation in Cathodes and Anodes on Li-Ion Battery Thermal Management. J. Power Sources 2010, 195, 3720–3729. [Google Scholar] [CrossRef]
  32. Rheinfeld, A.; Sturm, J.; Noel, A.; Wilhelm, J.; Kriston, A.; Pfrang, A.; Jossen, A. Quasi-Isothermal External Short Circuit Tests Applied to Lithium-Ion Cells: Part II. Modeling and Simulation. J. Electrochem. Soc. 2019, 166, A151–A177. [Google Scholar] [CrossRef]
  33. Yazami, R.; Reynier, Y. Thermodynamics and Crystal Structure Anomalies in Lithium-Intercalated Graphite. J. Power Sources 2006, 153, 312–318. [Google Scholar] [CrossRef]
  34. Liu, H.; Wei, Z.; He, W.; Zhao, J. Thermal Issues about Li-Ion Batteries and Recent Progress in Battery Thermal Management Systems: A Review. Energy Convers. Manag. 2017, 150, 304–330. [Google Scholar] [CrossRef]
  35. Jeon, D.H. Numerical Modeling of Lithium Ion Battery for Predicting Thermal Behavior in a Cylindrical Cell. Curr. Appl. Phys. 2014, 14, 196–205. [Google Scholar] [CrossRef]
  36. Tang, S.; Wang, Z.; Guo, H.; Wang, J.; Li, X.; Yan, G. Simulating the Distribution of Electrochemical Characteristics: A Case Study of 4.35 V LiCoO2/Graphite Pouch Cell. Electrochim. Acta 2020, 354, 136634. [Google Scholar] [CrossRef]
  37. Jiang, F.; Peng, P. Elucidating the Performance Limitations of Lithium-Ion Batteries Due to Species and Charge Transport through Five Characteristic Parameters. Sci. Rep. 2016, 6, 32639. [Google Scholar] [CrossRef] [Green Version]
  38. Ramadass, P.; Haran, B.; White, R.; Popov, B.N. Mathematical Modeling of the Capacity Fade of Li-Ion Cells. J. Power Sources 2003, 123, 230–240. [Google Scholar] [CrossRef]
  39. Peng, P.; Sun, Y.; Jiang, F. Thermal Analyses of LiCoO2 Lithium-Ion Battery during Oven Tests. Heat Mass Transf. 2014, 50, 1405–1416. [Google Scholar] [CrossRef]
  40. Kim, G.-H.; Pesaran, A.; Spotnitz, R. A Three-Dimensional Thermal Abuse Model for Lithium-Ion Cells. J. Power Sources 2007, 170, 476–489. [Google Scholar] [CrossRef]
  41. Jiang, K.; Liao, G.; Jiaqiang, E.; Zhang, F.; Chen, J.; Leng, E. Thermal Management Technology of Power Lithium-Ion Batteries Based on the Phase Transition of Materials: A Review. J. Energy Storage 2020, 32, 101816. [Google Scholar] [CrossRef]
  42. Coman, P.T.; Rayman, S.; White, R.E. A Lumped Model of Venting during Thermal Runaway in a Cylindrical Lithium Cobalt Oxide Lithium-Ion Cell. J. Power Sources 2016, 307, 56–62. [Google Scholar] [CrossRef]
  43. Smekens, J.; Paulsen, J.; Yang, W.; Omar, N.; Deconinck, J.; Hubin, A.; van Mierlo, J. A Modified Multiphysics Model for Lithium-Ion Batteries with a LixNi1/3Mn1/3Co1/3O2 Electrode. Electrochim. Acta 2015, 174, 615–624. [Google Scholar] [CrossRef]
  44. Wang, W.; Wang, Y.; Ni, R.; Xie, Z. Effects of Fast Charging Modes on Thermal Performance of Lithium-Ion Battery. Energy Technol. 2022, 10, 2200415. [Google Scholar] [CrossRef]
  45. Li, J.; He, K.; Meng, Q.; Li, X.; Zhu, Y.; Hwang, S.; Sun, K.; Gan, H.; Zhu, Y.; Mo, Y.; et al. Kinetic Phase Evolution of Spinel Cobalt Oxide during Lithiation. ACS Nano 2016, 10, 9577–9585. [Google Scholar] [CrossRef]
  46. Kim, D.S.; Sohn, J.S.; Lee, C.K.; Lee, J.H.; Han, K.S.; Lee, Y. il Simultaneous Separation and Renovation of Lithium Cobalt Oxide from the Cathode of Spent Lithium Ion Rechargeable Batteries. J. Power Sources 2004, 132, 145–149. [Google Scholar] [CrossRef]
  47. Shu, J.; Shui, M.; Huang, F.; Ren, Y.; Wang, Q.; Xu, D.; Hou, L. A New Look at Lithium Cobalt Oxide in a Broad Voltage Range for Lithium-Ion Batteries. J. Phys. Chem. C 2010, 114, 3323–3328. [Google Scholar] [CrossRef]
  48. Capron, O.; Samba, A.; Omar, N.; van den Bossche, P.; van Mierlo, J. Thermal Behaviour Investigation of a Large and High Power Lithium Iron Phosphate Cylindrical Cell. Energies 2015, 8, 10017–10042. [Google Scholar] [CrossRef] [Green Version]
  49. Celik, A.; Coban, H.; Göcmen, S.; Ezan, M.A.; Gören, A.; Erek, A. Passive Thermal Management of the Lithium-Ion Battery Unit for a Solar Racing Car. Int. J. Energy. Res. 2019, 43, 3681–3691. [Google Scholar] [CrossRef]
  50. Tang, S.; Wang, Z.; Guo, H.; Wang, J.; Li, X.; Yan, G. Systematic Parameter Acquisition Method for Electrochemical Model of 4.35 V LiCoO2 Batteries. Solid State Ion 2019, 343, 115083. [Google Scholar] [CrossRef]
  51. Pan, S.; Ji, C.; Wang, S.; Wang, B. Study on the Performance of Parallel Air-Cooled Structure and Optimized Design for Lithium-Ion Battery Module. Fire Technol. 2020, 56, 2623–2647. [Google Scholar] [CrossRef]
  52. Yiding, L.; Wenwei, W.; Cheng, L.; Fenghao, Z. High-Efficiency Multiphysics Coupling Framework for Cylindrical Lithium-Ion Battery under Mechanical Abuse. J. Clean. Prod. 2021, 286, 125451. [Google Scholar] [CrossRef]
  53. Egorkina, O.Y.; Skundin, A.M. The Effect of Temperature on Lithium Intercalation into Carbon Materials. J. Solid State Electrochem. 1998, 2, 216–220. [Google Scholar] [CrossRef]
  54. Choudhari, V.G.; Dhoble, D.A.S.; Sathe, T.M. A Review on Effect of Heat Generation and Various Thermal Management Systems for Lithium Ion Battery Used for Electric Vehicle. J. Energy Storage 2020, 32, 101729. [Google Scholar] [CrossRef]
  55. Lai, Y.; Du, S.; Ai, L.; Ai, L.; Cheng, Y.; Tang, Y.; Jia, M. Insight into Heat Generation of Lithium Ion Batteries Based on the Electrochemical-Thermal Model at High Discharge Rates. Int. J. Hydrog. Energy 2015, 40, 13039–13049. [Google Scholar] [CrossRef]
  56. Takano, K.; Saito, Y.; Kanari, K.; Nozaki, K.; Kato, K.; Negishi, A.; Kato, T. Entropy Change in Lithium Ion Cells on Charge and Discharge. J. Appl. Electrochem. 2002, 32, 251–258. [Google Scholar] [CrossRef]
  57. Hatchard, T.D.; MacNeil, D.D.; Basu, A.; Dahn, J.R. Thermal Model of Cylindrical and Prismatic Lithium-Ion Cells. J. Electrochem. Soc. 2001, 148, A755. [Google Scholar] [CrossRef]
  58. Hosseinzadeh, E.; Genieser, R.; Worwood, D.; Barai, A.; Marco, J.; Jennings, P. A Systematic Approach for Electrochemical-Thermal Modelling of a Large Format Lithium-Ion Battery for Electric Vehicle Application. J. Power Sources 2018, 382, 77–94. [Google Scholar] [CrossRef] [Green Version]
  59. Macdonald, M.P.; Chandrasekaran, S.; Garimella, S.; Fuller, T.F. Thermal Runaway in a Prismatic Lithium Ion Cell Triggered by a Short Circuit. J. Energy Storage 2021, 40, 102737. [Google Scholar] [CrossRef]
  60. Joachin, H.; Kaun, T.D.; Zaghib, K.; Prakash, J. Electrochemical and Thermal Studies of Carbon-Coated LiFePO4 Cathode. J. Electrochem. Soc. 2009, 156, A401. [Google Scholar] [CrossRef]
  61. Xu, J.; Hendricks, C. A Multiphysics Simulation of the Thermal Runaway in Large-Format Lithium-Ion Batteries. In Proceedings of the 18th IEEE Intersociety Conference on Thermal and Thermomechanical Phenomena in Electronic Systems (ITherm), Las Vegas, NV, USA, 28–31 May 2019; pp. 815–821. [Google Scholar] [CrossRef]
  62. Yiding, L.; Wenwei, W.; Cheng, L.; Xiaoguang, Y.; Fenghao, Z. Multi-Physics Safety Model Based on Structure Damage for Lithium-Ion Battery under Mechanical Abuse. J. Clean. Prod. 2020, 277, 124094. [Google Scholar] [CrossRef]
  63. Shelke, A.V.; Buston, J.E.H.; Gill, J.; Howard, D.; Abbott, K.C.; Goddard, S.L.; Read, E.; Howard, G.E.; Abaza, A.; Cooper, B.; et al. Characterizing and Predicting 21700 NMC Lithium-Ion Battery Thermal Runaway Induced by Nail Penetration. Appl. Therm. Eng. 2022, 209, 118278. [Google Scholar] [CrossRef]
Figure 1. Open Circuit Potential (OCP) vs. Li/Li+ (Ueq,y) in volts (V) plotted against the degree of lithiation, xy, for (a) lithium cobalt oxide positive electrode (y = p), and (b) graphite negative electrode (y = n).
Energies 16 02642 g001
Figure 2. Entropy change coefficient in volts per Kelvin (V K−1) plotted against the degree of lithiation, xy, for (a) lithium cobalt oxide positive electrode (y = p), and (b) graphite negative electrode (y = n).
Energies 16 02642 g002
Figure 3. Simulation and experimental working potential vs. time during various discharge C-rates. Experimental discharge curves (broken lines) and simulated curves (solid lines). 1 C discharge C-rate (black lines) and 0.5 C discharge C-rate (red lines).
Energies 16 02642 g003
Figure 4. Simulation and experimental average battery surface temperature vs. time during 1C discharge. Experimental temperature profile (broken line) and simulated temperature profile (solid lines).
Energies 16 02642 g004
Figure 5. Effects of heat generation towards the average battery surface temperature plotted against time during 1 C discharge. Simulated temperature profile at 1 C discharge (black line), irreversible heat generation (red line), and reversible heat generation (blue line) against time.
Energies 16 02642 g005
Figure 6. Simulation and experimental average battery surface temperature vs. time during various oven tests. Experimental temperature profiles (broken lines) and simulated temperature profiles (solid lines). 403.15 K oven test (black lines) and 423.15 K oven test (red lines).
Energies 16 02642 g006
Figure 7. Simulated evolution of the dimensionless concentrations of different heat generation sources of a thermal runaway at different oven temperatures. 403.15 K oven tests are depicted with solid lines, while 423.15 K oven tests are illustrated with broken lines. SEI decomposition reaction is factored by the dimensionless amount of lithium-containing meta-stable species in the SEI, CSEI. The anode–electrolyte reaction is factored by the dimensionless amount of lithium intercalated within the carbon, Ca. The conversion degree, αc-e factors the cathode–electrolyte reaction. The electrolyte decomposition reaction is factored by the dimensionless concentration of electrolytes, Ce.
Energies 16 02642 g007
Figure 8. Simulated evolution of thermal runaway heat generation sources from (a) 403.15 K oven test and (b) 423.15 K oven test. The inset graph of the 423.15 K oven test shows the full view of heat generation where the cathode–electrolyte reaction gives off the most significant amount of heat.
Energies 16 02642 g008
Table 1. Battery specifications.
PropertyValue
CathodeLCO
AnodeGraphite
ElectrolytePVdF-HFP
Positive current collectorAluminum
Negative current collectorCopper
Nominal capacity2000 mAh
Nominal voltage3.7 V
Maximum charge voltage4.2 V
Maximum charge current1 C
Maximum discharge current2 C
Discharge cut-off voltage2.75 V
Weight37.5 g
Dimensions (Length*Width*Thickness in mm)54.5*49.3*4.8
Table 2. LiPo battery modeling equations for electrochemical behavior.
Name Equation Reference
Charge transportSolid
phase
= σ eff S ϕ S  
= ( ε S ) 1.5
(1)
(2)
[11,20]
Electrolyte
phase
ϕ E = i E κ eff + 2 RT F ( 1 t Li ) ( 1 + dlnf ± dlnc Li E ) lnc Li E
κ eff = κ ( ε E ) 1.5
(3)
(4)
[11,20]
Mass transportSolid
phase
c Li S t = 1 r 2 r ( D Li S r 2 c Li S r ) = D Li S ( 2 c Li S r 2 + 2 r   c Li S r ) (5)[11]
Electrolyte
phase
ε E c Li E t = · ( D Li , eff E   c Li E ) + ( 1 t Li ) a F
D Li , eff E = D Li E ( ε E ) 1.5
(6)
(7)
[11,20]
Active surface area a = 3 ε S r P (8)[20]
Current density i n = i 0 [ exp ( α A F η RT ) exp ( α C F η RT ) ] (9)[11]
Exchange current density i 0 = Fk ( c Li S ) α C ( c Li , max S c Li S ) α A ( c Li E ) α A (10)[20]
Overpotential η = ϕ 1 ϕ 2 U eq (11)[11]
Table 3. LiPo battery thermal modeling equations.
NameEquation Reference
General energy balance ρ c p T t = λ 2 T + q (16)[22,28]
Battery heat generation q = q B (17)[11]
Heat generation in battery model q B = q rev + q irrev (18)[20]
Reversible heat q rev = ai n T U eq T (19)[11]
Irreversible heat q irrev = q pol + q ohm (20)[20]
Polarization heat q pol = ai n η (21)[11]
Ohmic heat q ohm = σ eff S ( ϕ S x ) 2 + κ eff   ( ϕ E x ) 2 + κ eff D ϕ E x lnc Li E x
κ eff D = 2 RT κ eff F ( t + 0 1 ) ( 1 + dlnf ± dlnc )
(22)
(23)
[28]
Table 4. Parameters used for the electrochemical and thermal model.
Parameter (Symbol)Positive Current CollectorCathodeSeparatorAnodeNegative Current CollectorReference
Length (L)10 × 10−670 × 10−625 × 10−673.5 × 10−610 × 10−6[28]
Solid phase volume fraction ( ε S ) 0.59 0.49 [35]
Electrolyte phase volume fraction ( ε E ) 0.450.450.45 [36]
Radius of the particle ( r p ) 8 × 10⁻⁶ 1 × 10⁻⁵ [37]
Solid phase Li + diffusivity ( D L i S ) 10−14 3.9 × 10⁻¹⁴ [38]
Reaction rate constant (k) 1.0 × 10⁻¹¹ [36]
Initial Li + concentration in solid ( c L i , 0 S ) 1 21,250 2 23,099.58 1—Fitted
2—[22]
Maximum Li + concentration in solid ( c L i , m a x S ) 51554 30555 [20]
Initial electrolyte concentration ( c L i , o E ) 1000 [38]
Transference number of lithium-ion ( t L i ) 0.435 [28]
Cathodic charge transfer coefficient ( α C ) 0.5 0.5 [38]
Anodic charge transfer coefficient ( α A ) 0.5 0.5 [38]
Electronic conductivity in the solid phase ( σ S )1 3.8 × 1072 10 2 1001 6 × 1071—[35]
2—[38]
Ionic conductivity ( κ )(Equation (12))[8]
Electrolyte phase Li + diffusivity ( D L i E ) (Equation (13))[4]
LixCoO2 Equilibrium potential ( U e q , p ) (Equation (14))[26]
LiyC6 Equilibrium potential ( U e q , n ) (Equation (15))[26]
LixCoO2 Entropy coefficient ( U e q , p T ) (Equation (26))[26]
LiyC6 Entropy Coefficient ( U e q , n T ) (Equation (27))[32]
Thermal conductivity ( λ )2381.480.451.04398[39]
Isobaric heat capacity ( c p )903700133.91437.4385[39]
Density ( ρ )15002500129026608900[39]
Table 5. LiPo battery thermal runaway modeling equations.
NameEquation Reference
Heat generation in thermal runaway q TR = q SEI + q a e + q c e + q e (28)[40]
SEI decomposition heat q SEI = H SEI W ac A SEI exp ( E a , SEI RT ) c SEI (29)[40,42]
Anode–electrolyte reaction heat q a e = H a e W ac A a e exp ( z z 0 ) exp ( E a , a e RT ) c a (30)[34,42]
Cathode–electrolyte reaction heat q c e = H c e W p A c e α c e ( 1 α c e ) exp ( E a , c e RT ) (31)[34,42]
Electrolyte decomposition heat q e = H e W e A e exp ( E a , e RT ) c e (32)[34,42]
Table 6. Computational results of battery grid sensitivity analysis for a 1 C discharge at 100 s time step study.
Physics-Controlled Mesh TypeNumber of Mesh ElementsComputational TimeRMSE [V]
Coarser19,15245 s0.0599258
Coarse35,80557 s0.0599250
Normal85,1912 min 11 s0.0577542
Fine300,6739 min 42 s0.0599246
Finer419,405--
Disclaimer/Publisher’s Note: The statements, opinions and data contained in all publications are solely those of the individual author(s) and contributor(s) and not of MDPI and/or the editor(s). MDPI and/or the editor(s) disclaim responsibility for any injury to people or property resulting from any ideas, methods, instructions or products referred to in the content.