Article

A New Approach for Long-Term Stability Estimation Based on Voltage Profile Assessment for a Power Grid

by
Alireza Pourdaryaei
1,
Amidaddin Shahriari
2,
Mohammad Mohammadi
3,
Mohammad Reza Aghamohammadi
4,
Mazaher Karimi
5 and
Kimmo Kauhaniemi
5,*
1
Substations and Relays Repairs and Maintenance Affairs, Operation and Protection Office, Hormozgan Regional Electric Company, Bandar Abbas 7916795599, Iran
2
Department of Electrical Engineering, Islamic Azad University, South Tehran Branch, Tehran 1477893855, Iran
3
Department of Power and Control, School of Electrical and Computer Engineering, Shiraz University, Shiraz 7194684334, Iran
4
Department of Electrical Engineering, Shahid Abbaspour School of Engineering, Shahid Beheshti University, Tehran 1983969411, Iran
5
School of Technology and Innovations, University of Vaasa, Wolffintie 34, 65200 Vaasa, Finland
*
Author to whom correspondence should be addressed.
Energies 2023, 16(5), 2508; https://doi.org/10.3390/en16052508
Submission received: 17 January 2023 / Revised: 23 February 2023 / Accepted: 2 March 2023 / Published: 6 March 2023
(This article belongs to the Special Issue Stability Issues and Challenges in Modern Electric Power Systems)

Abstract

:
Load flow solutions refer to the steady-state stability of power systems and have a crucial role in the design and planning of slow-changing elements; e.g., in online tab changing actions, automatic generation control, over-excitation limiters and the power recovery characteristics of a load. Therefore, the purpose of this work was to show the connectivity between load flow analysis and long-term voltage stability using a generator model by introducing a novel voltage stability assessment based on the multi-machine dynamic model along with the load flow study for a power grid. The Euclidean distance (ED) was used to introduce a new voltage stability index based on the voltage phasor profile for real-time monitoring purposes. The effects of reactive power compensation, in addition to load-generation patterns and network topology changes in the system behavior, could be seen clearly on the voltage profiles of the buses. Thus, the increased values for the EDs of the buses’ voltage amplitudes—from 0 to around 1.5 (p.u.)—implied that the system was approaching the voltage collapse point, corresponding to the Jacobian matrix singularity of the load flow equation. Moreover, the weakest load bus with respect to any system change was also identified. Indeed, the criticality of any network interruption was in direct proportion to this voltage stability index. The proposed method was validated using the IEEE 118-bus test system.

1. Introduction

Voltage collapse, in terms of long-term stability analysis, is the process by which the sequence of events accompanying voltage instability leads to an unacceptable voltage drop in a significant part of a power system. Catastrophic decreases in voltage lead to a loss of stability in large interconnected power systems, causing blackouts. This long-term power system stability analysis employs the load flow concept, which plays an important role in power system operation and planning. The loss of system equilibrium is a direct consequence of the saddle-node bifurcation of the network equations (electro-mechanic), which is undoubtedly the most significant fundamental phenomenon [1]. Up until now, applications of network theory and statistical mechanics to power transmission networks have predominantly emphasized the synchronization of synchronous generators [2,3,4]. The synchronization of power networks is primarily regulated by the flow of power and the management of power-demanding loads. Achieving this requires a comprehensive theoretical understanding of active power, which plays a critical role in ensuring the stability and synchronization of power networks [5]. However, voltage collapse as collective nonlinear “instability” has received little attention from a network perspective [6,7,8,9]. Voltage instability is fundamentally a dynamic phenomenon, with slightly slow dynamics in terms of time, from a few seconds to several minutes or more [7,8]. In addition, the connectivity of the behavior of a linearized dynamic model of a power system can be seen in the load-flow Jacobian matrix performance [2,6,8,10,11].
On the other hand, the conventional viewpoint on load flow analysis as a solution for the steady-state condition of a power system cannot provide a comprehensive steady-state voltage stability analysis [12,13]. We categorized voltage collapse phenomena using a load flow solution with the concepts of total and local voltage collapse of a power network. Total voltage collapse returns to the steady-state collapse of the power system based on a load flow analysis with the singularity of a Jacobian matrix such that no acceptable load flow solution exists [14]. The voltage stability margin and voltage collapse point (VCP) can be determined using voltage stability indices (VSIs), depending on the Jacobian matrix singularity for the total voltage stability assessment [15]. Moreover, a modal analysis of the Jacobian matrix is required to assess the VSIs to estimate the critical lines and buses. Nonetheless, the divergence of the Jacobian matrix at the VCP is the most exact way to assess the steady-state condition of voltage stability in the normal condition of the network.
Voltage collapse is divided into two different categories: local and total. The local type returns to voltage drops based on IEC 60364 standards, which determine the allowable voltage drops for low-voltage installations supplied directly from a public low-voltage distribution system: 3% for lighting and 5% for other uses. This means less than 95% of the power of each bus is transferred to the local voltage collapse. Total voltage collapses in the majority of buses involve voltage drops less than 5% [16]. Local voltage collapse corresponds to a situation in which there is no solution for the load flow equation for power networks equivalent to two-bus systems, where the sending end bus is assumed to be a generator bus and the receiving end bus a load bus in distribution systems. The local voltage stability varies between no loading and the maximum loading point of the corresponding bus. Different approaches have been employed for the load flow equation, such as quadratic or biquadratic approaches as a function of the voltage amplitude of the load buses, the Thévenin model, Tellegen’s theorem and the Thévenin equivalent maximum power transfer [17,18].
The theoretical difference between local VSIs returns to the assumptions utilized, such as the power factor and the Thévenin impedance in terms of any changes in the network topology. From an online practical viewpoint, in addition to the load flow calculations, the network impedance calculations are also difficult due to the scale of and unsatisfactory data for the power system. Nevertheless, the dynamic and static characteristics of load, as well as the limitations on generators’ reactive power capability, are not included in these indexes. However, local VSIs can contain enough information to directly determine the voltage stability margin, since voltage and current phasors at the system buses are already available from the phasor measurement units (PMUs) installed in many power systems [18,19]. In addition to the advantages of simplicity and the low computational effort required, local methods also provide very good insight into the voltage-collapse process and can easily be used for online system monitoring [4]. In terms of voltage stability, various long-term approaches are discussed in [20]. This study introduced the rapid voltage stability index, which is based on the Wolf algorithm, to enhance the optimal load capacity of a transmission system.
Additionally, the authors of [21] utilize an optimization method implemented with an ensemble sparse oblique regression tree method for voltage stability-constrained operation optimization to improve the voltage stability margin. The authors of [22] undertake online voltage stability observation using a feature subspace-founded ensemble approach. The general idea is to use the input from various feature selectors for the ensemble and aggregate their outputs. The modern voltage stability index (MVSI) ignores the line resistance partially—i.e., by zeroing the resistance of a part and not completely the exact formula of the system—to develop an estimated and fast collapse prediction index [23].
The contribution of this study is that it investigated the relationship between the concepts of local and total voltage collapse to find simple and robust VSIs for real-time monitoring purposes. Hence, the main contributions of this study are summarized as follows:
  • A monitoring tool for secure operation is one of the main contributions of this study. In addition, the Euclidean distance is utilized to calculate a real-time voltage stability index. The proposed index for online purposes employing the Euclidean distance (ED) defines a scale from 0 to 1.5 p.u. for the bus voltage amplitude ED corresponding to the grid behavior from the normal operation point to the voltage collapse point under different cascading scenarios;
  • Moreover, the weakest load bus based on any grid changes can be found, such that this index makes the steady-state verification of voltage stability possible through the concepts of a synchronous generator and motors understood according to PV and PQ buses in the presence of various events;
  • To address the long-term voltage stability problem, a multi-machine dynamic model was developed to determine the boundary operation of the PV bus. In parallel, the capability curve was used to access the phasor diagram of the PV bus;
  • The proposed method was examined carefully using the 118-bus network, which has the potential to verify the ED index, in two scenarios including three cascading events—load demanding, line outage and reactive power compensation—simultaneously.

2. Connectivity between the Multi-Machine Dynamic Model and Load Flow Analysis

IEEE Std. 399–1997 defines load flow analysis as “the determining the steady-state condition of power system including voltage magnitude and phase angle of each bus for a specified set of load and generation value” [19]. This specified set is returned to the steady-state operation of the network synchronous generators accelerating or decelerating due to any disturbance; i.e., load increments, line outages or generator outages. Thus, a load flow solution can be estimated as the stable equilibrium points of the dynamic model of the power system using a set of differential and algebraic equations as follows [24].
d X ( t ) d t = U ( X ,   H ,   G ) ,   F ( X , H ) = 0 ,
where X is the vector of state (independent) variables (the voltage magnitude and angle at each bus), and H is the vector of dependent variables (active and reactive power of each bus). G indicates the dynamic model of the multi-machine electromechanical equations and F is the load flow equation.
The derivation of the load flow equation from the dynamic analysis of a power system can be defined using multiple simplified synchronous machines in a network with constant admittance load models. Each synchronous machine is presented by a constant voltage source with the direct axis transient reactance showing the constant flux linkages between rotor and armature. The machine output active powers are supposed to remain constant in terms of the load flow analysis by neglecting the governors. As a result, the synchronous machine, as a generator model, conducts to the PV or generator-type bus so that the real power and the voltage magnitude are specified in the power flow analysis.
Regarding the aforesaid considerations, a group of coherent machines could be represented by one equivalent machine connected to an infinitive bus that tends to develop restoring power equal to or greater than a power demand event to maintain the state of equilibrium operation point that is found with a load flow solution. The dynamics model of a synchronous machine as a generator and an induction motor as a load model for the ith machine is as follows [7,25]:
H i π f 0 d 2 ( α i α 0 ) d t 2 + D i d ( α i α 0 ) d t = P m i P e i ,
Q e i Q l o a d = 0 ,
Hi is an inertia constant of the machine, and i is stated by the swing bus MVA as follows:
H i = S G i S B i H G i ,
where HGi and SBi are the inertia constant and the complex power of machine i, respectively. f0 and Di correspond to the nominal frequency and damping coefficient for the synchronous machine i. αi and α0 indicate the terminal voltage phase angles of a synchronous machine i in relation to the swing bus as references before and after an event correspondingly related to. Pmi and Pei represent the real power generation of machine i and the load demand for induction machines separately. In this case, for the synchronous machine i, (Qei) contributes to the compensation Qload as the reactive power of the induction machines.
The convergence of Equation (2) as a swing equation for the multi-machine equation leads to a new operation point for bus αi from the initial point α0 in the steady-state condition. Thus, if the left-hand side of Equation (2) matches zero, then the real power parts of the load flow equation based on the equivalent admittance of all loads for machine i coupled to bus i become:
P m i = P e i = V i k = 1 N V k Y i k cos ( α i k β i k )
where N is the number of buses. Vi, Vk and Yik indicate the synchronous machine i with system bus voltage magnitudes and line admittances. αik and βik indicate the angle between the sending and receiving line buses and the corresponding line admittance, respectively. The reactive power injected by bus i is calculated from the voltage amplitude and phase angle in the reactive power part of the load flow equation:
Q e i = V i k = 1 N V k Y i k sin ( α i k β i k )
The most important control task of PV buses is to maintain the normal condition of load buses’ voltage amplitudes while their reactive power compensation capacity is specified. Thus, any long-term voltage stability analysis determining a voltage stability margin from a VCP will in some way return to the characteristics of the PV buses in term of the load demand increasing with any system topology changes.
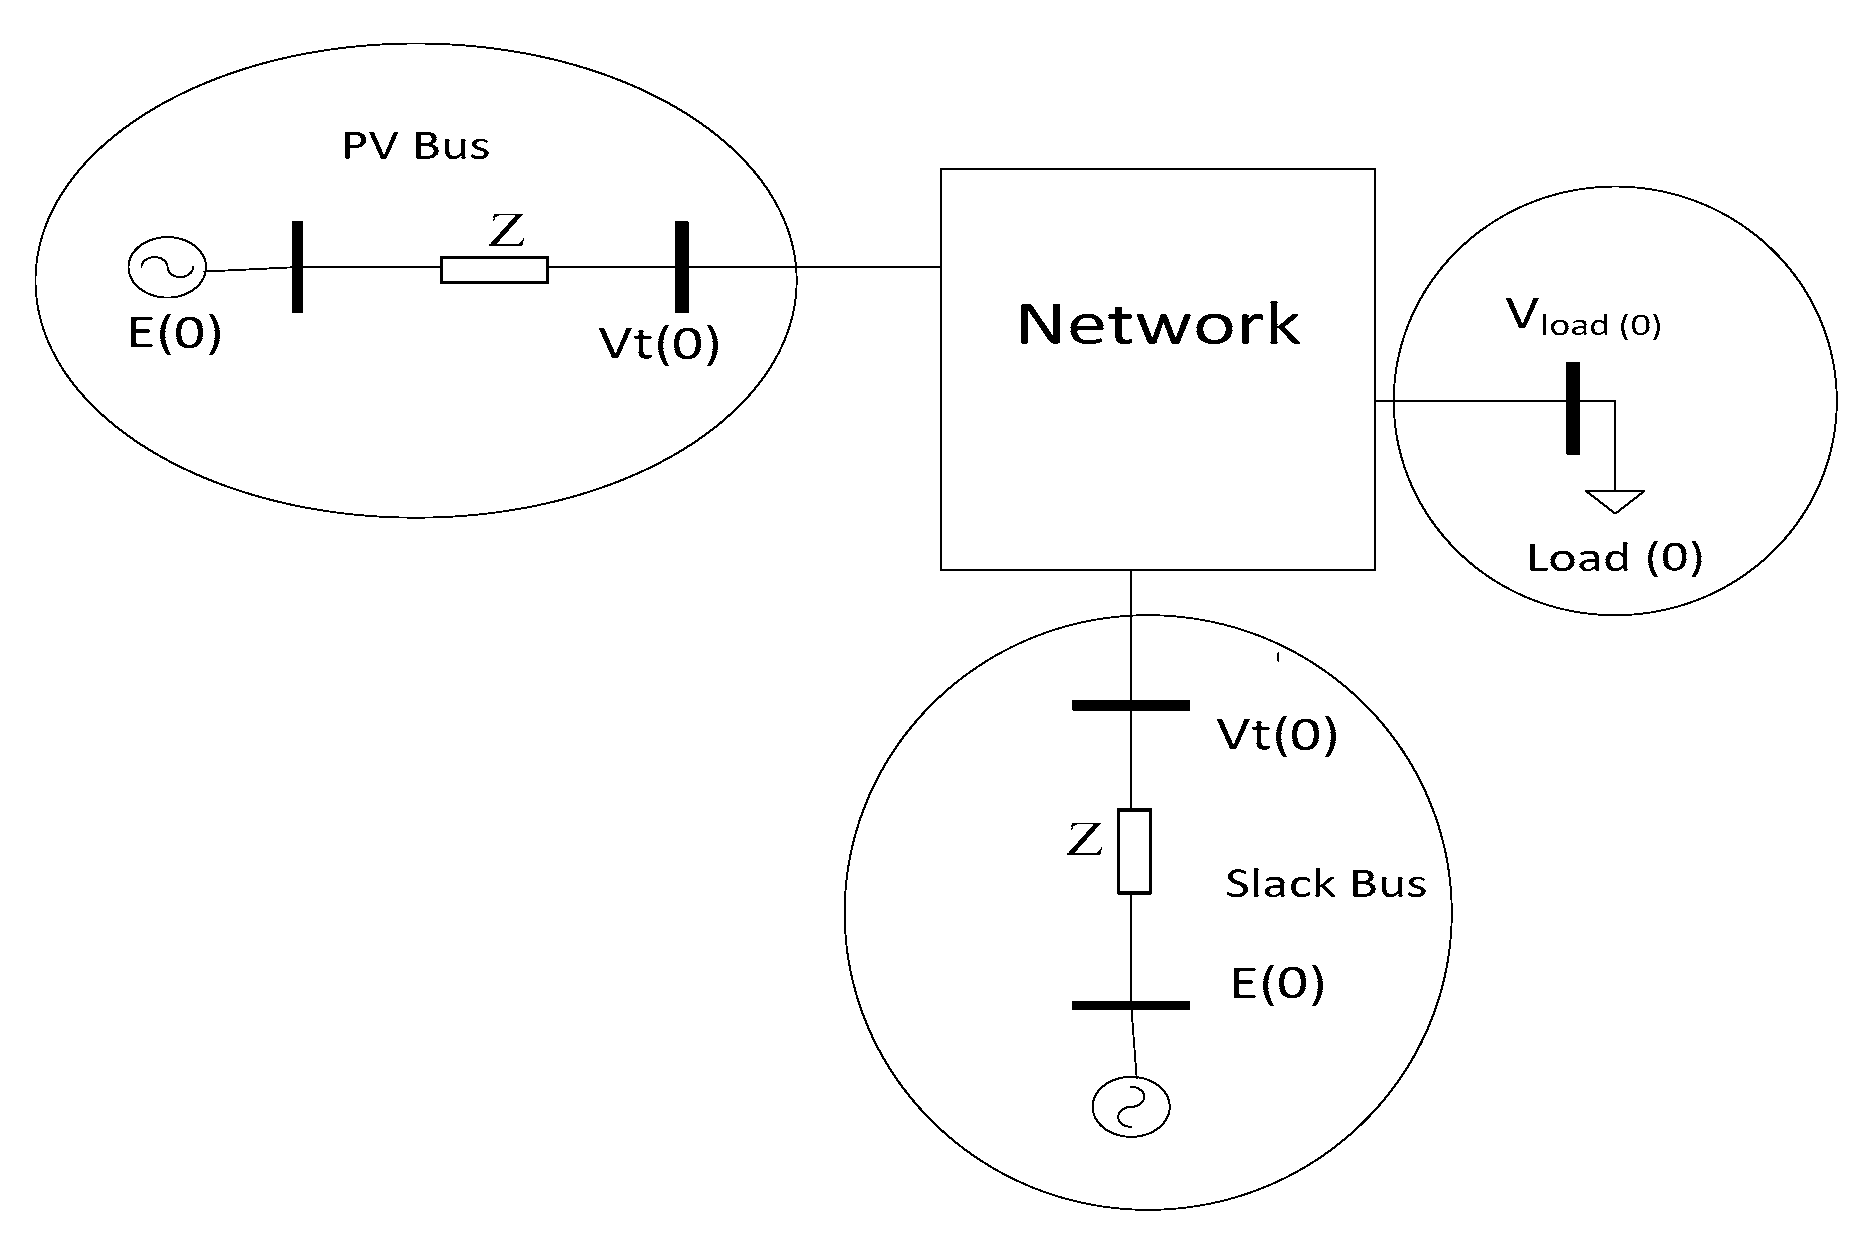
A power network consists of a PV, PQ and slack buses, as shown in Figure 1, corresponding to the first given condition of the buses. The PV bus is indicated by the simplified steady state of the synchronous generator, including E (excitation or induced voltage), X (synchronous reactance) and Vt (terminal voltage). The PQ bus can imply any static load model through equivalent active and reactive powers connected to the network bus.
The PV bus operates similarly to a cylindrical synchronous generator. The PV bus-specified voltage magnitude entails no alteration in the voltage terminal under the generation operation conditions.
Figure 2 shows phasor diagrams for the behavior of PV buses with respect to different network-load demand-type resistances, capacitors and reactance to unity, showing the leading and lagging power factor control of a synchronous generator. The terminal voltage with constant values as references can be seen.
As seen in Figure 2, the real power generation and reactive power compensation provided to a network from a PV bus according to the armature current for a single phase are [26]:
I a = | E f | δ | V t | 0 0 X s 90 0
The complex power flow from the PV bus (generator) to the terminal voltage is
S 1 = P 1 + j Q 1 = E f I a * = | E f | 2 90 0 | E f | | V t | ( 90 0 + δ ) X S
The complex power flow from the terminal voltage to the network considered as an infinite bus is calculated by separating the real and imaginary parts of the equations, giving:
P = P 2 + j Q 2 = V t I a * = | E f | | V t | ( 90 0 + δ ) | V t | 2 90 0 X S
Separating the real and imaginary parts of the equations gives:
P = P 1 = P 2 = | E f | | V t | X S sin δ
Q 1 = | E f | X S ( | E f | | V t | cos δ )
Q 2 = | V t | X S ( | E f | cos δ | V t | )
In Equation (12), for | E f | cos δ = | V t | , the injected reactive power from the PV bus to the network equals zero. For | E f | cos δ > | V t | and | E f | cos δ < | V t | as over-excited and under-excited modes, correspondingly, the PV bus injects and absorbs reactive power to, as well as from, the network, respectively.
In fact, the PV bus with a constant terminal voltage and productive real power compensates for the reactive power demand (absorb or deliver) through its capacity. Thus, Equation (10) is arranged as follows
P | V t | X S = | E f | sin δ | E f | sin δ = constant  
It can be seen from Equation (13) that, for | E f | , the magnitude decreases in terms of the increment of the power angle. Moreover, the active and reactive power flow received at the terminal voltage bus can be formulated using the armature current as
P = P 1 = P 2 = | E f | | V t | X S sin δ
Q 1 = | E f | X S ( | E f | | V t | cos δ )
Therefore, Equation (13) is written as
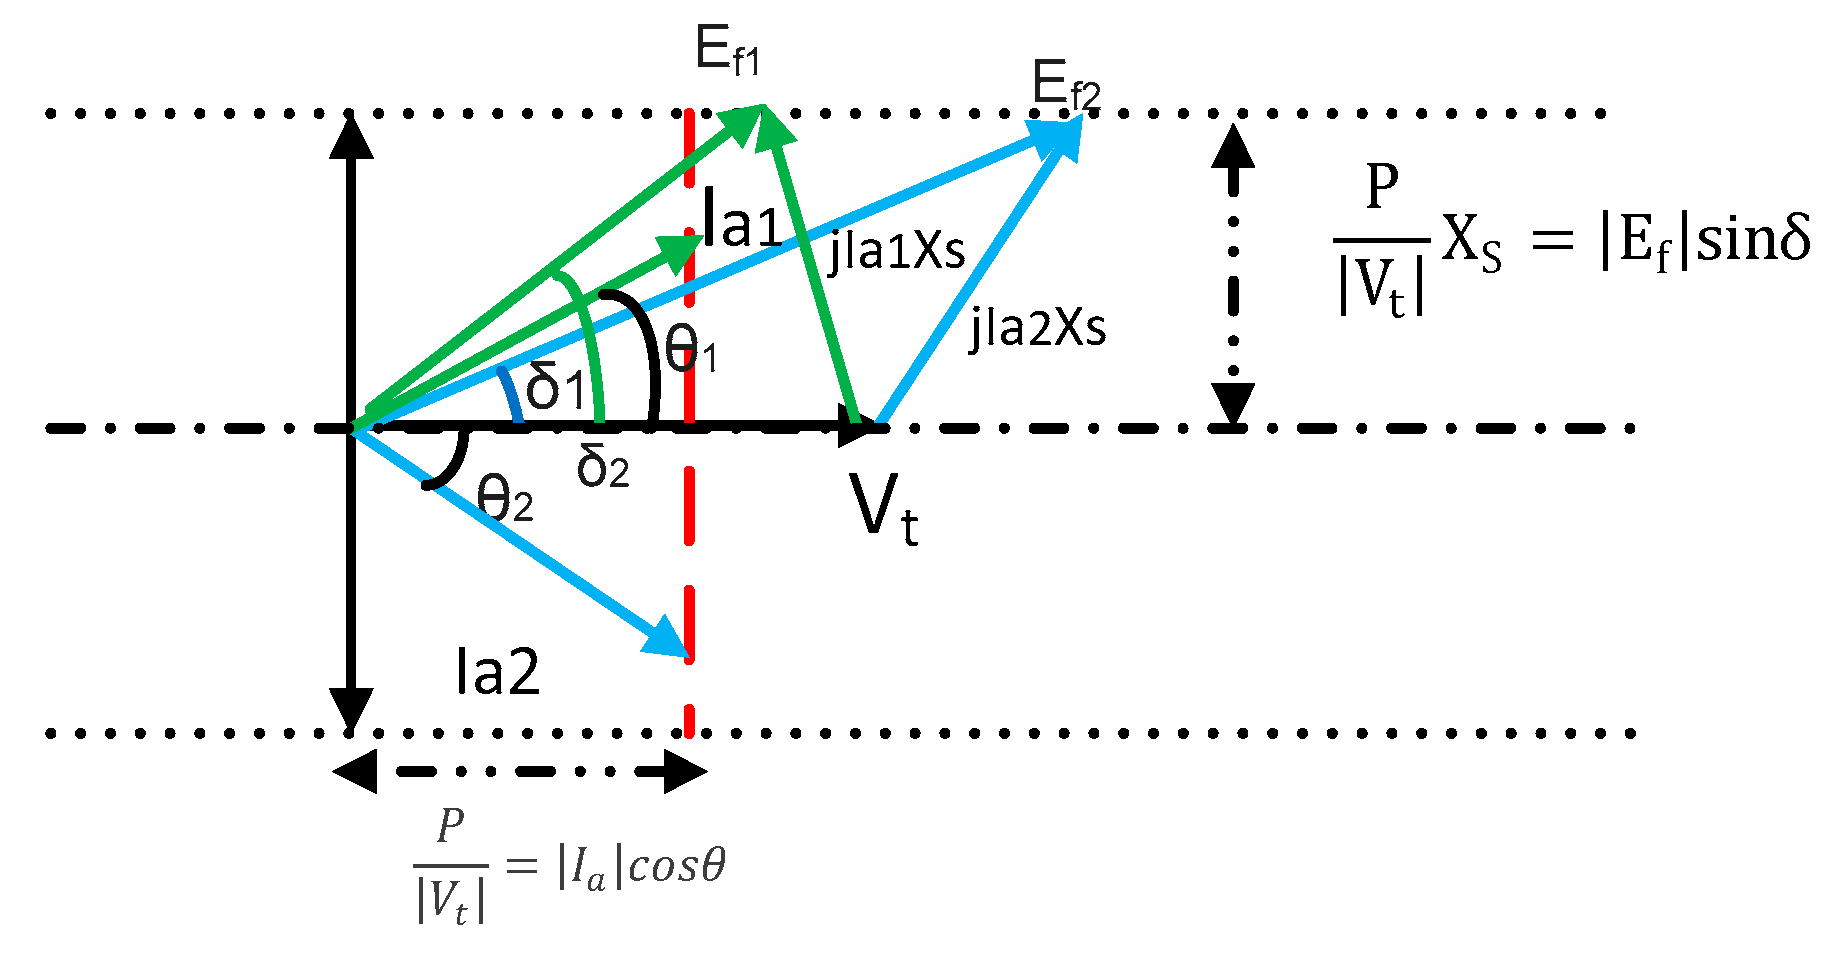
| V t | | I a | cos θ | V t | X S = X S | I a | cos θ = | E f | sin δ
Figure 3 illustrates the response and operation of the PV bus based on its specified voltage magnitude Vt and real power P as a consequence of any changes in the network.
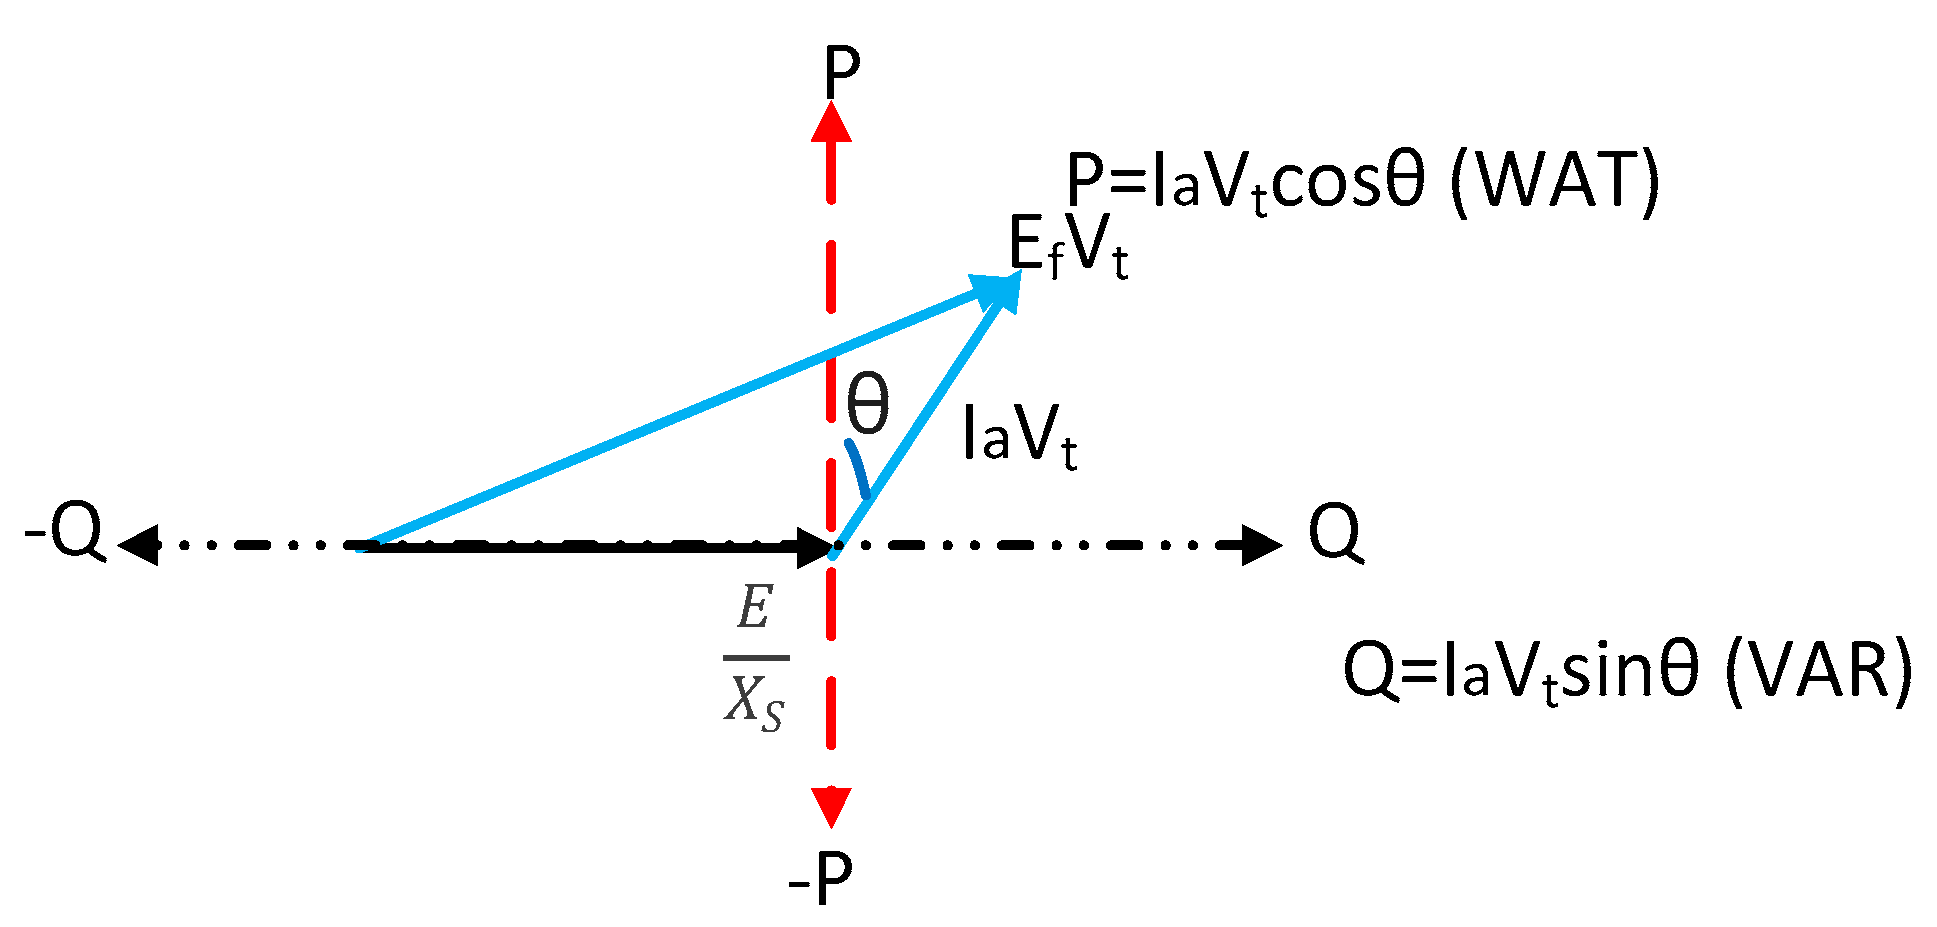
In order to derive the PV bus capability curve, the operation phasor diagram of the PV bus shown in Figure 3 is multiplied by (EfVt/X). The phasor diagrams of the PV bus capability curve are shown in Figure 4 and Figure 5. Figure 4 demonstrates the active power (generating) and reactive power (generating and absorbing) on the y-axis and x-axis, respectively.
The semicircle with radius Ia Vt illustrates the operation zone of the PV bus capability curve in Figure 5.
From a practical point of view, this operation zone is limited by the under- and over-excitation limiter indicated by the red sector. The reason behind the limitation of the magnetic field current is to control the Ef magnitude between Efmin and Efmax. Consequently, the boundary of the PV bus operation based on the angle correction of any load power factor is less than 90. This leads to the definition of Qmin and Qmax for the PV bus type. In this context, variation in Vt is the only approach that maintains the PV bus reactive power compensation inside the capability curve operation zone (red line).
A slack bus (swing bus) is utilized to balance the active and reactive power while performing load flow studies. This issue corresponds to the varying synchronous generator power angle (δ) based on the fixed terminal voltage V and excited voltage Ef, as shown in Figure 6.
It can be seen from this diagram that, as the power angle increases, the armature current increases and the power factor is improved. The slack bus is considered as a reference, with lagging voltage for all PV and PQ buses due to the power flow to other buses. In a real system, it can also be shown for PQ buses that the maximum difference in the phase angle between the load current and voltage is less than 90 due to the use of induction motors with most implemented loads.

3. The Voltage Stability Index Using the Euclidean Distance for Voltage Profile Phasor Vectors

The goal of this study was a novel assessment method for the analysis of the network local and total voltage stability based on the load flow solution and using the polar Euclidean distance between the voltage profile phasors of buses, taking into account the introduced boundary for the PV buses’ operation. Figure 7 displays a power system network with a typical bus based on the equivalents of the transmission line π model.
The application of the KLC law for this bus results in:
I i = y i 0 V i + y i 1 ( V i V 1 ) + ( V i V 2 ) y i 2 + + y i n ( V i V n )
I i = V i j = 0 n y i j j = 1 n y i j V j  
For any injected active and reactive power load and generator, equivalent admittance is used
I i = | P i j Q i | | V i * | = y i 0 new V i  
Therefore, based on Equation (19), Equation (18) becomes
y i 0 new V i = V i j = 0 n y i j j = 1 n y i j V j V i ( j = 0 n y i j y i 0 new ) = V i Y i i = j = 1 n y i j V j  
The Norton theorem and Thévenin’s corresponding theorem can be utilized for Equation (20) with an ideal current source voltage source and with corresponding impedance, as shown in Figure 8 and formulated as
V Y i i = j = 1 n y i j V j  
I i N O = V i T H Z i T H = j = 1 n y i j V j  
The equivalent Thévenin circuit can be extended for all buses connected to bus i, as indicated in Figure 8, making it possible to rewrite Equation (23) as:
I i N O = V i T H Z i T H = j = 1 n y i j V j T H ,
As a result, for any PV or PQ buses in the load flow analysis, the equivalent Thévenin model of the power network using a π model can be implemented. This model shows the impact of any changes in the network on the power flow equation, as presented in Figure 9.
In this context, the voltage profile of the network under the first given condition found by the load flow solution is considered for the Thévenin model voltage source magnitude and phase angle, as there are no load or open circuit values. Standard practice for economical and stable network operation is to keep bus voltages near their open circuits. Hence, the stable steady-state condition of the bus voltage in terms of any changes in the network is defined by
| V i ( N L ) V i ( L ) | | V i ( N L ) | ξ                       i { 1 , 2 , 3 , , n }  
where V i ( N L ) and V i ( L ) are the no load and loading voltages at the ith bus, respectively, and ξ is a deviation showing the allowable percentage limit for voltage profile dropping. The grid with a light load has a small deviation, and the heavy-loaded grid conducts large amounts of ξ, resulting in voltage collapse. The connectivity of the network collapse returns to bus voltage collapse as local voltage breakdown in a cascading manner. This association between the load flow equation and the dynamic response of a power system can be studied using the simple mechanical analog system shown in Figure 10.
Figure 10 shows that a number of masses representing the load buses in the electric system are suspended from a network. Furthermore, the mechanical analog system consists of screws in the solid body and elastic strings corresponding to generator PV busses and the electric transmission lines, respectively. The system is in a static steady state, with each string loaded below its break point corresponding to the fact that each transmission line is operated below its static stability. As a result, the masses undergo transient coupled motions, and the forces in the strings fluctuate. The system settles down to a new equilibrium state, characterized by a new set of strings that have the masses’ weight and can be adjusted with a screw in the solid body in the new position (i.e., line powers in the electric case). The regulation of a screw based on loosening represents the new value of the corresponding PV bus voltage amplitude and phase angle. The additional masses and cutting a string, equivalent to the load demand and line outage in the power network, result in local voltage collapse and, eventually, total system collapse. Local voltage collapse for PQ buses means that the injected increased power is less than the load demand consumption. As mentioned, the outage of PV buses in the long-term voltage collapse analysis corresponds to the strings breaking and then the removal of screws from the solid body. Accordingly, the local voltage collapse leads to total system collapse.
The connectivity of the steady-state stability of the bus voltage, considered as long-term voltage stability in Equation (24) and described using distance calculations with the Euclidean distance formula for two voltage phase angles, is given in polar coordinates. If the polar coordinates of these voltages are defined by two parameters, such as V1 (r,θ) and V2 (s,ψ), then the distance between voltage operation points is given by the cosine law, d (V1,V2) = r2 + s2 − 2rs cos(θψ).
This hypothesis regarding the Euclidean distance in the polar coordinate form is:
| V i ( N L ) V i ( L ) | | V i ( N L ) | = | Δ V i | | V i ( N L ) | = V i ( N L ) 2 + V i ( L ) 2 2 V i ( N L ) V i ( L ) cos ( θ i ( N L ) θ i ( L ) ) | V i ( N L ) | ξ
The Euclidean distance describes Equation (24) based on voltage magnitude, and phase can also be used to define the boundary of ξ around the VCP easily. The local voltage stability can be analyzed for bus I using the Euclidean distance (Equation (25)) and the proposed Thévenin model (Equations (22) and (23)). For instance, the value of ξ under the first given condition is equal to zero due to:
V i ( N L ) 2 + V i ( N L ) 2 2 V i ( N L ) V i ( N L ) cos ( 0 ) | V i ( N L ) | = 2 V i ( N L ) 2 2 V i ( N L ) 2 cos ( 0 ) | V i ( N L ) | = 0  
For any PV bus, the maximum value of ξ at the local VCP can be estimated:
V i ( L ) 2 + V i ( L ) 2 2 V i ( L ) V i ( L ) cos ( 90 ) | V i ( N L ) | = 2 2 cos ( 90 ) 1 = 1.4142  
It is apparent that ξ varies between 0 and 1.4142 in practice and from the viewpoint of the stability operation of the generator and loads in a power system, while mathematically it changes between 0 and 2.
In order to determine the relationship between the local voltage collapse and the Euclidean distance, the proposed Thévenin model was utilized for the load flow equation at bus i so that the Thévenin V t h ( b u s i ) implies the first initial guess of the voltage phasor or open circuit. Therefore, we have:
P j + i Q j = V b u s i I j * = V b u s i ( V t h ( b u s i ) V b u s i ) * Z t h ( p o w e r   n e t w o r k ) * ( P j + i Q j ) Z t h ( p o w e r   n e t w o r k ) * = V b u s i ( Δ V b u s i * )
F 1 = ( R t h P j   + X t h Q j ) = V b u s i Δ V x b u s i = V b u s i ( V t h ( b u s i ) cos ( α V t h α V b u s i ) V b u s i )
F 2 = ( R t h Q j   X t h P j ) = V b u s i Δ V y b u s i = V b u s i ( V t h ( b u s i ) sin ( α V t h α V b u s i )
The classical form of the load flow equation for a two-bus test system is indicated in Equations (27) and (28). The implementation of Newton-based load flow for the mentioned equation gives the Jacobian matrix as follows:
Jacobian ( F 1 , F 2 ) = [ d F 1 d α α V b u s i d F 1 d V b u s i d F 2 d α V b u s i d F 2 d V b u s i ] = [ V b u s i V t h ( b u s i ) sin ( α V t h α V b u s i ) V t h ( b u s i ) cos ( α V t h α V b u s i ) 2 V b u s i V b u s i V t h ( b u s i ) cos ( α V t h α V b u s i ) V t h ( b u s i ) sin ( α V b u s i α V t h ) ]
It is clear that the determinant of the Jacobian matrix as a system derivative with respect to independent variables in terms of loading is equal to zero at the maximum loading point. We can find:
V b u s i 2 V b u s i 2 cos ( α V t h α V b u s i ) V t h ( b u s i ) = 0 V t h ( b u s i ) cos ( α V t h α V b u s i ) V t h ( b u s i ) = V b u s i 2 V b u s i = 1 2          
Equation (30) shows that the value of the bus voltage amplitude at the local collapse point is reduced to half of the basic condition. The reformulated Jacobian matrix determinant based on the Euclidean distance gives:
D e t ( Jacobian ( F 1 , F 2 ) ) = V b u s i V t h ( b u s i ) 2 2 V b u s i 2 V t h ( b u s i ) cos ( α V t h α V b u s i ) = V b u s i [ V t h ( b u s i ) 2 2 V b u s i V t h ( b u s i ) cos ( α V t h α V b u s i ) ) ]     = V b u s i ( Δ V 2 V b u s i 2 ) = V b u s i ( E D 2 V b u s i 2 ) = 0           E D 2 = V b u s i 2 E D V b u s i = 1
It can be found from Equations (26) and (31) that
| S | V b u s i Y t h ( p o w e r   n e t w o r k ) = E D V b u s i = 1
The boundary of the voltage phase angle of the Thévenin model can be estimated at the VCP as follows
cos ( α V t h α V b u s i ) = 1 2   cos ( α V t h α V b u s i ) = V t h ( b u s i ) V b u s i × 1 2
Originally, the value of V t h ( b u s i ) is near 1 p.u., and the assumed V b u s i is 0.5 due to its sharply dropping at the VCP; thus, we have
cos ( α V t h α V b u s i ) = 1 4 α V t h α V b u s i = 73.52 0
This issue reveals that, in most practical cases, the maximum difference in the phase angle from the initial to the vicinity local voltage collapse varies around 80 ± 7° [27].
The load flow equation can also be defined as the cost function, such that the solutions settle down at the optimum point and no solution for the optimum point corresponds to the VCP [11,28]. The local VCP valuation can be carried out using the cost function of the complex power for an equivalent two-bus system using Equations (27) and (28):
cost ( P , Q ) = ( F 1 V b u s i ( V t h ( b u s i ) cos ( α V t h α V b u s i ) V b u s i ) ) 2 + ( F 2 V b u s i ( V t h ( b u s i ) sin ( α V t h α V b u s i ) ) ) 2
For different values of F1 and F2 as active and reactive load enhancements, Equation (31) has a pair of solutions that meet each other at the VCP. In other words, the trajectories of all straight lines through two distinct state variable solutions (the voltage magnitude and the angle at each bus) approach the VCP in terms of the loading factor [29]. The quadratic form of the load flow solution for the cost function is
V b u s i R 2 V t h ( b u s i ) V b u s i R + ( F 2 V t h ( b u s i ) ) 2 + F 1 = 0                
The solution to Equation (36) is
V b u s i R = V t h ( b u s i ) ± V t h ( b u s i ) 2 4 [ ( F 2 V t h ( b u s i ) ) 2 + F 1 ] 2
By dividing Equation (36) by the V th ( busi ) , we get:
V b u s i R V t h ( b u s i ) = 1 2 ± 1 4 [ F 2 2 V t h ( b u s i ) 4 + F 1 V t h ( b u s i ) 2 ]
In order to have two distinct roots for Equation (36), the discriminant should be positive, which results in:
V b u s i V t h ( b u s i ) cos ( α V t h α V b u s i ) V b u s i 2 C O S 2 ( α V t h α V b u s i )   V t h ( b u s i ) 2 < 1 4  
Equation (39) varies between 0 and 0.25, corresponding to the voltage stability index varying between 0 and 1 [28,30].
In the case of Equation (39), as the discriminant of Equation (35) is equal to 0.25 at the local collapse point, Equation (38) becomes
V b u s i R V t h ( b u s i ) = 1 2
Moreover, Equation (40) can be confirmed from the derivation of Equation (36) with respect to V b u s i R . Accordingly, the variations in the bus voltage magnitude and phase angle from the first given condition to the local voltage collapse may be between 1 and 0.5 and approximately 0 and 90°. The total voltage collapse of the network can occur in a cascaded manner after the local voltage collapse. Indeed, a minimum of one local voltage collapse is required to break down a network.
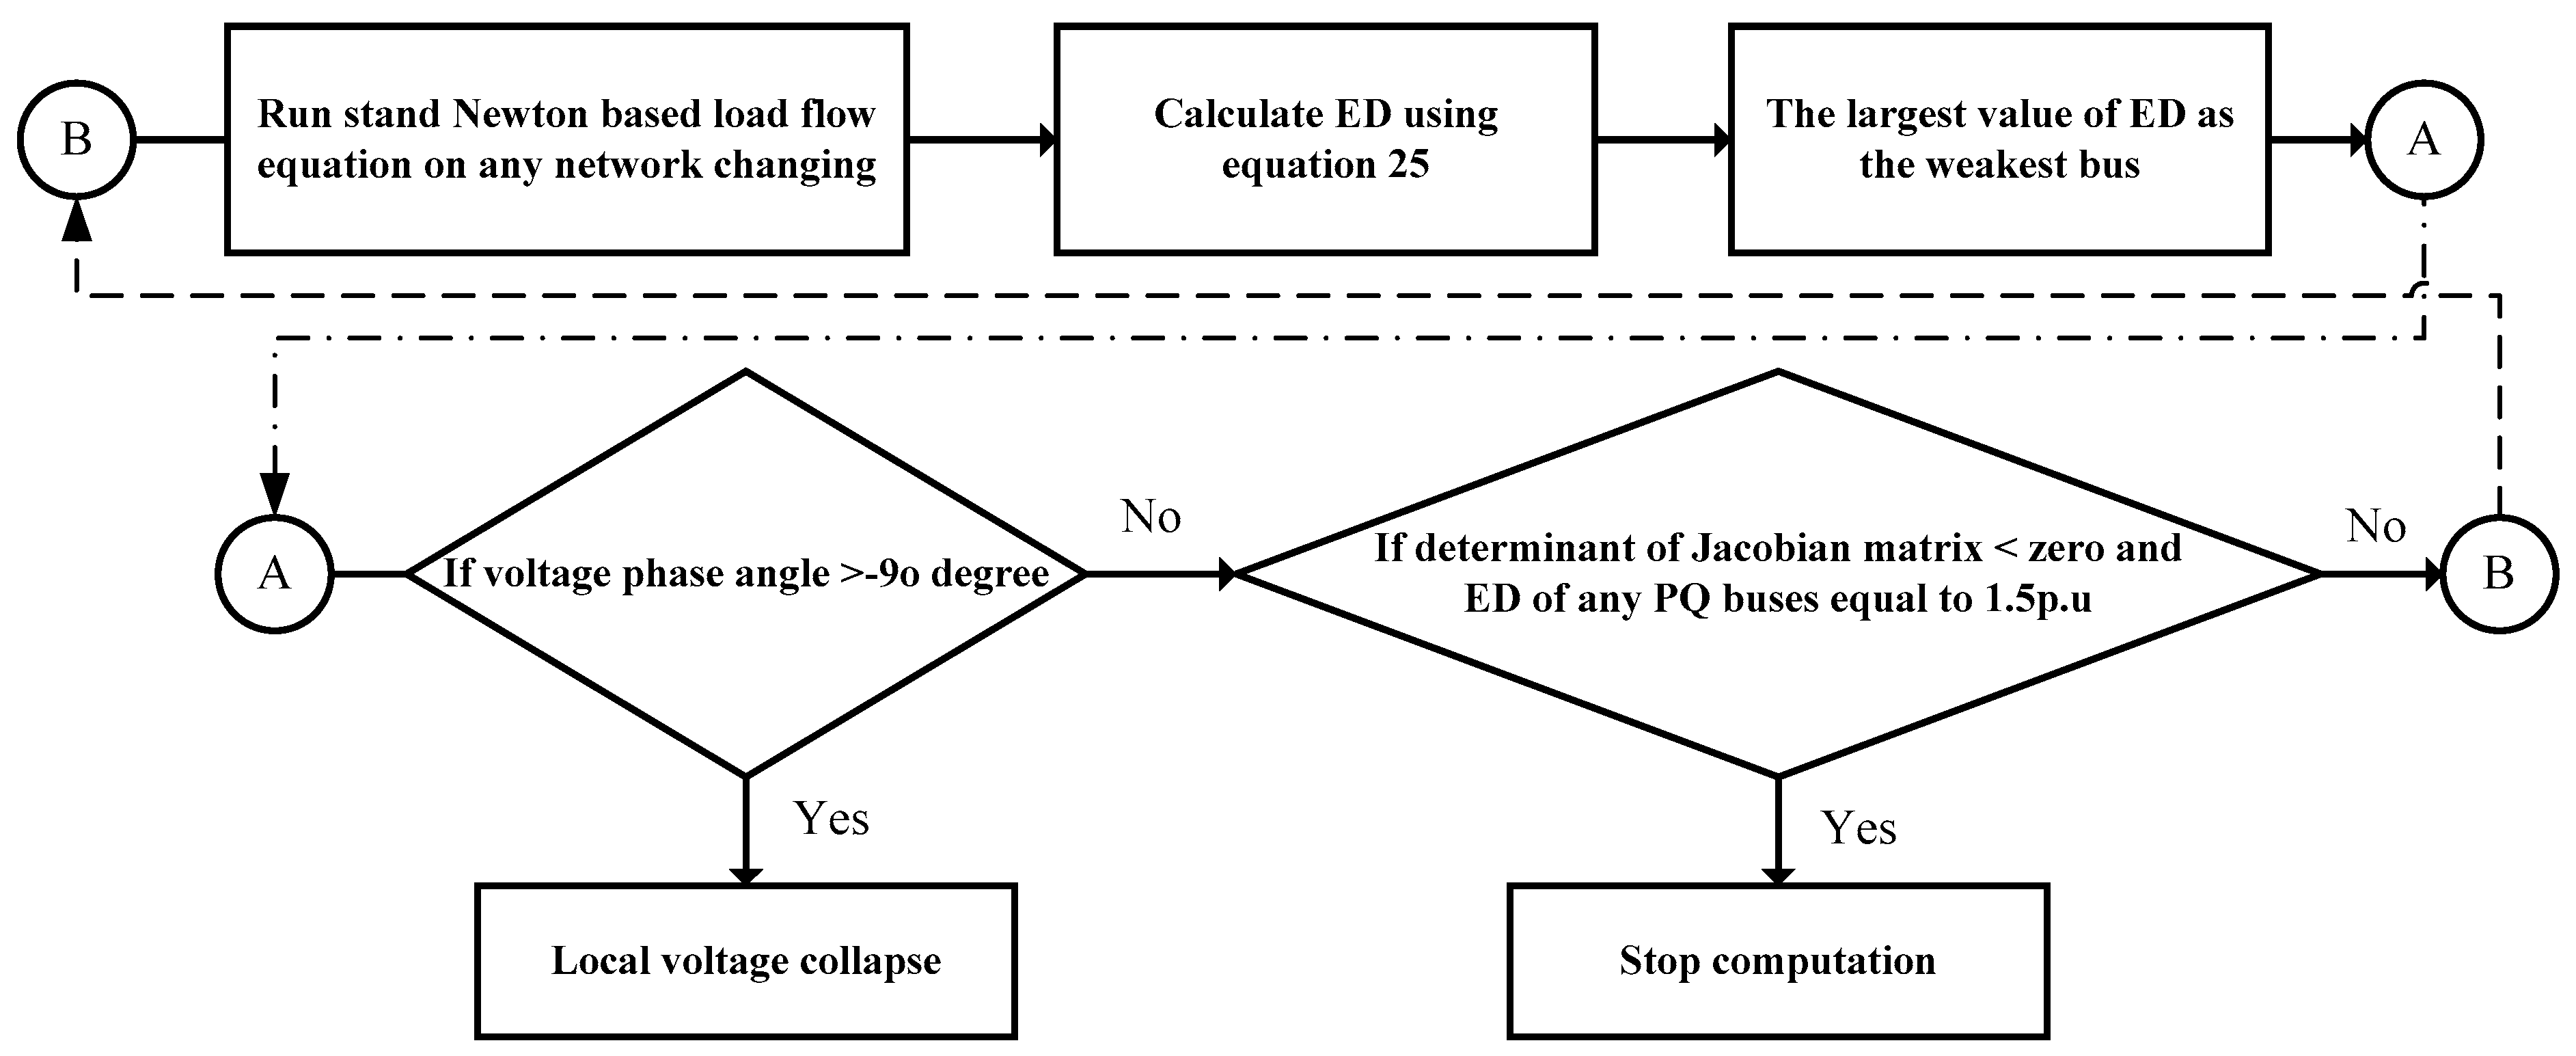
The connectivity between the load flow analysis and the long-term voltage stability was investigated using a generator model by introducing a novel voltage stability assessment based on the multi-machine dynamic model along with the load flow study for a power grid. In parallel, the Euclidean distance (ED) was represented as a novel voltage stability index through the voltage phasor profile. The results of the reactive power compensation’s further load-generation patterns and network topology fluctuations in the changing network configuration can be perceived plainly from the voltage profiles of the buses. The whole process of stability estimation using an ED method is shown in Figure 11:
  • Run the standard Newton-based load flow equation for the load demand increase in response to the different topology changes resulting from line outages or reactive power compensation, or only one of them;
  • Calculate the Euclidean distance (ED) (Equation (25)) for every PQ bus;
  • Consider the PQ bus with the greatest value for the Euclidean distance (ED) as the weakest bus;
  • If the voltage phase angle of the weakest bus is greater than −900, then local voltage collapse will occur; otherwise, go to 5;
  • If the determinant of the Jacobian matrix is less than zero and the Euclidean distance (ED) of any of the PQ buses approaches 1.5 p.u., stop the computation; otherwise, go to 1.
4. Results

The proposed method was tested and validated using an IEEE 118-bus test system network.

4.1. IEEE 118-Bus Test System

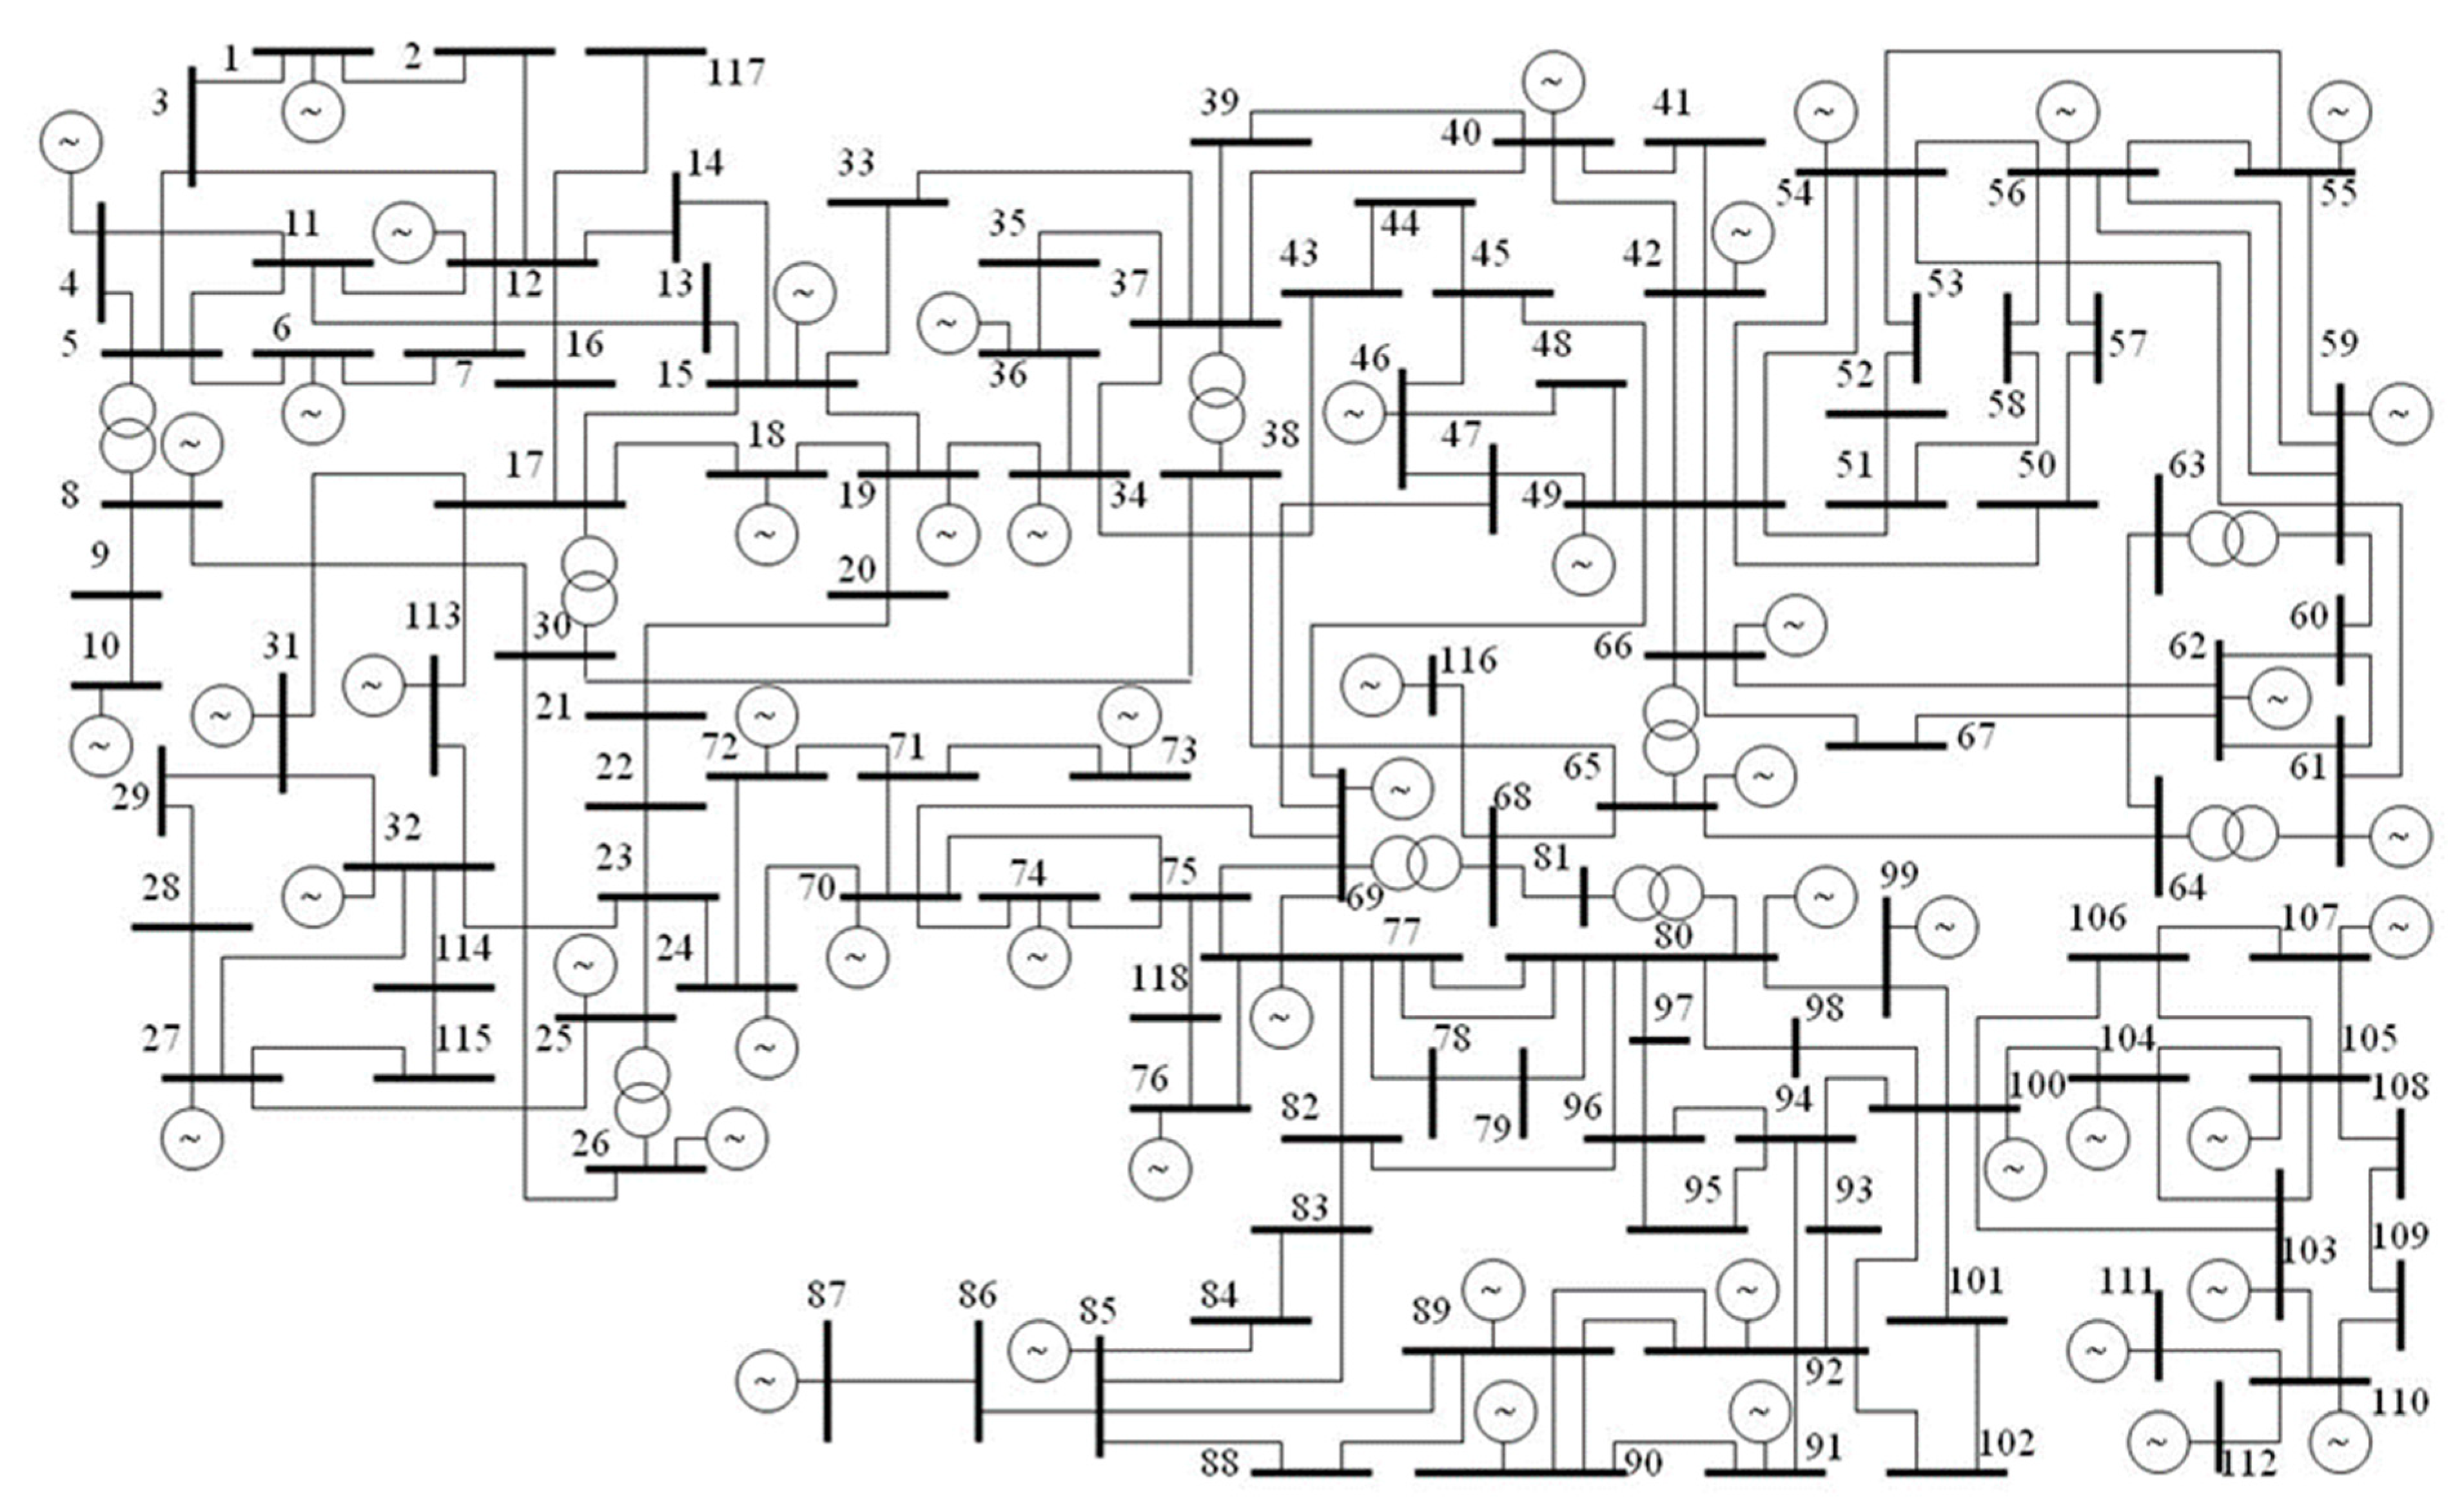
An IEEE 118-bus test system was used to verify the Euclidean distance (ED) voltage stability index for the voltage profile during load demand increases for the different topology changes resulting from line outages and reactive power compensation. This system includes 118 buses, 186 branches, 91 load sides and 51 thermal units. A single-line diagram of the IEEE 118-bus test system is shown in Figure 12.
The ED voltage stability index was verified in the two scenarios shown in Table 1 by estimating the voltage stability margin. These cascade events happened at step numbers 11, 26 and 36, corresponding to load levels of 5302.5, 6893.25 and 7953.75 MW, respectively. The load increasing path was calculated according Equation (41)
P = P 0 + n × P s t e p
where P0 is equal to the initial load demand condition for every PQ bus, Pstep is equal to the step size of 0.025 p.u. and n represents the step increase.
The related voltage profile increasing from 4242 MW under the first given system condition to the maximum loading point at 11,665.5 MW was used as a reference profile. The effects of the cascade events involving line outages and reactive power consumption changes, as well as load demand increasing, on the reference voltage profile under the first given condition were considered to investigate the propose method.

4.2. First Case

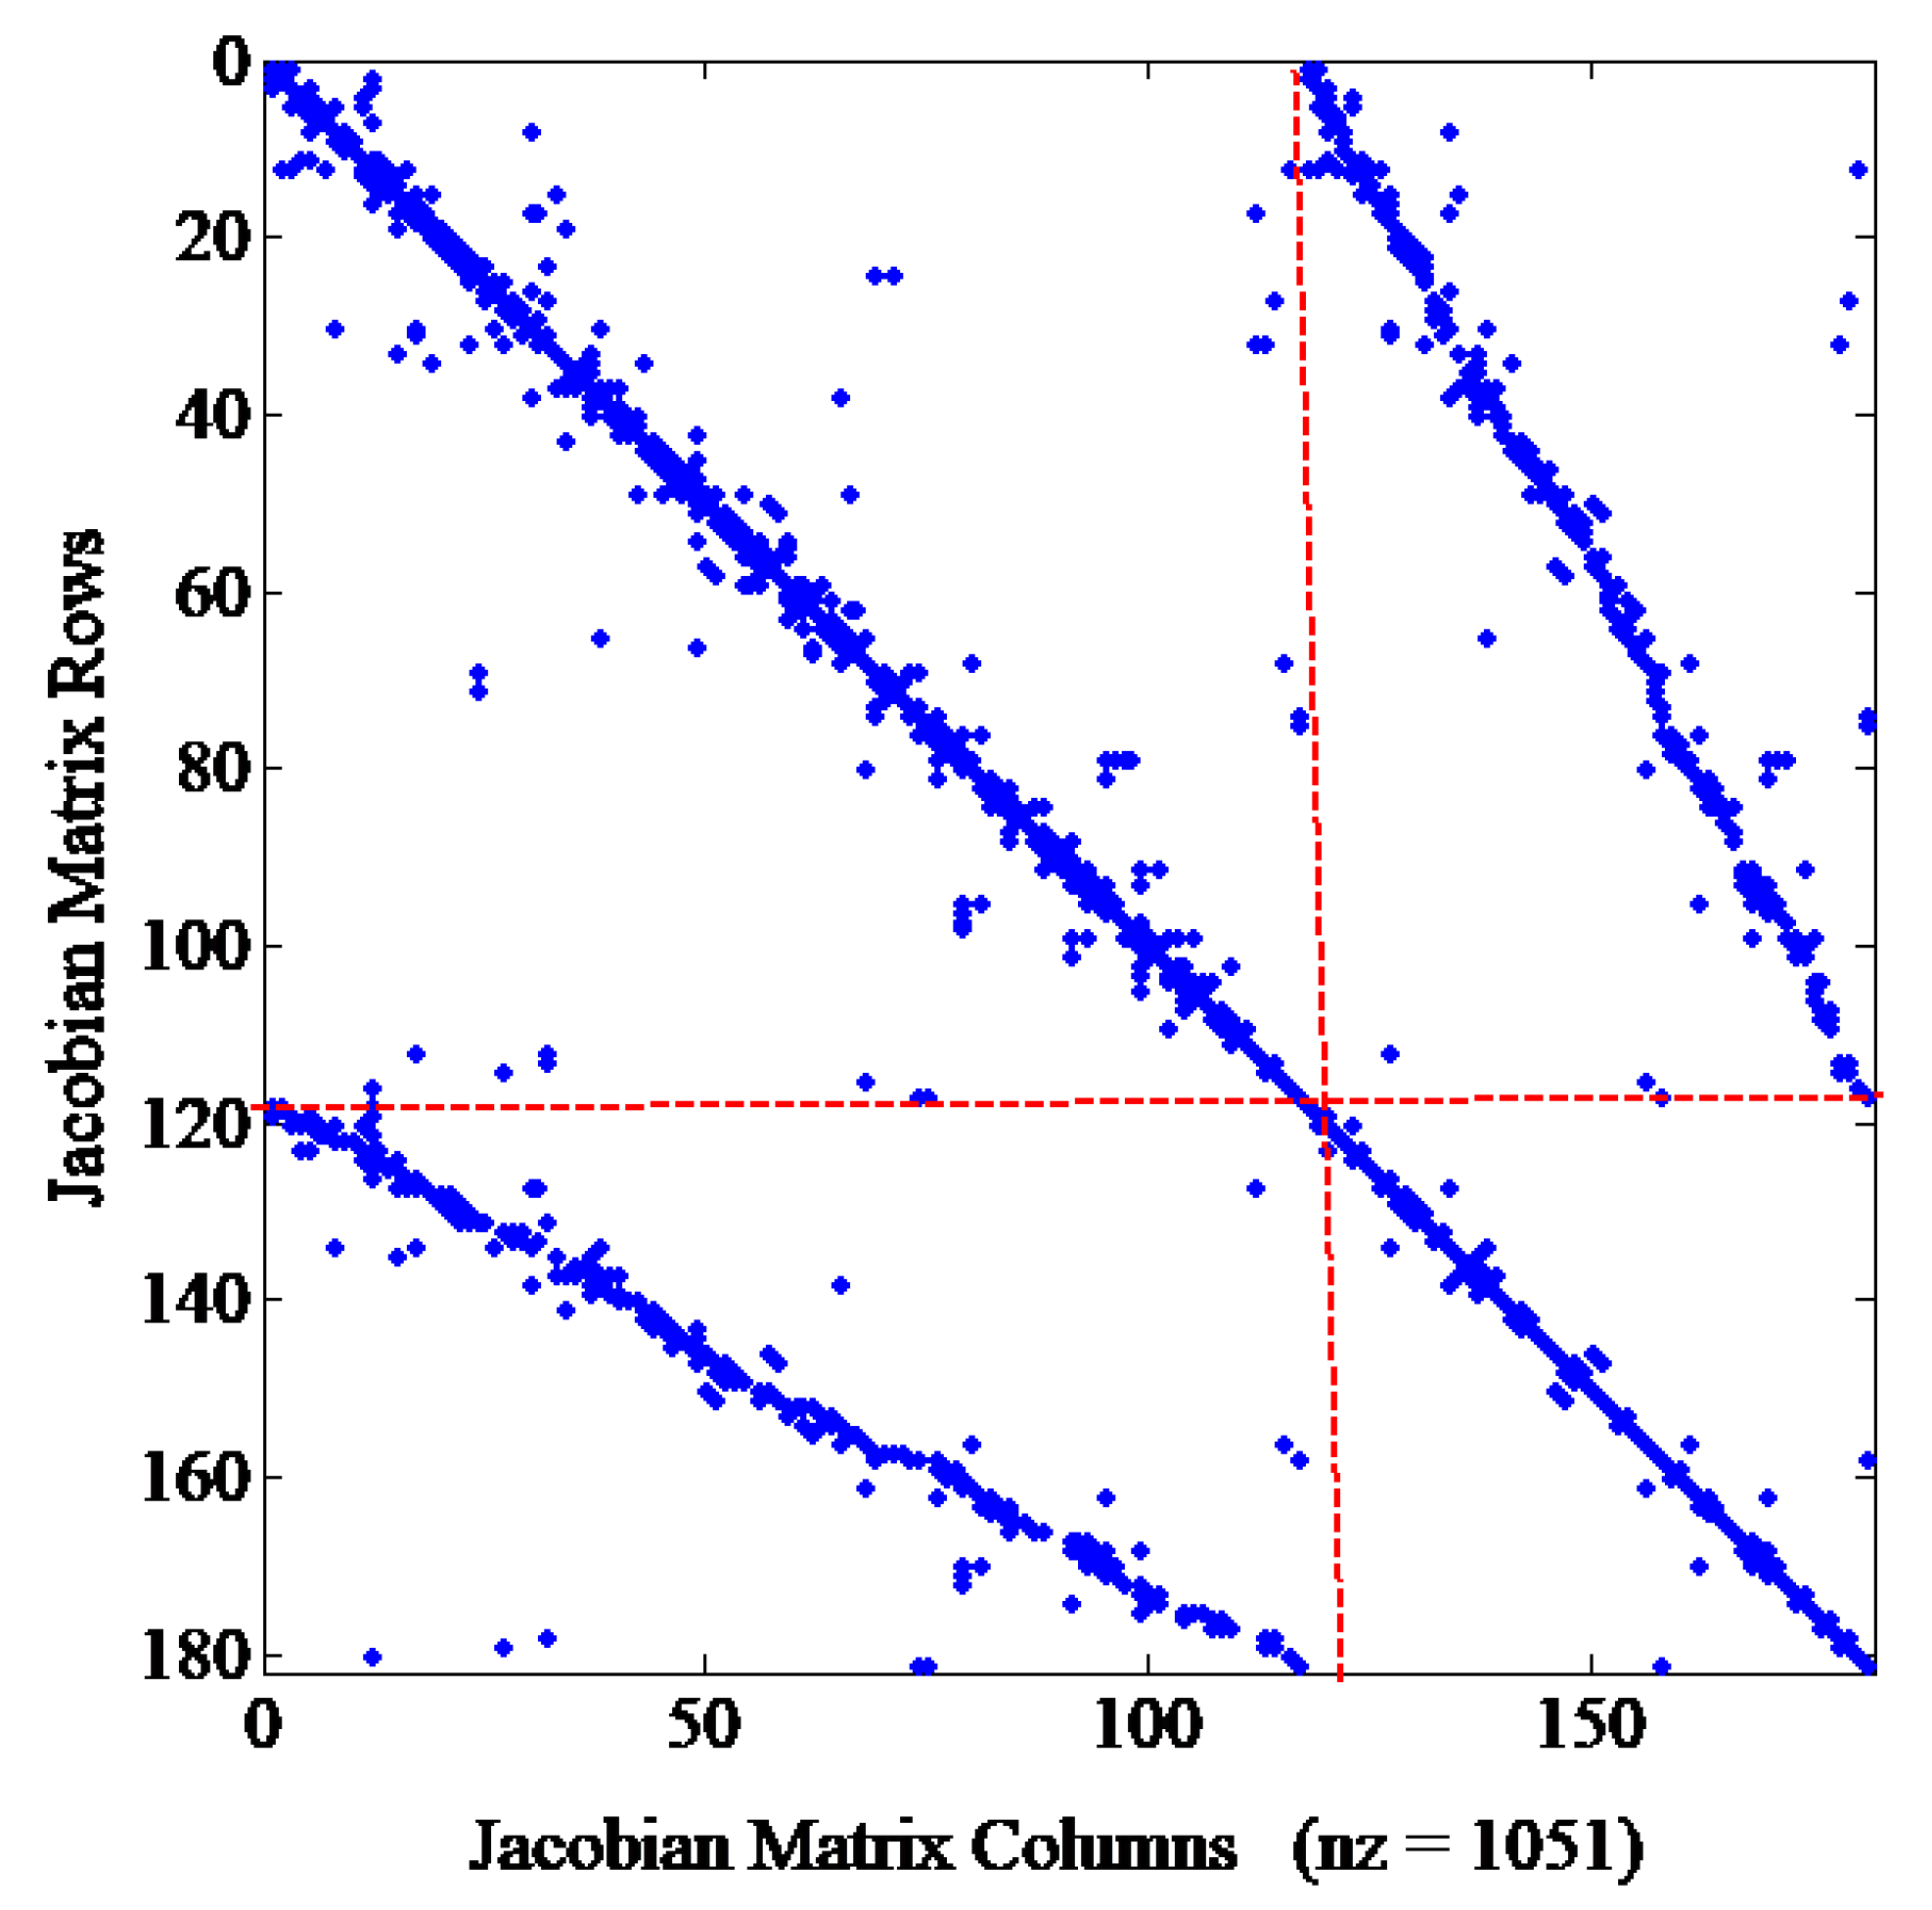
For the loading pattern in the first case, the system load was increased gradually with a step size of 0.025 p.u. until the resulting load capability limit corresponding to the existence of the load flow solution defined as the voltage stability limit point was reached. The system maximum load ability in terms of load increases was found at the boundary of the Jacobian matrix singularity at a load level of 2.75 p.u. Divergence in the load flow solution and the Jacobian matrix singularity were seen at 2.775, beyond the maximum load ability. The non-zero elements of the Jacobian matrix for the load level of 2.75 were the 1051 points shown in Figure 13.
The density of the matrix and the non-zero elements of the diagonals reflect the condition of a system, indicating whether it is well- or ill-conditioned. Since the matrix density was low, it can be concluded that the IEEE 118-bus test system at the load level of 2.75 was an ill-conditioned system, as presented in Figure 13.
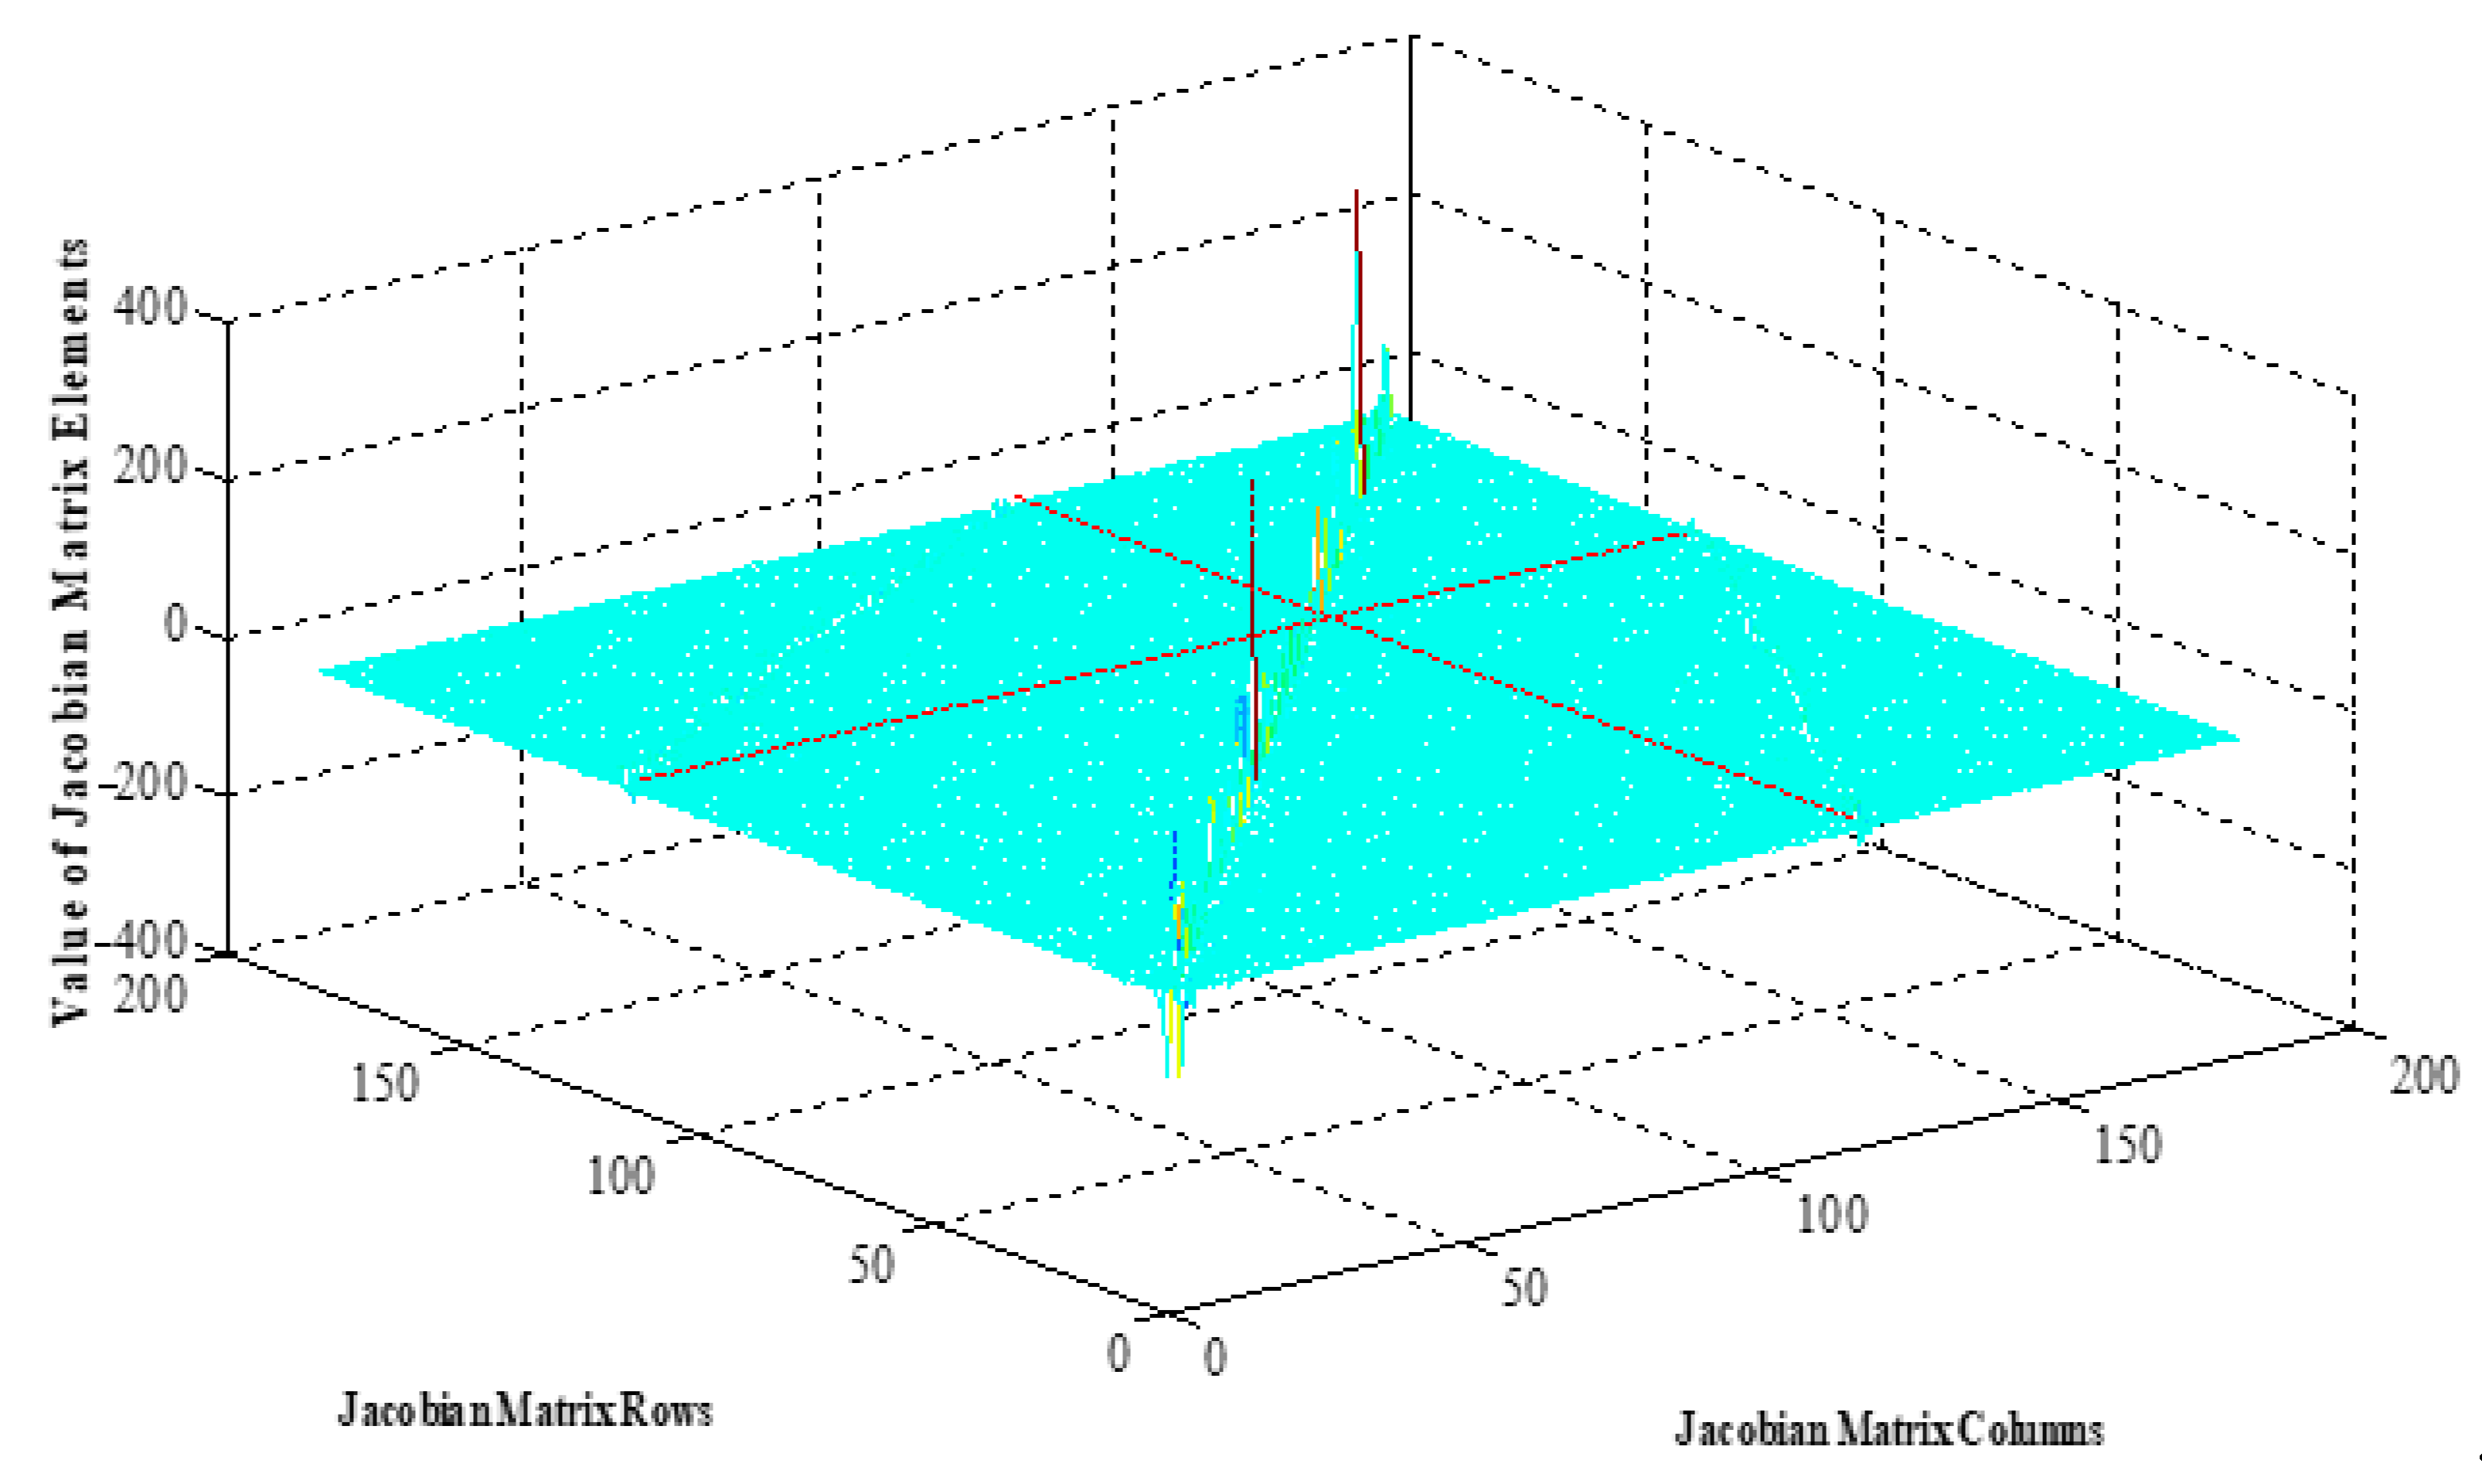
This was because most of the Jacobian matrix’s zero elements were within the area of Δ P / Δ α and Δ Q / Δ | V | (surrounded by dashed red lines). Figure 14 and Figure 15 show the solid mesh geometry of a sparse Jacobian for the IEEE 118-bus test system under loadings of 2.75 and 2.775 as the boundary and beyond the VCP of the system, respectively. The zero elements of the Jacobian matrix main diagonal in Figure 13 clearly imply the insolvability of the load flow equation.
In Figure 15, it is apparent that the large number of Jacobian matrix zero elements is what leads to the insolvability condition for the load flow equations; i.e., for the complete estimation of power grid instability. The determinant and condition number of the Jacobian matrix can also verify this fact, with Table 2 indicating that the Jacobian matrix condition, as a ratio of the maximum to minimum eigenvalues, had a very high value, 1.8446 × 10⁷ at 2.775 (step 72), in comparison to before the maximum loading point (MLP). For this case, the negative sign of the Jacobian matrix determinant indicates the absolute steady-state instability of the system at a value of 2.775 (step 72) and higher. On the other hand, the infinite sensitivity of the system stability in the vicinity of the MLP was apparent due to the very large difference between the values of the Jacobian matrix determinant at the loading points of 2.775 (step 72) and 2.75 (step 71): −6.0727e + 302 and 2.4317e + 251, respectively. Accordingly, the value at 2.75 (step 71) was considered as the VCP.
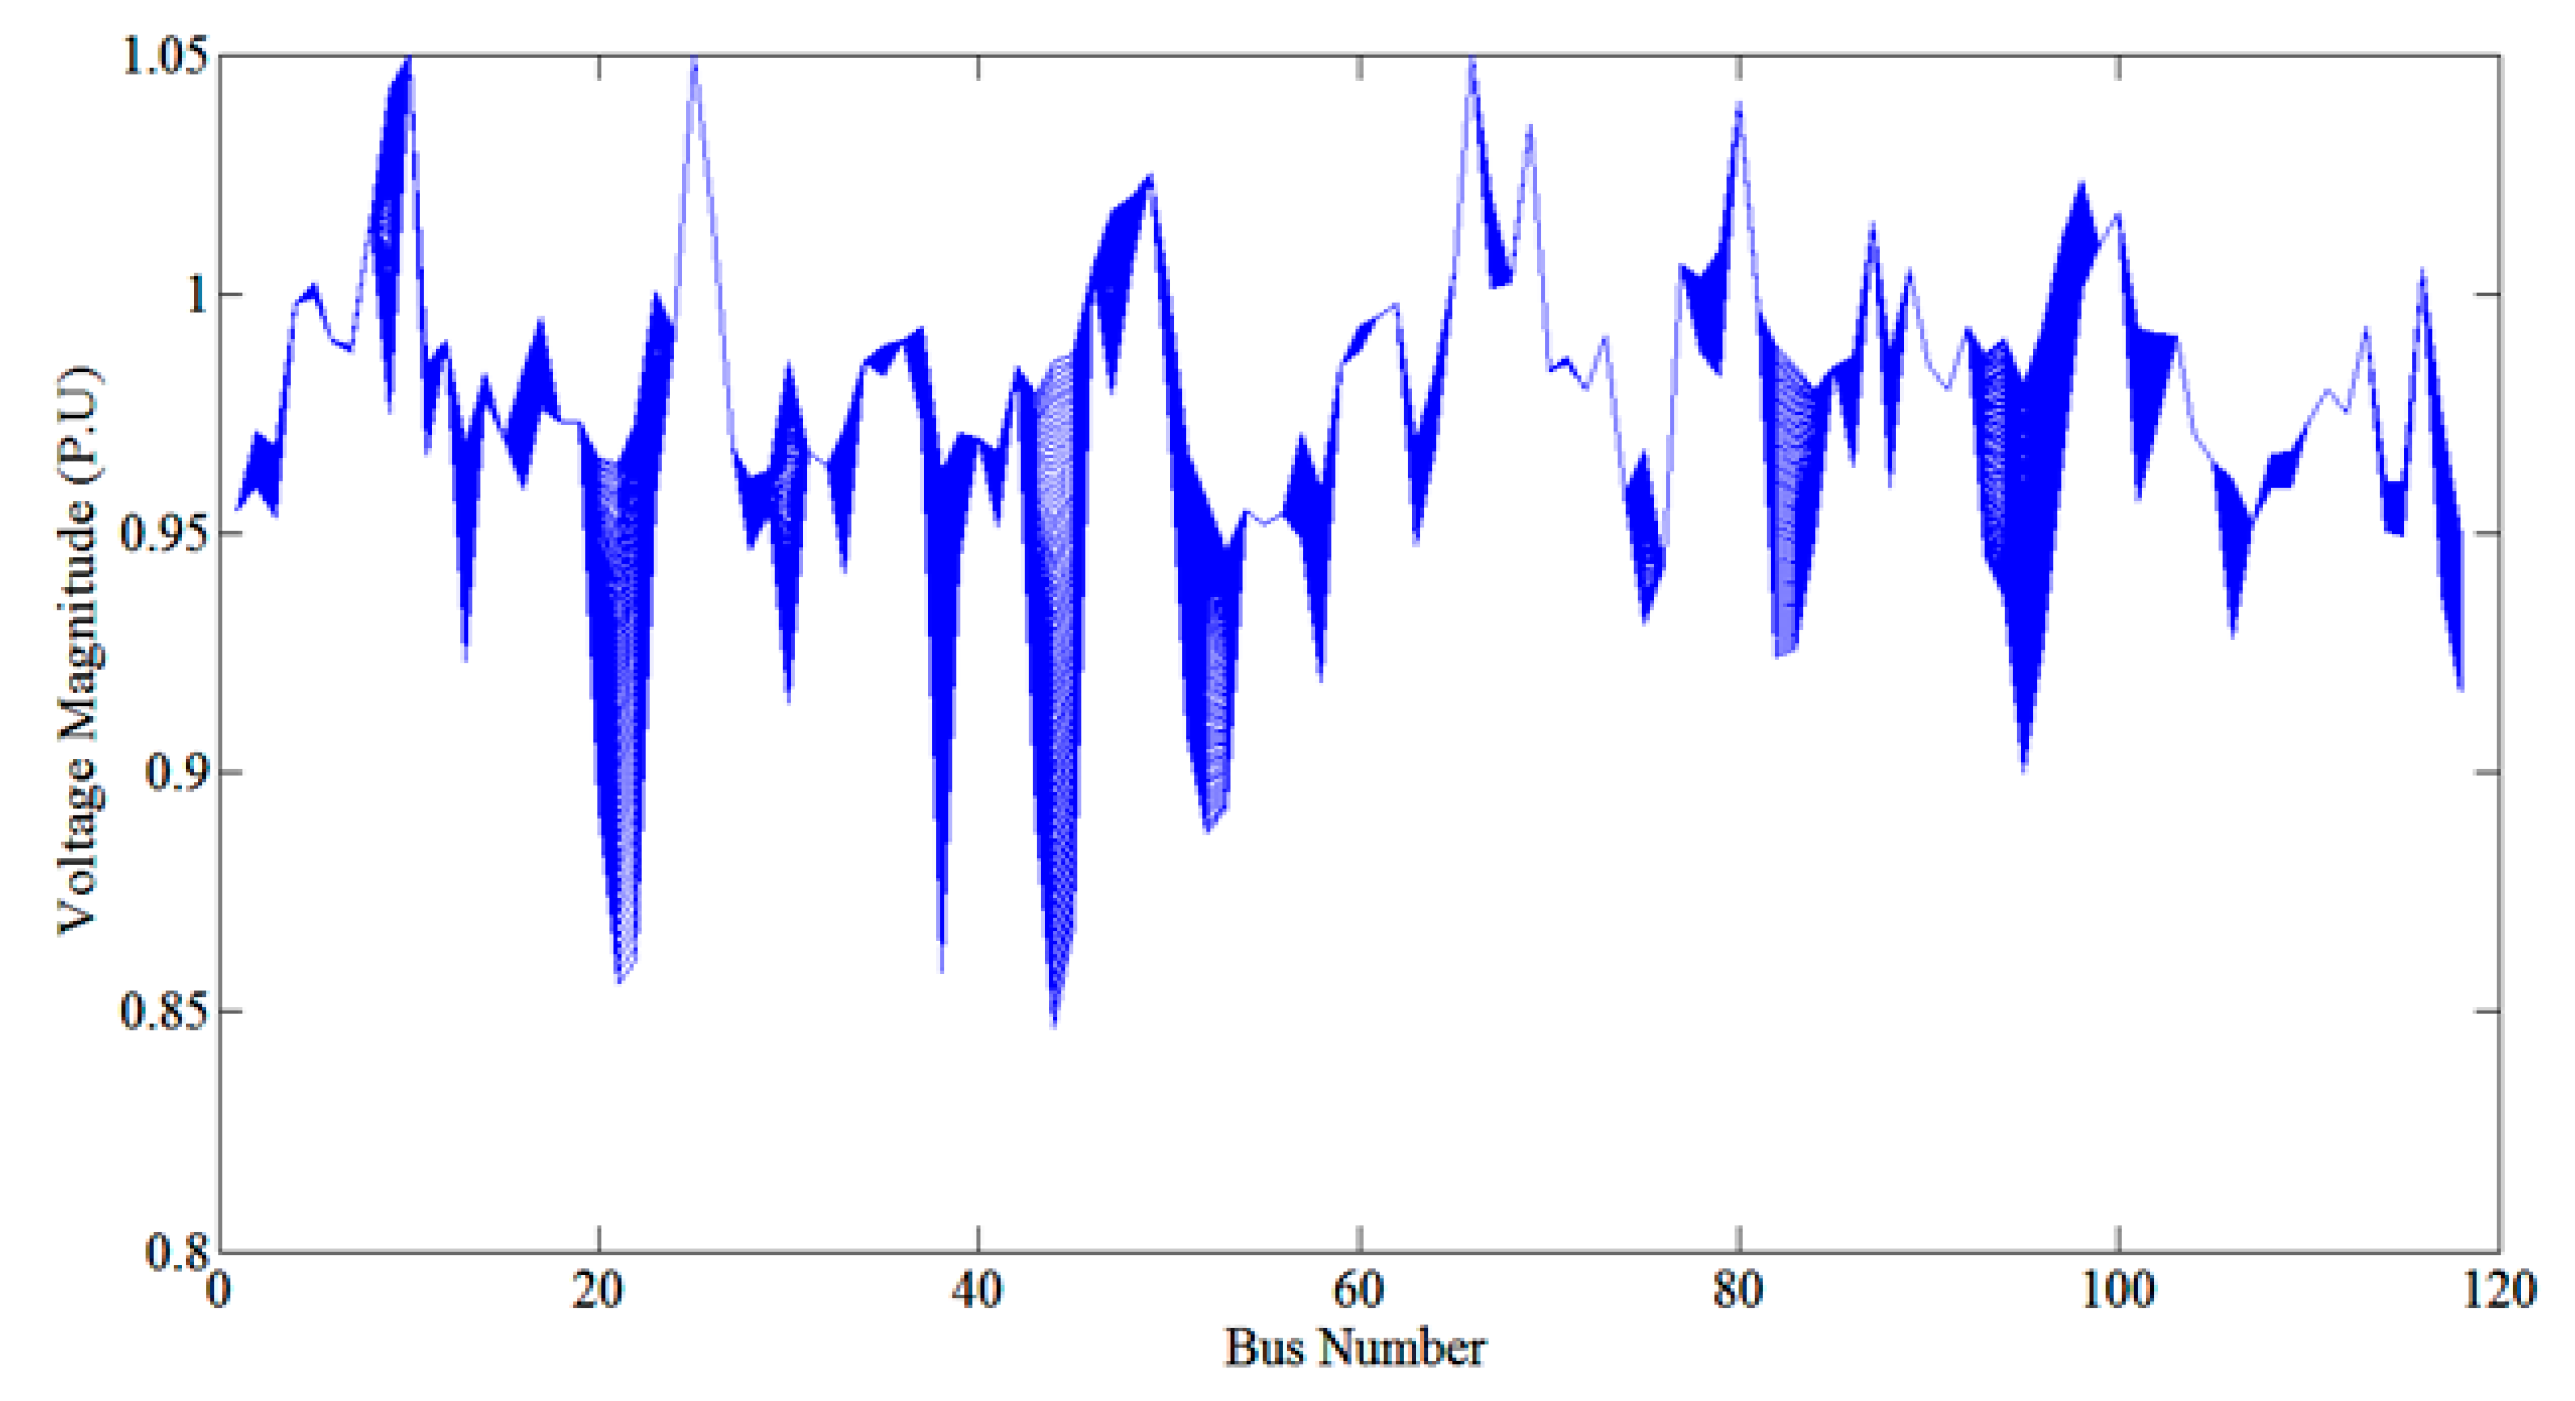
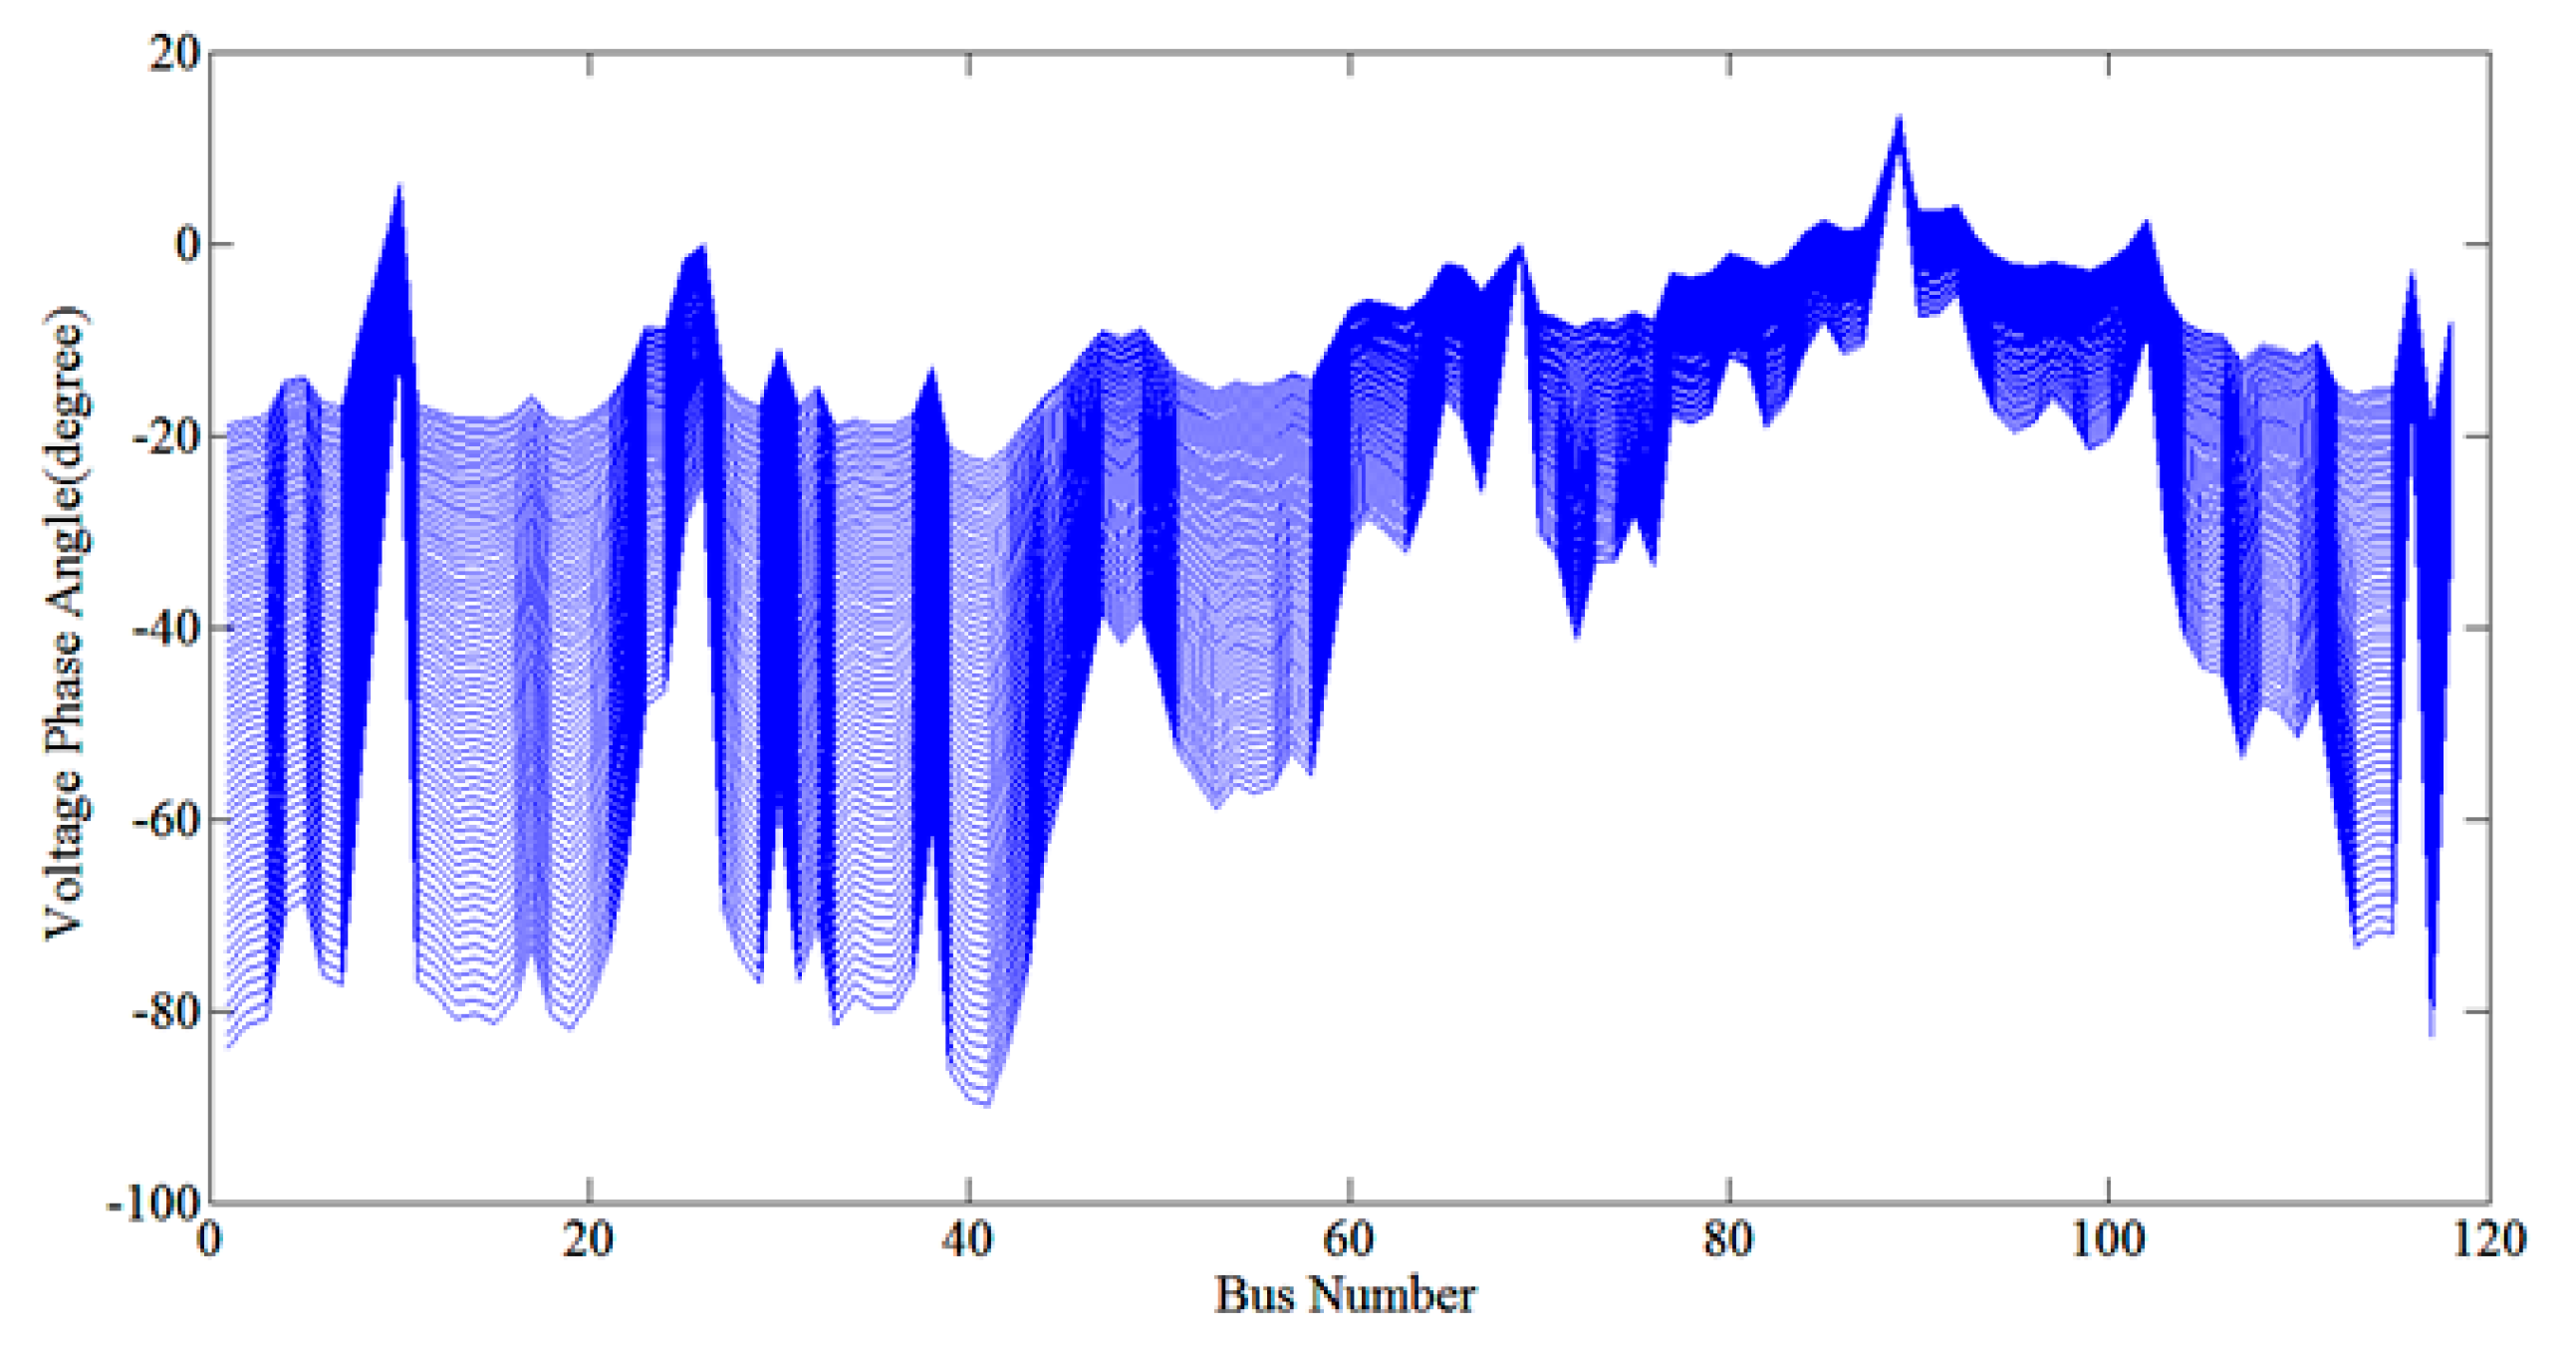
The voltage amplitude and phasor profile in terms of the load demand increment in the MLP are shown in Figure 16 and Figure 17, respectively.
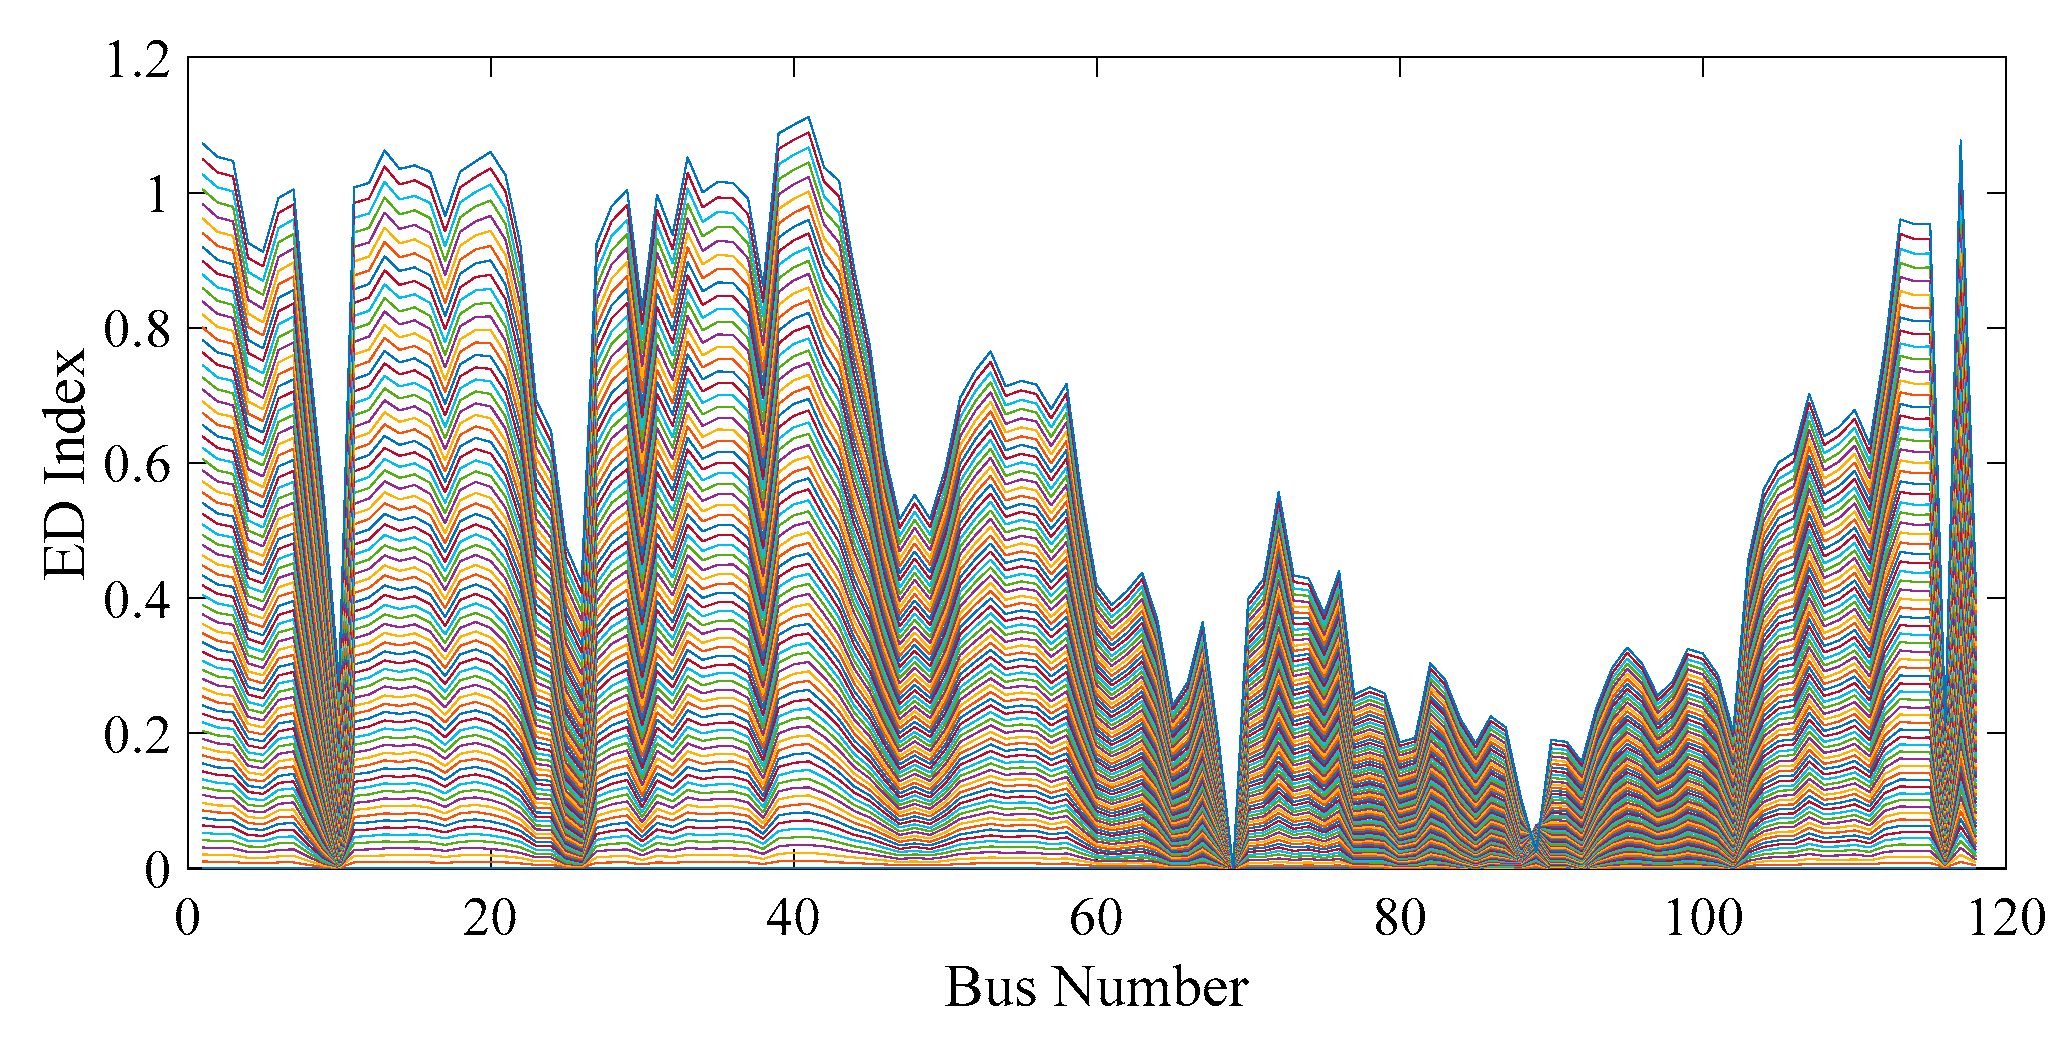
Figure 16 and Figure 17 indicate the variations in the magnitude of the bus voltages and the phase angles, which had minimum values of 0.8676 (p.u) and −90° for buses 44 and 41 near the MLP, respectively. This confirmed that the breakdown of the steady-state stability of the power system in the vicinity of the MLP could have occurred due to the voltage phase angle approaching −90° in at least one of the buses; i.e., either the voltage phasor or the amplitude profiles from the initial loading point. Figure 18 shows the ED index profiles in terms of the load demand increment in the MLP and also verifies that buses 44 and 41 were the weakest unstable regions near the MLP because of their corresponding maximum ED index values between buses.

4.3. Second Case

This case includes cascading line outages and reactive power compensation during the load demand increase. The outages based on lines 5–6 and 3–12 between buses 5, 6, 3 and 12 were implemented at loading levels of 5302.5 MW (step 11) and 6893.25 MW (step 26), respectively. The reactive power compensation occurred at bus 3 with −50 Mvar as the reactive load.
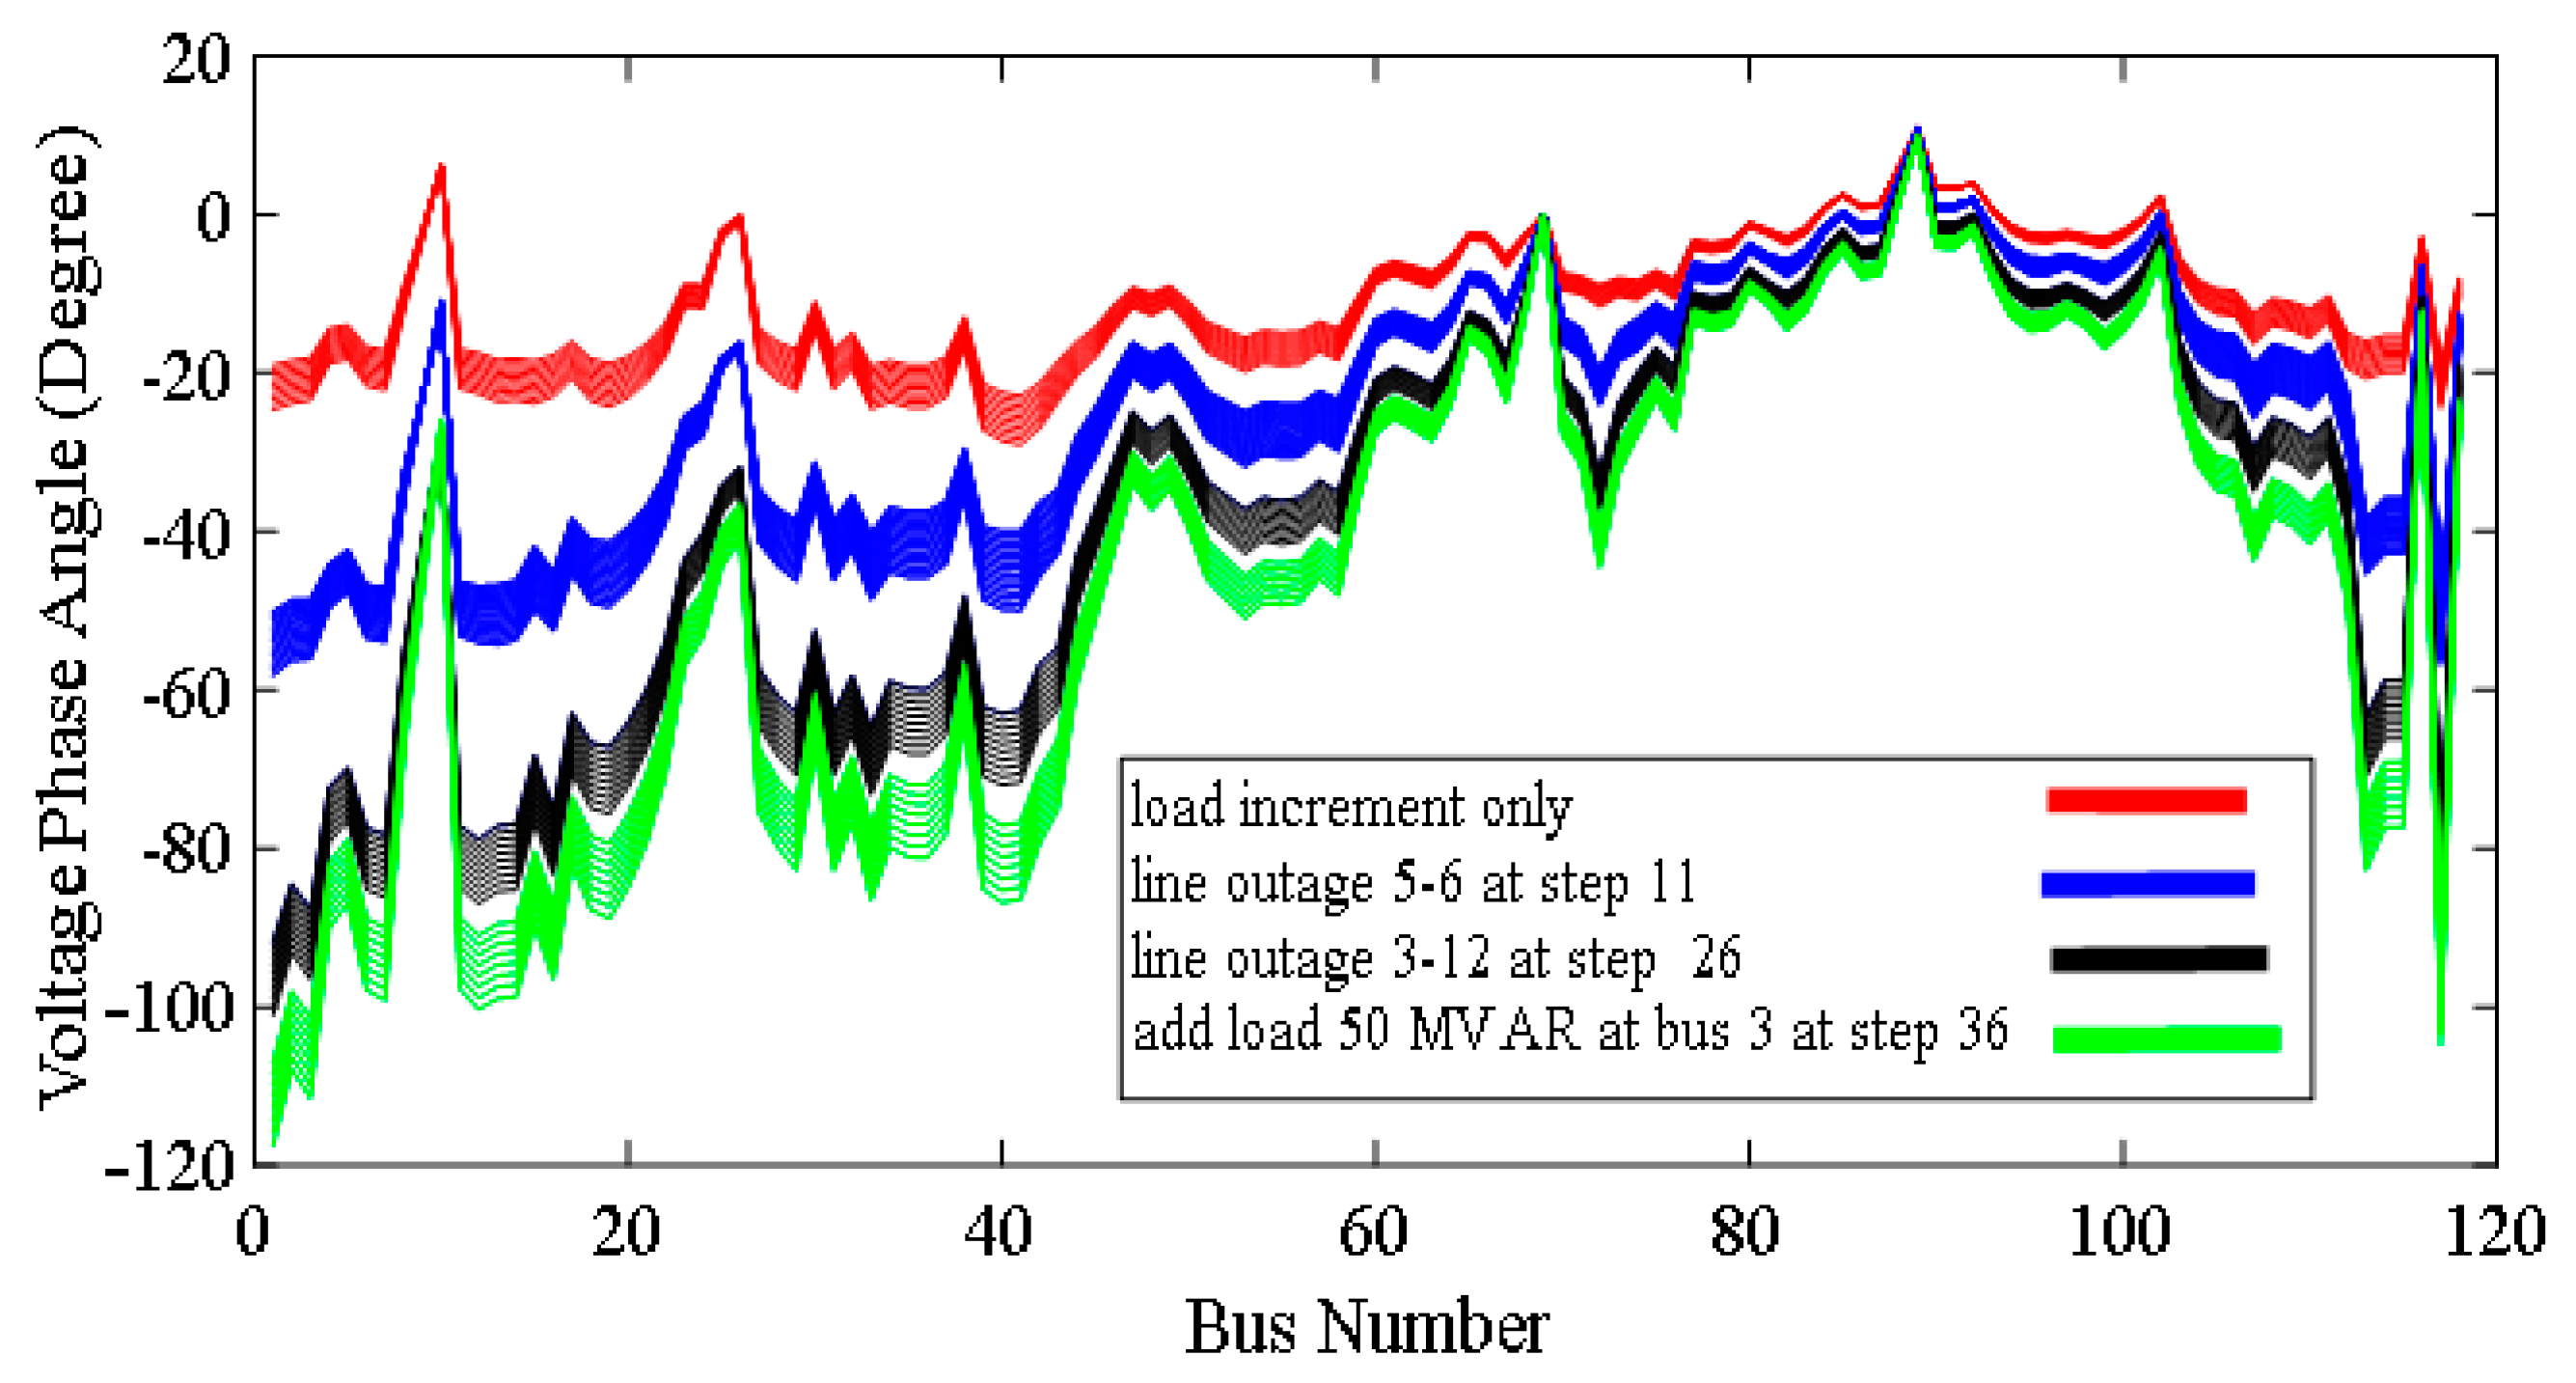
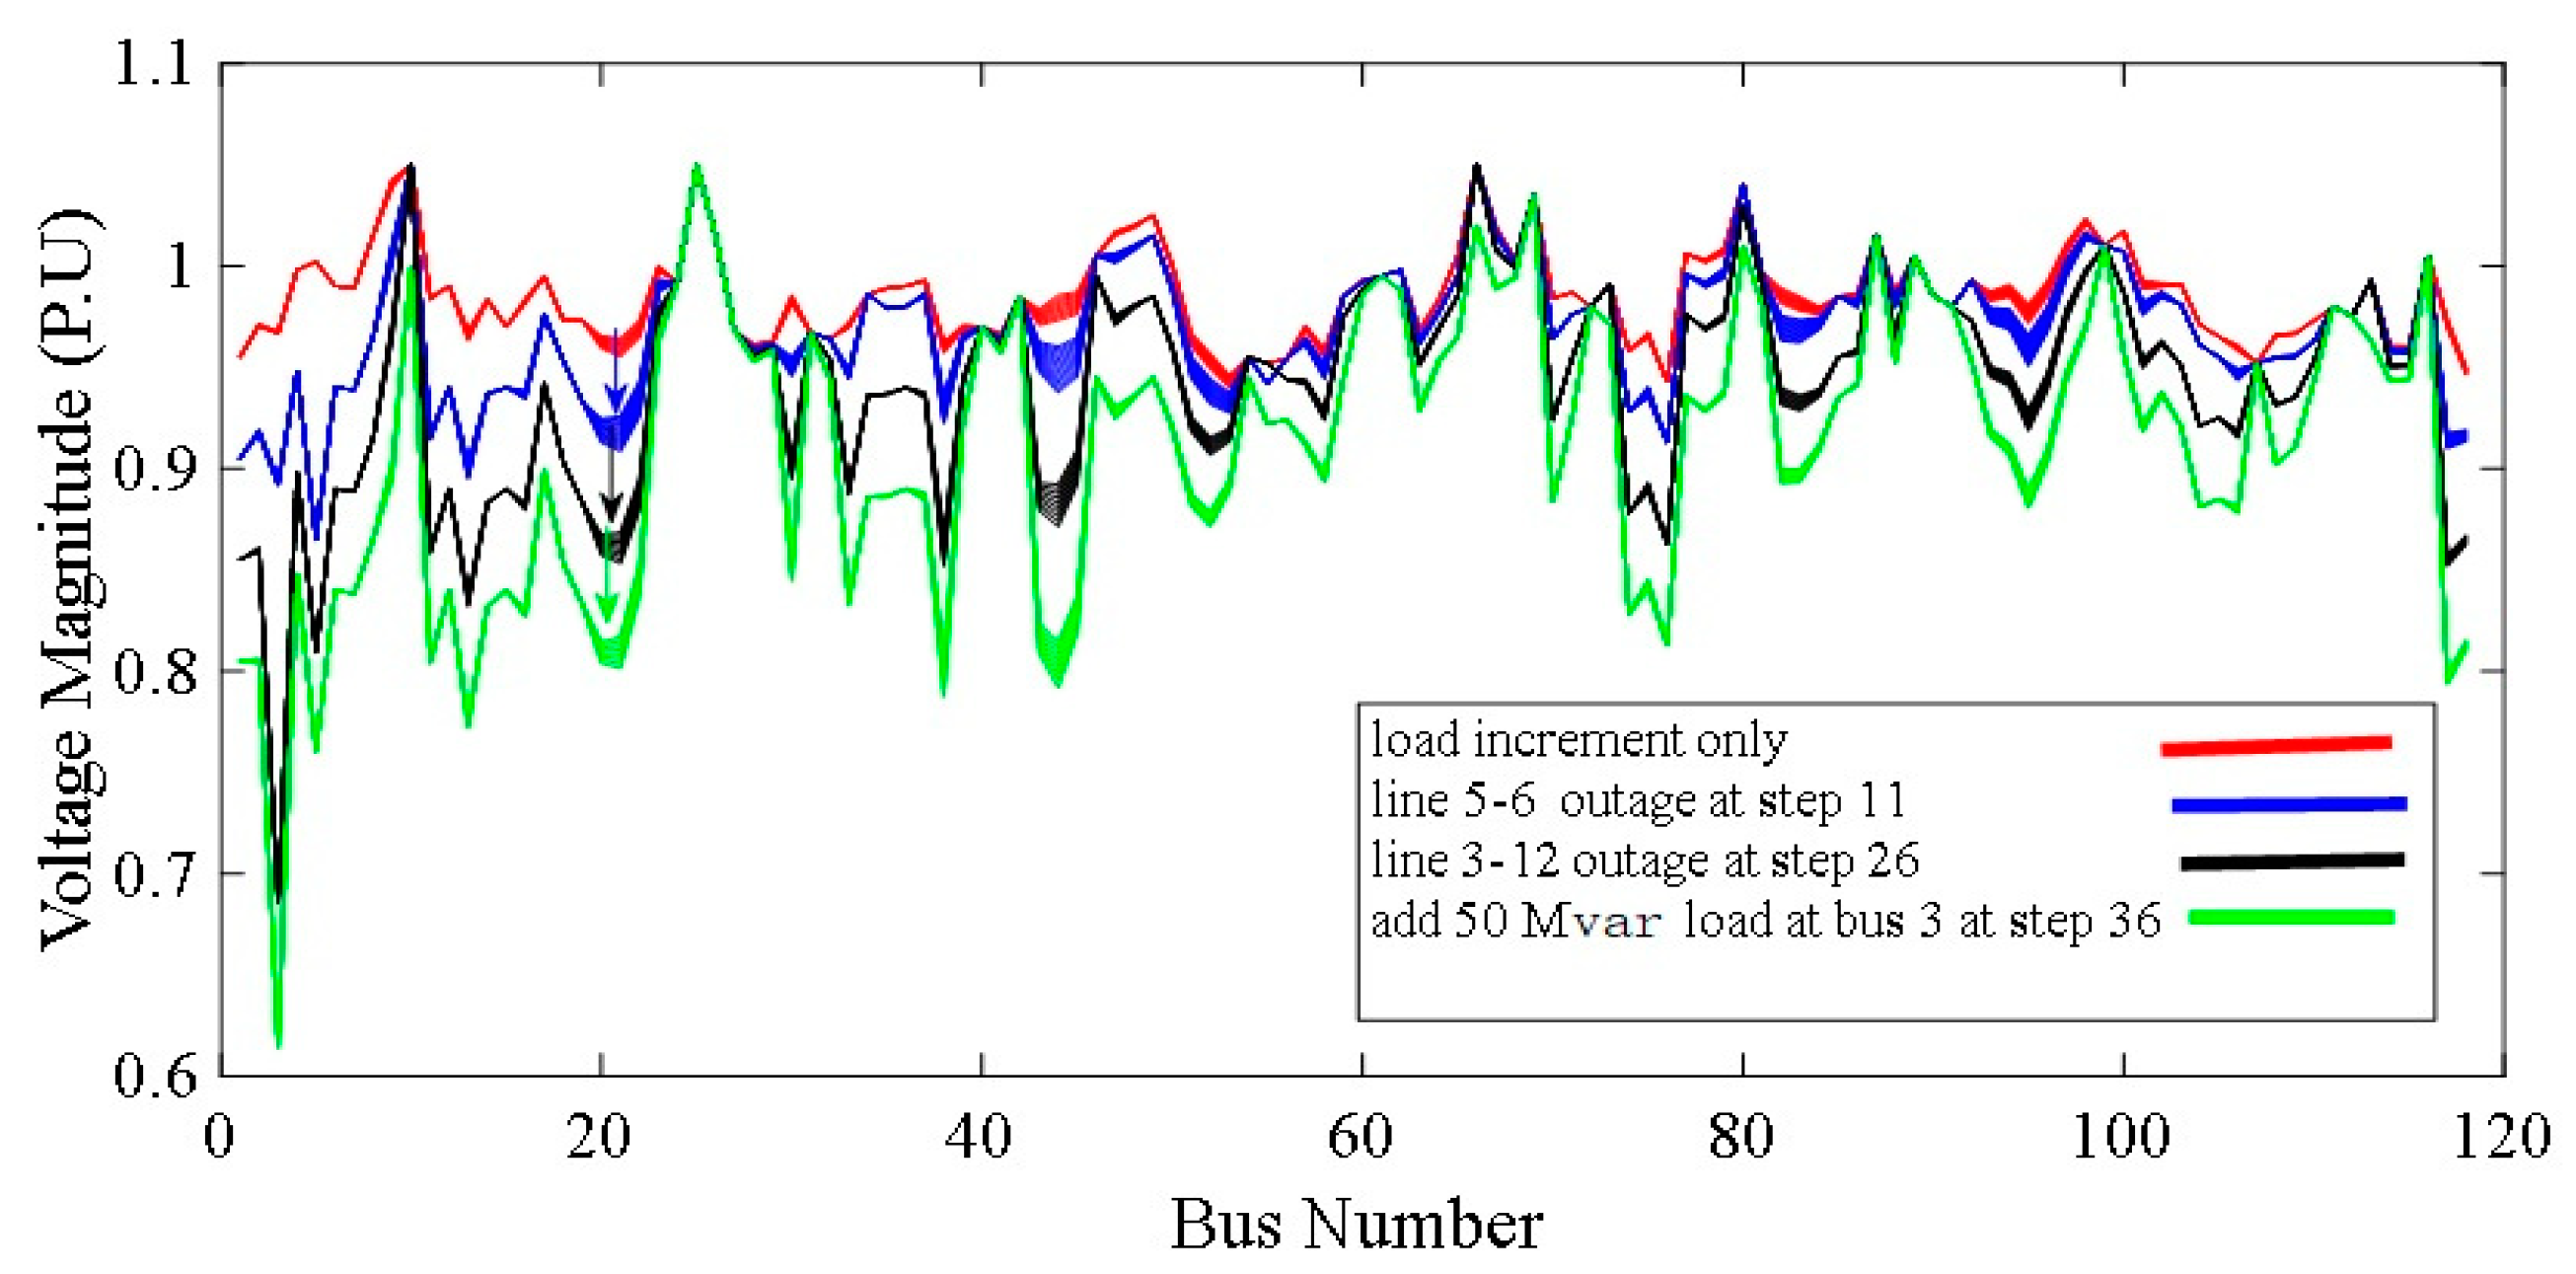
Figure 19 and Figure 20 show the gaps between the three voltage phase angles and amplitude profiles, respectively, that occurred due to the mentioned triple cascading events. This resulted in the semi-blackout simulation for the 118-bus test system. A blackout is a total loss of power in an area and the most severe form of power outage that can occur. Failure of PV bus operation during a blackout is related to the field current limitations and occurs in order to control reactive power. The boundary of the PV bus operation based on the angle correction of the load power factors is a maximum of 90° in terms of any blackout phenomena. This means that the PV buses reduce the voltage magnitude of the generator terminal to keep operation between the defined Qmin and Qmax. Consequently, the generator reactive power limit is a key factor in voltage instability.
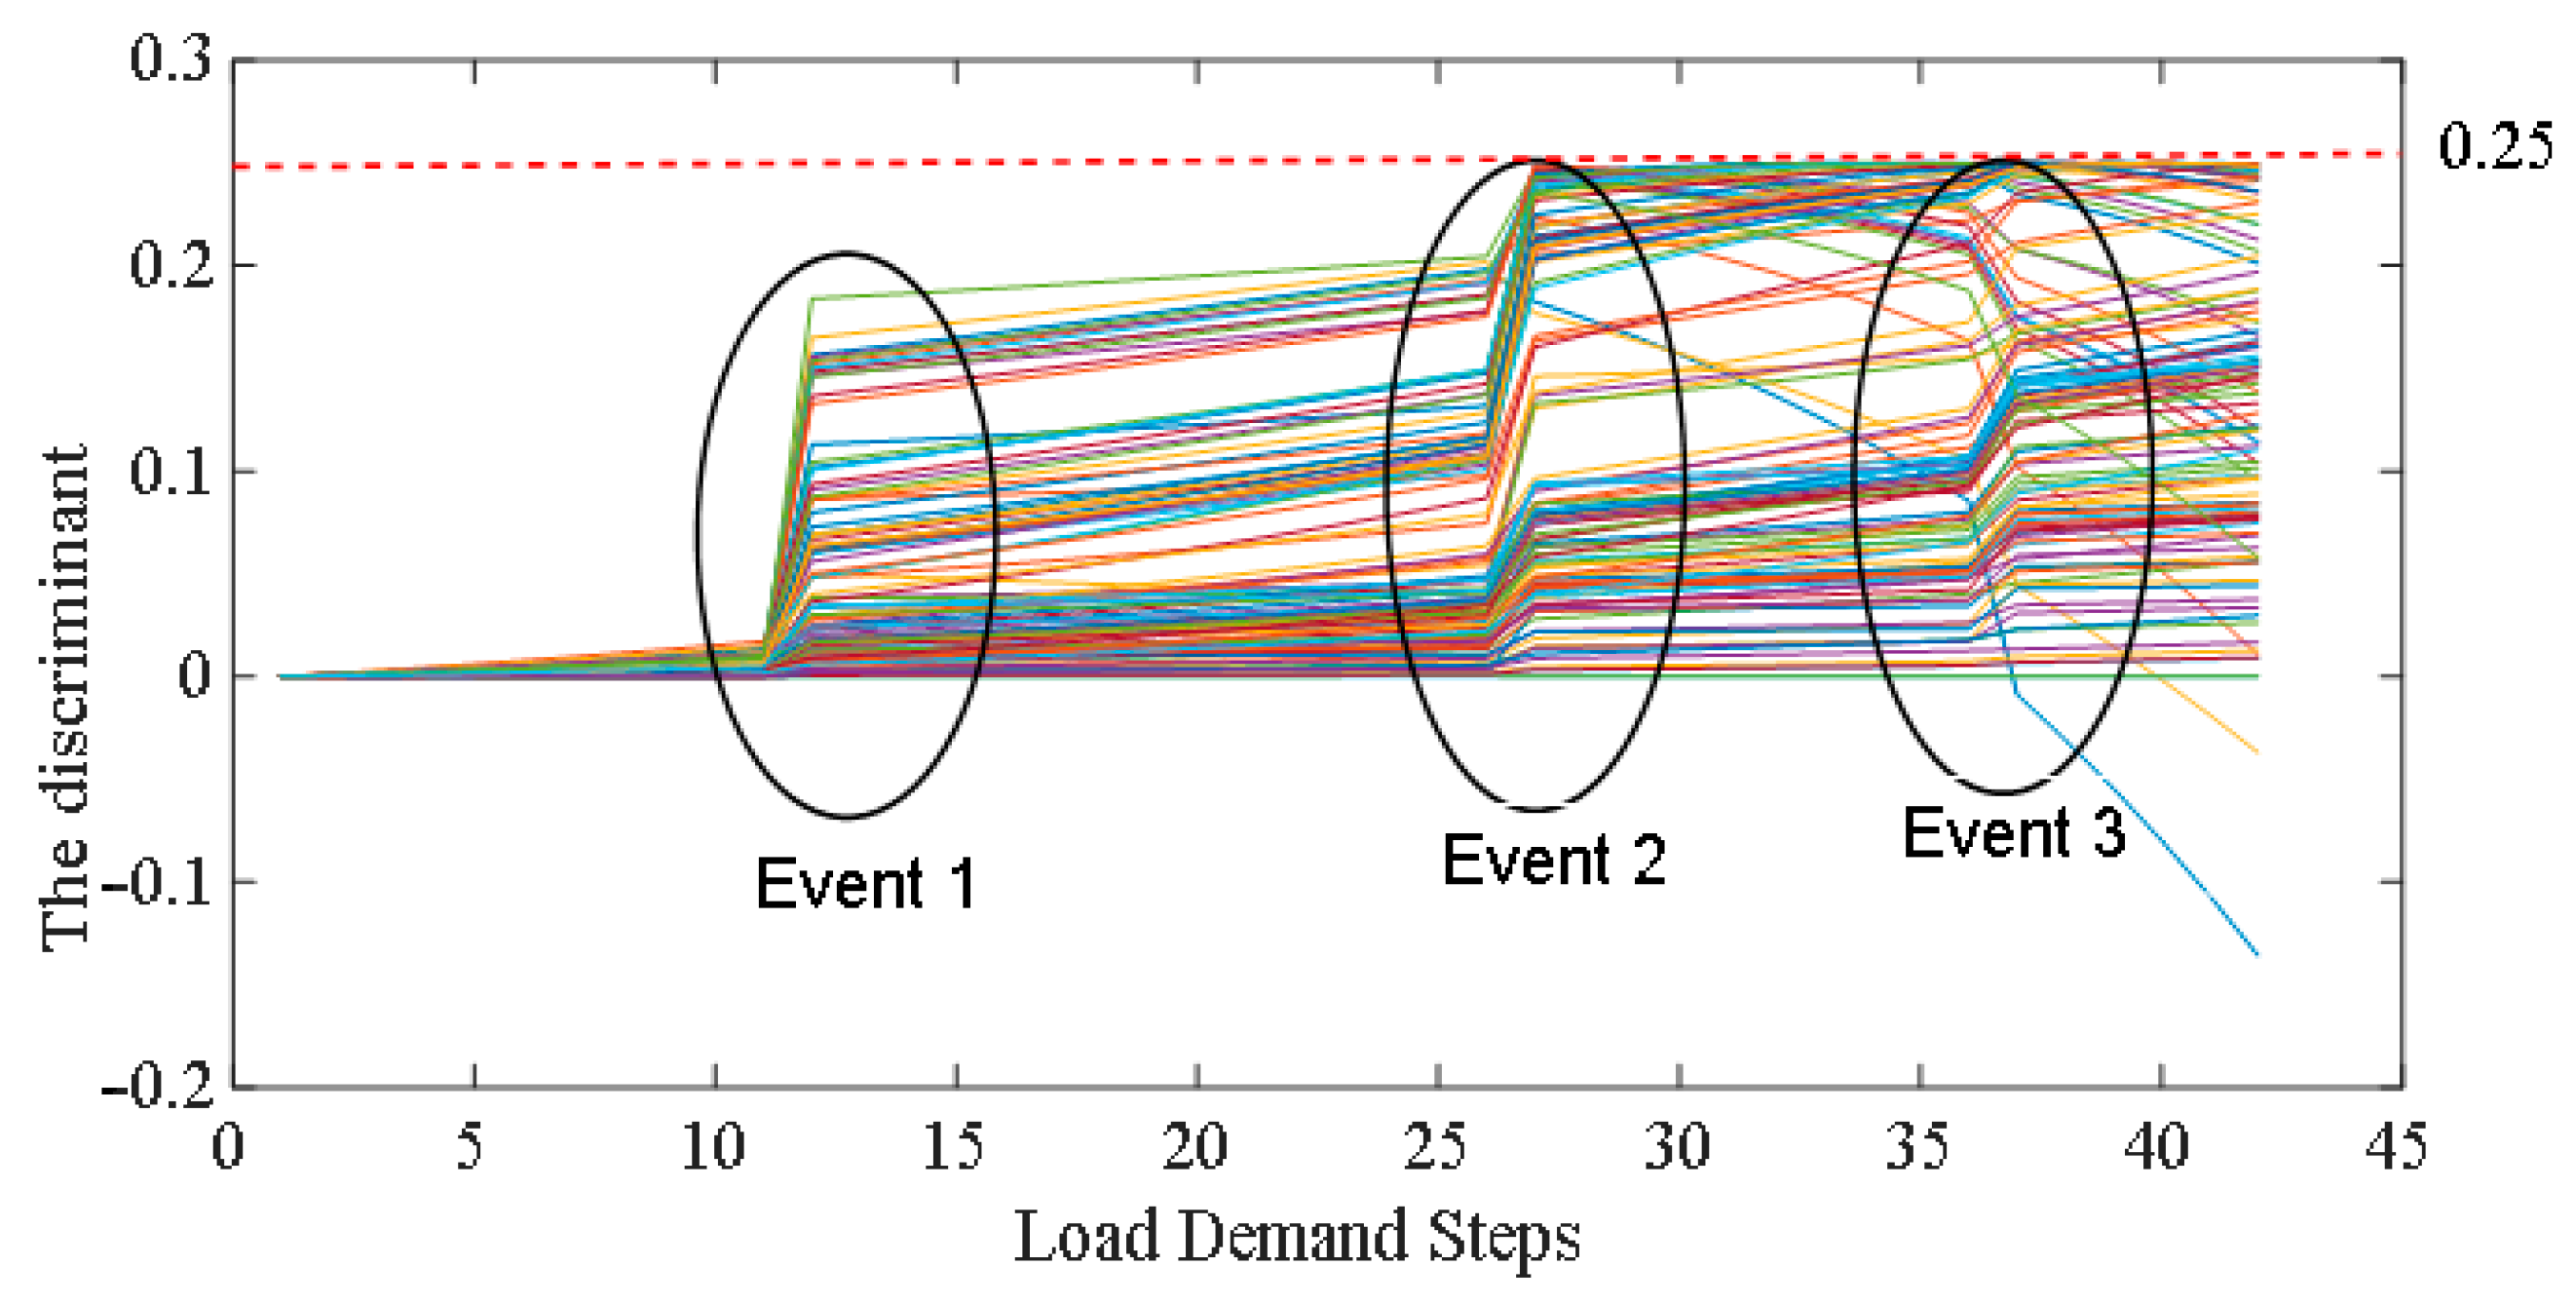
From Figure 21 and Figure 22, it can be seen that the response of the ED index involves three events relating to the load demand steps and bus numbers of the IEEE 118-bus test system, respectively.
  • For the first event, the variation in the ED index from step 11 to step 12 due to the outage of lines 5–6 showed that the maximum value for bus 5 was 0.5648. Thus, bus 5 was the weakest node, which was also confirmed by the discriminant of the quadratic form of the local load flow solution shown in Equation (38), as the auxiliary index had a maximum value of 1.839 for bus 5, as also indicated for all buses in Figure 23. The maximum value of 1.839 for bus 5 is also indicated for all buses in Figure 24.
  • The second event at step 26 of the load demand occurred due to the outage of lines 3–12. This event pushed the number for bus three above 1.4142 as the ED index safe-side stability line. This means that, before the third event, bus three with a value of 1.4375 started to collapse. The reduction shown in Equation (38) for bus three during the second event also demonstrated the local voltage collapse. Indeed, the power factor angle of bus three as a load bus during the second event was reduced sharply from −56.730 to −89.300 at the local vicinity of the unstable point. The values for the ED index for buses 1, 2 and 117 also passed over the stability zone on the side of bus 3. Moreover, the mentioned bus voltage phase angle operated in the unstable zone due to it approaching a value higher than 90°. Furthermore, the local voltage collapse indicated by the convergence of the load flow solution at the local maximum loading point for the quadratic form can be clearly seen in the example for bus one in Figure 24.
  • This case study indicated that voltage stability damage can occur in a local power grid, and occasionally this can extent to the whole power grid. As a consequence, the voltage stability collapses across the entire power grid, as seen for the load demand at step 42 as a divergence of the load flow solution due to the Jacobian matrix singularity. Cascading events can also decrease the transmission capacity of a grid, which causes decreased substation voltage stability and even substation voltage collapse in heavy-load situations.

5. Conclusions

In this paper, for the steady-state stability estimation of a power system based on a voltage stability estimation phasor profile, a novel index consisting of the Euclidean distance (ED) was introduced for online purposes. The mentioned index defines a scale from 0 to 1.5 p.u. for the bus voltage amplitude ED corresponding to the grid behavior from the normal operation point to the voltage collapse point under different cascading scenarios. In addition, the bus with the weakest load with respect to any grid changes can be detected. Indeed, this index also enables the steady-state verification of voltage stability through the concepts of a synchronous generator and synchronous-based motors in terms of PV and PQ buses during any event. The IEEE 118-bus test system was utilized to verify the ED index in two scenarios including three cascading events—load demand, line outage and reactive power compensation—simultaneously.

Author Contributions

Conceptualization, A.S. and M.R.A.; methodology, A.P. and A.S.; software, A.P.; validation, A.S., M.M. and M.R.A.; formal analysis, A.S.; investigation, M.R.A.; resources, M.K.; data curation, M.K.; writing—original draft preparation, A.S.; writing—review and editing, A.P., M.K. and K.K.; visualization, M.M.; supervision, M.K.; project administration, M.R.A.; funding acquisition, K.K. All authors have read and agreed to the published version of the manuscript.

Funding

This research was supported by the REDISET project with financial support provided by Business Finland as part of grant no. 27081089141/REDISET/WP/2704800.

Data Availability Statement

No new data were created or analyzed in this study. Data sharing is not applicable to this article.

Conflicts of Interest

The authors declare no conflict of interest.

References

  1. Kundur, P.; Paserba, J.; Ajjarapu, V.; Andersson, G.; Bose, A.; Canizares, C.; Hatziargyriou, N.; Hill, D.; Stankovic, A.; Taylor, C.; et al. Definition and classification of power system stability IEEE/CIGRE joint task force on stability terms and definitions. IEEE Trans. Power Syst. 2004, 19, 1387–1401. [Google Scholar] [CrossRef]
  2. Xi, K.; Dubbeldam, J.L.A.; Lin, H.X. Synchronization of cyclic power grids: Equilibria and stability of the synchronous state. Chaos: Interdiscip. J. Nonlinear Sci. 2017, 27, 013109. [Google Scholar] [CrossRef] [Green Version]
  3. Nishikawa, T.; Molnar, F.; Motter, A.E. Stability landscape of power-grid synchronization. IFAC-PapersOnLine 2015, 48, 1–6. [Google Scholar] [CrossRef]
  4. Manik, D.; Rohden, M.; Ronellenfitsch, H.; Zhang, X.; Hallerberg, S.; Witthaut, D.; Timme, M. Network susceptibilities: Theory and applications. Phys. Rev. E 2017, 95, 012319. [Google Scholar] [CrossRef] [Green Version]
  5. Grigsby, L.L. Power System Stability and Control; CRC Press: Boca Raton, FL, USA, 2007. [Google Scholar]
  6. Van Cutsem, T. Voltage instability: Phenomena, countermeasures, and analysis methods. Proc. IEEE 2000, 88, 208–227. [Google Scholar] [CrossRef] [Green Version]
  7. Tang, Y. Voltage Stability Analysis of Power System; Springer: Berlin/Heidelberg, Germany, 2021. [Google Scholar]
  8. Bosetti, H.; Khan, S. Transient stability in oscillating multi-machine systems using Lyapunov vectors. IEEE Trans. Power Syst. 2017, 33, 2078–2086. [Google Scholar] [CrossRef]
  9. Yusof, N.A.; Mohd Rosli, H.; Mokhlis, H.; Karimi, M.; Selvaraj, J.; Sapari, N.M. A new under-voltage load shedding scheme for islanded distribution system based on voltage stability indices. IEEJ Trans. Electr. Electron. Eng. 2017, 12, 665–675. [Google Scholar] [CrossRef]
  10. Morison, G.K.; Gao, B.; Kundur, P. Voltage stability analysis using static and dynamic approaches. IEEE Trans. Power Syst. 1993, 8, 1159–1171. [Google Scholar] [CrossRef]
  11. Nimje, A.A.; Sawarkar, P.R.; Kumbhare, P.P. Voltage Stability Analysis for Planning and Operation of Power System. In Silicon Photonics & High Performance Computing; Springer: Berlin/Heidelberg, Germany, 2018; pp. 17–25. [Google Scholar]
  12. Cui, B.; Sun, X.A. A new voltage stability-constrained optimal power-flow model: Sufficient condition, SOCP representation, and relaxation. IEEE Trans. Power Syst. 2018, 33, 5092–5102. [Google Scholar] [CrossRef] [Green Version]
  13. Ghiocel, S.G.; Chow, J.H. A power flow method using a new bus type for computing steady-state voltage stability margins. IEEE Trans. Power Syst. 2013, 29, 958–965. [Google Scholar] [CrossRef]
  14. Biswas, S.S.; Srivastava, A.K. Voltage Stability Monitoring in Power Systems. U.S. Patent 9876352, 23 January 2018. [Google Scholar]
  15. Abe, S.; Hamada, N.; Isono, A.; Okuda, K. Load Flow Convergence in the Vicinity of a Voltage Stability Limit. IEEE Trans. Power Appar. Syst. 1978, PAS-97, 1983–1993. [Google Scholar] [CrossRef]
  16. IEEE. Recommended Practice for Industrial and Commercial Power Systems Analysis; IEEE Brown Book; IEEE: New York, NY, USA, 1997. [Google Scholar]
  17. Overbye, T.J. A power flow measure for unsolvable cases. IEEE Trans. Power Syst. 1994, 9, 1359–1365. [Google Scholar] [CrossRef] [Green Version]
  18. Sauer, P.W.; Pai, M.A. Power system steady-state stability and the load-flow Jacobian. IEEE Trans. Power Syst. 1990, 5, 1374–1383. [Google Scholar] [CrossRef]
  19. Smon, I.; Verbic, G.; Gubina, F. Local voltage-stability index using tellegen’s Theorem. IEEE Trans. Power Syst. 2006, 21, 1267–1275. [Google Scholar] [CrossRef]
  20. Muppidi, R.; Nuvvula, R.S.; Muyeen, S.; Shezan, S.A.; Ishraque, M.F. Optimization of a Fuel Cost and Enrichment of Line Loadability for a Transmission System by Using Rapid Voltage Stability Index and Grey Wolf Algorithm Technique. Sustainability 2022, 14, 4347. [Google Scholar] [CrossRef]
  21. Jia, H.; Hou, Q.; Yong, P.; Liu, Y.; Zhang, N.; Liu, D.; Hou, M. Voltage Stability Constrained Operation Optimization: An Ensemble Sparse Oblique Regression Tree Method. IEEE Trans. Power Syst. 2023. [CrossRef]
  22. Khurram, A.; Gusnanto, A.; Aristidou, P. A feature-subspace-based ensemble method for estimating long-term voltage stability margins. Electr. Power Syst. Res. 2022, 212, 108481. [Google Scholar] [CrossRef]
  23. Mokred, S.; Wang, Y.; Chen, T. Modern voltage stability index for prediction of voltage collapse and estimation of maximum load-ability for weak buses and critical lines identification. Int. J. Electr. Power Energy Syst. 2023, 145, 108596. [Google Scholar] [CrossRef]
  24. Fonseca, A.; Salazar, G.; Quilumba, F.; Pérez-Yauli, F. Determination of the Thevenin equivalent in power grids using real records based on short circuit power. IET Gener. Transm. Distrib. 2021, 15, 13–23. [Google Scholar] [CrossRef]
  25. Wang, X.; Bialek, J.W.; Turitsyn, K. PMU-Based Estimation of Dynamic State Jacobian Matrix and Dynamic System State Matrix in Ambient Conditions. IEEE Trans. Power Syst. 2018, 33, 681–690. [Google Scholar] [CrossRef] [Green Version]
  26. Rajagopalan, C.; Lesieutre, B.; Sauer, P.; Pai, M. Dynamic aspects of voltage/power characteristics (multimachine power systems). IEEE Trans. Power Syst. 1992, 7, 990–1000. [Google Scholar] [CrossRef]
  27. Berizzi, A.; Bosisio, A.; Simone, R.; Vicario, A.; Giannuzzi, G.; Pisani, C.; Zaottini, R. Real-time identification of electromechanical oscillations through dynamic mode decomposition. IET Gener. Transm. Distrib. 2020, 14, 3992–3999. [Google Scholar] [CrossRef]
  28. Hu, Z.; Wang, X. Efficient computation of maximum loading point by load flow method with optimal multiplier. Power Syst. IEEE Trans. 2008, 23, 804–806. [Google Scholar] [CrossRef]
  29. Makarov, Y.V.; Hiskens, I.A.; Hill, D.J. Study of multisolution quadratic load flow problems and applied newton-raphson like methods. In Proceedings of the ISCAS’95—International Symposium on Circuits and Systems, Seattle, WA, USA, 30 April–3 May 1995; pp. 1508–1511. [Google Scholar]
  30. Mohamed, A.; Jasmon, G. A new clustering technique for power system voltage stability analysis. Electr. Mach. Power Syst. 1995, 23, 389–403. [Google Scholar] [CrossRef]
Figure 1. The single power network diagram including a PV.
Energies 16 02508 g001
Figure 2. The phasor diagrams for the performance of PV buses with respect to different network-load demand-type resistances and capacitor reactance.
Energies 16 02508 g002
Figure 3. The terminal voltage and injected reactive power of the PV bus with respect to network demand.
Energies 16 02508 g003
Figure 4. The PV bus capability curve.
Energies 16 02508 g004
Figure 5. The operation zone of the PV bus capability curve.
Energies 16 02508 g005
Figure 6. The slack bus performance versus network changes.
Energies 16 02508 g006
Figure 7. A typical bus in a power system network.
Energies 16 02508 g007
Figure 8. The equivalent Thévenin and Norton circuit models for the typical bus shown in Figure 7.
Energies 16 02508 g008
Figure 9. The equivalent Thévenin circuit model of a power network.
Energies 16 02508 g009
Figure 10. The simple mechanical system analogous to the power network.
Energies 16 02508 g010
Figure 11. Online voltage stability procedure using ED.
Energies 16 02508 g011
Figure 12. A single-line diagram of the IEEE 118-bus test system.
Energies 16 02508 g012
Figure 13. The sparsity form of the Jacobian matrix at a load level of 2.75.
Energies 16 02508 g013
Figure 14. Solid mesh geometry of sparse Jacobian at load level of 2.75.
Energies 16 02508 g014
Figure 15. Solid mesh geometry of sparse Jacobian at load level of 2.775.
Energies 16 02508 g015
Figure 16. The voltage amplitude profile in terms of the load demand increment in the MLP with the IEEE 118-bus test system.
Energies 16 02508 g016
Figure 17. The voltage phasor profile in terms of the load demand increment in the MLP with the IEEE 118-bus test system.
Energies 16 02508 g017
Figure 18. The ED index profiles in terms of the load demand increment in the MLP with the IEEE 118-bus test system.
Energies 16 02508 g018
Figure 19. Phase angle of the voltage profile during the events leading to the voltage collapse point for the IEEE 118-bus test system.
Energies 16 02508 g019
Figure 20. The amplitude of the voltage profile in the events leading to the voltage collapse point for the IEEE 118-bus test system.
Energies 16 02508 g020
Figure 21. The response of the ED index for the case including three events related to the load demand steps for the IEEE 118-bus test system.
Energies 16 02508 g021
Figure 22. The response of the ED index for the case including three events related to the bus number for the IEEE 118-bus test system.
Energies 16 02508 g022
Figure 23. The response determined by Equation (38) for the case including three events related to the load demand steps for the IEEE 118-bus test system.
Energies 16 02508 g023
Figure 24. The voltage magnitude for bus one using the quadratic form in terms of the load demand.
Energies 16 02508 g024
Table 1. Testing scenarios.
ScenariosEvent 1Event 2Event 3
First caseLoad increment—11 stepsLoad increment—26 stepsLoad increment—36 steps
Second caseOutage 5–6Outage 3–12Q = −50 at bus 30
Table 2. The determinant and condition number of the Jacobian matrix at loadings of 2.75 and 2.775.
Loading Demand StepJacobian Matrix DeterminantCondition NumberStability Condition
2.775 (72)−6.0727e + 3021.8446e + 007Beyond the MLP
2.75 (71)2.4317e + 2516.9519e + 003Boundary of the MLP
1 (1)4.0224e + 2623.1723e + 003Original condition
Disclaimer/Publisher’s Note: The statements, opinions and data contained in all publications are solely those of the individual author(s) and contributor(s) and not of MDPI and/or the editor(s). MDPI and/or the editor(s) disclaim responsibility for any injury to people or property resulting from any ideas, methods, instructions or products referred to in the content.