Abstract
Since carbonate reservoirs develop pores and fractures and have a complex formation pressure system, overflow and even blowout seriously threaten the exploration and development of these kinds of reservoirs. According to the overflow characteristics of fractured-vuggy carbonate reservoirs, a field monitoring and identification method for overflow has been developed. This method is based on the top-down logic framework for early overflow identification, combined with optimized monitoring parameters. The DBSCAN clustering algorithm is used to identify abnormal logging parameters, and thus, a probability weight coefficient of overflow (K) indicated by the abnormal engineering parameters of a gas well can be calculated. K is divided into four early warning response levels of overflow, and the overflow control operation can be made according to the different levels of early warning response. Based on this method, an integrated software system for field monitoring and identification of early overflow is designed. This software system integrates the functions of data collection and management, overflow risk parameter calculation, overflow early warning, and overflow simulation analysis. Finally, according to a case analysis of overflow prediction for a fractured-vuggy carbonate reservoir in Well XX, this method’s prediction stability and accuracy are demonstrated, indicating that it can be used for the overflow early warning in engineering practice.
1. Introduction
A blowout is the most severe drilling accident in oil and gas drilling engineering [1]. Overflow is the precursor to a blowout. If overflow is monitored and identified timely and accurately, it can not only avoid a blowout but also reduce the damage to underground oil and gas reservoirs during well-kill operations [2]. Specifically, carbonate reservoirs usually have a complex pressure system [3] and low rock strength, which can lead to a high collapse pressure [4]. Thus, a narrow safe mud density window would be for the wells in the carbonate reservoir. In this case, overflow often occurs in this kind of reservoir during the drilling process [5], which seriously restricts the exploration and development of oil and gas resources in a carbonate reservoir. Therefore, it is of great practical significance to develop a timely and reliable overflow monitoring and identification method to achieve safe, efficient, and economical drilling operations for carbonate reservoirs with narrow safe mud density windows [6].
A good theoretical method can predict overflow occurring in the stratum [7]. Yang et al. [8] developed a new two-phase flow model using the pressure while drilling (PWD) to evaluate overflow. Fu et al. [9] proposed a kick detection system at mud lines in deep water drilling. Yin et al. [10] developed a Doppler ultrasonic flow measurement system based on the Doppler principle. However, the change in mud density and gas overflow will affect the measurement accuracy of these methods. Li et al. [11] proposed an early gas cut detection method based on the propagation characteristics of the measurement-while-drilling pressure wave and developed an unsteady state mathematical model for early gas-kick detection, but it has a low predictive effect if the temperature is low. Sai et al. [12] and Mao et al. [13] believed that real-time drilling data should be analyzed to detect overflow events as early as possible. With the improvement of computing equipment, some scholars have introduced the intelligent algorithms of neural networks [14,15,16,17] and Bayes [18,19,20,21] for overflow identification. However, both the intelligent algorithms of neural networks and Bayes have a common limitation, which is that a lot of training, testing, and early-warning network building at different overflow levels should be completed before using these two methods. In general, there have been some theoretical methods for predicting overflow until now. However, the accuracy and reliability of these methods are limited by the deficiencies of their theoretical basis for development, resulting in the fact that none of them can be used for overflow evaluation of fractured-vuggy carbonate reservoir.
The field monitoring and identification of overflow mainly depend on the downhole or well site monitoring equipment. Due to that, the Coriolis mass flowmeter can determine accurate, high-precision direct mass flow measurement and has many advantages such as wear resistance, corrosion resistance, and the ability to measure multiple media and parameters. Many scholars [22,23,24] proposed combining the Coriolis mass flowmeter and logging technology to form an early overflow detection system. Yet, it is sensitive to external vibration interference, and the instability of the zero point is also a significant defect. With the development of downhole measurement while drilling, the speed and bandwidth between downhole data and surface transmission are increasing. So various early monitoring methods for gas cut evaluation based on downhole measurement while drilling have been developed [25]. In addition, according to the fact that the invasion of formation fluid into the wellbore will lead to changes in the composition of drilling fluid (mud) in the bottom annulus and the measured data of Logging While Drilling (LWD), some scholars have proposed to use LWD tools to monitor the changes in logging parameters while drilling for overflow prediction, such as resistivity and natural gamma [26,27]. This method should be combined with the changes in bottom annulus pressure, equivalent mud density, and temperature measured by annular parameter monitoring tools while drilling [28,29]. However, due to the limitations of sensor types, accuracy, reliability, mechanical and environmental noise, physical matching degree, data models with actual drilling conditions, and degree of software intelligence, it is still a challenge to use them to monitor the early overflow during drilling in complex formations, such as the carbonate reservoir with a narrow safe mud density window.
As mentioned above, although many overflow evaluation theories and monitoring techniques have been developed, these techniques and methods have poor adaptability to the overflow monitoring and identification of the carbonate reservoir with a narrow safe mud density window. Therefore, based on the in-depth analysis of the overflow characteristics of the carbonate reservoir with a narrow safe mud density window, a method of micro-overflow field monitoring and identification is developed for this kind of formation. This method, which can predict the overflow in the wellbore annular a couple of hours ahead, can provide technical support for overflow prevention and control of the carbonate reservoir with a narrow safe mud density window.
2. Characteristics of Overflow in Carbonate Reservoir and Its Challenge in Evaluation
2.1. Characteristics of Overflow in Carbonate Reservoir
The carbonate reservoir often develops pores, fractures, and vugs, resulting in a complex formation pressure system. During the drilling process, multiple types of gas often exist simultaneously or transform into each other. The comprehensive performance of gas cuts is exceptionally complex, generally showing the following three characteristics.
- (1)
- The formation pressure is sensitive. Due to the development of fractures in the carbonate reservoir, seepage resistance is very small, resulting in almost no safe mud density window and only a very narrow gravity replacement interval. Thus, gravity displacement overflow will occur (Figure 1). The actual drilling shows that a little increase in bottom-hole pressure (BHP) in the carbonate reservoir will cause lost circulation, and a little decrease in BHP will result in a gas cut, forming the typical characteristics of reservoir pressure sensitivity.
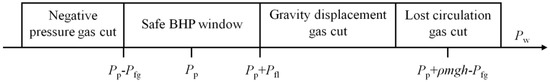 Figure 1. Number axes of gas cut, safe pressure window, gravity displacement and lost circulation at different bottom hole pressure (BHP) in a carbonate reservoir. Pfl is the drilling fluid (mud) pressure for overcoming resistance and pressure drop of drilling fluid flowing from the wellbore to formation, MPa; Pw is the BHP, MPa; Pp is the formation pressure, MPa; Pfg is the gas pressure for overcoming resistance and pressure drop of gas flowing from formation to the wellbore, MPa.
 - (2)
- The gas cut from the reservoir is varied. During the drilling process, direct and diffuse gas cuts are unavoidable, while the “rock burst” gas cut is relatively rare. Negative pressure, gravity displacement, and lost circulation gas cuts are the three main types of gas cut forms, as shown in Figure 1, and they transform each other with the change of the BHP. When the non-delicate managed pressure drilling technology is used to drill the fractured-vuggy carbonate reservoir with different formation pressures, the change law of bottomhole situations is shown in Figure 2.
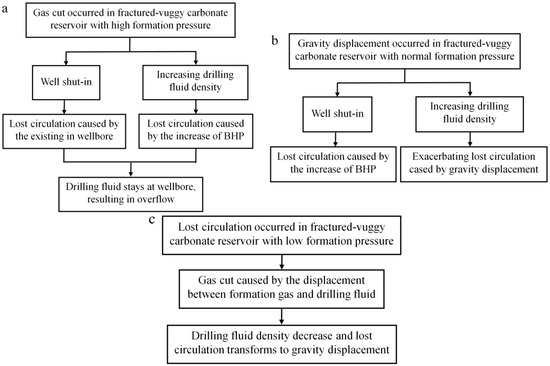 Figure 2. Complex bottomhole situations during drilling the fractured-vuggy carbonate reservoir with different formation pressures using non-delicate managed pressure drilling technology: (a) Fractured-vuggy carbonate reservoir with high formation pressure; (b) Fractured-vuggy carbonate reservoir with normal formation pressure; (c) Fractured-vuggy carbonate reservoir with low formation pressure.
 - (3)
- The downhole situation is difficult to evaluate. Due to the existence of multiple pressure systems and their irregular distribution in the fractured-vuggy carbonate reservoir, the downhole environment is extremely complex, resulting in serious accidents. This includes lost circulation, overflow, and even the simultaneous occurrence of a blowout (overflow) and lost circulation, and it is difficult to evaluate when these accidents occur. Due to the mutual influence of overflow and lost circulation, both are concealed, and the site engineers cannot accurately identify them, which would mislead the accident treatment, resulting in the blowout-lost circulation coexistence accident treatment being more difficult. This would seriously delay the construction period of the well and even cause significant economic losses and safety accidents. The inlet and outlet flow rates of the wellbore after the gas cut conform to the material conservation theorem, and the physical model is shown in Figure 3.
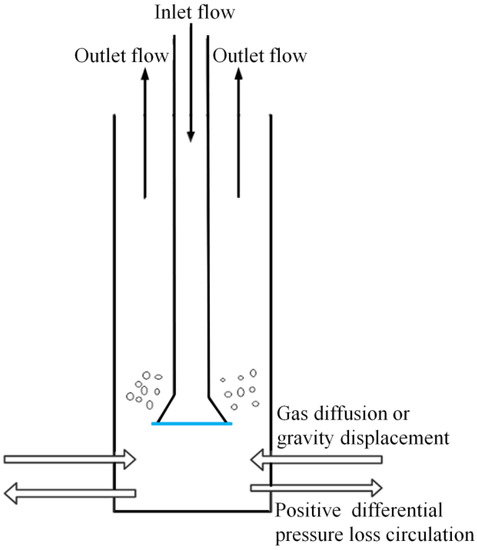 Figure 3. Schematic diagram of wellbore physical model when a gas cut occurs.
2.2. Challenges of Overflow Evaluation in Carbonate Reservoir
The primary pores of the carbonate reservoir are small, and the secondary pores of the carbonate reservoir are developed, showing pronounced heterogeneity and anisotropy. The reservoir space of the carbonate reservoir is mainly composed of natural fractures, karst caves (vugs) developed by dissolution, and pores formed by diagenesis. These reservoir spaces are of different sizes, shapes, and distributions, among which karst caves are the leading oil and gas storage spaces and network distribution fractures are the main flow channels. However, the bedrock is relatively compact and does not have permeability [30]. The unique formation environment, the heterogeneity of the spatial distribution of reservoir spaces, and the complexity of the reservoir structure make the formation pressure present a complicated distribution state, resulting in a narrow safe mud density window in the carbonate reservoir, which would be prone to overflow, blowout, collapse, drill pipe sticking, and other complicated drilling situations.
Due to the complex situations mentioned above, it is very difficult to monitor and evaluate the early overflow in the carbonate reservoir. Currently, the monitoring timeliness and accuracy of early overflow in carbonate reservoirs are still deficient in China. Furthermore, the detection cost is high, and the downhole tools are immature. The main difficulties for monitoring and evaluating the early overflow in the carbonate reservoir are as follows: (1) Overflow and lost circulation coexist, and lost circulation transforms into overflow very fast; (2) A narrow safe mud density window mainly exists in the case of a deep well with a small size and high formation temperature and pressure. For this type of formation, even in the case of a slight gas cut, gas will rapidly migrate to the wellhead and swell as a large volume of gas, resulting in huge security risks to the drilling operation. So far, the domestic overflow monitoring method is mainly based on comprehensive logging measurements. Therefore, the reliability of the overflow monitoring is highly dependent on the accuracy of the parameters for comprehensive logging measurement. However, the reliability of the comprehensive logging results would be greatly reduced for the deep well in the complex carbonate reservoir with a narrow safe mud density window, causing low reliability of the overflow monitoring results in this kind of formation.
3. Comprehensive Identification Method of Overflow
3.1. Monitoring Parameters Optimization
Through sorting and analyzing 87 overflow data for 64 wells in Northwest Oilfield in the past five years, we found that overflow mainly occurs during the drilling process in the carbonate reservoir, and the parameters of outlet flow, total mud pool volume, and total hydrocarbon rate will change significantly when an overflow happens. The changes in these parameters are defined as parameter abnormal changes. Moreover, the ratio of the number of abnormal changes to the number of overflows is defined as the abnormal probability corresponding to the specific parameter. The abnormal probabilities of the field parameters are shown in Table 1, indicating that the abnormal probability of fluid column pressure is close to 40%, the abnormal probabilities of drilling time, outlet density, and outlet conductance are about 30%, and the abnormal probabilities of other parameters are low.

Table 1.
Statistics of changes in various parameters during the overflow period.
Based on the analysis of the influencing factors during the overflow development process and the statistics presented in Table 1, ten parameters are selected as overflow sensitive parameters, including five fast response parameters and five delayed response parameters, as shown in Table 2.
Table 2.
Optimized overflow sensitive parameters.
3.2. Logic Framework for Early Overflow Identification
Based on the early overflow monitoring parameters of the carbonate reservoir, as mentioned in Section 3.1, a logic rule algorithm is developed to meet the actual needs of the drilling operation, which are described as follows:
- (1)
- First, according to the sensitive parameters, as shown in Table 1, a recursive logic framework from top to bottom is developed according to the response speed of each parameter, as shown in Table 2. The response order can be drawn as BHP change, with the fastest response from the top layer → bottom hole temperature change of the second level → standpipe pressure change → outlet flow change → drilling time change → hook load → total hydrocarbon rate change → outlet mud density change → outlet mud conductivity change. The individual parameters of the comprehensive logging instrument are easily distorted, which may lead to the termination of the logic calculation midway, causing a final error in the results. Therefore, a top-down criterion based on the reliability of each logging parameter, as shown in Table 2, should be added. The flow chart for early overflow identification is shown in Figure 4.
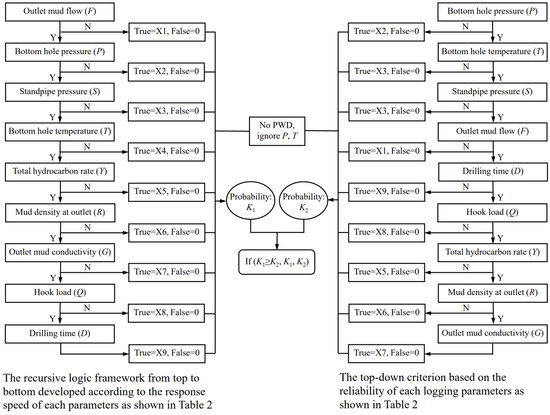 Figure 4. Flow chart of early overflow identification.
The abnormity of total mud volume in mud pools is not considered here because its abnormity can directly identify the occurrence of overflow.
- (2)
- In Figure 4, Tube = X1, X2, X3 ... X9 is the output probability value after the abnormal change of each parameter. Taking the standpipe pressure as an example, the identification of a parameter abnormality is briefly explained as follows: First, DBscan (Density-Based Spatial Clustering of Applications with Noise, a typical density based clustering algorithm) clustering is carried out for standpipe pressure logging curves. The data is divided into the following three categories:
Core points: there are more than MinPts points in the radius Eps.
Boundary points: the number of points within the radius Eps is less than MinPts, but it falls in the neighborhood of the core point.
Noise points: points that are neither core points nor boundary points.
After the noise points of the standpipe pressure curve are filtered, the linear least square method is used to fit four sections of opposite pressure curves every 120 s, and the slope of each fitted straight line segment is used to represent the slope Ni of the pressure curve of this section. A sensitive parameter S* is set for standpipe pressure. If the slope Ni is greater than the sensitive parameter S*, the abnormal standpipe pressure is determined, and the output probability X3 can be obtained.
- (3)
- For engineering practice, it is necessary to determine the weight coefficient of each parameter according to the field situation; thus, the important and key parameters can be taken as the necessary parameters to play a leading role in the multi-parameter identification. Therefore, the different severity descriptions of bottomhole accidents can be achieved by improving the proportion of corresponding parameters. For example, if the weight of standpipe pressure and hook load is appropriately increased in high pore pressure formation, the prediction accuracy will be improved with the change in standpipe pressure and hook load. Early warning at different levels reflects the overall trend of the event and the severity of abnormal changes, so that more reasonable measures can be taken for drilling operations and well control. As shown in Table 3, the parameter weights of different well types in different work areas are set. The weights are determined according to the number of parameters; taking the high-pressure gas well in carbonate rock as an example, nine parameters are set to identify overflow comprehensively, and the sum of the weight values is 9.
Table 3. Overflow parameters weight setting.
The probability can be obtained from the weight distribution of each parameter in Table 3, expressed as:
where, Xi is the probability of overflow related to the abnormality of parameter i; Yx is the overflow weight value of each parameter. The probability weight coefficient of overflow (K) is expressed as:
The overflow alarm is divided into four levels according to K, as shown in Table 4. Field operation procedures should be formulated according to the four levels so that the field staff can conduct well control treatment in time to prevent blowout accidents and ensure the safety of drilling operations.
Table 4.
Classification of overflow alarm by K.
3.3. Early Overflow Identification Software System
The early overflow identification software system includes the following modules, as shown in Figure 5: human-computer interaction, data management, real-time data collection, overflow warning, overflow risk parameter calculation, and overflow analysis simulation module.
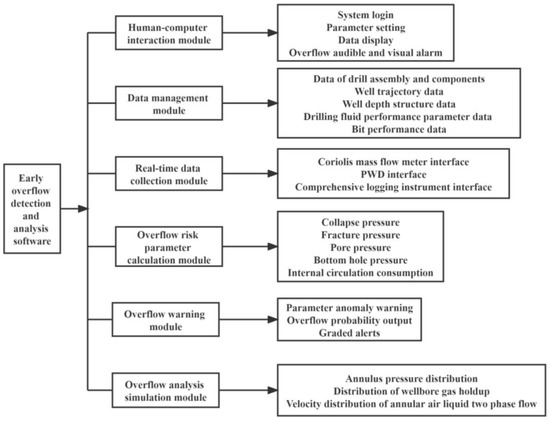
Figure 5.
Software design architecture.
The software workflow is shown in Figure 6, which can be described as follows:
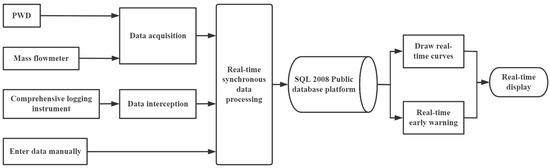
Figure 6.
Software workflow.
- (1)
- The basic information of the well is input, including the region, block, well number, wellbore structure data, bottom hole assembly (BHA) component data, BHA usage data, and drilling fluid performance parameter data. The information on the mass flowmeter, PWD, and comprehensive logging instrument should be collected and received in real-time and then be sent to the client through network communication. After receiving the data, the software decodes and converts the data format to obtain parameters, including vertical pipe pressure, casing pressure, hook load, well depth, conductivity, outlet flow, outlet temperature, outlet drilling fluid density, gas measurement value, and bit position, and these data can be processed synchronously in real-time.
- (2)
- All parameters are uploaded synchronously to the SQL2008 data public platform.
- (3)
- The monitoring parameter curve is drawn in real-time after noise abatement.
- (4)
- The abnormal change of each parameter is analyzed. The overflow probability value is then output and is divided into four levels for warning.
- (5)
- The post-processing overflow simulation analysis can complete the evaluation of the overflow trend and degree.
- (6)
- The result is displayed in the human-computer interaction interface.
4. Evaluation of the Proposed Identification Method of Overflow
4.1. A Case Study for Evaluating Overflow of Carbonate Reservoir
A carbonate gas reservoir is used to demonstrate the accuracy of the proposed method. The physical properties of this reservoir are generally characterized by low porosity and low permeability and locally developed high porosity and permeability. The structure, lithofacies, lithology, and physical properties of the reservoir have vertical and horizontal heterogeneity. The distribution characteristics of porous and permeable points indicate that there are dual seepage media in the reservoir and that it is a fracture pore (vug) type reservoir, as shown in Figure 7. Furthermore, this reservoir has high heterogeneity characteristics in porosity and permeability, and the relationship between porosity and permeability is poor (Figure 7). Thus, although this carbonate gas reservoir develops local holes (vugs), its permeability is poor due to the high heterogeneity and low connectivity of the reservoir spaces. In this case, the pressure coefficient of the reservoir is complex, resulting in complicated bottom-hole accidents. The complicated bottom-hole accidents in this carbonate gas reservoir, such as overflow, and lost circulation, frequently occurred in this carbonate gas reservoir for many wells.
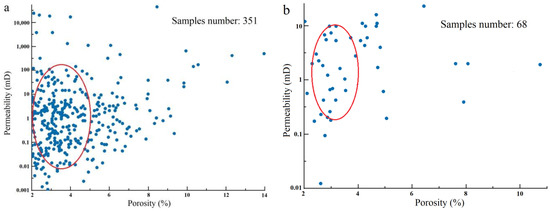
Figure 7.
Relationship between permeability and porosity: (a) standard sample with size of ϕ25.4 mm × 50.8 mm; (b) full diameter core with a size of 120 mm. The red ellipses indicate the most concentrated data of the samples.
Based on the method mentioned in Section 3, the following procedure is completed for Well XX in this carbonate gas reservoir to demonstrate the performance of the proposed identification method of overflow. First, the primary data, including wellbore structure, drilling tool assembly, drilling tool assembly usage, and drilling fluid properties data of the well, were input into the data management module. Thereafter, the real-time collected data were managed, including the real-time data of the surface choke manifold, the real-time data of the comprehensive logging instrument, and the real-time calculation and correction data of the bottom-hole pressure. Thirdly, the real-time comprehensive logging data can be displayed through tables and graphs so the comprehensive data and curves can be viewed intuitively. Following this, the overflow risk parameters are evaluated by calculating the formation pressure (equivalent drilling fluid density of formation pressure), lost circulation pressure (equivalent drilling fluid density of lost circulation pressure), circulating pressure loss, and bottom hole pressure. Finally, a probability curve for a time period is output on the interface of the overflow warning module.
According to the field well history data, the overflow situation of the carbonate gas reservoir in Well XX is described as follows. At 1:06 a.m., there was no returned drilling fluid at the well head, indicating that the lost circulation occurred in the carbonate gas reservoir. The total amount of the loss of drilling fluid with a density of 1.33 g/cm3 was 12.3 m3. At 7:12 a.m., a small displacement circulation of plugging fluid was completed for this well. The drilling crew shut in the well at 08:13 a.m. and started to pump the drilling fluid at 08:48. The drilling fluid outlet flow recovered to normal at 09:03 a.m. At the same time, the drilling fluid outlet flow fluctuated sharply. Thereafter, a gas cut accident occurred, which was verified by the drilling fluid density at the outlet showing a decrease at 9:59 a.m., and the gas was monitored in the wellhead at 10:02 a.m. Finally, the overflow decreased from 12:56, as verified by the liquid level in the mud pool, which did not rise from this time. The logging data from 7:06 a.m. to 1:30 p.m. were imported into the software for early overflow identification to calculate the overflow warning results, as shown in Table 5.
Table 5.
Output results of overflow probability.
From the overflow probability results, as shown in Table 5, the overflow risk can be seen. The overflow probability was 0% at 7:04 a.m., increased to 28% at 8:10 a.m., and the suspected overflow indication was given by the overflow warning module. The bottom hole pressure (BHP) and standpipe pressure first appeared in the abnormal change. At this time, the drilling crew shut in the well at 8:13 a.m. and started to pump the drilling fluid at 8:48, as mentioned above. From 9:05 a.m. to 9:59 a.m., the outlet flow, outlet mud conductivity, hook load, and total hydrocarbon rate gradually changed, and the overflow probability increased from 0.33 to 1.00. At 9:59 a.m., the overflow warning module emitted the overflow warning, and the drilling crew ignited the gas at the wellhead.
Due to the visualized display of the optimized overflow sensitive parameters and the predicted overflow probability, the drilling crew can see the abnormal changes in each logging, PWD parameter and overflow probability. It can handle the overflow accident unhurriedly following the overflow warning. The early overflow identification software system gave the suspected overflow indication at 8:10 a.m. and the overflow warning at 9:59 a.m. These closely matched the real-world engineering situation, and the suspected overflow indication was emitted about 2 h before the time when the overflow occurred. These indicate that this early overflow identification software system can assist the drilling crew in dealing with the overflow in the carbonate reservoir with excellent performance.
4.2. Comprehensive Evaluation of the Proposed Identification Method of Overflow
The early overflow identification software system based on the proposed identification method of overflow is a complete software system integrating real-time data acquisition, data anomaly processing, overflow risk parameter calculation, real-time warning, and overflow analysis. The application of this software system in the overflow accident prediction of Well XX shows good stability and accuracy. It has crucial significance and good application value for the early detection of downhole overflow, reasonable drilling technology, and the well-kill scheme design and prevention of blowout accidents. Compared with neural networks and Bayesian methods, this method does not require numerous training tests and the construction of different levels of early warning networks. The accuracy, real-time performance, and reliability of overflow monitoring are not limited by prior knowledge and training data. Compared with downhole tool monitoring methods, they are not limited to sensor types, accuracy and reliability of monitoring tools, mechanical and environmental noise in downhole, physical and data models, etc.
There are also a few limitations to this method: (1) this system should be installed on a specialized platform for the first time. The matching problem of the early overflow identification software and hardware in the field may be hard to handle. (2) The accuracy of early overflow identification depends on the performances of the various downhole tools, such as the accuracy and stability of PWD and flowmeters.
In general, this method is very convenient for early overflow monitoring and identifying the carbonate reservoir with a narrow safe mud density window. It can be put into use after installation and can give the early warning information about 2 h before the overflow occurred, as confirmed by the case application as mentioned in Section 4.1. The evaluation result of the overflow on the abnormal changes of various parameters is highly consistent with the actual situation. Based on the concept for developing this method, this field monitoring and identification method for overflow can be used not only for fractured-vuggy carbonate reservoirs but also for other reservoirs with the characteristics of developed pores, fractures, and vugs, such as volcanic reservoirs.
5. Conclusions
- (1)
- The characteristics of overflow in a carbonate reservoir are summarized as high sensitivity to formation pressure, various gas cuts, and difficult evaluation of the downhole situation. These would cause the coexistence of overflow and lost circulation and a narrow safe mud density window for this type of reservoir, making the overflow challenging to evaluate.
- (2)
- Ten monitoring parameters are optimized for identifying the overflow in the carbonate reservoir, including outlet mudflow, bottom annulus pressure, standpipe pressure, bottom annulus temperature, drilling time, total hydrocarbon rate, drilling fluid density, hook load, outlet mud conductivity, and total mud volume in the mud poor.
- (3)
- A logic framework for early overflow identification is developed by using the DBscan clustering algorithm to identify the anomalies of the ten monitoring parameters. A probability weight coefficient of overflow (K) is defined, and four levels of overflow accident response warning are divided according to K.
- (4)
- According to the overflow identification method, a software system is developed. It includes six modules: a human-computer interaction module, a data management, real-time data collection, overflow warning, overflow risk parameter calculation, and overflow analysis simulation module. This software system can integrate real-time data acquisition, data anomaly processing, overflow risk parameter calculation, real-time warning, and overflow analysis.
- (5)
- The field monitoring and identification method for overflow are demonstrated by Well XX in a carbonate gas reservoir. The results indicate that the predicted results can closely match the real engineering situation, and the suspected overflow indication was emitted about 2 h before the overflow occurred. It indicates that this method can assist the drilling crew in dealing with the overflow in the carbonate reservoir with excellent performance.
Author Contributions
Conceptualization, Q.Z. and X.F.; methodology, Q.Z.; software, J.S.; validation, Z.Y., Z.L. and L.J.; formal analysis, P.Z.; investigation, Q.Z., Z.Y., J.S.; resources, Q.Z. and X.F.; data curation, L.L.; writing—original draft preparation, Z.Y.; writing—review and editing, Q.Z., Z.Y. and P.Z.; visualization, Z.L.; supervision, X.F.; project administration, Q.Z.; funding acquisition, X.F. All authors have read and agreed to the published version of the manuscript.
Funding
This research was funded by the National Natural Science Foundation of China (Grant Nos. 42172313 and 51774246) and the Natural Science Foundation of Sichuan Province (Grant No. 2022NSFSC0185). The authors would like to express their gratitude to the editors and anonymous reviewers for their constructive comments on the draft paper.
Institutional Review Board Statement
Not applicable.
Informed Consent Statement
Not applicable.
Data Availability Statement
Not applicable.
Conflicts of Interest
The authors declare no conflict of interest.
References
- Atchison, B.W. Automated well control: From automated detection to automated shut-in. In Proceedings of the SPE/IADC Middle East Drilling Technology Conference and Exhibition, Abu Dhabi, United Arab Emirates, 25–27 May 2021. SPE-202091-MS. [Google Scholar]
- Han, C.; Guan, Z.C.; Xu, Y.Q.; Hu, H.G.; Wu, D.S. A blowout accident causative model of hydrogen sulfide oil and gas wells using DEMATEL and ISM Algorithms. In Proceedings of the IADC/SPE Asia Pacific Drilling Technology Conference, Virtual Conference, 8–9 June 2021. SPE-201032-MS. [Google Scholar]
- Selem, A.M.; Agenet, N.; Gao, Y.; Raeini, A.Q.; Bijeljic, B. Pore-scale imaging and analysis of low salinity waterflooding in a heterogeneous carbonate rock at reservoir conditions. Sci. Rep. 2021, 11, 15063. [Google Scholar] [CrossRef] [PubMed]
- Tan, W.; Li, S.X.; Su, S.X.; Weng, H.Y.; Xiao, Y. A Classification and Description Method for Carbonate Reservoir Mechanical Properties Based on the Hoek-Brown Criterion; American Rock Mechanics Association: Alexandria, VA, USA, 2019; ARMA-2019-0268. [Google Scholar]
- Gao, H.Y.; Ai, Z.Q.; Zhang, J.C.; Zhou, B.; Chen, F.; Wang, W.C.; Liu, Z.F.; Deng, Q.; Shi, Y.Z.; Wang, Z.L. Numerical simulation of improving cementing displacement efficiency under narrow safety density window. In Proceedings of the SPE/IATMI Asia Pacific Oil and Gas Conference and Exhibition, Bali, Indonesia, 29–31 October 2019. SPE-196426-MS. [Google Scholar]
- Zhang, Z.; Sun, B.J.; Wang, Z.Y.; Pan, S.W.; Lou, W.Q.; Tong, S.K.; Guo, B. A wellbore pressure calculation method considering gas suspension in wellbore shut-in condition. In Proceedings of the SPE/IATMI Asia Pacific Oil and Gas Conference and Exhibition, Virtual Conference, 12–14 October 2021. SPE-205768-MS. [Google Scholar]
- Zhi, J.Q.; Bo, L.F.; Qu, G.H.; Jiang, N.; Zhang, R.Z. Water invasion law and water invasion risk identification method for deep sea bottom-water gas reservoir. Energies 2022, 5, 1937. [Google Scholar] [CrossRef]
- Yang, H.W.; Li, J.; Liu, G.H.; Liu, G.H. Development of a Dual-Measured-Points Early Gas Kick Detection Method based on the pressure responses of two PWD tools. Arab. J. Geosci. 2020, 13, 1–8. [Google Scholar] [CrossRef]
- Fu, J.H.; Su, Y.; Jiang, W.; Xu, L.B. Development and testing of kick detection system at mud line in deepwater drilling. J. Pet. Sci. Eng. 2015, 135, 452–460. [Google Scholar] [CrossRef]
- Yin, B.T.; Lin, Y.S.; Wang, Z.Y.; Sun, B.J.; Liu, S.J.; Sun, J.S.; Hou, J.; Ren, M.P.; Wang, N. A gas kick early detection method outside riser based on Doppler ultrasonic wave during deepwater drilling. Pet. Explor. Dev. 2020, 47, 846–854. [Google Scholar] [CrossRef]
- Li, X.; Zhang, J.; Tang, X.; Li, C.N.; Li, B.; Wang, Y.; Zhao, Z.P. Propagation characteristics and application effects of measurement-while-drilling pressure wave for early gas-kick detection. J. Loss Prev. Process Ind. 2022, 76, 104741. [Google Scholar] [CrossRef]
- Yalamarty, S.S.; Singh, K.; Kamyab, M.; Cheatham, C.; Crkvenjakov, V.; Flurry, K. Early Detection of Well Control Kick Events by Applying Data Analytics on Real Time Drilling Data; Society of Petroleum Engineers (SPE): Richardson, TX, USA, 2022; SPE-208770-MS. [Google Scholar]
- Mao, Y.L.; Zhang, P. An automated kick alarm system based on statistical analysis of real-time drilling data. In Proceedings of the Abu Dhabi International Petroleum Exhibition and Conference, Abu Dhabi, United Arab Emirates, 11–14 November 2019. SPE-197275-MS. [Google Scholar]
- Obi, C.E.; Falola, Y.; Manikonda, K.; Hasan, A.R.; Rahman, M.A. A machine learning analysis to relate flow pattern and pressure gradient during gas kicks under static conditions. In Proceedings of the SPE Western Regional Meeting, Bakersfield, CA, USA, 26–28 April 2022. SPE-209333-MS. [Google Scholar]
- Andia, P.; Israel, R.R. A cyber-physical approach to early kick detection. In Proceedings of the IADC/SPE Drilling Conference and Exhibition, Fort Worth, TX, USA, 6–8 March 2018. SPE-189701-MS. [Google Scholar]
- Yang, J.; Sun, T.; Zhao, Y.; Borujeni, A.T.; Shi, H.D.; Yang, H. Advanced real-time gas kick detection using machine learning technology. In Proceedings of the Twenty-ninth (2019) International Ocean and Polar Engineering Conference, Honolulu, HI, USA, 16–21 June 2019; pp. 1404–1409. [Google Scholar]
- Borozdin, S.; Dmitrievsky, A.; Eremin, N.; Arkhipov, A.; Sboev, A.; Emenova, O.C.; Fitzner, L.; Safarova, E. Drilling problems forecast system based on neural network. In Proceedings of the SPE Annual Caspian Technical Conference, Nur-Sultan, Kazakhstan, 21–22 October 2020. SPE-202546-MS. [Google Scholar]
- Sun, X.H.; Sun, B.J.; Zhang, S.; Wang, Z.Y.; Gao, Y.H.; Li, H. A new pattern recognition model for gas kick diagnosis in deepwater drilling. J. Pet. Sci. Eng. 2018, 167, 418–425. [Google Scholar] [CrossRef]
- Ojinnaka, M.A.; Beaman, J.J. Full-course drilling model for well monitoring and stochastic estimation of kick. J. Pet. Sci. Eng. 2018, 166, 33–43. [Google Scholar] [CrossRef]
- Olukoga, T.A.; Feng, Y. Practical machine-learning applications in well-drilling operations. SPE Drill. Complet. 2021, 36, 849–867. [Google Scholar] [CrossRef]
- Adeyemi, E.A.; Ogbe, D.O.; Wu, X. Quantifying the risks of wellbore failure during drilling operations using bayesian algorithm. In Proceedings of the SPE Nigeria Annual International Conference and Exhibition, Virtual Conference, 11–13 August 2020. SPE-203710-MS. [Google Scholar]
- Habib, M.M.; Imtiaz, S.; Khan, F.; Ahmed, S.; Baker, J. Early detection and estimation of kick in managed pressure drilling. SPE Drill. Complet. 2021, 36, 245–262. [Google Scholar] [CrossRef]
- Song, Z.H.; Li, F.Q.; Deng, P.X.; Zhu, J.; Zeng, L.; Wang, X.D. Intelligent pressure control system for MPD. In Proceedings of the IADC/SPE Asia Pacific Drilling Technology Conference, Virtual Conference, 8–9 June 2021. SPE-200990-MS. [Google Scholar]
- Sun, H.H.; Lao, L.Y.; Li, D.Y.; Tao, Q.H.; Ma, H.; Li, H.Y.; Song, C.H. Optimization of suitable measurement position through fluid dynamics in early kick detection. In Proceedings of the International Petroleum Technology Conference, Beijing, China, 26–28 March 2019. IPTC-19528-MS. [Google Scholar]
- Curina, F.; Abdo, E.; Mustapha, H. Reducing human error through automatic kick detection, space out and dynamic well monitoring. In Proceedings of the IADC/SPE International Drilling Conference and Exhibition, Galveston, TX, USA, 8–10 March 2022. SPE-208784-MS. [Google Scholar]
- Noordin, F.B.M.; Seddik, I.A.; Singh, M.; Meamari, A.S.A.; AlSaadi, S.A.; Arfi, S.A.; Baloushi, M.N.M.A.; Boyd, D.; Gerges, N.; Kushnir, D.; et al. Mapping injection water slumping and reservoir boundaries using real-time ANN 2D inversion of extra deep azimuthal LWD resistivity measurements. In Proceedings of the SPWLA 63rd Annual Logging Symposium, Stavanger, Norway, 10–15 June 2022. SPWLA-2022-0024. [Google Scholar]
- Sviridov, M.; Kushnir, D.; Mosin, A.; Belousov, A.; Nemushchenko, D.; Zaputlyaeva, A. Reservoir mapping with vendor-independent gradient-based stochastic inversion of LWD ultra-deep azimuthal resistivity data. In Proceedings of the 2022 SPE Annual Technical Conference and Exhibition, Houston, TX, USA, 3–5 October 2022. SPE-210062-MS. [Google Scholar]
- Patel, N.; Penkar, S.; Blyth, M. Managing drilling risk using an integrated approach to real-time pore pressure prediction. In Proceedings of the Abu Dhabi International Petroleum Exhibition and Conference, Abu Dhabi, United Arab Emirates, 12–15 November 2018. SPE-192692-MS. [Google Scholar]
- Yusof, M.S.M.; Khazali-Rosli, K.A.; Ezzatty, N.N.; Prasertamporn, P.; Arathoon, M.; Sockalingam, S.; Hwa, C.C.; Muhamad, E.A. Successful implementation of narrow margin drilling procedures to optimise a deepwater well. In Proceedings of the Offshore Technology Conference, Kuala Lumpur, Malaysia, 20–23 March 2018. OTC-28526-MS. [Google Scholar]
- Daryasafar, A.; Joukar, M.; Fathinasab, M.; Prat, G.D.; Kharrat, R. Estimating the properties of naturally fractured reservoirs using rate transient decline curve analysis. J. Earth Sci. 2017, 28, 848–856. [Google Scholar] [CrossRef]
Disclaimer/Publisher’s Note: The statements, opinions and data contained in all publications are solely those of the individual author(s) and contributor(s) and not of MDPI and/or the editor(s). MDPI and/or the editor(s) disclaim responsibility for any injury to people or property resulting from any ideas, methods, instructions or products referred to in the content. |
© 2023 by the authors. Licensee MDPI, Basel, Switzerland. This article is an open access article distributed under the terms and conditions of the Creative Commons Attribution (CC BY) license (https://creativecommons.org/licenses/by/4.0/).