Abstract
The paper presents the methodology that should be used to optimize hybrid power system configurations, i.e., the chosen microgrid scenario. The methodology was developed with the aim of evaluating the different production capacities of a system and comparing them with alternative connections to the main grid. It has a step-by-step structure and includes part of the steps performed by simulations in a computer program. It provides us with not only a basic but also a representative idea of an actual microgrid configuration, which is further used as support in the system’s design. An algorithm has been developed to check the energy flows and correct the selling price. The program HOMER Pro is used as the program support in performing the hybrid optimization simulation. In the analysis, it was found that the maximum share of generation from renewable energy sources in relation to the power grid is 143%, while the share of renewable energy sources in the generated energy is 65.3%. Greenhouse gas emissions are reduced by 40.75% compared to energy generated only from the power grid. In the optimization process, four configurations of the microgrid model with 990 solutions were taken, all of which are feasible.
1. Introduction
The increasing demand for electricity has led to the development of new technologies, improvements of applications of existing technologies in the energy industry, and an increased use of renewable energy sources. All this has led to the concept of decentralized power generation and the creation of advanced grids and microgrids [1,2].
A microgrid can operate in the grid mode when it is connected to the power grid and draws voltage, power, and frequency references from it; it can also operate in island mode when it is independent of the power grid [3]. Advanced grids are very similar to microgrids with their decentralized control and management of distributed energy sources. All new technologies used in the modernization of power grids are called advanced grids. The main challenge with advanced grids is the lack of standards that would govern the integration and widespread use of advanced applications, smart meters, smart appliances, and renewable energy sources. A microgrid allows connections to the electric grid at a common connection point that maintains voltages at the same level as the main grid unless there is a grid problem or another reason for a shutdown. It generally operates as long as it is connected to the grid, but it can be shut down and operated independently using local power generation when needed [4]. Internal microgrid configurations allow versatility. They can provide power to a single user (household), can power all or part of an industrial complex, or provide power to a commercial consumer. Their advantage is that, for example, millions of people who do not have access to electricity for basic services can use microgrids for local use at a cost that is often much lower than grid access. The ability to develop microgrids provides an improved ability to deliver electricity services, often at a lower cost than developing centralized electric utilities.
Microgrid designers develop system architectures that seek improved scalability, flexibility, and security. The basic microgrid architecture includes generation, critical and non-critical electrical loads, centralized control, power interfaces, common connection points, and storage technologies. Digital systems manage interoperable distributed control functions and capabilities. The supporting architecture for microgrids ultimately aims to provide plug-and-play component functionality (devices that can be used without additional customization), two-way power transmission, and seamless connectivity with energy-efficient microgrids (EEM).
When microgrids are used for power generation, a solution to the above-mentioned problems must be found. A common solution approach is to combine different types of generation. In the search for greater scalability and improved sustainability, an increasing number of electric utilities are utilizing hybrid microgrid generation models [5]. An important feature of the microgrid is the use of a mix of energy resources to generate electricity. Many microgrids are configured as hybrid generation systems [6] that use multiple technologies to achieve their resilience goals.
The development of mathematical and laboratory simulation models [7,8] that can simulate and replicate the operation of today’s microgrid networks can contribute significantly to solving existing problems and challenges. To achieve this, computer tools are needed to simulate the interaction of power and communication networks.
The results of the conducted research [9] show that computer simulation tools can be used in evaluating simulations based on microgrid networks as well as the impact of communication networks on the same networks. In addition, such simulation models are used in many other scenarios, such as the following: demand response, outage recovery, distributed management of a microgrid network, etc. By combining a number of power system simulation tools, a suitable framework can be created for the detailed analysis of a range of microgrid networks. The presented research work [10] illustrates that an environment for analysis and valuable information collection regarding these systems can be achieved by combining the different simulation tools and realistic simulations of power infrastructure.
Due to the fact that the price of energy from the grid has increased in recent years (according to [11], the average price in the EU is 0.2525 EUR/kWh) and the price of energy from renewable sources (RES) is decreasing (due to accessibility and technological development), its price has fallen to 0.05 EUR/kWh [12]. For this reason, RES are increasingly used in grid-connected microgrids. The global weighted average cost of electricity (LCOE) of photovoltaic (PV) systems has decreased by 88% between 2010 and 2021, from 0.417 USD/kilowatt-hour (kWh) to 0.048 USD/kWh [12]. In 2021, the year-on-year decrease was 13%. The global capacity-weighted average total cost of projects commissioned in 2021 [12] was 857 USD/kW, 82% less than in 2010 and 6% less than in 2020. Therefore, when implementing this type of microgrid, there are a number of factors other than economics that lead to the adoption of RES. First and foremost, these are the positive impact on the environment by reducing greenhouse gas emissions, but also political and socio-economic reasons, etc. Utility companies that supply electricity attempt to regulate the impact of RES on the main grid through the purchase prices of that energy or the amount of energy purchased relative to the energy sold from the grid. Since renewable energy sources have not been considered as much in grid-connected microgrids due to their high price compared to energy from the grid, there are a whole set of problems in running simulations that need to be highlighted and solved. This is now the case when the energy obtained from photovoltaics is the cheapest form [5,13]. In this paper, the solution to the correction of the optimization algorithm is presented, which was made in the computer program HOMER Pro using the developed methodology. This is applicable for all cases where a purely economically optimal solution is needed and for all cases where the purchase of energy from renewable energy sources depends on the purchased energy. In the second case, it is meant that there is a correction coefficient for the ratio between purchased and sold energy from and to the main grid. In this paper, other aspects such as political, security, and socio-economic aspects were not considered, and the simulations were not considered in this sense. According to the IEA World Energy Outlook of 2020 [13], electricity generation from renewable energy sources such as solar PV is expected to increase by 43% and wind by 16% by 2040 compared to 2018.
The optimization methodology and correction algorithm are presented using the example of the Zagreb University of Applied Sciences (TVZ) building, Croatia, on a microgrid model featuring power generation with a hybrid system. An evaluation of the feasibility of grid-connected microgrid hybrid systems for reliable power supply is given. The work aims to evaluate the feasibility of the hybrid microgrid at the considered site by performing a techno-economic analysis of the selected hybrid system configurations. For this purpose, a methodology has been developed, whose individual steps are described. It is not only iterative and based on the search for the optimal solution for hybrid power systems but also includes control with the aim of obtaining an acceptable solution. The preliminary simulation in the computer program HOMER Pro does not provide the expected optimal results for microgrids managed by the energy management system (EMS) method of conditioning the purchase price in relation to the regulated energy flows in the network [14]. For such cases, an algorithm was developed within the methodology, which corrects the optimization according to the conditioning EMS method and brings the optimization result to the optimal feasible solution through an iteration process.
The Introduction is followed by Section 2, which presents existing research on microgrids and the optimization of hybrid power system configurations. Section 3 presents the development of the methodology and the algorithm by optimization, including all its steps as well as its graphical representation via a flowchart. In the next section, the application of the methodology to a selected power system example is presented, while Section 5 provides a discussion and review of the obtained results. Section 6 concludes with the conclusion of the presented research as well as possible directions for further research.
2. Literature Review
There is still no consensus on the agreed definition of microgrids. All existing definitions can generally be grouped into two categories [5]: energy microgrids and community microgrids. Energy microgrids can be defined according to the definition of the European Microgrids Project [15]. They are defined as “low-voltage distribution networks that include various distributed generators, storage devices, and controllable loads that can either be interconnected or operated in isolation from the main distribution network as a controlled unit”.
On the other hand, according to the author Gui [16], community microgrids are defined as follows: “A community microgrid that is connected to its community by physical placement and may be partially or wholly owned by the community”. Considering the social dimension, a community microgrid can be considered a microgrid with the main objectives of achieving economic, social, and environmental benefits in community power supply and distribution. This classification is important for the later definition of the sustainability of microgrids [5]. The research conducted in the existing literature mainly focuses on identifying the problems of the sustainability and optimality of microgrid operation and provides practical recommendations with the aim of optimizing microgrids [17]. Practical case studies are presented to support the given recommendations [5]. The problems in microgrid operation and optimization can be divided into 4 areas: energy, information, finances, and social aspects [5]. In this paper, the energy domain is addressed with the issue of the proper sizing of electrical infrastructure, and the finance domain is addressed with the issue of the proper economic design of the microgrid by optimizing the microgrid using the EMS method of conditioning energy flows [14].
The existing literature [18,19,20] also includes numerous research papers on the analysis of different hybrid renewable energy systems (HRES) intended for rural or island electrification, such as economic analysis, technical feasibility, and environmental, political, and social considerations. The computer program for analyzing different combinations of HRES, i.e., the hybrid optimization of multiple energy sources (HOMER Pro) [21,22], is widely used.
Various methods have been used to optimize a microgrid, including genetic algorithms and swarm optimization techniques [23]. Numerous software programs have also been widely used in such studies (Table 1). These methods, used for the optimal size of RES, consider either the economic criteria or the power reliability criteria as performance indicators for the size of the renewable energy system. The computer program HOMER Pro, the micro energy system optimization tool, allows the design of off-grid and grid-connected systems. It can also be used to perform analyses to examine a wide range of design issues, such as the cost-effectiveness of various technologies and the overall architecture and size of components, including renewable energy components. It can simulate a large number of technologies and the variation in technology costs and energy resource availability. It also performs sensitivity analyses to determine the economics of the energy network as component costs or loads change. The optimal solution for the desired model configuration proposed by HOMER Pro satisfies all user-defined constraints and sizes the HRES for the lowest value of net present cost (NPC) [24].

Table 1.
Presentation of optimization computer tools for microgrids.
The following are some papers that show the application of the HOMER Pro tool. In [25], the authors studied the cost and technical benefits of several alternatives for a hybrid rural electrification system for a remote community in southern India. Seven different combinations of solar photovoltaic systems (SPVS), wind turbines, diesel generators, battery storage systems (BESS), and hydropower were simulated. A similar study is presented in [26], where the authors used HOMER Pro to explore seven different scenarios for integrated renewable energy systems for a village in Thumkunta, India.
The research hypothesis of this paper is that hybrid microgrid systems based on renewable energy sources can reduce electricity costs in urban areas and ensure energy access in remote and geographically isolated areas. On this basis, the contribution of this paper has been developed, presenting the methodology in all its steps with the aim of obtaining an optimal microgrid model based on the desired power consumption. The contribution of this work lies in the development of an algorithm within the methodology that performs optimization corrections according to the EMS conditioning method and, through an iteration process, brings the optimization result to the optimal feasible solution. Such a solution is consistent with the conditional management of the energy flows in the microgrid, i.e., the proposed methodology provides an optimal result where the energy flows into and out of the grid are balanced. The methodology is iterative in nature, and it is necessary to evaluate several possible solutions in order to find the optimal one regarding the consumption of electricity. Moreover, during some steps of the methodology, considering the control of energy flows and specific changes in the coefficient of energy purchase is necessary.
3. Description of Methodology for the Configuration Optimization of Hybrid Electrical Power Systems
This section presents the methodology for determining the optimal configuration of a hybrid energy system. The purpose of the methodology is that different production capacities are evaluated and compared with the alternative of connection to the main grid. The methodology includes part of the steps performed in the simulation. It provides us with not only a basic but also a representative idea regarding the configuration of the microgrid itself, which is used as a support in the planning process. The methodology includes in one of its steps an algorithm that performs an optimization correction according to the method of EMS for conditioning energy flows. This is done through an iteration process, and the optimization result is brought to the optimal feasible solution. This is also the contribution of this work because similar methods published so far in the scientific literature perform the optimization process without considering the EMS method of the microgrid.
The program HOMER Pro (Hybrid Optimization of Multiple Energy Resources) was chosen to perform the simulation and provide program support for hybrid optimization in multiple energy resources. This tool is used for the design, modelling, and optimization of autonomous and grid-connected energy systems. In practice, it is a recognized tool for the techno-economic analysis of microgrids, as it offers the possibility of simulating a number of different conventional technologies and renewable energy source technologies. It can also provide an assessment regarding their technical and economic feasibility.
The following is a description of the methodology with an illustration of all its steps. Figure 1 graphically depicts the methodology using a flowchart. The steps are as follows:
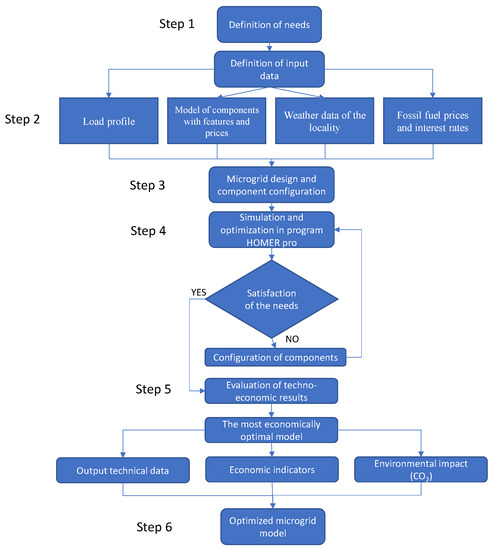
Figure 1.
Graphic representation of methodology with flow diagram.
- The needs assessment involves defining the system’s specifications (e.g., type of renewable energy source and technical constraints), which must be clearly defined along with the economic aspects of the system (i.e., cost model, system lifetime, and interest rate). In addition, component modelling, including technical specifications (e.g., type of photovoltaic modules, battery type, etc.), is considered when calculating their economic specifications (e.g., acquisition and replacement costs). Then, the system’s design is approached by considering different system configurations.
- Determination of input parameters: For the considered building, based on its location (site), i.e., latitude and longitude, the input parameters are determined: meteorological data and average daily solar radiation at the site (kWh/m2), wind speed (m/s), and average daily air temperature (°C). In addition, data on the required electricity consumption in kWh for the considered building are collected for all months of the observed year. Based on the collected input parameters, the load profiles by location and the load profiles by month are calculated. In addition, the model components with their characteristics and prices, the weather data of the locations, and the fossil fuel prices and interest rates are collected.
- Design of microgrid and configuration of components: It is necessary to select the scenario of the microgrid solution, i.e., to show its configuration with all components. For the predicted solutions, another simulation is performed; i.e., optimization is performed.
- Simulation and optimization of the selected scenario for a microgrid solution: The price of electricity generation in the microgrid is determined in relation to the investment costs (planning, design, and construction costs) and the operation and maintenance (O&M) costs of the microgrid (replacement of system components, fuel, and purchase of electricity from the system).
- (a)
- Optimization in the program’s interface, HOMER Pro, is performed in terms of the net present cost or life-cycle cost (NPC), which includes the following:
- All costs of the system during its lifetime minus all revenues;
- The cost value is reduced to the present value by discounting;
- Costs included the following: capital costs, replacement of system components, operation and maintenance costs, fuel, and the purchase of electricity from the grid;
- Revenues included the following: the sale of electricity to the grid and the value of the equipment at the end of the project (salvage).
The net present value of the cost (CNPC) is calculated according to the expression:
where
Cann,tot—total annual cost EUR);
i—discount rate (%);
Rproj—lifetime of the system (year);
CRF()—the function to calculate the coefficient of return on investment (ROI) is a ratio used to calculate the present value of an annuity (a series of equal annual cash flows).
The equation for the coefficient of return on investment is as follows:
where
i—discount rate (%);
N—number of years (year).
A real discount rate is used to convert one-time costs to annual costs. The computer program HOMER Pro calculates the annual real discount rate (interest rate) from the input data of the nominal discount rate and expected inflation rate. The HOMER Pro tool uses a real discount rate to calculate discount coefficients and annual costs from net present costs. The following equation is used to calculate the real discount rate:
where
i—real discount rate (%);
i′—nominal discount rate (%);
f—expected inflation rate (%).
A discounted cash flow is the nominal cash flow discounted to year zero. The computer program HOMER Pro calculates the discounted cash flow by multiplying the nominal cash flow by the discount factor.
The discount factor is a ratio used to calculate the present value of a cash flow that occurs in any year of the project’s lifetime. HOMER Pro calculates the discount factor using the following equation [18]:
where
—real discount rate (%);
N—number of years (year).
- (b)
- When selecting the cheapest model, the average price of the generated energy per kWh is calculated (levelized cost of energy—LCOE or COE) according to the following expression:where
Cann,tot—total annual cost of the system EUR/year);
ctop—the price of thermal energy /kWh);
Hserved—total thermal energy generated (kWh/year);
Eserved—total energy generated (kWh/year).
The second term in the meter is the portion of the annual cost that results from serving the heat load. For systems that do not generate thermal energy, i.e., do not serve the thermal load (Hserved = 0), this part of the expression is zero. The COE is a practical metric for comparing systems after optimization.
- (c)
- The initial investment cost is the total cost of each component required to install and commission the system’s components.
- (d)
- The value of the system at the end of the project life is the value of the system remaining after depreciation at the end of the project life. The computer program HOMER Pro assumes a linear depreciation of components, which means that the return value of the component is directly proportional to its remaining useful life.
The return value of the component is calculated using the following equation:
where Rrem is the remaining life of the component at the end of the life of the project and is indicated by
while Rrep is the time for the replacement cost of the components, and it is provided as
where
Crep—component replacement cost (),
Rcomp—lifetime of the component (year);
Rproj—lifetime of the project (year);
INT()—a function that returns the integer amount of a real number.
The correction factor for the supplied energy shall be calculated according to the formulas specified in part VIII of the Act on Renewable Energy Sources and High-Efficiency Cogeneration of the Republic of Croatia.
The purchase of electricity from final customers with their own production or users of self-supply facilities is described in Article 51, paragraph (5); the purchase price of RES is defined as follows.
Article 51, paragraph (5) of this Act states that “For the electricity taken over by the electricity supplier from paragraph 1 of this Article, the value of the electricity taken over by the final customer with own production Ci in the settlement period shall be determined as follows:
where
1. Ci = 0.9·PKCi, if for the billing period i: Epi > = Eii,
2. Ci = 0.9·PKCi·Epi/Eii, if for the billing period i: Epi < Eii,
- -
- Epi—total electric energy taken from the grid by the customer in the billing period, expressed in kWh;
- -
- Eii—total electric energy supplied to the grid by the customer’s own generation unit during the billing period, expressed in kWh;
- -
- PKCi—the average unit price of electricity paid by the customer to the supplier for the electricity sold, excluding grid usage charges and other fees and taxes, within the billing period, expressed in HRK/kWh. As long as the energy taken from the grid is greater than the energy delivered to the grid, the correction factor for the price of delivered energy is 0.9. When the share of energy delivered to the grid becomes greater than that taken, the correction factor decreases, increasing the return on investment and the profitability of the given model in the simulation.
The computer program HOMER Pro cannot consider the change in the energy price coefficient, so it is necessary to consider the obtained results from this point of view and correct the input parameters of the simulation. For this purpose, a flowchart of the algorithm for checking the obtained results from the point of view of the supplied and received energy was created. It shows that the input parameters are corrected when an incorrect result is found. Moreover, with each new iteration step, it leads to the optimal solution according to NPC, considering the price of the delivered energy and the power of the PV field.
Looking at the cash flow, the largest investment in infrastructure is at the beginning, while at the end of the project, the rest of the value of the assets is added.
If the energy needs are met, the techno-economic requirements are evaluated (step 5); otherwise, it is necessary to reconfigure the components of the microgrid and repeat the simulation (the process is iterative in nature). The computer program HOMER Pro is used to perform the simulation.
- 5.
- Evaluation of technical-economic requirements: An economic sensitivity analysis is performed for the preferred system to determine its performance under the impact of selected economic variables. In addition, the impact of various economic variables on the cost of the project is determined. Input variables used in the sensitivity analysis include the following: electricity prices, interest rates, and inflation rates.
- 6.
- Presentation of the optimized microgrid model: At the end, after the simulation and evaluation, an optimized model of the microgrid system is presented. For this purpose, the results of the microgrid configuration, economic indicators, and greenhouse gas emission values are read. The system’s configuration provides information about which energy sources contribute the most to the optimization results. Optimization is performed according to NPC, but important indicators also include COE and investment payback time. The environmental impact of the system is monitored by assessing the carbon dioxide (CO2), sulphur dioxide (SO2), and nitrogen oxide (NOx) levels.
4. Valorization of the Methodology with Results—Case Study
In this section, the application of the methodology with the aim of obtaining an optimal microgrid power system for the building of Zagreb University of Applied Sciences (TVZ) is demonstrated, and impacts are assessed with a case study. The preliminary optimization does not lead to the expected results, which are consistent with the method of EMS for conditioning the energy flows. Therefore, a correction of the optimization process of the standard microgrid is required. For this purpose, a correction algorithm has been developed, and the proposed methodology and algorithm are validated using the repeated iterative process to determine the optimal result.
Choosing the optimal size of distributed energy sources and optimizing their operation are very important to justify the investment costs and to achieve the best possible system efficiency. Thus, to choose the optimal power and capacity of energy storage, the microgrid represents a solution where at least 50% of the electricity consumption is generated from renewable energy sources, contributing to the increase in energy security, climate change mitigation, and future economic savings. The purpose was to determine what configuration of the microgrid would be required to generate 50% of the energy from renewable sources and to perform a preliminary techno-economic analysis. In the paper itself, it can be seen that the NPC and COE for the simulation with a 50% share of RES are higher than the simulation of the optimal solution.
The application of the methodology was performed according to the steps explained in the previous section, using the computer program HOMER Pro.
- 1.
- Determination of demands: the following system specifications were defined by applying the indicated computer program:
- -
- Electricity generator: photovoltaic system and wind turbines;
- -
- Grid feeding: surpluses are sold to the grid, and deficits are taken from the grid;
- -
- Storage: no/yes;
- -
- CO2 emission reduction calculation;
- -
- Minimum share of renewable energy sources: 50%.
To perform the simulation, the microgrid was designed with the following initial conditions. Generic values for PV systems (an efficiency of 0.8, a capital cost of 900 EUR/kW, operation and maintenance costs of 30 EUR/kW per year, and a lifetime of 30 years), wind turbines (a generic 3 kW, a capital cost of 18.000 EUR/kW, and operation and maintenance costs of 180 EUR/kW), converters (an efficiency of 0.9, a capital of 300 EUR/kW or 13,000 EUR/100 kW, and a lifetime of 15 years), and the grid (a grid electricity price of 0.111 EUR/kWh and a grid feedback price 0.1 EUR/kWh for Croatia) were assumed.
- 2.
- Definition of input parameters—the following parameters are defined in order.
- (a)
- Location and meteorological data:
The location of the observed building of the Zagreb University of Applied Sciences in Zagreb at the address Konavoska 2 is located at a latitude of 45.799 and a longitude of 15.928 (Figure 2).
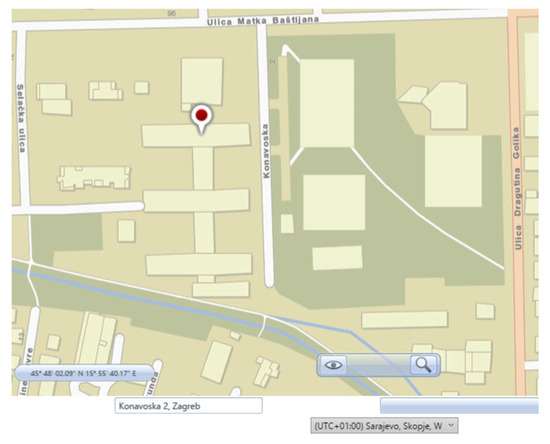
Figure 2.
Selection of location and meteorological data for the observed building.
Given that a photovoltaic system and wind turbines are used for the generators, the meteorological data that are important for the implementation of the project include the mean daily solar irradiation at the site (kWh/m2) and wind speed (m/s).
The data for the mean daily irradiance and data for the wind speed at the site were taken from the statistical computer program HOMER Pro and can be seen in the following figures (Figure 3, Figure 4 and Figure 5).
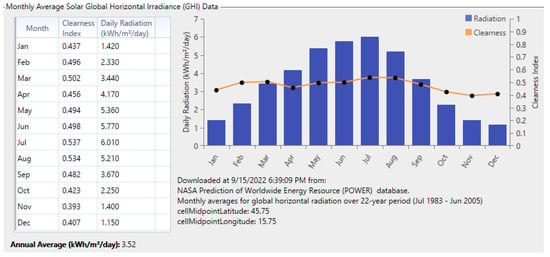
Figure 3.
Monthly Average Solar Global Horizontal Irradiance (GHI) Data.
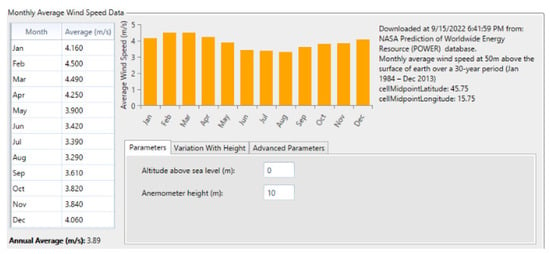
Figure 4.
Monthly Average Wind Speed Data.
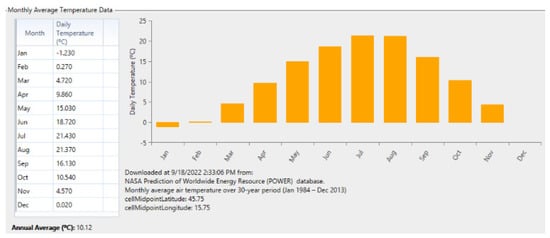
Figure 5.
Monthly Average Temperature Data for selected location.
- (b)
- Requirements for electrical energy consumption at the observed location:
Data on electricity consumption for the year prior to 2021 were collected and are presented in Table 2.

Table 2.
Presentation of electrical energy consumption by month in 2021.
According to the required electricity consumption, the electricity load profile (daily, monthly, and annual) for the selected location was created, which is shown in Figure 6.
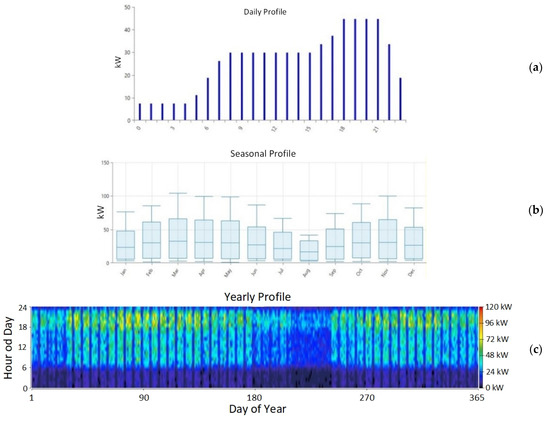
Figure 6.
(a) Daily, (b) monthly, and (c) annual electrical energy load profile for the selected location.
A more detailed monthly load profile for 2021 at the observed location is shown in Figure 7.
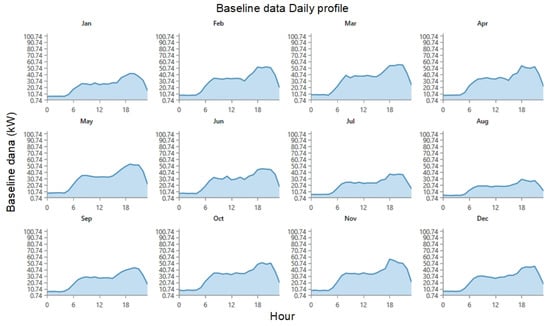
Figure 7.
More detailed monthly electricity load profile for selected site for 2021.
Based on the obtained data, the following were calculated:
- -
- The total annual consumption of electrical energy Wuk, which is obtained by adding up the consumption for each month of the year.
Wuk = 292,837 kWh
- -
- Average daily electrical energy consumption Wd, which is obtained by dividing the total annual consumption by 365 days per year.
Wd = Wuk/365 = 292,837/365 = 802.3 kWh/day
- 3.
- Design of the microgrid and configuration of components: a microgrid connected to the power grid was chosen as the observed scenario, consisting of a grid, wind turbines, and a photovoltaic system. In total, 990 solutions were simulated, of which all 990 solutions were feasible.
Overall, 990 simulations were performed with the following values: PV, 0–250 kW (value determined by the correction algorithm in the range of 1–739 kW, Figure 8); G3, 0–1000 kW; converter, 30.3–546 kW. Of these, 224 solutions did not meet the criteria of EMS using the energy flow conditioning method, while 766 solutions were feasible and met the energy flow criteria in the microgrid.
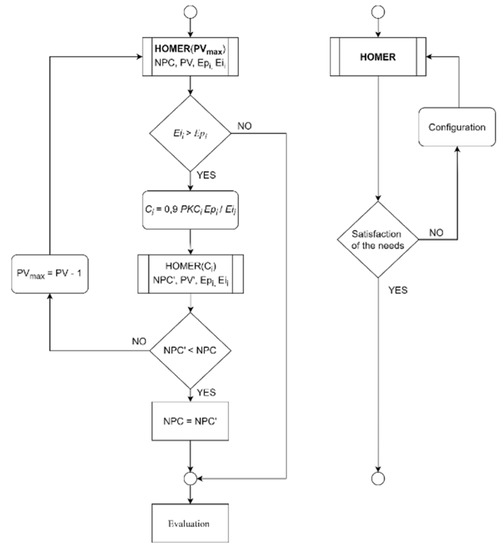
Figure 8.
Flow diagram of the simulation correction algorithm.
- 4.
- Simulation and optimization of the selected microgrid solution scenario: A simple optimization procedure was conducted.
According to the available meteorological data for the location, it is evident that the sun, as a renewable energy source, has a much greater potential than the wind itself. Therefore, when designing the system, a large number of photovoltaic modules were used, and only one wind turbine was used in accordance with the given parameters of the system. According to the initial requirements, photovoltaic modules should make up a minimum of 50% of the energy source. The inverter losses amount to ηAC/DC = 0.9.
50% of Wd is 0.5 · Wd = 0.5 · 802.3 kWh = 401.15 kWh
The photovoltaic modules should ensure a minimum daily consumption of 401.15 kWh. If we also consider the losses of the inverter itself, which are 0.9, we conclude that the photovoltaic modules should produce at least 397.2 kWh of energy per day.
Wukd = Wd/ηAC/DC = 401.15/0.9 = 445.72 kWh
In the design of photovoltaic systems that are not connected to the power grid, the month of the year with the lowest average daily irradiance is usually considered, and the number of modules to be installed at the site is determined based on the technical data of the available module. Since it is a plant connected to the grid, the average daily solar irradiance for the year is considered, with the average number of peak sun hours being psh = 3.52 kW/m2.
If the value of psh = 3.52 kW/m2 and the loss on the module itself is 0.8, it is assumed that the average required power of photovoltaic modules is as follows.
P = 445.72/3.52·0.8 = 158.28 kWp
In this case, the number of photovoltaic modules required for performance is as follows.
N = 158.28/0.330 = 479.63 → N = 480 modules
A preliminary optimization with the computer program HOMER Pro shows that a high initial investment of EUR 733,575.00 is required, which is amortized in 13 years, with a difference in the total net price of EUR 26,816 compared to the basic solution with only the grid (Table 3). The average energy price per kWh of EUR 0.03 is much cheaper than the basic solution. To implement such a solution, 739 kW of solar modules and 532 kW inverter must be installed (Table 4).

Table 3.
Economic indicators of preliminary optimization without the control.

Table 4.
Technical indicators of preliminary optimization without the control.
The obtained results of the preliminary optimization did not provide the expected results consistent with the method EMS for conditioning the energy flows. Therefore, a correction of the optimization methodology of the given microgrid was needed, and for these needs, a correction algorithm and a proposed methodology were developed. The input data for the computer program HOMER must additionally be adjusted to support optimization for markets that have a limit on sales to the grid as a function of power flows. This was done to account for the power flow relationships in the input parameters within the optimization methodology and to adapt the optimization results to such markets. The scientific contribution of this work is to develop such a correction algorithm and methodology for the needs of optimization in such markets. The results of the corrections of the whole NPC for the preliminary simulation using the developed methodology and algorithm can be seen in Table 5.

Table 5.
Comparison of the optimization results.
From the obtained results, it can be concluded that the optimization results, regardless of how good the program support is, should always be taken with caution and understanding. Precisely because of the peculiarities of each energy system in which the microgrid participates, it is necessary to control the energy flows so that an optimal solution is achieved regardless of the peculiarities of the system itself [15].
In order to obtain correct optimization results, it is necessary to implement additional mechanisms that verify and correct the previously obtained results. First, the energy flows must be verified, and, based on these energy flows, the actual energy purchase price must be calculated according to Ci = 0.9 − PKCi − Epi/Eii. When the actual energy purchase price has been determined according to the correction coefficient, we restart the simulation with new input parameters and calculate a new actual NPC′. If the new NPC′ is <NPC, then we conclude that the results of this simulation represent the optimal solution. Otherwise, we decrease the boundaries of the observed space PVmax = PV − 1 (initially, PVmax = 2000 kW and PVmin = 0 kW) and repeat the simulation with new input parameters PVmax. The procedure is repeated until Eii > Epi or until we obtain the minimum NPC′, as shown in Figure 8.
The whole procedure is carried out in the 4th step (Figure 1) of the method to optimize the configuration of the hybrid power system until optimal simulation results are obtained. The flowchart of the algorithm is shown in Figure 8.
The optimization showed (Table 6) that the most favorable solution with a total net price (net present value or life cycle cost—NPC) of EUR 368,542.00.

Table 6.
Presentation of developed models in scenario of selected example of TVZ building.
The average energy cost per kWh (levelized cost of energy—LCOE or COE) is 0.067 EUR/kWh, and the operation and maintenance (O&M) cost of such a microgrid is 9312 EUR/year. While there is a pure grid solution NPC EUR 386,665.00, COE 0.111 EUR/kWh, and O&M 29,910 EUR/year, an initial investment of EUR 248,161.00 is required.
- 5.
- Evaluation of techno-economic requirements—on the basis of this, it was found that the investment return time is 12 years (Figure 9).
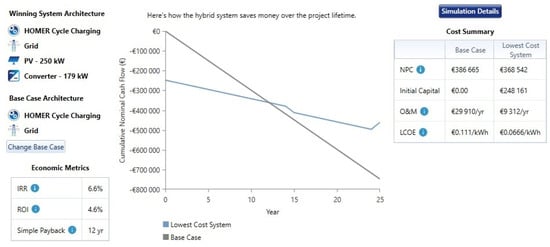 Figure 9. Selection of optimal microgrid model after evaluation.
The total energy withdrawn from the grid in a year is 159,658 kWh, while the energy fed into the grid is 158,322 kWh (Table 7).

Table 7.
Calculation of electrical energy consumption and cost by month of year.
Figure 10 shows the energy purchased from the grid (a) and the energy sold to the grid (b).
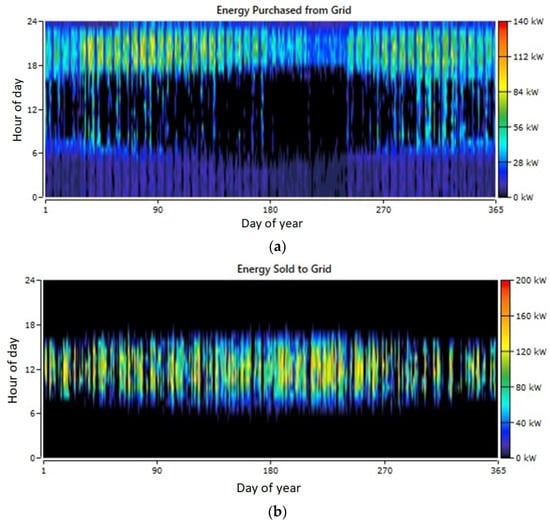
Figure 10.
(a) Energy purchased from grid and (b) energy sold to grid.
The calculation shows that the share of renewable energy sources from photovoltaic panels is 65.3% (Table 8).

Table 8.
Production and consumption of electrical energy.
Figure 11 shows the monthly distribution of energy purchased and sold to the grid.

Figure 11.
Monthly distribution of taken and delivered energy according to network.
Via a sensitivity analysis, 42,280 solutions were simulated, all of which are feasible only with different NPCs. The sensitivity analysis in relation to the price of energy delivery to the network (Figure 12) showed that the share of renewable energy sources increases only above the price of EUR 0.05/kWh and that the share of renewable energy sources in the network is over 50% at a price of EUR 0.096/kWh.
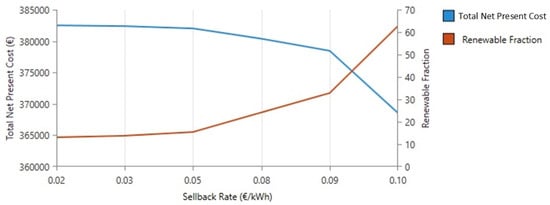
Figure 12.
Sensitivity analysis in relation to price of energy delivery to grid.
Sensitivity analysis according to the purchase price is shown in Table 9.

Table 9.
Sensitivity analysis according to purchase price.
Looking at the money flow, the largest investment in infrastructure is at the beginning, while at the end of the project, the rest of the equipment’s value is added up (Figure 13).
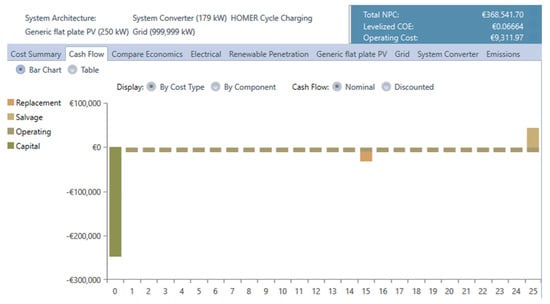
Figure 13.
Cash flow over 25 years.
Salvage value occurs as a positive cash flow at the end of the project lifetime for any component that has some remaining life at that point.
Net present value (NPV) includes the residual value of the equipment at the end of the project life, which is added to the total revenue in NPV. The discounted value after 25 years of project life is EUR 8983.00 for the photovoltaic system and EUR 1749.00 for the converter, resulting in a total discounted value of the equipment of EUR 10,732.00 (Table 10). For optimization purposes, a nominal discount rate of 8% and an inflation rate of 2% were assumed, resulting in a real discount rate of 5.88%. The sensitivity analysis showed that the discount rate does not affect the choice of the optimal solution, although it increases the NPC and therefore was not considered in detail in the analysis of the optimal model.

Table 10.
Salvage value of PV and converter at the end of lifetime of the project.
The optimal solution has lower greenhouse gas emissions. The emissions of carbon dioxide (CO2), sulphur dioxide (SO2), and nitrogen oxides (NOx) decreased by 40.7%. This is a significant reduction in greenhouse gas emissions. Table 11 shows a comparison between the optimal and the original baseline system in terms of greenhouse gas emissions.

Table 11.
Comparison between the optimal and the original baseline system in terms of greenhouse gas emissions.
Figure 14 shows the sensitivity analysis related to the price of energy from the grid. It can be seen that as the price of energy from the grid increases, the share of renewables increases with an increase in the price of energy from the grid, rising to 83.7% (ranging from 50–84%, depending on the purchase price correction coefficient).
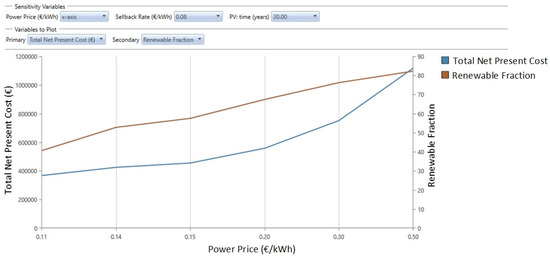
Figure 14.
Sensitivity analysis in relation to price of energy from the grid.
5. Discussion on Obtained Results
In this paper, the microgrid optimization scenario is analyzed on a selected example of the Zagreb University of Applied Sciences building in Zagreb, Croatia (TVZ). In the scenario, the microgrid of the system was connected to the power grid, and in the first step, an optimal solution was sought for 50% of the generated energy to come from renewable energy sources. Then, the most optimal solution was found via the optimizations. The optimal configuration of the hybrid microgrid system in parallel operation with the power grid (TVZ building scenario) consists of 250 kW photovoltaic panels, the power grid, and 179 kW inverter. From Table 12, we can conclude the following.

Table 12.
Similarities and discrepancies between the literature and the current research work.
As shown in previous work in the microgrid model associated with EEM, the impact of wind turbines and batteries in the microgrid on NPC and COE is significant [29]. In this work, it is shown that the microgrid is more optimal without these components. All simulations that included elements of wind turbines and batteries gave worse results according to the NPC and COE. Therefore, the optimization in this paper for the approximate configuration gives a 33% better COE compared to previous work. With a lower energy price from the grid 15] and a similar share of PV (62%) due to its share in the cost of wind turbines, the optimization leads to worse results in the COE/energy price relationship than in this work. When the energy price is very low, as in [29], the cost-effectiveness of implementing a hybrid microgrid is questioned. Then, the share of PV systems in production is only 20% (according to Figure 14), and the price of the energy obtained from such a microgrid is even more expensive than the energy from the grid. In [30], the relationship between the sell-back price and COE is considered, where COE decreases as the sell-back price of energy increases, but the total energy sold to the grid is twice the energy purchased from the grid, and the purchase price is always the same, which is not applicable in the case of a legal price correction when the energy sold to the grid is higher than the purchased energy. No other paper considers the change in the purchase price of energy relative to the energy sold/purchased, so this paper provides an analysis of the simulation in such a case and a solution for such situations using the presented correction algorithm.
The preliminary simulation showed that the optimization results did not consider the energy flows and the associated changes in the selling price and, therefore, could not be assumed as optimal results. Therefore, as part of the methodology, a special algorithm was developed to verify the accuracy of the obtained results based on the relationship between energy flows and sales prices. In the case when more energy was sold to the grid, it was found that the computer program HOMER Pro gives incorrect optimization results because, in such a case, it does not consider the sales price correction coefficient. Therefore, the energy flows are checked by the algorithm, and the selling price is corrected, which restarts the simulation. Moreover, the results of the repeated NPC and the original simulation are compared, and in case of a non-optimal solution, the PV input limits are reduced; thus, the whole process is brought to the optimal solution by the iteration process.
In the most optimal solution, the share of renewable energy sources in the total energy production is 65.30%. The most optimal model is the grid connected to the power grid with energy generation from solar panels with an NPC of EUR 368,542.00. The average energy price per kWh is 0.067 EUR/kWh compared to the grid price of 0.111, while the operation and maintenance costs of such a microgrid are 9312 EUR/year compared to the price of EUR 29,910.00 for the basic model. An initial investment of EUR 248,161.00 is required, and the payback period is 12.09 years. Greenhouse gas emissions decreased by 40.75% compared to the base model. A total of four microgrid models were analyzed with 990 solutions, all of which are feasible. In the sensitivity analysis, 42,280 simulations of the solution were performed, which showed that due to the correction coefficient in the purchase of electricity from renewable energy sources, the most optimal solution results from the area where the energy purchased from the grid is equal to the energy sold to the grid. This shows that the search for an optimal solution depends not so much on the price of electricity itself but mainly on the profile of the consumer.
6. Conclusion and Some Possible Directions for Future Research
This paper presents a methodology aimed at optimizing the feasibility of hybrid microgrids via the scenario of microgrids in parallel operation with power grids. The contribution of this work is to develop a methodology that includes an algorithm that corrects the optimization according to the EMS conditioning method and, through an iteration process, brings the optimization result to the optimal feasible solution. This represents a difference from the methods previously published in the literature, which perform optimization without considering the EMS method of the microgrid. The methodology is iterative, and it is necessary to evaluate several possible solutions to find the optimal solution in terms of power consumption. In addition, some steps of the methodology must consider the control of energy flows and specific changes in the coefficient of energy reference.
The optimization methodology and correction algorithm are presented using the case study of the Zagreb University of Applied Sciences building in Zagreb, Croatia (TVZ), on a microgrid model and power generation with a hybrid system. An evaluation of the feasibility of grid-connected microgrid hybrid systems for reliable power supply is given. The work aims to evaluate the feasibility of the hybrid microgrid at the considered site by performing a techno-economic analysis of the selected hybrid system configurations.
The chosen site is characterized by a large amount of available solar energy and a small amount of wind energy. The obtained optimization results illustrate the feasibility of hybrid microgrids in urban and rural areas with a return on investment of 12.09 years and an average energy price per kWh lower than primary systems without renewable energy sources.
A preliminary simulation has proved that the use of the HOMER Pro program tool alone is not sufficient to meet the needs of optimization in a special case, as in this example. An algorithm was created to verify the accuracy of the optimization based on energy flows, sales prices, and present PV power limits. The methodology and algorithm were evaluated using a case study where, starting from an initial PV power of 739 kW, an optimal solution with a PV power of 250 kW was obtained through an iteration process.
The optimizations have shown that there is an entire range of possible solutions (990) for the performance of hybrid microgrids depending on the available sources and consumption profile. Such microgrids are reliable systems for power supply in urban and rural areas. The analysis of the scenarios and individual models shows that the microgrid effectively uses the solar energy sources at the site and is able to meet energy demands for the daily needs of the observed TVZ building.
The optimal configuration in the scenario uses solar radiation energy and provides more economically and environmentally favorable results than the primary system without renewable energy sources.
For the selected example and scenario of the TVZ building (microgrid in parallel operation), the following data were obtained:
- The optimal configuration of the hybrid microgrid in parallel operation with the power grid consists of 250 kW photovoltaic panels, a power grid, and 179 kW inverter.
- In the optimization process, four configurations of the microgrid model were taken with 990 solutions, all of which are feasible. For the sensitivity analysis, 42,280 solution simulations were performed. The following results were obtained: NPC EUR 368,542.00 and COE EUR 0.067/kWh, while the payback period of the investment is 12.09 years.
- The maximum percentage of generation from renewable energy sources in relation to the power grid is 143%, while the percentage of renewable energy sources in the generated energy is 65.3%.
- A total of 459,763 kWh/year was generated.
- The optimal solution has lower greenhouse gas emissions. Emissions of carbon dioxide (CO2), sulphur dioxide (SO2), and nitrogen oxides (NOx) decreased by 40.7%.
- Models with a wind turbine are economically less favorable than the baseline solution due to insufficient wind at the site and were not considered in the sensitivity analyses.
- For optimization purposes, a nominal discount rate of 8% and an inflation rate of 2% were assumed (as input parameters), resulting in a real discount rate of 5.88%. The sensitivity analysis showed that the discount rate does not affect the choice of the optimal solution, although it increases the NPC and therefore was not considered in detail in the analysis of the optimal model.
- The optimization solution is completely incorrect for the specific case of regulated energy purchases because the computer program itself cannot consider the change in the correction coefficient for energy purchases. If the proposed architecture is used in real settings, considering changes in the purchase price coefficient, completely different results are obtained. This shows that optimization results, no matter how good the program support is, should always be taken with caution and understanding. Precisely because of the peculiarities of each energy system in which the microgrid participates, controlling energy flows in order to achieve an optimal solution is necessary regardless of the peculiarities of the system itself. The search for an optimal solution also considers the control of energy flows (using a local controller) and specific changes in the coefficient of energy purchases. The development of the control algorithm is not the subject of this paper, so it is not presented here.
One of the possible directions of future research would be to extend the methodology with the aim of being able to possibly evaluate several similar scenarios simultaneously and possibly use one of the other optimization algorithms (e.g., the genetic algorithm).
Author Contributions
Conceptualization, D.Ž. and K.O.; formal analysis, D.Ž. and T.T.; writing—original draft preparation, D.Ž. and K.O.; data curation, D.Ž. and T.T.; project administration, D.Ž. and K.O.; simulation, D.Ž. and T.T., funding acquisition, D.Ž. and T.T.; supervision, T.T. and K.O. All authors have read and agreed to the published version of the manuscript.
Funding
This research received no external funding.
Data Availability Statement
Data is unavailable due to privacy restrictions.
Conflicts of Interest
The authors declare no conflict of interest.
Nomenclature
| Latin variables | |
| Cann,tot | total annual cost (EUR) |
| Cann,tot | total annual cost of the system during a year EUR/year) |
| CNPC | the net present value of the cost (EUR) |
| Crep | component replacement cost (EUR) |
| Ctop | the price of thermal energy (EUR/kWh) |
| COE | levelized cost of energy (EUR/kWh) |
| CRF | the coefficient of return on investment |
| CRF() | function to calculate the coefficient of return on investment (CRF) |
| Eii | total electric energy supplied to the grid by the customer’s own generation unit during the billing period (kWh) |
| Epi | total electric energy taken from the grid by the customer in the billing period (kWh) |
| Eserved | total energy generated (kWh/year) |
| f | expected inflation rate (%) |
| fd | discount factor (%) |
| Hserved | total thermal energy generated (kWh/year) |
| i | discount rate (%) |
| i | real discount rate (%) |
| i′ | nominal discount rate (%) |
| INT() | a function that returns the integer amount of a real number |
| N | number of years (year) |
| N | the number of photovoltaic modules required for performance (-) |
| P | average required power of photovoltaic modules |
| PKCi | the average unit price of electricity paid by the customer to the supplier for the electricity sold, excluding grid usage charges and other fees and taxes, within the billing period (HRK/kWh) |
| psh | average number of peak sun hours (kW/m2) |
| Rcomp | lifetime of the component (year) |
| Rproj | lifetime of the project (year) |
| Rproj | lifetime of the system (year) |
| S | the return value of the component |
| Wd | average daily electrical energy consumption (kWh/day) |
| Wuk | the total annual consumption of electrical energy (kWh) |
| Greek variables | |
| ηAC/DC | inverter losses (-) |
References
- Marnay, C.; Venkataramanan, G. Microgrids in the evolving electricity generation and delivery infrastructure. In Proceedings of the Power Engineering Society General Meeting, 2006, Montreal, QC, Canada, 18–22 June 2006. [Google Scholar] [CrossRef]
- Jiayi, H.; Chuanwen, J.; Rong, X. A review on distributed energy resources and MicroGrid. Renew. Sustain. Energy Rev. 2008, 12, 2472–2483. [Google Scholar] [CrossRef]
- Hatziargyriou, N.; Asano, H.; Iravani, R.; Marnay, C. Microgrids: An Overview of Ongoing Research, Development, and Demonstration Projects. Environmental Energy Technologies Division, Ernest Orlando Lawrence Berkeley National Laboratory. Available online: http://eetd.lbl.gov/EA/EMP/emp-pubs.html (accessed on 16 June 2022).
- Lantero, A. How Microgrids Work | Department of Energy, How Microgrids Work. Available online: https://www.energy.gov/articles/how-microgrids-work (accessed on 16 June 2022).
- Boche, A.; Foucher, C.; Villa, L.F.L. Understanding Microgrid Sustainability: A Systemic and Comprehensive Review. Energies 2022, 15, 2906. [Google Scholar] [CrossRef]
- Murugaperumal, K.; Ajay, D.; Vimal Raj, P. Feasibility design and techno-economic analysis of hybrid renewable energy system for rural electrification. Sol. Energy 2019, 188, 1068–1083. [Google Scholar] [CrossRef]
- Suryanarayanan, S.; Steurer, M.; Woodruff, S.; Meeker, R. Research perspectives on high-fidelity modelling, simulation and hardware-in-the-loop for electric grid infrastructure hardening. In Proceedings of the IEEE Power Engineering Society General Meeting (PES), 2007, Tampa, FL, USA, 24–28 June 2007. [Google Scholar] [CrossRef]
- Gopstein, A.; Nguyen, C.; O’Fallon, C.; Hastings, N.; Wollman, D. NIST Framework and Roadmap for Smart Grid Interoperability Standards, Release 4.0, National Institute of Standards and Technology (NIST), Tech. Rep. Available online: https://nvlpubs.nist.gov/nistpubs/SpecialPublications/NIST.SP.1108r4.pdf (accessed on 16 June 2022).
- Amarasekara, B.; Ranaweera, C.; Nirmalathas, A.; Evans, R. Co-simulation platform for smart grid applications. In Proceedings of the 2015 IEEE Innovative Smart Grid Technologies—Asia (ISGT ASIA 2015), 2016, Bangkok, Thailand, 3–6 November 2015. [Google Scholar] [CrossRef]
- Bytschkow, D.; Zellner, M.; Duchon, M. Combining SCADA, CIM, GridLab-D and AKKA for smart grid co-simulation. In Proceedings of the 2015 IEEE Power and Energy Society Innovative Smart Grid Technologies Conference (ISGT 2015), 2015, Washington, DC, USA, 18–20 February 2015. [Google Scholar] [CrossRef]
- Electricity Price Statistics—Statistics Explained. Available online: https://ec.europa.eu/eurostat/statistics-explained/index.php?title=Electricity_price_statistics#Electricity_prices_for_household_consumers (accessed on 31 January 2023).
- IRENA. Renewable Power Generation Costs in 2021, International Renewable Energy Agency, Abu Dhabi. 2022. Available online: https://www.irena.org/-/media/Files/IRENA/Agency/Publication/2022/Jul/IRENA_Power_Generation_Costs_2021_Summary.pdf (accessed on 31 January 2023).
- International Energy Agency. World Energy Outlook. Available online: www.iea.org/weo (accessed on 31 January 2023).
- Zia, M.F.; Elbouchikhi, E.; Benbouzid, M. Microgrids energy management systems: A critical review on methods, solutions, and prospects. Appl. Energy 2018, 222, 1033–1055. [Google Scholar] [CrossRef]
- Tsikalakis, A.G.; Hatziargyriou, N.D. Centralized control for optimizing microgrids operation. In Proceedings of the 2011 IEEE Power and Energy Society General Meeting, Detroit, MI, USA, 24–28 July 2011. [Google Scholar] [CrossRef]
- Gui, E.M.; Diesendorf, M.; MacGill, I. Distributed energy infrastructure paradigm: Community microgrids in a new institutional economics context. Renew. Sustain. Energy Rev. 2017, 72, 1355–1365. [Google Scholar] [CrossRef]
- Danish, M.S.S.; Senjyu, T.; Funabashia, T.; Ahmadi, M.; Ibrahimi, A.M.; Ohta, R.; Howlader, H.O.R.; Zaheb, H.; Sabory, N.R.; Sediqi, M.M. A sustainable microgrid: A sustainability and management-oriented approach. Energy Procedia 2019, 159, 160–167. [Google Scholar] [CrossRef]
- Hidalgo-Leon, R.; Amoroso, F.; Litardo, J.; Urquizo, J.; Torres, M.; Singh, P.; Soriano, G. Impact of the Reduction of Diesel Fuel Subsidy in the Design of an Off-Grid Hybrid Power System: A Case Study of the Bellavista Community in Ecuador. Energies 2021, 14, 1730. [Google Scholar] [CrossRef]
- Shahzad, M.K.; Zahid, A.; Rashid, T.U.; Rehan, M.A.; Ali, M.; Ahmad, M. Techno-economic feasibility analysis of a solar-biomass off grid system for the electrification of remote rural areas in Pakistan using HOMER software. Renew. Energy 2017, 106, 264–273. [Google Scholar] [CrossRef]
- Faizan, A.K.; Nitai, P.; Syed, H.S. Optimisation and Sizing of SPV/Wind Hybrid Renewable Energy System: A Techno-Economic and Social Perspective. Energy 2021, 233, 121114. [Google Scholar] [CrossRef]
- HOMER Energy LLC. HOMER (Hybrid Optimization of Multiple Energy Resources) Software. Available online: https://www.homerenergy.com/products/pro/index.html (accessed on 16 June 2022).
- Homer Energy. HOMER Pro Version 3.7 User Manual. Available online: https://www.homerenergy.com/pdf/HOMERHelpManual.pdf (accessed on 16 June 2022).
- Baños, R.; Manzano-Agugliaro, F.; Montoya, F.; Gil, C.; Alcayde, A.; Gómez, J. Optimization methods applied to renewable and sustainable energy: A review. Renew. Sustain. Energy Rev. 2011, 15, 1753–1766. [Google Scholar] [CrossRef]
- Saiprasad, N.; Kalam, A.; Zayegh, A. Comparative Study of Optimization of HRES using HOMER and iHOGA Software. J. Sci. Ind. Res. 2018, 77, 677–683. Available online: http://nopr.niscair.res.in/handle/123456789/45489 (accessed on 20 February 2023).
- Amutha, W.M.; Rajini, V. Cost benefit and technical analysis of rural electrification alternatives in southern India using HOMER. Renew. Sustain. Energy 2016, 62, 236–246. [Google Scholar] [CrossRef]
- Anwar, K.; Deshmukh, S.; Mustafa Rizvi, S. Feasibility and sensitivity analysis of a hybrid photovoltaic/wind/biogas/fuelcell/diesel/battery system for off-grid rural electrification using homer. J. Energy Resour. Technol. 2020, 142, 061307. [Google Scholar] [CrossRef]
- Nurunnabi, M.; Roy, N.K. Grid connected hybrid power system design using HOMER. In Proceedings of the 3rd International Conference on Advances in Electrical Engineering (ICAEE 2015), Dhaka, Bangladesh, 17–19 December 2015; pp. 18–21. [Google Scholar] [CrossRef]
- Riayatsyah, T.M.I.; Geumpana, T.A.; Fattah, I.M.R.; Rizal, S.; Mahlia, T.M.I. Techno-Economic Analysis and Optimisation of Campus Grid-Connected Hybrid Renewable Energy System Using HOMER Grid. Sustainability 2022, 14, 7735. [Google Scholar] [CrossRef]
- Morad, M.; Nayel, M.; Elbaset, A.A.; Galal, A.I.A. Sizing and Analysis of Grid-Connected Microgrid System for Assiut University Using HOMER Software. In Proceedings of the 20th International Middle East Power Systems Conference (MEPCON 2018), Cairo, Egypt, 18–20 December 2018; pp. 694–699. [Google Scholar] [CrossRef]
- Vai, V.; Eng, S. Study of Grid-Connected PV System for a Low Voltage Distribution System: A Case Study of Cambodia. Energies 2022, 15, 5003. [Google Scholar] [CrossRef]
- Sharma, H.; Mishra, S. Hybrid Optimization Model for Smart Grid Distributed Generation Using HOMER. In Proceedings of the 3rd International Conference on Recent Developments in Control, Automation and Power Engineering (RDCAPE 2019), 2019, Noida, India, 10–11 October 2019; pp. 94–99. [Google Scholar] [CrossRef]
- Das, P.; Das, B.K.; Safir, S.M.; Hossain, T.; Ashad, M.; Islam, M.S. Optimum Design of a Grid Connected PV/Battery Hybrid System for Commercial Load in Bangladesh: Effects of PV, Battery, and Dispatch Strategies. In Proceedings of the International Conference on Mechanical, Industrial and Energy Engineering 2020 (ICMMIE2020), Khulna, Bangladesh, 19–21 December 2020. [Google Scholar]
Disclaimer/Publisher’s Note: The statements, opinions and data contained in all publications are solely those of the individual author(s) and contributor(s) and not of MDPI and/or the editor(s). MDPI and/or the editor(s) disclaim responsibility for any injury to people or property resulting from any ideas, methods, instructions or products referred to in the content. |
© 2023 by the authors. Licensee MDPI, Basel, Switzerland. This article is an open access article distributed under the terms and conditions of the Creative Commons Attribution (CC BY) license (https://creativecommons.org/licenses/by/4.0/).