Article

Effect of Microchannel Diameter on Electroosmotic Flow Hysteresis

1
Bioprocessing Technology Institute (BTI), Agency for Science, Technology and Research (A*STAR), 20 Biopolis Way, #06-01 Centros, Singapore 138668, Singapore
2
School of Mechanical and Aerospace Engineering (MAE), Nanyang Technological University (NTU), 50 Nanyang Avenue, Singapore 639798, Singapore
*
Author to whom correspondence should be addressed.
Energies 2023, 16(5), 2154; https://doi.org/10.3390/en16052154
Submission received: 1 February 2023 / Revised: 17 February 2023 / Accepted: 21 February 2023 / Published: 23 February 2023
(This article belongs to the Section J1: Heat and Mass Transfer)

Abstract

:
Electroosmotic flow (EOF) commonly involves inhomogeneous fluids in practical applications. EOF hysteresis, which is defined as direction-dependent flow behavior, has been extensively investigated for dissimilar solution pair systems. Hitherto, there is no investigation being conducted to examine the effect of microchannel diameter on the hysteresis phenomenon. In this investigation, current monitoring experiments and finite element numerical simulations were performed to examine the intensification of the hysteretic behavior with reduction in the microchannel diameter. Three solution pairs were selected for the study, namely KCl–NaCl (dissimilar ionic species with similar concentration), NaCl and KCl (similar ionic species but different concentrations) solution pairs, with microchannels of 5 μm and 100 μm internal diameters. EOF hysteresis augmentation for reduced channel diameter (i.e., 5 μm microchannel) is due to the coupling effect of the resultant wider/tighter interfacial width and the minority pH-governing ion-driven hysteresis, which was earlier discovered to be the origin of EOF hysteresis. This investigation provides an appropriate understanding of the channel dimensional effect on EOF behavior involving multiple fluids, and the outcomes can potentially be implemented on chemical and biological microfluidic systems with adjustable throughput.

1. Introduction

Electroosmotic flow (EOF) is produced via supplying an extrinsic electric field across a micro-/nanochannel. Negative channel wall charges are developed upon interaction with an aqueous fluid solution. This causes the positive and negative ions to be attracted and repelled, respectively, in the solution. The electrical double layer (EDL) formation arises because of the net positively charged layer. The nanometer thickness EDL will experience an electrical body force when an extrinsic electric field is supplied, which induces movement of it in the field direction. Consequently, the flow momentum is carried to the fluid in the bulk from the EDL due to viscous drag, and thus a velocity profile that is plug-like will be produced. Compared with the channel dimensions, the EDL thickness is thin and EOF velocity can be derived through the Helmholtz-Smoluchowski equation:
VEOF = −ζEɛoɛr/µ
where the wall electrostatic zeta potential, relative permittivity, free space permittivity, extrinsic supplied electric field and fluid viscosity are represented by ζ, εr, εo, E and µ, respectively. For a symmetric electrolyte, characterization of the thickness of EDL can be derived with the Debye length:
λD = [(Tkbɛrɛo)/(2coNae2z2)]1/2
where the Boltzmann constant, Avogadro constant, solution concentration, temperature, ion charge number and electron charge are represented by kb, Na, co, T, z and e, respectively.
EOF often involves inhomogeneous fluids in various micro/nanofluidic applications, such as electrokinetic transdermal drug delivery [1], fluid pumping and mixing of reagents (e.g., with utilization of sodium hydroxide (NaOH)) [2,3,4,5,6,7], particle/chemical species pre-concentration and separation [8,9,10]. Ion-conductive solid porous microneedles that are polymer-based (PMN) can improve iontophoresis with interconnected micropores and generate EOF for drug delivery, which enables efficient transdermal molecular extraction or penetration through the skin with direct applied current [1]. The application of electrohydrodynamic-driven fluid instabilities for lipid nanoparticle formation can facilitate efficient mixing and produce highly monodisperse nanoparticles by nanoprecipitation under precisely controlled reaction environments in channel dimensions of microscale [5,6].
Separation of double-stranded deoxyribonucleic acid (DNA) can be performed by employing EOF with polymer solutions, such as derivative celluloses and poly(ethylene oxide) (PEO) solutions, which controlling the EOF/electrophoretic mobility aids in the optimization of process speed and resolution [8]. Nguyen et al. [10] proposed a new principle of EOF-assisted electrokinetic preconcentration coupled with light-emitting diode-induced fluorescence (LEDIF) detection for channel electrophoresis (CE), with a 350-fold sensitivity improvement, as EOF modulation and suppression in the microchannels are enabled without the need of any dynamic/permanent channel coating [11,12] and imbedded/constructed nanostructures [13,14].
The electroosmotic displacement flow of fluids with dissimilar concentrations/conductivities has been widely investigated [15,16,17,18,19,20]. Ren et al. [15,16] described the EOF flow process of fluids with different conductivities (due to different concentrations) by the equivalent electrical circuit model. Tang et al. [17] developed theoretical expressions for the elucidation of current-time behavior and the fluid velocity interface during electroosmotic displacement flow with several fluids of dissimilar conductivity ratios. Mampallil et al. [18] derived a theoretical model to curve-fit the EOF current-time response of two fluids for the measurement of the microchannel surface charge. Hussain et al. [19] performed EOF of multiple fluids with several channel configurations, and their investigation demonstrated the suitability of jet-shaped geometry for multiple phase flows. Mekheimer et al. [20] studied the alternating current (AC) EOF of two types of nanofluids suspended with copper- or blood-mediated gold nanoparticles, which can be employed for thermotherapy of oncology as a drug agent. As demonstrated by the aforesaid examples [15,16,17,18,19,20], EOF involving multiple fluid types is crucial in practical systems and applications.
Electroosmotic displacement flow for systems with dissimilar types of fluids demonstrates experimentally hysteretic behavior, which the flow velocity for one fluid displacing the other fluid is influenced by the direction of displacement. The phenomenon is coined as EOF hysteresis, whereby the EOF velocity/flow rate is influenced by the variation of the solution content with the interplay between the migration of ions, distribution of electric field and driving flow. Knowledge regarding the EOF hysteresis effect is necessary for accurate and correct interpretation of experimental results.
EOF hysteresis involving dissimilar ion species has been studied [21,22,23]. EOF hysteresis for systems with different cation species [21] was found to be caused by the focusing/broadening of interfacial width because of solution conductivity differences, and the evolutions of the ion concentrations which results in the dissimilar flow velocities/rates for different flow directions. EOF hysteresis for systems with different anion species [22] was discovered to exhibit an interesting behavior, i.e., full displacement is not achievable, which is caused by the ion concentration variations as a result of the anions migrating against the EOF, as well as induced concentration evolutions because of the diffusive interface near the microchannel inlet. For dissimilar anion species system with solution pair of substantial pH difference [23], complete displacement is made possible by lowering the low pH solution concentration, while altering the high pH solution concentration has negligible effect.
EOF hysteresis for similar ionic species solution pair with different concentrations was also observed [24] and investigated [25,26]. Through numerical simulations, the hysteresis phenomenon was counterintuitively discovered to be caused by the imbalance of electromigrative fluxes that leads to the minority pH-governing ions to accumulate/deplete [25]. This causes variations of the solution pH, zeta potential and flow rate/velocity according to the displacement flow directions, while the pH variations occurring in the microchannel were quantified with experimentations involving pH-sensitive dye [26]. Li et al. [27] had confirmed the mechanics via incorporation of surface complexation reaction equations, carbonate equilibrium and proton transport to their semi-analytical model, which can reflect the EOF hysteretic behavior.
Although EOF hysteresis has been extensively investigated for dissimilar solution pair types and systems [21,22,23,24,25,26], there has yet been any investigation being carried out to study the microchannel dimensional effect on the hysteresis phenomenon, which is a fundamental microfluidic problem that involves the science of multiple fluid transportation through microchannel. There are numerous studies on the effect of microchannel dimension on single EOF flow [28]. However, the main novelty of the chosen investigation is the fact that the microchannel dimensional effect has not been realized, comprehended or investigated for EOF hysteresis (newly coined phenomenon) involving two fluids, whereby the EOF velocity/flow rate of the displacement flow is not only influenced by the variation of the solution content with the interplay between the migration of ions, distribution of electric field and driving flow, but is also influenced by the size of the microchannel diameter.
In this investigation, experiments based on the current monitoring technique and numerical simulations based on finite element method (FEM) were carried out for the examination of the hysteretic behavior of EOF with relation to the reduction in the microchannel diameter. This investigation allows a proper comprehension of the impact of microchannel dimensions on the precise EOF manipulation involving inhomogeneous fluids, and the research outcomes are conceivably extendable to practical chemical and biological applications [29,30,31] with adjustable throughput.

2. Experimental Setup, Materials and Procedures

EOF displacement behavior was observed with current monitoring method [21,22,23,24,25,26]. The applied voltage of 1000 V was provided by a power supply (CZE1000R, Spellman, Hauppauge, NY, USA). The change in current along the microfluidic channel is observed by a picoammeter (Keithley 6485, Tektronix, Singapore) in series connection. The current and voltage were controlled and recorded with a program written by Labview and a data acquisition card (PCI-6052E, National Instrument, Austin, TX, USA). Figure 1 shows the current monitoring experiment setup.
In this investigation, three solution pairs were selected, namely 0.5 mM potassium chloride (KCl)–sodium chloride (NaCl) (dissimilar ionic species with similar concentration), 0.5 mM–0.6 mM NaCl and 0.2 mM–1 mM KCl (similar ionic species but different concentrations) solution pairs, for current monitoring experiments to study the channel diameter effect on the EOF hysteresis behaviour (see Figure 1).
Microchannels of 5 μm and 100 μm internal diameters were employed for the investigation. For the previous studies of different EOF hysteresis systems [21,22,23,24,25,26], the commonly employed microchannel internal diameter size is 100 μm, which sizes below that are rarely encountered due to difficulties such as pumping of fluid into the microchannel. The influence on EOF hysteresis behavior should be gradual as the channel diameter decreases beyond the typical size of 100 μm. The hysteresis effect will be affected more if the channel diameter decreases less than 5 μm. However, it will be extremely difficult to manually pump fluid into microchannels with diameters less than 5 μm for the initialization of experiments. Hence, microchannels with 5 μm and 100 μm internal diameters were selected to demonstrate distinguishably (and sufficiently) the impact reducing the channel diameter has on the hysteresis phenomenon.
The 0.01 M KCl and NaCl stock solutions were made by using the deionized (DI) water to dissolve the powder-formed salts (Sigma-Aldrich, Saint Louis, MO, USA). By performing further dilution, the required concentrations of electrolyte solutions were made. The measured properties of solution such as the pH and conductivity were performed with a a pH meter (Mettler Toledo, FiveEasy plus, Singapore) and a conductivity meter (IONCheck 65, Radiometer Analytical, Loveland, CO, USA), respectively. Table 1 shows the solution properties.
Polyimide-coated flexible fused silica microchannels (Polymicro Technologies, Phoenix, AZ, USA) of 5 μm, and 100 μm internal diameters were cut by a Shortix Column Cutter (SGT Ltd., Singapore) into 8 cm length. The microchannels were first flushed with acetone. Subsequently, deionized (DI) water was used for flushing the channels, and the experimental solutions were filled in the channels. The microchannel was placed in between two fluid reservoirs (2 cm diameter and depth) made of Telfon (see Figure 1).
The fluid level variations during the displacement flow were insignificant with the employment of large-sized reservoirs, which reduced the back pressure due to the difference in fluid levels of the two reservoirs [32]. The large reservoirs also prevented electroosmotic displacement flow to be affected by the local variations of pH through diluting the hydrogen (H+) and hydroxide (OH) ion concentrations generated because of electrolysis at electrodes [33]. Further precaution to avoid unnecessary pH variations was carried out by placing the electrodes far (approximately 2 cm) from the channel inlet and outlet [34].
In order to reveal the EOF hysteresis behavior, the current-time behaviors in two opposite flows were compared. For example, for the 0.5 mM KCl–NaCl solution pair, EOF of 0.5 mM KCl → 0.5 mM NaCl (flow direction indicates by arrow) and 0.5 mM NaCl → 0.5 mM KCl were carried out. The anode reservoir contained the displacing solution for replacing the residing solution originally inside microchannel; the cathode contained the residing solution. Five experimental runs were performed for a specific solution pair, microchannel diameter and displacement flow direction, so as to ensure consistency and reliability of results.
Joule heating effect is insignificant in this investigation due to the low concentrations/conductivities of the electrolyte solutions [35]. The joule heating effect can be conservatively estimated by considering the equilibrium of generation energy Eg and energy capacity ∆Ecap, and the methodology with derivation is detailed in the research of Arulanandam and Li [36]. The worst-case experimental condition with external supplied electric field = 125 V·cm−1, conductivity of solution for 1 mM KCl (highest solution conductivity) = 147.9 µS·cm−1, diameter of channel = 100 µm and duration of experiment (longest) = 300 s has a predicted increase of 0.06 °C in temperature, which is inconsequential.

3. Numerical Simulation

3.1. Governing Equations

This investigation employed the Poisson–Nernst–Planck (PNP) model [21,22,24] to elucidate the hysteresis behavior with relation to the reduction in the microchannel diameter during EOF of two fluids. The model takes into consideration the variation of the electric field (arising from the solution conductivity difference) and the movement of the main constituent ionic species under the effects of diffusion, convection and electromigration. The variation in zeta potential at the channel wall is enabled by setting a constant value for the surface charge density.
The PNP model is formulated with several governing equations [21,22,24]. Laplace equation is responsible for the applied electric potential φ, and takes into consideration of the electric field variation:
∇·(σφ) = 0
where the solution conductivity, ion charge number, Faraday constant, concentrations and mobilities of ionic species are represented by σ = F∑cium(i)zi, zi, F, ci and um(i), respectively.
Poisson equation governs the microchannel wall electrostatic potential distribution ψ:
∇·∇ψ = −ρe/(ɛrɛo)
where the net charge density is represented by ρe = Fcizi. The zeta potential variation is enabled with a prescribed wall surface charge of constant density, which the zeta potential varies with the solution concentration.
Nernst–Planck (NP) equation consists of the diffusion, convection and electromigration gradient fluxes, which describes the ion species concentration variation:
∂ci/∂t + ∇·[−Dicium(i)ciφ] = −v·∇ci
where the velocity of fluid and ion diffusion coefficient are represented by v and Di, respectively.
An incompressible Newtonian fluid flow is described by the Navier–Stokes (NS) and continuity equations:
ρ∂v/∂t = −∇p + µ2v + ρe[−∇(φ)]
∇·v = 0
where the fluid viscosity, density and pressure are represented by µ, ρ and p, respectively. In microfluidics, Stokes flow can be assumed with the inertial term being ignored, as less than 1 Reynolds number is typical. Table 2 presents the values of constants adopted for simulations.

3.2. Simulation Domain

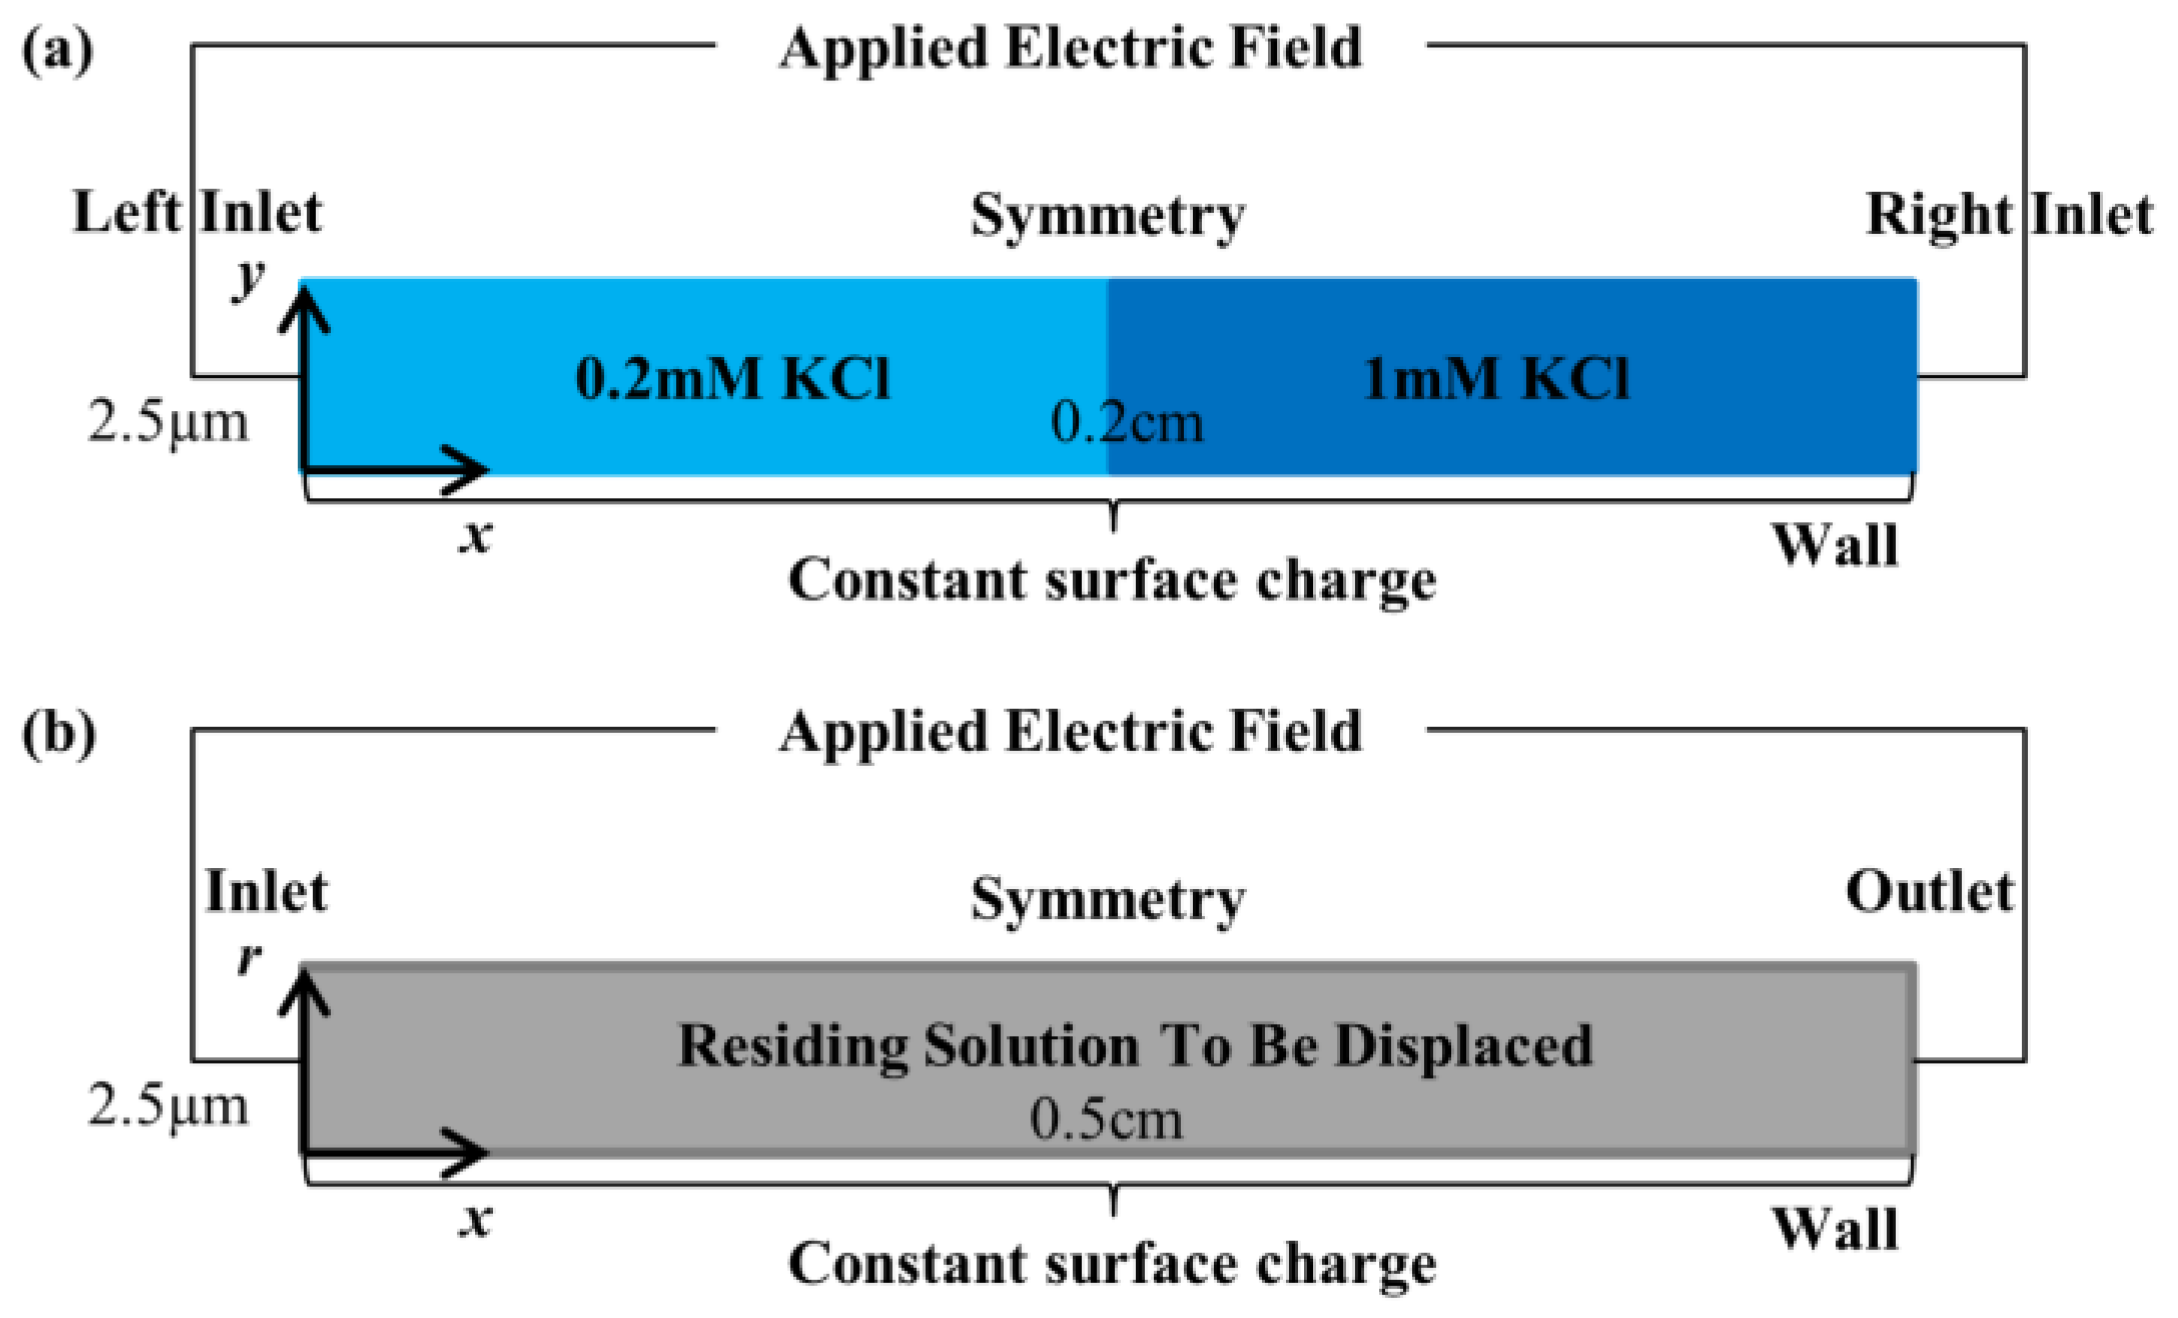
Simulations were performed on finite element COMSOL Multiphysics software with the governing equations in Section 3.1. To examine if the reduction in channel diameter results in ionic distribution variations that affect EOF hysteresis behavior, three simulation cases for 0.2 mM–1 mM KCl solution pair of 5 μm diameter microchannel and 0.2 cm length (see Figure 2a) were modeled, whereby the convective term in the NP equation (see Equation (5)) was removed along with the governing equations that are related to convection (NS and continuity equations, see Equations (6) and (7)). The 1 mM KCl and 0.2 mM KCl initially reside in the right and left halves of the domain for the simulation (see Figure 2a).
The three simulation cases were the pure diffusion and the applied electric field cases. No electric field is supplied along the domain (see Figure 2a) for the pure diffusion case. To supply 125 V·cm−1 electric field, a voltage of 25 V was set on the left inlet for 0.2 mM KCl displacing 1 mM KCl, and on the right inlet for the opposite displacement flow. Constant surface charge of −4.16 mC·m−2 (assumed average value for the two solutions) was set on the wall boundary.
Full simulations of EOF of 0.2 mM–1 mM KCl solution pair for 5 μm diameter and 0.5 cm length microchannel, with the convective term in the NP equation (see Equation (3) and the convective-related equations (NS and continuity equations, see Equations (4) and (5)) included, were also performed in two displacement flow directions to investigate in depth the mechanics of the channel diameter-dependent hysteresis behavior. The solution to be displaced initially resides (see Figure 2b) in the microchannel (either 1 mM KCl or 0.2 mM KCl). The 62.5 V voltage was supplied at the left inlet for setting up 125 V·cm−1 electric field. Zero pressures are set at the inlet and outlet.
The boundary conditions of the inlets were modified by ramping in 0.01 s (an arbitrarily short time) for solving the time-dependent solutions with the governing equations (Equations (3)–(7)) in Section 3.1. The boundary conditions set for the simulations are shown in Table 3.
The domain for simulations without the convective term and equations (see Figure 2a) was meshed with 400 and 24 edge elements in the axial and radial directions (9600 quadrilateral elements), respectively, while the domain for full simulations (see Figure 2b) was meshed with 1000 and 24 edge elements in the axial and radial directions (24,000 quadrilateral elements), respectively. The size of the element changes exponentially in the radial direction. This makes sure that the EDL elements were sufficiently meshed for capturing the variable changes which were steep. The ion concentrations, electrostatic wall potential and applied electric potential adopted second-order elements for discretization, while the fluid velocity and pressure adopted linear elements for discretization.
Mesh elements of higher numbers were selected for the convergence test, which was performed based on steady-state solutions. The chosen mesh type and number was found to have numerical error less than 1%, which would be negligible. For subsequent iterations, relative tolerance was set to be below 0.01 as the convergence criterion. The total simulated time was 14 s, with the maximum integration time step set as 0.05 s.

4. Results and Discussion

4.1. Dissimilar Ionic Species System: KCl–NaCl Solution Pair

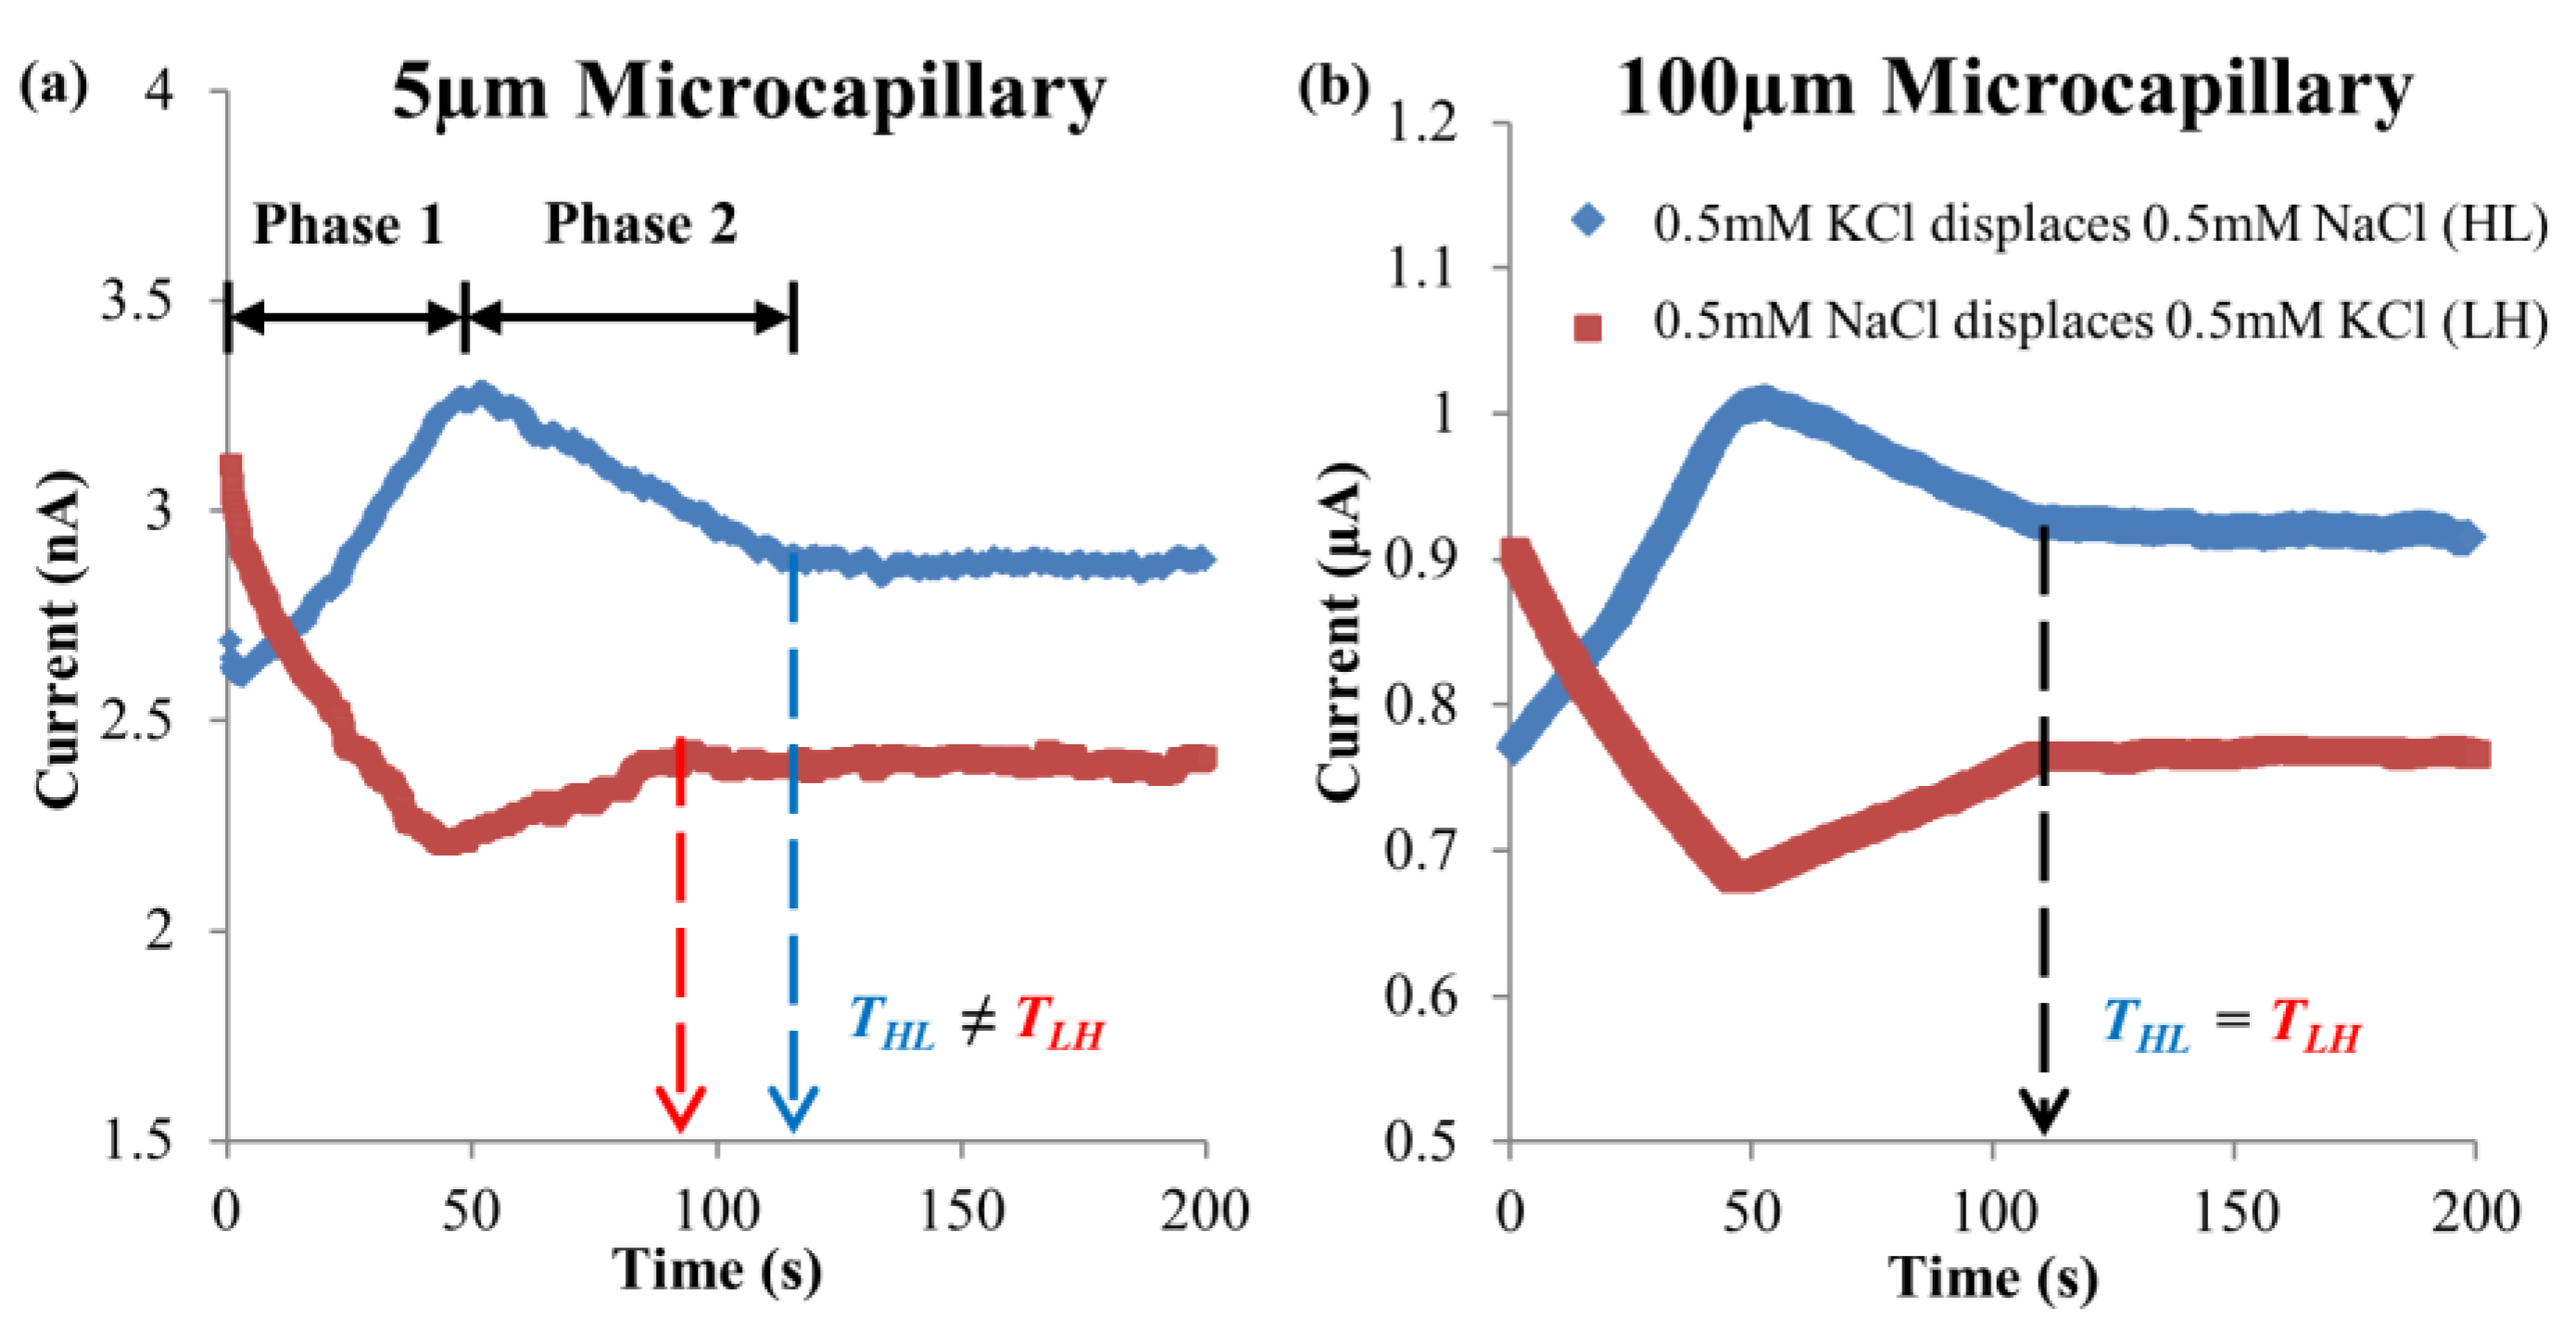
The current-time responses for EOF of 0.5 mM KCl–NaCl solution pair at 125 V∙cm−1 electric field for microchannels with 5 μm and 100 μm internal diameters are shown in Figure 3a and Figure 3b, respectively. Differing from the conventional displacement flow with dissimilar concentrations, an abrupt change of gradient was observed for the dissimilar ionic species system. With the change of current gradient, the displacement process for such system was separated into two phases [21,22,23], namely Phases 1 and 2 (see Figure 3). Phase 1 involved the evolution of the ion concentration distributions of the displacing fluid due to cation migration, while Phase 2 involved the EOF of different concentration-displacing fluids, after the original residing fluid had been completely displaced.
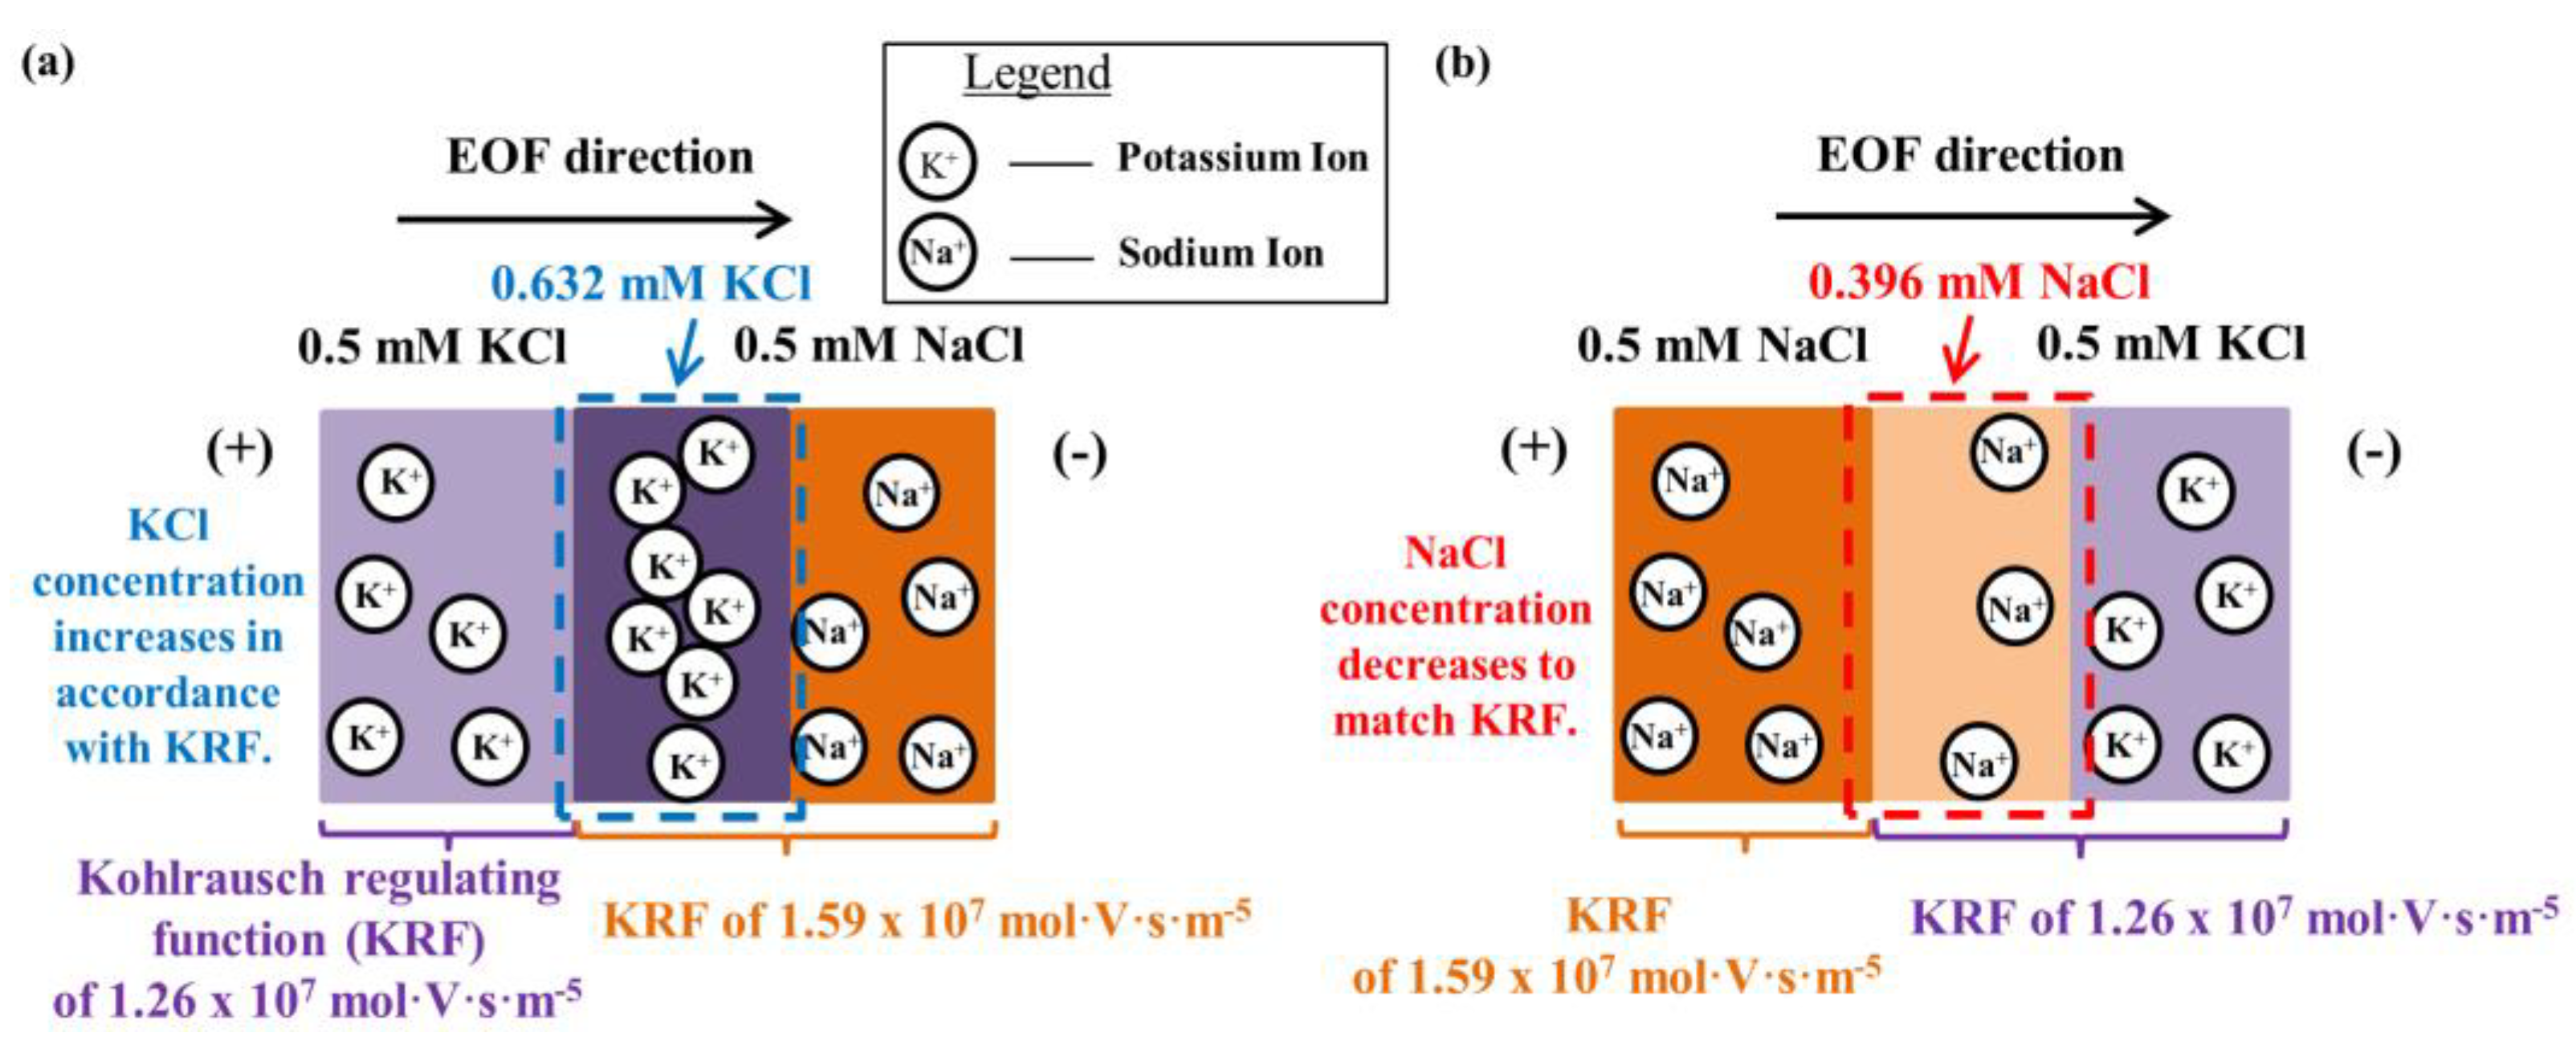
For Phase 1, the currents were observed to increase and decrease for KCl NaCl (EOF direction is indicated via the arrow) and NaCl KCl, respectively (see Figure 3). The current variation is due to the evolution of the ion concentration distributions during the displacement process. Prediction of the concentration change can be made by the Kohlrausch regulating function (KRF) [22,23,38], whereby both the electroneutrality and current continuity are satisfied as follows:
KRF(X) = ∑[zici(X,T)/um(i)]
where ci is the concentration of ions as a function of channel axial coordinate X and time T.
KRF values of 0.5 mM KCl and 0.5 mM NaCl are 1.26 × 10⁷ mol·V·s·m−5 and 1.59 × 10⁷ mol·V·s·m−5, respectively. Cations migrate in the direction of EOF. For 0.5 mM KCl → 0.5 mM NaCl, the K+ migration causes variation of the KCl concentration (see Figure 4a). The KCl concentration is raised from 0.5 mM to 0.632 mM in accordance with 0.5 mM NaCl KRF (KCl concentration is calculated from 0.5 mM NaCl KRF, K+ and Cl ion mobilities from Table 2, see Equation (8)), which Phase 1 saw a resultant current increase (see Figure 3).
When 0.5 mM NaCl → 0.5 mM KCl, it is the migration of Na+ that causes the concentration variation of NaCl (see Figure 4b). The concentration of NaCl is reduced from 0.5 mM to 0.396 mM to fit the KRF of 0.5 mM KCl (the NaCl concentration is calculated from 0.5 mM KCl KRF, Na+ and Cl ion mobilities from Table 2, see Equation (8)). Thus, for Phase 1, it was observed that the current decreased (see Figure 3).
The original residing fluid was flushed out completely at the end of Phase 1. Different concentration displacing fluids were formed along the fluidic channel for two displacement directions.
In Phase 2 of KCl → NaCl, EOF of 0.5 mM KCl and 0.632 mM KCl (increased concentration) occurred, and a decrease in the current was detected (see Figure 3). As for Phase 2 of NaCl → KCl, EOF of 0.5 mM NaCl and the reduced concentration of 0.396 mM NaCl happened, and a current increase was realized (see Figure 3). When the displacing fluid completely replaced the fluid in the microchannel, the conductivity and hence the current became constant. When the current reached a stable value, the displacement time could be determined.
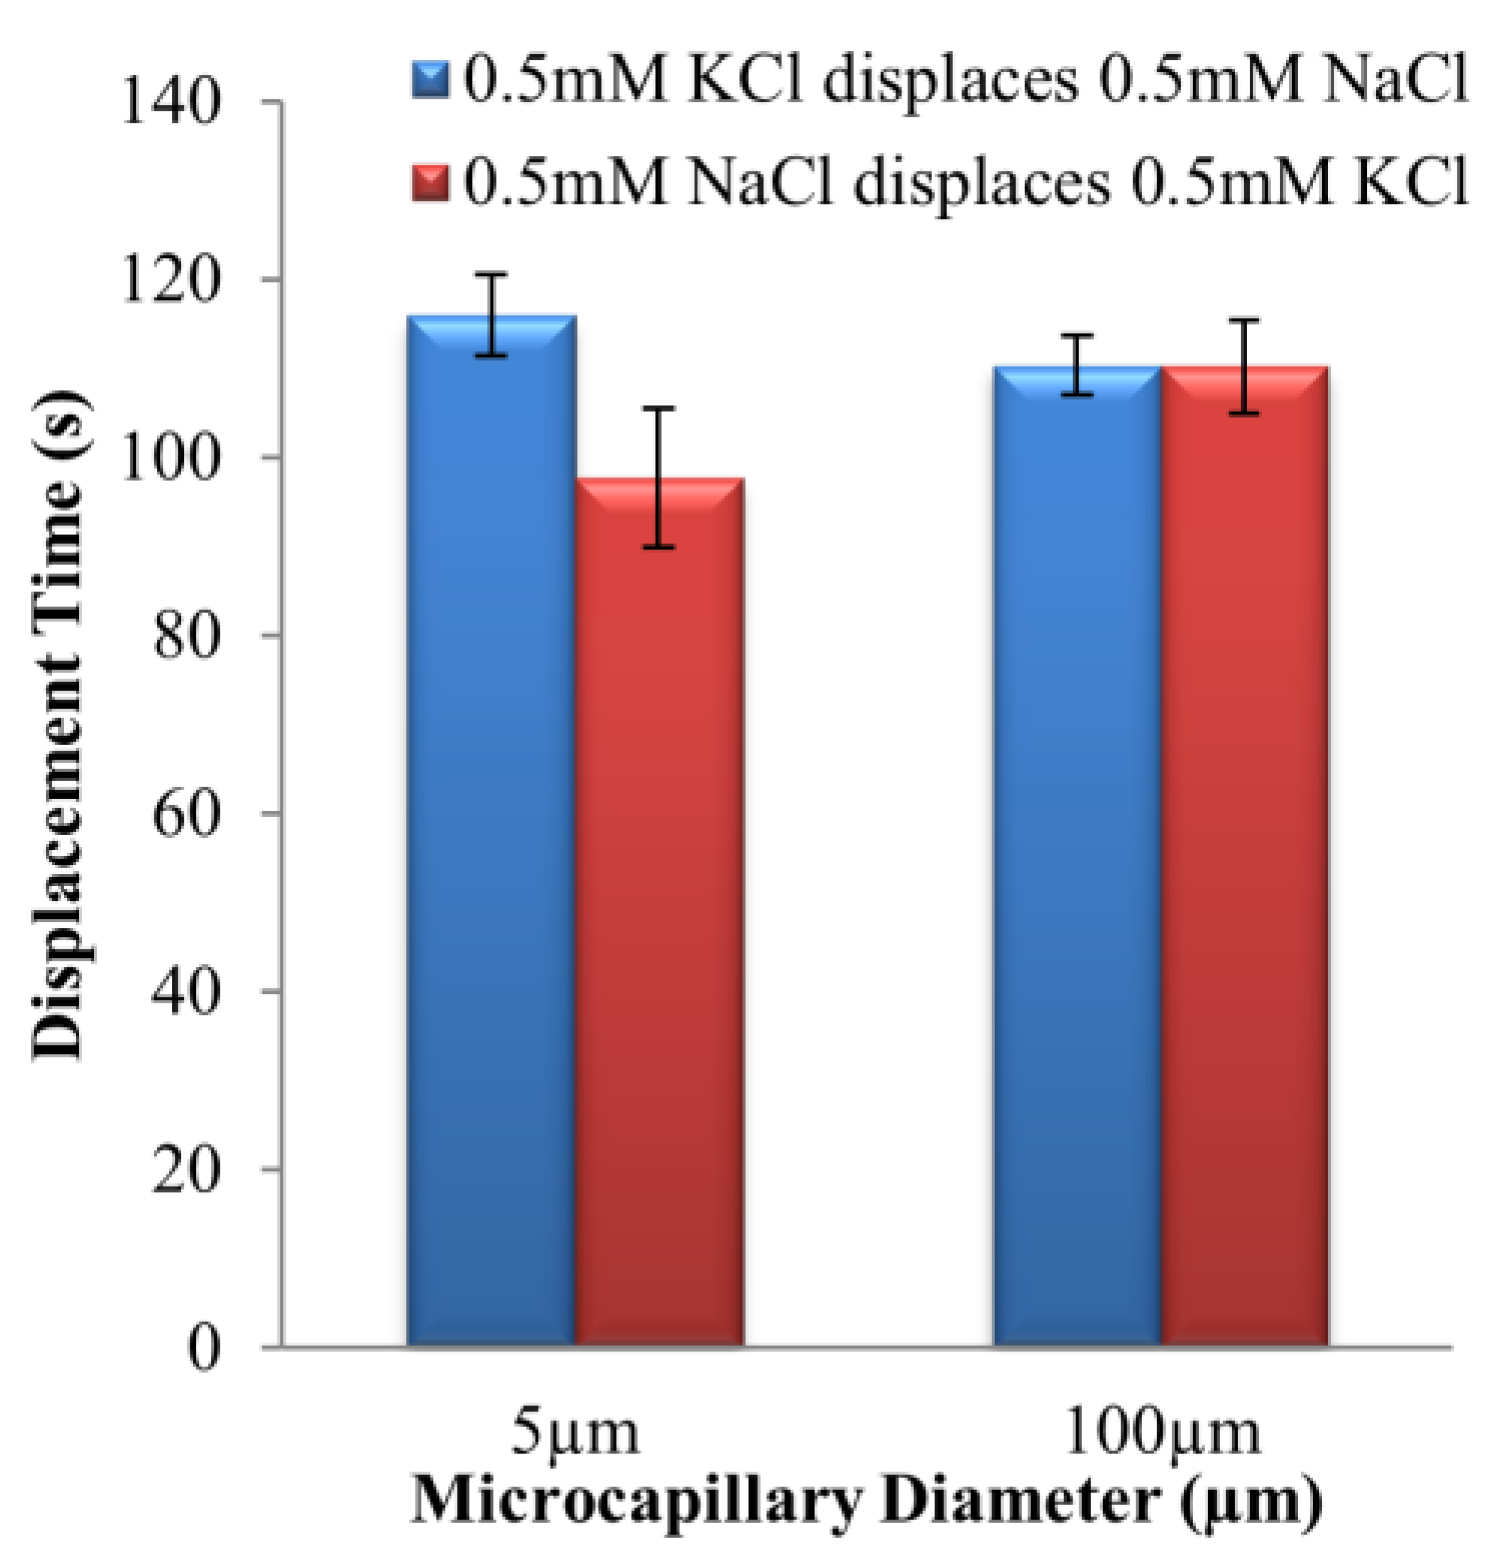
The displacement times of 0.5 mM KCl–NaCl solution pair for two displacement flow directions in microchannels with 5 μm and 100 μm internal diameters are shown in Figure 5.
Student’s t-test was conducted to check whether the times for complete displacements of the two different directions differ significantly for both 5 μm and 100 μm microchannels. Let THL be the displacement time for high conductivity (or high concentration) solution displacing low conductivity (or low concentration) solution, and TLH be the displacement time for low conductivity (or low concentration) solution displacing high conductivity (or high concentration) solution. The null hypothesis Ho suggests that THL is the same as TLH, while the alternative hypothesis H1 suggests otherwise. The t-score is calculated by the following:
ts = [TLH(Mean) − THL(Mean)]/[(sLH2/n) − (sHL2/n)]1/2
where n is the sample number, THL(Mean), TLH(Mean), sHL and sLH are the means of samples and standard deviations of THL and TLH, respectively.
The sample size was 5 for each flow direction. For the t-score, it has degrees of freedom (dof) 8. In a two-tailed test, with 1% significance level, the critical t-scores are ±3.36. The calculated t-scores (calculated with data from Figure 5 and Equation (9)) can be found in Table 4.
For 100 μm microchannel, the difference of the displacement times between the two direction flows was not statistically significant according to the t-scores in Table 4. However, for 5 μm microchannel, the likelihood for the time difference observed to be influenced by random error was less than 1% (very small), and rejection of Ho can be presumed. Therefore, the displacement times in the two directions were indeed different in the 5 μm microchannel, but not the case for 100 μm microchannel.
EOF hysteretic behavior, which can be characterized through the displacement time difference, was not observed for 100 μm microchannel (see Figure 3b and Figure 5). On the contrary, for 5 μm microchannel, the displacement time difference for 0.5 mM KCl → 0.5 mM NaCl was 18.6 ± 9.4% longer as compared to the opposite direction displacement flow. The results clearly reveal that microchannel diameter is a prominent factor in augmenting EOF hysteresis.

4.2. Dissimilar Concentration System—NaCl and KCl Solution Pairs

As discovered in Section 4.1, channel diameter plays a role in the augmentation of EOF hysteresis for dissimilar ionic species system, i.e., KCl–NaCl solution pair. The displacement process was divided into two phases, which were Phases 1 and 2. Phase 1 involved the evolution of the ion concentration distributions of the displacing fluid due to cation migration, while Phase 2 involved the EOF of displacing fluids with different concentrations (where the currents/conductivities differ by ~20%), after the original residing fluid had been fully displaced.
The hysteretic behavior (displacement time difference) was observed during Phase 2 of the displacement process for a dissimilar ionic species system with reduced microchannel diameter, i.e., 5 μm microchannel. For further validation, a similar ionic species solution pair with different concentrations was employed for experimentation. To match the conductivity difference during Phase 2 of the different ionic species system for the displacing solution concentration evolutions, a 0.5 mM–0.6 mM NaCl solution pair was chosen for the experimental validation with 20.0 ± 1.8% difference in the conductivities (see Table 1).
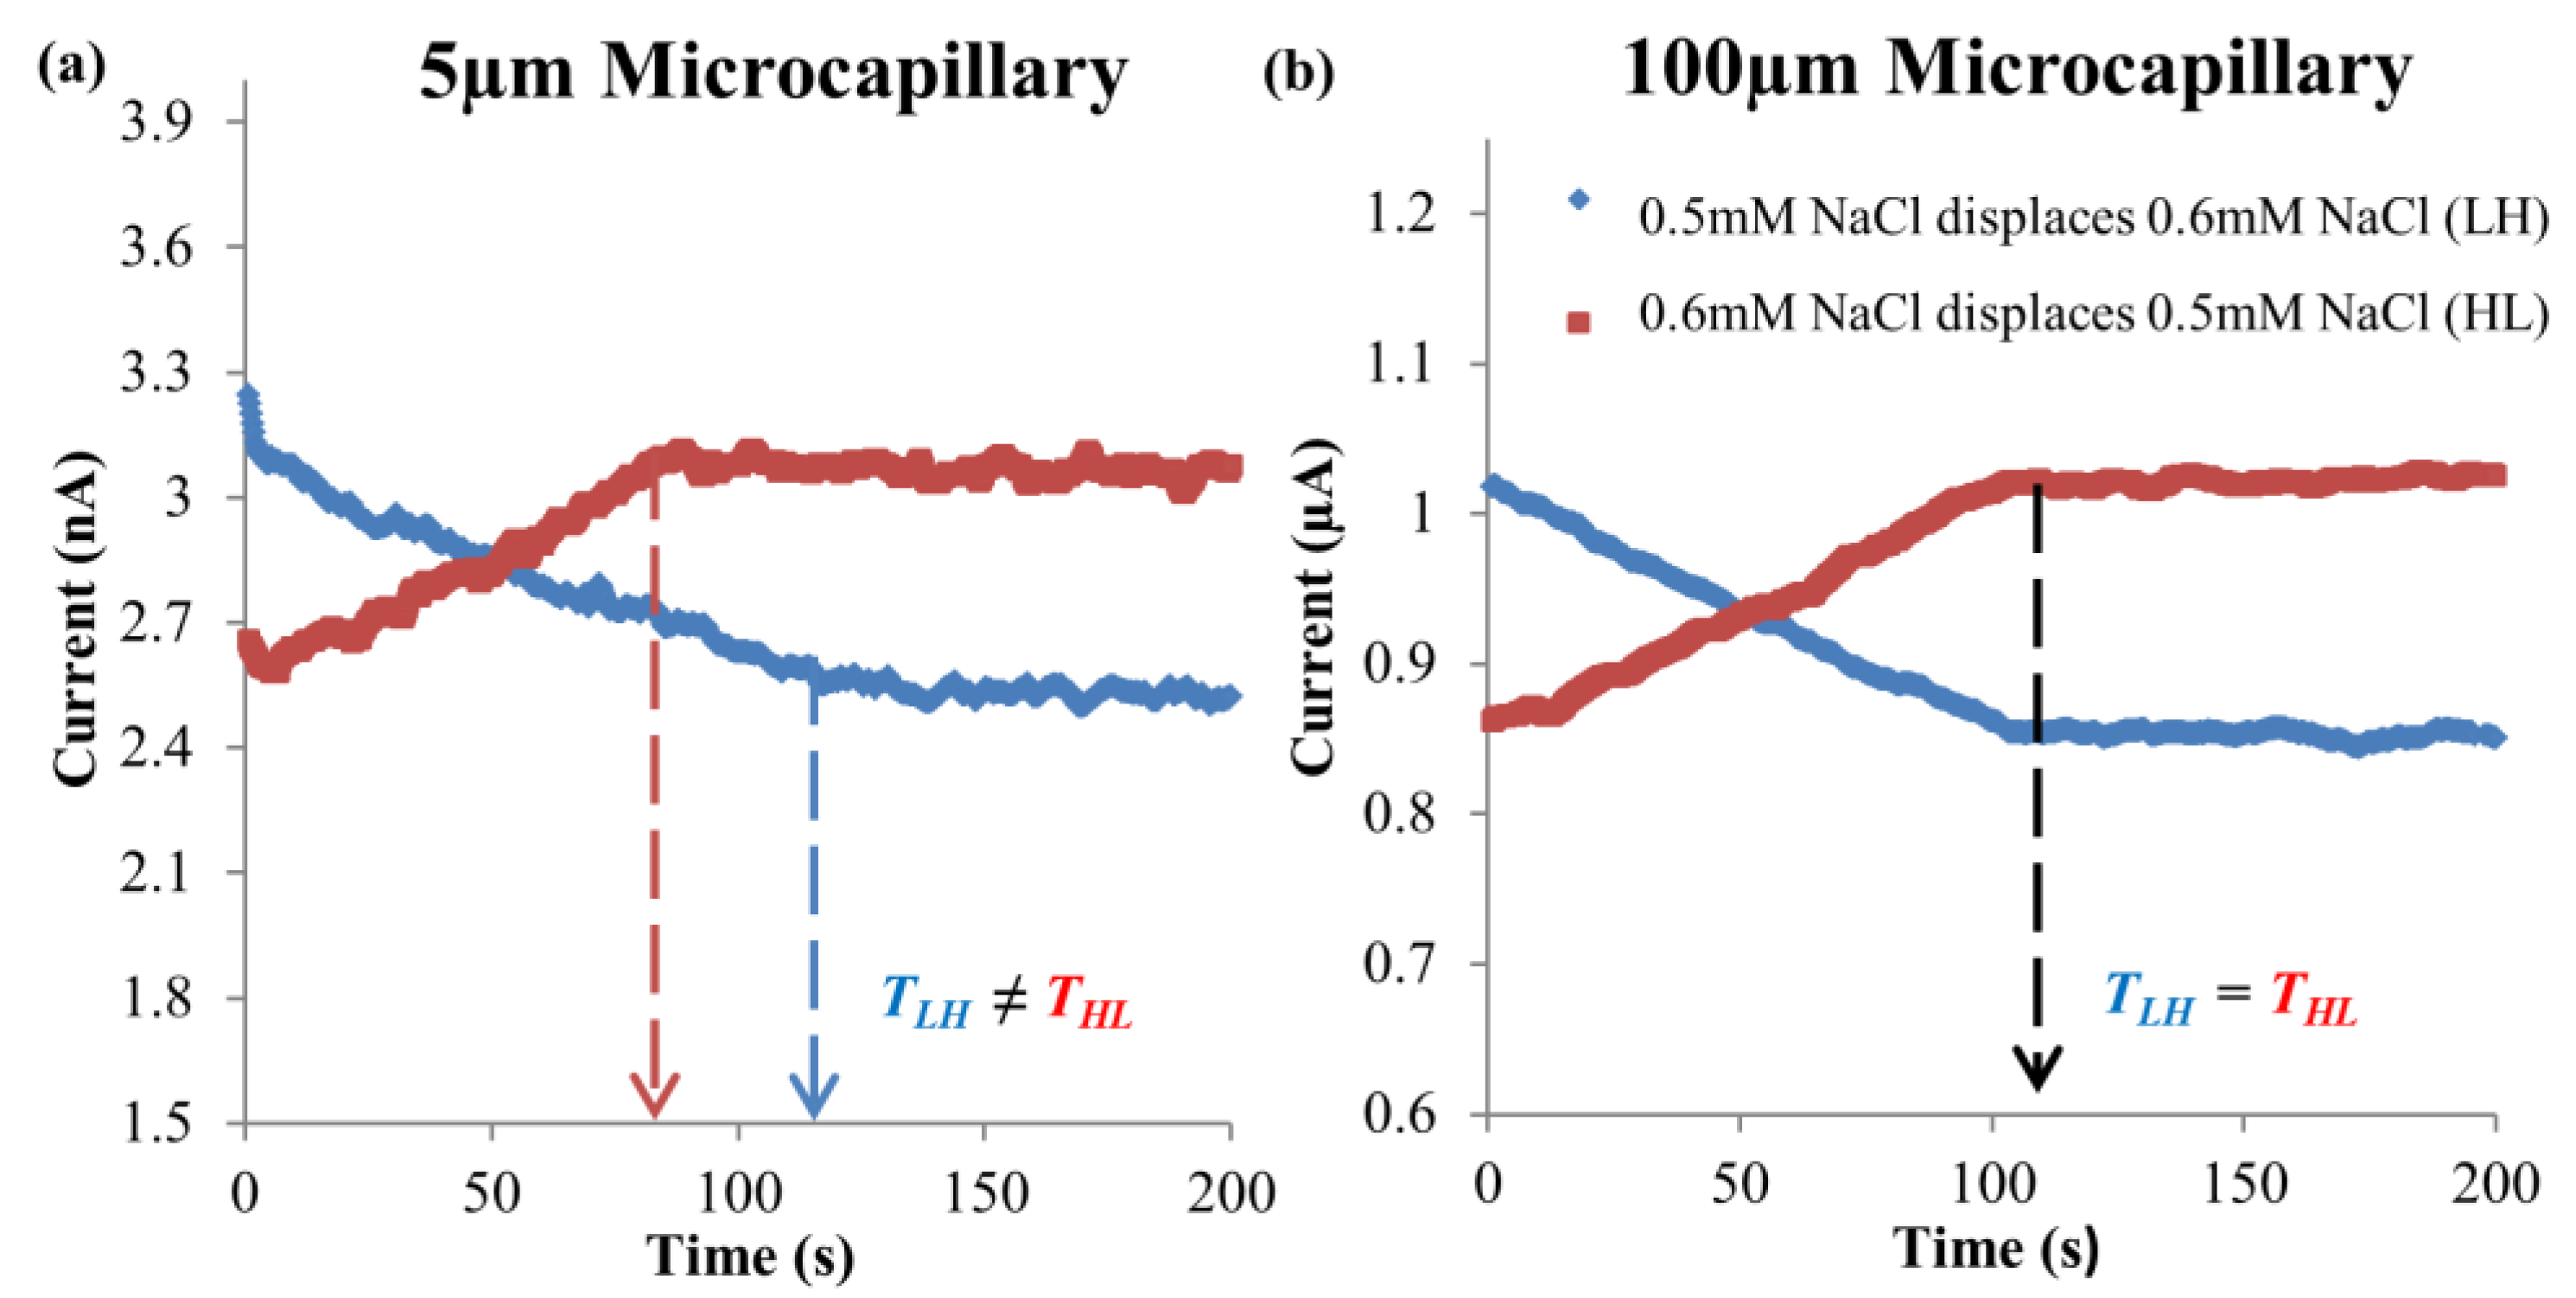
The current-time curves for EOF of 0.5 mM–0.6 mM NaCl solution pair at 125 V∙cm−1 electric field in microchannels with 5 μm and 100 μm internal diameters are shown in Figure 6a and Figure 6b, respectively. For 0.5 mM NaCl → 0.6 mM NaCl, the current decreased due to the low conductivity 0.5 mM NaCl displacing the high conductivity 0.6 mM NaCl (see Table 1). The current then became constant after the displacing fluid had completely displaced the residing fluid (see Figure 6). As for 0.6 mM NaCl → 0.5 mM NaCl, the current increased because of the high conductivity 0.6 mM NaCl displacing the low conductivity 0.5 mM NaCl (see Table 1), which stabilized after full displacement of the original residing fluid (see Figure 6).
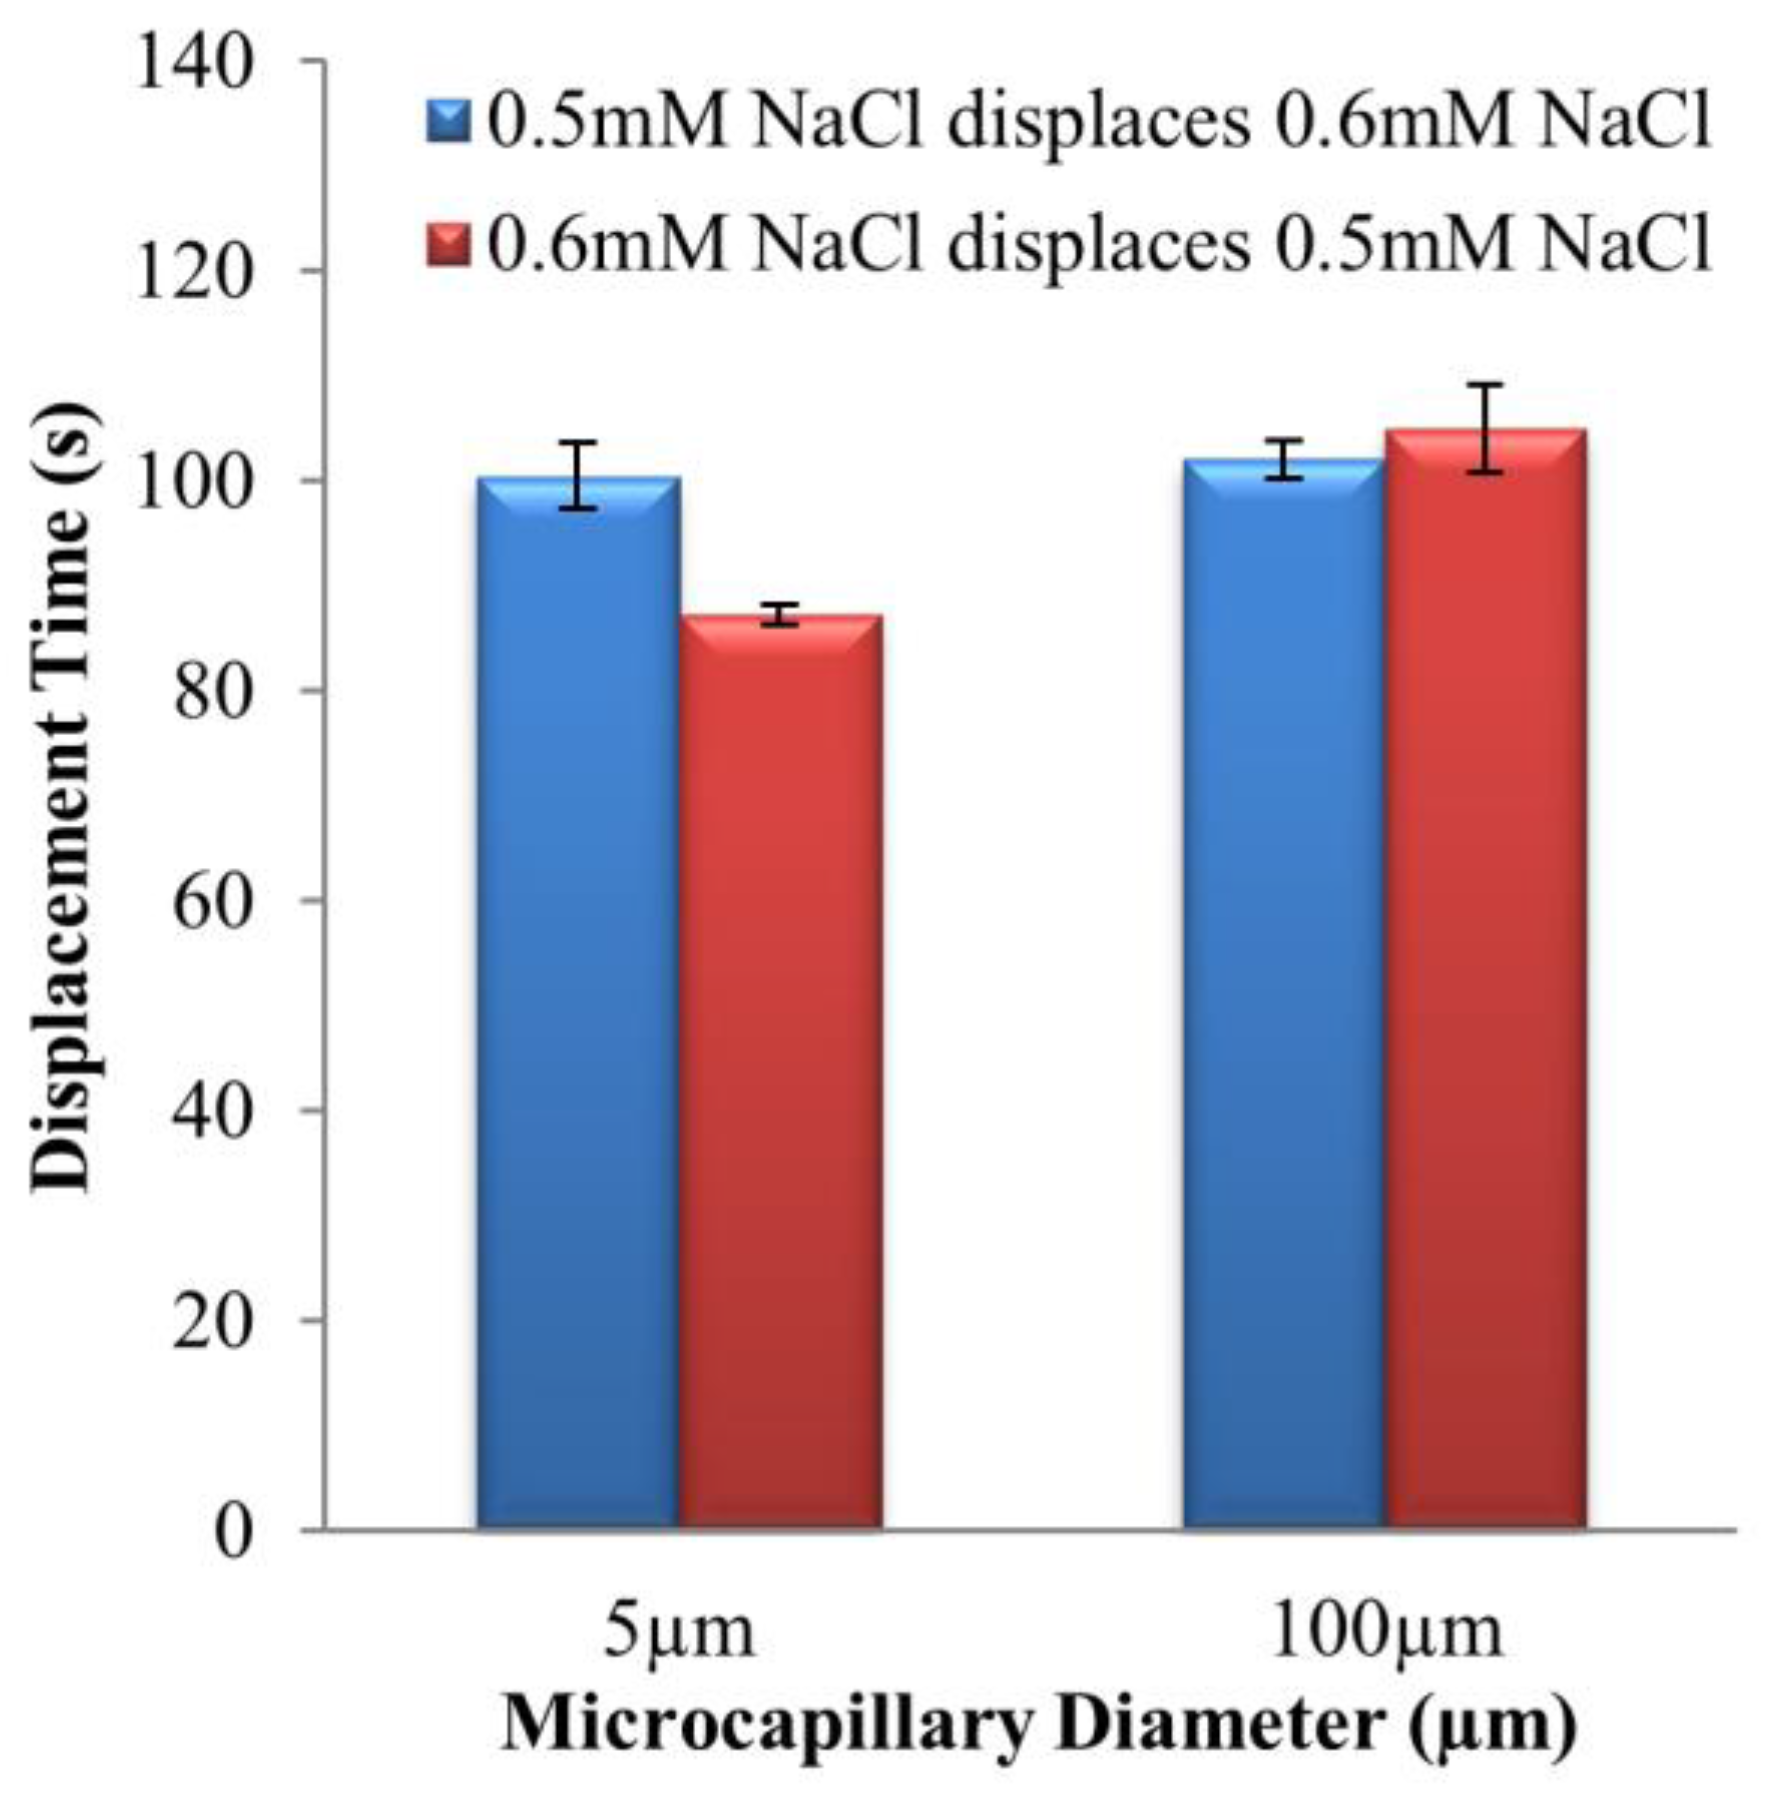
The times of complete displacements for 0.5 mM–0.6 mM NaCl solution pair in two flow directions with microchannels of 5 μm and 100 μm internal diameters are shown in Figure 7.
Similar to Section 4.1, Student’s t-test was carried out to examine if the displacement time different is significant between the two flow directions for 5 μm and 100 μm microchannels. Table 5 shows the calculated t-scores (calculated with data from Figure 7 and Equation (9)). The Student’s t-test similarly demonstrated that the time difference for the two displacement directions is significant statistically in 5 μm microchannel, and otherwise for 100 μm microchannel.
From previous findings [24,25,26], hysteresis behavior for a similar ionic species solution pair with different concentrations can only be observed when the conductivity difference is sufficiently large, i.e., >40%. The conductivity difference for 0.5 mM–0.6 mM NaCl solution pair was 20.0 ± 1.8%. Hence, as expected, the displacement times for 0.5 mM NaCl → 0.6 mM NaCl, and 0.6 mM NaCl → 0.5 mM NaCl were almost identical for 100 μm microchannel. On the contrary, for 5 μm microchannel, the time of displacement for 0.5 mM NaCl → 0.6 mM NaCl was 15.1 ± 3.7% longer than the opposite direction displacement flow. This has demonstrated that reducing the microchannel diameter leads to the intensifying of EOF hysteresis for similar ionic species solution pair with different concentrations.
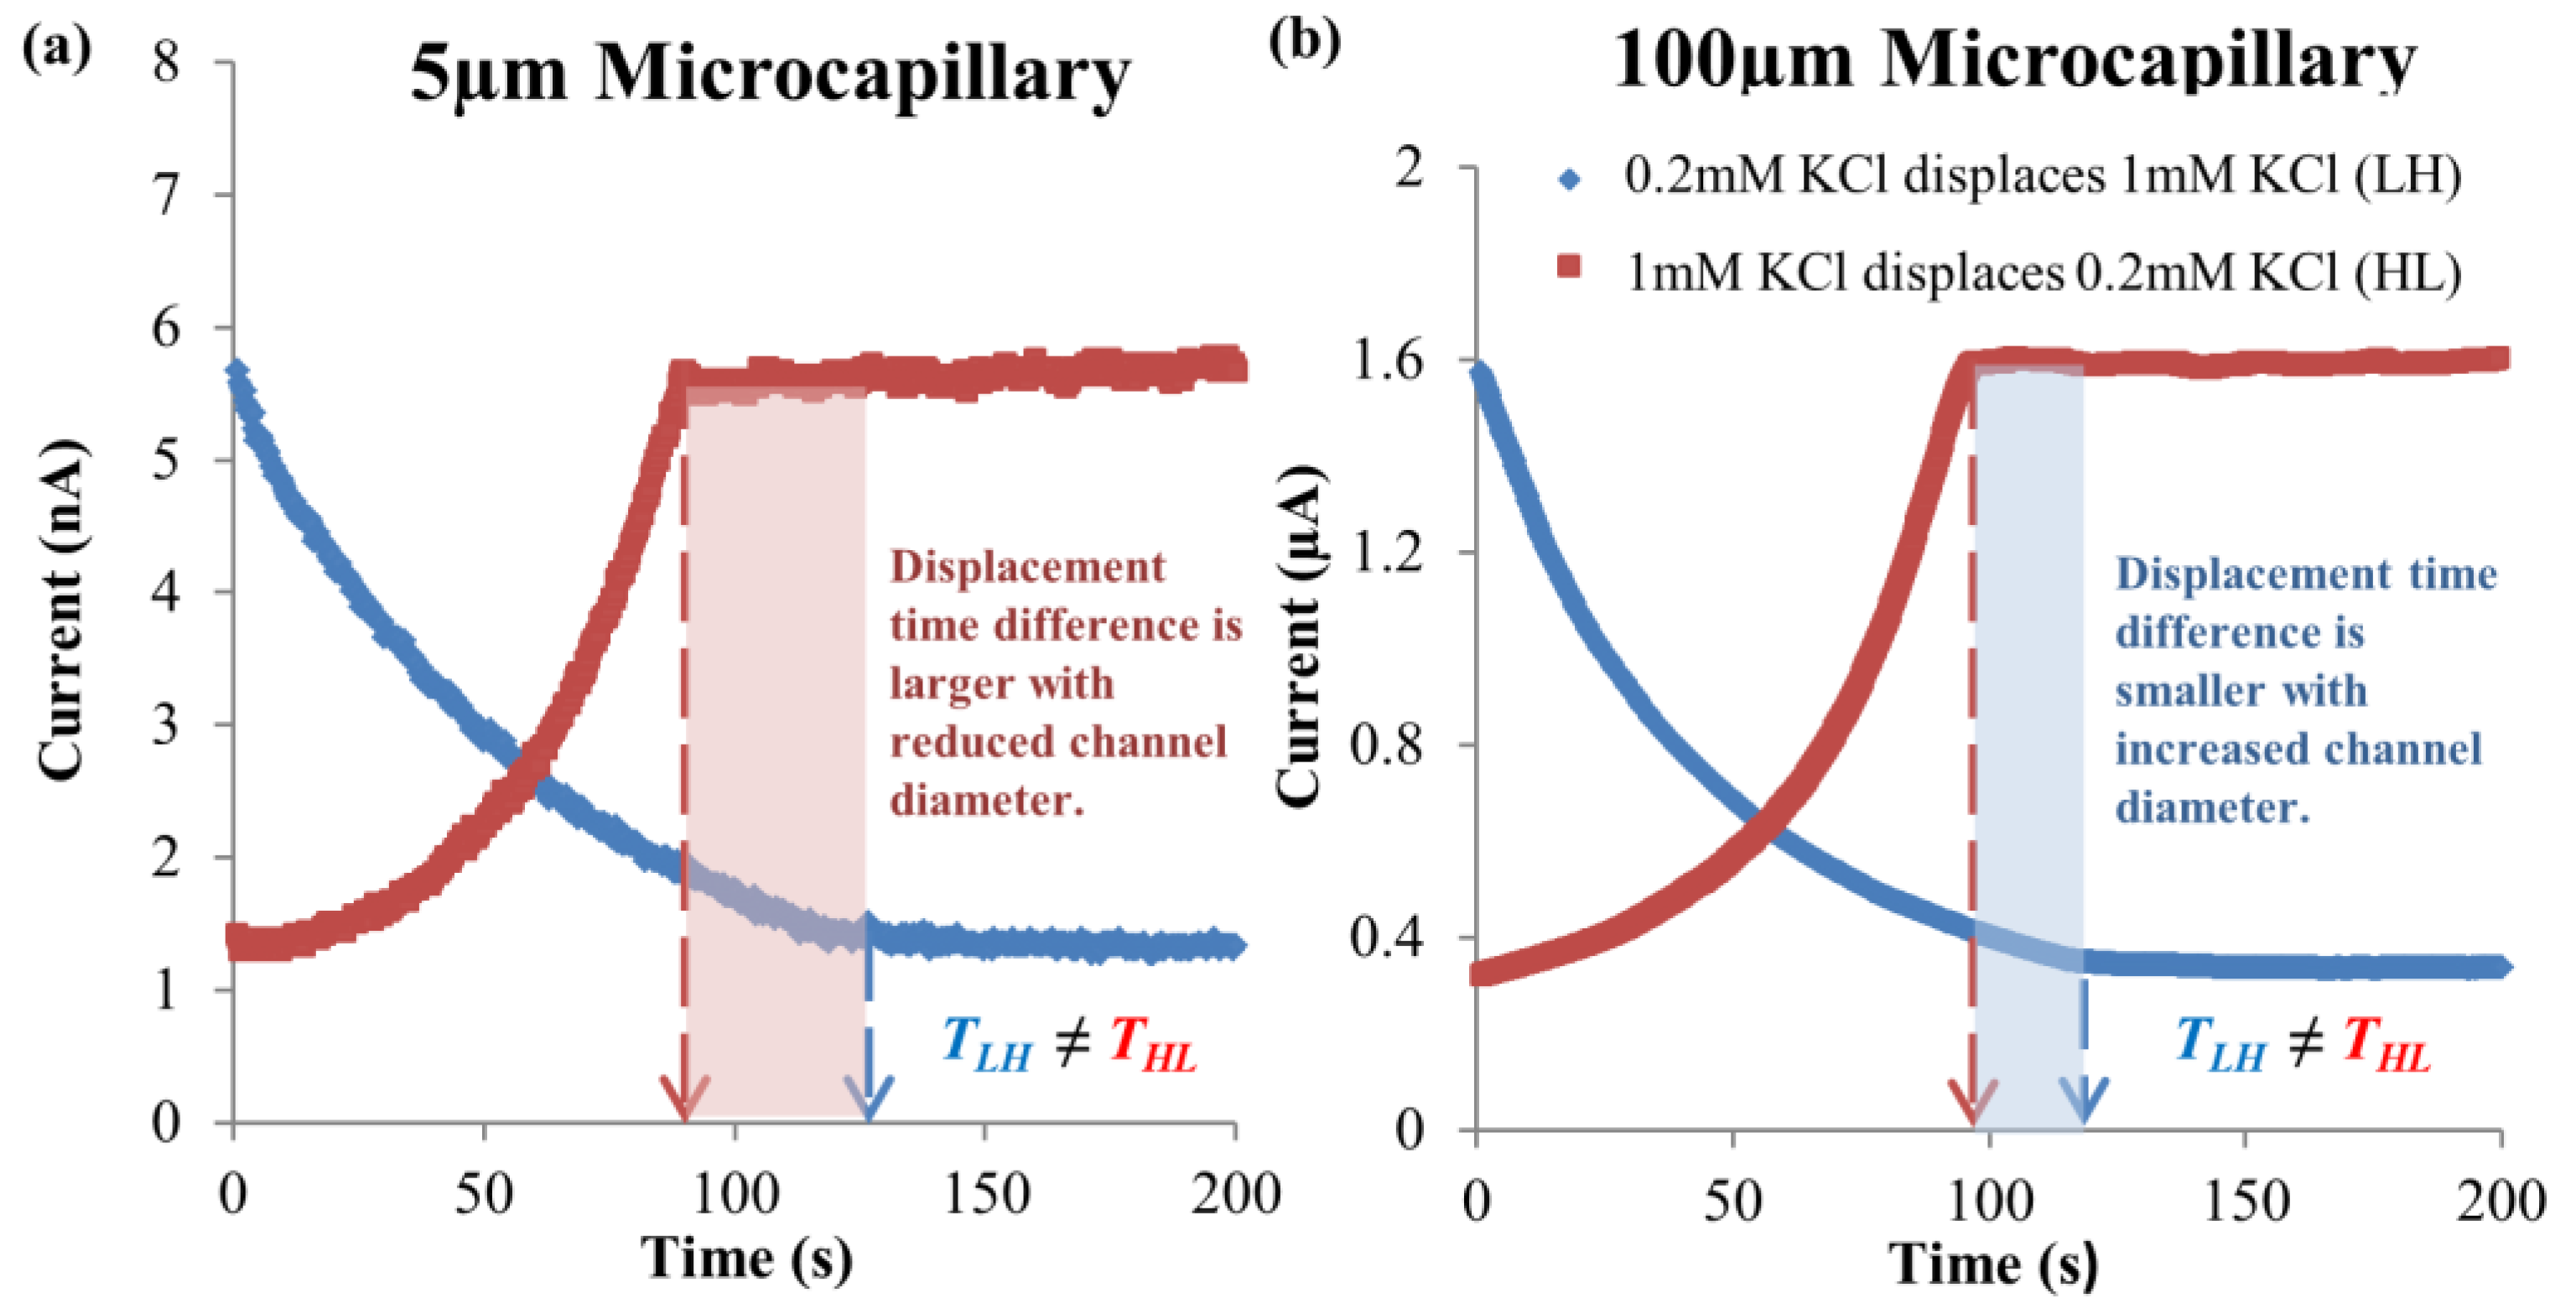
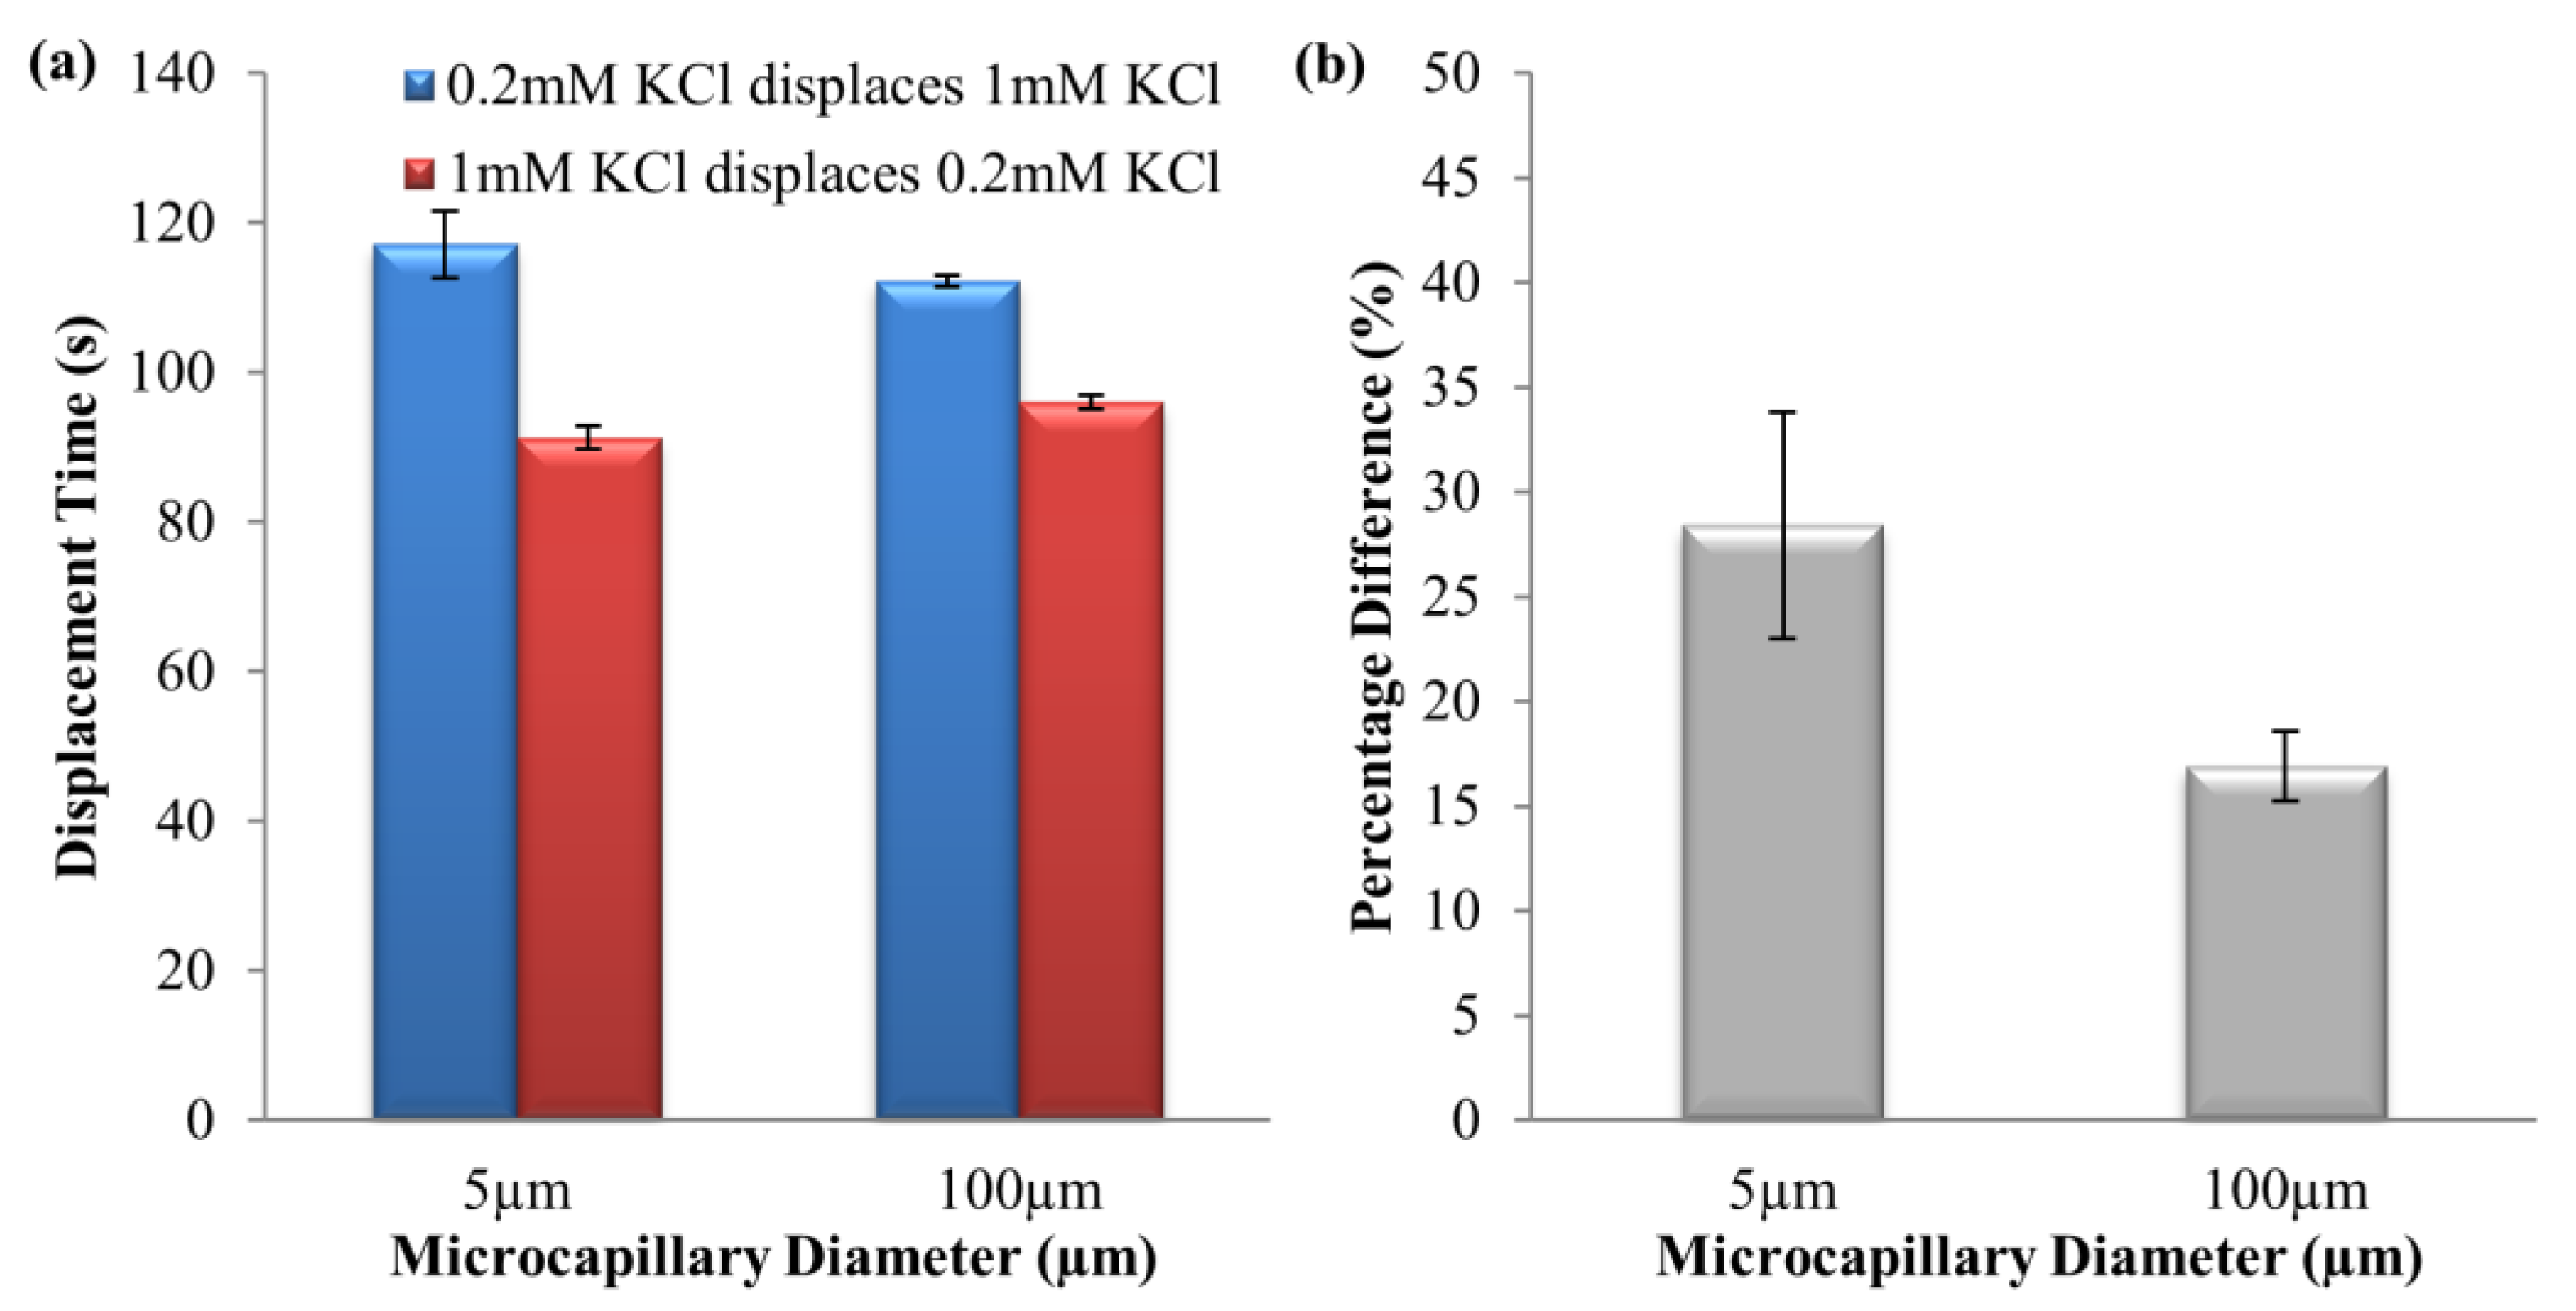
Electroosmotic displacement flow experiments were carried out for 0.2 mM–1 mM KCl solution pair with microchannels of internal diameters 5 μm and 100 μm to investigate the intensifying effect of EOF hysteresis with reduction in channel diameter. The current-time responses, displacement times and percentage of time difference at electric field of 125 V∙cm−1 for two dissimilar direction flows are presented in Figure 8, Figure 9a and Figure 9b, respectively.
For 0.2 mM KCl → 1 mM KCl, the current decreased because of the high conductivity 1 mM KCl was displaced by the low conductivity 0.2 mM KCl (see Table 1), and it stabilized after complete displacement (see Figure 8). As for 1 mM KCl → 0.2 mM KCl, the current increased due to the high conductivity 1 mM KCl displacing the low conductivity 0.2 mM KCl (see Table 1), which upon full displacement the current reached a steady value (see Figure 8). For the displacement time difference percentage, it was observed that the times of complete displacements for 0.2 mM KCl → 1 mM KCl were 28.4 ± 5.4% and 16.9 ± 1.7% longer than the reverse direction, for 5 μm and 100 μm microchannels, respectively (see Figure 9). The investigation has proven that EOF hysteresis for similar ionic species solution pair with different concentrations will be enlarged with the reduction in microchannel diameter.

4.3. Simulation Results on Mechanics Contributing to Augmentation of EOF hysteresis

In previous investigations [25,26], the origin of EOF hysteresis for similar ionic species solution pair with different concentrations was experimentally demonstrated and elucidated through numerical simulations. Rather counterintuitively, despite EOF being a surface phenomenon, the hysteresis effect originates from the bulk-fluid minority ion behavior. The fluid interface gradient of electric field induces flux imbalance of the electromigration of the minority ions that governs the pH, for instance, H3O+ ions.
For 0.2 mM KCl → 1 mM KCl, the flux that is incoming for H3O+ is higher compared to its outgoing flux. This results in the accumulation of H3O+ along the fluid interface (see Figure 10a). Then, the accumulation of H3O+ broadens and the pH over the entire microchannel decreases, which causes the reduction in the EOF flow rate that leads to longer displacement time (see Figure 9a). In contrast, for 1 mM KCl → 0.2 mM KCl, the flux that is incoming for H3O+ is lower compared to its outgoing flux. This causes the depletion of H3O+ at the interface (see Figure 10b). Subsequently, the depletion zone spreads to the bulk fluid and the overall pH along the channel increases, which leads to the increase in flow rate of EOF that results in a faster displacement process (see Figure 9a).
The imbalance flux of electromigration, which causes the pH, zeta potential and eventual variations of the microchannel flow rate, explains the origin of EOF hysteresis for similar ionic species solution pair with different concentrations.
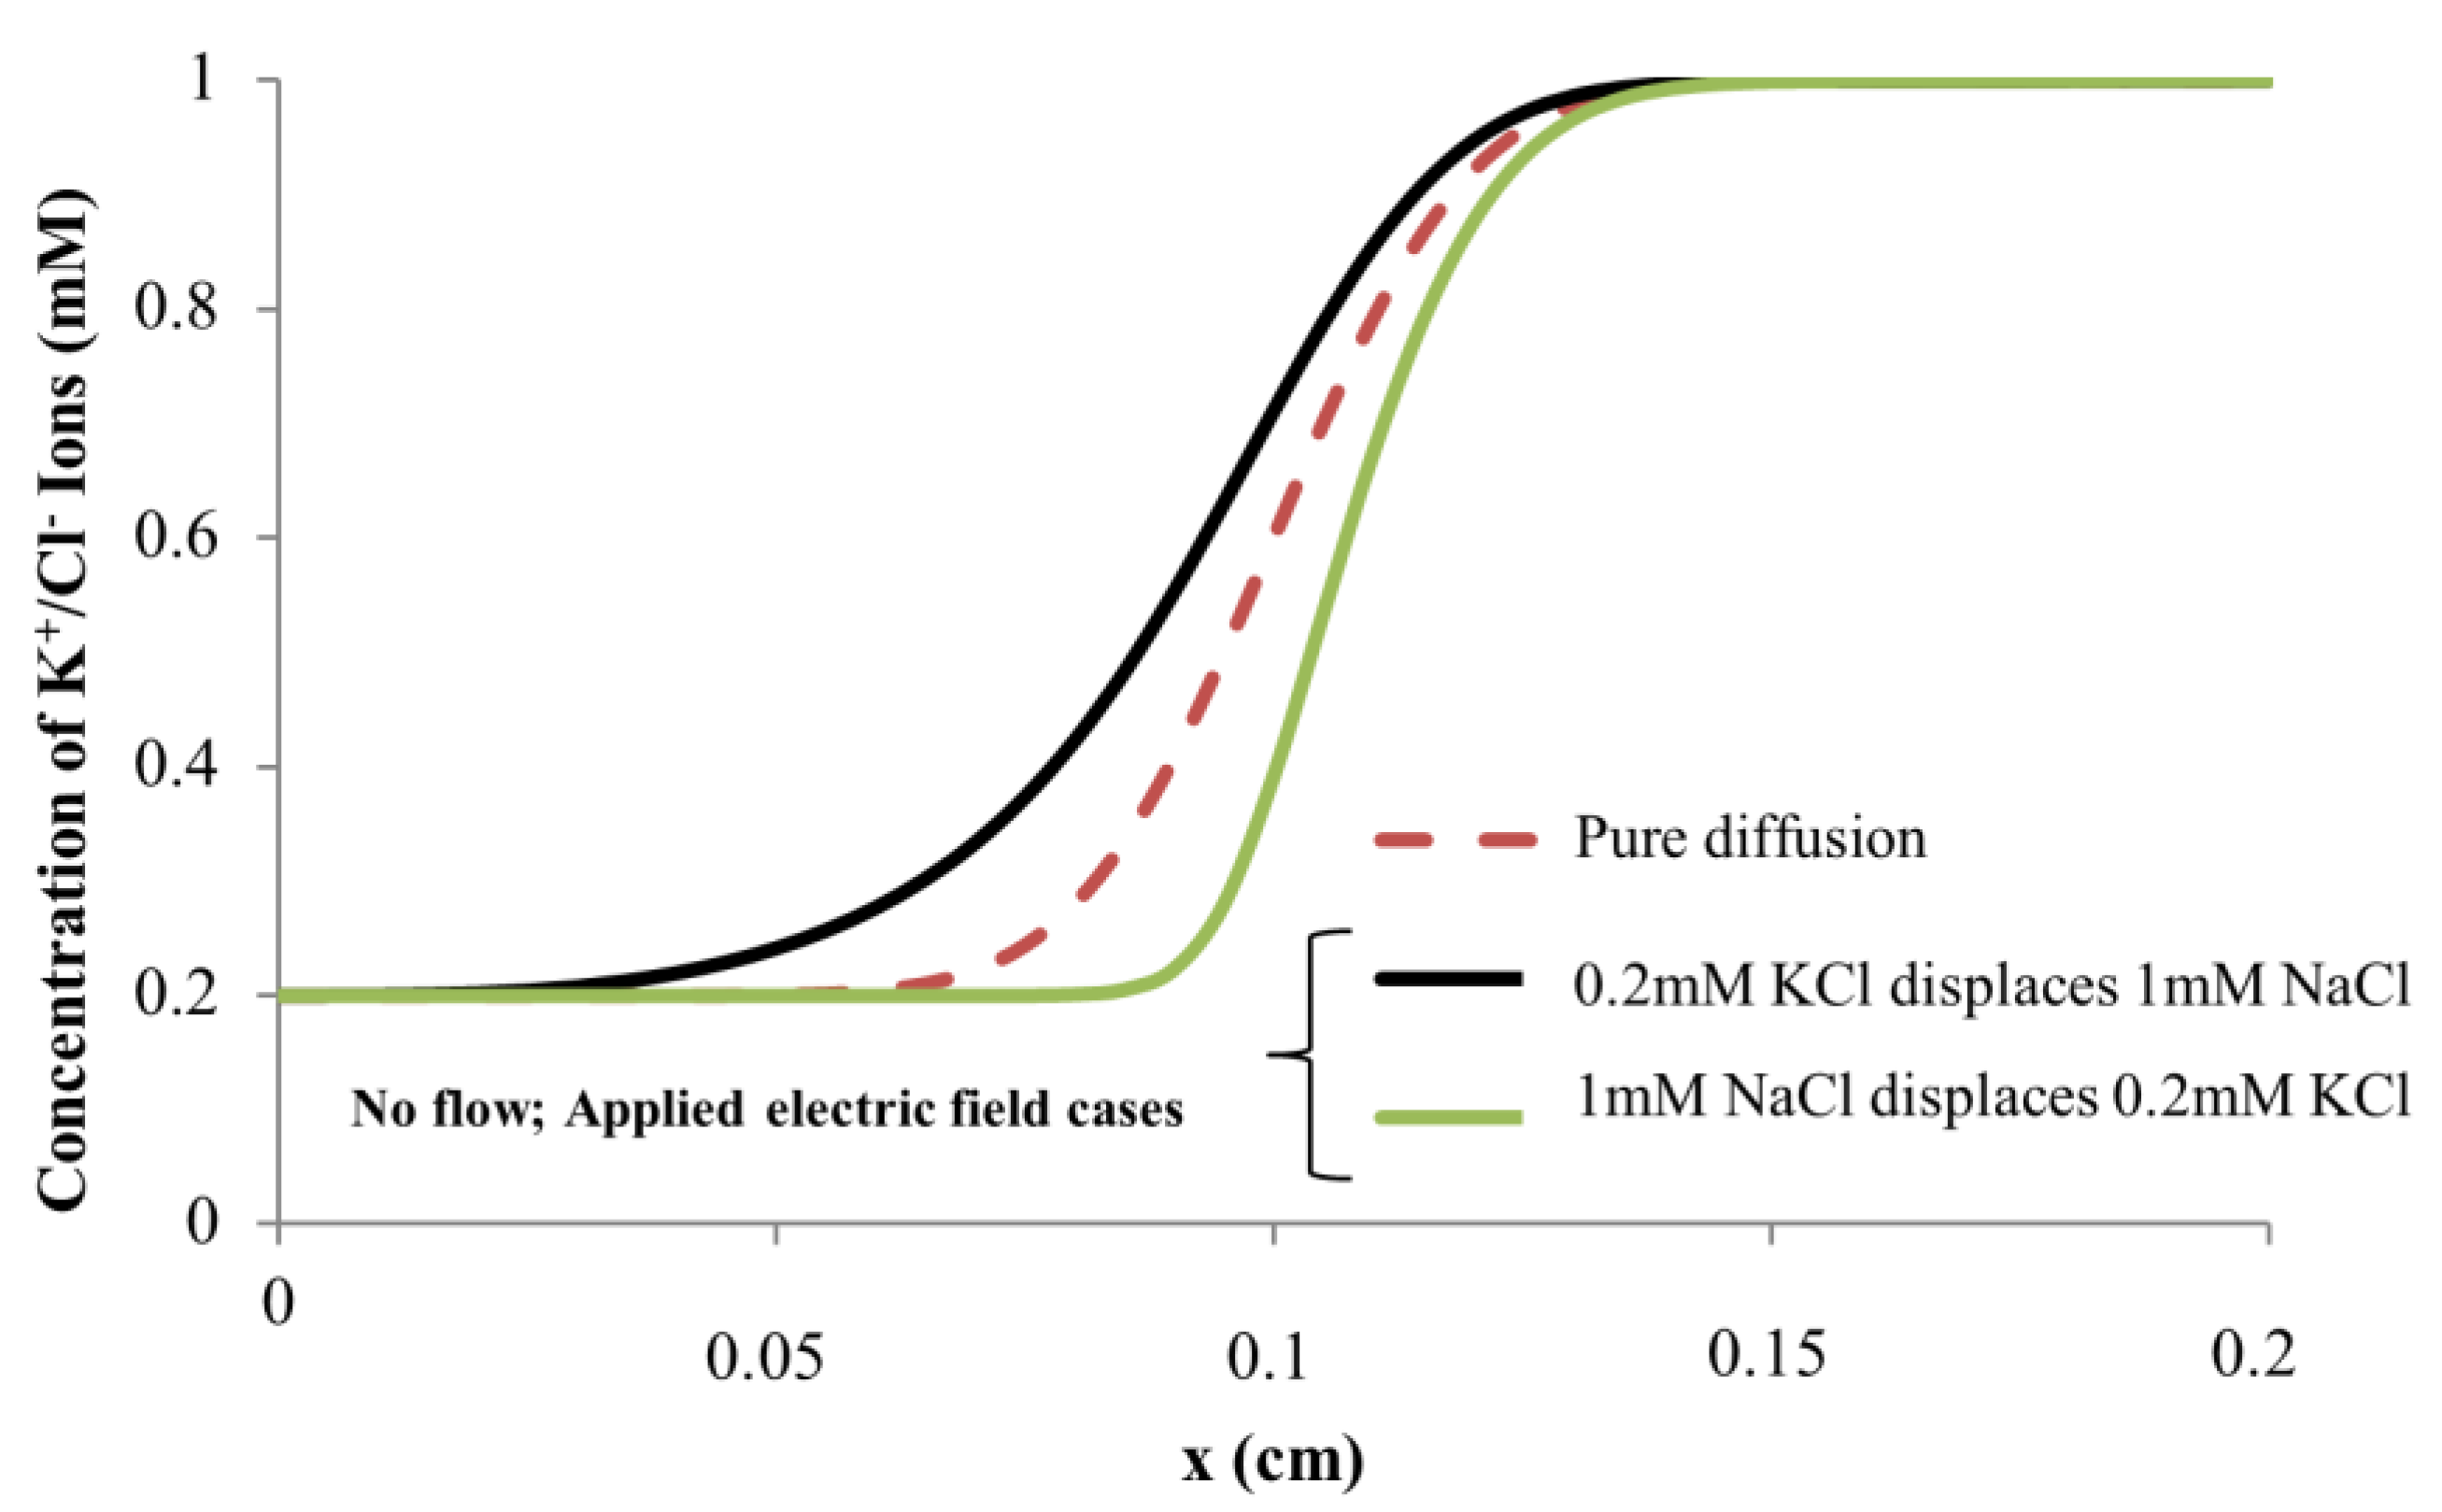
In Section 3 numerical studies were performed to investigate the mechanics that give rise to the intensification of EOF hysteresis when the microchannel diameter was reduced (see Section 4.2). To examine if the reduction in channel diameter results in ionic distribution variations that effect the enhancement of EOF hysteresis, three simulation cases for 0.2 mM–1 mM KCl solution pair of 5 μm microchannel were modeled, whereby the convective term in the NP equation (see Equation (5)) were removed along with the governing equations related to convection (NS and continuity equations, see Equations (6) and (7)). The three simulation cases were the pure diffusion (no supplied electric field) and the applied electric field cases (for two directions at 125 V∙cm−1 field strength to simulate the experiment condition).
Figure 11 shows the simulated K+/Cl concentration for the three modeled cases along the symmetry boundary at time t = 6 s. For electric field application in the direction of 0.2 mM KCl → 1 mM KCl, the ion distribution is more dispersed, and this translates to the widening of the interface between the two fluids. With reversal of electric field, i.e., in the direction of 1 mM KCl → 0.2 mM KCl, a sharpening of the ion distribution occurs, and the fluid interface becomes tighter, while for the pure diffusion case (the electric field is not applied), the diffusive interface is in between the ion distributions of the two applied electric field cases.
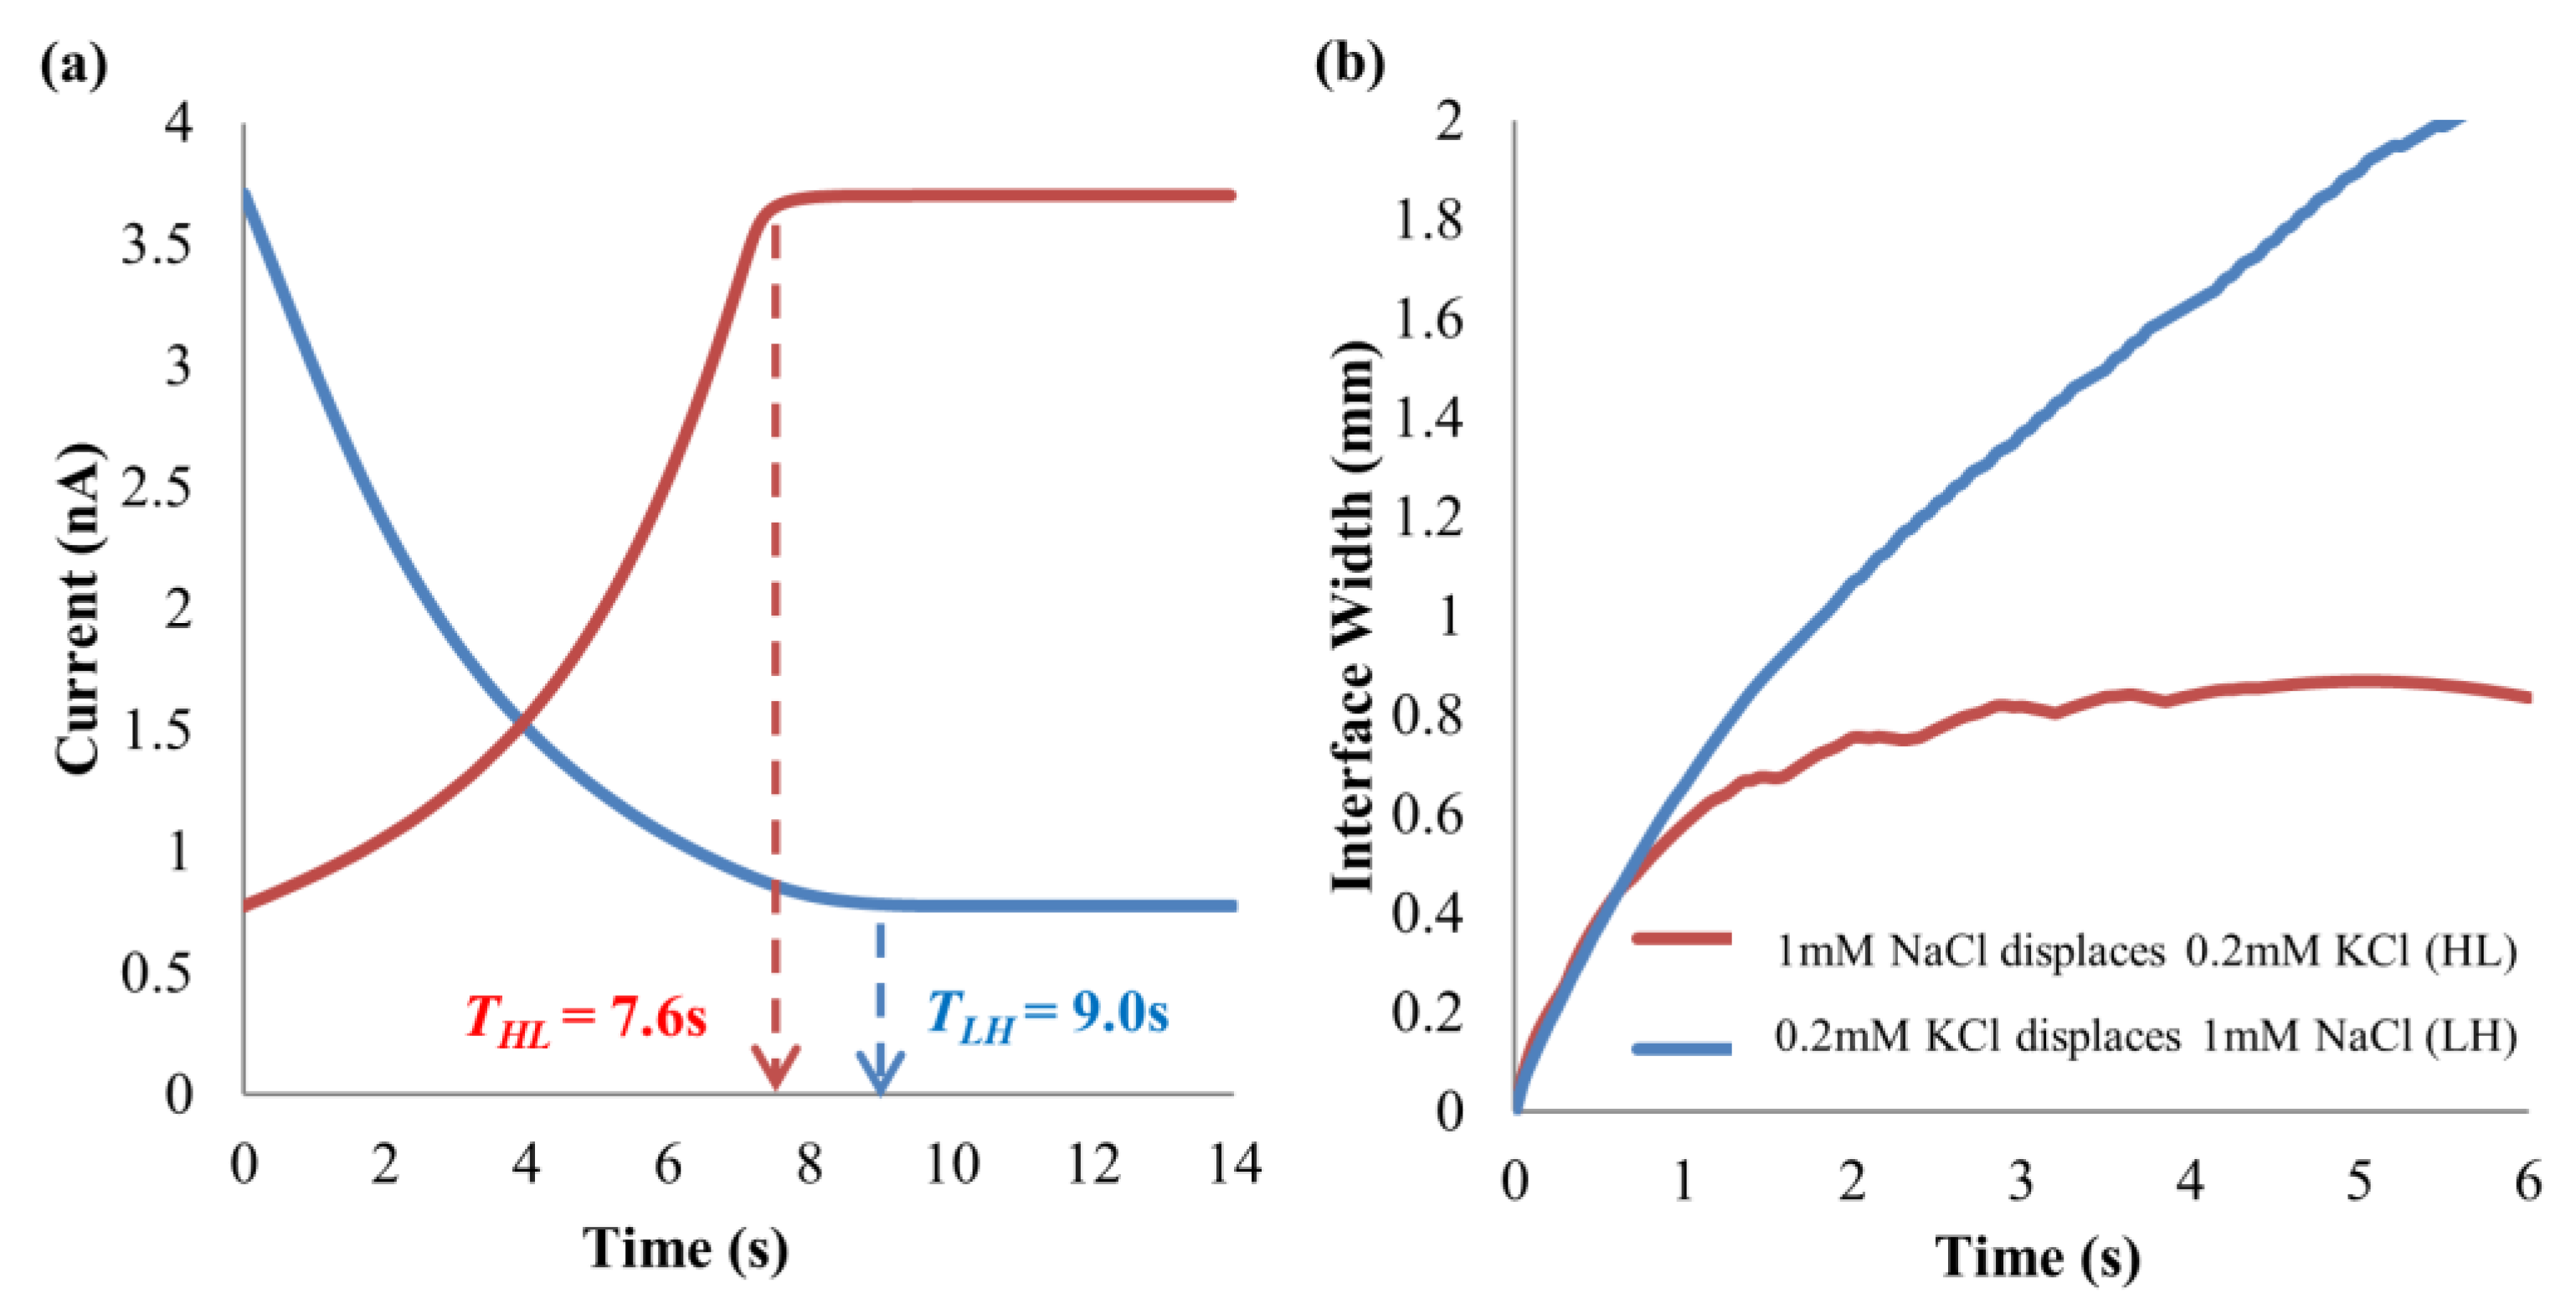
The implication of the wider and tighter interfacial widths for the two applied electric field directions is reflected in the current-time curves in Figure 12a through full simulations of EOF of 0.2 mM–1 mM KCl solution pair for 5 μm microchannel, with the convective term in the NP equation (see Equation (5)) and the convective-related equations (NS and continuity equations, see Equations (6) and (7)) included. For this investigation, the pH-governing minority ions with its acid-base equilibria will not be included so as not to complicate the flow process with the minority-ion-driven hysteresis effect. This will aid in the ease of understanding the mechanics of the channel diameter-dependent hysteresis behavior. The simulated interfacial width variations for the two displacement flow directions are shown in Figure 12b.
From Figure 12a, the displacement time for 0.2 mM KCl → 1 mM KCl is 18.4% longer than that of the opposite flow direction. For 0.2 mM KCl → 1 mM KCl, the interfacial width widens (see Figure 12b) and requires a longer time for full displacement process. For 1 mM KCl → 0.2 mM KCl, the interfacial width is much sharper and tighter compared to the other flow direction (see Figure 12b), and thus steady current is reached in a much shorter time. This phenomenon will disappear as the microchannel diameter increases in the simulation, i.e., to 100 μm diameter.
The experimental observations for the EOF hysteresis enlargement of 0.2 mM–1 mM KCl solution pair with the reduction in microchannel diameter (see Figure 8 and Figure 9) are due to the coupling effect of the resultant wider/tighter interfacial width and the minority-ion-driven hysteresis. The widening/tightening of the interfacial width (depending on displacement direction) between the two fluids is caused by the distortion of ion distributions in the presence of diffusive and electromigrative components of the Nernst–Planck equation (see Equation (5)), when the channel diameter is reduced from 100 μm to 5 μm (or below 5 μm). The aforesaid phenomenon, in combination with the minority-ion-driven effect, augments EOF hysteresis through influencing the overall pH, which causes variations of the EOF flow rate that result in dissimilar displacement times depending on the flow directions.
When 0.2 mM KCl → 1 mM KCl for reduced channel diameter (i.e., 5 μm diameter), the wider interface width (Figure 12b) aids in the accumulation of H3O+, which further broadens and causes more decrease in the pH over the entire microchannel. As such, this causes further reduction in the EOF flow rate that results in an even longer displacement time (see Figure 9a). This can be experimentally observed from the increased displacement time as the channel diameter decreased for 0.2 mM KCl → 1 mM KCl (see Figure 8 and Figure 9a). While for 1 mM KCl → 0.2 mM KCl with reduced channel diameter, depletion of H3O+ at the interface persists, though with tighter interface width (Figure 12b). The depletion zone continues to spread throughout the channel regardless of the shaper interface width. This causes the pH to increase in general, which results in the increase in EOF flow rate that leads to the short displacement time (see Figure 9a). From Figure 8 and Figure 9a, the experimental displacement times were observed to be rather consistent despite reducing the channel diameter for 1 mM KCl → 0.2 mM KCl.

5. Conclusions

EOF hysteresis, which is defined as the direction-dependent flow behavior, has been extensively investigated for dissimilar solution pair systems. Hitherto, there is no investigation being conducted to examine the effect of microchannel diameter on EOF hysteresis. In this study, three solution pairs were selected, namely KCl–NaCl (dissimilar ionic species with similar concentration), NaCl and KCl (similar ionic species but different concentrations) solution pairs, for current monitoring experiments to investigate the channel diameter effect on the EOF hysteresis behaviour. Microchannels of 5 μm and 100 μm internal diameters were employed for the investigation.
EOF of 0.5 mM KCl–NaCl solution pair in two flow directions were split into two phases, which were Phases 1 and 2. Phase 1 involved the evolution of the ion concentration distributions of the displacing fluid due to cation migration, while Phase 2 involved the EOF of different concentration displacing fluids (where the currents/conductivities differ by ~20%), after the original residing fluid had been completely displaced.
The hysteretic behavior was observed during Phase 2 of the displacement process for KCl–NaCl system with reduced microchannel diameter, i.e., 5 μm versus 100 μm microchannel. The 0.5 mM–0.6 mM NaCl solution pair with a conductivity difference matching that for Phase 2 of the 0.5 mM KCl–NaCl system was employed for further validation.
EOF of 0.5 mM–0.6 mM NaCl solution pair in two flow directions demonstrated similarly that the displacement times were almost identical for 100 μm microchannel, and differed significantly for 5 μm channel. This has verified that reducing the microchannel diameter leads to the intensifying of EOF hysteresis for similar ionic species solution pair with different concentrations.
EOF of 0.2 mM–1 mM KCl solution pair for different directions had also revealed that the times of complete displacements for 0.2 mM KCl displacing 1 mM KCl were 28.4 ± 5.4% and 16.9 ± 1.7% longer than the reverse direction, for 5 μm and 100 μm microchannels, respectively. The investigation has proven the augmentation of EOF hysteresis with the reduction in microchannel diameter.
Three simulation cases without the convective equations were modeled, namely the pure diffusion (no supplied electric field) and the applied electric field cases (for two directions), to investigate the mechanics that give rise to the intensification of EOF hysteresis when the channel diameter was reduced. The widening and tightening of the interfacial widths happen for the two applied electric field directions with respect to the pure diffusion case.
Full simulations for EOF of 0.2 mM–1 mM KCl (convective equations included) with reduced channel diameter (i.e., 5 μm diameter) were also performed to demonstrate the mechanics enlarging the hysteretic behavior. For 1 mM KCl displaced by 0.2 mM KCl, the wider interface width aids in the accumulation of H3O+, which further broadens and causes a more significant decrease in the pH along the channel. This further reduces the EOF flow rate that results in an even longer experimental displacement time. For the reverse flow direction, depletion of H3O+ persists, though with tighter interfacial width. The depletion zone continues to spread, causing the overall pH to increase, which increases the EOF flow rate that leads to the short experimental displacement process.
EOF hysteresis augmentation for reduced microchannel diameter is due to the coupling effect of the resultant wider/tighter interfacial width and the minority-ion-driven hysteresis (origin of EOF hysteresis). This study provides an appropriate understanding of the channel dimensional effect on EOF behavior involving multiple fluids, and the investigation can potentially be applied for chemical and biological microfluidic systems with tunable throughput.

Author Contributions

A.E.L. conceived the project, performed the experimental and numerical investigations, and wrote the paper; A.E.L. and S.G. analyzed the results and reviewed the paper. All authors have read and agreed to the published version of the manuscript.

Funding

This research received no external funding.

Data Availability Statement

The data presented in this study are available on request from the corresponding author. The data are not publicly available due to privacy restrictions.

Acknowledgments

An Eng Lim would like to specially thank Yee Cheong Lam for previously supervising his Ph.D. project. This has built An Eng the foundation that results in this extended research work. He would like to thank Shireen Goh for providing him with guidance and insights on the analysis of data. He acknowledged School of Mechanical & Aerospace Engineering (MAE), Nanyang Technological University (NTU), where he gathered his experimental and numerical data from, in his capacity as a Part-Time Lecturer.

Conflicts of Interest

The authors declare no conflict of interest.

References

  1. Kusama, S.; Sato, K.; Matsui, Y.; Kimura, N.; Abe, H.; Yoshida, S.; Nishizawa, M. Transdermal electroosmotic flow generated by a porous microneedle array patch. Nat. Commun. 2021, 12, 658. [Google Scholar] [CrossRef] [PubMed]
  2. Buie, C.R.; Posner, J.D.; Fabian, T.; Cha, S.W.; Kim, D.; Prinz, F.B.; Eaton, J.K.; Santiago, J.G. Water management in proton exchange membrane fuel cells using integrated electroosmotic pumping. J. Power Sources 2006, 161, 191–202. [Google Scholar] [CrossRef]
  3. Liu, M.; Liu, Y.; Guo, Q.; Yang, J. Modeling of electroosmotic pumping of nonconducting liquids and biofluids by a two-phase flow method. J. Electroanal. Chem. 2009, 636, 86–92. [Google Scholar] [CrossRef]
  4. Balasuriya, S. Dynamical systems techniques for enhancing microfluidic mixing. J. Micromech. Microeng. 2015, 25, 094005. [Google Scholar] [CrossRef]
  5. Modarres, P.; Tabrizian, M. Electrohydrodynamic-driven micromixing for the synthesis of highly monodisperse nanoscale liposomes. ACS Appl. Nano Mater. 2020, 3, 4000–4013. [Google Scholar] [CrossRef]
  6. Trabzon, L.; Karimian, G.R.; Khosroshahi, A.; Gül, B.G.; Bakhshayesh, A.; Koçak, A.F.; Akyıldız, D.; Aldi, Y.E. High-throughput nanoscale liposome formation via electrohydrodynamic-based micromixer. Phys. Fluids 2022, 34, 102011. [Google Scholar] [CrossRef]
  7. Mohammad Jafarpour, A.; Rostamzadeh Khosroshahi, A.; Hanifi, M.; Sadegh Moghanlou, F. Experimental study on the performance of a mini-scale Y-type mixer with two liquid metal-enabled pumps. Phys. Fluids 2022, 34, 112110. [Google Scholar] [CrossRef]
  8. Huang, M.F.; Hsu, C.E.; Tseng, W.L.; Lin, Y.C.; Chang, H.T. Separation of dsDNA in the presence of electroosmotic flow under discontinuous conditions. Electrophoresis 2001, 22, 2281–2290. [Google Scholar] [CrossRef]
  9. Giordano, B.C.; Burgi, D.S.; Hart, S.J.; Terray, A. On-line sample pre-concentration in microfluidic devices: A review. Anal. Chim. Acta 2012, 718, 11–24. [Google Scholar] [CrossRef]
  10. Nguyen, N.V.T.; Smadja, C.; Taverna, M.; El Mousli, S.; Secret, E.; Siaugue, J.M.; Nguyen, L.T.H.; Mai, T.D. Electroosmotic flow modulation for improved electrokinetic preconcentration: Application to channel electrophoresis of fluorescent magnetic nanoparticles. Anal. Chim. Acta 2021, 1161, 338466. [Google Scholar] [CrossRef]
  11. Horvath, J.; Dolník, V. Polymer wall coatings for channel electrophoresis. Electrophoresis 2001, 22, 644–655. [Google Scholar] [CrossRef]
  12. Preisler, J.; Yeung, E.S. Characterization of nonbonded poly (ethylene oxide) coating for channel electrophoresis via continuous monitoring of electroosmotic flow. Anal. Chem. 1996, 68, 2885–2889. [Google Scholar] [CrossRef]
  13. Lim, A.E.; Lim, C.Y.; Lam, Y.C.; Taboryski, R.; Wang, S.R. Effect of nanostructures orientation on electroosmotic flow in a microfluidic channel. Nanotechnology 2017, 28, 255303. [Google Scholar] [CrossRef] [Green Version]
  14. Lim, A.E.; Lam, Y.C. Numerical investigation of nanostructure orientation on electroosmotic flow. Micromachines 2020, 11, 971. [Google Scholar] [CrossRef]
  15. Ren, L.; Masliyah, J.; Li, D. Experimental and theoretical study of the displacement process between two electrolyte solutions in a microchannel. J. Colloid Interface Sci. 2003, 257, 85–92. [Google Scholar] [CrossRef]
  16. Ren, L.; Escobedo, C.; Li, D. Electroosmotic flow in a microchannel with one solution displacing another solution. J. Colloid Interface Sci. 2001, 242, 264–271. [Google Scholar] [CrossRef] [Green Version]
  17. Tang, S.W.; Chang, C.H.; Wei, H.H. Roles of solution conductivity mismatch in transient current and fluid transport in electrolyte displacement by electro-osmotic flow. Microfluid. Nanofluid. 2011, 10, 337–353. [Google Scholar] [CrossRef]
  18. Mampallil, D.; van den Ende, D.; Mugele, F. A simple method to determine the surface charge in microfluidic channels. Electrophoresis 2010, 31, 563–569. [Google Scholar] [CrossRef]
  19. Hussain, F.; Ellahi, R.; Zeeshan, A. Mathematical models of electro-magnetohydrodynamic multiphase flows synthesis with nano-sized hafnium particles. Appl. Sci. 2018, 8, 275. [Google Scholar] [CrossRef] [Green Version]
  20. Mekheimer, K.S.; Zaher, A.Z.; Hasona, W.M. Entropy of AC electro-kinetics for blood mediated gold or copper nanoparticles as a drug agent for thermotherapy of oncology. Chin. J. Phys. 2020, 65, 123–138. [Google Scholar] [CrossRef]
  21. Lim, A.E.; Lim, C.Y.; Lam, Y.C. Electroosmotic flow hysteresis for dissimilar ionic solutions. Biomicrofluidics 2015, 9, 024113. [Google Scholar] [CrossRef] [Green Version]
  22. Lim, A.E.; Lim, C.Y.; Lam, Y.C. Electroosmotic flow hysteresis for dissimilar anionic solutions. Anal. Chem. 2016, 88, 8064–8073. [Google Scholar] [CrossRef]
  23. Lim, A.E.; Lam, Y.C. Electroosmotic Flow Hysteresis for Fluids with Dissimilar pH and Ionic Species. Micromachines 2021, 12, 1031. [Google Scholar] [CrossRef]
  24. Lim, C.Y.; Lam, Y.C. Direction dependence of displacement time for two-fluid electroosmotic flow. Biomicrofluidics 2021, 6, 012816. [Google Scholar] [CrossRef] [Green Version]
  25. Lim, C.Y.; Lim, A.E.; Lam, Y.C. Ionic origin of electro-osmotic flow hysteresis. Sci. Rep. 2016, 6, 22329. [Google Scholar] [CrossRef] [Green Version]
  26. Lim, C.Y.; Lim, A.E.; Lam, Y.C. pH change in electroosmotic flow hysteresis. Anal. Chem. 2017, 89, 9394–9399. [Google Scholar] [CrossRef]
  27. Zhang, L.; McNeece, C.J.; Hesse, M.A.; Wang, M. Reactive transport of protons in electro-osmotic displacements with electrolyte concentration difference in a microchannel. Anal. Chem. 2018, 90, 11802–11811. [Google Scholar] [CrossRef]
  28. Jing, D.; Zhan, X. Cross-sectional dimension dependence of electroosmotic flow in fractal treelike rectangular microchannel network. Micromachines 2020, 11, 266. [Google Scholar] [CrossRef] [Green Version]
  29. Lee, M.H.; Moon, Y.R.; Chung, B.Y.; Kim, J.S.; Lee, K.S.; Cho, J.Y.; Kim, J.H. Practical use of chemical probes for reactive oxygen species produced in biological systems by γ-irradiation. Radiat. Phys. Chem. 2009, 78, 323–327. [Google Scholar] [CrossRef]
  30. Britton, G. Carotenoid research: History and new perspectives for chemistry in biological systems. Biochim. Biophys. Acta Mol. Cell Biol. Lipids 2020, 1865, 158699. [Google Scholar] [CrossRef]
  31. Allec, S.I.; Sun, Y.; Sun, J.; Chang, C.E.A.; Wong, B.M. Heterogeneous CPU+ GPU-enabled simulations for DFTB molecular dynamics of large chemical and biological systems. J. Chem. Theory Comput. 2019, 15, 2807–2815. [Google Scholar] [CrossRef]
  32. Yan, D.G.; Yang, C.; Huang, X.Y. Effect of finite reservoir size on electroosmotic flow in microchannels. Microfluid. Nanofluid. 2007, 3, 333–340. [Google Scholar] [CrossRef]
  33. Rodríguez, I.; Chandrasekhar, N. Experimental study and numerical estimation of current changes in electroosmotically pumped microfluidic devices. Electrophoresis 2005, 26, 1114–1121. [Google Scholar] [CrossRef] [PubMed]
  34. Almutairi, Z.A.; Glawdel, T.; Ren, C.L.; Johnson, D.A. A Y-channel design for improving zeta potential and surface conductivity measurements using the current monitoring method. Microfluid. Nanofluid. 2009, 6, 241–251. [Google Scholar] [CrossRef]
  35. Tang, G.; Yan, D.; Yang, C.; Gong, H.; Chai, J.C.; Lam, Y.C. Assessment of Joule heating and its effects on electroosmotic flow and electrophoretic transport of solutes in microfluidic channels. Electrophoresis 2006, 27, 628–639. [Google Scholar] [CrossRef] [PubMed]
  36. Arulanandam, S.; Li, D. Determining ζ potential and surface conductance by monitoring the current in electro-osmotic flow. J. Colloid Interface Sci. 2002, 225, 421–428. [Google Scholar] [CrossRef] [PubMed]
  37. Newman, J.; Thomas-Alyea, K.E. Electrochemical Systems; John Wiley & Sons: Haboken, NJ, USA, 2012. [Google Scholar]
  38. Hruška, V.; Gaš, B. Kohlrausch regulating function and other conservation laws in electrophoresis. Electrophoresis 2007, 28, 3–14. [Google Scholar] [CrossRef] [PubMed]
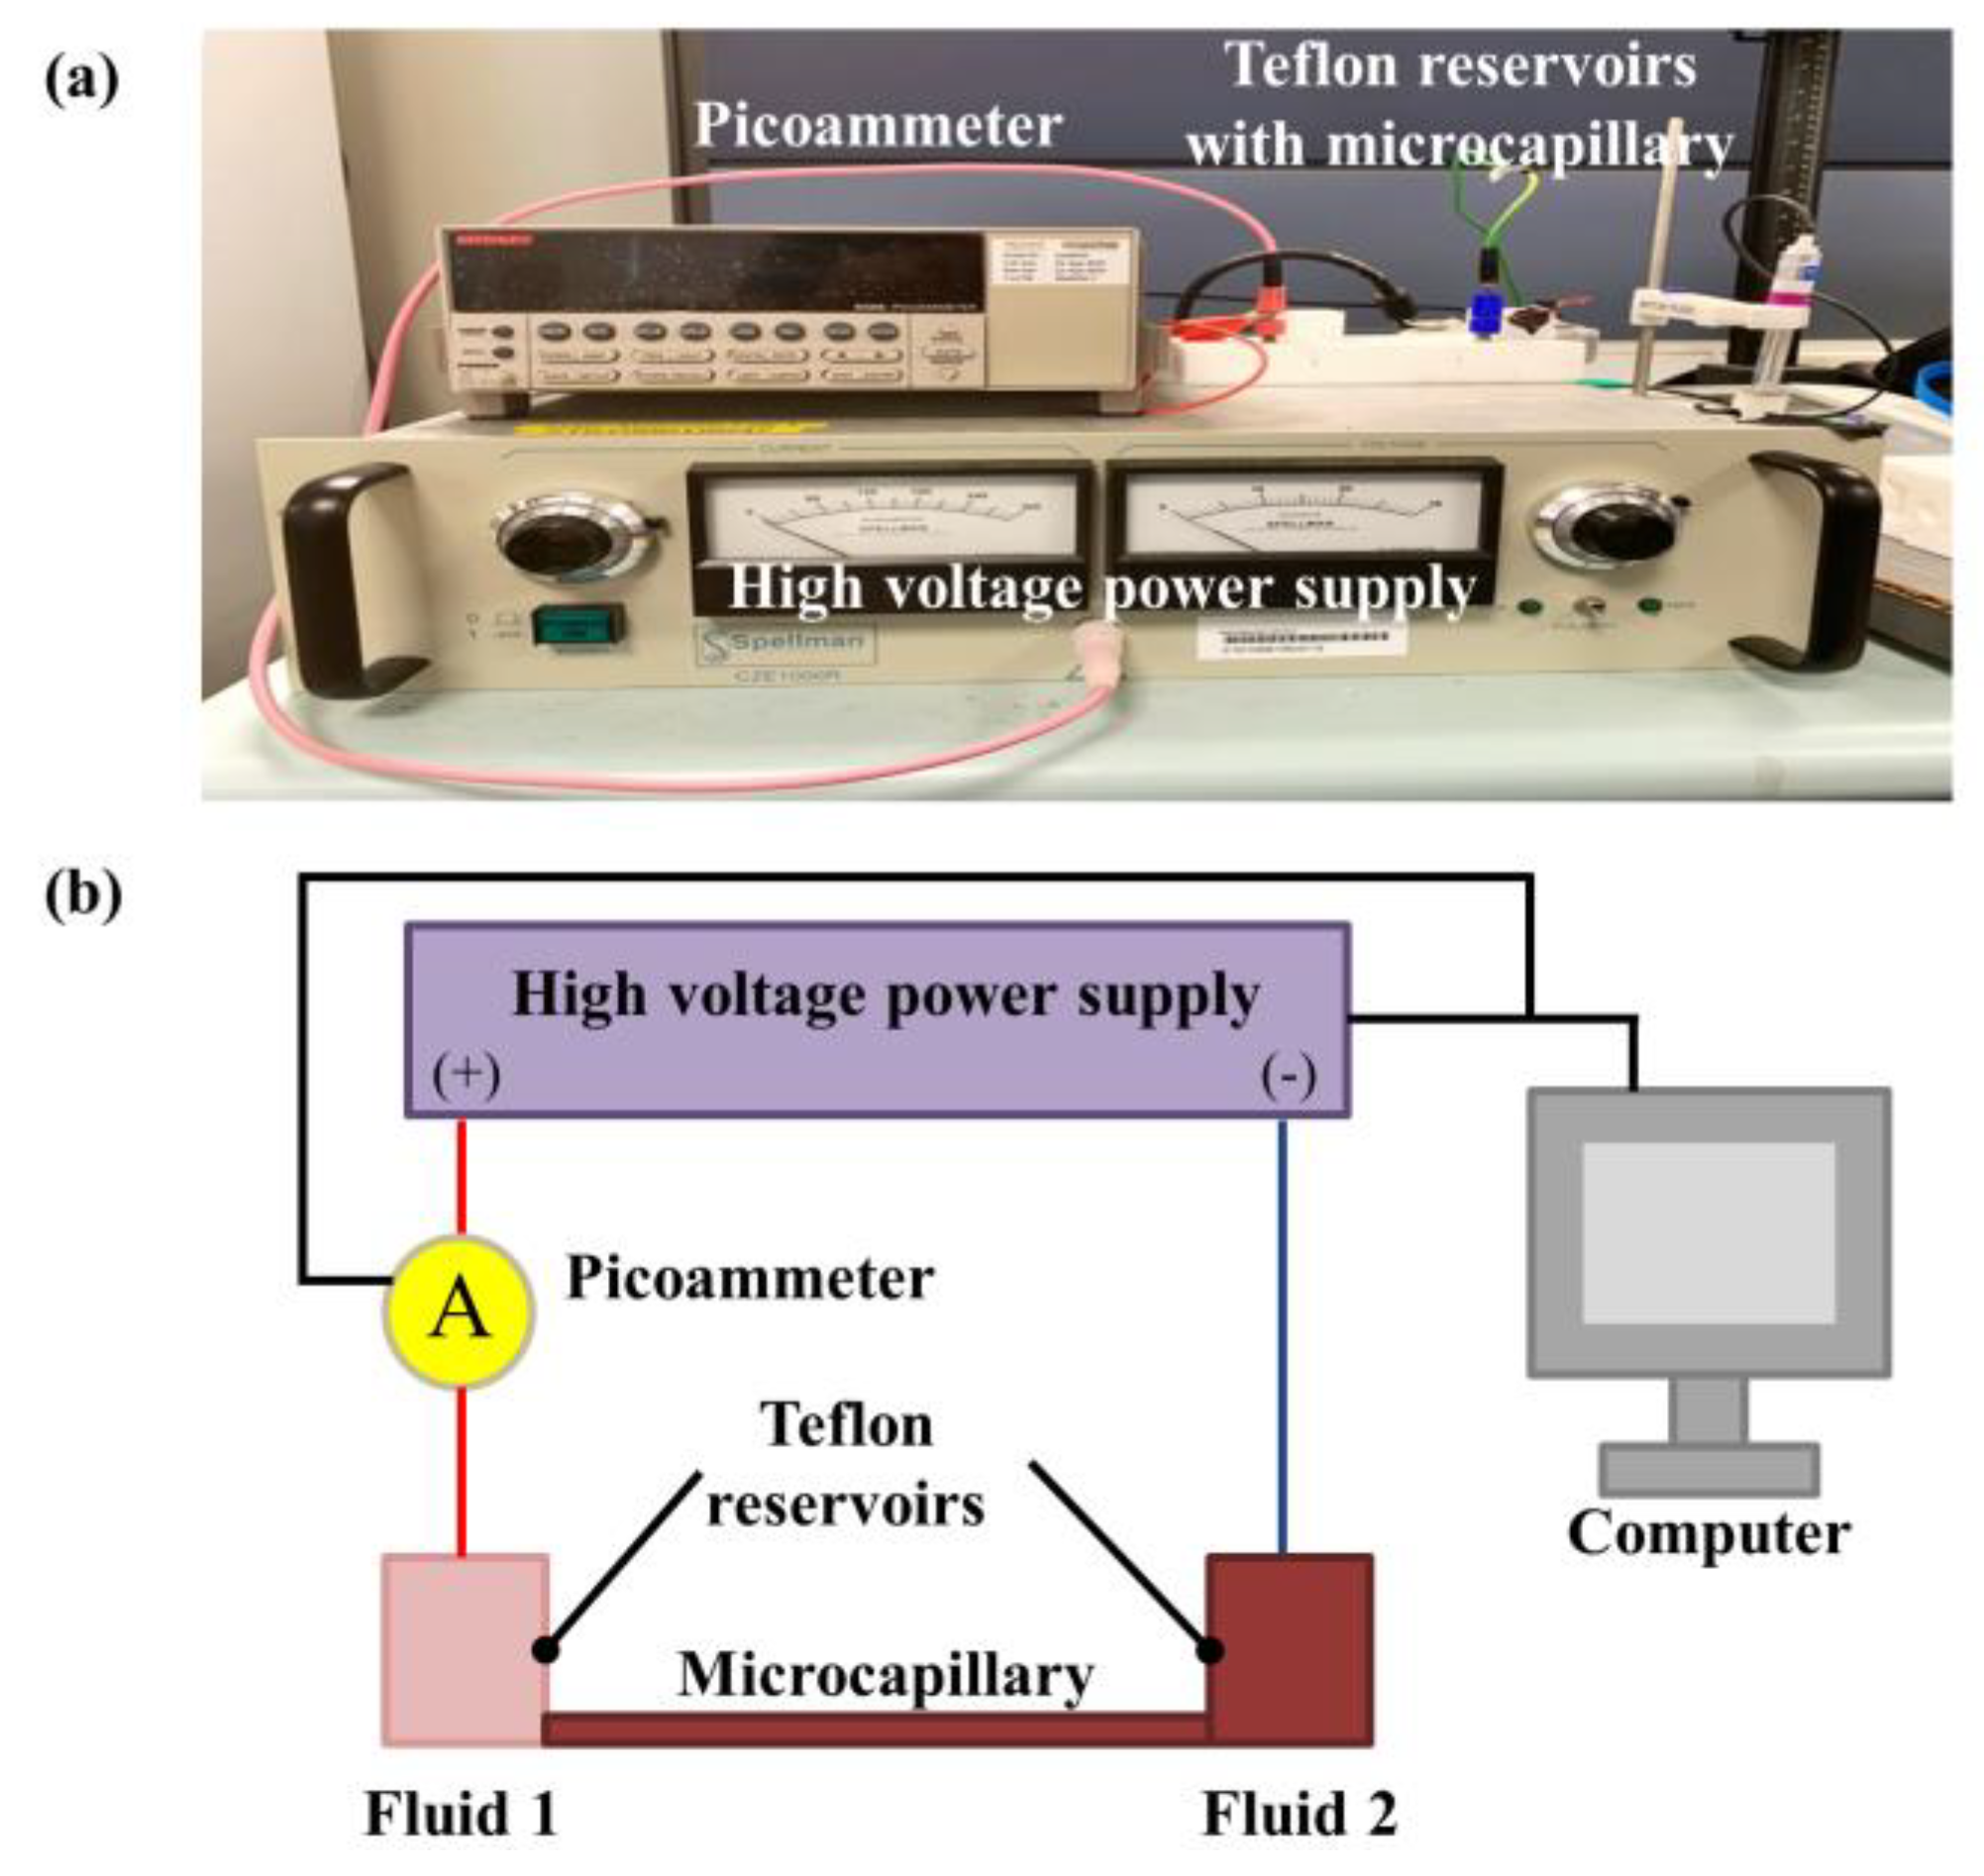
Figure 1. (a) Image of experimental setup for current monitoring technique [21,22,23,24,25,26] and (b) graphic representation. Microchannels with internal diameters of 5 μm and 100 μm and a length of 8 cm were employed for experimentations.
Energies 16 02154 g001
Figure 2. Numerical simulation domains (not drawn to scale) for (a) simulations without convective-related term and governing equations and (b) full simulations.
Energies 16 02154 g002
Figure 3. Experimental current-time responses of two EOF flow directions for 0.5 mM KCl–NaCl solution pair, at 125 V∙cm−1 electric field for microchannels with (a) 5 μm and (b) 100 μm internal diameters, respectively.
Energies 16 02154 g003
Figure 4. Illustration of concentration evolution due to cation migration for Phase 1 when (a) 0.5 mM KCl → 0.5 mM NaCl (electroosmotic flow (EOF) direction is indicated via the arrow) and (b) 0.5 mM NaCl → 0.5 mM KCl, in accordance with Kohlrausch regulating function (KRF).
Energies 16 02154 g004
Figure 5. Experimental displacement times of two EOF directions for 0.5 mM KCl–NaCl solution pair, at 125 V∙cm−1 electric field for microchannels with 5 μm and 100 μm internal diameters, respectively.
Energies 16 02154 g005
Figure 6. Experimental current-time responses of two EOF flow directions for 0.5 mM–0.6 mM NaCl solution pair, at 125 V∙cm−1 electric field for microchannels with (a) 5 μm and (b) 100 μm internal diameters, respectively.
Energies 16 02154 g006
Figure 7. Experimental displacement times of two EOF directions for 0.5 mM–0.6 mM NaCl solution pair, at 125 V∙cm−1 electric field for microchannels with 5 μm and 100 μm internal diameters, respectively.
Energies 16 02154 g007
Figure 8. Experimental current-time responses for two EOF directions of 0.2 mM–1 mM KCl solution pair, at 125 V∙cm−1 electric field for microchannels with (a) 5 μm and (b) 100 μm internal diameters, respectively.
Energies 16 02154 g008
Figure 9. (a) Experimental displacement times and (b) percentage time difference of 0.2 mM–1 mM KCl solution pair in two directions, at 125 V∙cm−1 electric field for microchannels with 5 μm and 100 μm internal diameters, respectively.
Energies 16 02154 g009
Figure 10. (a) Hydronium ions (H3O+) (minority ions) accumulation and (b) depletion as a result of electromigrative influx and outflux imbalance at the interface of 0.2 mM and 1 mM KCl solutions [25].
Energies 16 02154 g010
Figure 11. Numerical simulations of K+/Cl ion concentration along microchannel (symmetry boundary) at t = 6 s. Channel diameter = 5 μm and length = 0.2 cm.
Energies 16 02154 g011
Figure 12. (a) Current-time curves and (b) interface widths of full simulations (with convective term and governing equations) for 0.2 mM–1 mM KCl solution pair in two displacement flow directions, at 125 V∙cm−1 electric field for microchannel diameter of 5 μm.
Energies 16 02154 g012
Table 1. Measured conductivities and pH values of solutions.
SolutionsConductivities (µS·cm−1)pH
0.5 mM NaCl63.5 ± 0.15.68 ± 0.03
0.6 mM NaCl76.2 ± 0.25.49 ± 0.05
0.2 mM KCl30.8 ± 0.15.62 ± 0.02
0.5 mM KCl75.5 ± 0.25.57 ± 0.02
1 mM KCl147.9 ± 0.15.73 ± 0.01
Table 2. Simulation constants with symbols and values. The ion mobility is derived by (ziDiF)/(RT).
ConstantsValueSymbol (Unit)
Free space permittivity8.85 × 10−12ɛo (C·V−1·m−1)
Fluid relative permittivity80ɛr
Fluid viscosity8.90 × 10−4µ (kg·m−1·s−1)
Fluid density1000ρ (kg·m−3)
Boltzmann constant1.381 × 10−23kb (m2·kg·s−2·K−1)
Faraday constant96,485F (C·mol−1)
Avogadro constant6.022 × 1023Na (mol−1)
Gas constant8.314R (J·mol−1·K−1)
Boltzmann constant1.381 × 10−23kb (m2·kg·s−2·K−1)
Temperature298T (K)
Electron charge1.602 × 10−19e (C)
K+ diffusion coefficient1.957 × 10−9 [37]DK+ (m2·s−1)
Na+ diffusion coefficient1.334 × 10−9 [37]DNa+ (m2·s−1)
Cl diffusion coefficient2.032 × 10−9 [37]DCl (m2·s−1)
K+ mobility7.930 × 10−8um(K+) (m2·V−1·s−1)
Na+ mobility5.194 × 10−8um(Na+) (m2·V−1·s−1)
Cl mobility−7.919 × 10⁻⁸um(Cl) (m2·V−1·s−1)
K+ charge number+1zK+
Na+ charge number+1zNa+
Cl charge number−1zCl
Table 3. Boundary conditions for numerical simulations.
VariableCondition aBoundary
Applied potential φφ = 25 V or 62.5 VInlet
φ = 0 VOutlet
n·σφ = 0Wall and symmetry
Electrostatic wall potential ψn·∇ψ = 0Inlet, outlet and symmetry
n·∇ψ = S/(ɛoɛr) = −4.16 × 10⁻³/(ɛoɛr)Wall
Concentrations of ions cici = co(i)exp[−zi/(kbT)]Inlet and outlet
n·[−Dici − um(i)ciφ + vci] = 0
Note: The term vci will be removed for cases without flow.
Wall and symmetry
Flow velocity v and Pressure p
Note: This will be removed for cases without flow.
v = 0Wall
n·u = 0Symmetry
p = 0Inlet and outlet
a where the solution conductivity, free space permittivity, fluid relative permittivity, ion mobility, ion diffusion coefficient, unit vector perpendicular to boundary, Boltzmann constant, electron charge, temperature and charge number of ion species are represented by S, εo, εr, um(i), Di, n, kb, e, T and z, respectively.
Table 4. Calculated t-scores of experimental displacement time difference for two flow directions of 0.5 mM KCl–NaCl solution pair with microchannels of 5 μm and 100 μm internal diameters, respectively.
Microchannel Diametert-Score
5 µm−4.49
100 µm0.07
Table 5. Calculated t-scores of experimental displacement time difference for two flow directions of 0.5 mM–0.6 mM NaCl solution pair with microchannels of 5 μm and 100 μm internal diameters, respectively.
Microchannel Diametert-Score
5 µm9.09
100 µm−1.38
Disclaimer/Publisher’s Note: The statements, opinions and data contained in all publications are solely those of the individual author(s) and contributor(s) and not of MDPI and/or the editor(s). MDPI and/or the editor(s) disclaim responsibility for any injury to people or property resulting from any ideas, methods, instructions or products referred to in the content.