Abstract
In order to study the mechanical characteristics and seepage mechanism of the structural plane under the action of seepage water pressure, the shear–seepage coupling test was carried out. It was found that with an increase in seepage water pressure, the peak shear strength, and shear stiffness of the structural plane decreased, while the peak dilatancy angle, average dilatancy angle, peak shear displacement, initial flow rate, and peak flow rate increased. The profile JRC and 3D morphology parameters under different Y values increased as seepage water pressure increased, indicating that the wear degree of the structural plane decreased. The contact area, effective aperture, average aperture, and hydraulic aperture of the structural plane all increased in phase with the increase in shear displacement, and they all increased in trend with the increase in seepage water pressure. The distribution and evolution law of the structural plane aperture were analyzed by programming using scanning point cloud data and the normal displacement value of the structure plane. It was concluded that the aperture gradually increased with the increase in seepage water pressure.
1. Introduction
The need for flood control and increasing use of hydroelectric power has promoted the development of water conservancy projects. Thus, many reservoirs have been built in recent years. However, reservoir impoundment can induce earthquakes. As a discontinuous plane in a rock mass, the structural plane has weak mechanical properties and, thus, controls the strength of the intact rock mass. In a general geological environment, the structural plane is affected mainly by normal and shear loads, which are also the main seepage channels of rock masses. Therefore, studying the shear–seepage coupling properties of the structural plane holds great engineering significance.
The mechanical and permeable properties of structure plane are affected mainly by stress, water pressure, structural plane roughness, and crack openings [1]. The existence of water in a jointed rock mass reduces the strength of soft rock joints and causes stress corrosion at the tip of non-penetrating joints in hard rock. This can easily lead to expansion. Simultaneously, the seepage pressure produced by water in the rock mass changes the stress field in the jointed rock mass, influencing the law of deformation of joints in the rock mass [2]. The two authoritative conclusions of the famous Malpasay dam accident suggest that it was caused by seepage of the joint fissure. Landslides during rainy seasons are also related to water pressure and seepage in the joints [3]. Many studies have been conducted on the factors that affect the failure of structural planes. On the basis of different engineering backgrounds, experimental studies have been conducted under two boundary conditions: constant normal stress (CNL) and constant normal stiffness (CNS). The measurement technology for structural surface morphology has been transformed from mechanical measurements [4,5] to optical measurement [6,7,8] as a result of scientific advances. This transformation has promoted the study of structural surface roughness from a 2D to a 3D scale, improved the accuracy of measurement results, and eliminated the errors caused by human subjective factors. Most of the research on the influence of normal stress and structural surface roughness has focused on the compressive strength and tensile strength based on the structural wall. The empirical formula for the shear strength is obtained by combining the 3D morphology parameters [9,10,11,12]. It can be clearly seen that normal stress, mechanical properties (uniaxial compressive strength, tensile strength, basic friction angle, etc.), and roughness coefficient affect the strength of the structural plane. Using these parameters, methods for characterizing the roughness coefficients have been proposed from different research perspectives [13,14,15,16,17].
All the underground rock masses were subjected to a certain level of ground stress and water pressure. The groundwater penetrates, compresses, and transforms the surrounding rock structural plane, changing the original stress–seepage coupling characteristics of the rock mass, i.e., the redistribution of stress affects the change in seepage [18]. In turn, the distributions of the seepage water pressure and seepage flow stress state of the rock medium are changed. The interaction between the stress and seepage field changes the stress and deformation of the rock mass and directly determines the stability and safety of rock mass engineering [19]. Owing to the limitations of the shear box sealing technology and test equipment, it is difficult to realize shear–seepage coupling tests. With regard to technology development [20,21,22], studies on shear–seepage coupling tests of structural planes under different conditions continue to emerge [23,24,25,26]. Early research was based mainly on the description of hydraulic properties, such as seepage law and crack opening of structural planes [27,28,29]. On the basis of the flow pattern of water, shear–seepage coupling experiments can be divided mainly into parallel and radiation flows. In recent years, many studies have been conducted on the effect of single fracture seepage characteristics under parallel flow conditions [30,31,32,33,34,35,36,37,38]. However, there are few investigations on the radiation flow characteristics around the excavation of tunnels or caverns based on the engineering concept that groundwater flows from the surrounding rock to the underground tunnel, i.e., in the manner of radiation flow [39]. Therefore, shear–seepage coupling testing is necessary. Nevertheless, most studies have focused on the hydraulic properties of 2D morphological structural planes under shear stress [40,41,42,43].
In this study, a single structural plane with a 3D rough morphology was used to conduct a shear–seepage coupling test under different seepage water pressure. The failure mechanism and seep age evolution law of structural plane are studied. Finally, the dynamic evolution process of structural plane aperture during shearing is obtained by combining 3D point cloud data with normal displacement. Finally, the law of water flow between structural planes and the shear–seepage coupling mechanism is analyzed.
2. Experimental Methodology
2.1. Specimen Preparation
The casting template for the rock-like material structural plane was obtained from sandstone samples of the Xujiahe Formation of the Upper Triassic in the Three Gorges water area of Chongqing. The production steps are as shown in Figure 1. (1) Cubic samples with an edge length of 100 mm were prepared using a grinding machine after processing large intact rocks. A Brazilian splitting test was performed, and the rock-like material structural plane template required for the test was prepared. (2) The upper and lower halves of the split sandstone were placed in a mold box of size 100 × 100 × 100 mm. Mineral oil was daubed on the contact surface of the mold box, and sandstone was employed as a lubrication and release agent. Cement mortar was prepared by mixing cement, sand, and water in a ratio of 3:2:1, respectively. The mixture was poured into the mold box and oscillated evenly. (3) After being held at 20 °C for 24 h, the specimen was demolded and placed in a standard concrete curing box for 28 days. After curing, the upper and lower parts of the corresponding specimens were combined to obtain a complete rock mass specimen with unfilled structural planes of dimension 100 × 100 × 100 mm. To study the shear–seepage coupling characteristics of structural planes, it is necessary to have a water injection channel to allow the entry of water into the structural plane. The shear–seepage coupling test was carried out using the radiation flow method, through which a water injection hole with a diameter of 12 mm on the upper structural plane was opened in the center of the specimen.
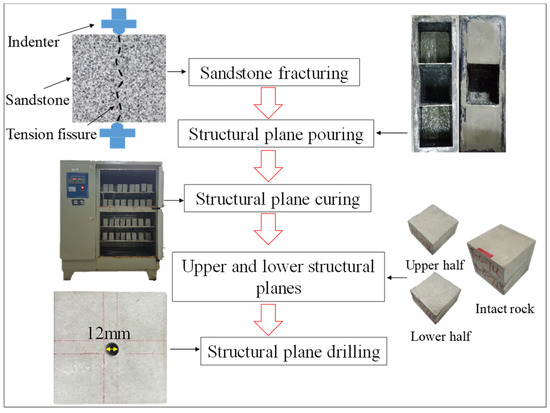
Figure 1.
Preparation of structure planes.
The basic mechanical parameters of the rock samples and rock-like materials are listed in Table 1, where ρ is the density, σc is the uniaxial compressive strength, E is the elastic modulus, ν is Poisson’s ratio, c is the cohesion, and b is the internal friction angle. By comparing the values, it can be seen that the mechanical parameters of the rock-like samples were very close to those of sandstone.

Table 1.
Mechanical parameters of sandstone similar material.
2.2. Experimental Set-Up
The test was performed on an independently developed coal and rock shear–seepage coupling test system (Figure 2a) [22,44]. The system was composed mainly of a servo control loading system, fluid source loading system, shear box and seal system, test control and data acquisition system, and a 3D scanning system. The servo loading system used a high-pressure oil pump to provide power, hydraulic drive servo valve control, shear displacement, and force loading. The normal displacement and shear displacement were measured by six LVDT displacement sensors, including four normal and two shear sensors. The average value was used to increase the measurement accuracy. The shear box and sealing system were the design core of the entire system; they included the upper and lower shear boxes and sealing rings. The water injection orifice adopted the design mode of the central hole water injection radiating around the water outlet. The shear box cavity was the installation position of the specimen. The shear box exhibited a good sealing effect during the test. The upper and lower boxes were in close contact with each other and were sufficiently flexible to meet the test requirements (Figure 2b).
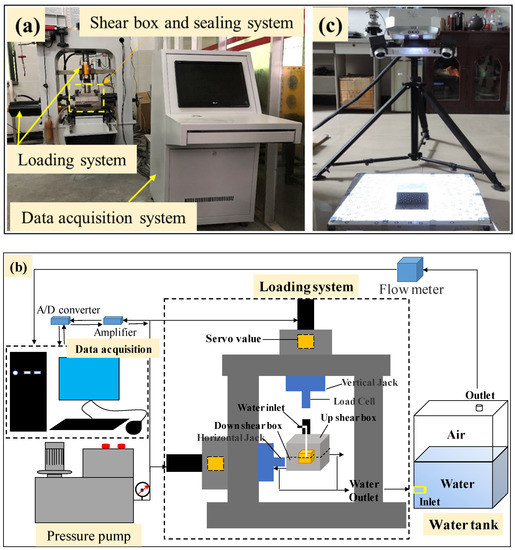
Figure 2.
(a) Coal and rock shear–seepage coupling test system, (b) schematic of the shear–seepage system, and (c) 3D scanner.
An OKIO-B-type noncontact optical scanner was used to scan the structural plane to collect and analyze the morphological characteristics of the structural plane, as shown in Figure 2c.
This instrument can automatically identify and establish a 3D coordinate system, offering high precision, a large amount of data, and convenient operation. The corresponding average scanning point distance is 0.07–0.15 mm, and the maximum scanning accuracy can reach 0.01–0.02 mm. The ASC file format data produced a point cloud, and MATLAB software was used to perform quantitative statistical analysis on the structural plane to determine the structural evolution rules of the surface morphology parameters before and after shearing.
2.3. Test Procedure
The experimental procedures of shear–seepage coupling tests included the following main steps:
- ♦
- 3D morphology scanning of upper and lower structural planes: before the test, the upper and lower structural planes were scanned to obtain 3D point cloud data.
- ♦
- Fix the sample: the upper and lower structure planes were placed into the upper and lower shear boxes, respectively, and then the shear box was fixed to the center of the equipment.
- ♦
- Apply normal load: a normal force was applied at a speed of 0.1 kN/s to the 3 MPa.
- ♦
- Apply water pressure: water pressure was applied to the set point until the water flow rate reached a steady value.
- ♦
- Apply shear load: a shear load was applied at a speed of 0.5 mm/min.
- ♦
- Test completion: the test ended when the shear displacement reached 10 mm, and the data were saved.
- ♦
- Three-dimensional morphology scanning of upper and lower structural planes: after completing the test, the upper and lower structural plane were scanned to obtain 3D point cloud data.
Use the exhaust method to measure the flow rate. The specific process was as follows: During the shearing process, the water at the outlet entered the water tank to exhaust the air in the water tank. The flowmeter was connected to the outlet of the water tank to measure the real-time flow of the discharged air. Finally, the conversion coefficient was used to obtain the water flow. The normal stress in the test was 3 MPa, and the seepage water pressures were 0, 0.1, 0.2, and 0.3 MPa, respectively. Three repeated tests were conducted for each group to ensure accuracy of the results.
3. Test Results
3.1. Evolution of Mechanical Properties
The shear stress–shear displacement curve of the structural plane under different seepage water pressures is shown in Figure 3a. When the seepage water pressure was 0 MPa, the shear stress–shear displacement curve exhibits an obvious peak point. When seepage water pressure not equal to 0 MPa was applied, there is no obvious peak point in the shear stress–shear displacement curve, which shows the characteristics of strain hardening. This is because the increase of seepage water pressure reduced the normal effective stress of the structural plane. At the same time, due to the softening effect of water, the asperities of the structural plane softened, which shows that the ability of the structural plane to resist shear was reduced during the shear process. When the main asperity on the structural plane was sheared, it did not cause a significant reduction in the shear stress.
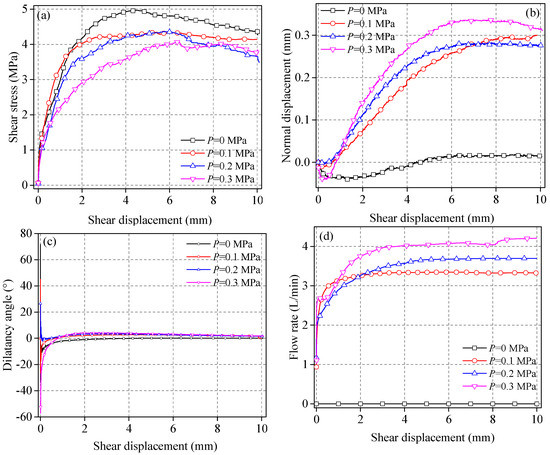
Figure 3.
(a) Shear stress-shear displacement curve, (b) normal displacement-shear displacement curve, (c) dilatancy angle-shear displacement curve, and (d) flow rate-shear displacement curve.
The normal displacement shear–displacement curve is shown in Figure 3b. It can be seen that the normal deformation of the structural plane was divided into three stages. When the shear load was applied at the beginning, the normal displacement was less than zero, and the structural plane was compressed. The normal displacement decreased first as shear displacement increased. After reaching the zero point, the normal displacement was greater than zero and gradually increased, indicating shear expansion, and the shear expansion amount gradually increased. When the seepage water pressure increased from 0 to 0.1 MPa, the difference in normal displacement was large. With an increase in seepage water pressure, the difference in the normal displacement gradually decreased. This shows that as the seepage pressure increased, the effective normal stress acting on the structural plane decreased, and, thus, the shear expansion increased. Comparing the results of water pressure of 0.1 and 0.2 MPa, the effective normal stress decreased due to the increase of water pressure, which should be due to the increase of shear expansion, but it showed a decrease. It may be due to the increase of water pressure, which increased the water flow of the structural plane, thus softening the structural plane, reducing the strength, and showing a slight decrease in the shear expansion in the later stage of shearing.
The dilatancy angle–shear displacement curve is shown in Figure 3c. It can be seen that the evolution and movement of the dilatancy angle can be divided into three stages. The dilatancy angle rapidly decreased to its minimum value in the first stage, and the structural plane was compressed. In the second stage, the dilatancy angle increased at a deceleration rate. In the third stage, the dilatancy angle was stable and did not change. The peak shear dilatancy angles are used to describe the maximum normal climbing amount of the structural plane in the shear process, that is, the shear expansion amount to describe the impact of water pressure on the shear resistance of the structural plane. In order to overcome the error caused by the evolution law of a certain point to the analysis results, the average dilatancy angles wereselected for further description, and the consistent law was obtained through verification.
The flow rate–shear displacement curve is shown in Figure 3d. The flow evolution curve was divided into two stages: the first stage was characterized by a rapid increase in flow; the second stage was characterized by a change in flow rate that is stable with increasing shear displacement. The flow rate was related to the seepage channel shape of the structural plane, and the seepage channel can be reflected by normal deformation. When the shear load was applied, the structural plane was not completely closed, and there was an initial flow. The structural plane will become damaged as shear displacement increases, and, thus, the opening will also increase. The final structural plane wear gradually became stable with the increase in flow; that is, the residual shear strength was reached, the seepage channel was fixed, and the flow hardly changed.
3.2. Evolution of Mechanical Parameters
The mechanical parameters are defined in Figure 3 as follows:
- (1)
- Peak shear stress τp: shear stress value at the maximum point of shear stress vs. shear displacement curve.
- (2)
- Peak shear displacement up: shear displacement value at the maximum point of shear stress vs. shear displacement curve.
- (3)
- Shear stiffness kn: stress gradient corresponding to shear elastic stage.
- (4)
- Peak dilatancy angle θP: maximum value of the dilatancy angles.
- (5)
- Average dilatancy angle θave: average value of dilatancy angles.
- (6)
- Peak flow rate Qp: maximum value of flow rate.
- (7)
- Initial flow rate Q0: corresponding flow rate when the shear displacement is zero.
The evolution of the mechanical parameters is illustrated in Figure 4.
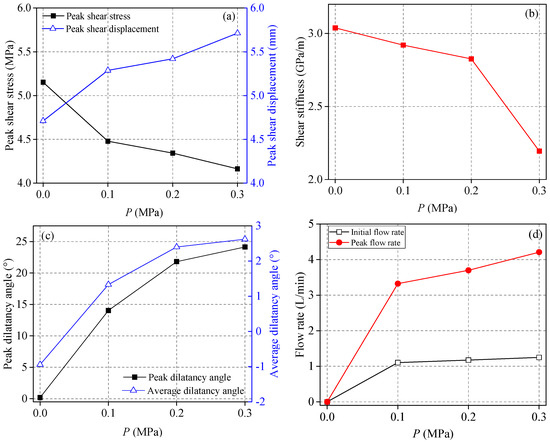
Figure 4.
Evolution of (a) peak shear stress and peak shear displacement, (b) shear stiffness, (c) peak dilatancy and average dilatancy angle, (d) flow rate.
It can be seen from Figure 4a that with an increase in seepage water pressure, the peak shear stress decreased by 13.63%, 3.036%, and 0.401%, respectively, and the reduction degree gradually decreased. This indicates that the influence of seepage water pressure on the peak shear stress was more significant when there was no water-to-water transition. However, when water exists between the structural planes, the change in the peak shear strength is not obvious with the increase in seepage pressure. The peak shear displacement of the structural plane increased gradually, increasing by 12.248%, 2.496%, and 5.406%, respectively, as seepage water pressure increased. Similar to the evolution of the peak shear stress, the peak shear displacement was significantly affected when the structural planes transitioned from water to no water. However, when water exists between the structural planes, the change in the peak shear displacement is not obvious with the increase in seepage pressure.
It can be seen from Figure 4b that with an increase in seepage water pressure, the shear stiffness decreased gradually by 3.884%, 3.219%, and 22.364%, respectively, indicating that the shear resistance of the structural plane decreased gradually. Therefore, the seepage water pressure weakened the structural plane and reduced the strength of the structural plane.
It can be seen from Figure 4c that with the increase in seepage water pressure, both the peak and average dilatancy angles showed an increasing trend, indicating that when the seepage water pressure was applied, the effective normal stress of the structural plane decreased. Thus, the possibility of slope climbing failure increases and the dilatancy increases. When the seepage water pressure P = 0 MPa, the peak shear expansion angle and the average shear expansion angle were both less than zero, and under other seepage water pressures, the peak shear expansion angle and the average shear expansion angle were both greater than zero. This indicates that the seepage water pressure reduced the effective normal stress of the structural plane, changing the failure mode from tooth cutting failure to climbing failure.
As shown in Figure 4d, with an increase in seepage water pressure, the initial flow rate and the peak flow rate will increase. However, the increase of initial flow rate was not obvious; the peak flow rate increased by 11.22% and 13.82%, respectively. It shows that when the shear displacement was 0, the structural plane was not damaged. With the increase of seepage water pressure, the equivalent normal stress decreased, which increased the hydraulic gap width of the structural plane, resulting in a slight increase in the initial flow. With the shear displacement, the structural plane will be damaged and the seepage channel will increase, so the peak flow rate will increase significantly.
3.3. Failure Characteristics of the Structural Plane
Through 3D scanning of the structural plane before and after shearing, the 3D point cloud data wereobtained. To eliminate the influence of the boundary effect, only a 90 mm × 90 mm area of structure planes was selected, and the sampling interval was 0.25 mm, as shown in Figure 5.
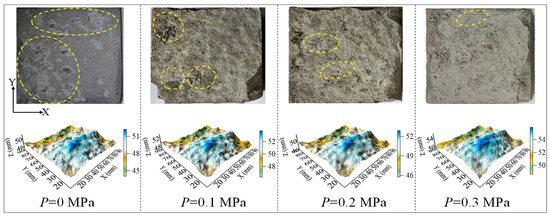
Figure 5.
Failure of the structural plane.
When P = 0 MPa, there were visible friction marks on the structural plane, and the wear area was largest. When P = 0.1 MPa, the failure area of the structural plane decreased, and the degree of damage also decreased. There was only a small amount of wear on the structural plane at P = 0.2 MPa. When P = 0.3 MPa, the wear on the structural plane continued to decrease. This shows that with an increase in seepage water pressure, the damage degree of the upper and lower structural planes decreased gradually, and the area of the damaged area also decreased gradually.
Each structural plane was divided into five equal 2D interfaces. The shape of the four section lines was obtained, which satisfies the three quantitative standards of the ISRM recommended method [45]. The section positions were 20, 40, 60, and 80 mm in the Y direction, and the spacing between the contour lines was 20 mm. The positive X-direction corresponded to the cutting direction, as shown in Figure 6.
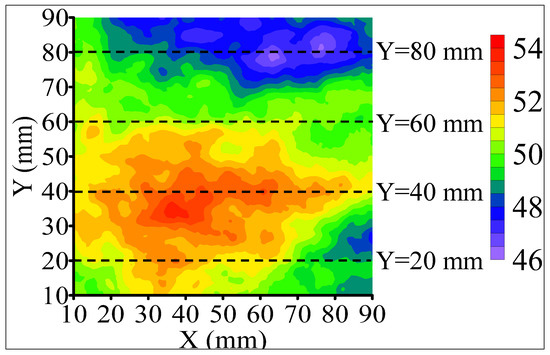
Figure 6.
Schematic diagram of 2D contour line location.
Because the correlation coefficient between the root means square z2 of the first derivative of the height of the shape curve and the roughness coefficient JRC was the largest, R2 = 0.993 [46]. Thus, z2 was used to estimate JRC, and the calculation is as follows:
where xi is the abscissa of the i point on the 2D contour line, Zi is the ordinate of the i point on the 2D contour line, and n is the number of samples.
The calculation method of the JRC of the 2D section line is [46].
JRC = 32.69 + 32.98lg(z2)
The 2D section line and the JRC of the structural plane are shown in Figure 7 and Figure 8, respectively.
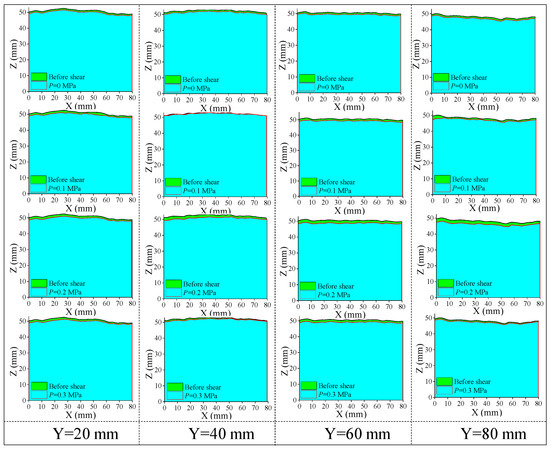
Figure 7.
Contour line of the structural plane at different Y values.
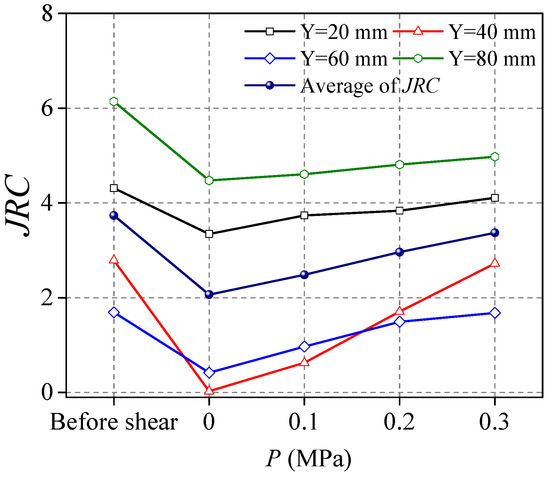
Figure 8.
JRC value of the contour line at different Y values.
As seepage water pressure increased, the 2D section line shape of the structural plane remained consistent. However, the height of the section line decreased slightly, indicating that the surface layer of the structural plane peeled off due to shear friction. Compared with its value before shearing, the JRC value of the structural plane section decreased; thus, the roughness of the structural plane was reduced, indicating that the surface of the structural plane became smooth. The JRC value of the section line increased gradually with the increase of the seepage water pressure, indicating that the damage degree of the structural plane increased gradually.
The selected 3D morphology parameters are as follows:
- (1)
- Average height z3: average height of each point on the structural plane.
- (2)
- Maximum surface elevation difference Sh: vertical distance from the highest point to the lowest point of the structural plane.
- (3)
- Maximum peak height of the surface Sp: distance from the highest point of the structural plane to the datum plane.
- (4)
- Contour area ratio SA: ratio of the developed surface area of the structural plane to the vertical projected area. The calculation is as follows:
- (5)
- Volume V: the volume of the space enclosed by the structural plane and the bottom plane.
- (6)
- Surface area St: surface developed area of the structural plane.
The evolution of the structural plane morphological parameters is shown in Figure 9. It can be seen from that with an increase in seepage water pressure, the 3D morphology parameters gradually increased. This shows that with the increase in seepage water pressure, the damage degree of structural plane was decreasing. Therefore, the seepage water pressure is an important factor affecting the shear mechanical properties of the structural plane. This is because with the increase of seepage water pressure, there is seepage water pressure in the partially closed seepage channel of the structural plane. This leads to the reduction of the effective normal stress and the wear degree of the structural plane.
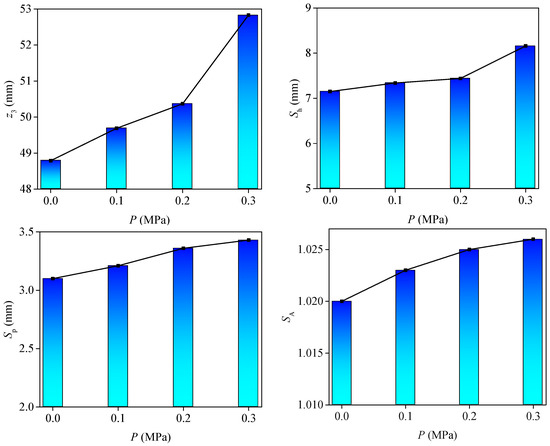
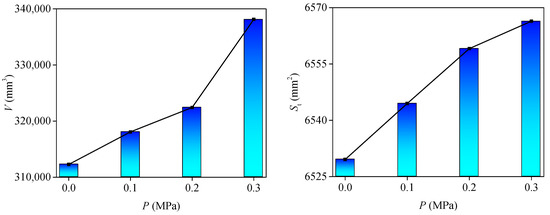
Figure 9.
Evolution of 3D morphology parameters of the structural plane under different seepage water pressures.
3.4. Evolution of Aperture
The seepage law of structural plane is closely related to the aperture, surface morphology, and contact state. The roughness of the structural plane and its contact area together lead to the complexity of the seepage state. The flow state between the structural planes is divided into laminar flow, transitional flow, and turbulence. The mechanical aperture between structural planes is defined as the average value of the gap between the upper and lower planes [47,48,49].
Assuming that the seepage of the structural plane is in the laminar flow state, the aperture is e, the wall surface is smooth and infinitely extended, and the length is far greater than the width, the structural plane can be simplified as a smooth parallel plate, and the water seepage law satisfies the following requirements:
where Q is the flow rate, g is the acceleration due to gravity, e is the hydraulic aperture, w is the width of the flow area, and i is the unit hydraulic gradient of dimension one.
It is assumed that the water enters the smooth and parallel structural planes in the state of radiation flow, the light head line values of the same radius are equal, and the flows of different water passing sections are equal; that is, the inlet flow and other assumptions are consistent with the cubic law. Combining the Laplace equation in polar coordinates and Equation (4), we can obtain the cubic law of radiation flow as follows:
where r1 is the radius of the water outlet, r0 is the radius of the water injection hole, and Δh is the difference in water head between the inlet and outlet.
For square specimens, r1 needs to be replaced equivalently. Based on the idea of integration, Equation (5) is equivalent to
where r2 the equivalent radius of the water outlet, and L1 and L2 are the length and width of the rectangular structural plane, respectively.
The equivalent hydraulic aperture of structural plane is:
The area contact rate of structural plane is defined as:
The effective aperture is:
The mean aperture is:
where is the total number of contact points between the upper and lower structural planes; ∑ix−dx is the total number of contact points on the projection coincidence surface of the upper and lower structural planes when the shear displacement is dx; Ax−dx is the contact area of the upper and lower structural planes when dx is translated; zup(x,y) is the height of the structural plane at point (x,y); and zlow(x − dx,y) is the translation dx height of the lower structural plane.
It can be seen from Figure 10a that with an increase in shear displacement, the contact area changed in three stages. In Stage Ⅰ, the contact area rapidly increased to the maximum value, corresponding to the shear of the structural plane, and the contact between the upper and lower structural planes increased. The contact area decreased gradually in Stage Ⅱ, and the corresponding structural plane expanded. The gradual stabilization of the contact area and the wear of the corresponding structural plane occurred in Stage Ⅲ.
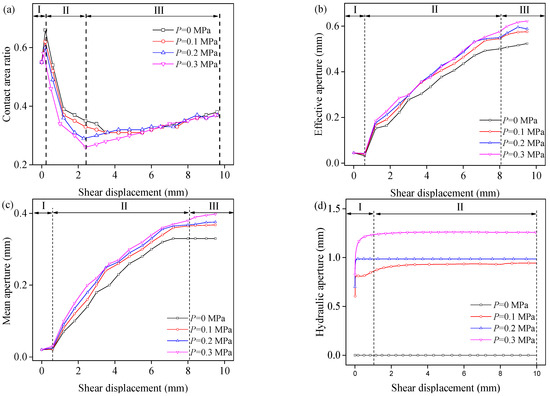
Figure 10.
Evolution of (a) contact area ratio, (b) effective aperture, (c) mean aperture, (d) hydraulic aperture.
As depicted in Figure 10b,c, with the increase in shear displacement, the effective aperture and average aperture showed three stages of change. Stage Ⅰ was to reduce the aperture to the minimum value, which is because the structural plane and the internal void was compressed, resulting in the reduction of the aperture. Stage Ⅱ was the gradual increase of the aperture, which occurred because the structural plane sheared and expanded, and the internal gap increased. Stage Ⅲ was the gradual stabilization of the aperture because the wear of the structural plane reached a stable level; at this time, the aperture did not change.
It can be seen from Figure 10d that the hydraulic opening of the structural plane was divided into two stages. They are expressed as follows: in Stage Ⅰ, with the increase of shear displacement, the hydraulic aperture width rapidly increased to the maximum value; in Stage Ⅱ, the hydraulic aperture width was basically stable. When the seepage water pressure was 0 MPa, the hydraulic aperture was always 0 mm. At the same time, with the increase of seepage water pressure, the hydraulic aperture width showed a gradual increasing trend, and the increase of seepage water pressure from 0.1 to 0.2 MPa was less than that of seepage water pressure from 0.2 to 0.3 MPa.
3.5. Evolution of Transmissivity
In the shear–seepage coupling test, the relationship between transmissivity and shear displacement is one of the most effective factors to reflect the coupling characteristics of the test. The transmissivity reflects the difficulty of water flowing through a structural plane during the shear process. The calculation is as follows:
where k is the transmissivity, Q is the flow rate of the structural plane, ω is the width of the flow area, and i is the unit hydraulic gradient. The width of parallel flow, ω, is the width of the structural plane perpendicular to the flow direction. In the radial flow, the width ω is related to the inner and outer diameters of the structural plane. The width calculation model is as follows:
The evolution of the transmissivity is shown in Figure 11. It can be seen that the transmissivity changes in two stages. In the first stage, the transmissivity increased rapidly. At this time, the destruction of the structural plane increased, which increased the aperture between the structural planes and seepage channels, leading to an increase in the transmissivity. In the second stage, the transmissivity was stable. At this time, the shape and number of seepage channels in the structural plane stabilized; thus, it remained stable.
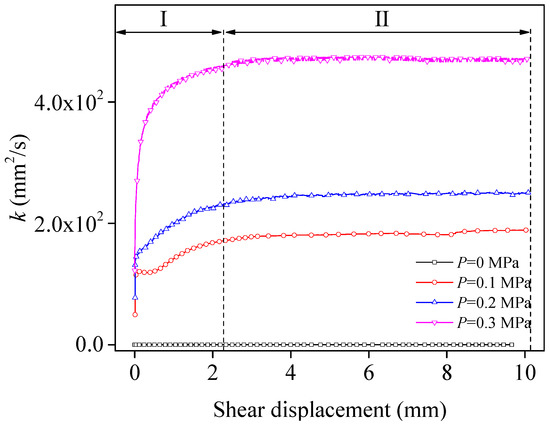
Figure 11.
Evolution of transmissivity.
4. The Distribution of Aperture
The evolution of aperture reflects the seepage mechanism in the structural plane. The spatial positions of each identification point on the upper and lower structural planes under different shear displacements were calculated by using MATLAB programming, and the aperture distribution in the shear process was analyzed on the basis of the point cloud data and the normal displacement value of the structural plane. When the structural plane was cut and staggered, the spacing between points on the upper and lower structural planes changed. Simultaneously, due to the shear expansion effect of the structural plane, the aperture was also affected. The aperture of structural plane aperture refers to the spatial distribution between the upper and lower structural planes, as shown in Figure 12.
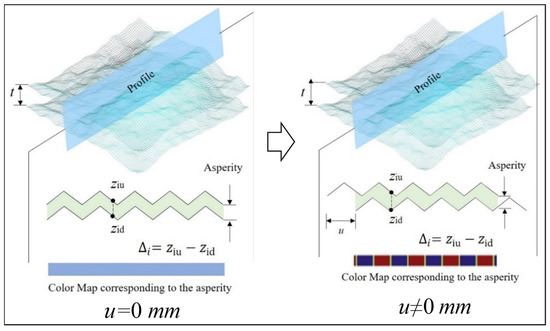
Figure 12.
Schematic diagram of aperture.
The aperture calculation is:
where Δi is the aperture of the structural plane at point i, ziu is the height of the upper structural plane at point i(x,y), and zid is the height of the lower structural plane at point i(x,y).
The 3D point cloud data of the structural plane can be used to accurately obtain the spatial coordinate points iou(x,y,z) and iod(x,y,z) of the upper and lower structural planes, respectively, in the initial state (shear displacement u = 0 mm). Here, ziou and ziod are ziu and zid, respectively. Therefore, ziou and ziod can be substituted into Equation (13) for direct calculation. When shear displacement u ≠ 0 mm, the aperture of the upper and lower structural planes are:
where ziou is the height of the upper structural plane at point i in the initial state, ziod is the height of the lower structural plane at point i in the initial state, z(i+u)ou is the height of the upper structural plane at point (i + u) in the initial state, and δn is the normal displacement when shear displacement is u.
The dynamic evolution process of the structural plane’s aperture under different seepage water pressures when the shear displacements were 0, 2, 4, 6, and 8 mm is shown in Figure 13, where the positive direction of the X-axis is the shear direction, the white line and the black line are the water inlet and seepage directions respectively. It can be seen that when the shear displacement was 0 mm, the structural plane was not completely closed; thus, the aperture was very small but not zero. It can also be verified that the initial flow rate was not zero. Under the same seepage water pressure, the aperture gradually increased with increasing shear displacement. Because there was a convex body that was cut during the shear process, the wear degree of the structural plane gradually increased, and the contact points of the upper and lower structural planes gradually decreased. Under the same shear displacement, with the increase of seepage water pressure, the aperture of the structural plane gradually increased, which is shown as P = 0 MPa < P = 0.1 MPa < P = 0.2 MPa < P = 0.3 MPa. The results show that that under the same shear position, the wear of the structural plane decreased, which can be verified by the damage of the structural plane. Under different seepage water pressure, the position and shape of the area with a large aperture in the structural plane remained unchanged, but the area increased with the increase in seepage water pressure. According to the previous analysis, applying seepage water pressure will reduce the effective normal stress between the structural planes, thus changing the failure mode. Therefore, the size of the seepage area changed.
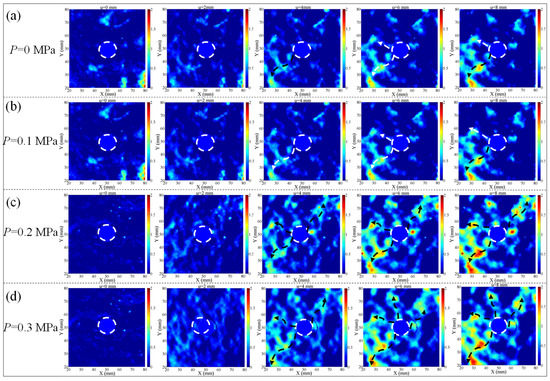
Figure 13.
Aperture distribution under seepage water pressure are (a) 0 MPa, (b) 0.1 MPa, (c) 0.2 MPa, (d) 0.3 MPa.
5. Conclusions
To study the shear–seepage coupling mechanism of the structural plane, a shear–seepage coupling test of the structural plane under seepage water pressure was performed. The mechanical properties and seepage mechanism of the structural plane were analyzed, and the following conclusions were drawn:
- (1)
- When the seepage water pressure was 0 MPa, the shear stress–shear displacement curve of the structural plane was mainly of the peak type. When P ≠ 0 MPa, the shear stress–shear displacement curve of the structural plane had no softening stage, reflecting strain hardening characteristics. The normal displacement–shear displacement curves of the structural plane exhibited a trend of shear shrinkage first, followed by shear expansion. With an increase in seepage water pressure, the amount of shear expansion increased gradually. The evolution of dilatancy angle can be divided into three stages, and the evolution of discharge can be divided into two stages.
- (2)
- With an increase in seepage water pressure, the peak shear stress decreased by 13.63%, 3.036%, and 0.401%, respectively, and the peak shear displacement of the structural plane increased by 12.248%, 2.496%, and 5.406%, respectively. The shear stiffness decreased gradually by 3.884%, 3.219%, and 22.364%, respectively. The peak shear dilatancy angle and average shear dilatancy angle were both less than zero, and under other seepage water pressures, they were both greater than zero. The initial flow rate and peak flow rate increased with an increase in seepage water pressure.
- (3)
- The section line shape of the structural plane was consistent, the height decreased slightly, and the JRC of the section line decreased, indicating that the roughness of the structural plane decreased and the surface gradually became smooth. The JRC value of the contour and the 3D morphology parameters increased gradually with an increase in seepage water pressure.
- (4)
- With the increase in shear displacement, the contact area, effective aperture, and mean aperture exhibited three stages of change trend, and the transmissivity exhibited two stages of change. When the shear displacement was 0 mm, the aperture of structural plane was very small but not zero. Under the same seepage water pressure, the aperture gradually increased with the increasing shear displacement. Under the same shear displacement, with the increase of seepage water pressure, the aperture gradually increased.
Author Contributions
J.X. contributed to experimental design; F.J. and S.P. conducted the experiment; S.P. and F.J. analyzed the data and wrote the main manuscript text; M.H. and X.Z. reviewed the manuscript. All authors have read and agreed to the published version of the manuscript.
Funding
This work was supported and financed by the National Natural Science Foundation of China (grant No. 51874055; 51974041).
Data Availability Statement
Data of this study are available from the corresponding author upon request.
Acknowledgments
The authors would like to acknowledge the editor and the three anonymous reviewers for their valuable suggestions for the improvement of this paper.
Conflicts of Interest
The authors declare that they have no known competing financial interests or personal relationships that could have appeared to influence the work reported in this paper.
References
- Esaki, T.; Du, S.; Mitani, Y.; Ikusada, K.; Jing, L. Development of a shear-flow test apparatus and determination of coupled properties for a single rock joint. Int. J. Rock Mech. Min. Sci. 1999, 36, 641–650. [Google Scholar] [CrossRef]
- Karimzade, E.; Seifabad, M.C.; Sharifzadeh, M.; Baghbanan, A. Modelling of Flow–Shear Coupling Process in Rough Rock Fractures Using Three-Dimensional Finite Volume Approach. Rock Mech. Rock Eng. 2019, 52, 4693–4713. [Google Scholar] [CrossRef]
- Cardinali, M.; Galli, M.; Guzzetti, F.; Ardizzone, F.; Reichenbach, P.; Bartoccini, P. Rainfall induced landslides in December 2004 in south-western Umbria, central Italy: Types, extent, damage and risk assessment. Nat. Hazards Earth Syst. Sci. 2006, 6, 237–260. [Google Scholar] [CrossRef]
- Barton, N.; Choubey, V. The shear strength of rock joints in theory and practice. Rock Mech. Rock Eng. 1977, 10, 1–54. [Google Scholar] [CrossRef]
- Barton, N. Review of a new shear-strength criterion for rock joints. Eng. Geol. 1973, 7, 287–332. [Google Scholar] [CrossRef]
- Grasselli, G. Shear Strength of Rock Joints Based on Quantified Description. Ph.D. Thesis, Swiss Federal Institute of Technology, Lausanne, Switzerland, 2001. [Google Scholar]
- Liu, X.; Zhu, W.; Yu, Q.; Chen, S.; Guan, K. Estimating the Joint Roughness Coefficient of Rock Joints from Translational Overlapping Statistical Parameters. Rock Mech. Rock Eng. 2018, 52, 753–769. [Google Scholar] [CrossRef]
- Rong, G.; Yang, J.; Cheng, L.; Zhou, C. Laboratory investigation of nonlinear flow characteristics in rough fractures during shear process. J. Hydrol. 2016, 541, 1385–1394. [Google Scholar] [CrossRef]
- Ladanyi, B.; Archambault, G. Simulation of shear behavior of jointed rock mass. In Proceedings of the 11th Symposium on Rock Mech, New York, NY, USA, 16–19 June 1969. [Google Scholar]
- Kulatilake, P.; Shou, G.; Huang, T.; Morgan, R. New peak shear strength criteria for anisotropic rock joints. Int. J. Rock Mech. Min. Sci. Géoméch. Abstr. 1995, 32, 673–697. [Google Scholar] [CrossRef]
- Zhao, J. Joint surface matching and shear strength part B: JRC-JMC shear strength criterion. Int. J. Rock Mech. Min. Sci. 1997, 34, 179–185. [Google Scholar] [CrossRef]
- Grasselli, G. Manuel Rocha Medal Recipient Shear Strength of Rock Joints Based on Quantified Surface Description. Rock Mech. Rock Eng. 2006, 39, 295–314. [Google Scholar] [CrossRef]
- Liu, Q.; Tian, Y.; Liu, D.; Jiang, Y. Updates to JRC-JCS model for estimating the peak shear strength of rock joints based on quantified surface description. Eng. Geol. 2017, 228, 282–300. [Google Scholar] [CrossRef]
- Chen, S.J.; Chang, J.P.; Ji, C.X.; Wu, X.Y.; Du, G.S.; Yang, Z.D. A two-parameter evaluation method of joint roughness and its experimental verification. Chin. J. Rock Mech. Eng. 2021, 40, 476–489. [Google Scholar] [CrossRef]
- Abolfazli, M.; Fahimifar, A. An investigation on the correlation between the joint roughness coefficient (JRC) and joint roughness parameters. Constr. Build. Mater. 2020, 259, 120415. [Google Scholar] [CrossRef]
- Yong, R.; Ye, J.; Li, B.; Du, S.-G. Determining the maximum sampling interval in rock joint roughness measurements using Fourier series. Int. J. Rock Mech. Min. Sci. 2018, 101, 78–88. [Google Scholar] [CrossRef]
- Barton, N. The shear strength of rock and rock joints. Int. J. Rock Mech. Min. Sci. Géoméch. Abstr. 1976, 13, 255–279. [Google Scholar] [CrossRef]
- Selvadurai, A.P.S.; Głowacki, A. Stress-Induced Permeability Alterations in an Argillaceous Limestone. Rock Mech. Rock Eng. 2017, 50, 1079–1096. [Google Scholar] [CrossRef]
- Yin, L. Basic Experimental Study on Water-Inrush Mechanism of Floor in Deep Mining; Shandong University of Science and Technology: Qingdao, China, 2011. [Google Scholar]
- Jiang, Y.; Xiao, J.; Tanabashi, Y.; Mizokami, T. Development of an automated servo-controlled direct shear apparatus applying a constant normal stiffness condition. Int. J. Rock Mech. Min. Sci. 2003, 41, 275–286. [Google Scholar] [CrossRef]
- Zhang, Q.; Li, X.; Bai, B.; Pei, L.; Shi, L.; Wang, Y. Development of a Direct-Shear Apparatus Coupling with High Pore Pressure and Elevated Temperatures. Rock Mech. Rock Eng. 2019, 52, 3475–3484. [Google Scholar] [CrossRef]
- Xu, J.; Liu, Y.X.; Yin, G.Z.; Li, B.; Ye, G. Development of shear-flow coupling test device for coal rock. Chin. J. Rock Mech. Eng. 2015, 34, 2987–2995. [Google Scholar] [CrossRef]
- Huang, N.; Jiang, Y.; Cheng, Y.; Liu, R. Experimental and numerical study of hydraulic properties of three-dimensional rough fracture networks based on 3d printing technology. Rock Soil Mech. 2021, 42, 1659–1668. [Google Scholar] [CrossRef]
- Mofakham, A.A.; Stadelman, M.; Ahmadi, G.; Shanley, K.T.; Crandall, D. Computational Modeling of Hydraulic Properties of a Sheared Single Rock Fracture. Transp. Porous Media 2018, 124, 1–30. [Google Scholar] [CrossRef]
- Chen, Y.; Liang, W.; Lian, H.; Yang, J.; Nguyen, V.P. Experimental study on the effect of fracture geometric characteristics on the effect of fracture geometric characteristics on the permaeability in deformable rough-walled fracture. Int. J. Rock Mech. Min. Sci. 2017, 98, 121–140. [Google Scholar] [CrossRef]
- Yin, Q.; Ma, G.; Jing, H.; Wang, H.; Su, H.; Wang, Y.; Liu, R. Hydraulic properties of 3D rough-walled fractures during shearing: An experimental study. J. Hydrol. 2017, 555, 169–184. [Google Scholar] [CrossRef]
- Gentier, S.; Lamontagne, E.; Archambault, G.; Riss, J. Anisotropy of flow in a fracture undergoing shear and its relationship to the direction of shearing and injection pressure. Int. J. Rock Mech. Min. Sci. 1997, 34, 94.e1–94.e12. [Google Scholar] [CrossRef]
- Tsang, Y.W.; Witherspoon, P.A. The dependence of fracture mechanical and fluid flow properties on fracture roughness and sample size. J. Geophys. Res. Atmos. 1983, 88, 2359. [Google Scholar] [CrossRef]
- Saeb, S.; Amadei, B. Modelling rock joints under shear and normal loading. Int. J. Rock Mech. Min. Sci. Géoméch. Abstr. 1992, 29, 267–278. [Google Scholar] [CrossRef]
- Koyama, T.; Li, B.; Jiang, Y.; Jing, L. Coupled shear-flow tests for rock fractures with visualization of the fluid flow and their numerical simulations. Int. J. Geotech. Eng. 2008, 2, 215–227. [Google Scholar] [CrossRef]
- Brown, S.R. Fluid flow through rock joints: The effect of surface roughness. J. Geophys. Res. Atmos. 1987, 92, 1337–1347. [Google Scholar] [CrossRef]
- Lee, H.S.; Cho, T.F. Hydraulic Characteristics of Rough Fractures in Linear Flow under Normal and Shear Load. Rock Mech. Rock Eng. 2002, 35, 299–318. [Google Scholar] [CrossRef]
- Jiang, Y.; Tanabashi, Y.; Xiao, J.; Nagaie, K. An improved shear-flow test apparatus and its application to deep underground construction. Int. J. Rock Mech. Min. Sci. 2004, 41, 170–175. [Google Scholar] [CrossRef]
- Zhang, Z.; Nemcik, J. Fluid flow regimes and nonlinear flow characteristics in deformable rock fractures. J. Hydrol. 2013, 477, 139–151. [Google Scholar] [CrossRef]
- Chen, Y.-F.; Zhou, J.-Q.; Hu, S.-H.; Hu, R.; Zhou, C.-B. Evaluation of Forchheimer equation coefficients for non-Darcy flow in deformable rough-walled fractures. J. Hydrol. 2015, 529, 993–1006. [Google Scholar] [CrossRef]
- Olsson, R.; Barton, N. An improved model for hydromechanical coupling during shearing of rock joints. Int. J. Rock Mech. Min. Sci. 2001, 38, 317–329. [Google Scholar] [CrossRef]
- Li, B.; Jiang, Y.; Koyama, T.; Jing, L.; Tanabashi, Y. Experimental study of the hydro-mechanical hehavior of rock joints using a parallel-plate model containing contact areas and artifical fractures. Int. J. Rock Mech. Min. Sci. 2008, 45, 362–375. [Google Scholar] [CrossRef]
- Chen, Y.; Lian, H.; Liang, W.; Yang, J.; Nguyen, V.P.; Bordas, S.P. The influence of fracture geometry variation on non-Darcy flow in fractures under confining stresses. Int. J. Rock Mech. Min. Sci. 2018, 113, 59–71. [Google Scholar] [CrossRef]
- Barker, J.A. A generalized radial flow model for hydraulic tests in fractured rock. Water Resour. Res. 1988, 24, 1796–1804. [Google Scholar] [CrossRef]
- Cao, C.; Xu, Z.; Chai, J.; Li, Y. Radial fluid flow regime in a single fracture under high hydraulic pressure during shear process. J. Hydrol. 2019, 579, 124142. [Google Scholar] [CrossRef]
- Ding, L.N.; Chai, J.R.; Qin, Y.; Xu, Z.G. Derivation and experimental study of the cubic law of radial flow. J. Water Resour. Water Eng. 2019, 30, 242–247. [Google Scholar] [CrossRef]
- Li, W.; Wang, Z.C.; Bi, L.P.; Liu, J. Representative elementary volume size for permeable property and equivalent permeability of fractured rock mass in radial flow configuration. Rock Soil Mech. 2019, 40, 720–727. [Google Scholar] [CrossRef]
- Cao, C.; Chai, J.; Qin, Y.; Xu, Z.G.; Tan, R. Hydraulic behavior and deformation in single fracture with asperities crushed during shear. J. Northwest A&F Univ. 2018, 46, 139–147. [Google Scholar] [CrossRef]
- Liu, Y.X. Mechanism of Structure Degradation and permeability of Rock Mass Induced by Fluid Injection under Compression-shear Loads. Ph.D. Thesis, Chongqing University, Chongqing, China, 2018. [Google Scholar]
- Muralha, J.; Grasselli, G.; Tatone, B.; Blümel, M.; Chryssanthakis, P.; Yujing, J. ISRM suggested method for laboratory determination of the shear strength of rock joints: Revised version. Rock Mech. Rock Eng. 2014, 47, 291–302. [Google Scholar] [CrossRef]
- Yang, Z.-Y.; Lo, S.C.; Di, C.C. Reassessing the Joint Roughness Coefficient (JRC) Estimation Using Z 2. Rock Mech. Rock Eng. 2001, 34, 243–251. [Google Scholar] [CrossRef]
- Olsson, W.; Brown, S. Hydromechanical response of a fracture undergoing compression and shear. Int. J. Rock Mech. Min. Sci. Géoméch. Abstr. 1993, 30, 845–851. [Google Scholar] [CrossRef]
- Liu, S.; Li, X. Experimental study on the effect of cold soaking with liquid nitrogen on the coal chemical and microstructural characteristics. Environ. Sci. Pollut. Res. 2022. [Google Scholar] [CrossRef] [PubMed]
- Liu, S.; Sun, H.; Zhang, D.; Yang, K.; Wang, D.; Li, X.; Long, K.; Li, Y. Nuclear magnetic resonance study on the influence of liquid nitrogen cold soaking on the pore structure of different coals. Phys. Fluids 2023, 35, 012009. [Google Scholar] [CrossRef]
Disclaimer/Publisher’s Note: The statements, opinions and data contained in all publications are solely those of the individual author(s) and contributor(s) and not of MDPI and/or the editor(s). MDPI and/or the editor(s) disclaim responsibility for any injury to people or property resulting from any ideas, methods, instructions or products referred to in the content. |
© 2023 by the authors. Licensee MDPI, Basel, Switzerland. This article is an open access article distributed under the terms and conditions of the Creative Commons Attribution (CC BY) license (https://creativecommons.org/licenses/by/4.0/).