Article

Simulation and Protection of Reignition Overvoltage in Wind Farm Considering Microscopic Dielectric Recovery Process of Vacuum Circuit Breaker

1
College of Electrical Engineering and New Energy, China Three Gorges University, Yichang 443002, China
2
Hainan Jinpan Electric Research Institute Co., Ltd., Wuhan 430074, China
*
Author to whom correspondence should be addressed.
Energies 2023, 16(4), 2070; https://doi.org/10.3390/en16042070
Submission received: 25 January 2023 / Revised: 9 February 2023 / Accepted: 11 February 2023 / Published: 20 February 2023

Abstract

:
The high amplitude and steep overvoltage generated by the breaking of the vacuum circuit breaker in the wind farm damages the inter-turn insulation of the transformer. There is a certain difference between the simulation results of the traditional reignition model and the measured overvoltage. It is necessary to improve the simulation model to simulate the overvoltage condition of the transformer more accurately and then select appropriate overvoltage protection measures. In this paper, based on the physical process of dielectric recovery during the opening process of the vacuum circuit breaker, a model of dielectric strength recovery is built to simulate the arc reignition of the vacuum circuit breaker. The model was applied to compare the overvoltage protection effects of RC snubbers, surge arresters, and choke coils. The simulation results show that the overvoltage amplitude and reignition times calculated by the model proposed in this paper are closer to the measured values. Compared with the traditional linear curve reignition model, the accuracy was increased by 24% and 51.2%, respectively. The parameter value of RC snubbers, the connection mode of surge arresters, and the combination mode of choke coil have an influence on overvoltage suppression. Finally, a suitable suppression scheme is proposed by installing a combined arrester on the high-voltage side of the transformer and connecting a choke coil in series, which can limit the phase-to-ground voltage and the phase-to-phase voltage to 2.43 p.u and 3.24 p.u, respectively, and reduce the steepness from 157.2 kV/μs to 22.3 kV/μs.

1. Introduction

Multiple reignitions of the vacuum circuit breaker opening in wind farms generate transient overvoltages of very high amplitude and steepness, which cause shocks to the equipment and threaten the safe and stable operation of the power system [1,2]. The overvoltage of wind farms simulated using the traditional vacuum circuit breaker model is somewhat different from the test results, and the analysis of the operating state of the equipment and risk judgment is not accurate enough; there are still accidents such as turn-to-turn and phase-to-phase insulation breakdown of the step-up transformer at the end of the wind turbine [3,4]. For this reason, it is necessary to improve the vacuum circuit breaker simulation model to more accurately simulate the overvoltage condition of transformers in wind farms and provide a reference for overvoltage protection.
Existing studies show that whether reignition occurs after a vacuum circuit breaker is opened depends on the dielectric recovery process after arc extinguishing [5]. The Helmer reignition model ignores the complex diffusion process of residual ions, electrons, and neutral particles after the arc; it considers that the gap breakdown depends only on the static withstand voltage strength, and the dielectric insulation strength increases linearly with time. It also considers the interception and the high-frequency arc extinguishing capability to realize the simulation of vacuum circuit breaker reignition [6]. Ref. [7] found that the linear fit of the dielectric recovery rate is too fast, and the simulation error is significantly based on the reignition test; further considering the mechanical properties of the contacts, the deduced dielectric insulation strength rises quadratically and nonlinearly with time. In Ref. [8], the dispersion of the gap breakdown voltage was found to be significant, so the random nature of the breakdown voltage was considered, the breakdown voltage was considered to occur in the region between two dielectric insulation strength curves, and the nonlinear contact motion was considered. The results show that considering the random breakdown voltage in a vacuum with the contact motion characteristics makes the overvoltage assessment more accurate compared to the conventional method. Ref. [9] considered that this dispersion is related to the diffusion of microscopic particles and the decrease in dielectric recovery strength caused by free metal particles. Based on multiple sets of measured breakdown voltage distribution statistics, the dielectric insulation strength curve was fitted in segments. The accuracy of the simulation was improved after considering the sudden drop in breakdown voltage caused by microscopic particles. Combined with the above studies, the simulation of wind farm reignition takes less account of the influence of the microscopic dielectric. This paper improves the dynamic insulation strength of the dielectric in the traditional reignition model from this aspect.
The residual ions, electrons, and neutral particles left in the gap after the arc extinguishment of the vacuum circuit breaker affect the breakdown voltage of the fracture gap. The recovery process of the microscopic dielectric has been studied extensively by scholars. In Ref. [10], the dielectric recovery process after arc extinguishment was divided into three stages: sheath growth, metal vapor attenuation, and static withstand voltage stage by vacuum switch dielectric recovery strength test. Most of the analytical models are used for their numerical simulation, such as the continuous transition model (CTM) describing the sheath growth, the Farrar formula for metal vapor attenuation, and the average vapor attenuation formula [11]. Based on the above theory, Ref. [12] established, for the first time, a reignition model for microscopic dielectric recovery of vacuum circuit breakers; it simulates and calculates the operating overvoltage when opening a no-load transformer and compares it with the average recovery rate, and the results show that the established three-stage recovery strength calculation model is closer to the actually measured recovery characteristics. In Ref. [13], a dielectric recovery microscopic reignition model was established to study the influence law of load circuit parameters on the reignition of small inductive currents in circuit breaker opening. Ref. [14] found that in high-frequency arc opening, the arc burning time is short, the rate of change in current is large, the cathode spot can not be fully diffused, the cathode spot distribution diameter is smaller than the diameter of the contact, the traditional analytical model is improved, the plasma is calculated, metal vapor density is increased by order of magnitude, the dielectric recovery rate becomes slower, and the probability of reignition increases. The above reignition model takes into account the physical process of microscopic dielectric recovery, which is closer to the actual vacuum circuit breaker breaking characteristics. At present, the model is less used in the study of wind farm overvoltage. This paper intends to use this model to analyze the transient overvoltage endured by wind farm transformers more accurately.
For switching overvoltages caused by vacuum circuit breakers, the main suppression measures are the installation of surge arresters and RC snubbers. Surge arresters can suppress overvoltage amplitude but not steepness; the use of RC snubbers leads to a low probability of reignition occurrence [15,16,17]. Recent studies have shown that the use of choke coils can reduce the steepness of overvoltages, with insignificant suppression of voltage magnitude, and the installation of both surge arresters and choke coils is recommended [18,19]; however, the wiring method and the number of surge arresters have not been studied and require further discussion. The high-voltage side of transformers in wind farms is usually triangularly wired, which is subjected to higher voltage stresses compared to star wiring; therefore, the effect of suppression measures on the phase-to-phase voltage also needs to be analyzed.
In this paper, firstly, an improved vacuum breaker reignition model is built in the electromagnetic transient software based on the physical process of post-arc dielectric recovery of a vacuum breaker. The model takes into account the three stages of post-arc dielectric recovery, the dynamic changes in cathode spot distribution diameter, and the actual breaking characteristics of the contacts. The proposed model is compared with the measured values in the related literature to verify the accuracy of the model, and based on the model, the reignition overvoltage of wind farms is simulated and analyzed. Finally, a systematic simulation analyses the impact of different parameter values; wiring methods; and combinations of RC snubbers, surge arresters, and choke coils on the overvoltage suppression effect. Additionally, the best solution for overvoltage suppression is proposed.

2. Vacuum Circuit Breaker Micro-Dielectric Recovery Reignition Model

A vacuum circuit breaker opening between the contacts produces an arc; the arc current occurs before reaching the natural over-zero point. If the current value is small, the arc becomes unstable and is forced to extinguish; it then enters the post-arc dielectric recovery process. The contact ends bear the transient recovery voltage (TRV), and dielectric recovery strength competes with each other. The three stages bearing the TRV size are different. Reignition and open failure may occur, and static can withstand the voltage stage if the TRV peak can be withstood; it then opens successfully. The vacuum circuit breaker opening flow chart is shown in Figure 1.
It is crucial to simulate the dielectric recovery process accurately. In order to solve the problem in the traditional reignition model where the description of the dielectric recovery process after the arc is too simple, this paper considers the physical process of sheath development and metal vapor decay, establishes a mathematical model for each stage of dielectric recovery after the arc, and considers the vacuum breaker interception and high-frequency arc extinguishing characteristics to realize the simulation of arc reignition.

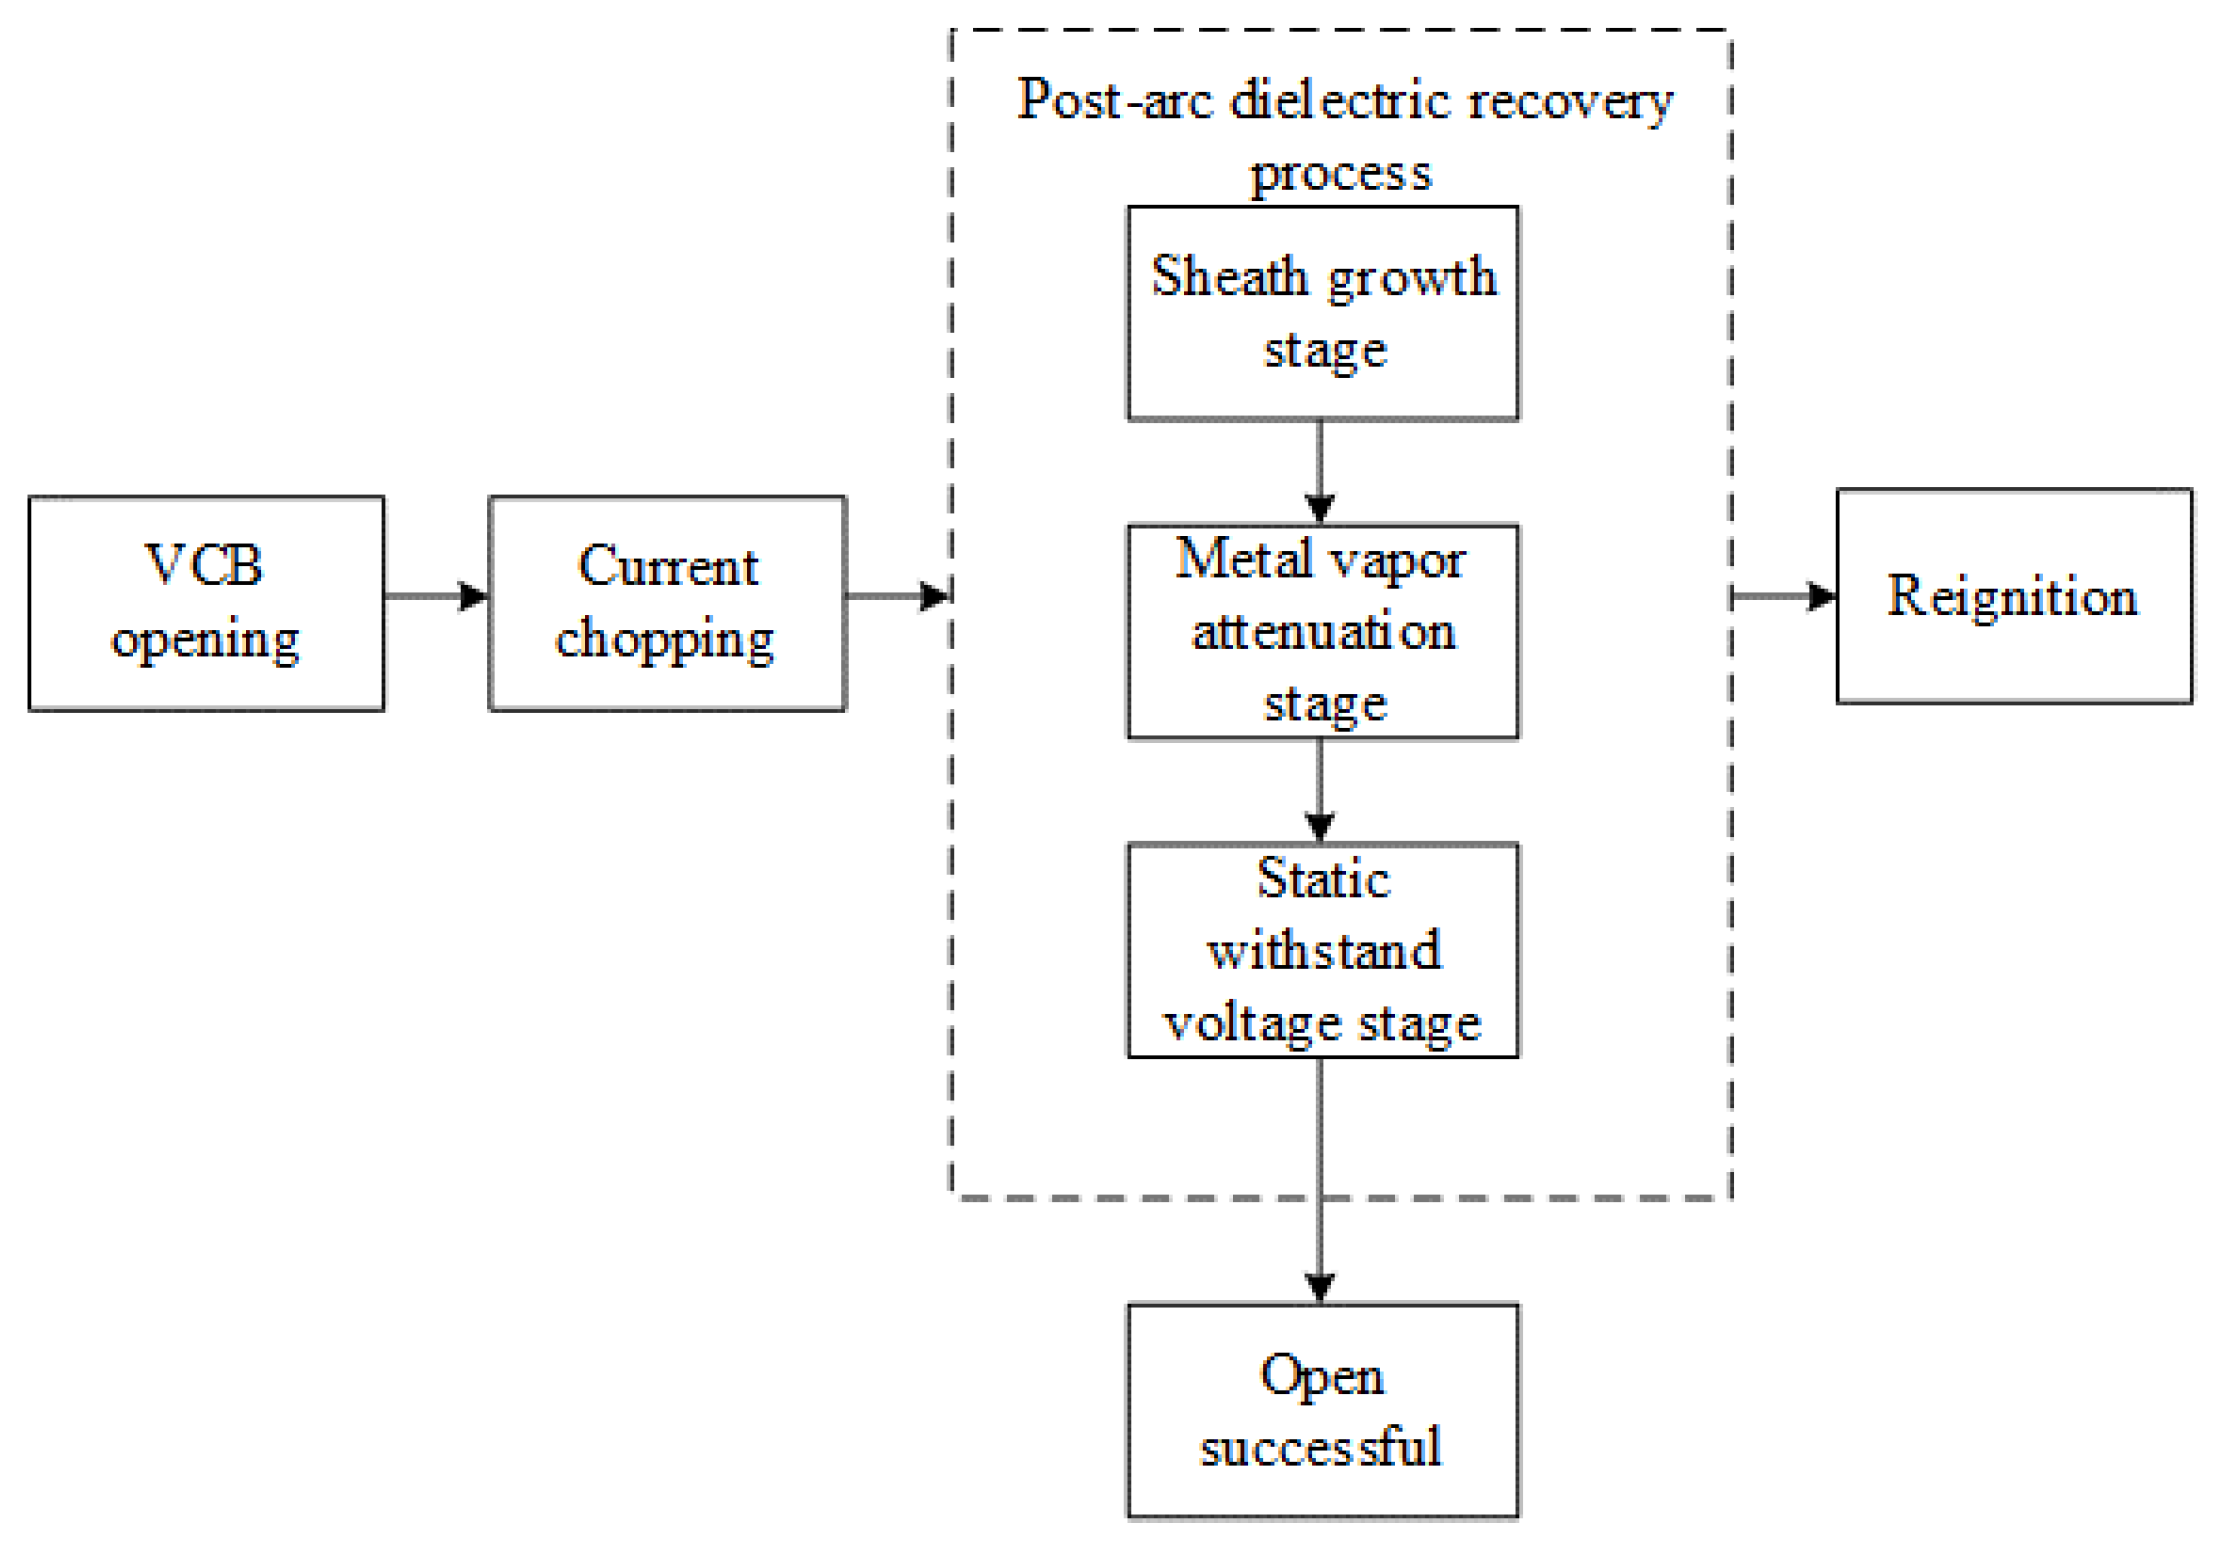
2.1. Mathematical Model of the Post-Arc Dielectric Recovery Process

2.1.1. Sheath Growth

The sheath growths were analyzed using the continuous transition model (CTM), which is modeled as follows [14]:
l 2 = 4 ε 0 u 0 9 e Z N i 1 + u T R V u 0 3 2 + 3 u T R V u 0 1
u 0 = M i 2 e ( v i d l d t ) 2
N i = N i 0 exp ( t t 0 τ ) ( δ A M P l 2 d 2 + 1 )
N i 0 = 4 I 0 v i π D 2 Z e
I 0 = d I d t t v o d
The physical meaning and values of each parameter are shown in Table 1.
Sheath stage reignition criterion:
E = 2 e Z N i ε 0 ( u T R V u 0 + u 0 2 u 0 )
Heavy breakdown occurs when the electric field strength E at the cathode surface is greater than the critical electric field strength Ec(5 × 10⁹ V/m) [13]. The metal vapor attenuation phase starts when the sheath length l is the same as the gap length d.

2.1.2. Metal Vapor Attenuation

The cathode spot of the vacuum arc is the main source of metal vapor. Under diffusive arc mode conditions, the metal vapor produced by the electrode at a sinusoidal current i = Imsinωt can be written as follows [20]:
n ( t ) = S m ω ω 2 + β 2 β ω sin ω t cos ω t + e β t e β t
ω = 2 π f
β = 1 2 R 8 K T π M
S m = K e E I m M π R 2 d
where n(t) is the average density of metal vapor; Im is the amplitude of sinusoidal current; β is the decay coefficient of metal vapor; T is the temperature of the metal vapor in the gap after the current crosses zero, taken as 2000 K; K is Boltzmann’s constant, and its value is 1.38 × 10⁻²³ J/K; E is the corrosion rate, taken as 61 μg/C; Ke is the evaporation coefficient of the electrode, taken as 4; M is the metal vapor atomic mass, where copper is 1.062 × 10⁻²⁵ kg; and R is the cathode spot distribution radius.
The limit metal vapor density of the vacuum circuit breaker is in accordance with the Paschen curve law. When the product of metal vapor density and gap opening distance is about 3 × 10¹⁹ m−2, the gap is considered to be broken [5].
When the average free travel of electrons is the same as the gap length, the dielectric recovery process after the vacuum circuit breaker arc enters the static pressure resistance stage. The relationship between the average free travel of electrons λe and the critical density of metal vapor nc is given by the following equation [21]:
n c = 1 2 λ e π r C u 2
where the copper ion radius rCu is taken as 1.278 × 10⁻¹⁰ m.

2.1.3. Static Withstand Voltage Stage

At this stage, the vacuum circuit breaker gap returns to the vacuum state; the breakdown at this time is a vacuum breakdown, and the relationship between the impact withstand voltage of the 40.5 kV vacuum interrupter, and the contact gap length is as follows [22]:
u d = 70.12 d 0.56
The contact gap length d is obtained from the measured breaking speed characteristic curve [23]. The magnitude of the transient recovery voltage (uTRV) is compared with the static shock voltage (ud) of the circuit breaker, and the vacuum gap is broken when uTRV is greater than ud.

2.1.4. Cathode Spot Distribution Diameter

The calculation of the initial plasma density and metal vapor density requires the cathode spot distribution diameter D. When the vacuum circuit breaker reignites, the contact gap flows through the high-frequency current; the arc burning time is short; the cathode spot is difficult to spread to the edge of the contact; the contact utilization rate is reduced; D takes the diameter of the contact, which makes the calculated density value small; there are deviations from the actual; and the model needs to be introduced for the acquisition of D. Assuming that the cathode spots are distributed circularly, and the velocity v of the cathode spots in all directions is the same, D can be written as follows [20]:
D = 2 v t ( 2 v t < D c ) D c ( 2 v t D c )
where v is the diffusion rate of the cathode spot, proportional to (di/dt)1/2 [14], and t is the arc-burning time. When the arc-burning time is long enough, D equals the diameter of the contact Dc.

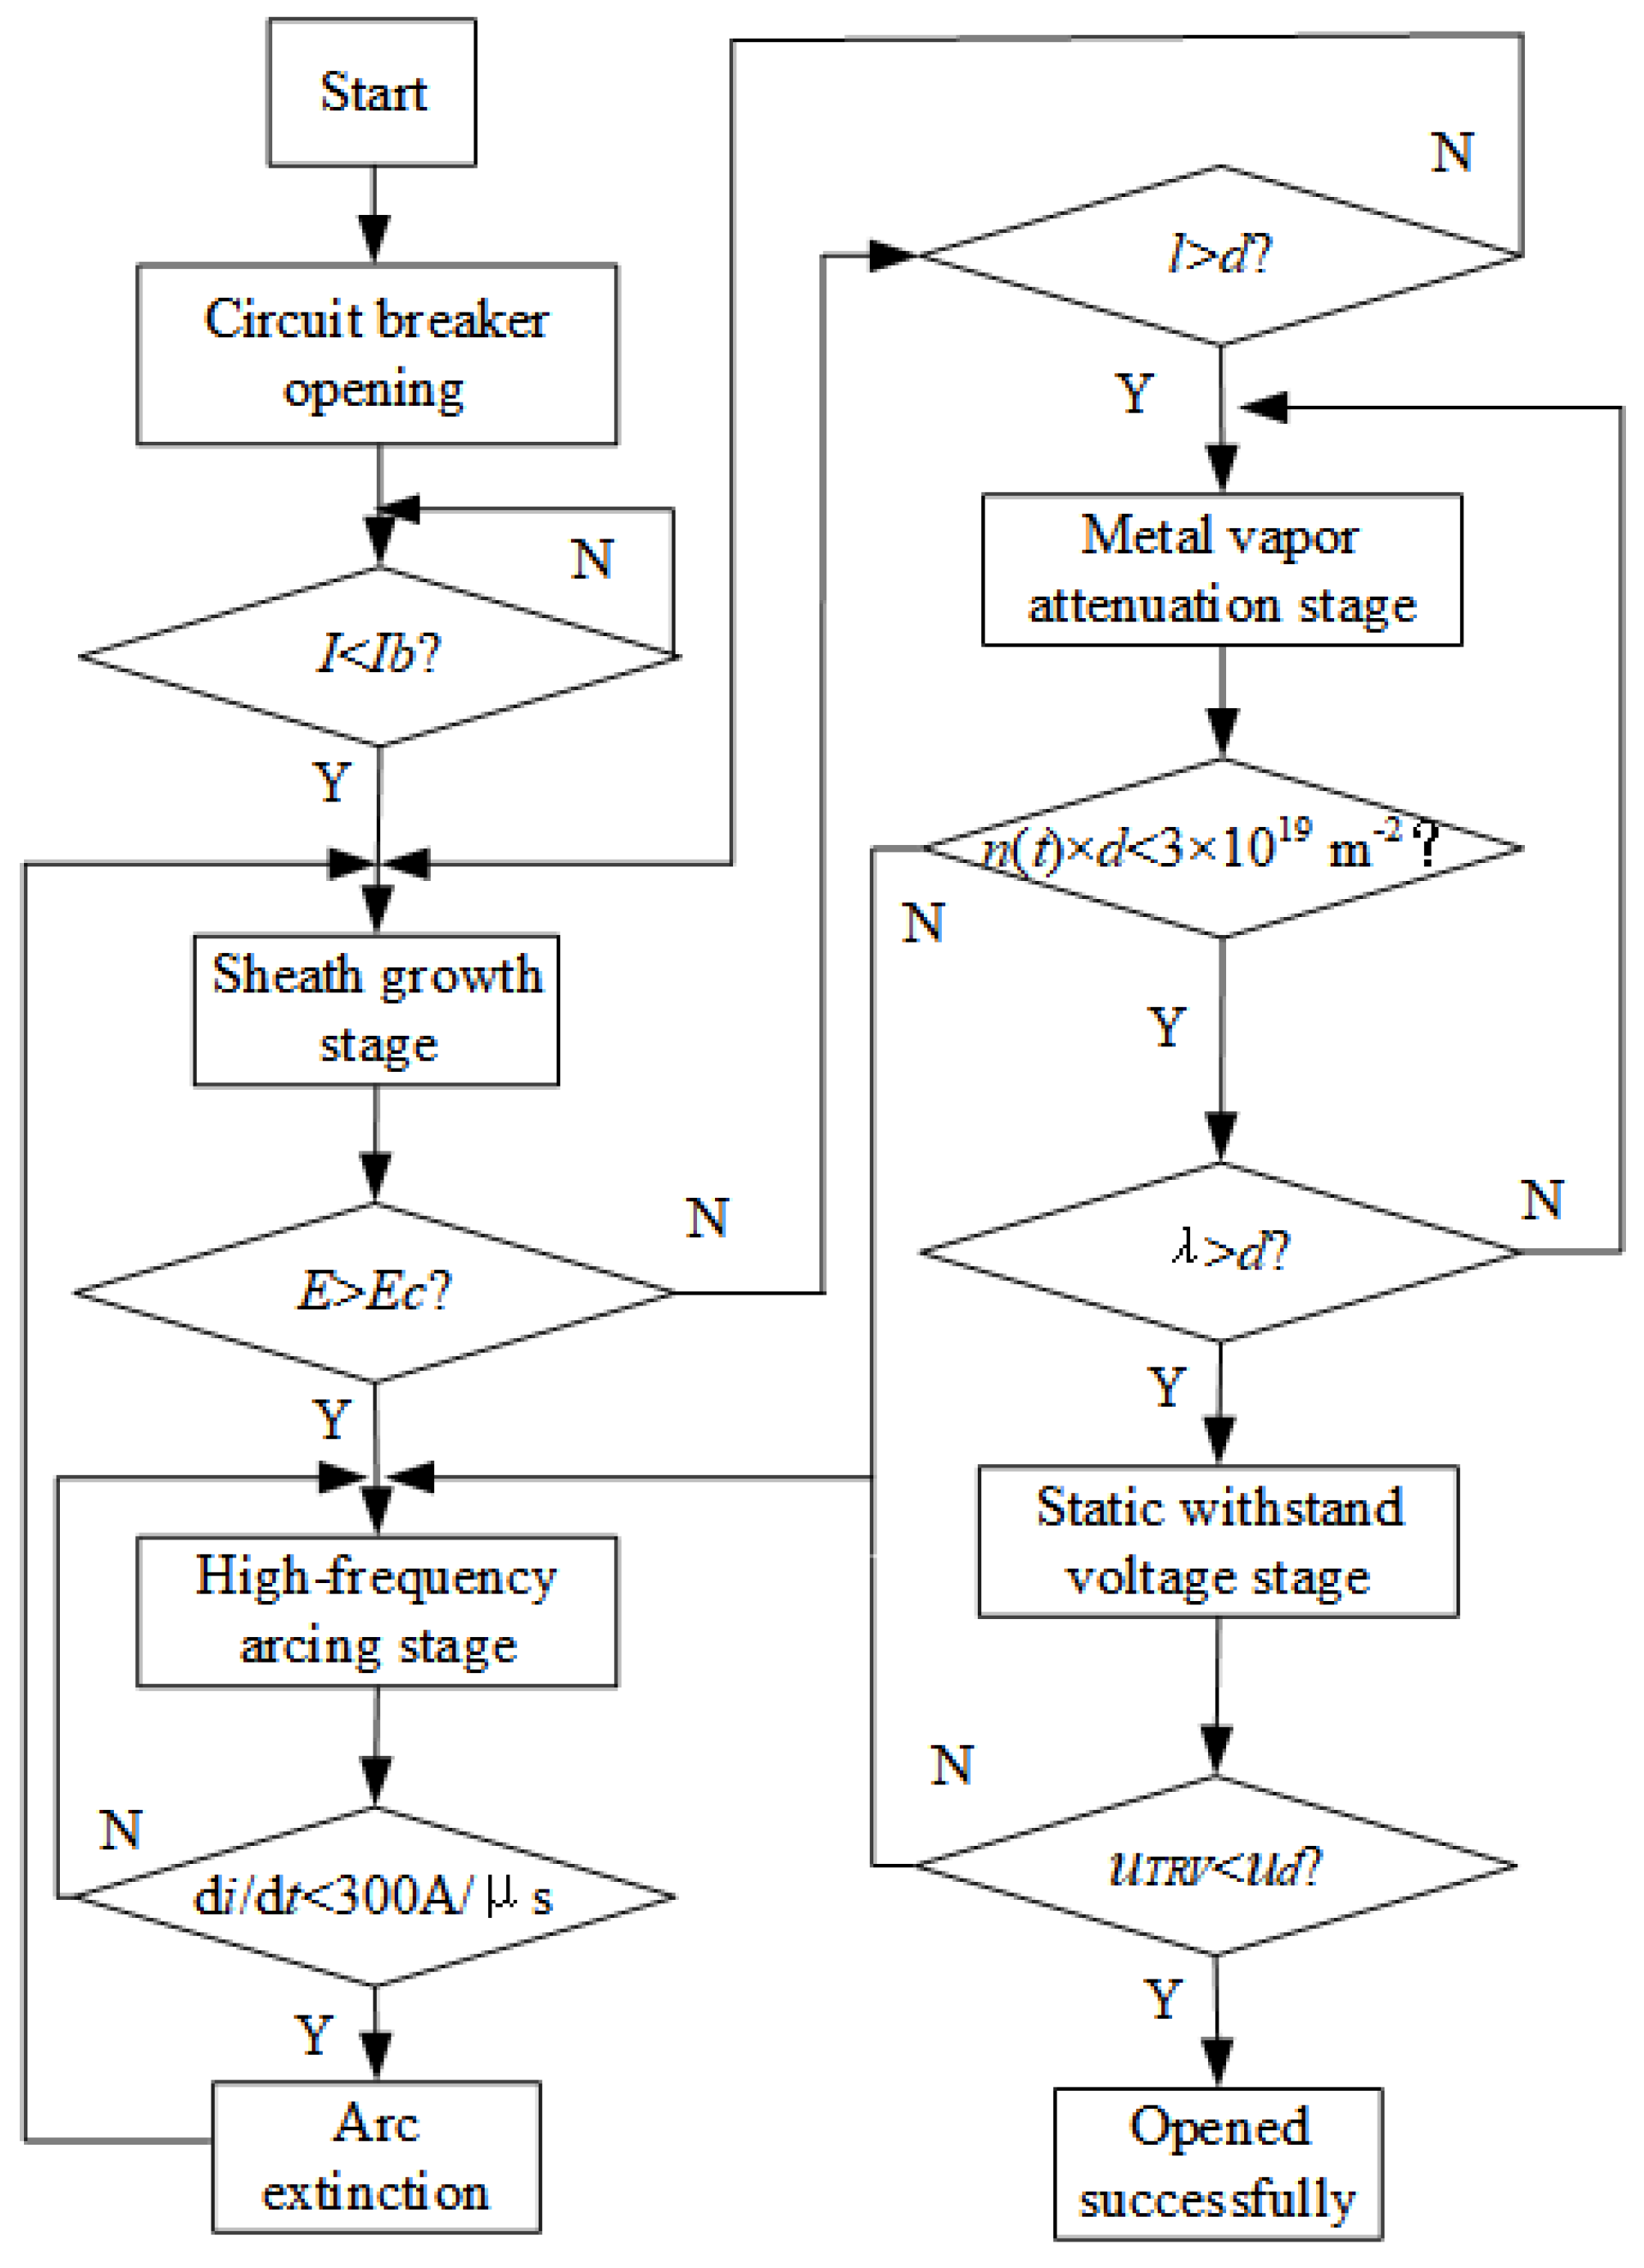
2.2. High-Frequency Arc Extinguishing Capability

Reignition leads to the gap flow through the high-frequency current, and its superposition on the frequency current appears as a large number of over-zero points; due to the initial arc current change rate being large, the vacuum circuit breaker can not cut off the high-frequency current. With the decay of the current, the current change rate gradually decreases after a few cycles. When the current is over zero, and the current change rate is small enough, the high-frequency current is cut off, so the critical value of the current change rate can be used on behalf of the vacuum. Therefore, the critical value of the current change rate can be used to represent the high-frequency current extinguishing ability of the vacuum circuit breaker. The range of the critical value is 100~600 A/μs [3]. In this paper, the critical current rate of change in simulation is set to 300 A/μs.

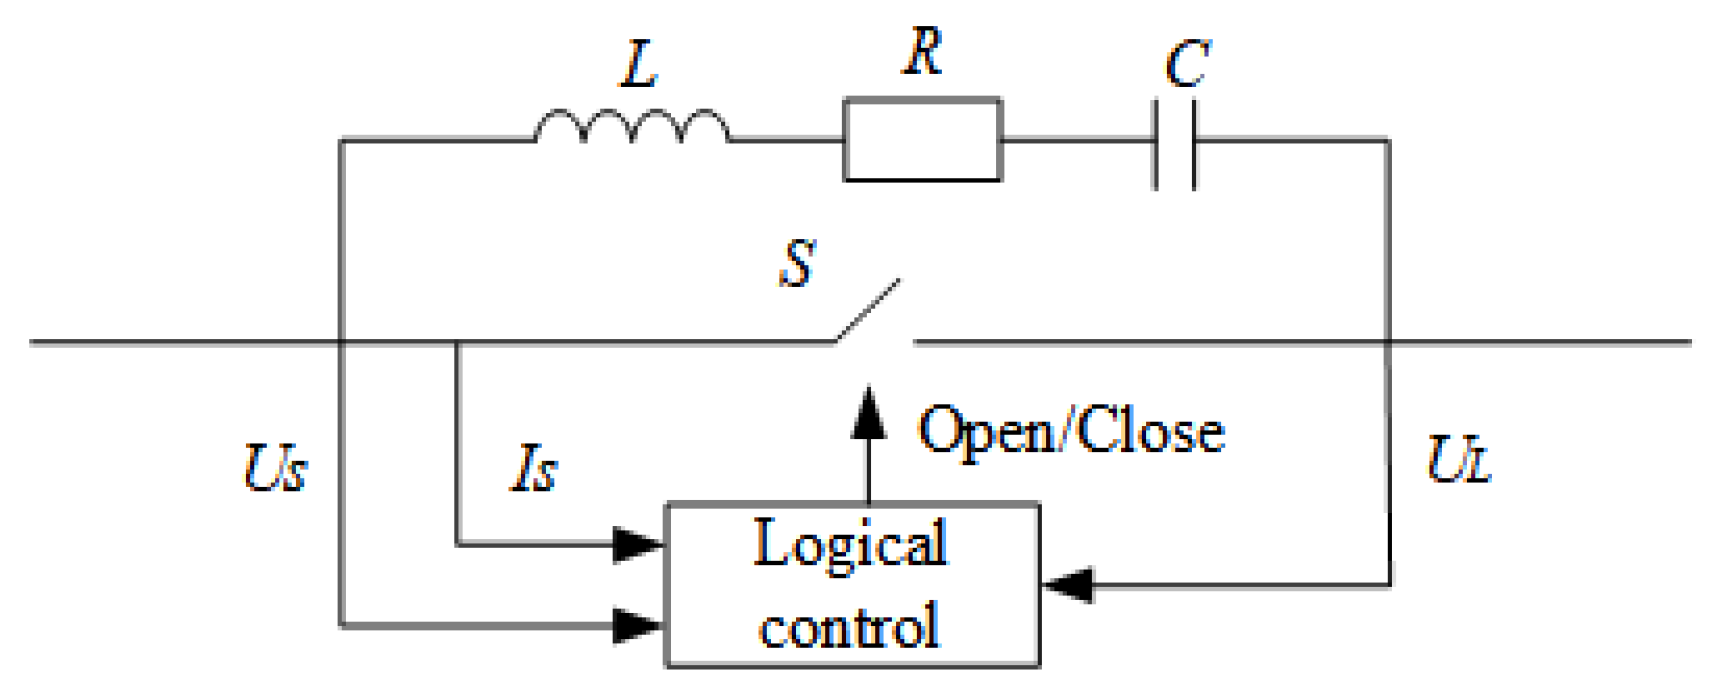
2.3. Vacuum Circuit Breaker Opening and Closing Logic

The built vacuum circuit breaker reignition model is shown in Figure 2. The model consists of an ideal switch, logic control module, and stray components. The ideal switch is set to infinity resistance (100 MΩ) when it is broken, and the arc resistance is replaced by a very small resistance (0.01 Ω) when it is closed. The logic control module controls the opening and closing state of the switch; the capacitance of the stray component is set to 200 pF, the resistance is set to 50 Ω, and the inductance is set to 50 nH.
The simulation frequency cut-off current value Ib is taken as 3 A, and the simulation step is taken as 0.02 μs. The specific simulation flow is shown in Figure 3.

3. Wind Farm Vacuum Circuit Breaker Reignition Overvoltage Model Validation

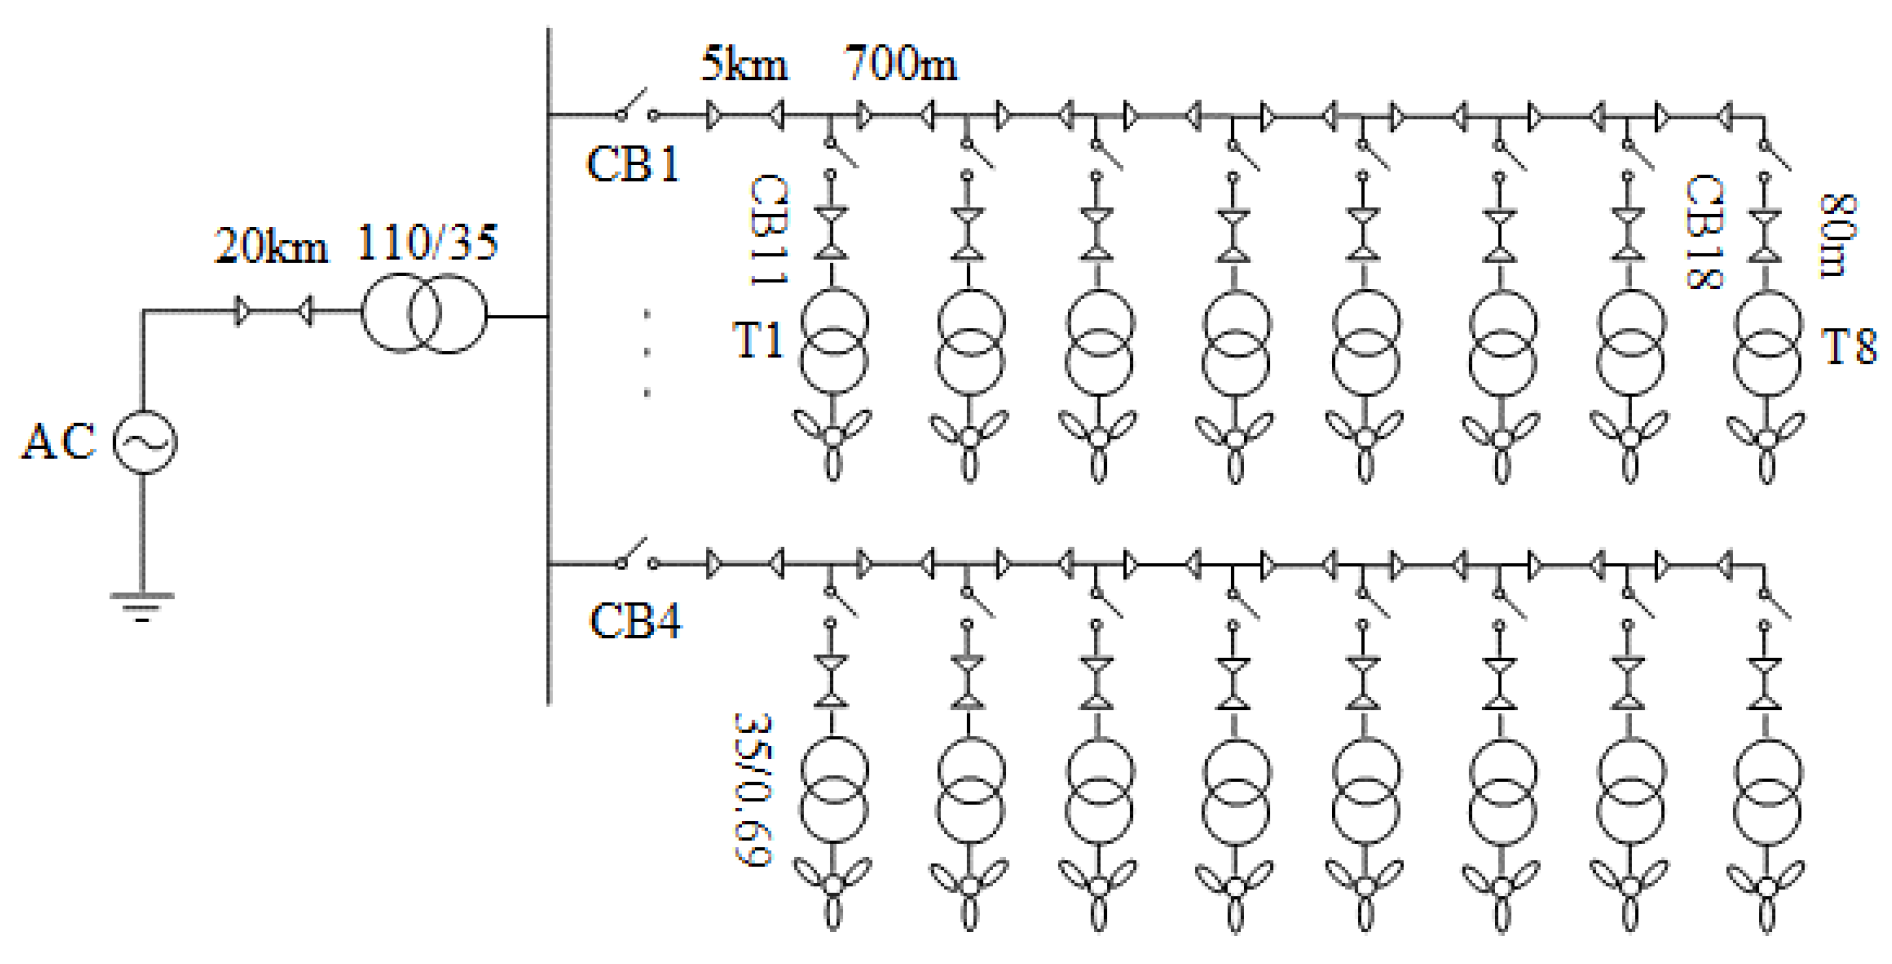
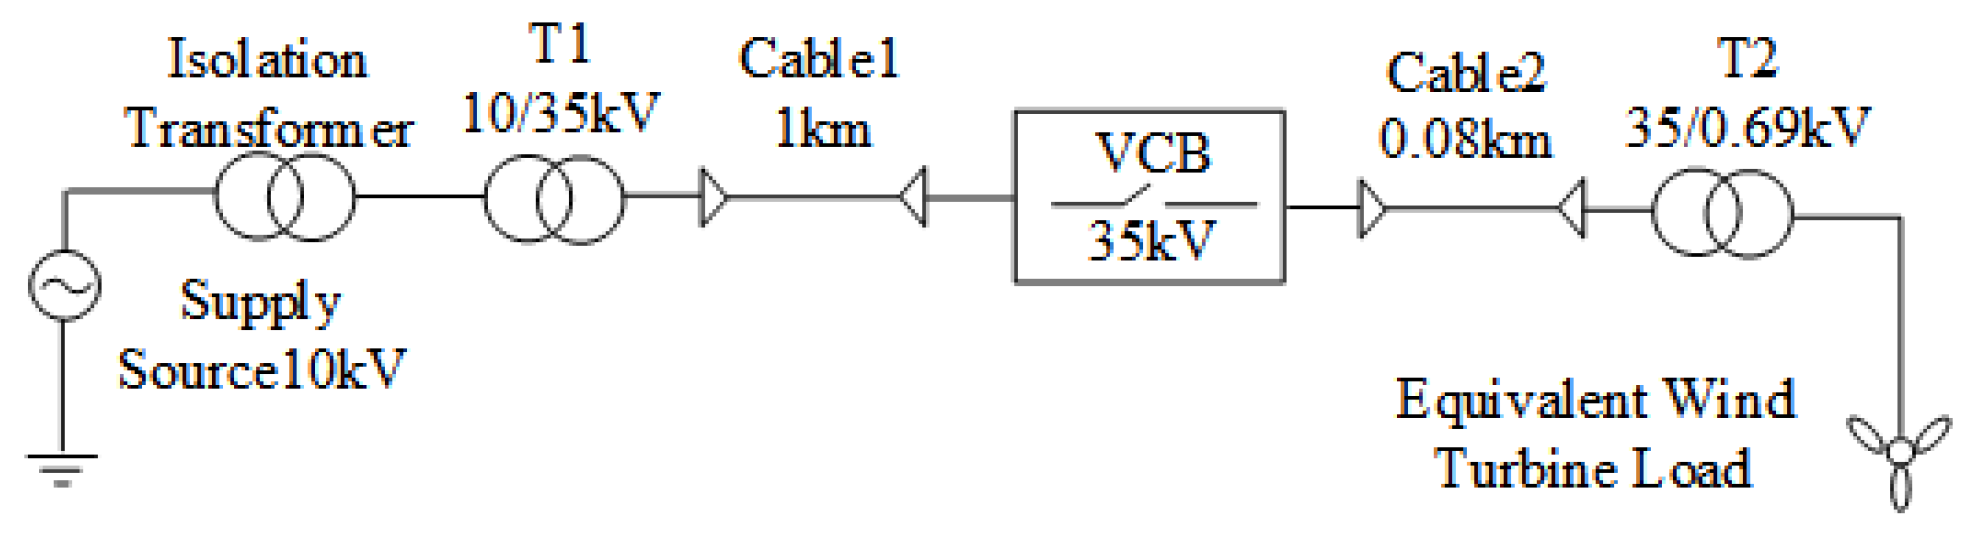
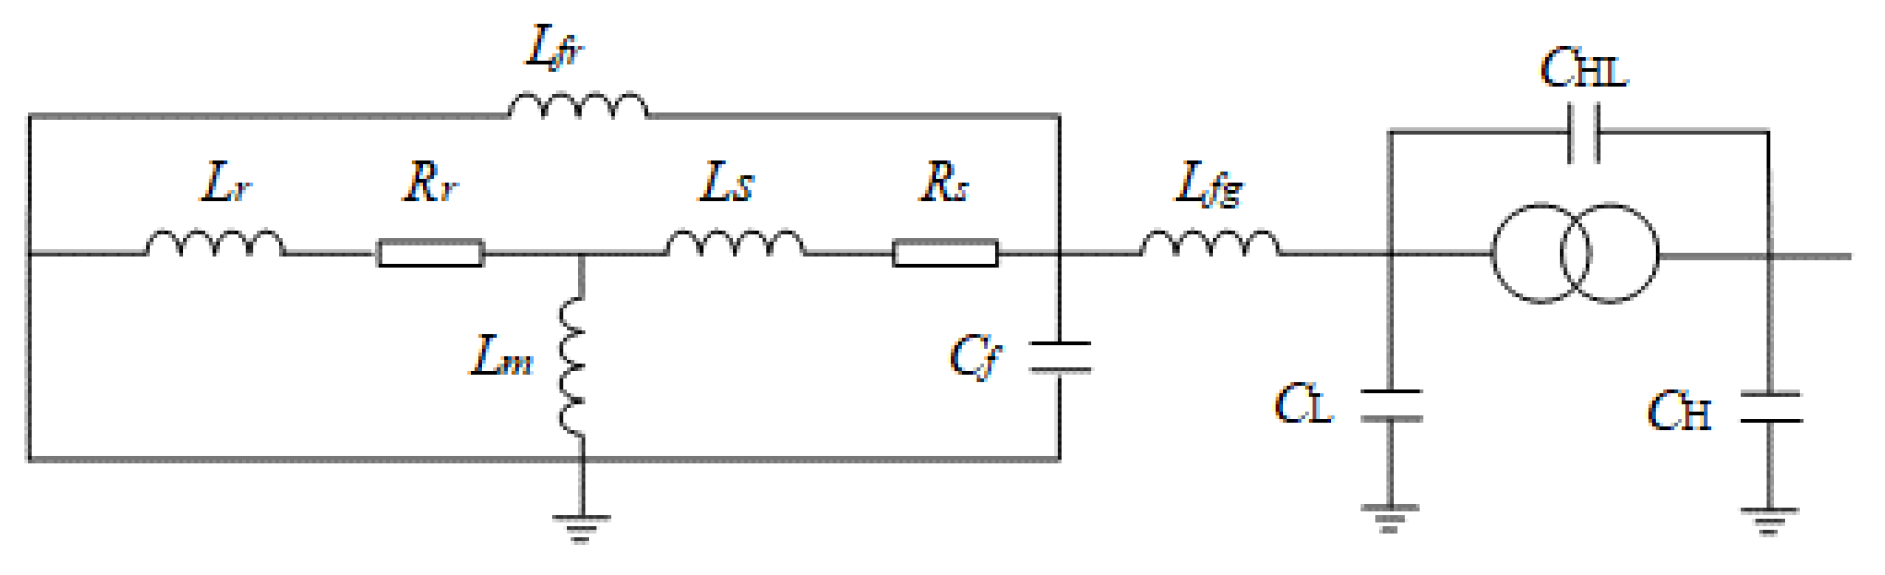
3.1. Overall Wind Farm System Model Building

The typical electrical layout of the wind farm is shown in Figure 4, and its collector line wiring structure is chain-shaped, with the entire wind farm consisting of four feeders in parallel and eight wind turbines connected to a single feeder with a 700 m spacing between neighboring turbines on the feeder. The cable length from the bottom of the turbine to the nacelle step-up transformer is about 80 m [24]. The voltage at the wind turbine end is 690 V, which is raised to 35 kV through the booster transformer, and the high voltage side of each booster transformer is connected to each other using collector lines to form a joint unit, which is finally connected to the booster station for voltage boosting.
In the simulation model, the step-up transformer models its high-frequency characteristics by connecting stray capacitors in parallel, with the high-voltage side capacitor CH = 1 nF, the low-voltage side capacitor CL = 3.1 nF, and the inter-high-voltage capacitor CHL = 3 nF [3]. The switching transients (about 3–5 ms) generated during the vacuum circuit breaker shutdown are much larger than the doubly fed fan control circuit response time (about tens to hundreds of milliseconds); therefore, for transient studies, the DFIG is mostly modeled as a high-frequency induction motor impedance, which is connected in parallel with its control circuit impedance as well as in series with a harmonic filter. See Figure 5 for the stator-side equivalent resistance Rs = 0.00047 Ω and inductance Ls = 0.0283 mH, rotor-side equivalent resistance Rr = 0.00053 Ω and inductance Lr = 0.0305 mH, motor excitation inductance Lm = 1.21 mH, stator and grid-side filter inductance Lfr = 1 mH and Lfg = 0.73 mH, and filter capacitance Cf = 100 μF [25]. The frequency-dependent (phase) model provided by the transient electromagnetic software was chosen for the three-core cable, and the metal shield was grounded via a 0.1 Ω resistance [26].

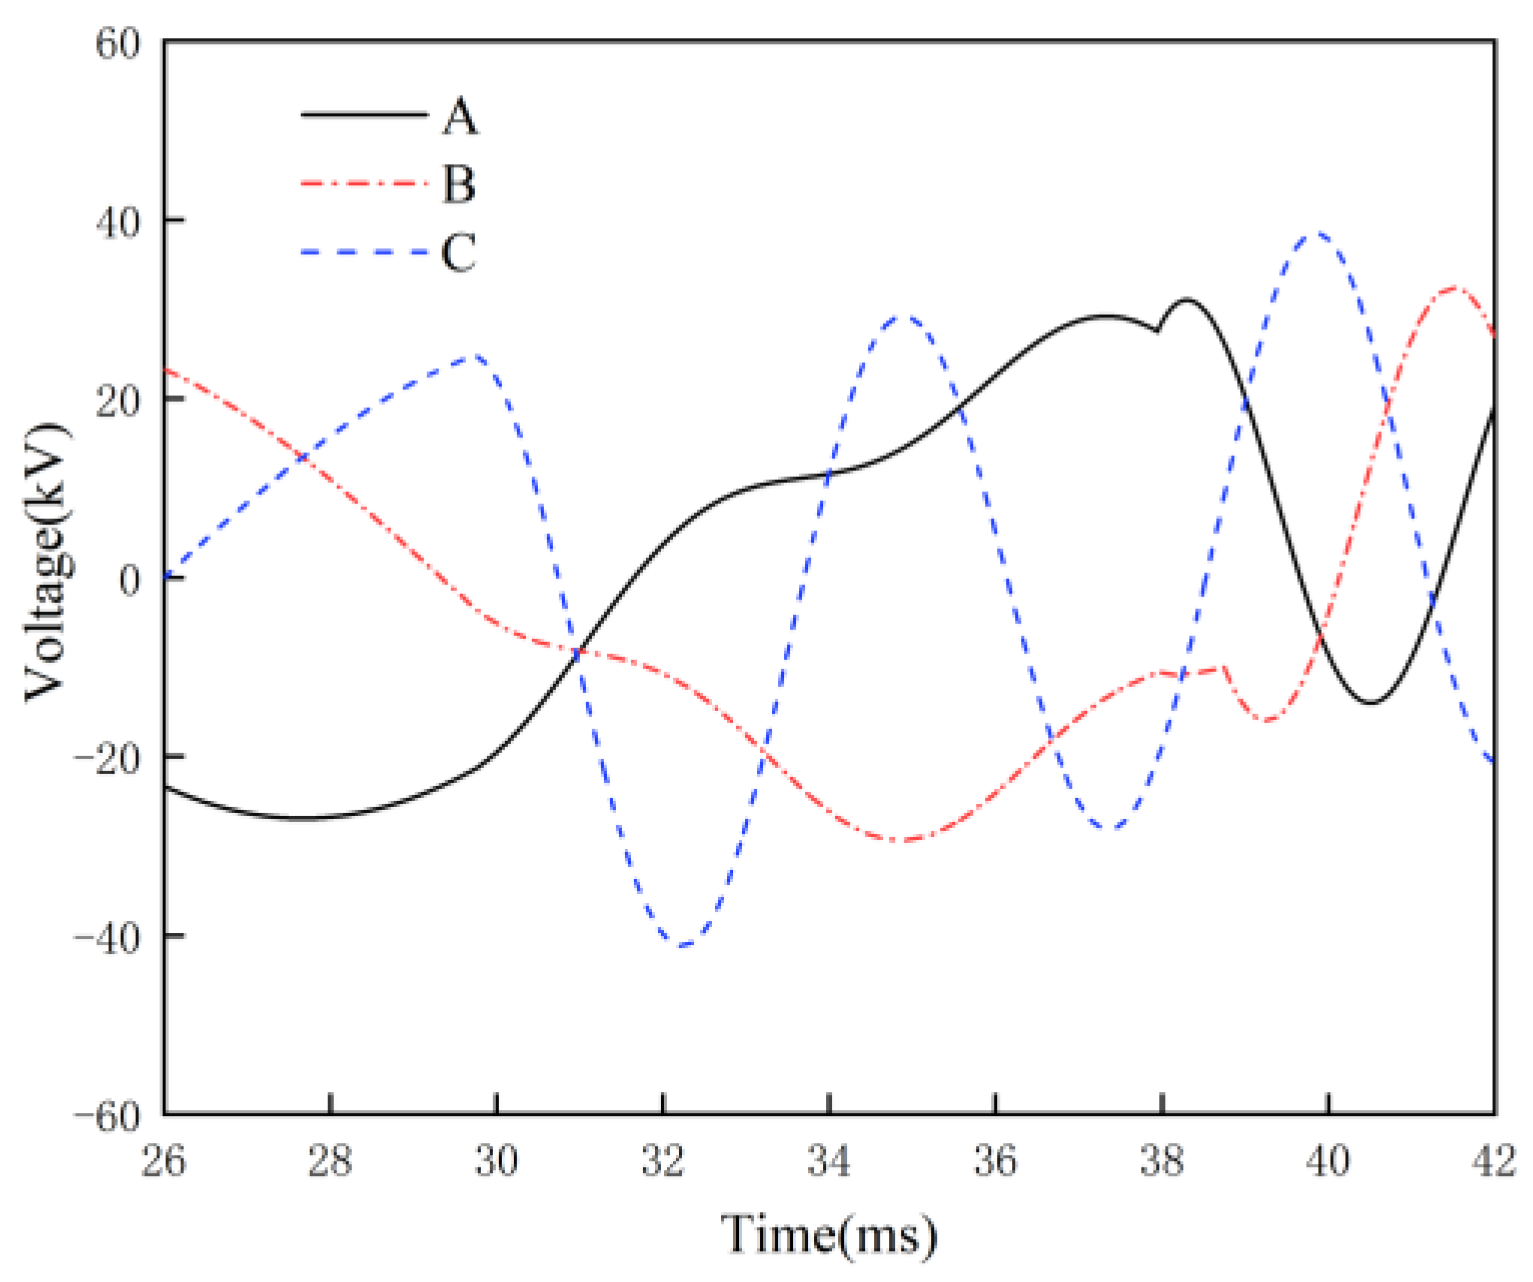
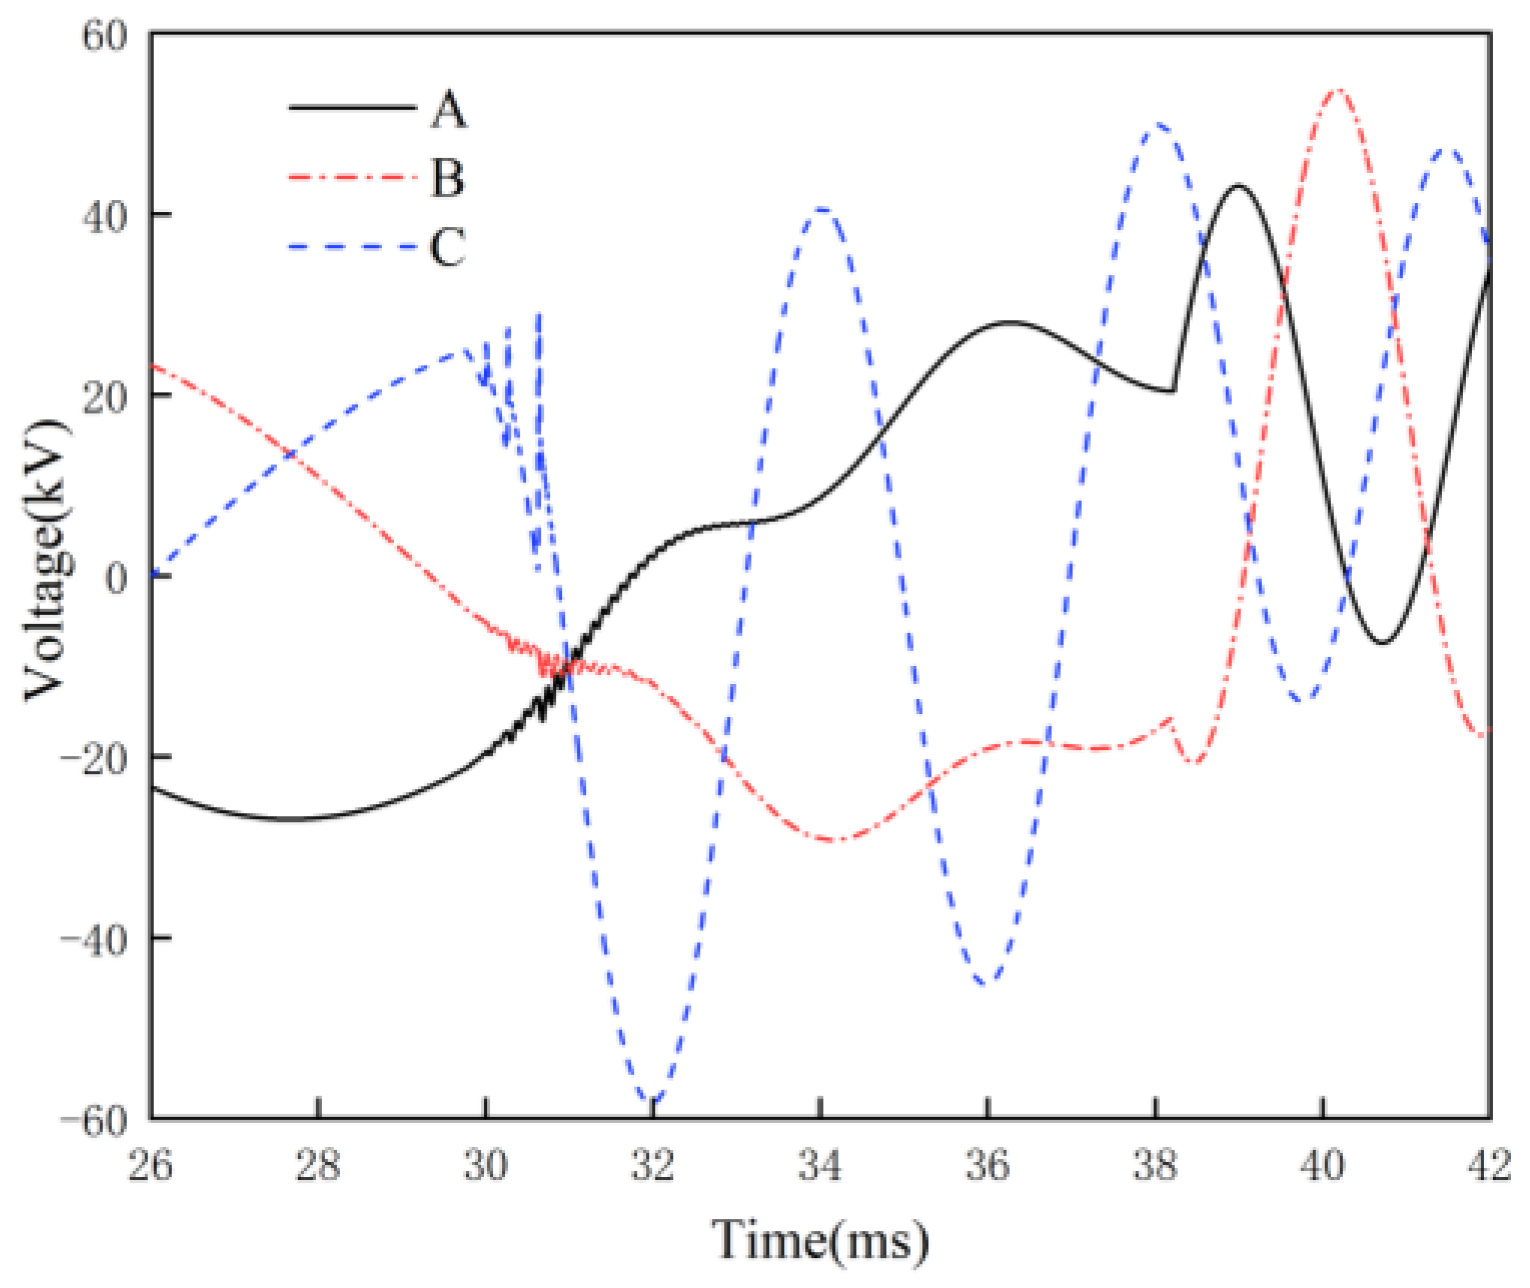
3.2. Vacuum Breaker Model Validation

In order to verify the effectiveness of the vacuum breaker model built in this paper, the same simulation model as the wind farm testbed arrangement in the paper [27] was built in the transient electromagnetic software (see Figure 6). The transformer, cable, and vacuum breaker were used in the high-frequency model mentioned above, and the wind turbine model was replaced by the reactor equivalent as in the paper [27] test. The simulation results are shown in Figure 7, which includes the comparison of the effect of traditional calculation methods (linear and quadratic fitting of dielectric dynamic insulation strength curve). The peak voltage, voltage steepness, number of reignitions, and duration of reignition were selected as the comparison indexes [9], and the comparison results are shown in Table 2.
Among the above three models, the values of critical parameters for the linear and quadratic methods were taken from the empirical values given in the papers [4,7,9]. When combining the data in Figure 7 and Table 2, it can be seen that the peak overvoltage of the conventional model simulation is larger than the measured value, and the errors of the linear and quadratic methods are 26.9% and 20.8%, respectively. The steepness, number of reignitions, and duration of reignition are smaller than the measured values, with errors of −11.9%, −58.1%, and −23.8% and −14.8%, −30.2%, and −9.5%, respectively. Considering the vacuum circuit breaker microscopic dielectric recovery simulation, the voltage peak, steepness, number of reignitions, and reignition duration are close to the measured values with errors of 2.9%, 6.5%, −6.9%, and 4.8%, respectively. It was also found that the overvoltage of the conventional method rises smoothly according to the fitted linear and quadratic curves, while the overvoltage simulated by the proposed method rises to fluctuate, the waveform is more accurate to the measured value, and the reignition process is more precise.
The analysis shows that the traditional linear method assumes that the contact gap is linearly proportional to time (constant opening speed), and the withstand voltage rises linearly with time, which is too fast to recover compared with the actual withstand voltage characteristics and ignores the low-voltage breakdown situation. Additionally, the gap withstand voltage value calculated at the later stage is large, resulting in a higher breakdown voltage when reignition occurs, a reduced number of reignitions, and a shorter reignition duration. The secondary method assumes constant acceleration of contacts, linear increase in opening speed, and nonlinear increase in withstand voltage with time. The simulation has a good fit in the early stage and the number of reignitions increases. However, because the low voltage breakdown is also ignored, the overall situation is lower than the actual measurement, and the breakdown voltage is large in the later stage.
By using the reignition model in this paper, the simulation found that the arc reignition mainly occurs in the metal vapor attenuation and static withstand voltage stage. The TRV of metal vapor attenuation stage is smaller than that of static withstand voltage stage, so when reignition occurs in metal vapor attenuation stage, the over-voltage after the reignition is significantly lower than the over-voltage of the last reignition. To achieve the low voltage breakdown in the measured waveform, the number of simulated reignition is higher than the traditional model. The static withstand voltage stage determines the overvoltage of the final reignition, and its withstand voltage value is obtained according to the measured breaking speed, so the peak overvoltage is closer to the actual measurement. Compared with the traditional linear curve reignition model, the reignition model built in the paper significantly improved the accuracy of overvoltage peak, reignition number, and reignition duration by 24%, 51.2%, and 19%, respectively. Compared with the traditional secondary curve reignition model, the accuracy of the overvoltage peak and reignition number improved significantly by 17.9% and 23.3%, respectively. It can be seen that the establishment of a detailed model of the physical process of post-arc dielectric recovery further improves the simulation accuracy of overvoltage.

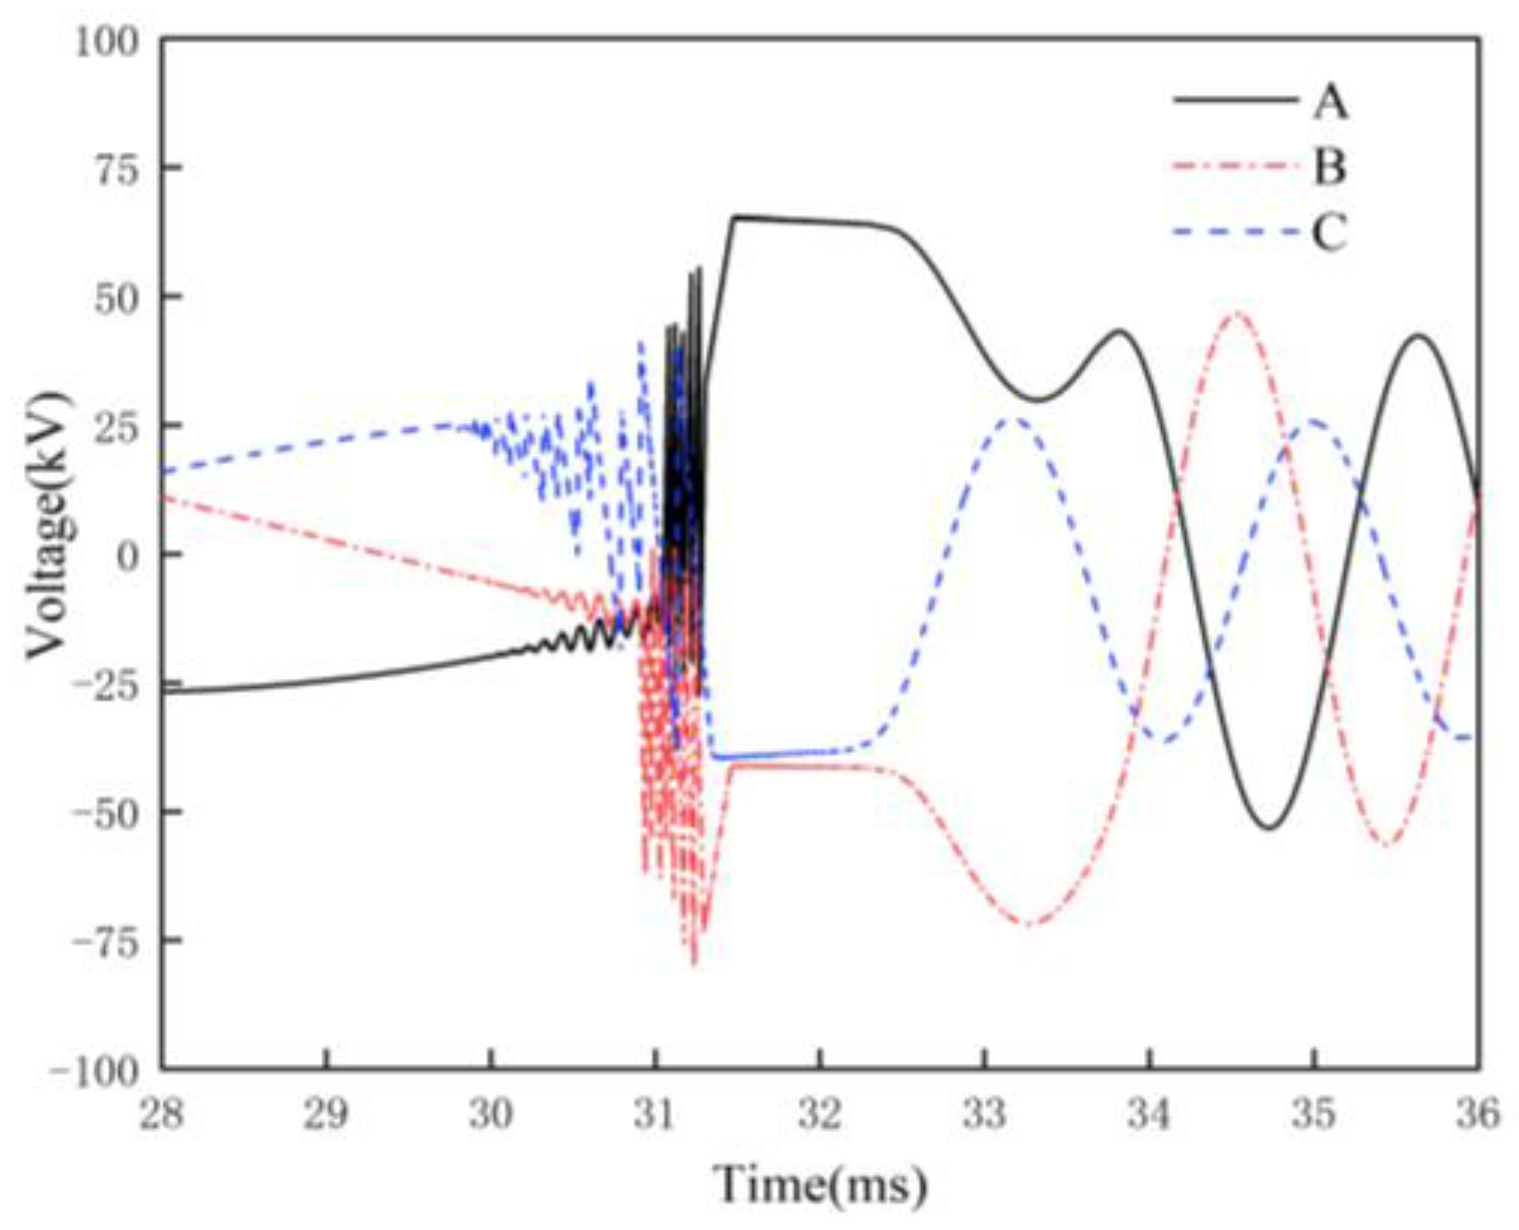
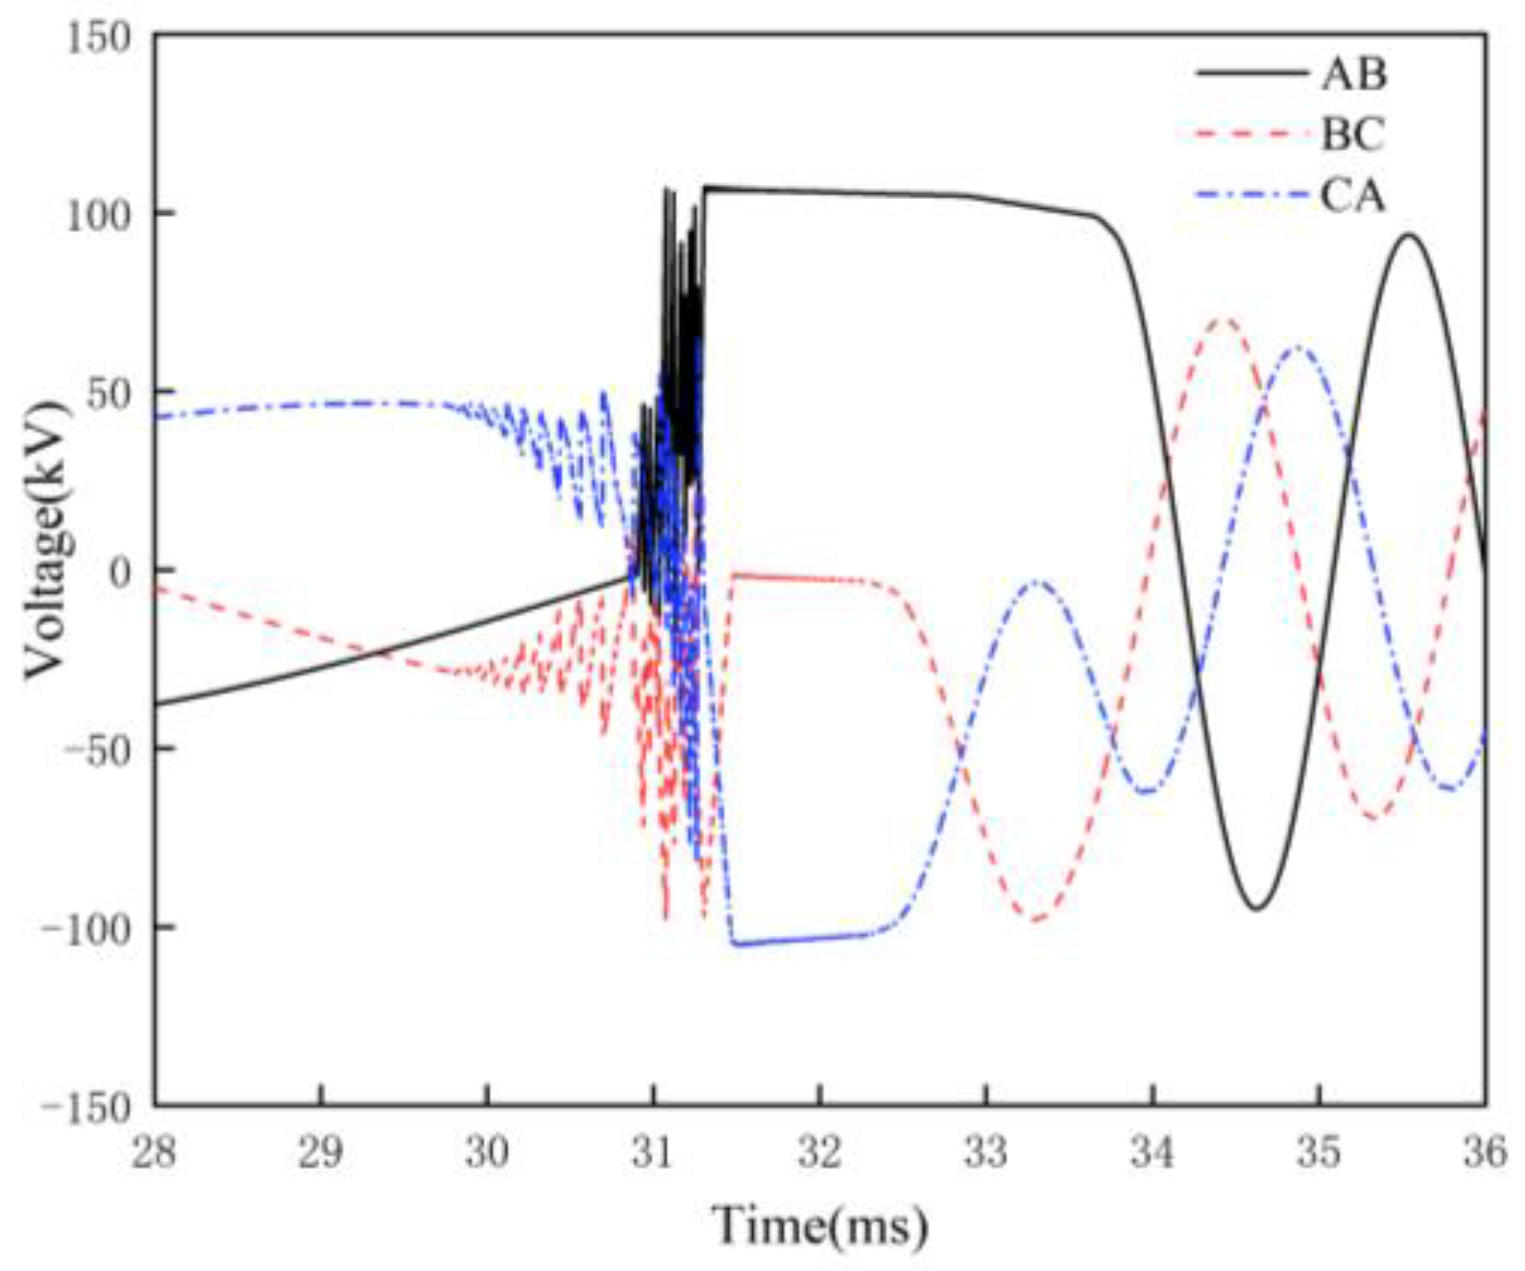
4. Simulation of Reignition Overvoltage Protection Measures

The overvoltage protection measures used in this section are capacitance absorbers, surge arresters, and choke coils. The capacitance absorber consists of resistance and capacitance in a series. Surge arresters are essentially nonlinear resistors, which use the V-I characteristic curve of residual voltage 73 kV at a nominal discharge current of 1 mA DC. The equivalent circuit of the choke coil is composed of inductance and resistance in parallel. The per-unit voltage of the 35 kV power system is as follows:
U p . u . = 40.5 × 2 3 = 33.1 kV
Reignition overvoltage caused by the opening operation of the vacuum circuit breaker at the bottom of the wind farm tower is the most serious [4]. In this paper, a simulation model was established according to the typical wind farm layout in Figure 3, in which the vacuum circuit breaker, transformer, cable, and wind turbine models adopt the proposed method. Without suppression measures, the overvoltage simulation waveform of the high-voltage side of the terminal transformer T1 is shown in Figure 8 and Figure 9 of the vacuum circuit breaker CB11 at the bottom of the opening tower, and the amplitude and steepness of the relative ground voltage are 153.7 kV (4.6 p.u.) and 157.2 kV/μs, respectively. The interphase overvoltage amplitude is 262.8 kV (7.9 p.u.), and the reignition duration is 3.7 ms. The relative operating overvoltage in a 35 kV system shall not exceed 132 kV (4.0 p.u.), and the relative overvoltage shall not exceed 1.4 times the relative overvoltage between phases, i.e., 185 kV (5.6 p.u.) [28]. It can be seen that the opening operation is easy to damage the insulation of the terminal transformer of the wind farm, and effective protection is required.

4.1. Effect of RC Snubbers on Overvoltage

RC snubbers are connected in parallel to the protection equipment and can effectively reduce the overvoltage amplitude and frequency. Since there is no national standard for RC snubbers, the capacitance parameters are based on many years of actual operating experience at home and abroad. In order to effectively suppress the reignition overvoltage in wind farms, this paper combines different capacitance parameters for simulation, with resistance selected from 100 to 500 Ω, and capacitance is taken as 0.01 μF, 0.05 μF, and 0.1 μF. The overvoltage situation under different capacitance parameters is shown in Figure 10.
As can be seen from Figure 10, (1) resistance and capacitance affect the suppression effect. Resistance remains constant; the larger the capacitance value, the more obvious the overvoltage suppression. Additionally, capacitance remains constant; the resistance increases; the overvoltage amplitude decreases; the capacitance value is 0.05 μF; the resistance value is 400 Ω; and the voltage amplitude appears as a significant decline, with a drop of 58.3%. The increase in resistance value reduces the oscillation frequency, prolongs the moment of high-frequency current over zero, reduces the chance of reignition, and thus suppresses the overvoltage amplitude. In order to reduce the loss and heat, the resistance value should not be selected too large, generally about 400 Ω. (2) Regarding 400 Ω/0.05 μF is compared with the commonly used 100 Ω/0.1 μF RC snubbers protection effect; the latter eliminated the occurrence of reignition, and the former occurred with three reignitions, but the relative ground and phase voltage did not exceed the specified standard value. The simulation results are shown in Table 3 and Figure 11 and Figure 12, and the two protection effect is very close. The former is able to overcome the problem of excessive capacitance current and resistance burnout of the latter in specific cases, and the capacitance value is reduced by half compared with 0.1 μF, so the volume can be further reduced, and the increase in resistance value also improves the protection effect and stability. If the site conditions allow, the RC snubbers with parameters of 400 Ω/0.05 μF can be considered.

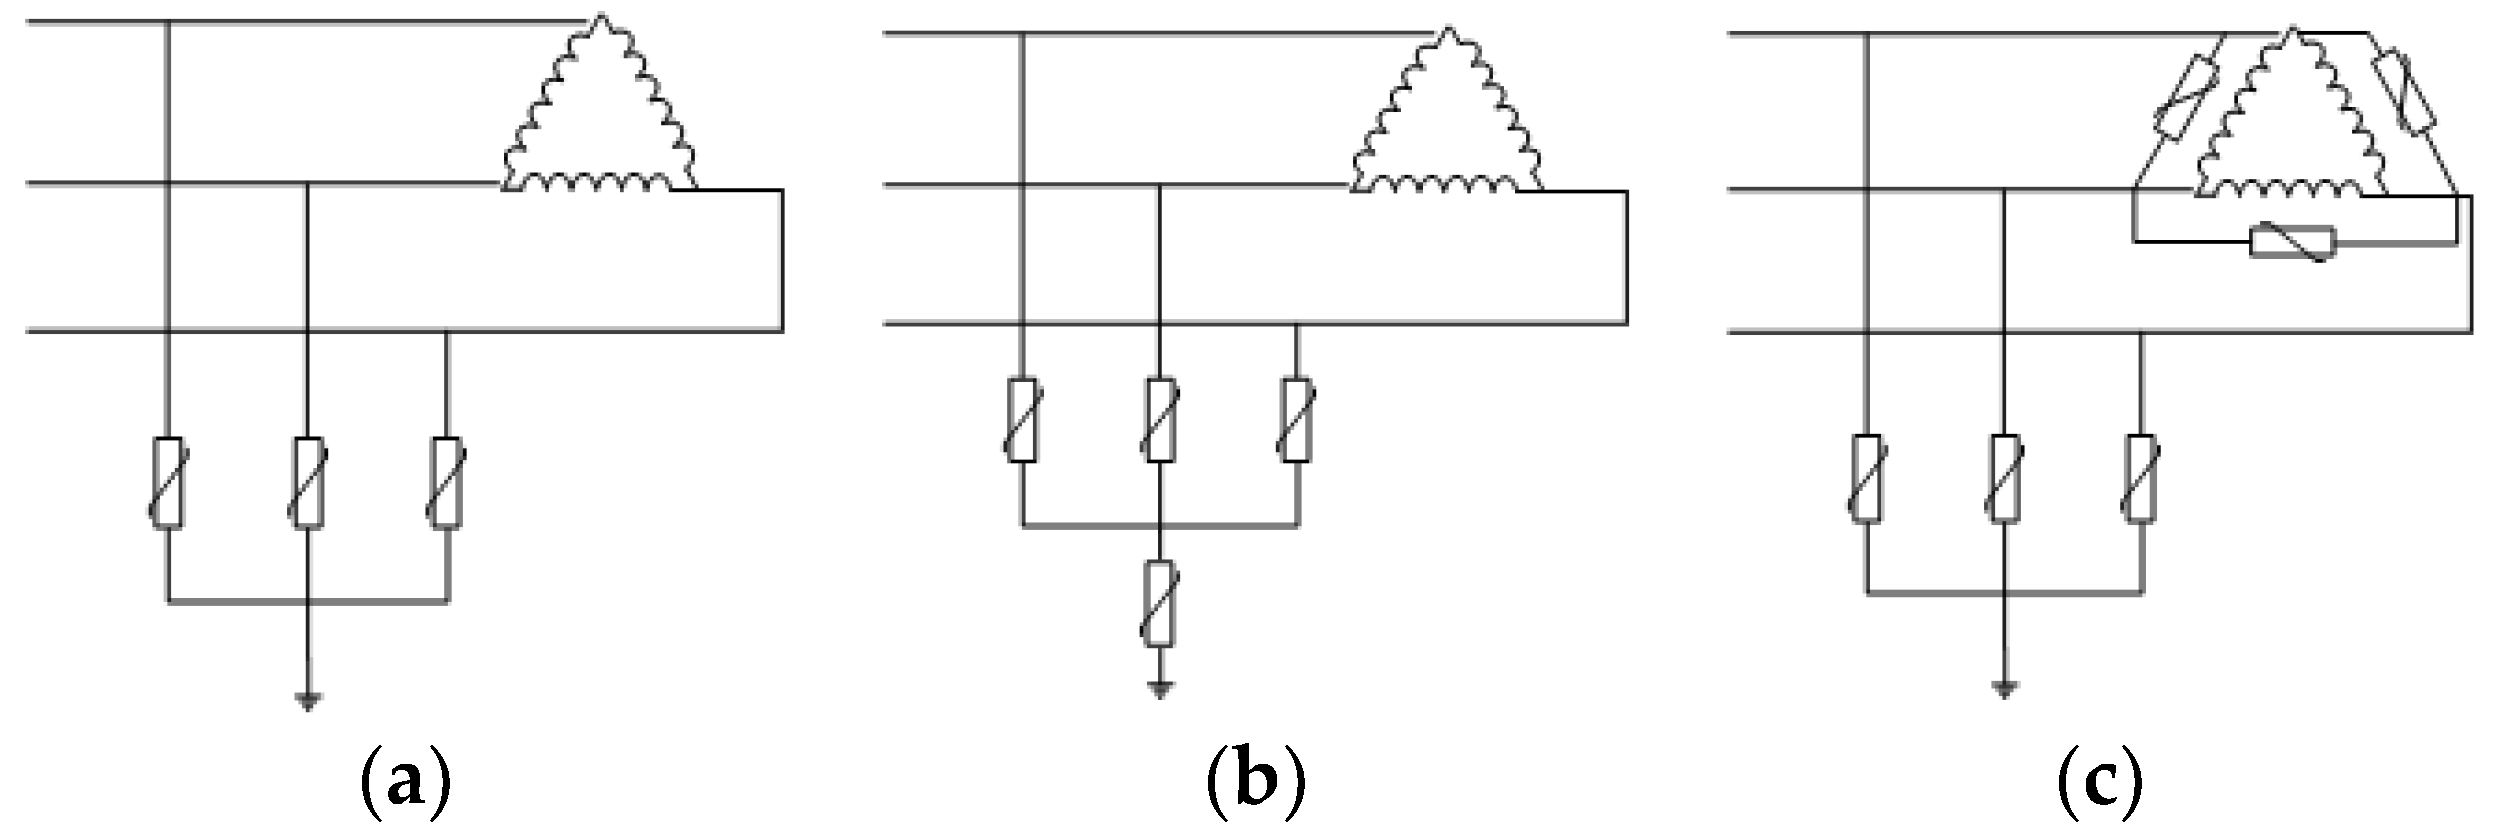
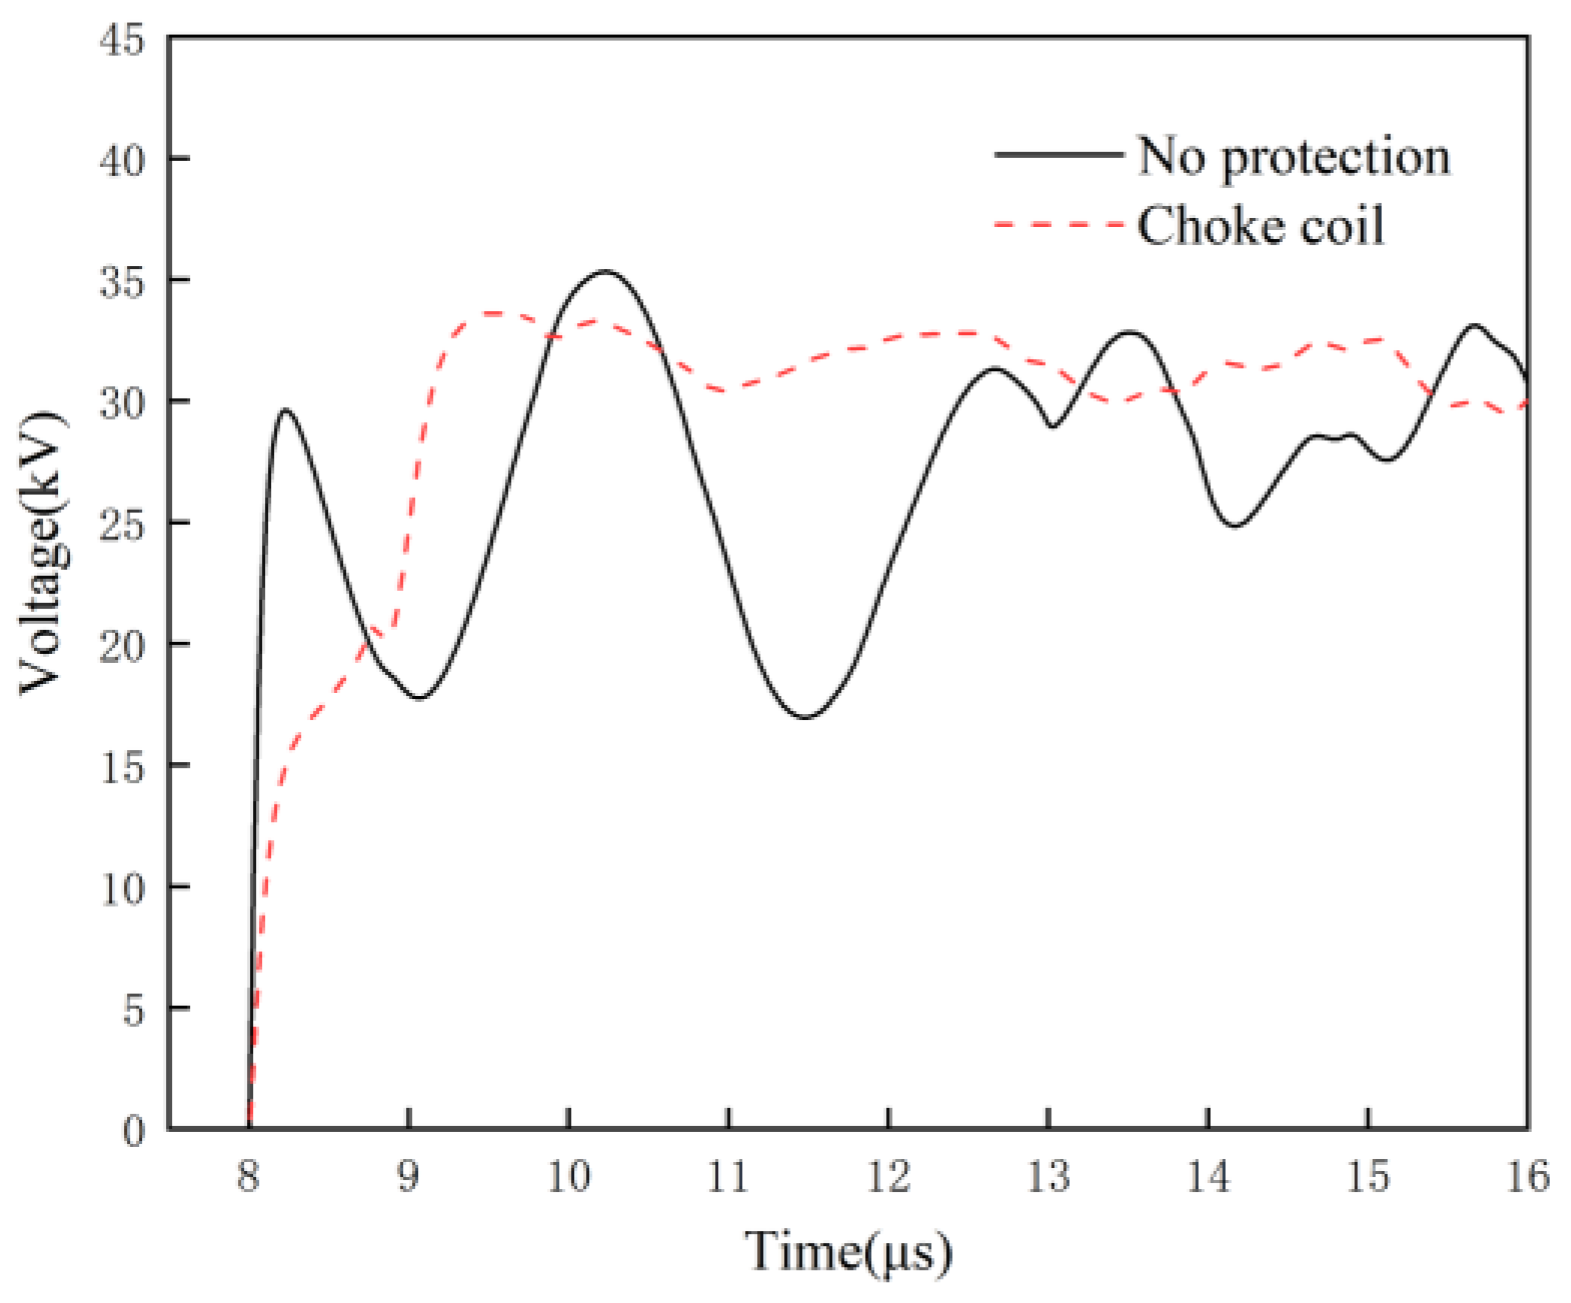
4.2. Effect of Surge Arresters and Choke Coil on Overvoltage

The high-voltage transformer side of the installation of the surge arrester is the conventional overvoltage amplitude suppression measures, the arrangement of star, and combined connection method. Ref. [15] also proposed the high-voltage transformer side of the relative ground and phase between the installation of surge arresters at the same time, as shown in Figure 13. The high-voltage transformer side (cable start end) series choke coil can suppress overvoltage steepness [18]. Due to the characteristics of high-frequency magnetic material (ferrite) (see Figure 14), the impedance of the coil is close to zero in the case of working frequency, which does not affect the equipment in the line, and in the case of high frequency, the coil exhibits high impedance, which suppresses the high-frequency current during reignition and reduces the frequency of transient voltage, thus reducing the steepness and amplitude of overvoltage rise. In order to eliminate wave reflection, the coil equivalent resistance value is as close as possible to the wave impedance of the cable, so a resistance of 30 Ω and an inductance value of 85 μH are selected. A series choke coil in parallel with a small capacitor (10 nF) or surge arresters may be more obvious for overvoltage suppression [19]. In each system, operating conditions and equipment parameters, etc., there are differences in the protection effect, so this paper simulates and compares the suppression effect under different combinations of the surge arresters and choke coil in the same system. The simulation results are shown in Table 4.
As seen in Table 4, (1) the commonly used star arrester was installed separately to limit the relative ground voltage to 2.77 p.u. (a drop of 40.3%), but the phase-to-phase voltage reaches 5.4 p.u., close to the phase-to-phase standard specified value of 5.6 p.u., which may cause transformer phase-to-phase breakdown, and the steepness suppression effect is poor (a drop of 7.6%). (2) When the choke coil is strung separately, it can significantly increase the rise time of the overvoltage to the peak (from 0.19 μs to 1.12 μs without protection; see Figure 15), effectively reducing the voltage steepness (a drop of 80.6%), but the relative ground and phase to phase voltage suppression is not obvious (a drop of 7.6% and 3.4%) and are more than the standard value; installing additional protective components is required. (3) The minimum steepness is 14.2kV/μs when adding small capacitance elements, which is related to the further increase of time constant, but the relative ground and interphase voltage exceeds the specified standard value. (4) With the addition of different wiring arrester components, the star arrester phase voltage is still too large. Therefore, combining the arrester and star and interphase arrester protection is the best option. Similarly, the relative ground and interphase voltage are not more than the specified standard value, but the former can choose a lower residual voltage valve. The number of surge arresters is also less than the latter; from a comprehensive comparison, the best protection measures are choking coil + combination arrester (see simulation Figure 16 and Figure 17). Although the reignition phenomenon can not be completely eliminated, the number of reignitions and steepness reduction of 68.9% and 85.8%, respectively, reduces the cumulative effect. The critical voltage of the transformer basic insulation level (BIL) was significantly improved, reducing the risk of transformer insulation breakdown.

5. Conclusions

In this paper, through the study of the vacuum circuit breaker reignition mechanism, a vacuum circuit breaker model was established in the electromagnetic transient software, and it was verified that it could truly simulate the reignition process of the circuit breaker. After that, the model was applied to wind farms, and the effects of the parameter values of the RC snubbers, the surge arrester wiring, and the choke coil combination on the suppression effect were systematically investigated, and the best suppression scheme was finally given. The conclusions are as follows:
(1)
The vacuum breaker reignition model built in this paper takes into account the microscopic dielectric recovery process after the arc, and the simulated reignition number is higher than the traditional linear curve reignition model, while the voltage is smaller, and the accuracy is improved by 51.2% and 24%, respectively, which is closer to the actually measured overvoltage and can reflect the transformer operating condition more accurately.
(2)
The resistance and capacitance parameters of RC snubbers affect the inhibition effect. The 400 Ω/0.05 μF and 100 Ω/0.1 μF parameters of the protection effect are comparable and can make the reignition phenomenon basically disappear. The 400 Ω/0.05 μF RC snubbers with strong stability can be selected, but the operation of the standard is not perfect and difficult to manage, among other issues; therefore, they are rarely used in wind farms.
(3)
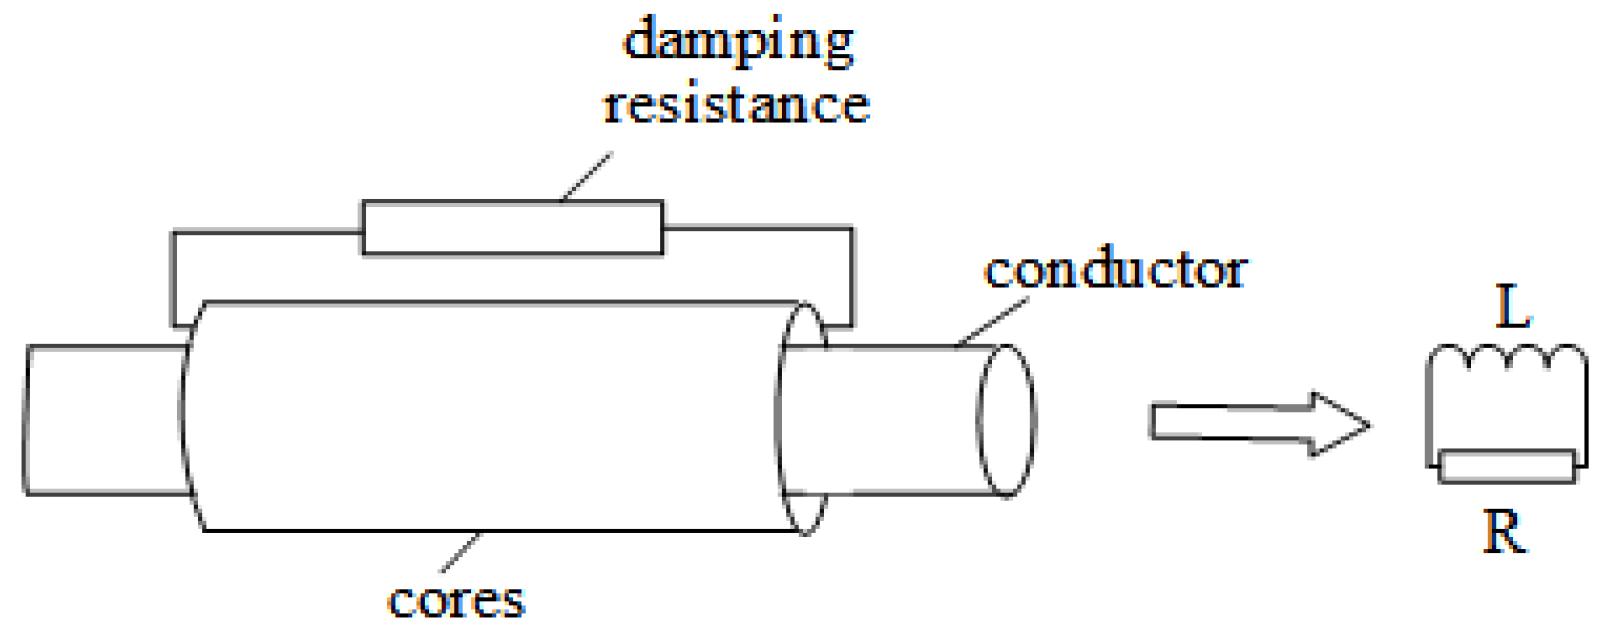
The addition of a combined surge arrester with a series choke coil can make the relative ground and phase overvoltage amplitude reduce by 47.6% and 59.2%; the steepness and the number of reignitions were also reduced by 85.8% and 68.9%. Compared to the RC snubbers, the normal operation of the line parameters will not change. This paper recommends this program for wind farms’ reignition overvoltage protection.

Author Contributions

This paper is a result of the collaboration of all co-authors. Z.P. conceived and designed the study; H.L. established the model, implemented the simulations, and drafted the manuscript; T.W. and Y.W. guided and revised the paper and refined the language; X.Y. helped with most of the corrections. All authors have read and agreed to the published version of the manuscript.

Funding

This research received no external funding.

Data Availability Statement

Data is contained within the article. The data presented in this study are available in the cited references.

Conflicts of Interest

The authors declare no conflict of interest.

Abbreviations

CTMcontinuous transition model
VCBvacuum circuit breaker
TRVtransient recovery voltage
DFIGdouble-fed induction generator
BILbasic insulation level

References

  1. Ghafourian, S.M.; Arana, I.; Holboll, J.; Sorensen, T.; Popov, M.; Terzija, V. General Analysis of Vacuum Circuit Breaker Switching Overvoltages in Offshore Wind Farms. IEEE Trans. Power Deliv. 2016, 31, 2351–2359. [Google Scholar] [CrossRef]
  2. Kafshgari, N.A.; Ramezani, N.; Nouri, H. Effects of high frequency modeling & grounding system parameters on transient recovery voltage across vacuum circuit breakers for capacitor switching in wind power plants. Int. J. Electr. Power Energy Syst. 2019, 104, 159–168. [Google Scholar]
  3. Abubakar, U.; Mekhilef, S.; Mokhlis, H.; Seyedmahmoudian, M.; Horan, B.; Stojcevski, A.; Bassi, H.; Rawa, M.J.H. Transient Faults in Wind Energy Conversion Systems: Analysis, Modelling Methodologies and Remedies. Energies 2018, 11, 2249. [Google Scholar] [CrossRef] [Green Version]
  4. Guo, Y.; Jiang, X.; Chen, Y.; Zheng, M.; Liu, G.; Li, X.; Tang, W. Reignition overvoltages induced by vacuum circuit breakers and its suppression in offshore wind farms. Int. J. Electr. Power Energy Syst. 2020, 122, 106227. [Google Scholar] [CrossRef]
  5. Wang, J.; Geng, Y.; Liu, Z. The Theory and Technology of Single-Break Vacuum Circuit Breaker for Transmission Level; Machinery Industry Press: Beijing, China, 2017. [Google Scholar]
  6. Helmer, J.; Lindmayer, M. Mathematical modeling of the high frequency behavior of vacuum interrupters and comparison with measured transients in power systems. In Proceedings of the 17th International Symposium on Discharges and Electrical Insulation in Vacuum, Berkeley, CA, USA, 21–26 July 1996; IEEE: New York, NY, USA, 1996; Volume 1, pp. 323–331. [Google Scholar]
  7. Abdulahovic, T.; Thiringer, T.; Reza, M.; Breder, H. Vacuum circuit-breaker parameter calculation and modelling for power system transient studies. IEEE Trans. Power Deliv. 2014, 32, 1165–1172. [Google Scholar] [CrossRef]
  8. Razi-Kazemi, A.A.; Fallah, M.R.; Rostami, M.; Malekipour, F. A new realistic transient model for restrike/prestrike phenomena in vacuum circuit breaker. Int. J. Electr. Power Energy Syst. 2020, 117, 105636. [Google Scholar] [CrossRef]
  9. Badrzadeh, B.; Hogdahl, M.; Isabegovic, E. Transients in Wind Power Plants-Part I: Modeling Methodology and Validation. IEEE Trans. Ind. Appl. 2012, 48, 794–807. [Google Scholar] [CrossRef]
  10. Farrall, G.A. Recovery of dielectric strength after current interruption in vacuum. IEEE Trans. Plasma Sci. 1978, 6, 360–369. [Google Scholar] [CrossRef]
  11. Mo, Y.; Shi, Z.; Jia, S. Study of the influences of different factors on the charged particles absorbed by the post-arc anode during the post-arc sheath expansion process in vacuum circuit breakers. AIP Adv. 2021, 11, 015317. [Google Scholar] [CrossRef]
  12. An, C.; Sima, W.; Liao, R.; Li, S. Research on 35 kV circuitry vacuum circuit breaker interrupting no load transformer overvoltage. Proc. CSEE 2002, 08, 100–104. [Google Scholar]
  13. Wang, F.; Wang, Z.; Hao, M. Dielectric recovery process of multiple re-ignition phenomena after small inductive current interruption in vacuum. High Volt. Eng. 2018, 44, 2019–2026. [Google Scholar]
  14. Liu, L.; Yuan, Z.; Liu, S.; Chen, L.; Wu, K.; Pan, Y. Research on the Postarc Sheath Growth Process Considering the Plasma Motion and Distribution. IEEE Trans. Plasma Sci. 2020, 48, 4289–4297. [Google Scholar] [CrossRef]
  15. Liljestrand, L.; Lindell, E. Efficiency of surge arresters as protective devices against circuit-breaker-induced overvoltages. IEEE Trans. Power Deliv. 2015, 31, 1562–1570. [Google Scholar] [CrossRef]
  16. Nilges, M.; Schegner, P. Influence of RC snubbers on the steepness of switching transients caused by vacuum circuit breakers. In Proceedings of the 2018 IEEE Power & Energy Society General Meeting (PESGM), Portland, OR, USA, 5–10 August 2018; IEEE: New York, NY, USA, 2018; pp. 1–5. [Google Scholar]
  17. Zhou, Q.; Cheng, Y.; Bian, X.; Liu, F.; Zhao, Y. Analysis of restrike overvoltage of circuit breakers in offshore wind farms. IEEE Trans. Appl. Supercond. 2016, 26, 1–5. [Google Scholar] [CrossRef]
  18. Smugala, D.; Piasecki, W.; Ostrogorska, M.; Florkowski, M.; Fulczyk, M.; Granhaug, O. Wind Turbine Transformers Protection Method against High-Frequency Transients. IEEE Trans. Power Deliv. 2015, 30, 853–860. [Google Scholar] [CrossRef]
  19. Ghasemi, S.; Allahbakhshi, M.; Behdani, B.; Tajdinian, M.; Popov, M. Probabilistic analysis of switching transients due to vacuum circuit breaker operation on wind turbine step-up transformers. Electr. Power Syst. Res. 2020, 182, 106204. [Google Scholar] [CrossRef]
  20. Liu, L.; Yuan, Z.; Liu, S.; Chen, L.; He, J.; Pan, Y. Experiment research of post-arc current and cathode spots distribution in medium-high frequency vacuum arc. Phys. Plasmas 2020, 27, 063507. [Google Scholar] [CrossRef]
  21. Liu, Z.Y.; Wang, J.M.; Yuan, S. Physical process of interrupting ac current in vacuum interrupter and mathematical evaluation of the interrupting capacity. In Proceedings of the International Symposium on Discharges and Electrical Insulation in Vacuum, ISDEIV, Xi’an, China, 18–22 September 2000; Volume 2, pp. 431–434. [Google Scholar]
  22. Ding, J.; Liu, X.; Yao, X.; Liu, Z.; Geng, Y.; Wang, J. Prebreakdown Current Characteristics of Vacuum Gaps with Various Gap Distances. In Proceedings of the 2020 29th International Symposium on Discharges and Electrical Insulation in Vacuum (ISDEIV), Padova, Italy, 26–30 September 2021; IEEE: New York, NY, USA, 2021; pp. 15–18. [Google Scholar]
  23. Rong, M.; Wang, X.; Yang, W.; Jia, S. Theoretical and experimental analyses of the mechanical characteristics of a medium-voltage circuit breaker. IET Sci. Meas. Technol. 2005, 152, 45–49. [Google Scholar] [CrossRef]
  24. Glasdam, J.; Bak, C.L.; Hjerrild, J. Transient Studies in Large Offshore Wind Farms Employing Detailed Circuit Breaker Representation. Energies 2012, 5, 2214–2231. [Google Scholar] [CrossRef] [Green Version]
  25. Xin, Y.; Zhao, B.; Liang, Q.; Zhou, J.; Qian, T.; Yu, Z.; Tang, W. Development of Improved Suppression Measures against Reignition Overvoltages Caused by Vacuum Circuit Breakers in Offshore Wind Farms. IEEE Trans. Power Deliv. 2021, 37, 517–527. [Google Scholar] [CrossRef]
  26. Ghafourian, S.M. Switching Transients in Large Offshore Wind Farms; The University of Manchester: Manchester, UK, 2015. [Google Scholar]
  27. Xin, Y.L.; Tang, W.H.; Zhou, J.J.; Yang, Y.; Liu, G. Sensitivity analysis of reignition overvoltage for vacuum circuit breaker in offshore wind farm using experiment-based modeling. Electr. Power Syst. Res. 2019, 172, 86–95. [Google Scholar] [CrossRef]
  28. GB 311.1—1997; Insulation Coordination for High Voltage Transmission and Distribution Equipment. Xi’an High Voltage Apparatus Research Institute: Xi’an, China, 1997.
Figure 1. Vacuum circuit breaker opening flow chart.
Energies 16 02070 g001
Figure 2. Simulation model of vacuum circuit breaker.
Energies 16 02070 g002
Figure 3. Simulation flowchart of the reignition process.
Energies 16 02070 g003
Figure 4. Typical distribution diagram of wind farm cable system.
Energies 16 02070 g004
Figure 5. High-frequency model of transformer and DFIG.
Energies 16 02070 g005
Figure 6. Layout of wind farm experimental platform [27].
Energies 16 02070 g006
Figure 7. Overvoltage at transformer T2 simulated by different methods: (a) real measurement [27] (peak voltage: 123.01 kV, steepness: 148.31 kV·μs−1, number of reignition: 43, reignition duration: 2.1 ms); (b) linear dielectric dynamic insulation strength curve (peak voltage: 156.18 kV, steepness: 130.64 kV·μs−1, number of reignition: 18, reignition duration: 1.6 ms); (c) quadratic dielectric dynamic insulation strength curve (peak voltage: 148.67 kV, steepness: 126.32 kV·μs−1, number of reignition: 30, reignition duration: 1.9 ms); (d) dielectric recovery (peak voltage: 126.61 kV, steepness: 157.89 kV·μs−1, number of reignition: 40, reignition duration: 2.2 ms).
Energies 16 02070 g007
Figure 8. Simulation waveform of transformer T1 phase-to-ground voltage without suppression measures.
Energies 16 02070 g008
Figure 9. Simulation waveform of transformer T1 phase-to-phase voltage without suppression measures.
Energies 16 02070 g009
Figure 10. Influence of different RC values on overvoltage.
Energies 16 02070 g010
Figure 11. Transformer voltage when RC value is 100 Ω/0.1 μF.
Energies 16 02070 g011
Figure 12. Transformer voltage when RC value is 400 Ω/0.05 μF.
Energies 16 02070 g012
Figure 13. Wiring method of surge arresters in wind farm: (a) star connection; (b) combined connection; (c) star and interphase connection.
Energies 16 02070 g013
Figure 14. Choke coil equivalent circuit.
Energies 16 02070 g014
Figure 15. Influence of choke coil on overvoltage rise time.
Energies 16 02070 g015
Figure 16. Phase-to-ground voltage of choke coil+combined arrester transformer.
Energies 16 02070 g016
Figure 17. Phase-to-phase voltage of choke coil+combined arrester transformer.
Energies 16 02070 g017
Table 1. Physical meaning and values of each parameter.
ParameterPhysical MeaningValue or Unit
lsheath lengthmm
ε0vacuum dielectric constant8.85 × 10−12 F/m
eelectronic charge1.602 × 10−19 C
Zaverage charge carried by ions1.3~1.5
u0sheath potentialV
δAMPinter-polar ion space charge distribution coefficient5
I0Initial value of post-arc currentA
Mimetal ion mass1.062 × 10−25 kg
vicopper ion movement velocity5000 m/s
Dcathode spot distribution diametermm
Niplasma densitym−3
τion diffusion decay time parameter0.5~10 μs
dgap distance between contactsMax. 20 mm
tvodthe time from the moment of current zero crossing to the beginning of the sheath growth100 ns
Table 2. Comparison of characteristic parameters of reignition overvoltage.
MethodVoltage (kV)Steepness
(kV·μs−1)
Number of ReignitionReignition Duration (ms)
Real measurement123.01148.31432.1
Linear156.18130.64181.6
Quadratic148.67126.32301.9
Dielectric recovery126.61157.89402.2
Table 3. Comparison of protection effects of two RC snubbers models.
Parameter ModelVoltage to Ground (kV)Interphase Voltage (kV)Steepness
(kV·μs−1)
Number of Reignition
No protection153.7262.8157.245
100 Ω/0.1 μF41.258.60
400 Ω/0.05 μF58.372.853.23
Table 4. Influence of different combinations of choke coils on overvoltage.
Protection MeasuresVoltage to Ground (kV)Interphase Voltage (kV)Steepness (kV·μs−1)Number of Reignition
Star arrester91.8180.6145.327
Choke coil145.1253.730.426
Choke coil +10 nF133.6241.614.216
Choke coil + star arrester91.7180.124.721
Choke coil + combined arrester80.5107.322.314
Choke coil + star and interphase arrester74.191.919.612
Disclaimer/Publisher’s Note: The statements, opinions and data contained in all publications are solely those of the individual author(s) and contributor(s) and not of MDPI and/or the editor(s). MDPI and/or the editor(s) disclaim responsibility for any injury to people or property resulting from any ideas, methods, instructions or products referred to in the content.

