

Investigating Divergent Energy Policy Fundamentals: Warfare Assessment of Past Dependence on Russian Energy Raw Materials in Europe

Abstract
1. Introduction
- Research question 1: have the past dependencies on Russian energy raw materials been similar across the EU countries?
- Research question 2: have the past dependencies on Russian energy raw materials been associated with the economic size of the EU member states and their proximity to or remoteness from Russia?
2. Materials and Methods
2.1. Literature Review
2.2. Data
2.3. Variables
2.4. Research Process
3. Results
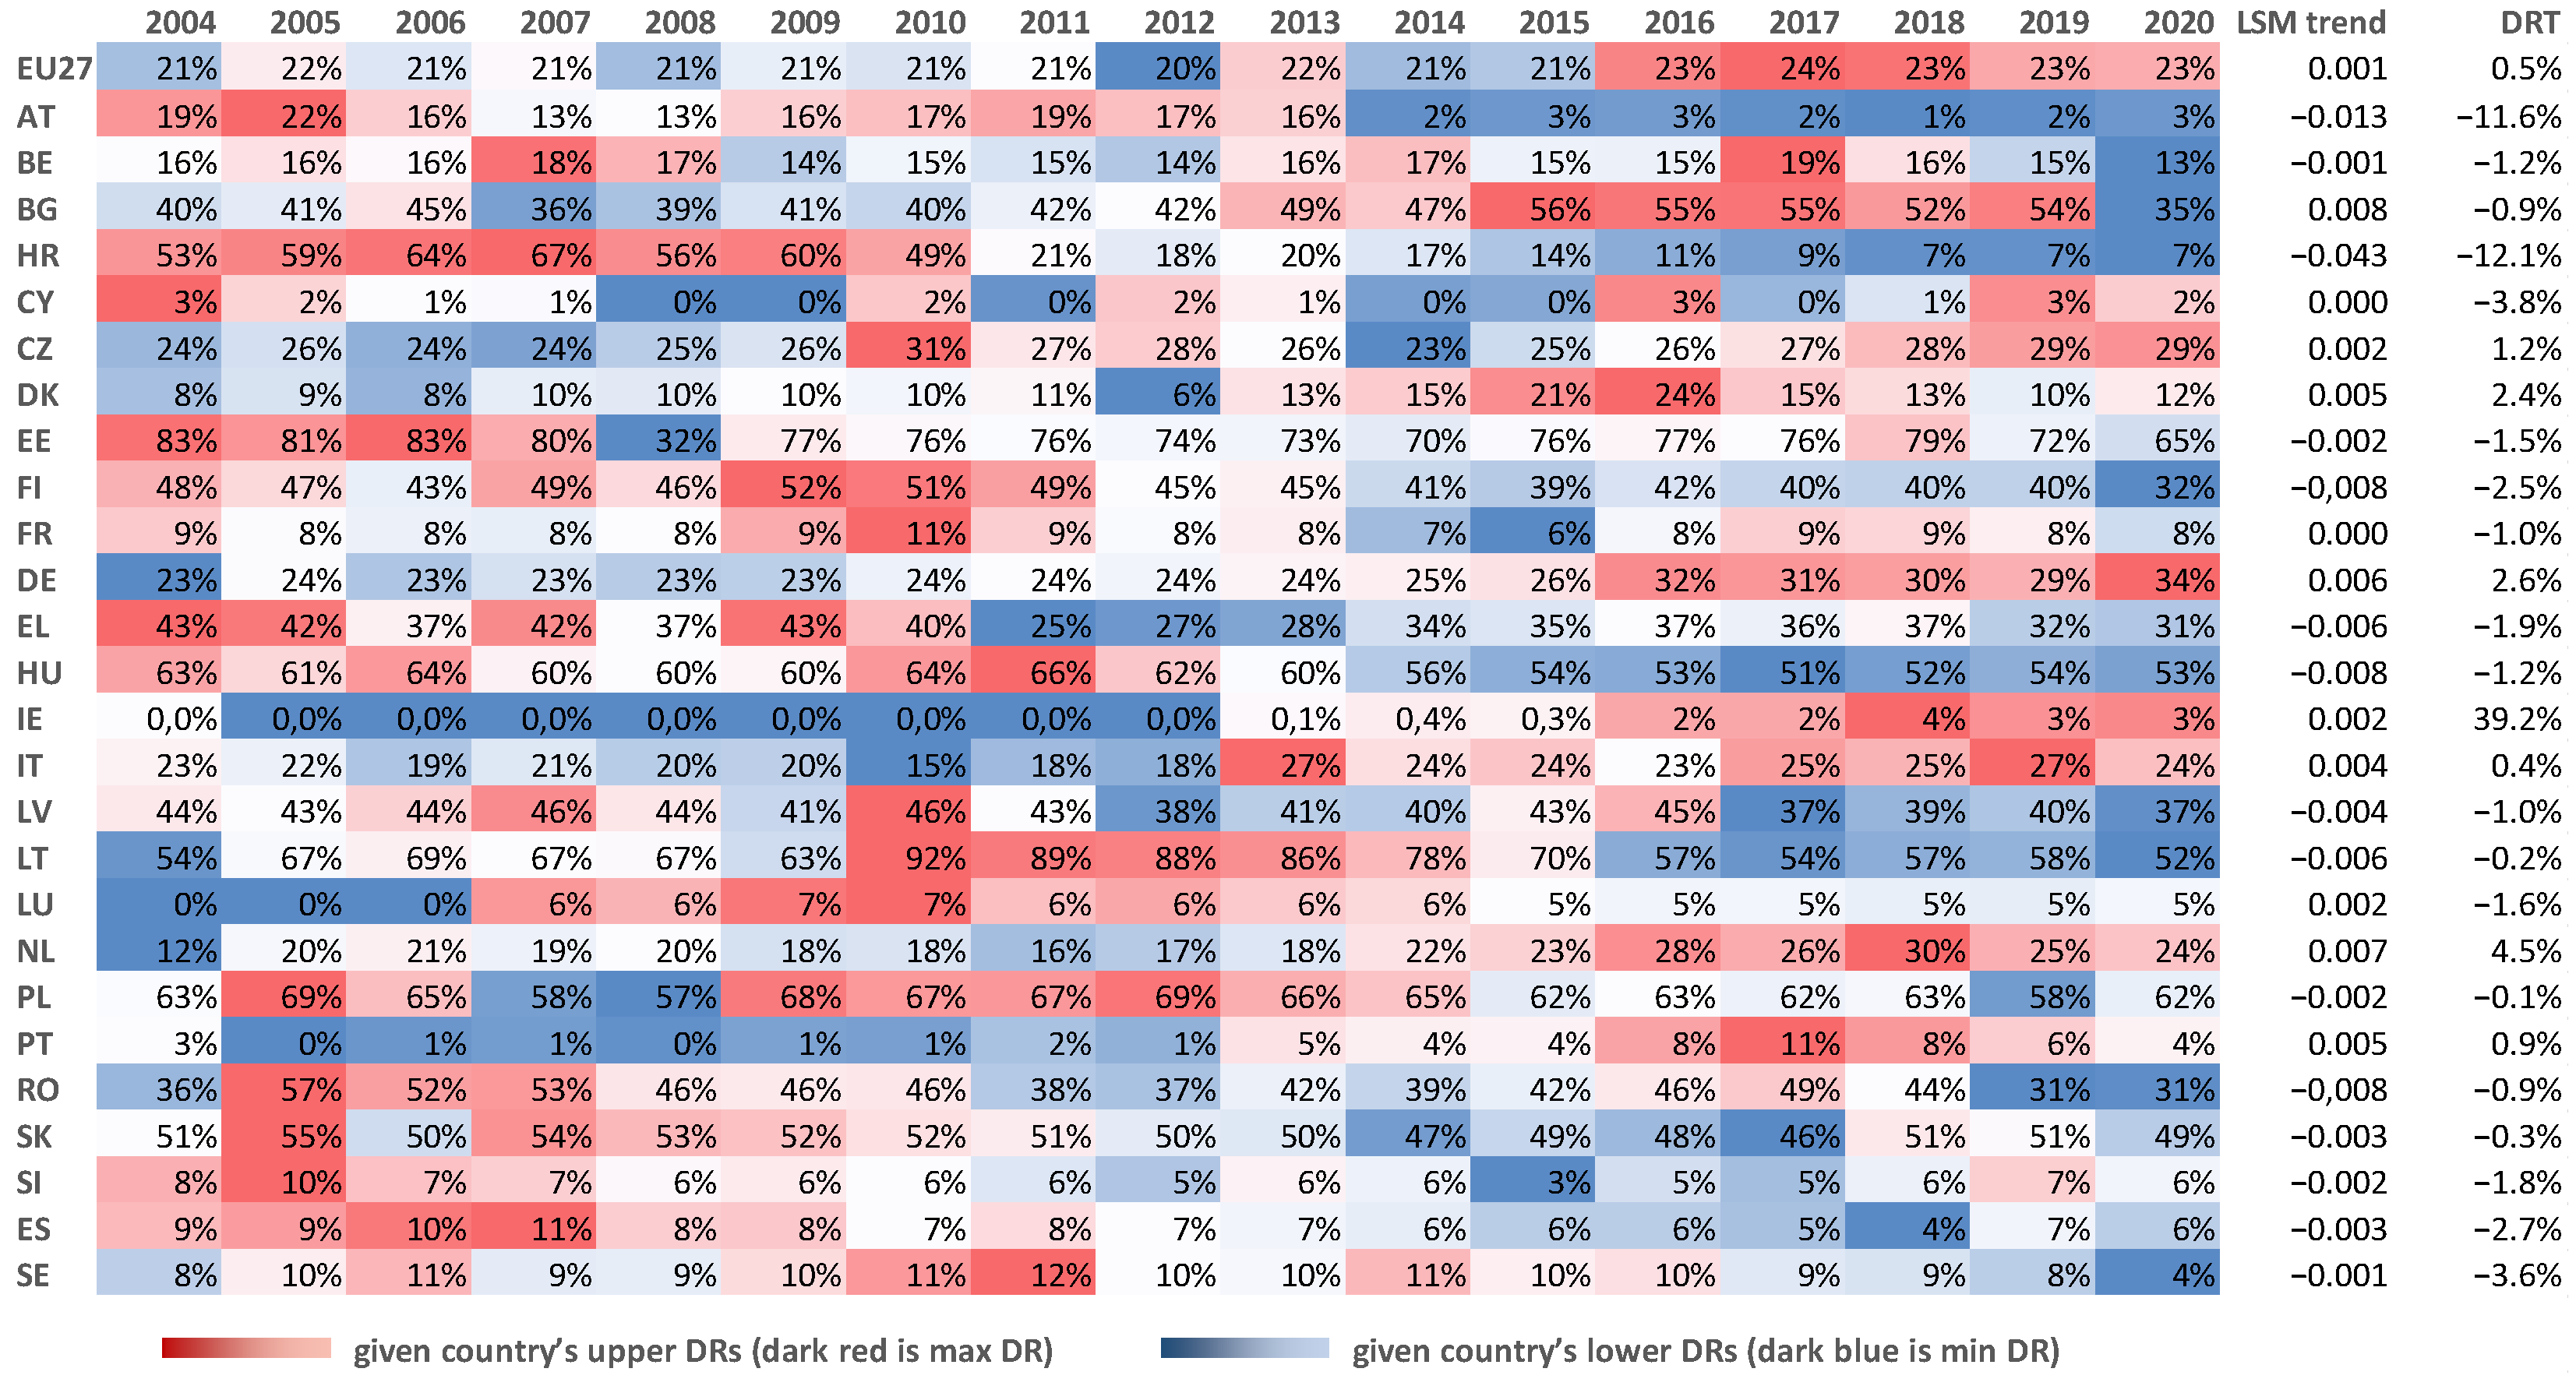
3.1. Magnitude
3.2. Dynamics
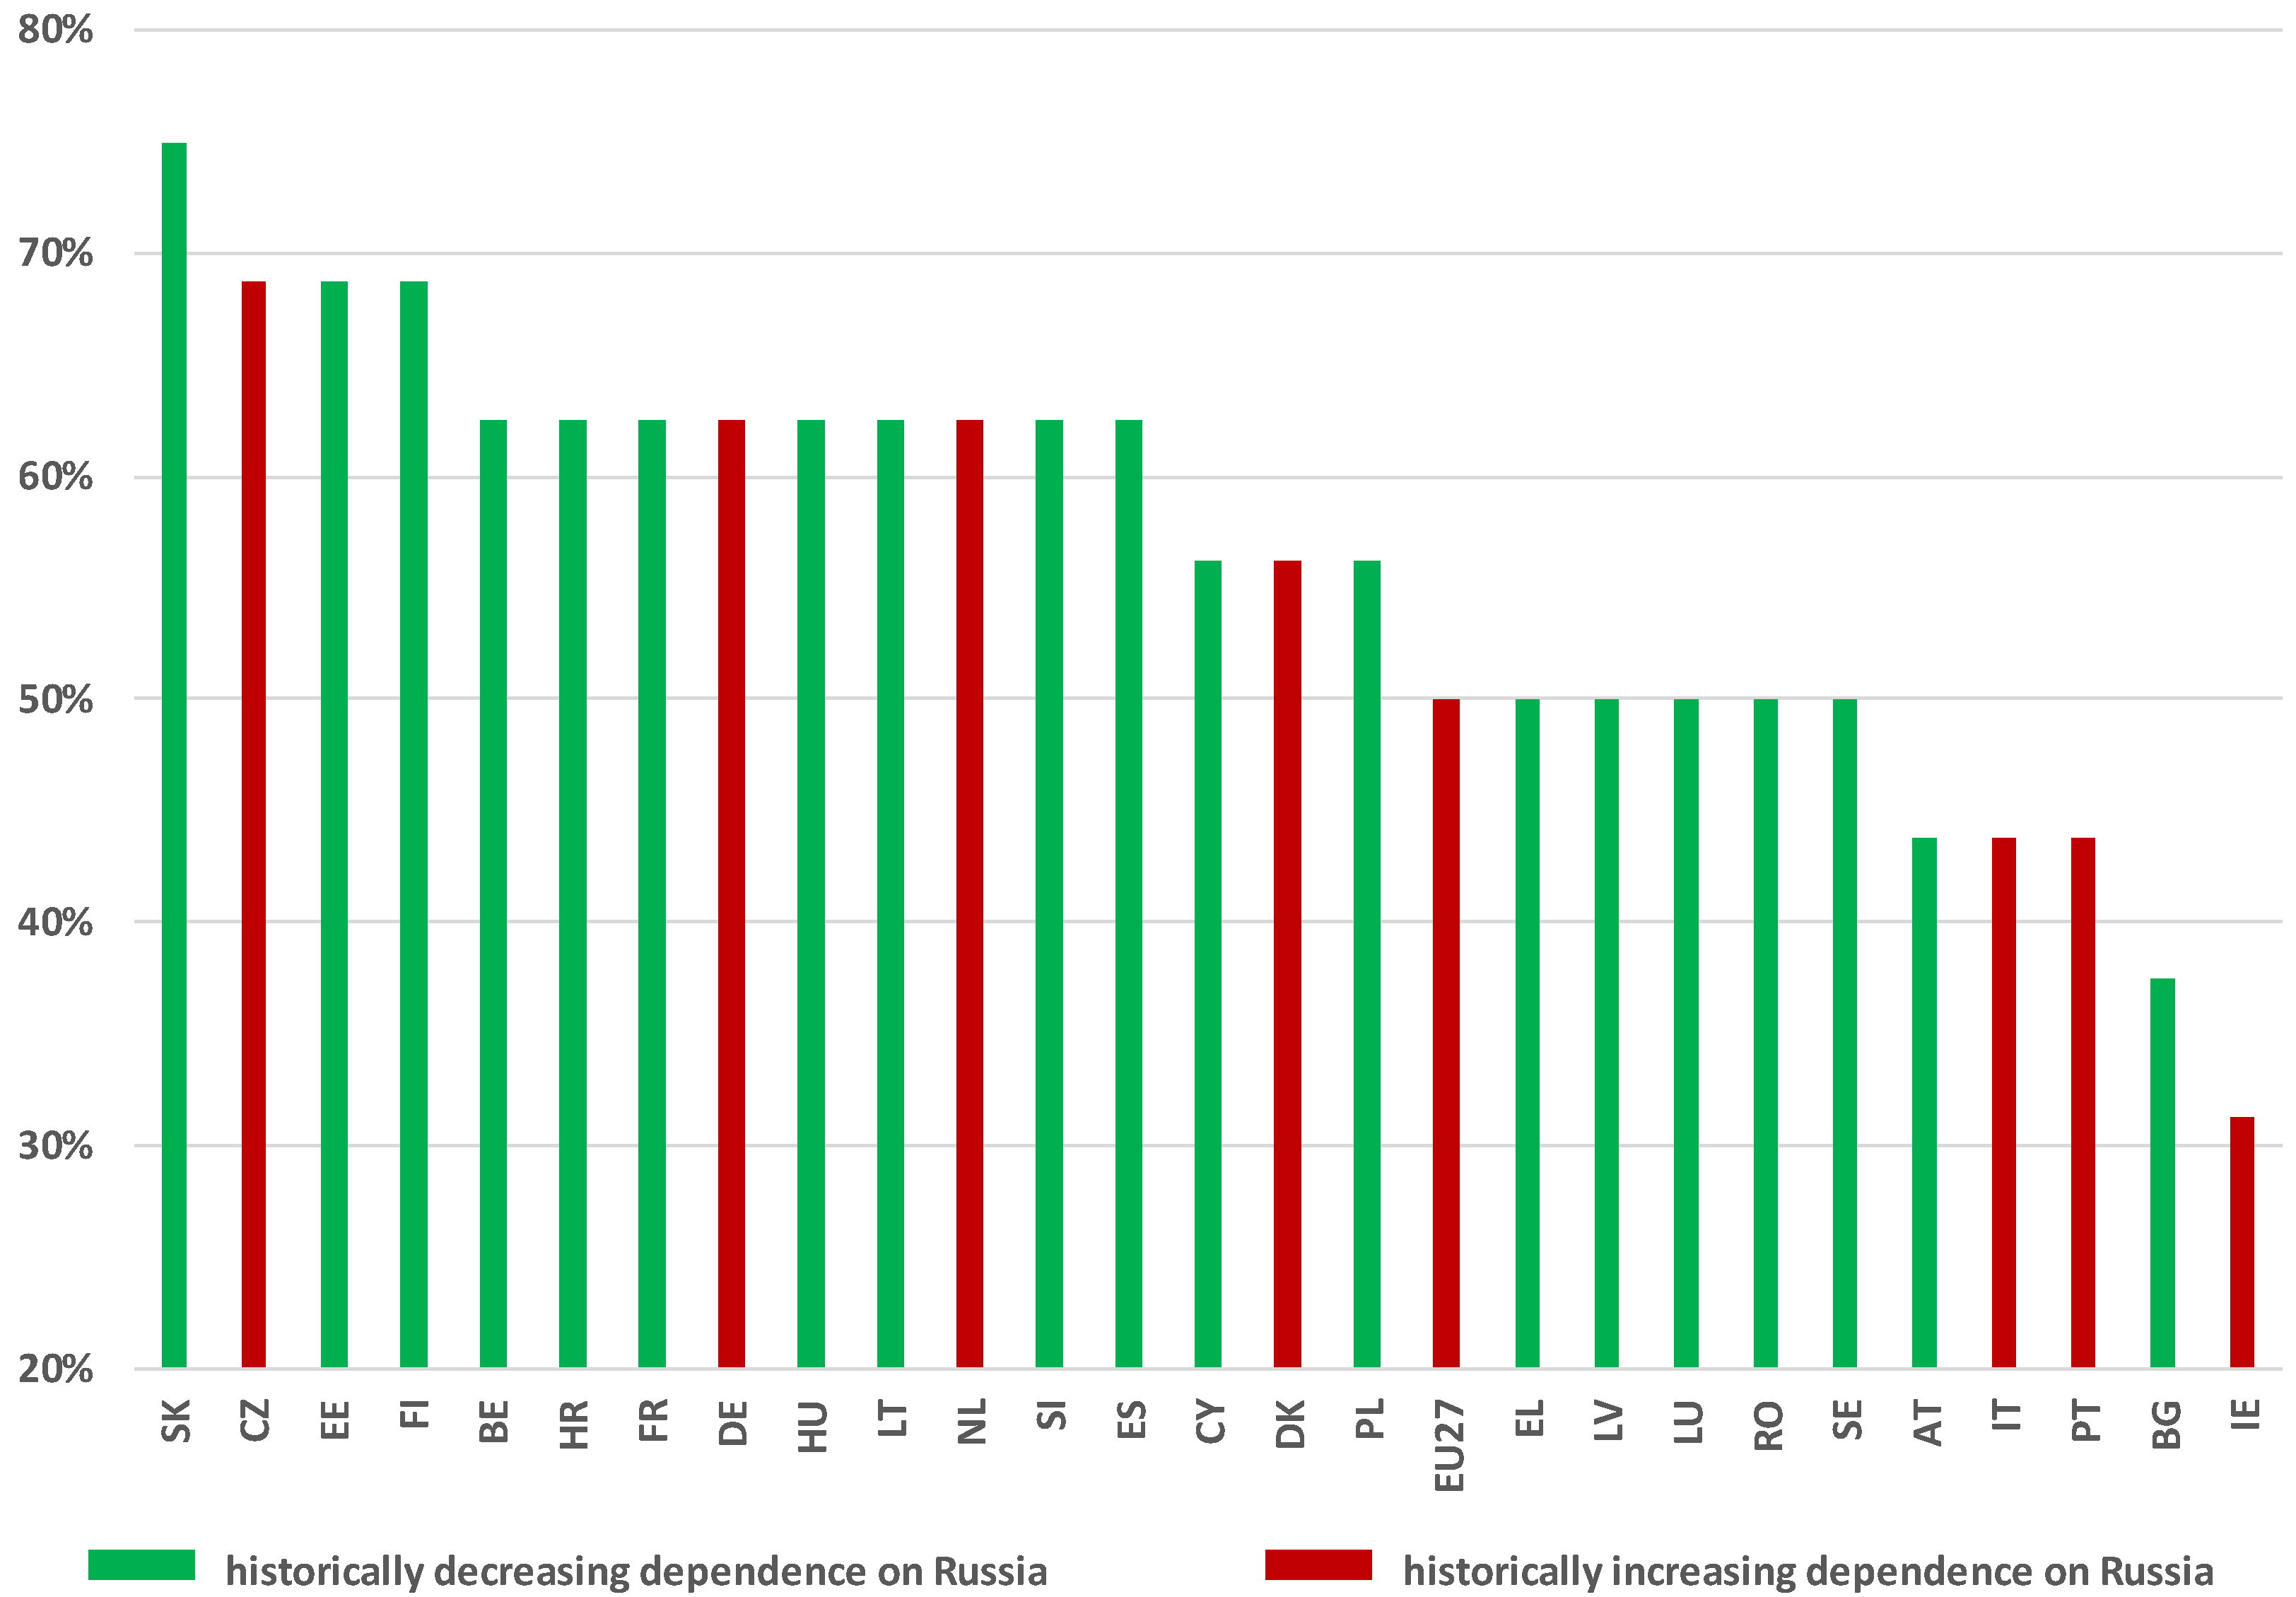
3.3. Consistency
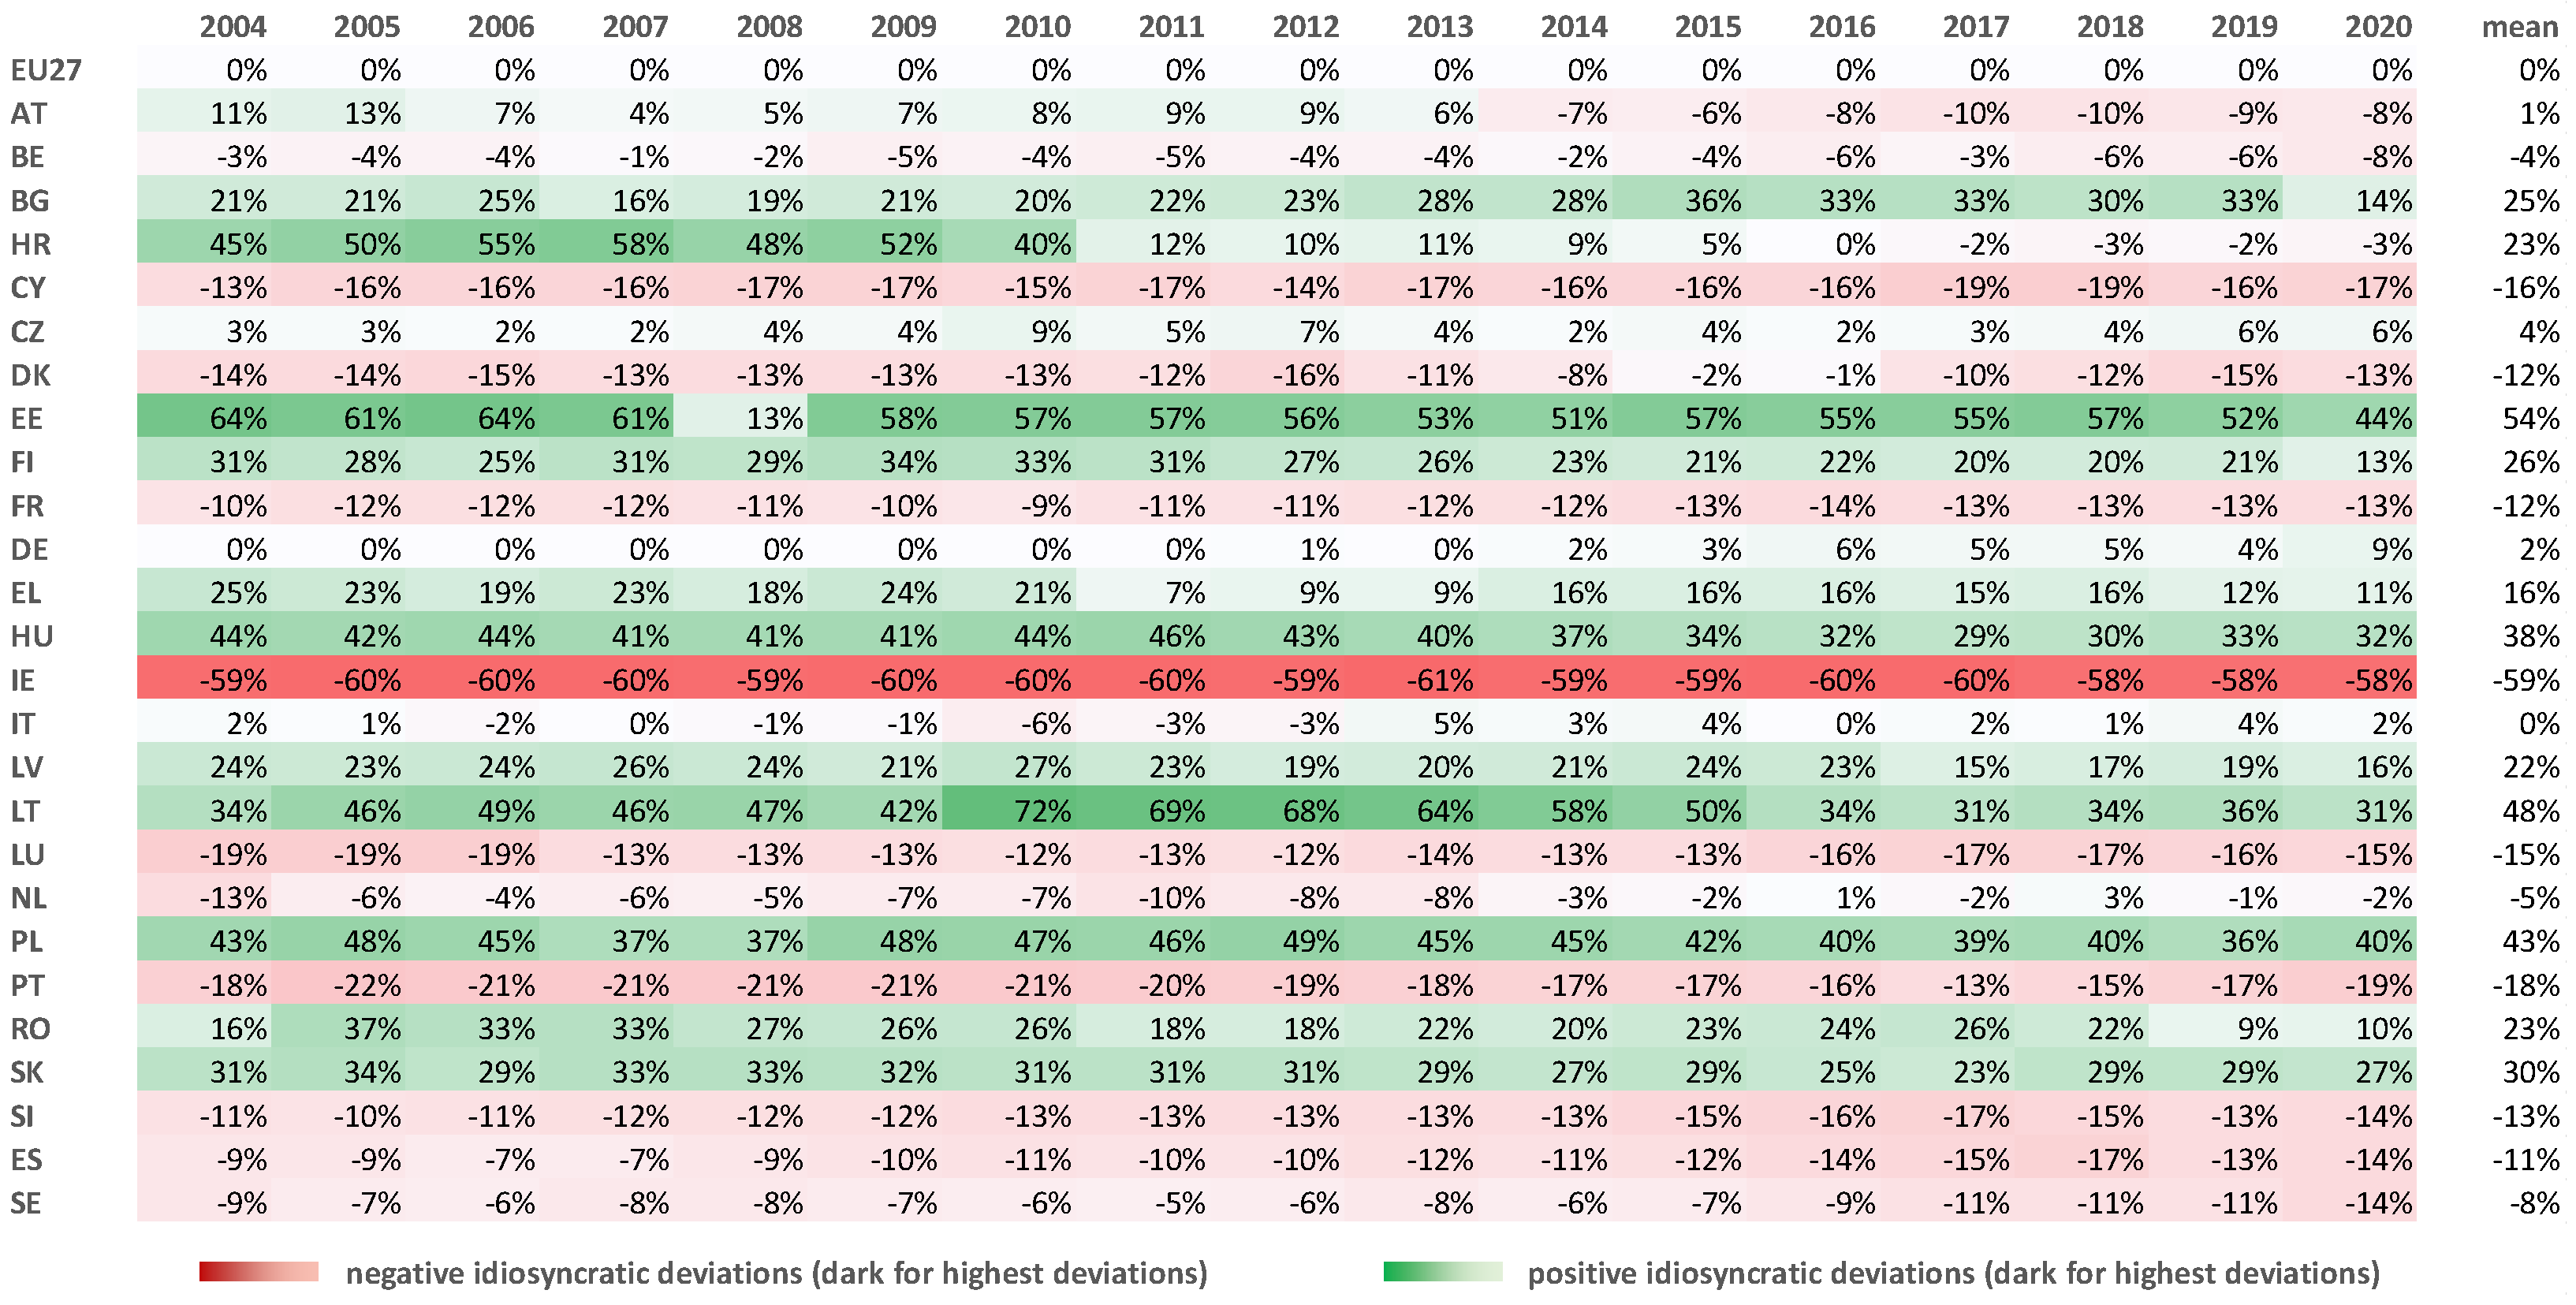
3.4. Idiosyncrasy
3.5. Multiple Linear Regression Model Analysis
4. Discussion and Conclusions
Funding
Data Availability Statement
Conflicts of Interest
References
- CNBC. Russia Has Cut off Gas Supplies to Europe Indefinitely. Here’s What You Need to Know. Available online: https://www.cnbc.com/2022/09/06/energy-crisis-why-has-russia-cut-off-gas-supplies-to-europe.html (accessed on 30 December 2022).
- IMF. From Abundance to Thirst. Available online: https://www.imf.org/en/Publications/fandd/issues/2022/12/from-abundance-to-thirst-Pescatori-Stuermer (accessed on 1 January 2023).
- IEA. World Energy Outlook 2022; OECD Publishing: Paris, France, 2022. [Google Scholar] [CrossRef]
- Zakeri, B.; Paulavets, K.; Barreto-Gomez, L.; Echeverri, L.G.; Pachauri, S.; Boza-Kiss, B.; Zimm, C.; Rogelj, J.; Creutzig, F.; Ürge-Vorsatz, D.; et al. Pandemic, War, and Global Energy Transitions. Energies 2022, 15, 6114. [Google Scholar] [CrossRef]
- Czech Presidency of the Council of the European Union. Available online: https://czech-presidency.consilium.europa.eu/en/news/ministers-agree-on-rules-for-more-energy-efficient-buildings/ (accessed on 30 October 2022).
- Costantini, V.; Morando, V.; Olk, C.; Tausch, L. Fuelling the Fire: Rethinking European Policy in Times of Energy and Climate Crises. Energies 2022, 15, 7781. [Google Scholar] [CrossRef]
- Jegen, M. Energy policy in the European Union: The power and limits of discourse. In Les Cahiers européens; Science Po: Paris, France, 2014; Volume 2, Available online: https://www.sciencespo.fr/centre-etudes-europeennes/sites/sciencespo.fr.centre-etudes-europeennes/files/cahiers_europeens_2014_02_maya.jegen_.pdf (accessed on 3 October 2022).
- Jegen, M.; Mérand, F. Constructive Ambiguity: Comparing the EU’s Energy and Defence Policies. West Eur. Politics 2014, 37, 1. [Google Scholar] [CrossRef]
- Nersesian, R.L. Energy Economics. Markets, History and Policy; Routledge: New York, NY, USA, 2016. [Google Scholar]
- The Economist. Conscious Uncoupling: Reducing Europe’s Dependence on Russian Gas is Possible—But It Will Take Time, Money and Sustained Political Will. Available online: https://www.economist.com/briefing/2014/04/03/conscious-uncoupling (accessed on 9 September 2022).
- The International Monetary Fund. Facing Crisis Upon Crisis: How the World Can Respond. Available online: https://www.imf.org/en/News/Articles/2022/04/14/sp041422-curtain-raiser-sm2022 (accessed on 15 August 2022).
- Mata Perez, M.; Scholten, D. Divergent Energy Paths within the European Union. In Divergent Energy Paths within the European Union, ECPR Conference. 2018. Available online: https://pure.tudelft.nl/ws/portalfiles/portal/57399740/Mata_Perez_and_Scholten_2018_ECPR_Divergent_Energy_Paths_within_the_European_Union.pdf (accessed on 3 October 2022).
- Wojtkowska-Łodej, G.; Nyga-Łukaszewska, H. Convergence or divergence of the European Union’s energy strategy in the central European countries? Centre for European Studies. 2019. Available online: https://www.proquest.com/working-papers/convergence-divergence-european-unions-energy/docview/2268536863/se-2 (accessed on 10 October 2022).
- Ritchie, H.; Roser, M.; Rosado, P. Energy Mix (coal). OurWorldInData.org. Available online: https://ourworldindata.org/energy-mix#coal-what-share-of-energy-comes-from-coal (accessed on 3 October 2022).
- Ritchie, H.; Roser, M.; Rosado, P. Energy Mix (oil). OurWorldInData.org. Available online: https://ourworldindata.org/energy-mix#oil-what-share-of-energy-comes-from-oil (accessed on 3 October 2022).
- Ritchie, H.; Roser, M.; Rosado, P. Energy Mix (gas). OurWorldInData.org. Available online: https://ourworldindata.org/energy-mix#gas-what-share-of-energy-comes-from-gas (accessed on 3 October 2022).
- Eurostat Data on Imports of Solid Fossil Fuels by Partner Country. Available online: https://ec.europa.eu/eurostat/databrowser/view/NRG_TI_SFF__custom_2374448/default/table?lang=en (accessed on 3 October 2022).
- Eurostat Data on Imports of Oil and Petroleum Products by Partner Country. Available online: https://ec.europa.eu/eurostat/databrowser/view/NRG_TI_OIL__custom_2374528/default/table?lang=en (accessed on 3 October 2022).
- Eurostat Data on Imports of Natural Gas by Partner Country. Available online: https://ec.europa.eu/eurostat/databrowser/view/NRG_TI_GAS__custom_2374540/default/table?lang=en (accessed on 3 October 2022).
- GDP Values from the World Bank Database. Available online: https://data.worldbank.org/indicator/NY.GDP.PCAP.PP.CD (accessed on 3 October 2022).
- Distances from Database by S. Georg. Available online: https://www.distance.to (accessed on 3 October 2022).
- Zweifel, P.; Praktiknjo, A.; Erdmann, G. Energy Economics: Theory and Applications; Springer: Berlin, Germany, 2017. [Google Scholar]
- Lee, J. Descriptive Statistics. In International Encyclopedia of Human Geography, 2nd ed.; Kobayashi, A., Ed.; Elsevier: Amsterdam, The Netherlands, 2020; pp. 13–20. [Google Scholar] [CrossRef]
- Rosati, D.K. Asymmetric Shocks in the Euro Area: Convergence or Divergence? Int. J. Manag. Econ. 2017, 53, 7–25. [Google Scholar] [CrossRef]
- Intellinews. Central Europe Remains Highly Exposed to Russian Uranium. Available online: https://www.intellinews.com/radioactive-central-europe-remains-highly-exposed-to-russian-uranium-249827/ (accessed on 15 August 2022).
- Di Leo, G.; Sardanelli, F. Statistical significance: P value, 0.05 threshold, and applications to radiomics—Reasons for a conservative approach. Eur. Radiol. Exp. 2020, 4, 18. [Google Scholar] [CrossRef] [PubMed]
- Osborne, J.W.; Overbay, A. The power of outliers (and why researchers should ALWAYS check for them). Pract. Assess. Res. Eval. 2004, 9, 6. [Google Scholar] [CrossRef]
- Esperanza Mata Pérez, M.; Scholten, D.; Smith Stegen, K. The multi-speed energy transition in Europe: Opportunities and challenges for EU energy security. Energy Strategy Rev. 2019, 26, 100415. [Google Scholar] [CrossRef]
- Nielsen, H.; Warde, P.; Kander, A. East versus West: Energy intensity in coal-rich Europe, 1800–2000. Energy Policy 2018, 122, 75. [Google Scholar] [CrossRef]
- Hafner, M.; Raimondi, P.P. Priorities and challenges of the EU energy transition: From the European Green Package to the new Green Deal. Russ. J. Econ. 2020, 6, 374. [Google Scholar] [CrossRef]
- Siddi, M. EU-Russia Energy Relations. In Handbook of Energy Governance in Europe; Knodt, M., Kemmerzell, J., Eds.; Springer: Cham, Switzerland, 2020. [Google Scholar] [CrossRef]


| Measure | Value |
|---|---|
| Mean | 0.24247 |
| Standard error | 0.03924 |
| Median | 0.24225 |
| Standard deviation | 0.20012 |
| Sample variance | 0.04005 |
| Kurtosis | −0.82844 |
| Skewness | 0.57776 |
| Range | 0.63285 |
| Minimum | 0.01651 |
| Maximum | 0.64935 |
| Sum | 6.30416 |
| Count | 26 |
| Measure | Value |
|---|---|
| Mean | 0.00066 |
| Standard error | 0.01651 |
| Median | −0.00968 |
| Standard deviation | 0.08577 |
| Sample variance | 0.00736 |
| Kurtosis | 17.98135 |
| Skewness | 3.71438 |
| Range | 0.51339 |
| Minimum | −0.12146 |
| Maximum | 0.39192 |
| Sum | 0.01770 |
| Count | 27 |
| EU27 | 8 | 50% | FI | 11 | 69% | LU | 8 | 50% |
| AT | 7 | 44% | FR | 10 | 63% | NL | 10 | 63% |
| BE | 10 | 63% | DE | 10 | 63% | PL | 9 | 56% |
| BG | 6 | 38% | EL | 8 | 50% | PT | 7 | 44% |
| HR | 10 | 63% | HU | 10 | 63% | RO | 8 | 50% |
| CY | 9 | 56% | IE | 5 | 31% | SK | 12 | 75% |
| CZ | 11 | 69% | IT | 7 | 44% | SI | 10 | 63% |
| DK | 9 | 56% | LV | 8 | 50% | ES | 10 | 63% |
| EE | 11 | 69% | LT | 10 | 63% | SE | 8 | 50% |
| Regression Statistics—Dynamics | ||||||
| Multiple R | 0.35615 | |||||
| R Square | 0.12684 | |||||
| Adjusted R Square | 0.04747 | |||||
| Standard Error | 0.08383 | |||||
| Observations | 25 | |||||
| ANOVA | df | SS | MS | F | Significance F | |
| Regression | 2 | 0.02246 | 0.01123 | 1.59796 | 0.22491 | |
| Residual | 22 | 0.15462 | 0.00703 | |||
| Total | 24 | 0.17708 | ||||
| Coeff | SE | t Stat | p-value | Lower 95% | Upper 95% | |
| Intercept | −0.0825 | 0.0532 | −1.5511 | 0.1352 | −0.1928 | 0.0278 |
| GDP PC | 0.0000 | 0.0000 | 1.3331 | 0.1961 | −0.0000 | 0.0000 |
| DFR | 0.0000 | 0.0000 | 0.8634 | 0.3972 | −0.0000 | 0.0001 |
| Regression Statistics—Consistency | ||||||
| Multiple R | 0.36050 | |||||
| R Square | 0.12996 | |||||
| Adjusted R Square | 0.05087 | |||||
| Standard Error | 0.10237 | |||||
| Observations | 25 | |||||
| ANOVA | df | SS | MS | F | Significance F | |
| Regression | 2 | 0.03444 | 0.01722 | 1.64311 | 0.21624 | |
| Residual | 22 | 0.23056 | 0.01048 | |||
| Total | 24 | 0.26500 | ||||
| Coeff | SE | t Stat | p-value | Lower 95% | Upper 95% | |
| Intercept | 0.6720 | 0.0649 | 10.3475 | * 0.0000 | 0.5373 | 0.8067 |
| GDP PC | −0.0000 | 0.0000 | −0.4320 | 0.6699 | −0.0000 | 0.0000 |
| DFR | −0.0000 | 0.0000 | −1.6197 | 0.1195 | −0.0001 | 0.0000 |
| Regression Statistics—Idiosyncrasy | ||||||
| Multiple R | 0.81884 | |||||
| R Square | 0.67050 | |||||
| Adjusted R Square | 0.64054 | |||||
| Standard Error | 0.15565 | |||||
| Observations | 25 | |||||
| ANOVA | df | SS | MS | F | Significance F | |
| Regression | 2 | 1.08459 | 0.54229 | 22.38386 | * 0.00000 | |
| Residual | 22 | 0.53299 | 0.02423 | |||
| Total | 24 | 1.61758 | ||||
| Coeff | SE | t Stat | p-value | Lower 95% | Upper 95% | |
| Intercept | 0.6979 | 0.0987 | 7.0678 | * 0.0000 | 0.4931 | 0.9027 |
| GDP PC | −0.0000 | 0.0000 | −3.5442 | * 0.0018 | −0.0000 | −0.0000 |
| DFR | −0.0002 | 0.0000 | −4.7406 | * 0.0001 | −0.0003 | −0.0001 |
Disclaimer/Publisher’s Note: The statements, opinions and data contained in all publications are solely those of the individual author(s) and contributor(s) and not of MDPI and/or the editor(s). MDPI and/or the editor(s) disclaim responsibility for any injury to people or property resulting from any ideas, methods, instructions or products referred to in the content. |
© 2023 by the author. Licensee MDPI, Basel, Switzerland. This article is an open access article distributed under the terms and conditions of the Creative Commons Attribution (CC BY) license (https://creativecommons.org/licenses/by/4.0/).
Share and Cite
Wiśniewski, T.P. Investigating Divergent Energy Policy Fundamentals: Warfare Assessment of Past Dependence on Russian Energy Raw Materials in Europe. Energies 2023, 16, 2019. https://doi.org/10.3390/en16042019
Wiśniewski TP. Investigating Divergent Energy Policy Fundamentals: Warfare Assessment of Past Dependence on Russian Energy Raw Materials in Europe. Energies. 2023; 16(4):2019. https://doi.org/10.3390/en16042019
Chicago/Turabian StyleWiśniewski, Tomasz P. 2023. "Investigating Divergent Energy Policy Fundamentals: Warfare Assessment of Past Dependence on Russian Energy Raw Materials in Europe" Energies 16, no. 4: 2019. https://doi.org/10.3390/en16042019
APA StyleWiśniewski, T. P. (2023). Investigating Divergent Energy Policy Fundamentals: Warfare Assessment of Past Dependence on Russian Energy Raw Materials in Europe. Energies, 16(4), 2019. https://doi.org/10.3390/en16042019