Article

Analysis of the Influence of the Skin Effect on the Efficiency and Power of the Receiver in the Periodic WPT System

by
Jacek Maciej Stankiewicz
Faculty of Electrical Engineering, Bialystok University of Technology, Wiejska 45D, 15-351 Bialystok, Poland
Energies 2023, 16(4), 2009; https://doi.org/10.3390/en16042009
Submission received: 27 December 2022 / Revised: 13 February 2023 / Accepted: 15 February 2023 / Published: 17 February 2023
(This article belongs to the Special Issue Research on Wireless Power Transfer System)

Abstract

:
The article shows an analysis of the influence of the skin effect on the maximum efficiency and maximum power of a receiver in a wireless power transfer system (WPT). For this purpose, the original solution of the WPT system was used, which contained periodically arranged planar coils. The results concern the multi-variant analysis of the WPT system. The geometry of the coils was taken into account, i.e., the size of coils, the number of turns, as well as the distance between the transmitting and receiving coils. The calculations were carried out over the frequency range of 0.1–1 MHz. In order to analyse the influence of the skin effect on the proposed WPT system, two approaches were used: analytical and numerical. The article analyses the appropriate selection of load impedance in order to obtain maximum efficiency or maximum power of the receiver. In this analysis, the influence of the skin effect on each of the two operating procedures was examined. The obtained analytical and numerical results differed by no more than 0.45%, which confirmed the correctness of the proposed WPT model. Based on the results, it was determined that the greatest influence of the skin effect occurred at 1 MHz. Then, the efficiency decreased by no more than 9%, while in the case of the receiver power decreased by an average of 25%. Detailed analysis shows the influence of the skin effect on the system parameters, and can also be an important element in the design of WPT systems.

1. Introduction

Wireless power transfer (WPT) systems are used in many fields such as electric vehicle charging [1,2,3,4], electric vehicles (PHEVs) [5,6], implantable medical devices (IMDs) [7,8,9], and consumer electronics [10,11]. WPT technology is used in robotic systems [12], communication sets [13,14,15], and in the Internet of Things (IoT) [12,13]. WPT technology is divided into two main classes (Figure 1). The first is the radiated far-field WPT [16,17,18]. The second group is a non-radiated near-field WPT.
Many authors analysed the shape of the coils and winding methods. In [19], textile coils for near-field WPT were analysed due to their characteristics. The focus was on the efficiency of the WPT system. In [20], the authors analysed coils of various shapes (circular, square, or planar). In [21], the authors analysed sewn, laser cut, and printed inductors. One of the coils was made of silver-coated yarn. They showed that this type of coil was not suitable for the WPT system. The reason was the excessive resistance of the coil.
In WPT systems, there is an interaction between the magnetic field and the electric field. The AC current in the copper coils is the source of the magnetic field, which induces an oppositely directed electric field. This field is responsible for the formation of secondary currents, i.e., currents flowing in the conductor in the opposite direction to the main current. Secondary currents reduce the value of the magnetic field and change the current density. In addition, the magnetic field created by the current around the conductor affects the adjacent conductors, penetrating them as an electromagnetic wave, inducing currents on the surface of adjacent conductors and thus increasing the value of the current flowing. These phenomena are the source of the so-called skin effect. These phenomena have a significant influence on the value of power losses [22] and the efficiency of the entire WPT system. As the skin effect increases, so does the winding resistance [23]. To reduce power loss in copper, enameled wires are made into a bundle of wires made of many very thin conductors insulated from each other. The diameter of a single wire from which the bundle is made depends primarily on the depth of current penetration on the surface of the copper wire [23]. The wire diameter should be less than the penetration depth. This depth in a single copper wire depends on the frequency of change in current (f), permeability (μ), and conductivity (σ) of the conductor. At high frequencies, the skin effect causes the current not to flow through the entire cross-section of the wire, but only through its outer layer, adjacent to the surface, and the thickness of this layer decreases with increasing frequency.
In [24], an optimized winding model was proposed. In this approach, a multi-strand Litz wire was used. This type of wire allows reducing the skin effect, particularly at high frequencies. Litz wire is one of the best solutions to reduce the skin effect. Unfortunately, it cannot be used for winding small planar coils, which are proposed in this article. For this reason, in small coils, it is important to know the influence of the skin effect on the efficiency of the system.
In [25], the skin effect at high frequency was studied. The authors showed a plane spiral arrangement with air hole. In this approach, they indicated that in order to reduce the influence of the skin effect, the thickness of the wire must be less than the skin depth. In [26], experimental measurements of the low frequency skin effect and internal inductance for a number of copper wires of various diameters and various linear cylindrical solid conductors, including copper, aluminum and brass rods, are provided. Measurements were compared with standard resistors, inductors, and capacitors.
Due to the problems related to the skin effect, new solutions are sought, including use of metamaterials [27] in WPT systems. In [28], the authors proposed the use of metasurfaces to enhance evanescent wave coupling to improve the wireless power transfer efficiency of multiple receivers.
Typical topologies are series and parallel combinations. In [29], the authors presented a series–parallel-series topology. This topology allows the power rating to be shifted in the event of severe misalignment. The authors [30] proposed various types of coils, e.g., domino. However, studies have only been conducted for the series configuration, when the series–parallel system has not yet been fully analysed.
Parallel connections have already been considered in the literature. For example, many sources and loads were shown in [31]. Nevertheless, to match the input impedance, the sources had been separated (in theory, each load had its own source), and additionally, the source-–load connection was realized using intermediate resonant coils. This type of “modular” system has successfully integrated multiple low-power IPT systems to increase power level, even at the cost of efficiency. In [32], a different approach was used, several transmitter–receiver systems were made, but a single load was powered (similarly to [31]). Therefore, with a reduced number of parallel circuits and only one load, the matching network was not needed, while recent studies [33,34] focused on parallel-connected inverters (sources) with a single transmitting coil and one receiving coil. This resulted in the efficiency between 85% and 93%, whereas the study presented in this manuscript focused on both multiple sources and loads (arranged periodically) with the intention of powering low-power devices, which was not investigated widely so far.
The paper shows a WPT system with periodically arranged planar coils. Two analysis approaches (analytical and numerical) have been proposed. The analytical method allows quickly determining the main parameters of the system, such as power and efficiency. The proposed numerical solution does not require the entire model with all coils, as those presented in [35,36,37]. In typical numerical modeling of the WPT system, the authors did not use periodic boundary conditions. For this reason, the number of degrees of freedom (NDOF) is huge, which does not allow for detailed representation of the models and limits its size. The proposed numerical solution allows for the analysis of complex structures. Both proposed solutions reduce the size of numerical and circuit models. By appropriate selection of the load impedance, it was possible to calculate maximum efficiency and maximum load power. Therefore, the system was studied in two operating procedures. The analysis was conducted over the frequency range of 0.1 to 1 MHz. Calculations were made for different values of the model geometry. The influence of the skin effect and geometrical parameters of the WPT system on the efficiency and power of the load was analysed.
In Section 2, the analyzed model of the WPT system is presented and described. The author also describes numerical and analytical approaches to analysis. In Section 3, the following data are shown: (a) analysis conditions and calculated values of lumped parameters of the analyzed models (Section 3.1); (b) numerical and analytical results for the system operating at maximum efficiency (Section 3.2); (c) numerical and analytical results for the system operating at maximum load power (Section 3.3). In Section 4, the conclusions are described.

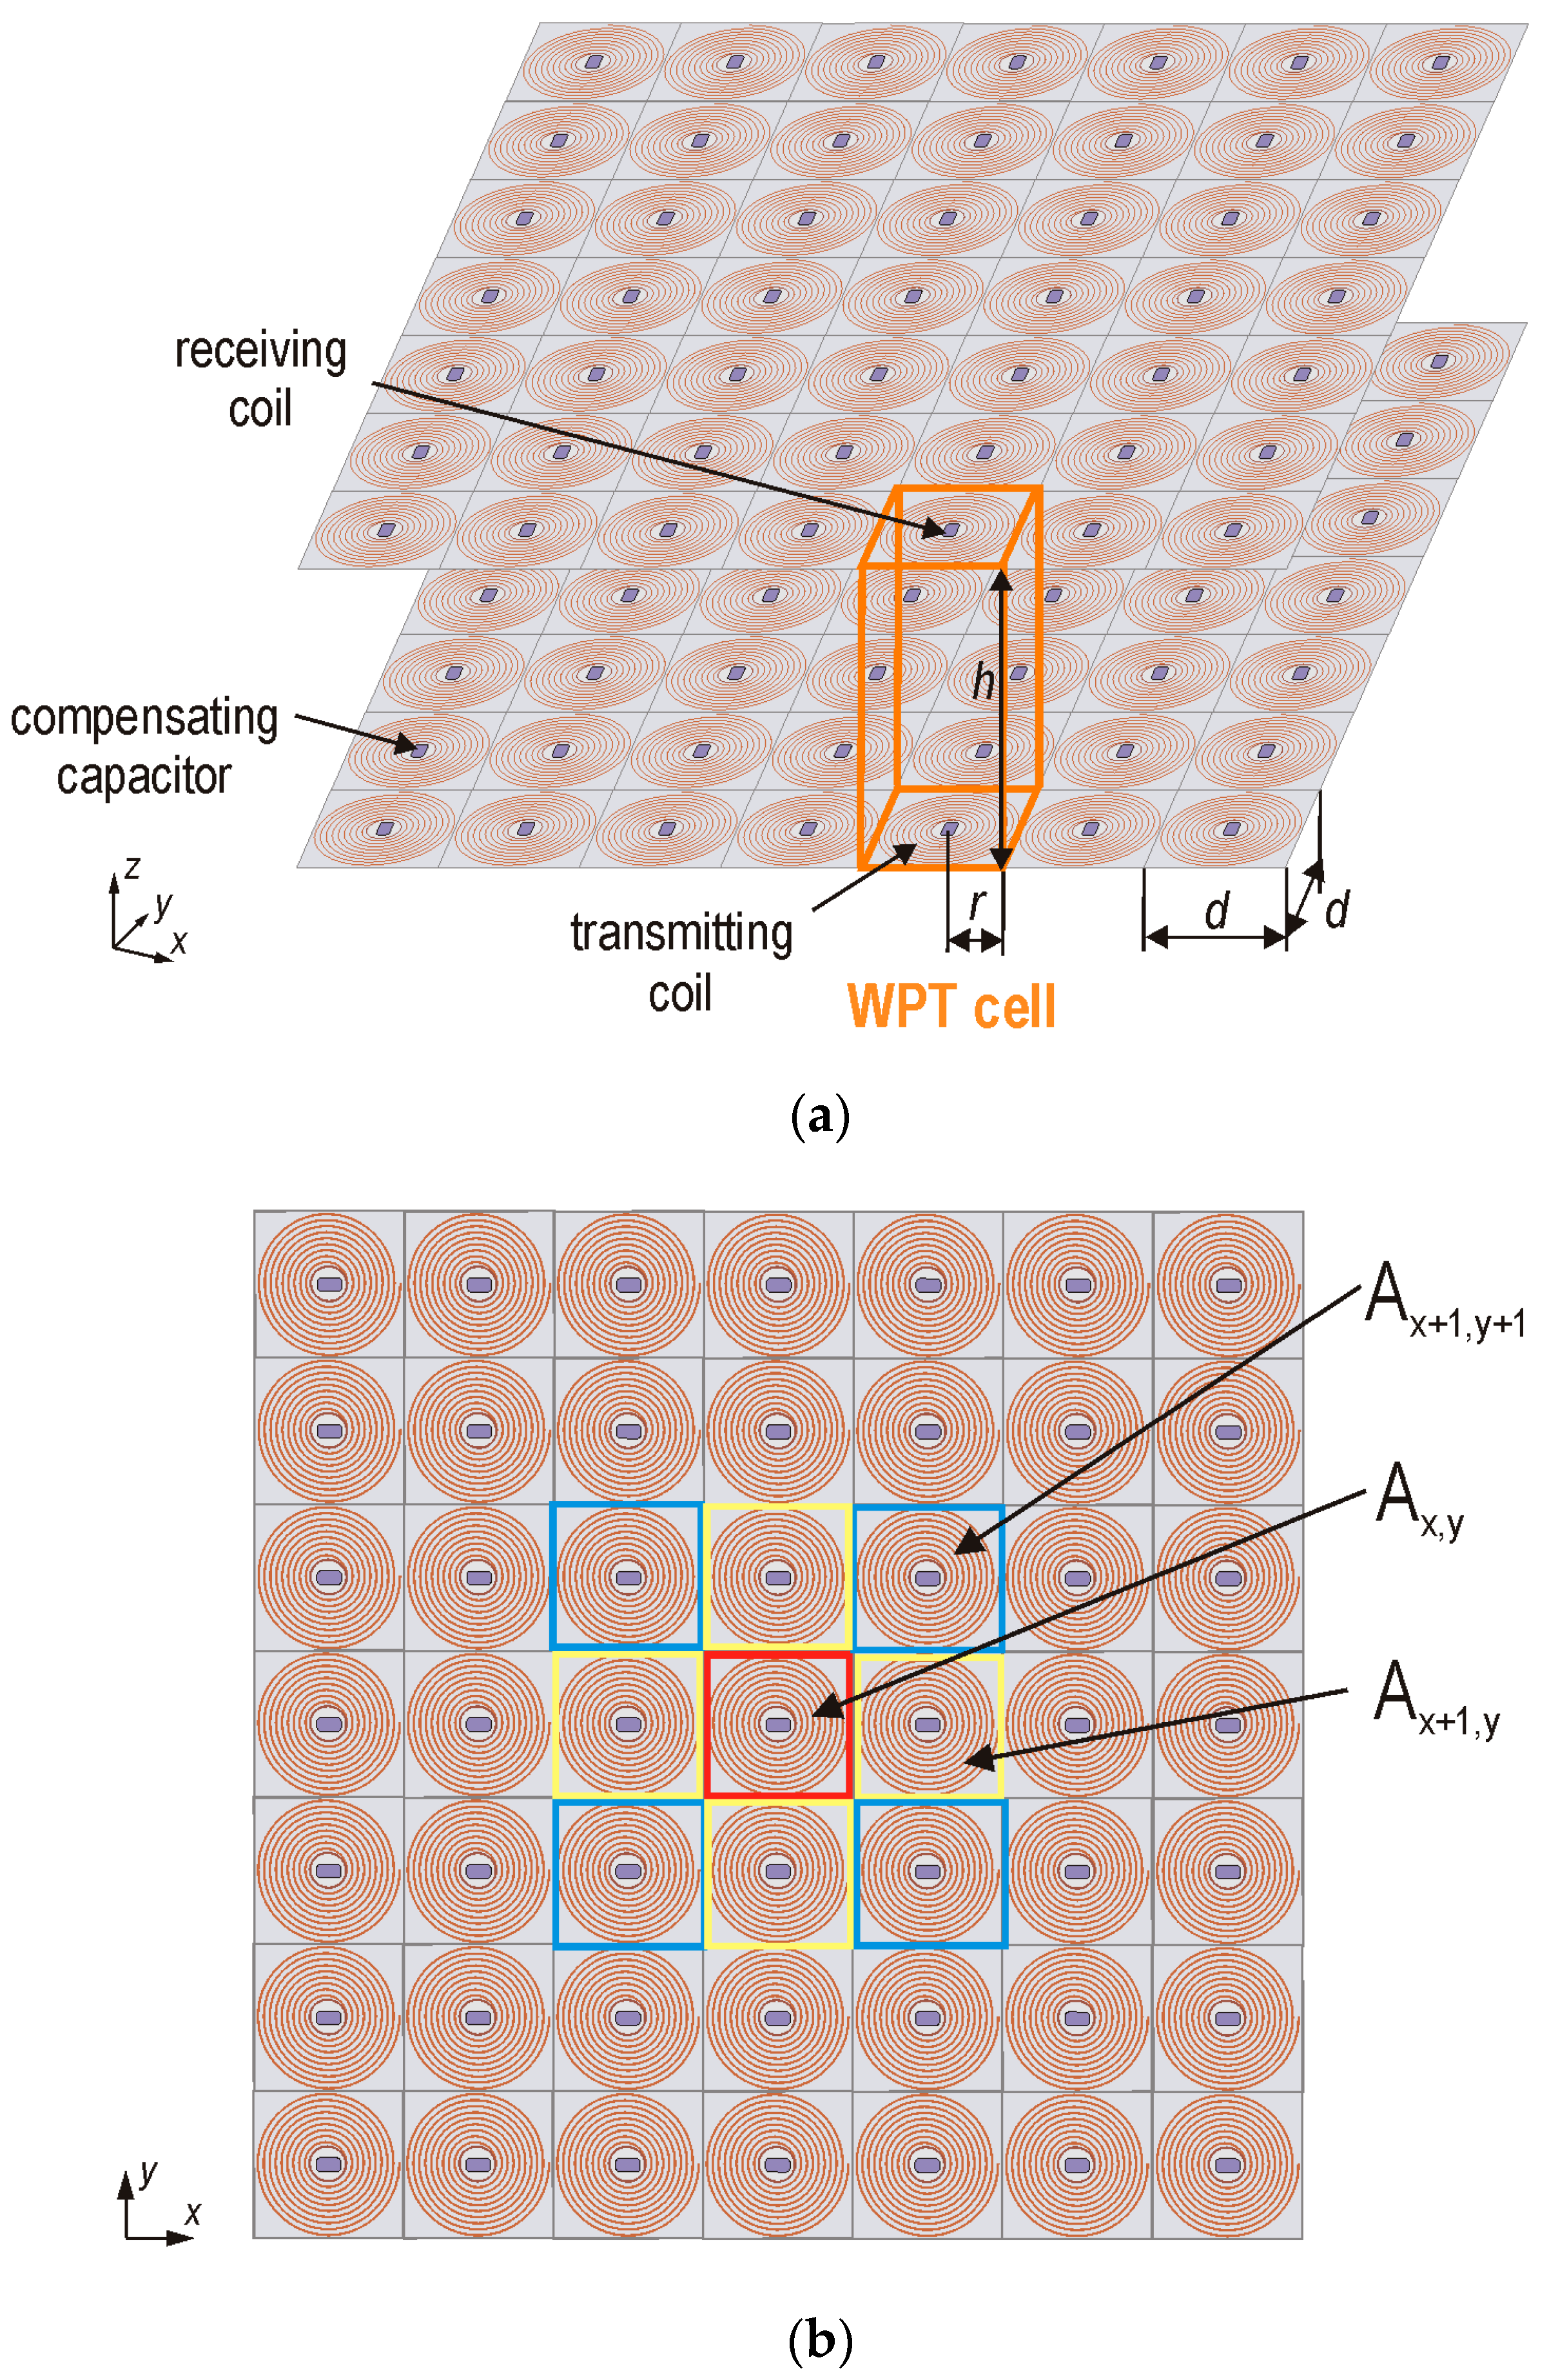
2. Analyzed Models Composed of Plane Coils

The considered system has transmitting (Tx) and receiving (Rx) coils. They are arranged periodically. Each Tx-Rx pair is called a WPT cell. The dimensions of the cell depend on the dimensions of the coils (d × d) (Figure 2). Both coils (Tx and Rx) of the WPT have the same radius (r) and the same number of turns (n). Each coil contains an additional compensating capacitor. The transmitting coils form the transmitting surface and the receiving coils form the receiving surface, between which wireless energy transfer takes place. The transmitting surface has a sinusoidal voltage source (Ut). The receiving coils are connected to the loads (Zl). Two types of coils were considered: a small coil (radius r = 0.01 m) and a large coil (radius r = 0.025 m). The coils were wound on a non-conductive carcass. Compensating capacitors are mounted on them, which are connected in series with the coils.
In the analyzed models, it is possible to select the power supply conditions depending on the requirements. Multiple receivers can be powered simultaneously. The considered cell Ax+m,y+n (Figure 2b) is part of an array, where m is the column number and n is the row number.
Each Tx is connected in parallel with a sinusoidal RMS voltage source (Ut), which powers the transmitting surface. Each WPT cell is assigned an individual load, which is Zl.
The article presents two approaches to analysis: numerical and analytical. The use of the proposed numerical approach allows reducing the number of degrees of freedom (NDOF) and shorten the analysis time (Section 2.1). However, the use of an analytical approach allows determining the power flow already at the design stage. A preliminary analysis of basic electrical properties is also possible (Section 2.2).

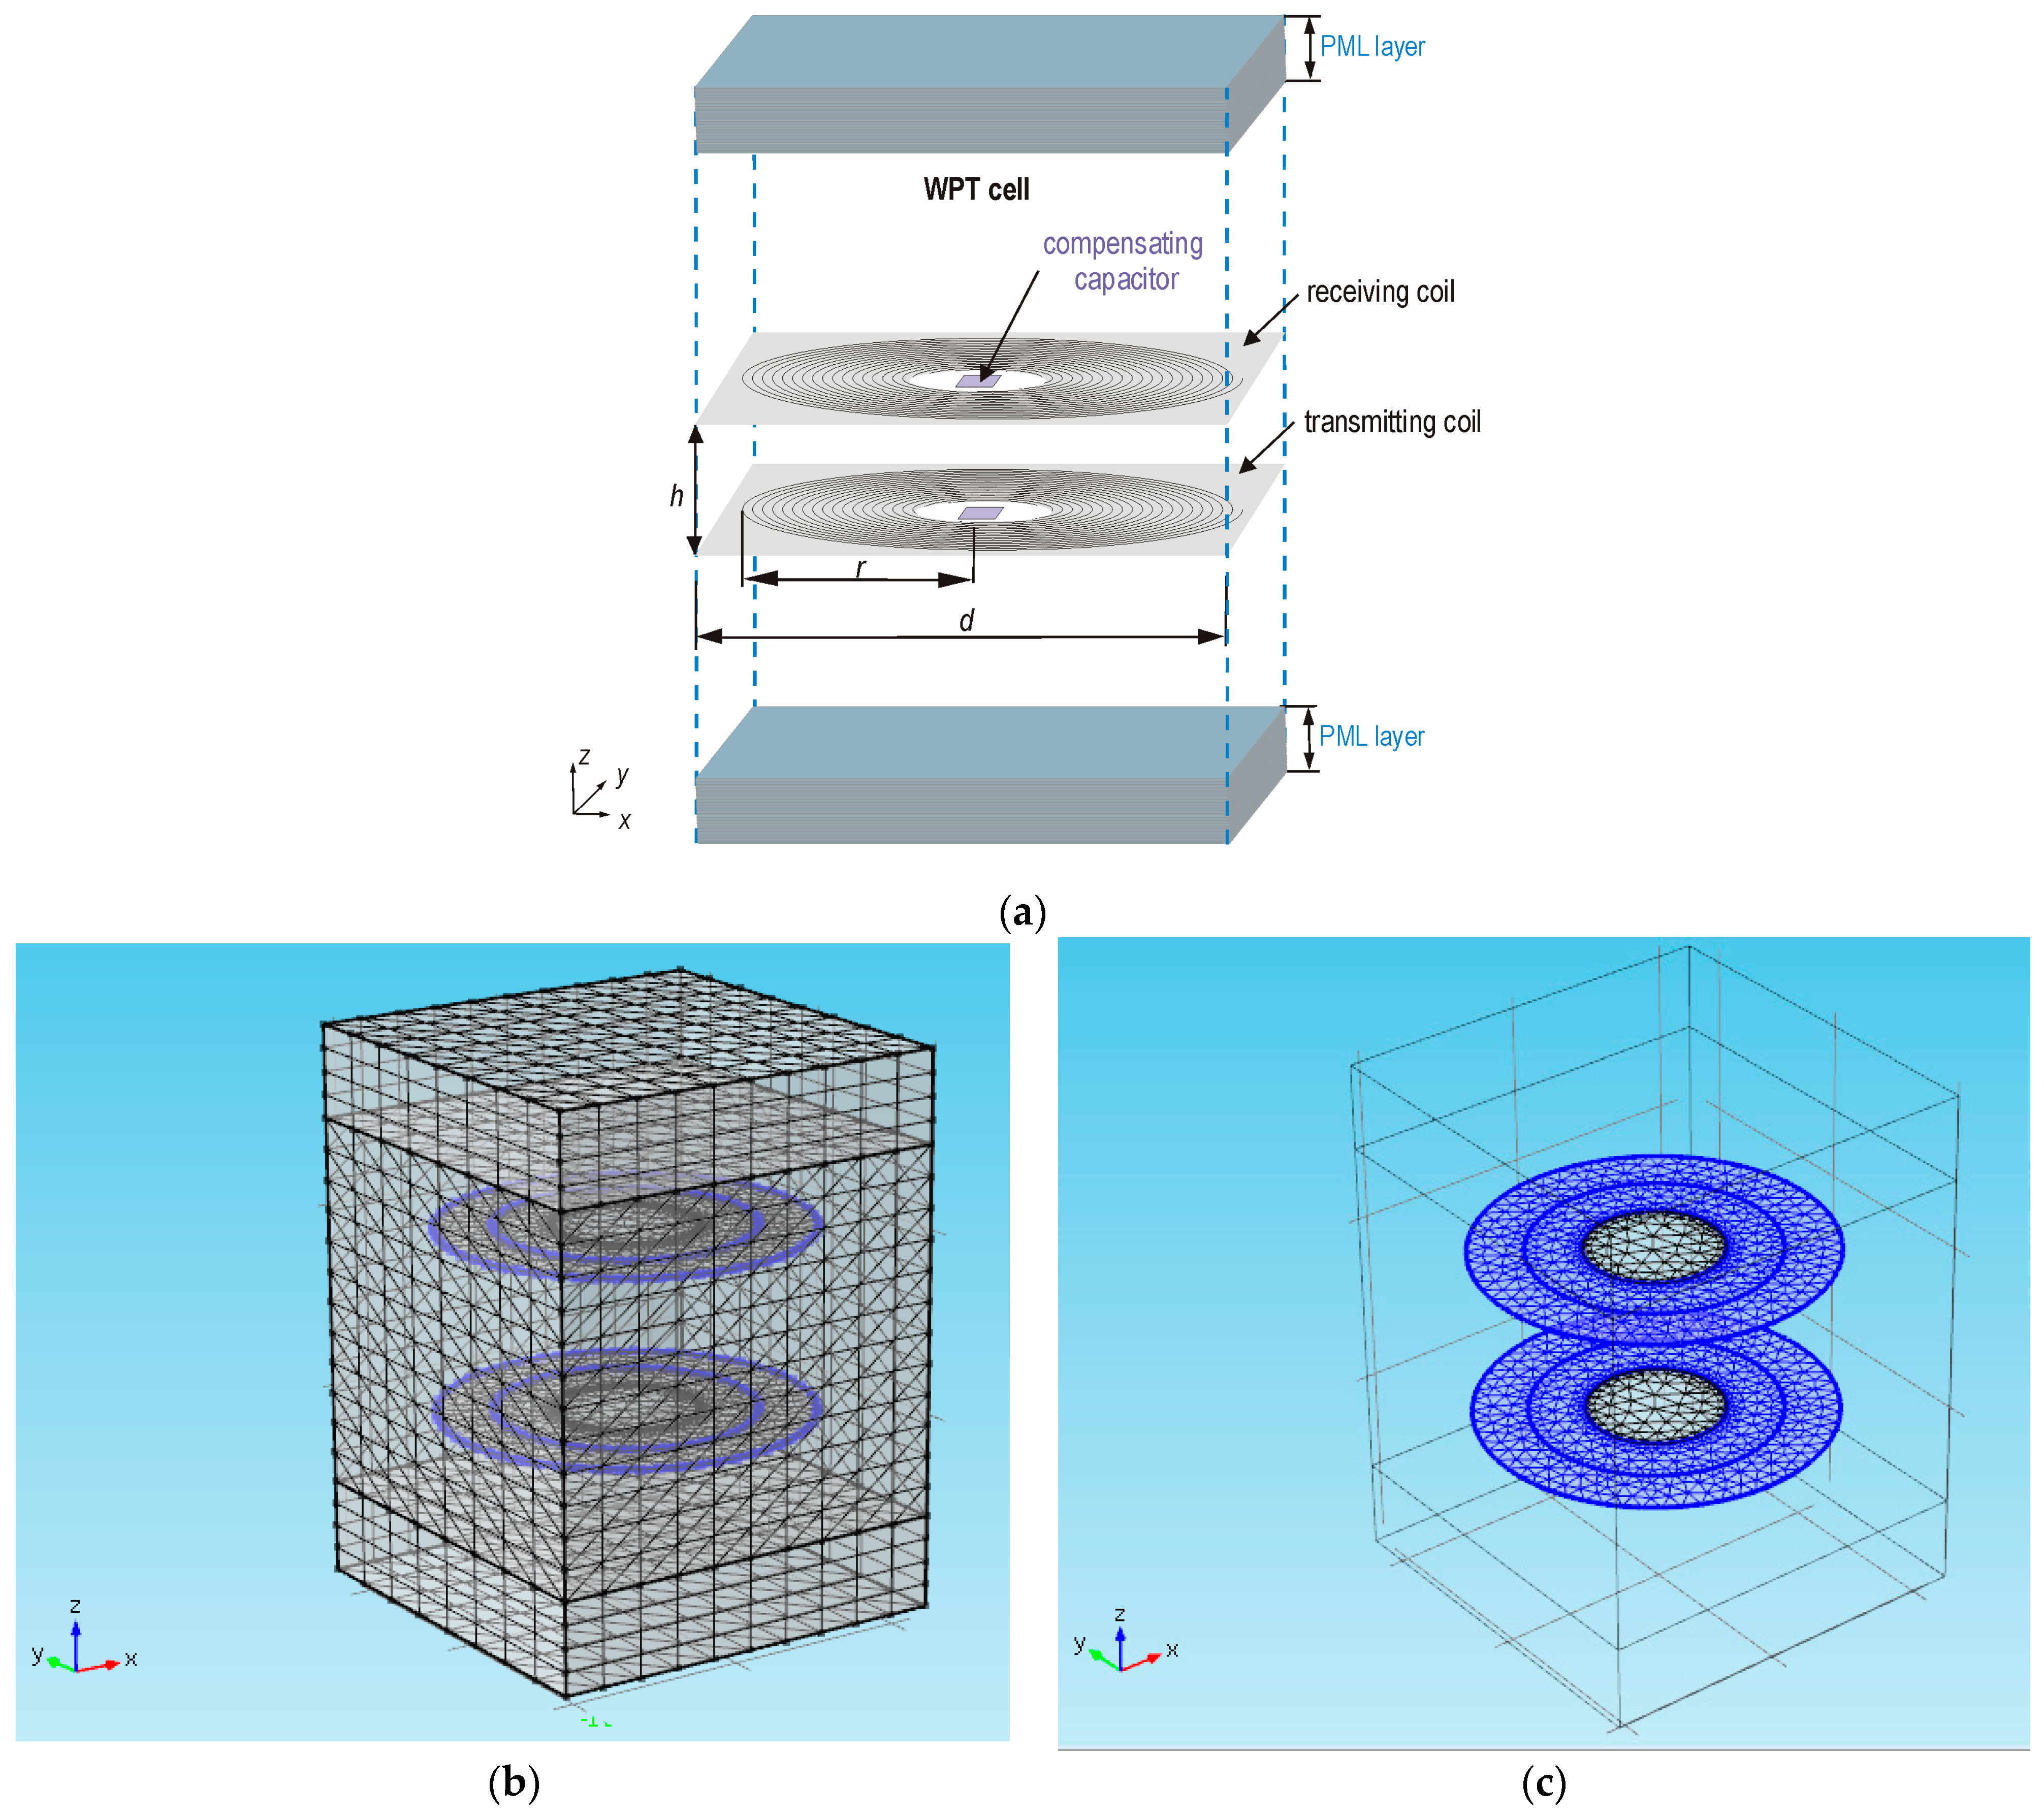
2.1. Numerical Approach

Numerical modeling is one of the basic tools of a scientist or engineer. With the use of appropriate models resulting from the approximate description of physical phenomena, it is possible to both test the design of devices and determine or optimize their essential features. The biggest challenge is to describe the problem, so that it is concise and contains the most important features of the modeled system. Proper selection of boundary conditions requires both practical experience and theoretical knowledge.
The use of numerical methods (e.g., FEM, FDTD, FDFD) [38,39,40] allows creating a model, and because of quick modifications, it is possible to perform a multi-variant analysis in order to determine the distribution of the magnetic field. The disadvantage of numerical methods is the limitation of the model geometry, i.e., the number of degrees of freedom (NDOF). In addition, the greater the number of degrees of freedom, the longer the computation time, but then the results are more accurate.
One of the most commonly used methods for building approximate numerical models is the finite element method (FEM). It allows searching for solutions of partial differential equations after discretization of these equations using mesh elements that are treated as fragments of a discretized area with homogeneous properties.
The COMSOL package, with the use of an additional Radio Frequency module, enables modeling of wave problems in the frequency domain. A detailed description of these boundary conditions can be found in the COMSOL package documentation [41,42].
The analyzed models had the following variables: coil radius (r), distance between the transmitting and receiving coils (h), and the number of turns (n). The coils are made of a very thin copper wire (wd = 200 µm), an electrical insulator with a thickness (wi = 5 µm), and wire conductivity (σc = 5.6 × 10⁷ S/m). The analyzed cell is filled with air (Figure 3). The compensation capacitor was modelled as a lumped element with capacitance (C). With periodic boundary conditions (PBC) [38,39,40,41,42], it is possible to simplify the model to a single cell filled with air and composed of a Tx-Rx pair. Periodic conditions were provided on surfaces parallel to the Z-axis. Using the finite element method, the entire area needs to be digitized. A perfectly matched layer (PML) was used to simulate an unrestricted environment, which prevents wave reflections from the boundaries of the area. Two additional layers (PML) were introduced at the top and bottom of the WPT cell (Figure 3a).
In addition, taking into account the use of the finite element method, the discretization of the area must be matched to the electromagnetic wave generated in it. In order to correctly represent the wave character in the considered models, the size of the mesh elements was selected, so that there were at least 20 elements between adjacent nodes per wavelength [40,41,42] (Figure 3b,c). A smaller number does not allow good mapping of the entire wave period, while a larger number increases the number of degrees of freedom, which also extends the calculation time.
The proposed model of the WPT system was constructed in the Comsol Multiphysics 4.3b software, which has built-in functions to solve the presented problems. It was possible to limit the number of degrees of freedom by using the finite element mesh adaptation. This allowed the mesh to be fine-tuned at important points in the model, i.e., coil turns and corners, for accurate results. The mesh inside the model consisted of elements such as Free tetrahedral and Free triangular. An analysis was conducted in the frequency domain, taking into account the physics of Magnetic fields in connection with a fragmentary Equivalent circuit. The coils were modeled using the built-in current sheet approximation of planar inductors (Multi-turn coil boundary condition), where the voltage source (Ut = 1 V), capacitors (C), and load (Zl) were connected to the coils by internal coupling with a fragmentary Equivalent circuit. The numerical models contained approximately 500,000 degrees of freedom.
The energy transport problem can be calculated using a magnetic vector potential
A = [ A x   A y   A z ] ,
and the Helmholtz equation
× 1 μ 0 × A j 2 π f σ A = J e ,
where Je is an external current density [A/m2] that results from a voltage supply (Ut). Equations (1) and (2) were solved by finite element method (FEM) [40,41,42,43]. The periodic boundary conditions on the four external surfaces were defined as magnetic insulation ns × A = 0, where ns is a surface normal vector ns = [1x 1y 1z].
The analyzed models of WPT system are presented in Table 1. The calculations were performed over a specified frequency range of 0.1 MHz to 1 MHz with a step of 50 kHz, at the distances h = r/2 and h = r for the small and large coils.

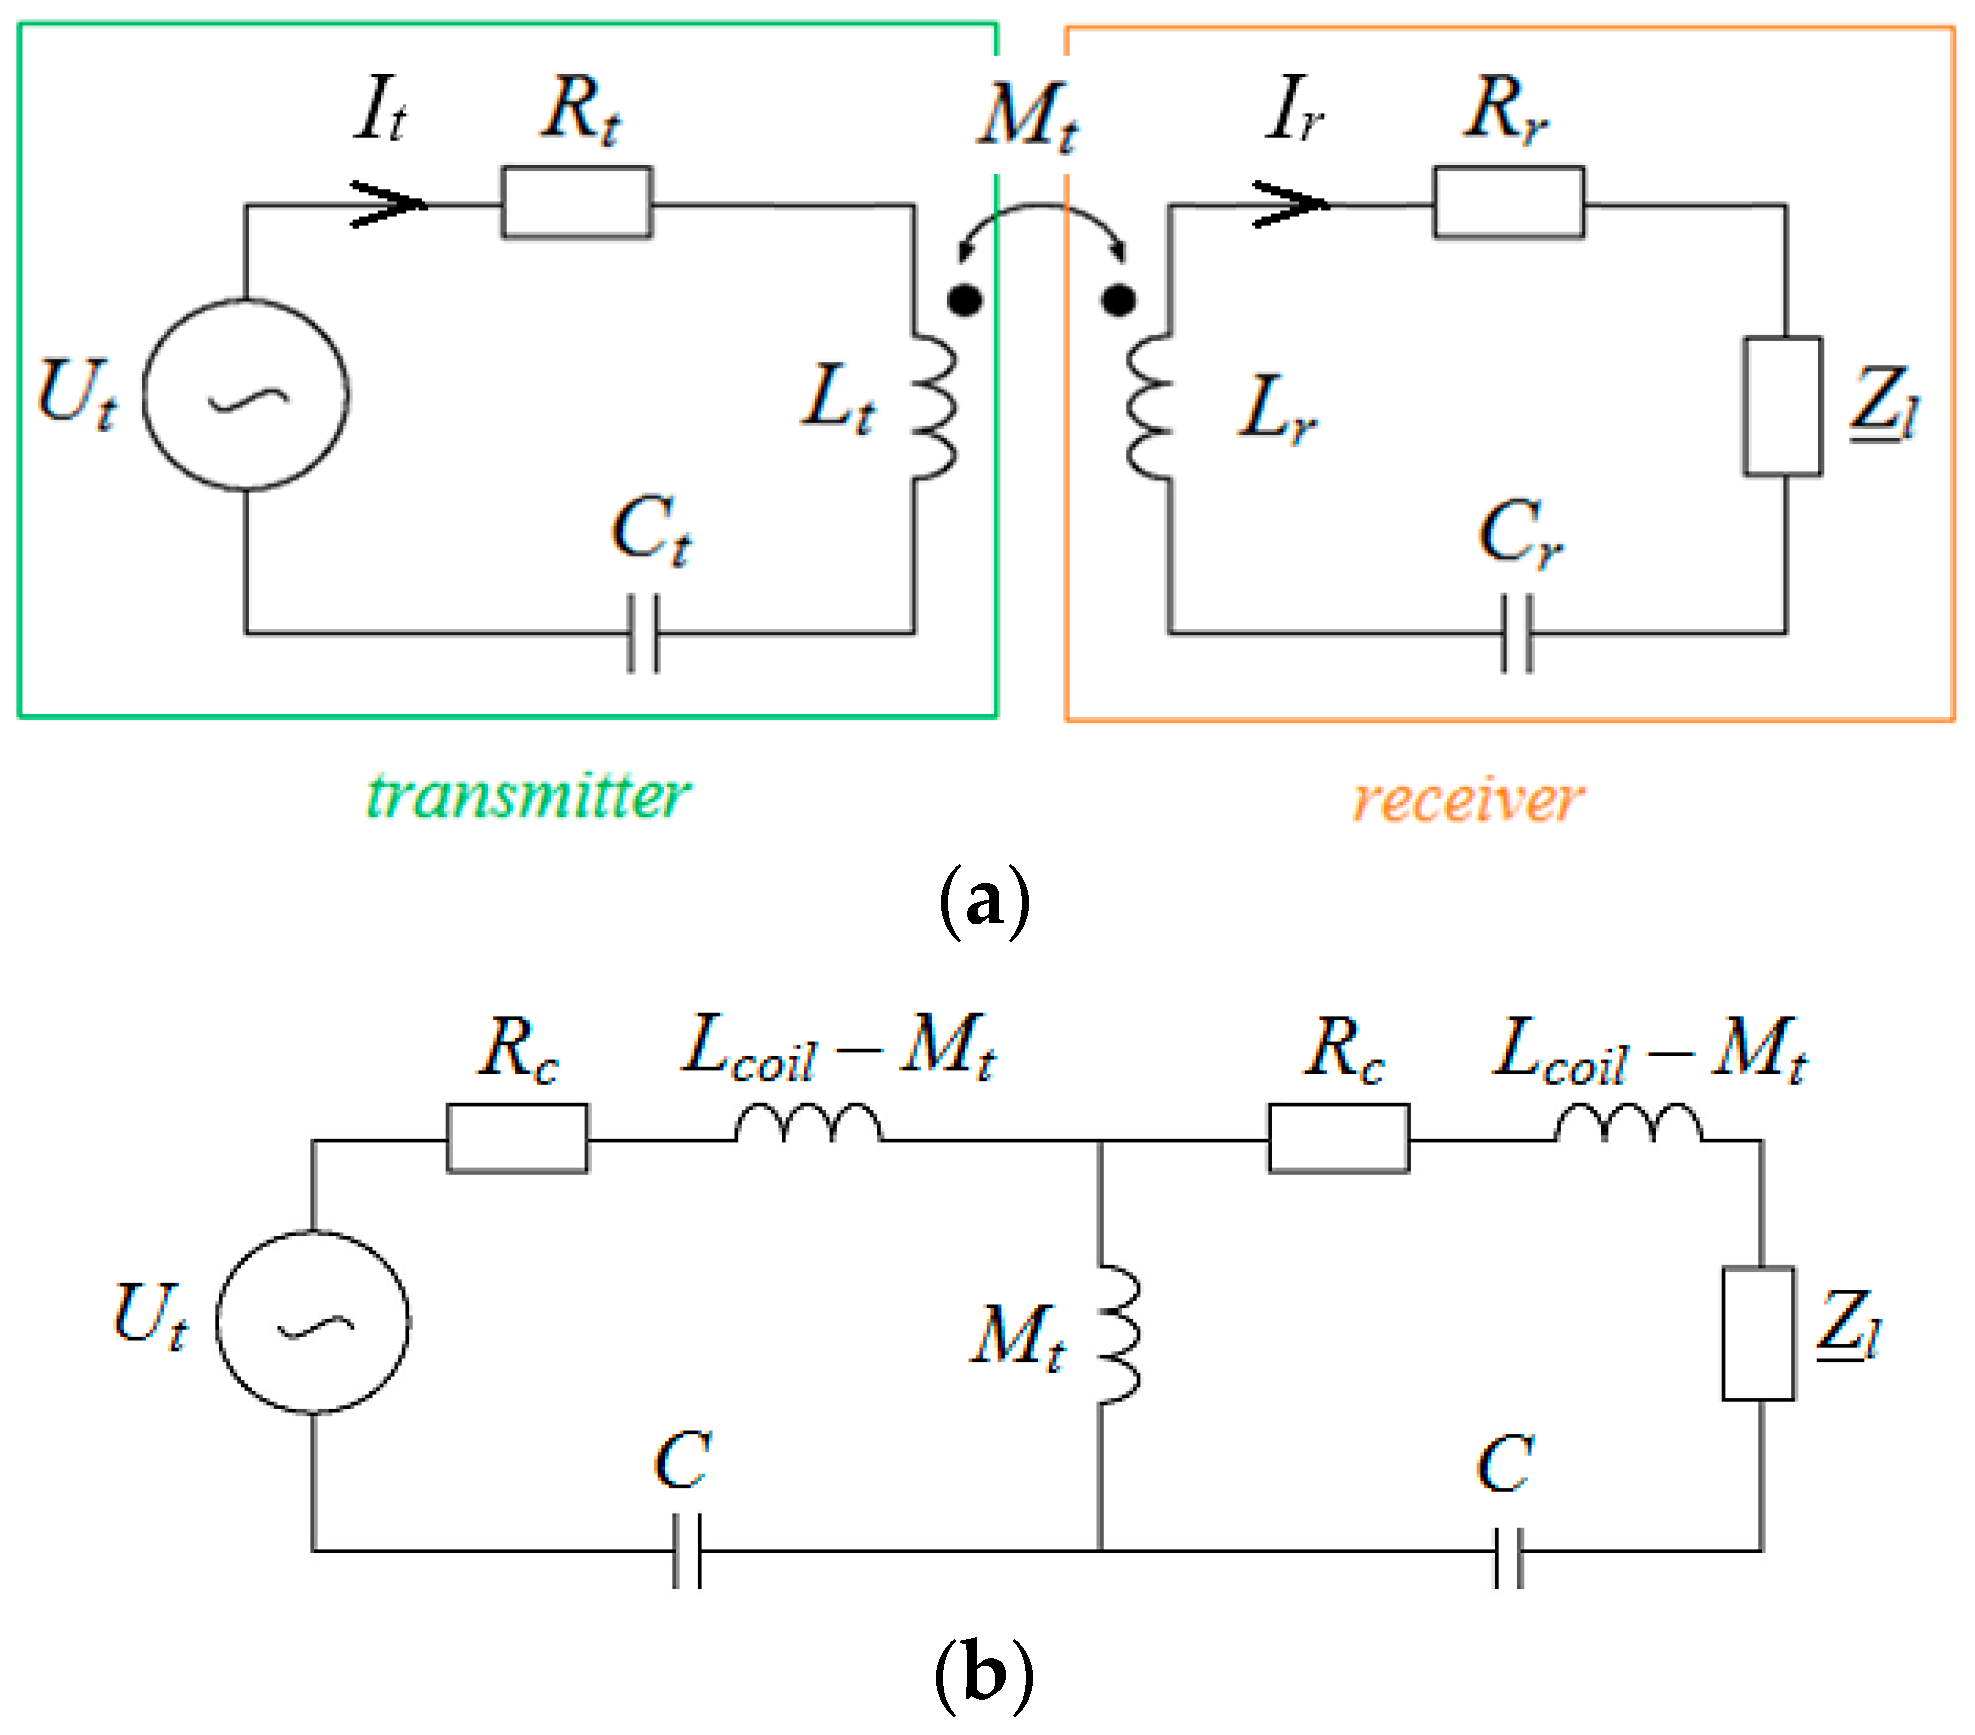
2.2. Analytical Approach

Numerical methods provide correct results if appropriate boundary conditions are applied and the real model is well mapped. Unfortunately, in numerical modeling it is often necessary to use simplifications, e.g., to reduce NDOF. On the other hand, the implementation of the equivalent circuit and the use of analytical equations allow obtaining a solution related to power transport. Very often, a simpler model that still provides the same range of calculations is desired. The use of the analytical method allows avoiding the long modeling process with the imposed requirements of the numerical method [43].
Due to the developed analytical method, it is possible to reduce a wide periodic network to a single WPT cell (Figure 4a). This approach will allow determining the initial results of the analysis, but at the same time, it is less complicated and does not require numerical modeling. The proposed analytical solution is a combination of a two-port set with a dependency for determining lumped parameters. The solution in the frequency domain was performed using circuit analysis (Figure 4b). In this case, the problem is to determine the lumped parameters taking into account the influence of the adjacent coils on the equivalent inductances Tx and Rx and mutual inductance Mt.
In an analytical approach, there are mutual inductances between adjacent coils, which influence the inductance in Ax,y that is presented by
L c o i l = L s + m n M x + m , y + n .
Lcoil is an effective self-inductance [H], Mx+m,y+n—mutual inductance between coils [H], Ls—self-inductance of a spiral coil [H], which is described by
L s = μ 0 k 1 d m n 2 2 ln k 2 α + k 3 α + k 4 α 2 .
A mean diameter is presented by
d m = 2 r + 2 r n w d + d i 2 .
A fill factor is described by
α = n w d + w i 2 r n w d + w i .
Coefficients k1, k2, k3, k4 depend on the shape of the coil [44]. Then, Equation (3) can be presented as
L c o i l = L s + M p ,
where Mp is the sum of mutual inductances in the periodic grid, because it reduces the inductance of the coil, it is with a minus. When the load Z = ∞ and there is no capacitor in series with Tx, Mp is calculated as
M p = U t I ¯ t , R c j ω L s ,
where Rc—coil resistance [Ω], It, ∞ = |It, ∞|ejψ—source current [A]. To avoid calculating each Mt,x+m,y+n, Mt is solved by dependence
M t = U ¯ r , I ¯ t , j ω ,
where Ur, ∞ = |Ur, ∞|ejθ—voltage induced in the receiving coil [V]. After self-inductance (Ls) and mutual inductance (Mp) were calculated, the series resonant capacitance was determined (C):
C f = 1 ω 2 L c o i l = 1 ω 2 L s + M p .
For the wire width (wd + wi), the total length is obtained by
l s m = 2 π n r n 1 w d + w i 2 .
Taking into account that the transmitter and receiver coils are identical, the resistances of the inductors are Rt = Rr = Rc. The formulas for Rc for the case without the skin effect, Equation (12), and for the case with the skin effect, Equation (13), are presented by
R c = l s m σ c π w d 2 4 ,
R c _ a c = l s m σ c a w = 2 π n r n 1 w d + w i 2 σ c a w ,
where σc—conductivity of the wire [S/m], aw—the effective cross-section of the wire [m2], Equation (14):
a w = π w d δ e δ e 2 ,
where δe is the effective skin depth [m] [45] which is described by
δ e = δ 1 exp w d 2 δ .
At the same time, δ is the skin depth:
δ = 1 π f σ c μ 0 .

3. Analysis of the Calculated Values Obtained by Two Methods

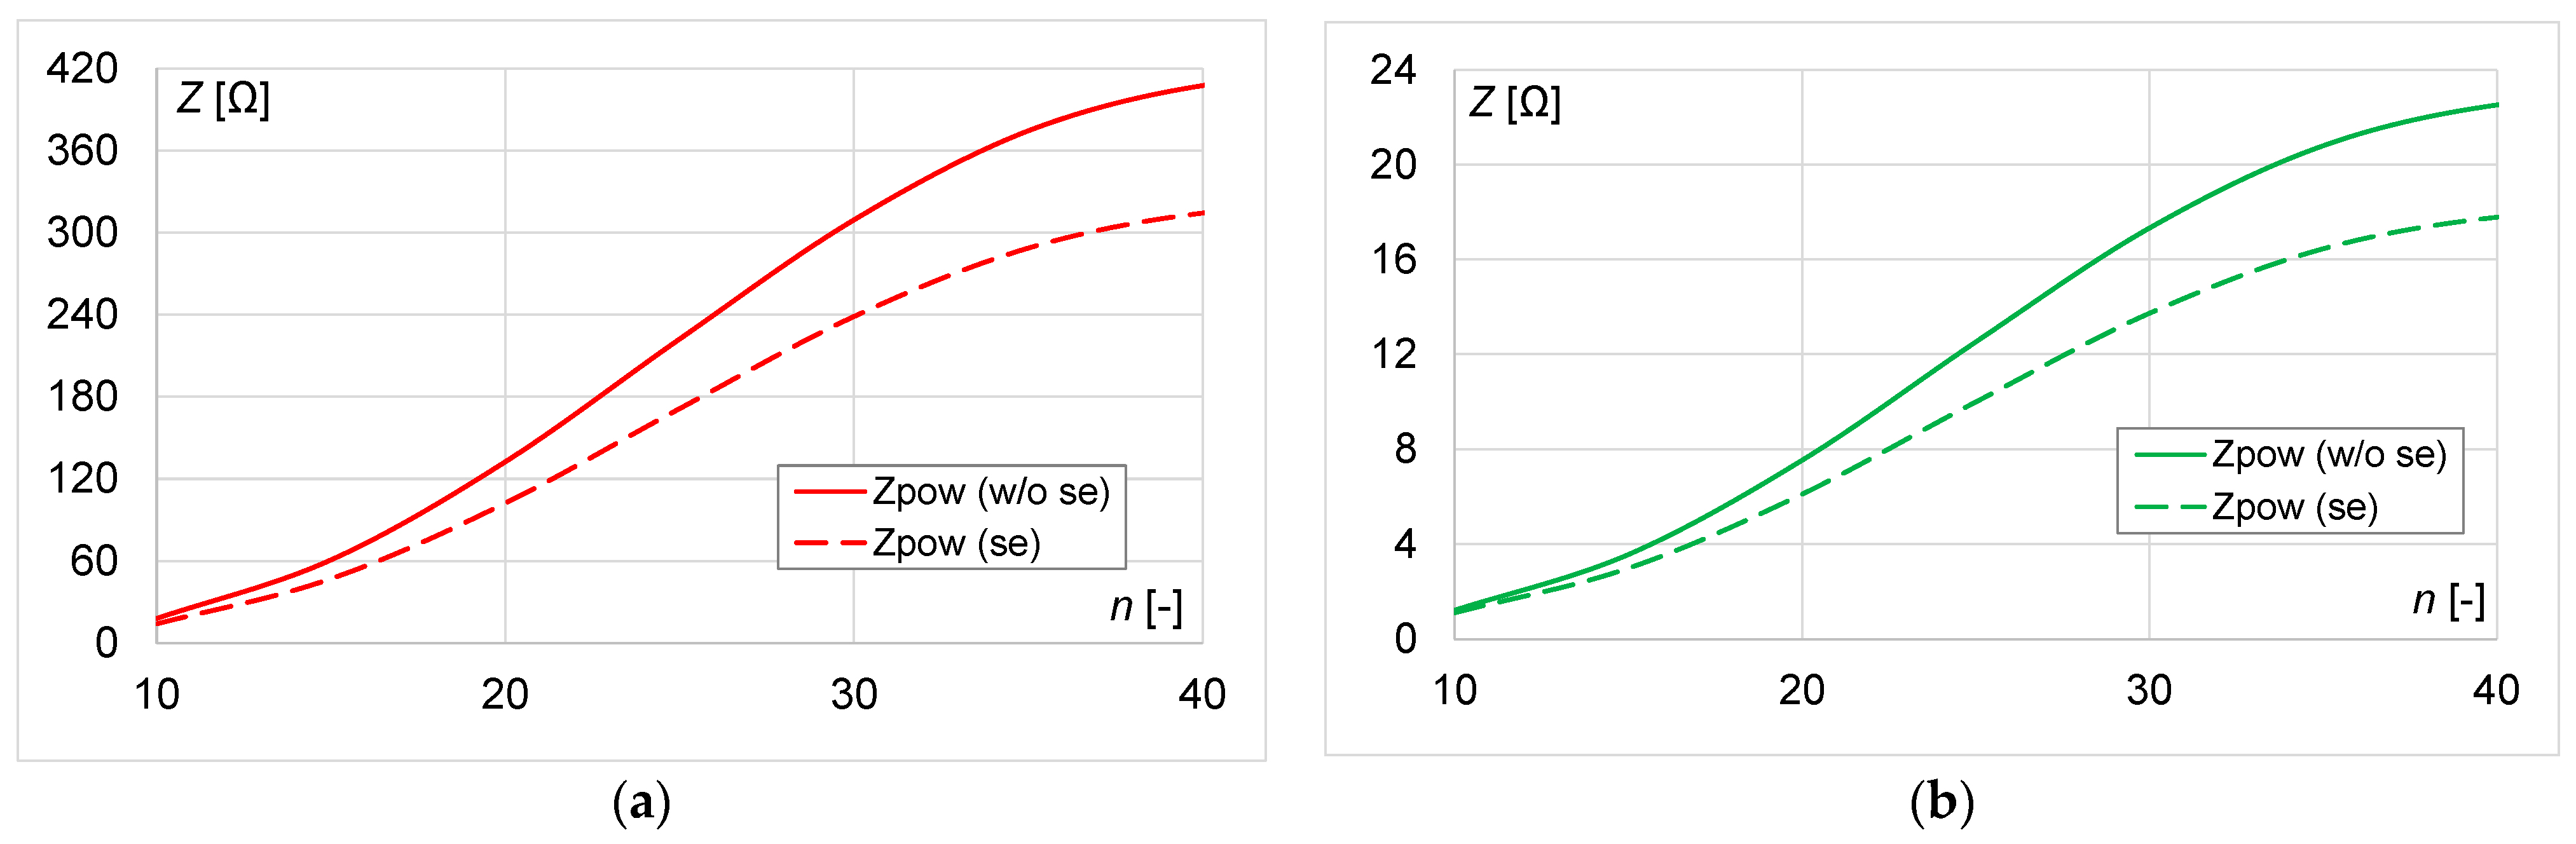
3.1. Analysis Conditions and Calculated Values of Lumped Parameters

Both methods were used in the analysis with the same parameters (Section 2.1). The analyzed WPT system models are presented in Table 1.
The same values were used for analytical calculations as in the numerical simulation, e.g., wd = 200 µm, wi = 5 µm, σc = 5.6 × 10⁷ S/m, and Ut = 1 V. On the basis of the values presented above, the correctness of the adopted assumptions was assessed. For this purpose, a comparison of the active power of the receiver (Pr) and the power of the transmitter (Pt) was conducted:
P r = R o I r 2 ,
P t = U t I t .
The power transfer efficiency was calculated as
η = P r P t 100 % .
The analysis was related with the suitable choice of the impedances by Equations (20)–(23) over an analyzed frequency range:
-for the procedure with maximum efficiency:
Z e f f = R c 2 + ω M t 2 ,
and in the case of the skin effect
Z e f f _ a c = R c _ a c 2 + ω M t 2 .
-for the procedure with maximum load power:
Z p o w = R c + ω 2 M t 2 R c ,
and in the case of the skin effect
Z p o w _ a c = R c _ a c + ω 2 M t 2 R c _ a c .
The lumped parameters of the electrical circuit were determined using Equations (12)–(13), (20)–(23). The values of the WPT system used in the analysis are presented in Table 2, Table 3, Table 4 and Table 5. When n increases, both impedances and the coil resistance increase. The skin effect increases the coil resistance and impedance Zeff. On the other hand, it causes a decrease in the impedance Zpow.

3.2. System Operating with the Maximum Power Transfer Efficiency

In this section, the calculation results of the analyzed WPT system, obtained by analytical and numerical methods, were compared. The parameters of the system (r, n, and h) were taken into account. Transmitter, receiver powers, and efficiency were calculated based on both models.
In the maximum efficiency procedure, the impedances of the receiver Zeff and Zeff_ac were calculated based on Equations (20) and (21). Calculations for different n and h are shown in Figure 5 for a small coil and in Figure 6 for a large coil. The analysis showed that the influence of the skin effect on the impedance values was negligible. Increasing n causes a linear increase in impedance for a coil of r = 0.025 m and a non-linear increase for a coil of r = 0.01 m. Regardless of the coil size, doubling h causes an approximately four-time decrease in the impedance.
In Figure 7, the resistances of coils are presented (r = 0.01 m and r = 0.025 m). Skin effect increases coil resistance by approx. 30% for small and large coils and regardless of the number of turns.
Maximum η values were compared, depending on n and h, for cases with and without skin effect, as seen in Table 6. Increasing the number of turns and/or the radius of the coil increases the efficiency of the system. An increase in h causes a decrease in system efficiency for the same coil size.
Higher η was obtained for the case without the skin effect. The results from numerical and analytical methods were compared. For each case, absolute error was calculated, which did not exceed 0.45%. It proved that the results were consistent.
The greatest influence of the skin effect on the efficiency occurs for a small coil, regardless of the distance h, at 9% (Table 7).
The Pt, Pr power, and η characteristics are shown on the graphs: in Section 3.2.1 for the small coil and in Section 3.2.2 for the large coil. The numerical analysis results are presented as dashed lines for the case with the skin effect and solid lines for the case without the skin effect (marked as FEM in the legend). The results of the analytical analysis are represented by dots (marked as A in the legend).

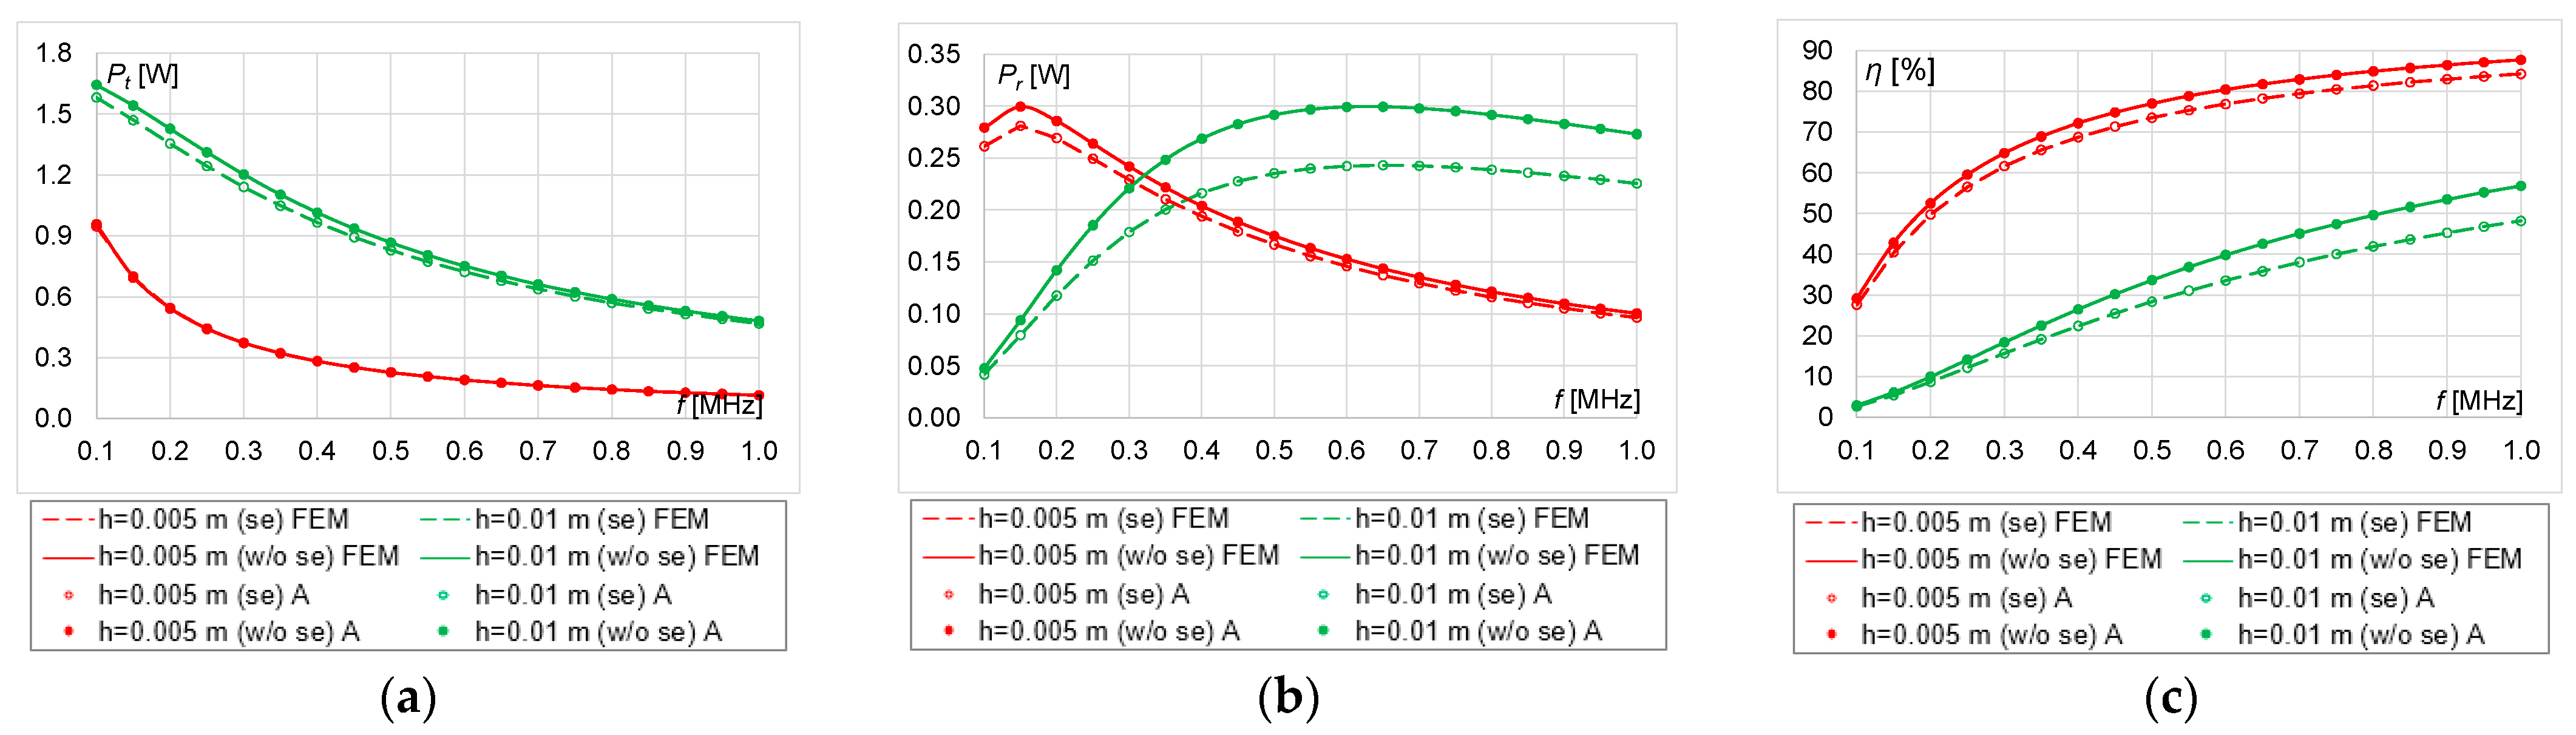
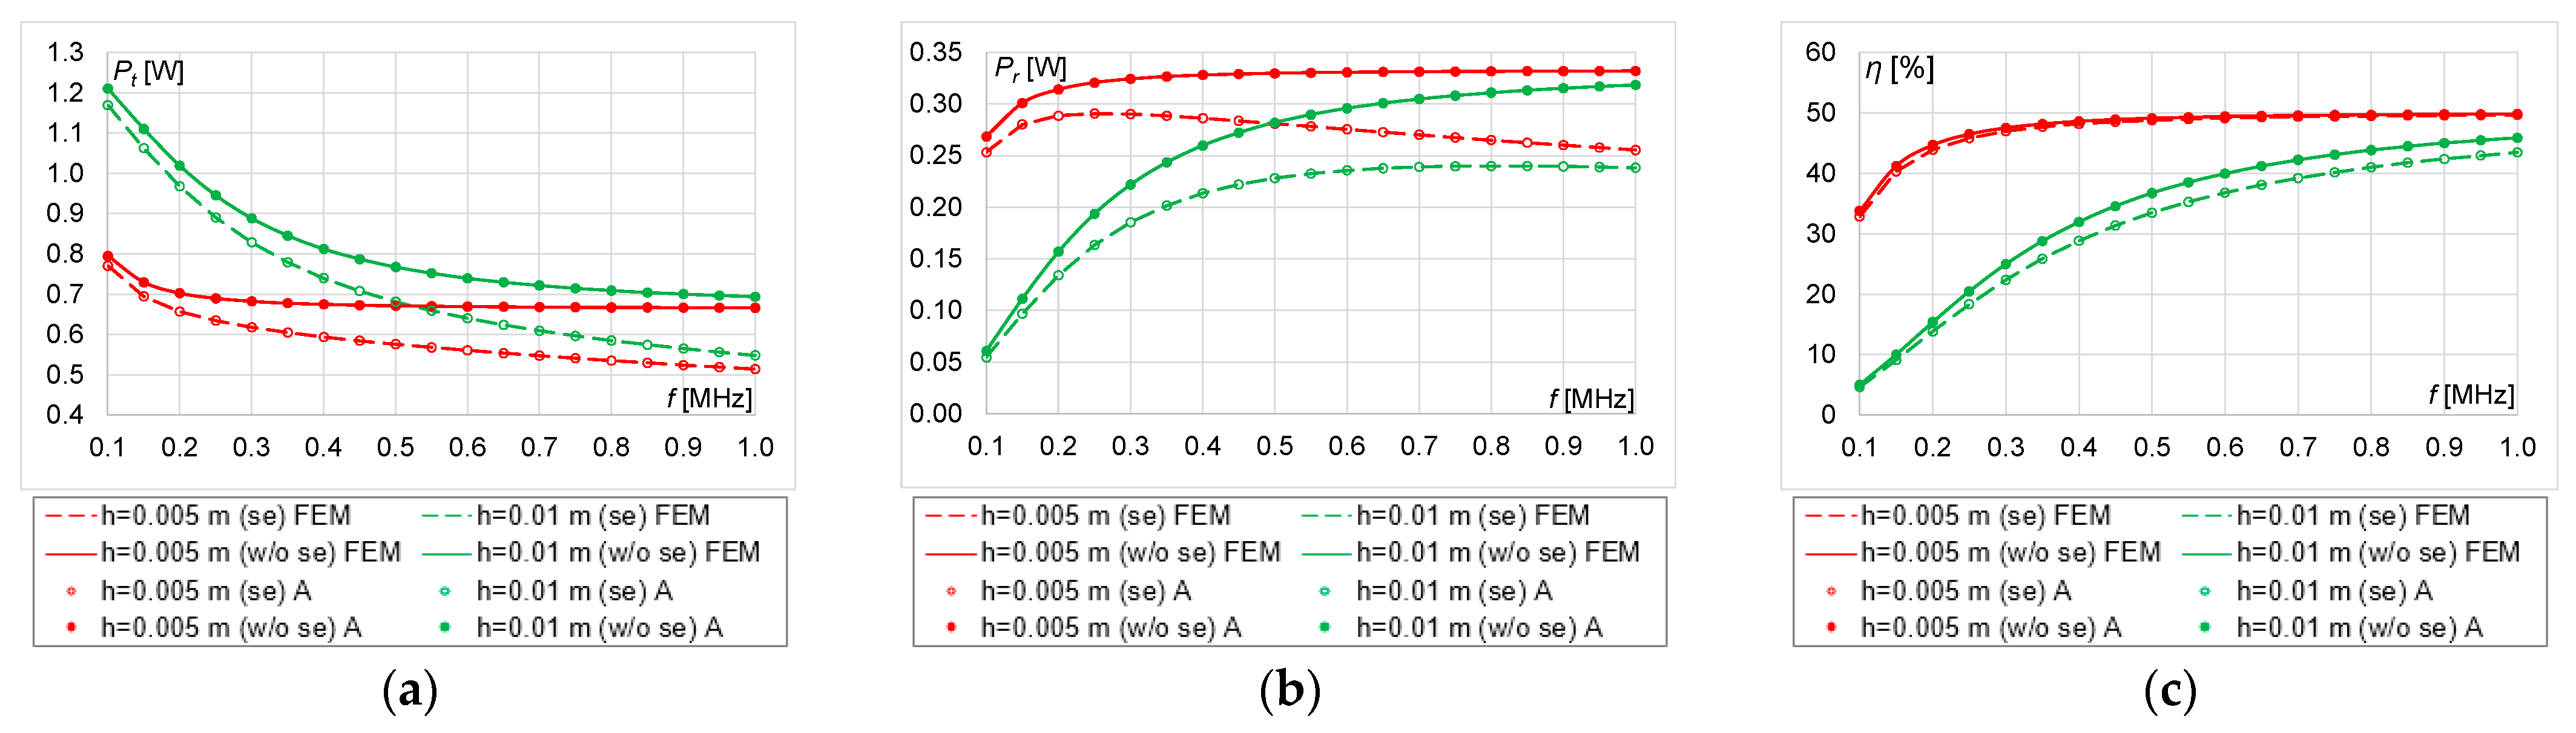
3.2.1. Results for a Small Coil

The graphs: transmitter, receiver power, and efficiency at the distances between the coils h = 0.005 m and h = 0.01 m for cases with and without skin effect are presented in Figure 8, Figure 9, Figure 10 and Figure 11.
The Pt power decreases over the entire frequency range, regardless of n (Figure 8a, Figure 9a, Figure 10a and Figure 11a). This power is the same for the cases with and without skin effect at h = 0.005 m. However, at h = 0.01 m, Pt is higher for the case without skin effect, regardless of n.
Receiver power is always higher for the case without skin effect (Figure 8b, Figure 9b, Figure 10b and Figure 11b). The greatest differences in values occur at h = 0.01 m and equal 150 mW for n = 10 at 1 MHz (Figure 8b). When η reaches approx. 50%, the Pr power reaches its maximum value. Then, the power decreases. The Pr power decreases with increasing n.
As the frequency increases, η increases, too, regardless of h and n (Figure 8c, Figure 9c, Figure 10c and Figure 11c). Doubling the distance h results in a decrease in efficiency by up to 40%. The greatest difference in efficiency η, for the cases with and without skin effect, occurs at h = 0.01 m, n = 20 and reaches 9% at the frequency of 1 MHz (Figure 9c). As n increases, this difference decreases.

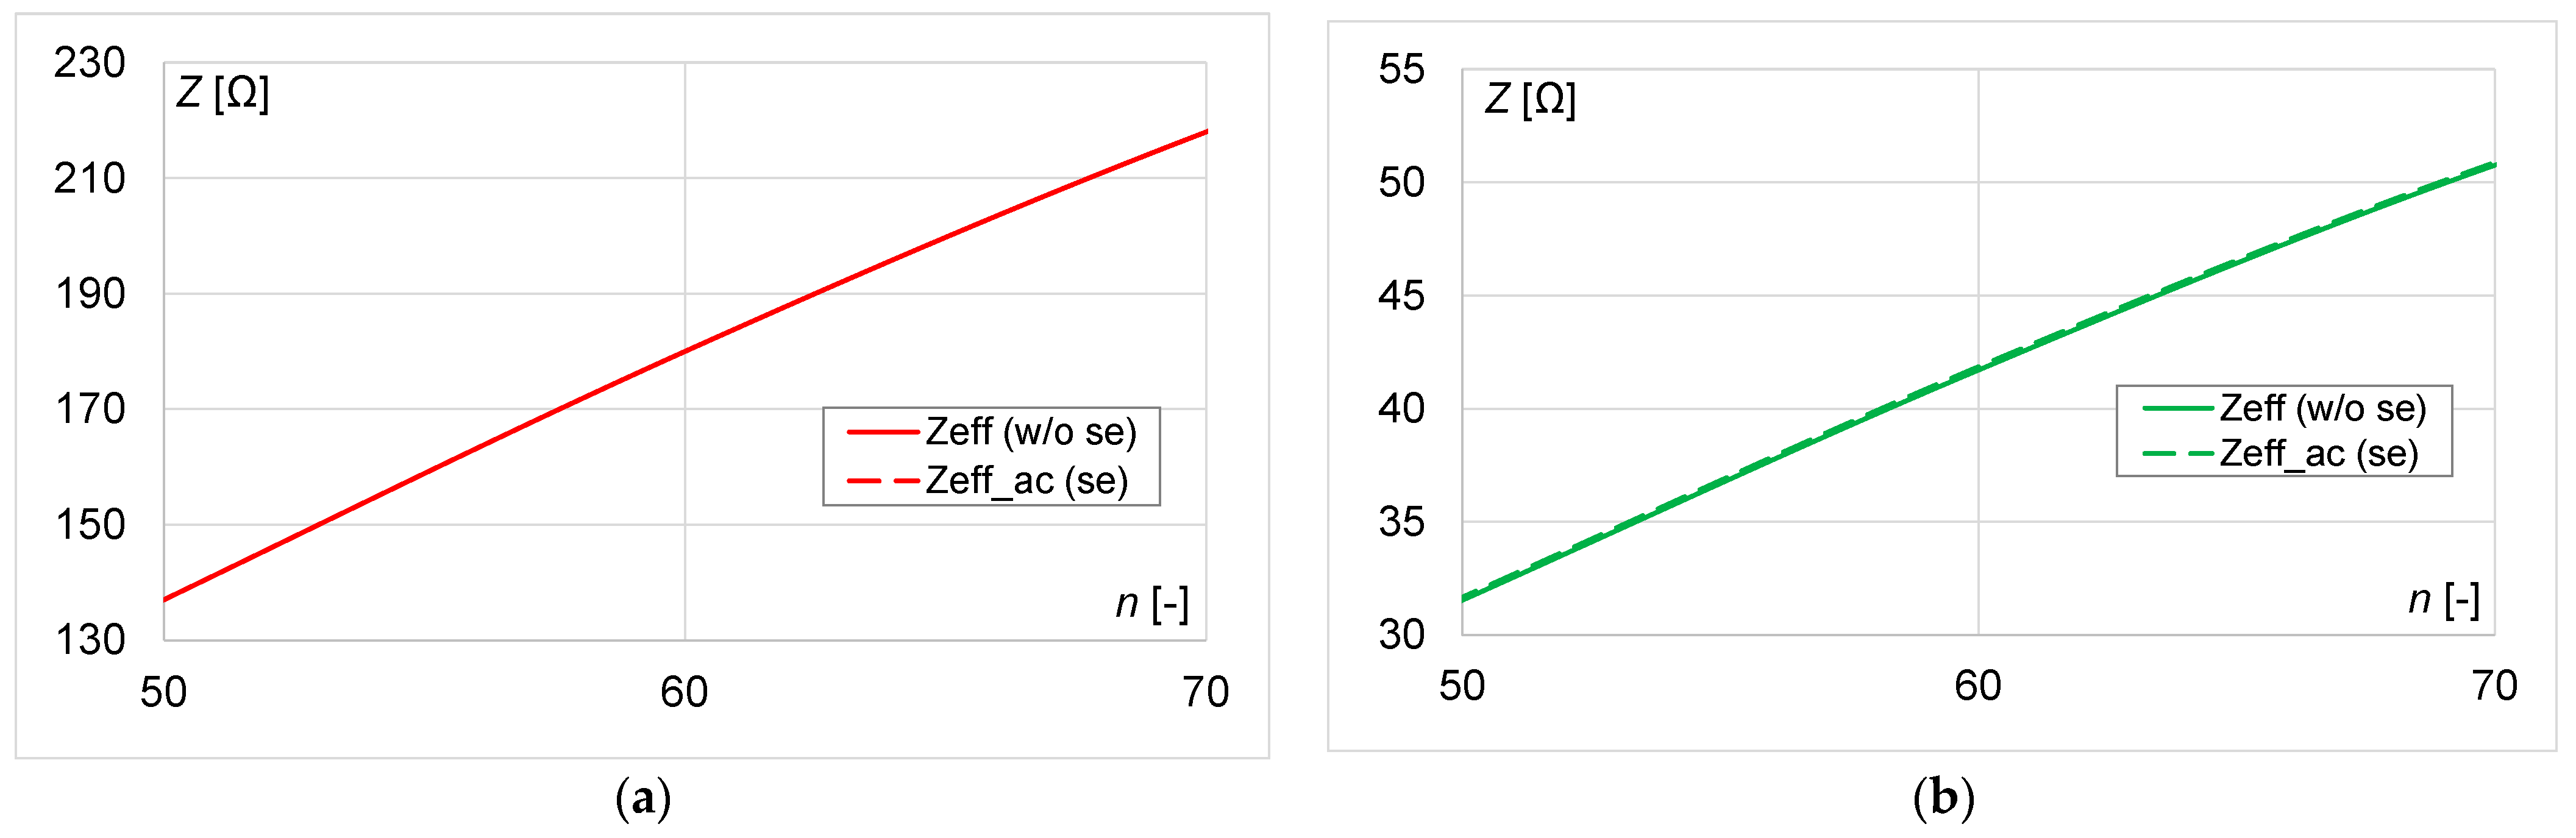
3.2.2. Results for a Large Coil

Figure 12, Figure 13 and Figure 14 present the graphs: Pt, Pr power, and efficiency at h = 0.0125 m and h = 0.025 m, for the cases with and without skin effect.
The Pt power decreases over the entire frequency range, regardless of n and h (Figure 12a, Figure 13a and Figure 14a). The transmitter power is always higher at h = 0.025 m, regardless of n. The greatest difference in values occurs in the lower frequency range. The Pt power is the same for the cases with and without skin effect at all distances.
At the distance h = 0.025 m, it can be observed that with all characteristics, when the efficiency reaches approx. 50%, the Pr power reaches its maximum value (Figure 12b, Figure 13b and Figure 14b). Then, this power decreases when the efficiency exceeds 50%. The Pr power is higher at h = 0.025 m over the entire frequency range. As n increases, the Pr power decreases. The shape of the Pr characteristics for the cases with and without skin effect is very similar. The receiver power is always higher for the case without skin effect. Regardless of the distance h, this difference decreases with the increase in n over the entire range of the analyzed frequencies.
As the frequency increases, η increases, too, regardless of h and n (Figure 12c, Figure 13c and Figure 14c). Doubling the distance h resulted in a decrease in η by up to 50% at lower frequencies. The greatest difference in η for the cases with and without skin effect occurs at h = 0.025 m and reaches 4–5%. At h = 0.0125 m, the difference is negligible, at 1%, regardless of n. The shape of the efficiency characteristics for all cases is very similar.

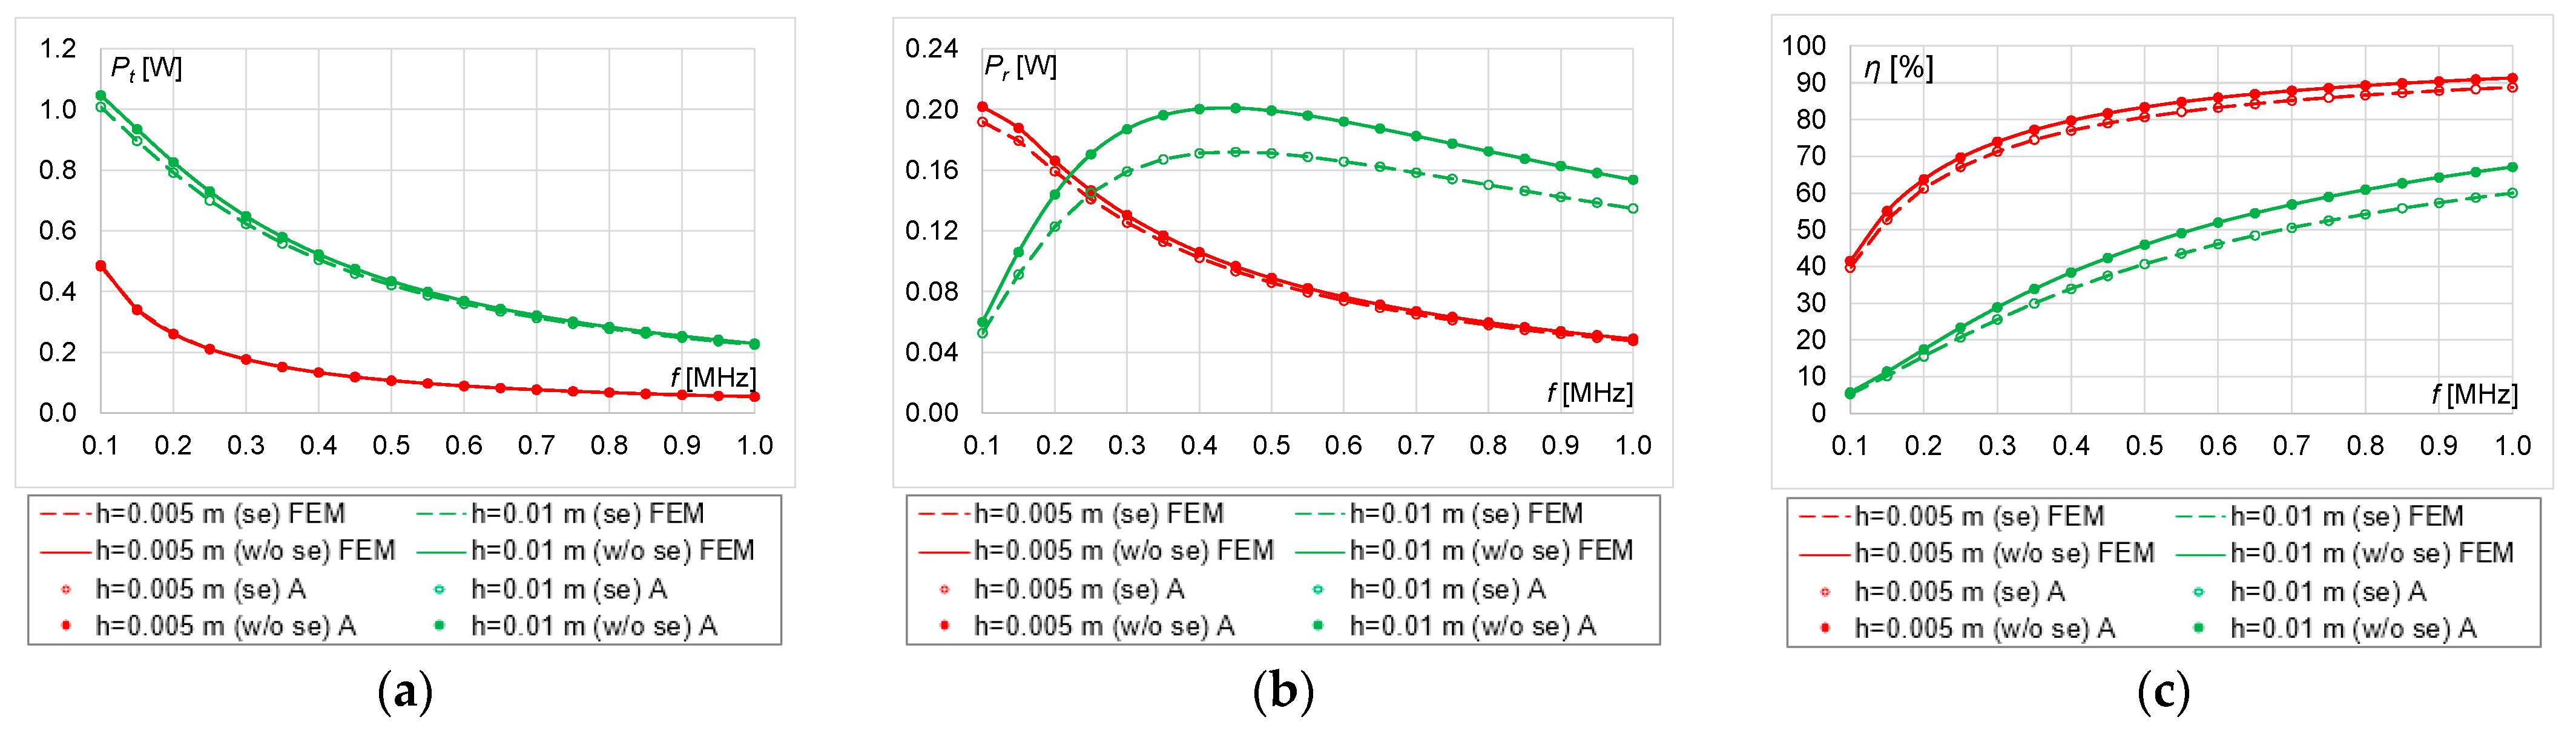
3.3. System Operating with the Maximum Load Power

In the maximum load power procedure, the values of the load impedances Zpow and Zpow_ac were calculated, taking into account n, the distance h between the coils Tx and Rx, for the small coil (Figure 15) and the large coil (Figure 16).
Doubling h results in over than eighteen-time decrease in the impedance for the small coil and over than seventeen-time decrease for the large coil. The influence of the skin effect on the impedance values was the highest for n = 40 for the small coil and for n = 70 for the large coil; it was above 20% in both cases.
Maximum load power values, depending on n and h, were compared for cases with and without skin effect, as seen in Table 8.
Higher load power values were obtained for the case without skin effect. The greatest influence of the skin effect on Pr power was observed for the small coil at h = 0.01 m and n = 10, but for the large coil it was observed for n = 50 (Table 9).
The results obtained by circuit and numerical methods were compared. For each case, the absolute error was calculated, which did not exceed 2.4 mW. It proved that the results were consistent.
The Pt, Pr power, and η characteristics are shown on the graphs: in Section 3.3.1 (r = 0.01 m) (Figure 17, Figure 18, Figure 19 and Figure 20) for the small coil and in Section 3.3.2 (r = 0.025 m) (Figure 21, Figure 22 and Figure 23) for the large coil. The numerical analysis results are presented as dashed lines for the case with the skin effect and solid lines for the case without the skin effect (marked as FEM in the legend). The results of the analytical analysis are represented by dots (marked as A in the legend).

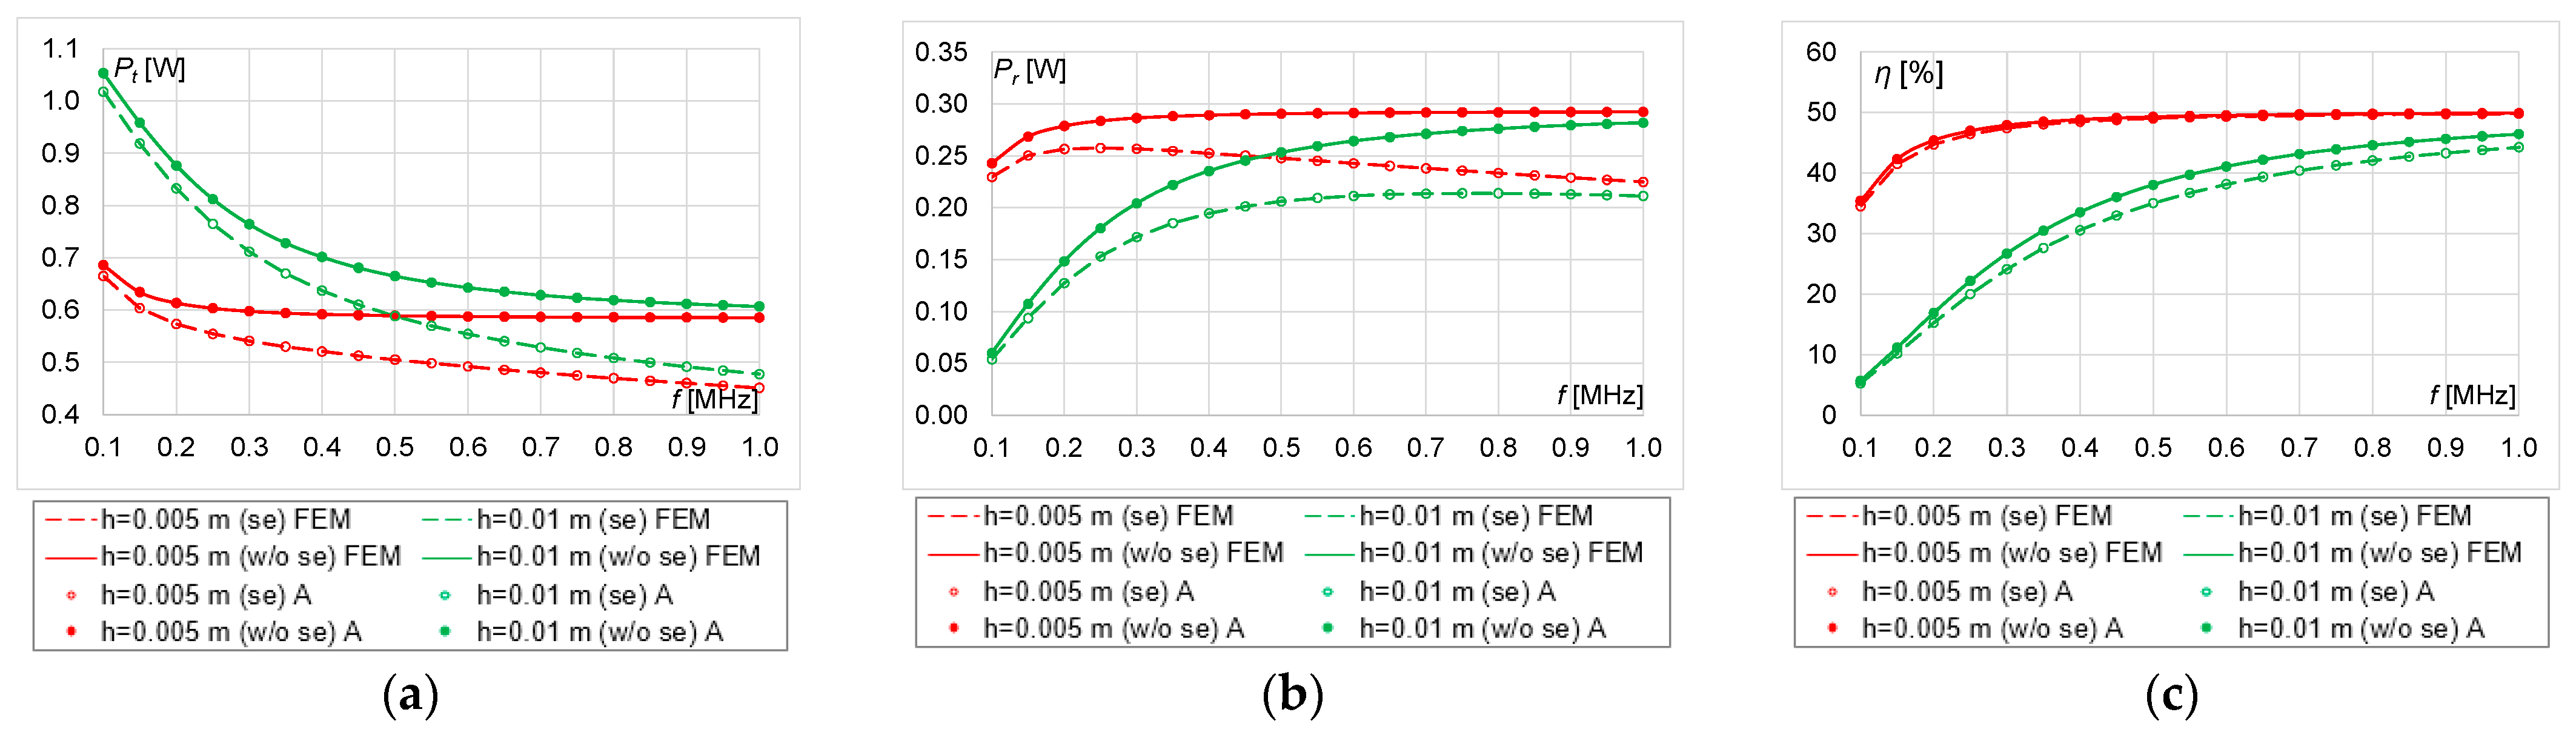
3.3.1. Results for a Small Coil

The transmitter, receiver power, and efficiency graphs at the distances h = 0.005 m and h = 0.01 m for the cases with and without skin effect are presented in Figure 17, Figure 18, Figure 19 and Figure 20.
Figure 17. Results for n = 10 for the cases with and without skin effect: (a) Pt, (b) Pr, (c) η.
Energies 16 02009 g017
Figure 18. Results for n = 20 for the cases with and without skin effect: (a) Pt, (b) Pr, (c) η.
Energies 16 02009 g018
Figure 19. Results for n = 30 for the cases with and without skin effect: (a) Pt, (b) Pr, (c) η.
Energies 16 02009 g019
Figure 20. Results for n = 40 for the cases with and without skin effect: (a) Pt, (b) Pr, (c) η.
Energies 16 02009 g020
Regardless of n, the Pt power decreases over the entire frequency range (Figure 17a, Figure 18a, Figure 19a and Figure 20a). As f and n increases, the influence of the skin effect on the transmitter power increases. The Pr power values stabilize after reaching the maximum value (Figure 17b, Figure 18b, Figure 19b and Figure 20b). However, at h = 0.01 m, the Pr power increases over the entire frequency range. The skin effect reduces the Pr power as the frequency increases. The higher the frequency, the greater the influence of the skin effect on the Pr power values. Regardless of n and h, the Pr power is always higher for the case without skin effect. The differences in values for the cases with and without the skin effect are approximately 23%, regardless of n, at h = 0.005 m and at f = 1 MHz.
In this operation procedure, η tends to a maximum of 50% then maximum power is supplied to the load (Figure 17c, Figure 18c, Figure 19c and Figure 20c). At h = 0.01 m, η increases over the entire analyzed frequency range, regardless of n. As n increases, the influence of the skin effect on the efficiency of the system decreases (Figure 19c and Figure 20c). The greatest influence of the skin effect can be observed at h = 0.005 m and n = 10, 20 (Figure 17c and Figure 18c).

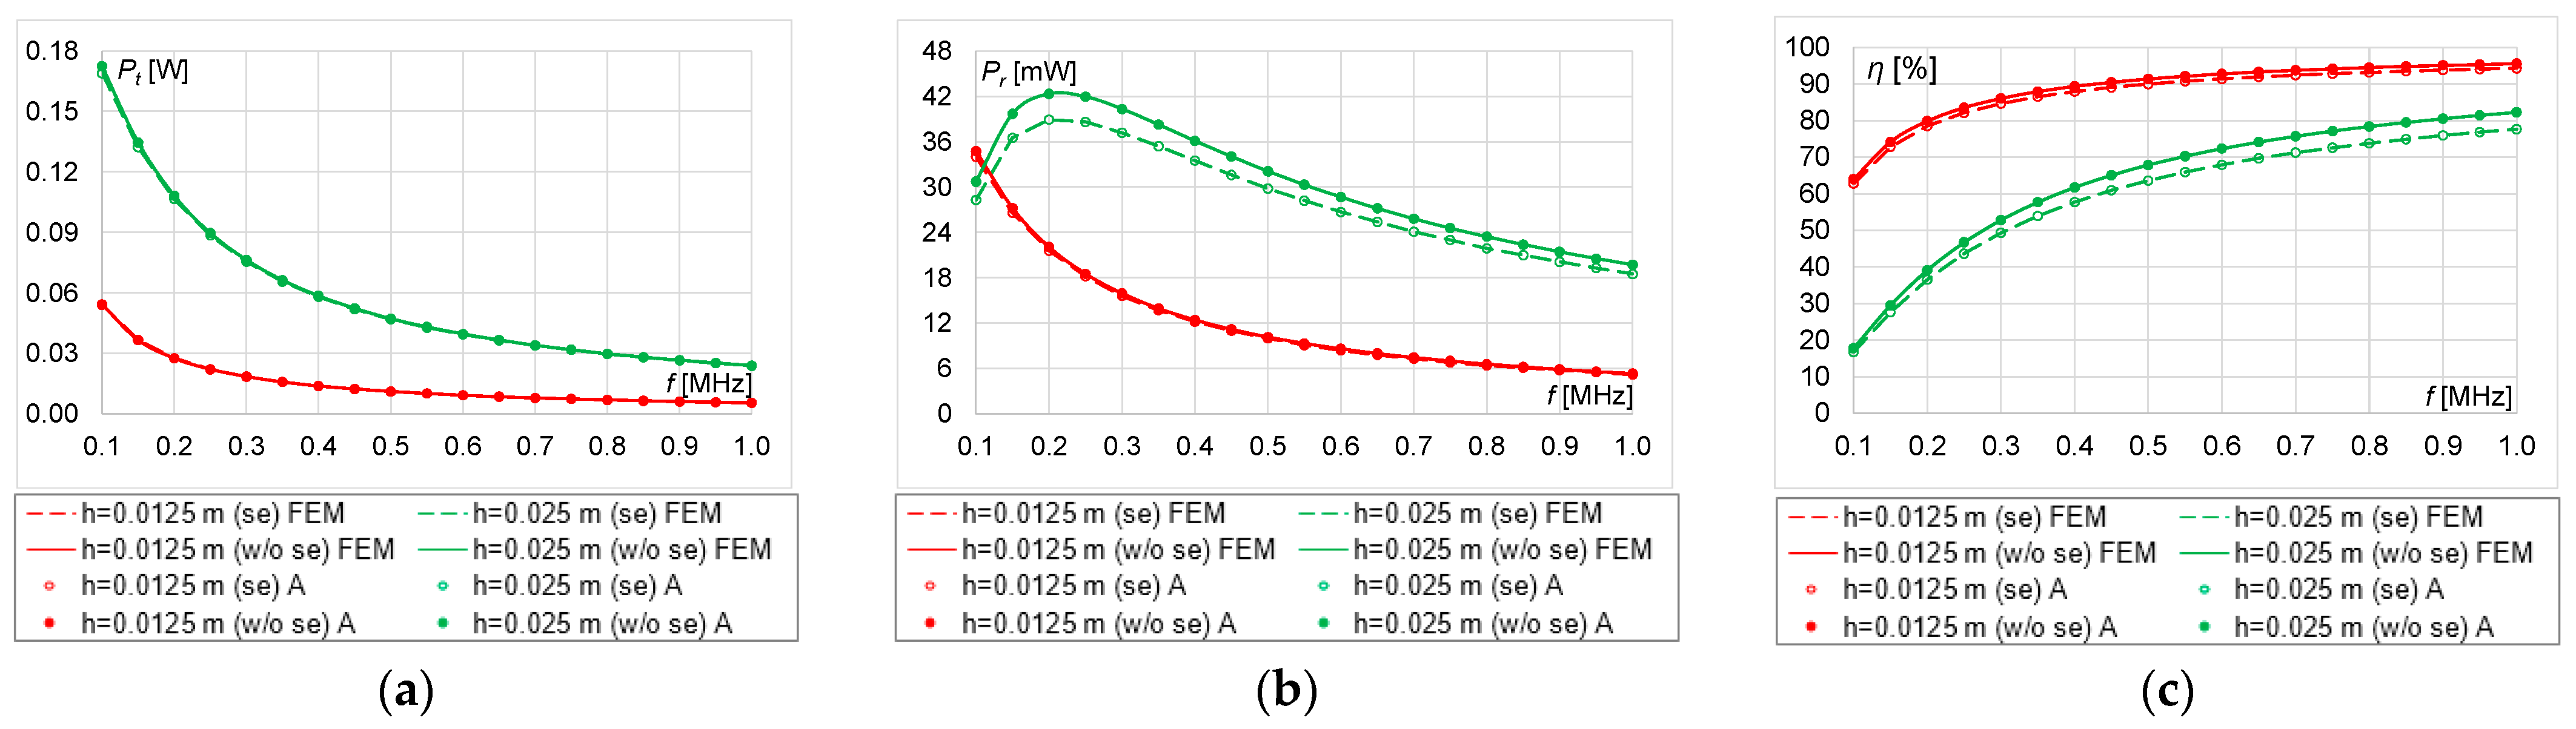
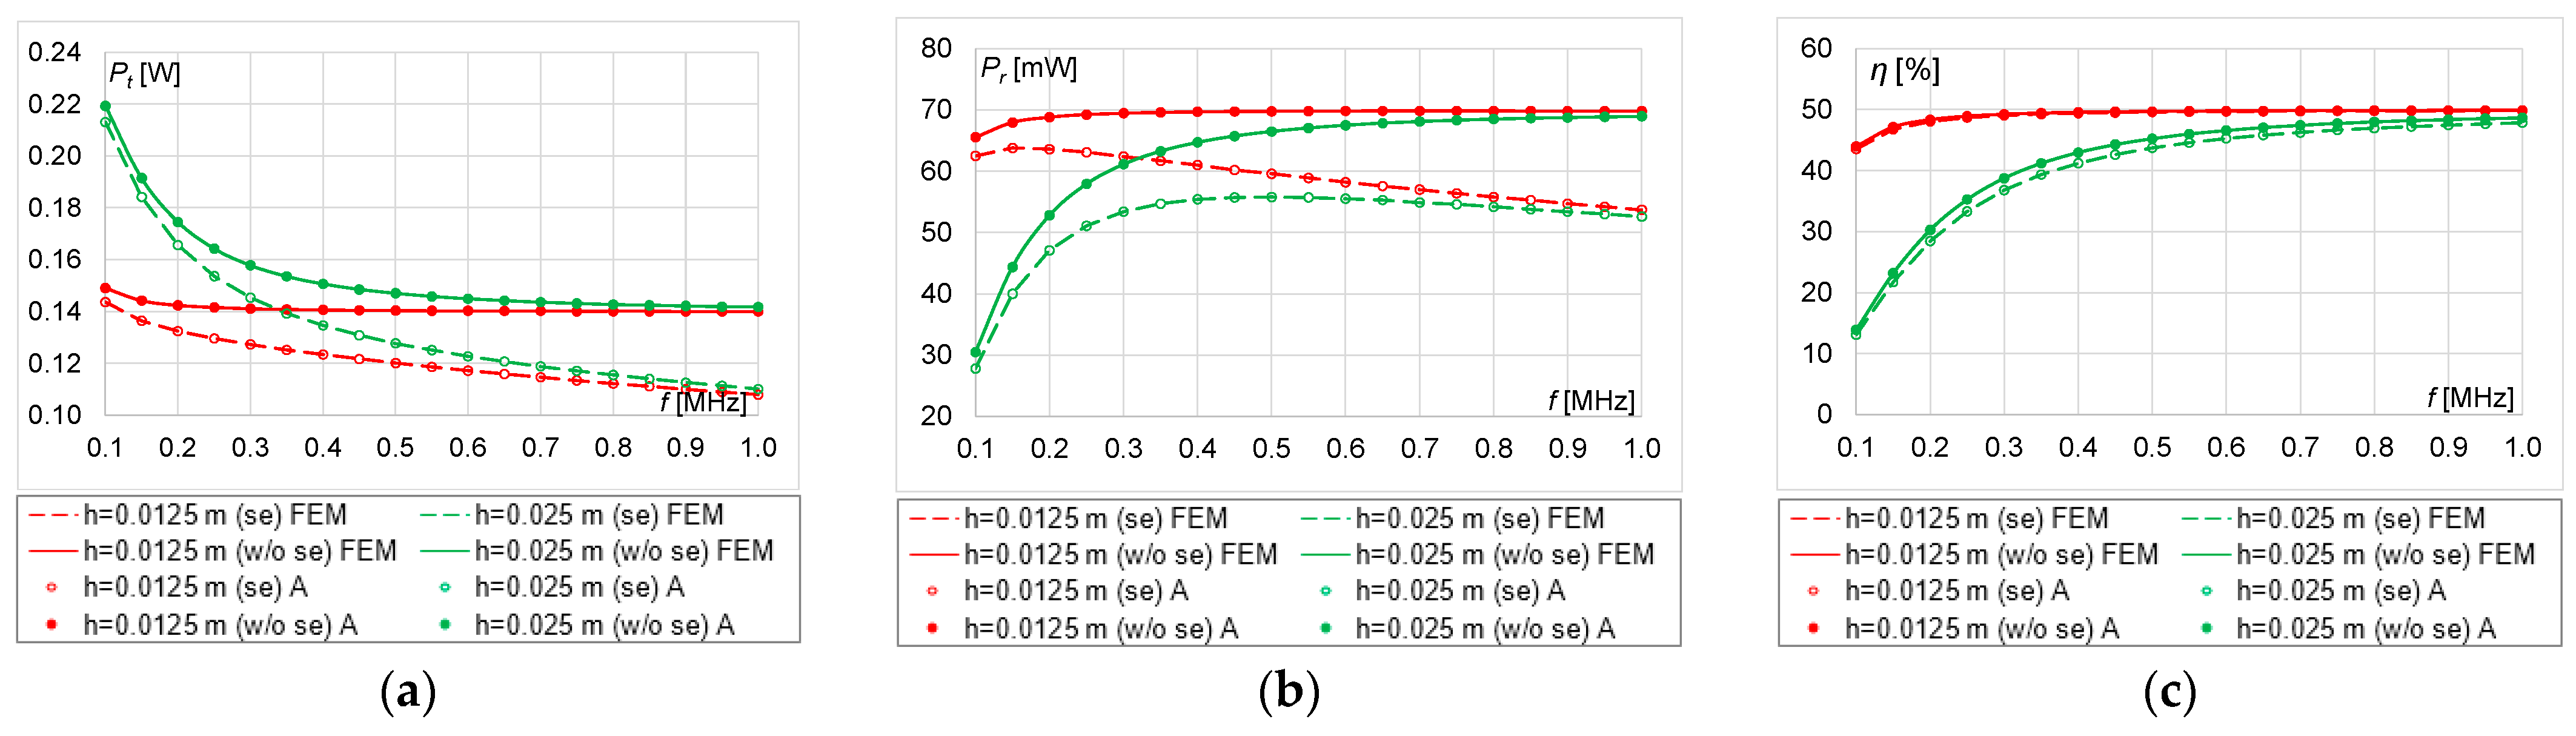
3.3.2. Results for a Large Coil

The following characteristics are shown in Figure 21, Figure 22 and Figure 23: Pt and Pr powers, and η at distances 0.0125 m and 0.025 m for cases with and without skin effect.
Figure 21. Results for n = 50 for the cases with and without skin effect: (a) Pt, (b) Pr, (c) η.
Energies 16 02009 g021
Figure 22. Results for n = 60 for the cases with and without skin effect: (a) Pt, (b) Pr, (c) η.
Energies 16 02009 g022
Figure 23. Results for n = 70 for the cases with and without skin effect: (a) Pt, (b) Pr, (c) η.
Energies 16 02009 g023
Regardless of n, the Pt power decreases over the entire frequency range (Figure 21a, Figure 22a and Figure 23a). As n increases, the transmitter power decreases. The influence of the skin effect on the Pt power is greater with increasing f and n, and at the frequency of 1 MHz, it is comparable, regardless of the distance between the coils.
The Pr power stabilizes after reaching the maximum value (Figure 21b, Figure 22b and Figure 23b). As n increases, the Pr power decreases. As the frequency increases, the skin effect reduces the receiver power. The higher the frequency, the greater the influence of the skin effect on the values of Pr power. Regardless of n and h, the Pr power is always higher for the case without skin effect.
In this operation procedure, η tends to a maximum of 50%, and then the maximum power is delivered to the load (Figure 21c, Figure 22c and Figure 23c). The influence of the skin effect on η of the WPT system at h = 0.0125 m is negligible. However, at h = 0.025 m, the influence of the skin effect on η is the greatest over the frequency range of 0.2 MHz to 0.5 MHz.

3.4. Distribution of Magnetic Flux Density

Example distribution of magnetic flux density (B) is presented in xz cut plane of the model along with normalized vectors, showing the direction of B (Figure 24). The Tx coil is located at z = 0 while Rx is at z = 0.005 m.

4. Conclusions

Alternating current generates lower losses, making it much better suited to transmit power over long distances. For the same reason, wireless technologies are unlikely to completely replace wired solutions. The idea of wireless energy transmission has been discussed for many years, but recently there have been more and more experiments confirming the practical possibility of using such a solution. If all efforts lead to progress, we expect WPT technology to spread on a larger scale and have a huge impact on everyday life.
In this article a WPT system was presented, in which the maximum efficiency and maximum load power operating procedures have been solved. In the article, the analytical and numerical approaches were shown. Both proposed methods of analysis were suitable for evaluating the properties of the WPT system and allowed for a quick estimation of power and efficiency. Since thin wires are used in planar coils, the influence of the skin effect on system efficiency is an important part of the analysis. The article presents an analysis of this problem on the example of many variants that differ in the geometry of the system. This analysis was focused on the maximum efficiency and power of the load.
With a detailed and multi-variant analysis, it can be concluded that the skin effect is acceptable. At 1 MHz, the efficiency losses for the small coil are max. up to 5%, and for the large coil, they are up to 9% (Table 7). The greatest decrease in efficiency occurs for a larger distance between the coils, i.e., h = r. With increasing distance, the efficiency decreases, and the skin effect further reduces the efficiency value. With a higher number of turns, the skin effect has less effect on the WPT system.
Analysis of the results of the maximum power of the receiver showed that the skin effect is comparable for both coils (r = 0.01 m, r = 0.025 m) at a smaller distance (h = r/2). However, with greater distance between the coils, the power values decrease as the number of turns increases.
The influence of the skin effect on the maximum efficiency and power of the receiver was analysed. Based on the results, the greatest influence of the skin effect occurred at 1 MHz:
(a)
in the maximum efficiency procedure:
(1)
for the small coil (r = 0.01 m):
  • n = 10: 6% (h = 0.005 m), 8% (h = 0.01 m);
  • n = 20: 3% (h = 0.005 m), 9% (h = 0.01 m);
  • n = 30: 3% (h = 0.005 m), 7% (h = 0.01 m);
  • n = 40: 3% (h = 0.005 m), 7% (h = 0.01 m);
(2)
for the large coil (r = 0.025 m):
  • n = 50: 1% (h = 0.0125 m), 5% (h = 0.025 m);
  • n = 60: 1% (h = 0.0125 m), 5% (h = 0.025 m);
  • n = 70: 1% (h = 0.0125 m), 4% (h = 0.025 m);
(b)
in the maximum load power procedure:
(3)
for the small coil (r = 0.01 m):
  • n = 10: 178 mW (h = 0.005 m), 195 mW (h = 0.01 m);
  • n = 20: 100 mW (h = 0.005 m), 107 mW (h = 0.01 m);
  • n = 30: 77 mW (h = 0.005 m), 80 mW (h = 0.01 m);
  • n = 40: 67 mW (h = 0.005 m), 71 mW (h = 0.01 m);
(4)
for the large coil (r = 0.025 m):
  • n = 50: 16 mW (h = 0.0125 m), 16 mW (h = 0.025 m);
  • n = 60: 15 mW (h = 0.0125 m), 14 mW (h = 0.025 m);
  • n = 70: 13 mW (h = 0.0125 m), 13 mW (h = 0.025 m).
It is well known that coil resistance increases with increasing frequency due to the skin effect. Choosing the wire diameter smaller than the skin depth could minimize the skin effect losses. However, this causes an increase in the resistance of the coil and heating of the wire from which the coil is wound. As a result, the efficiency and power of the receiver in the WPT system also decrease. The author plans to consider this case in detail in the next article to assess whether it is better to accept skin effect losses or reduce the wire diameter to eliminate them.

Funding

The printing of the article was financed from the ZIREG project—Integrated Program of the Bialystok University of Technology for Regional Development, contract no. POWR.03.05.00-00-ZR22/18. Project co-financed by the European Union from the European Social Fund under the Knowledge Education Development Operational Program 2014–2020.

Data Availability Statement

Not applicable.

Conflicts of Interest

The author declares no conflict of interest.

References

  1. Sun, L.; Ma, D.; Tang, H. A review of recent trends in wireless power transfer technology and its applications in electric vehicle wireless charging. Renew. Sustain. Energy Rev. 2018, 91, 490–503. [Google Scholar] [CrossRef]
  2. Alberto, J.; Reggiani, U.; Sandrolini, L.; Albuquerque, H. Fast calculation and analysis of the equivalent impedance of a wireless power transfer system using an array of magnetically coupled resonators. PIER B 2018, 80, 101–112. [Google Scholar] [CrossRef] [Green Version]
  3. Batra, T.; Schaltz, E.; Ahn, S. Effect of ferrite addition above the base ferrite on the coupling factor of wireless power transfer for vehicle applications. J. Appl. Phys. 2015, 117, 17D517. [Google Scholar] [CrossRef]
  4. Yang, Y.; El Baghdadi, M.; Lan, Y.; Benomar, Y.; Van Mierlo, J.; Hegazy, O. Design Methodology, Modeling, and Comparative Study of Wireless Power Transfer Systems for Electric Vehicles. Energies 2018, 11, 1716. [Google Scholar] [CrossRef] [Green Version]
  5. Inoue, K.; Kusaka, K.; Itoh, J.I. Reduction in radiation noise level for inductive power transfer systems using spread spectrum techniques. IEEE Trans. Power Electron. 2018, 33, 3076–3085. [Google Scholar] [CrossRef]
  6. Kan, T.; Mai, R.; Mercier, P.P.; Mi, C.C. Design and analysis of a three-phase wireless charging system for lightweight autonomous underwater vehicles. IEEE Trans. Power Electron. 2017, 3, 6622–6632. [Google Scholar] [CrossRef]
  7. Tang, S.C.; Lun, T.L.T.; Guo, Z.; Kwok, K.W.; McDannold, N.J. Intermediate range wireless power transfer with segmented coil transmitters for implantable heart pumps. IEEE Trans. Power Electron. 2017, 32, 3844–3857. [Google Scholar] [CrossRef]
  8. Li, X.; Zhang, H.; Peng, F.; Li, Y.; Yang, T.; Wang, B.; Fang, D. A wireless magnetic resonance energy transfer system for micro implantable medical sensors. Sensors 2012, 12, 10292–10308. [Google Scholar] [CrossRef]
  9. Fitzpatrick, D.C. Implantable Electronic Medical Devices; Academic Press: San Diego, CA, USA, 2014; pp. 7–35. [Google Scholar]
  10. Kang, S.H.; Choi, J.H.; Jung, C.W. Magnetic resonance wireless power transfer using three-coil system with single planar receiver for laptop applications. IEEE Trans. Consum. Electron. 2015, 61, 160–166. [Google Scholar]
  11. Barman, S.D.; Reza, A.W.; Kumar, N.N.; Karim, M.E.; Munir, A.B. Wireless powering by magnetic resonant coupling: Recent trends in wireless power transfer system and its applications. Renew. Sust. Energ. Rev. 2015, 51, 1525–1552. [Google Scholar] [CrossRef]
  12. Sugino, M.; Kondo, H.; Takeda, S. Linear motion type transfer robot using the wireless power transfer system. In Proceedings of the 2016 International Symposium on Antennas and Propagation (ISAP), Okinawa, Japan, 24–28 October 2016; pp. 508–509. [Google Scholar]
  13. Wu, Q.; Tao, M.; Kwan Ng, D.W.; Chen, W.; Schober, R. Energy-efficient resource allocation for wireless powered communication networks. IEEE Trans. Wirel. Commun. 2016, 15, 2312–2327. [Google Scholar] [CrossRef] [Green Version]
  14. Choroszucho, A.; Butryło, B. Local attenuation of electromagnetic field generated by wireless communication system inside the building. Przegląd Elektrotechniczny 2011, 87, 123–127. [Google Scholar]
  15. Vamvakas, P.; Tsiropoulou, E.E.; Vomvas, M.; Papavassiliou, S. Adaptive power management in wireless powered communication networks: A user-centric approach. In Proceedings of the IEEE 38th Sarnoff Symposium, Newark, NJ, USA, 18–20 September 2017; pp. 1–6. [Google Scholar]
  16. Khang, S.T.; Lee, D.J.; Hwang, I.J.; Yeo, T.D.; Yu, J.W. Microwave power transfer with optimal number of rectenna arrays for midrange applications. IEEE Antennas Wirel. Propag. Lett. 2018, 17, 155–159. [Google Scholar] [CrossRef]
  17. De Santi, C.; Meneghini, M.; Caria, A.; Dogmus, E.; Zegaoui, M.; Medjdoub, F.; Kalinic, B.; Cesca, T.; Zanoni, E. GaN-based laser wireless power transfer system. Materials 2018, 11, 153. [Google Scholar] [CrossRef] [Green Version]
  18. Li, Q.; Deng, Z.; Zhang, K.; Wang, B. Precise attitude control of multirotary-joint solar-power satellite. J. Guid. Control Dyn. 2018, 41, 1435–1442. [Google Scholar] [CrossRef]
  19. Micus, S.; Padani, L.; Haupt, M.; Gresser, G.T. Textile-Based Coils for Inductive Wireless Power Transmission. Appl. Sci. 2021, 11, 4309. [Google Scholar] [CrossRef]
  20. Luo, Z.; Wei, X. Analysis of square and circular planar spiral coils in wireless power transfer system for electric vehicles. IEEE Trans. Ind. Electron. 2018, 65, 331–341. [Google Scholar] [CrossRef]
  21. Chen, L.; Liu, S.; Zhou, Y.C.; Cui, T.J. An optimizable circuit structure for high-efficiency wireless power transfer. IEEE Trans. Ind. Electron. 2013, 60, 339–349. [Google Scholar] [CrossRef]
  22. Sołjan, Z.; Hołdyński, G.; Zajkowski, M. CPC-Based Minimizing of Balancing Compensators in Four-Wire Nonsinusoidal Asymmetrical Systems. Energies 2021, 14, 1815. [Google Scholar] [CrossRef]
  23. Raven, M.S. Skin effect in the time and frequency domain—Comparison of power series and Bessel function solutions. J. Phys. Commun. 2018, 3, 035028. [Google Scholar] [CrossRef]
  24. Abou Houran, M.; Yang, X.; Chen, W. Free Angular-Positioning Wireless Power Transfer Using a Spherical Joint. Energies 2018, 11, 3488. [Google Scholar] [CrossRef] [Green Version]
  25. Lee, S.-H.; Lorenz, R.D. Development and validation of model for 95%-efficiency 220-w wireless power transfer over a 30-cm air gap. IEEE Trans. Ind. Appl. 2011, 47, 2495–2504. [Google Scholar] [CrossRef]
  26. Raven, M.S. Experimental measurements of the skin effect and internal inductance at low frequencies. Acta Tech. 2016, 60, 51–69. [Google Scholar]
  27. Steckiewicz, A. Efficient Transfer of the Medium Frequency Magnetic Field Using Anisotropic Metamaterials. Energies 2023, 16, 334. [Google Scholar] [CrossRef]
  28. Xun, J.-H.; Mu, Y.; Zhang, K.; Liu, H.; Li, L. The Efficiency Improvement of Multiple Receivers in Wireless Power Transmission by Integrating Metasurfaces. Materials 2022, 15, 6943. [Google Scholar] [CrossRef]
  29. Villa, J.L.; Sallan, J.; Sanz Osorio, J.F.; Llombart, A. High-misalignment tolerant compensation topology for icpt systems. IEEE Trans. Ind. Electron. 2012, 59, 945–951. [Google Scholar] [CrossRef]
  30. Zhong, W.; Lee, C.K.; Hui, S.Y.R. General analysis on the use of Tesla’s resonators in domino forms for wireless power transfer. IEEE Trans. Ind. Electron. 2013, 60, 261–270. [Google Scholar] [CrossRef] [Green Version]
  31. Nguyen, B.X.; Vilathgamuwa, D.M.; Foo, G.; Ong, A.; Sampath, P.K.; Madawala, U.K. Cascaded multilevel converter based bidirectional inductive power transfer (BIPT) system. In Proceedings of the 2014 International Power Electronics Conference (IPEC-Hiroshima 2014—ECCE ASIA), Hiroshima, Japan, 18–21 May 2014; pp. 2722–2728. [Google Scholar]
  32. Hao, H.; Covic, G.A.; Boys, J.T. A parallel topology for inductive power transfer power supplies. IEEE Trans. Power Electron. 2014, 29, 1140–1151. [Google Scholar] [CrossRef]
  33. Mai, R.; Lu, L.; Li, Y.; Lin, T.; He, Z. Circulating Current Reduction Strategy for Parallel-Connected Inverters Based IPT Systems. Energies 2017, 10, 261. [Google Scholar] [CrossRef] [Green Version]
  34. He, H.; Liu, Y.; Wei, B.; Wu, X.; Jiang, C.; Jiang, B.; Wei, C. Phase synchronization and current sharing strategy for multiple overlapped transmitters IPT system. Energy Rep. 2022, 8, 1103–1111. [Google Scholar] [CrossRef]
  35. Awai, I.; Komori, T. A simple and versatile design method of resonator-coupled wireless power transfer system. In Proceedings of the 2010 International Conference on Communications, Circuits and Systems, ICCCAS 2010—Proceedings, Chengdu, China, 28–30 July 2010; pp. 616–620. [Google Scholar]
  36. Lee, W.-S.; Son, W.-I.; Oh, K.-S.; Yu, J.-W. Contactless energy transfer systems using antiparallel resonant loops. IEEE Trans. Ind. Electron. 2013, 60, 6093746. [Google Scholar] [CrossRef]
  37. Wang, B.; Yerazunis, W.; Teo, K.H. Wireless power transfer: Metamaterials and array of coupled resonators. Proc. IEEE 2013, 101, 1359–1368. [Google Scholar] [CrossRef] [Green Version]
  38. Taflove, A.; Hagness, S.C. Computational Electrodynamics: The Finite-Difference Time-Domain Method; Artech House: Boston, MA, USA, 2005. [Google Scholar]
  39. Choroszucho, A.; Butryło, B. Inhomogeneities and dumping of high frequency electromagnetic field in the space close to porous wall. Przegląd Elektrotechniczny 2012, 88, 263–266. [Google Scholar]
  40. Zienkiewicz, O.C.; Taylor, R.L.; Zhu, J.Z. The Finite Element Method: Its Basis & Fundamentals, 7th ed.; Butterworth-Heinemann: Oxford, UK, 2013. [Google Scholar]
  41. Introduction to the RF Module, COMSOL; Version: COMSOL 4.3b; COMSOL Inc.: Burlington, MA, USA, 2013.
  42. RF Module User’s Guide, COMSOL; Version: COMSOL 4.3b; COMSOL Inc.: Burlington, MA, USA, 2013.
  43. Stankiewicz, J.M.; Choroszucho, A. Efficiency of the Wireless Power Transfer System with Planar Coils in the Periodic and Aperiodic Systems. Energies 2022, 15, 115. [Google Scholar] [CrossRef]
  44. Mohan, S.S.; del Mar Hershenson, M.; Boyd, S.P.; Lee, T.H. Simple Accurate Expressions for Planar Spiral Inductances. IEEE J. Solid-State Circuits 1999, 34, 1419–1424. [Google Scholar] [CrossRef] [Green Version]
  45. Liu, S.; Su, J.; Lai, J. Accurate Expressions of Mutual Inductance and Their Calculation of Archimedean Spiral Coils. Energies 2019, 12, 2017. [Google Scholar] [CrossRef] [Green Version]
Figure 1. Classifications of the WPT system.
Energies 16 02009 g001
Figure 2. The analyzed periodic WPT system: (a) a three-dimensional model, (b) a two-dimensional fragment of a group of transmitting or receiving surfaces.
Energies 16 02009 g002
Figure 3. A numerical model with a pair of coils Tx-Rx: (a) a WPT cell geometry, (b) a grid over the entire area, (c) a grid over coils.
Energies 16 02009 g003
Figure 4. An analytical model with (a) a periodic cell, (b) a replacement circuit.
Energies 16 02009 g004
Figure 5. Load impedance for the cases with and without skin effect at 1 MHz for the small coil at (a) h = 0.005 m; (b) h = 0.01 m.
Energies 16 02009 g005
Figure 6. Load impedance for the cases with and without skin effect at 1 MHz for the large coil at (a) h = 0.0125 m; (b) h = 0.025 m.
Energies 16 02009 g006
Figure 7. Coil resistance with skin effect at 1 MHz and without skin effect for (a) small coil; (b) large coil.
Energies 16 02009 g007
Figure 8. Results for n = 10 for the cases with and without skin effect: (a) Pt, (b) Pr, (c) η.
Energies 16 02009 g008
Figure 9. Results for n = 20 for the cases with and without skin effect: (a) Pt, (b) Pr, (c) η.
Energies 16 02009 g009
Figure 10. Results for n = 30 for the cases with and without skin effect: (a) Pt, (b) Pr, (c) η.
Energies 16 02009 g010
Figure 11. Results for n = 40 for the cases with and without skin effect: (a) Pt, (b) Pr, (c) η.
Energies 16 02009 g011
Figure 12. Results for n = 50 for the cases with and without skin effect: (a) Pt, (b) Pr, (c) η.
Energies 16 02009 g012
Figure 13. Results for n = 60 for the cases with and without skin effect: (a) Pt, (b) Pr, (c) η.
Energies 16 02009 g013
Figure 14. Results for n = 70 for the cases with and without skin effect: (a) Pt, (b) Pr, (c) η.
Energies 16 02009 g014
Figure 15. Load impedance for the cases with and without skin effect at 1 MHz for the small coil at (a) h = 0.005 m; (b) h = 0.01 m.
Energies 16 02009 g015
Figure 16. Load impedance for the cases with and without skin effect at 1 MHz for the large coil at (a) h = 0.0125 m; (b) h = 0.025 m.
Energies 16 02009 g016
Figure 24. Magnetic flux density distribution (color) and its normalized vectors (white arrows) in xz surface, for the model with maximized efficiency at r = 0.01 m, h = 0.005 m, n = 30, and f = 1 MHz.
Energies 16 02009 g024
Table 1. Geometrical parameters of the analyzed models of WPT system.
r (m)nh (m)
0.01100.0050.01
200.0050.01
300.0050.01
400.0050.01
0.025500.01250.025
600.01250.025
700.01250.025
Table 2. Calculated circuit parameters for r = 0.01 m (without skin effect).
nRc
(Ω)
Zeff (Ω) at 1 MHzZpow (Ω) at 1 MHzx
h = 0.005 mh = 0.01 mh = 0.005 mh = 0.01 m
100.322.420.6318.011.21
200.588.732.081337.54
300.7515.263.6131017.33
400.8618.694.3940822.52
Table 3. Calculated circuit parameters for r = 0.025 m (without skin effect).
nRc
(Ω)
Zeff (Ω) at 1 MHzZpow (Ω) at 1 MHz
h = 0.0125 mh = 0.025 mh = 0.0125 mh = 0.025 m
503.5713731.545219279
604.0618041.717951428
704.4821850.7510627575
Table 4. Calculated circuit parameters for r = 0.01 m (with skin effect).
nRc_ac
at 1 MHz (Ω)
Zeff_ac (Ω) at 1 MHzZpow_ac (Ω) at 1 MHz
h = 0.005 mh = 0.01 mh = 0.005 mh = 0.01 m
100.422.430.68141.10
200.758.742.141026.11
300.9815.283.6723913.74
401.1118.714.4531417.79
Table 5. Calculated circuit parameters for r = 0.025 m (with skin effect).
nRc_ac
at 1 MHz (Ω)
Zeff_ac (Ω) at 1 MHzZpow_ac (Ω) at 1 MHz
h = 0.0125 mh = 0.025 mh = 0.0125 mh = 0.025 m
504.6313731.674021217
605.2718041.856124332
705.8221850.888188445
Table 6. Maximum power transfer efficiency values at 1 MHz.
nη (%) at 1 MHz
With Skin EffectWithout Skin Effect
h = 0.005 mh = 0.01 mh = 0.005 mh = 0.01 m
1070.4823.6276.4331.77
2084.2648.1987.7256.81
3087.9757.8990.6665.28
4088.7659.9891.3167.07
h = 0.0125 mh = 0.025 mh = 0.0125 mh = 0.025 m
5093.4374.1194.9079.35
6094.3177.6695.5982.28
7094.8379.1895.9983.48
Table 7. Difference between the maximum values of η at 1 MHz for cases with and without skin effect.
nη (%) at 1 MHz
h = 0.005 mh = 0.01 m
1068
2039
3037
4037
h = 0.0125 mh = 0.025 m
5015
6015
7014
Table 8. Maximum load power values at 1 MHz.
nPr (mW) at 1 MHz
With Skin EffectWithout Skin Effect
h = 0.005 mh = 0.01 mh = 0.005 mh = 0.01 m
10578369756564
20333295433402
30255238332318
40225211292282
h = 0.0125 mh = 0.025 mh = 0.0125 mh = 0.025 m
5054537069
6047476261
7043435656
Table 9. Difference between the maximum load power values at 1 MHz for cases with and without skin effect.
nPr (mW) at 1 MHz
h = 0.005 mh = 0.01 m
10178195
20100107
307780
406771
h = 0.0125 mh = 0.025 m
501616
601514
701313
Disclaimer/Publisher’s Note: The statements, opinions and data contained in all publications are solely those of the individual author(s) and contributor(s) and not of MDPI and/or the editor(s). MDPI and/or the editor(s) disclaim responsibility for any injury to people or property resulting from any ideas, methods, instructions or products referred to in the content.

