Abstract
Big cities affected by intense mobility, traffic and pollution are adopting electrification-based solutions for the reduction of the emissions of combustion engines. An interesting field in which the transition toward electrification can achieve important benefits is the area of instant deliveries. Instant deliveries deal with the mobility related to commercial trades between suppliers and customers. In this respect, optimal solutions can be considered during route planning based on the minimization of several metrics, such as distance, energy and road slope, among others. To this end, this paper presents an optimal solution to the instant deliveries problem in which the result is the optimal route, in the city under study, that minimizes energy consumption based on road slope and total distance traveled, and that gives higher priority to routes that include cycling infrastructure that the city can provide. The paper uses electric bikes since they are easily transportable and are highly versatile for instant deliveries. The results obtained were compared to a previous version of the optimal algorithm already published by the authors which minimizes the Haversine and Euclidian distances only. It was found that the shortest distance travelled between customers does not necessarily imply the least energy consumption. The latter, in combination with an energy consumption estimation approach, represent the original contribution of the work.
1. Introduction
Climate change is an issue of global concern due to its negative impact resulting from the rise in global average surface temperature caused by increase in greenhouse gases (GHG) [1,2,3,4,5,6,7,8]. To address climate change, the international community has established a common agenda through the Sustainable Development Goals (SDGs), and the Paris Agreement, focused on limiting the temperature increase to 2 and, preferably, 1.5 above pre-industrial levels. However, the global temperature continues to rise with a trend indicator of 3.2 by the end of this century [9]. Therefore, the need to strengthen commitments, improve strategies and accelerate actions for controlling the emission of GHGs associated with anthropogenic activities has arisen. Carbon dioxide () is the GHG with the largest contribution to global warming due to the volume of its emissions and its lifetime in the atmosphere [10]. It is responsible for 66% of the increase in radioactive forcing on Earth as explained by the National Oceanic and Atmospheric Administration (NOAA). Worldwide, 74% of emissions are generated from burning fossil fuels to obtain energy [9]. According to the International Energy Agency (IEA), among the activities that consume fossil fuels is the road transport sector, which is responsible for 18% of global emissions. At the world level, Mexico is responsible for approximately 1.3% of total emissions from combustion and 2.3% from road transportation as reported by the IEA. Although it is not the country that generates the most emissions, Mexico is a territory vulnerable to the impacts of global warming since the externalities are not only local but regional and global, as explained in [11]. Hence, the nation has made international commitments to collaborate in the fulfilment of emission reduction targets through atmospheric decarbonization, and has set national objectives for the well-being of its population.
In Mexico, classified by the UN as a developing economy country [12] and by the World Bank as an upper-middle-income country [13], the road transport sector is the most energy intensive sector, even above the industrial sector according to [14]. Road transportation represents 90% of the entire transport sector and 41.7% of the total energy consumption of the country [14]. Consequently, it releases 93.3% of emissions of the transport sector and 34.4% (161.6 Mt) of the national total emissions from oil fuel combustion [15]. These values rank road transportation as the activity that generates the second most emissions, behind only electricity production [15]. Transportation is crucial for social-economic development [16]. However, this sector has associated negative externalities that affect the environment and quality of life [17], especially in large cities due to traffic congestion and pollution. In Mexico, more than 80% of inhabitants are concentrated in urban areas and it is estimated that by 2050 the percentage will increase to 88.2%, as explained in [18]. In particular, the metropolitan area of the Valley of Mexico, officially known as Zona Metropolitana del Valle de México (ZMVM), which includes Mexico City and 59 municipalities in the State of Mexico and one in Hidalgo, is the second largest in Latin America and the fifth-largest globally, with 21 million inhabitants [18], 7800 and an estimated vehicle fleet of six million [19]. In the ZMVM, road transportation consumes 483 , which represents 50% of the total energy consumption in the ZMVM and 20% at national level [14,19]. The transportation sector is the main emitter of atmospheric pollutants: for the total emissions in the ZMVM, 56% (43,217,058 ) are of generated from road vehicles, representing 27% of total emissions nationwide [15,19].
Emissions reduction strategies in large urbanized regions, such as ZMVM, might be crucial for global atmospheric decarbonization. However, growing urbanization represents a challenge for urban development, provision of services, reduction in traffic congestion and emissions control. Achieving low-emission (direct and indirect) transport is a task that requires multisectoral strategies and actions, including privately supported initiatives [20]. These strategies must address comprehensive sustainable mobility that includes the use of clean energy and changes in transportation modes, consumption, and mobility patterns. One effective strategy to reduce emissions is to improve efficiency and lower fossil fuel consumption [16] using low-carbon energy on-road vehicles, such as electric vehicles [9,20], as well as alternative means of transportation, such as bicycles.
In large and dense cities, for instance Beijing, Mexico City, and Mumbai, commercial vehicles used for deliveries contribute to a significant share of traffic congestion and emissions [21]. Therefore, low-carbon commercial transportation strategies, such as the use of electric vehicles, is beneficial for the environment and the economy of suppliers and customers [21].
Previous studies reported in the literature have addressed the numerous challenges involved with the routing and logistics of CV-utilized instant deliveries in urban zones. Since one of the main obstacles to widespread EV adoption worldwide is a concern about the availability of charging facilities due to limited battery autonomy, numerous articles have focused on algorithms to solve the problems associated with recharging stations in route planning. For instance, Schneider et al. [22], proposed a cost-optimal solution for EVs, including time-windows and recharging stations, based on the development of a hybrid metaheuristic method that comprised a tabu search heuristic integrated with a variable neighborhood search algorithm. Felipe et al. [23] provided a mathematical programming model along with various heuristic algorithms centered exclusively on EV fleets and evaluated the use of diverse recharge technologies, including the option of partial recharges along the route. Keskin and Çatay [24] also considered EVs, time windows, and partial recharges, proposing a solution for the routing problem through the creation of an adaptive search algorithm applied to large neighborhoods. Subsequently, Keskin et al. [25], investigated the same problem of EVs, considering time-windows and stochastic waiting times at recharging stations using a two-stage simulation-based heuristic. Desaulniers et al. [26] presented a “branch-price-and-cut” algorithm for each of the four recharging options suggested in the study: single full recharge, multiple full recharges, single partial recharge, and multiple partial recharges. Montoya et al. [27] considered nonlinear functions of the charging time of batteries and presented and tested a hybrid metaheuristic approach combining heuristic concentration with an iterated local search. Zhang et al. [28] formulated a mathematical model in order to comprehensively calculate and minimize the actual energy consumption of EVs. To carry out the calculations, the authors proposed an “ant-colony-algorithm-based meta-heuristic”. Meanwhile, Aphrodite et al. [29] analyzed optimal solutions for vehicle routing and scheduling of a homogenous fleet of EVs. Goeke and Schneider [30] also centered their study on optimal routes, but in a mixed fleet of EVs and internal combustion engine (ICE) vehicles. Addressing the same issue, Lin et al. [31] studied the optimal routing of EVs and included evaluation of time costs and energy costs. Furthermore, Jie et al. [32] proposed an algorithm to address two-echelon capacitated electric routing with battery interchange stations, considering energy consumption and costs.
On the other hand, some authors have adopted a sustainability perspective, focusing on the negative impacts linked to commercial transportation. In this research area, Rai et al. [33] analyzed the environmental performance of crowd logistics by applying a multi-criteria analysis involving diverse stakeholders; additionally, the authors considered different social, environmental, and economic externalities, such as traffic congestion, pollutant emissions, use of non-renewable natural resources, noise, accidents and accessibility and the high costs of the last mile, among others. Finally, Pourrahmani and Jaller [34] analyzed the challenges and opportunities of crowdshipping service logistics and discussed several sustainability concerns, highlighting carbon emissions, cost savings, working conditions of the employees, driving behaviors, social equity, infrastructure, and the environmental benefits of clean modes of transportation.
Considering the topics and research gaps that the authors of the aforementioned articles have indicated, this study aims to cover diverse issues related to instant delivery services. These issues have been comprehensively addressed from a sustainability perspective [33,34] that is especially required in an emerging market [35] such as Mexico, including improvement in the efficiency of CVs in two-echelon vehicle routing, calculation of the energy consumed, and the use of cleaner modes of transportation [34] by combining electric bicycles and electric VAN to reduce traffic congestion and emissions.
For this purpose, this paper presents a new delivery strategy based on the combined use of large electric VAN and e-bikes, ensuring minimal energy consumption, while prioritizing available cycling infrastructure, ensuring bike rider safety. Furthermore, the proposed optimization method makes use of several software resources, such as Python®, Google Maps®, Matlab®-Simulink®, to elaborate data extracted from the context of Mexico City, and CarSim® for the simulation of the accurate functioning of an electric VAN that involves a full model with particular emphasis on the regenerative power provided by the regenerative braking system. Finally, the results obtained are compared to a previous version of the optimal algorithm already described by the authors in [36], showing the progress that has been achieved in this field. In [36], the optimal algorithm considers the Haversine and Euclidian distances only to elaborate the optimal decision. However, the current proposal takes into consideration the energy consumption estimation showing how the shortest distance between customers does not necessarily mean the least energy consumption.
Section 2 describes in detail the instant deliveries problem and the approach the authors propose. Section 3 recalls fundamental and basic aspects of vehicle dynamics with a particular focus on power into the wheel for e-bikes. Algorithms to solve the optimal delivery problem are discussed in Section 4. The results obtained are shown in Section 5 which highlights the quality of the measurements and decisions used in the real environment of Mexico City. Finally, Section 7 presents the authors conclusions and future research directions.
2. The Delivery-Route Problem
The main objective to be achieved in electric transportation is energy minimization since battery storage capacity is limited and charging stations are not fast enough to ensure instant deliveries. Energy minimization implies the minimization of other metrics, such as the distance traveled during delivery, the slope of the road the vehicle has to face, and the existence of cycling infrastructure where the vehicle to execute the delivery is an e-bike. In this respect, this paper considers all customers as nodes with defined map coordinates and that the supplier has a known station position. The supplier moves with an electric vehicle, VAN class, into which three e-bikes are loaded.
The problem is to define which customer represents the optimal arrival point, since the optimal node will determine bicycle deployment toward the rest of the customers. Making reference to Figure 1, the coordinates of the customers and the supplier station are introduced in Python® to the Google Map® platform. The latter returns distance and slope matrices for several instant times that are applied, making use of software interfaces, to Matlab®-Simulink® and CarSim®, where the simulations are made. In particular, deliveries made using e-bikes are simulated as dynamic models in Simulink®, whereas the travel of the e-VAN is simulated in CarSim®. Finally, the results obtained are elaborated using Python® and Gurobi® platforms, which calculate and return the optimal route.
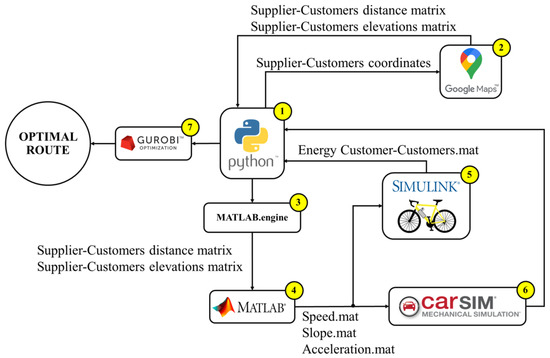
Figure 1.
Procedure scheme for optimal route definition.
It is worth noting that the use of the Google Maps platform under the “bicycle” mode ensures the existence of safe cycling routes which are designed and updated by the local authority. Moreover, according to the Ministry of Mobility (SEMOVI), the Mexico City Government has promoted the use of bicycles and planned routes and has invested in infrastructures in areas of higher urban density. Therefore, route simulation studies might support the cycling and automobile layout planning of the city. The next section presents some refreshers on bicycle dynamics to show how energy consumption estimations are made. Instead of considering statistical data for energy consumption, in this work, the authors simulate the main components of electric vehicles, such as the battery, electric motor, and control system, in order to achieve a high level of accuracy for the estimates and decisions.
3. Refreshers on E-Bike Components and Functioning
In this section, an electric bicycle model, including electrical components such as the battery, electric motor, motor control strategy and equations of motion, is presented.
3.1. E-Bike Dynamics
When electric vehicle applications are considered, it is common practice to analyze the mechanical and electrical behaviors of the vehicle. In this respect, the equations of motion of a vehicle are able to estimate the power to the wheels needed to provide sufficient traction force to cope with all the resistive forces applied to the vehicle during driving.
Making reference to the bike depicted in Figure 2, and according to [37,38], the equations of motion are the following:
where m represents the mass of the bike and the rider, v is the longitudinal velocity, is the traction force, is the force due to the aerodynamics, is the total force produced by the rolling resistance moment, and is the force due to the road slope, expressed as:
with representing the area of the frontal section of the bike, the drag coefficient and the air density,
where is the rolling resistance coefficient, g the gravity acceleration,
and the road slope.
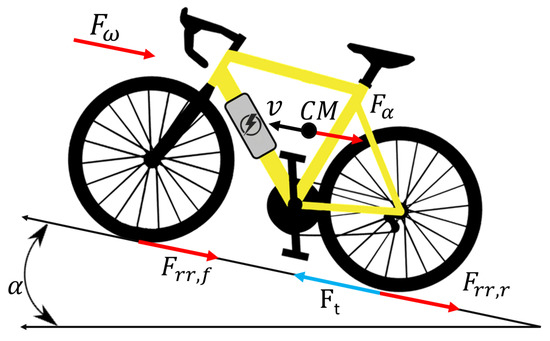
Figure 2.
Bike free body diagram.
Moreover, the traction force can be considered as a function of the wheel torque:
and substituting (1) in (12) one obtains:
Taking into account the external torque contribution the driver could eventually give, it is possible to split the total torque into two different contributions:
where is the torque given by the electric motor and is the external torque from the driver.
Assuming a gear ratio for the motor-wheel transmission given by the following relation:
one can determine the bicycle longitudinal velocity as follows:
where represents the wheel angular velocity and r the wheel radius.
It is now possible to calculate the mechanical power to the wheel given by the product of traction force and the bike velocity as follows:
where is the mechanical power to the wheels. The mechanical power is provided by an electric motor. In this respect, the next paragraph discusses the electric motor modelling and control strategy.
3.2. Permanent Magnet Synchronous Machine (PMSM) and Field Oriented Control (FOC)
In this paper, we consider an electric motor defined by the following equations and controlled by making use of a field-oriented current control. In this respect, the equations are given with respect to the rotor reference frame:
where d and q stand for the direct and quadrature rotor axes; , , and represent the voltage, currents and inductance, respectively. Moreover, p gives the number of pole pairs, whereas R is the phase resistance and is the flux linkage of the rotor, and, finally, represents the rotor angular speed. Hence, the behavior of direct and quadrature currents can be given by Equation (11). One can relate them to the electromagnetic torque, representing the main concern in traction applications:
Equation (12) presents the permanent magnet alignment and the reluctance factor, to the left and right, respectively. In fact, when the rotor is perfectly isotropic (), the torque is determined only by the permanent magnet alignment. Furthermore, for attaining traction control, the reference for the quadrature current is derived from the desired torque as follows:
whereas for the direct axis, the current is set to zero, i.e., . Moreover, when the angular speed increases and the electromotive force exceeds the capability of the source voltage, the direct axis current is injected with a negative direction, and the quadrature current is conditioned to extend the speed of the electric machine, at the cost of bringing its torque to a lower rank. This phenomenon is called field weakening and is accomplished, in this case, through a maximum torque per volt (MTPV) method [39]. References are given for the separate current controllers, proportional and integral (PI), for each rotor axis, as shown in Figure 3. Using phase transformations, where the electrical angle of the rotor is required, the variables of the rotor frame are converted to a stator frame and vice versa. These conversions derive the phase voltages in the stator frame and then decide the switching strategy for the transistors in the inverter. In this respect, a space-vector-modulation (SVM) switching strategy is considered. For control objectives, a transformation is also needed to calculate the current values in the rotor frame. As a consequence of causality, the machine will impose a traction torque, while the rotor speed will be attained as a consequence of vehicle dynamics [40].
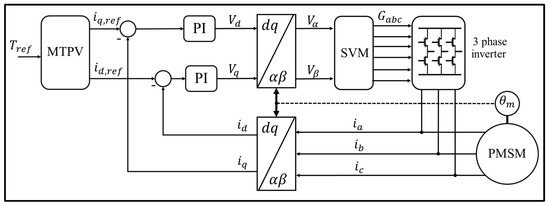
Figure 3.
Field-oriented current control strategy.
Figure 3 shows a simplified control scheme of the FOC technique, the most widely known vector control technique for electric motors. In this circuit, the currents of the stator phases of the motor are measured and transformed to a two-phase system via Clarke transformation. The value of the rotor angle from the position sensor is used for the following transformation of currents via Parke transformation from the static reference frame to the rotated frame connected with the rotor flux linkage. In accordance with the reference speed signals and the d-component of the stator current, considering the feedback signals, a separate control of the torque and the motor excitation flux is derived.
The current and voltage demand are provided by the battery. The next paragraph presents the battery mathematical model used in this work.
3.3. Dynamic Model of the Battery
The battery behavior is considered for two different scenarios: charging and discharging. In this work, the authors consider the bicycle not to be equipped with regenerative braking so that battery charging is only enabled in stationary conditions. The following equations describe the battery system: discharging,
and charging,
where: is the battery voltage, is the battery constant voltage, K is the polarization constant or resistance, Q is the battery capacity, is the actual battery charge, A is the exponential zone amplitude, B is the exponential time constant inverse, R is the internal resistance, i is the battery current, is the filtered current, and with , , and:
The electric functioning of the bicycle is described in terms of the traction force and power, electric motor with control strategy, and battery modelling. The next section discusses the proposal of an optimal solution to the route problem in instant deliveries.
4. Optimal Delivery Route Solutions
Mexico City has 393 km of cycling infrastructure, as reported by local authorities, such as the Ministry of Mobility, occurring mainly in three municipalities: Benito Juárez, Cuauhtémoc and Miguel Hidalgo. For the purpose of the present study, the experiment considers five locations in the municipality of Benito Juárez: one represents the coordinate of the supplier depot (e-VAN departure point) and the remaining points represent the coordinates of the customer positions. It is worth noting that the municipality taken into account for the study is chosen according to the kilometers of available cycling infrastructure, and its characteristics in terms of permanent and temporally enabled, exclusive, or bus-shared, as explained by the local Institute for Democratic Planning and Perspective.
The models presented in Section 3 for energy estimation are solved with the Gurobi® API for Python®, with the directions, distance matrix and map elevation APIs given by Google Cloud® in a computer with 32 GB RAM. Figure 4 explains the procedure to obtain the elevation points in each arc of the route. In this step, a set of points between each arc were obtained, where stands for the initial coordinate i and the arrival point j. The number of points per arc that can be counted depends on the distance between each node and are given by the platform. Hence, the distance, time, and elevation of each inner arc is calculated to develop the velocity profile. Figure 5 shows the procedure to obtain the distance and the duration of each arc in the search space set with the profile “bicycle”. This configuration prioritizes routes based on the available cycling infrastructure.
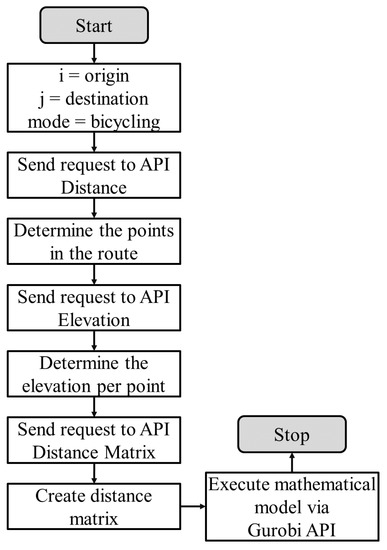
Figure 4.
Road slope acquisition method.
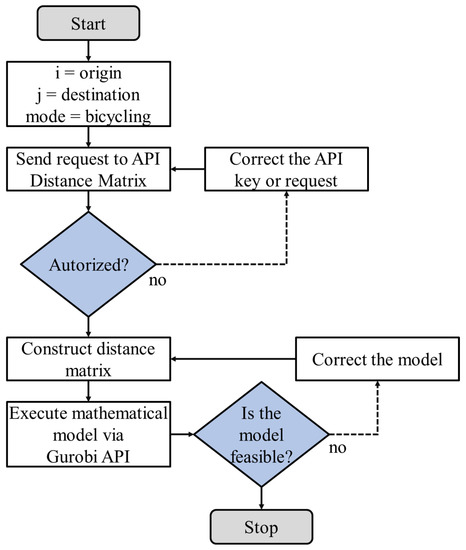
Figure 5.
Distance-time acquisition method.
This section provides the mathematical formulation of the p-median model. The sets, parameters, and decision variables for the models presented are listed below:
Sets:
A: set of arcs where
I: set of customers
J: set of candidate parking spots
Parameters:
: distance travel from node i to j
: energy consumed from i to j
: average elevation from i to j
P: number of desired parking spots
Decision variables:
: binary variable equal to 1 if customer i is served from node j, 0 otherwise
: binary variable equal to 1 if a parking sport is located on node j, 0 otherwise.
4.1. Previous Algorithm Model: Distance Optimization
This model type aims to minimize the total travel distance in the routes executed on bicycles. This approach does not consider the optimal routes from the EV/truck customer—it only assigns the parking spot. In Equation (18), the term minimizes the sum of the distances between the parking spot and the customers and return. The model does not have a classification of customers; in fact, all customers can be assigned to a truck or to a bicycle. The following equation set describes the optimal problem subjected to several constraints:
4.2. Actual Algorithm Proposal: Energy Optimization
The energy minimization problem has been introduced in several applications, especially in routing models as proposed in [41,42,43,44], where the authors first estimate the energy and then optimize it in the route. Conversely, our approach aims to minimize the energy according to the results obtained by the simulation with the elevation data previously obtained. Thus, the model minimizes the energy consumed of each arc in the route described by the following optimal criteria:
where represents the total energy consumed in both directions, from node i to j and from j to i.
5. Simulation Results
The quality and performance of the proposed method are validated by simulations. Two different platforms are used for simulating the energy-consumption estimation of the e-bikes moving from the optimal node toward the rest of all nodes, and the energy consumption estimation of the e-VAN performing the route from the supplier station to the customer nodes. In particular, Matlab®-Simulink® has been used for the mathematical model of the e-bike, including vehicle dynamics, electric motor with FOC-based control strategy, and battery modelling, whereas CarSim® is used to simulate the energy consumption of the e-VAN travelling from the supplier station to the rest of the customer nodes. The results obtained are here divided into two different parts: e-bikes and e-VAN.
The sequence of data manipulation can be summarized as follows: the geographic coordinates of the customers and dealer are introduced to the Google portal that, according to the travelling mode car or bicycle, returns to the Python script all the travel information point by point. These vectors are sent to Matlab that transform such vectors in a compatible structure for Simulink models. Simulink, making use of Matlab embedded functions, derives the energy consumption estimation, whereas an S-function connects the CarSim environment to the Simulink to perform the VAN simulations. The energy consumption estimations are returned to the Python script that merges and elaborates the optimal solution.
5.1. E-Bike Simulations Using Matlab®-Simulink®
The simulation results of the final delivery using e-bikes are shown in Figure 6, in which the longitudinal velocity, the road slope, the power to the wheel, and the energy consumption are presented for each of the customer nodes, in the sense that, for each node, the simulation involves three e-bikes travelling to the rest of the customer nodes. In this respect , , , and stand for the velocity, slope, power, and energy that the electric bicycle manifests when moving from node i to node j, respectively. For instance, Node 1 means that the VAN, transporting three e-bikes onboard, arrives to the node 1 and lets the bicycles go to the remaining nodes, one bike for one node only. On a single row of Figure 6, are given the longitudinal velocity, the road slope, the power to the wheel, and the energy consumption.
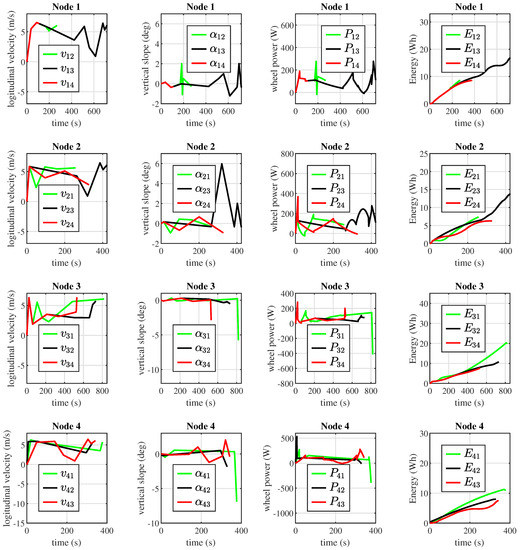
Figure 6.
E-bike energy consumption estimation based on longitudinal velocity, road slope, and vehicle dynamics.
For the e-bikes, the parameters used in the simulations are listed in Table 1.

Table 1.
Parameters used in e-bike simulations.
5.2. E-VAN Simulation Using CarSim®
The electric vehicle, e-VAN type, shown in Figure 7 is used to simulate the supplier travels to each customer. Due to the significant technology these vehicles possess, the authors decided to adopt a car simulator, CarSim®, which is able to mimic the real behavior of an electric vehicle, including regenerative braking.
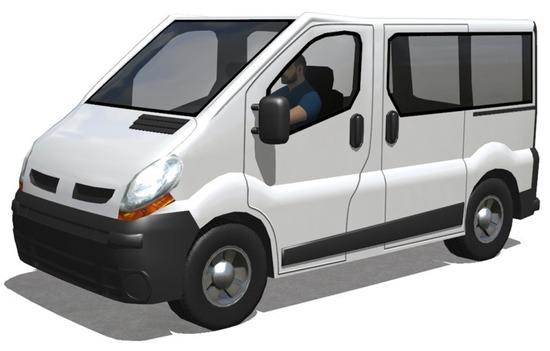
Figure 7.
Supplier VAN electrified vehicle used in CarSim®.
The results obtained are presented in Figure 8 showing travel from the supplier station (the subscript D stands for depot) to each of the customer nodes 1, 2, 3, 4, that are depicted. In particular, longitudinal velocity , road slope , power to the wheels , and energy consumption are given for points i and j, standing for the starting and arriving coordinates, respectively.
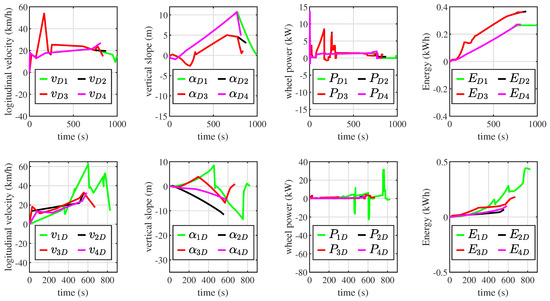
Figure 8.
Travels from depot to customers and from customers to depot.
For instance, the first row of Figure 8 represents the travels in terms of departures from the Depot to each one of the customers, whereas the second row depicts the travel from each node to the supplier.
Figure 9 shows all the routes executed in the experiments. The routes in solid blue represent the trajectories made by the e-Van; the routes with dotted lines represent the trajectories travelled by bicycle, whereas the yellow dots stand for parking points.
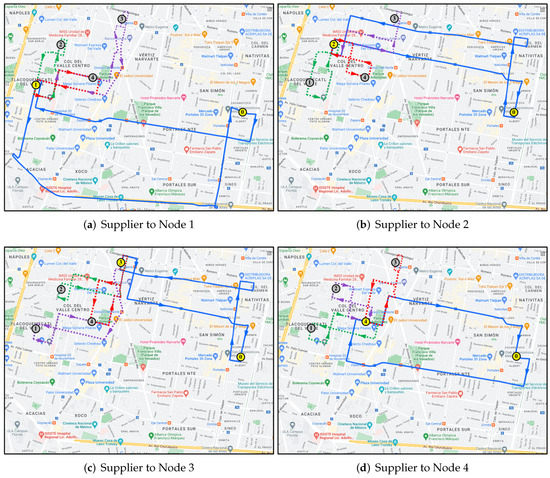
Figure 9.
Validation of deliveries travelling.
6. Discussion
The previous algorithm in [36] determines an optimal arriving point by minimizing the distance between nodes. The proposed approach, in contrast, is based on energy optimization making use of real traffic configuration, true travelling directions and road slopes given by the Google API.
According to the results given by the old approach, the optimal arriving point should be node number 2 since it presents the minimal distance between coordinates. However, our proposed method establishes that the optimal node is node number 4 since the optimization method takes into account the available route, the road slope, and minimizes the energy consumption, prioritizing the cycling infrastructure.
Table 2 and Table 3 summarize numeric results for the e-bikes moving between customers and the e-VAN of the supplier travelling to the customers nodes. In particular, the energy consumption given in the fourth column is calculated as the time integral of the traction power given in (10) as follows: .

Table 2.
Numeric results of customer route deliveries for e-bikes.

Table 3.
Numeric results of supplier route deliveries for e-VAN.
The first column describes if the travel of the bicycles is performed in terms of departure or arrival in the sense that departure node 1 means that the VAN is situated in node 1 and, from there, the bicycles go to the remaining three nodes. On the other hand, arrival node 1 means that the VAN is in node 1 and waits for the three bicycles returning to node 1. Note that the previous approach does not consider differences between round trips since the distances are equal in both directions, whereas the actual proposal exhibits greater accuracy of the predictions since they are based on real traffic and city scenarios.
7. Conclusions
Urban transportation, particularly instant deliveries, is facing a fast transition from combustion transportation to electrification-based solutions to achieve emissions reduction. In the field of electric transportation, the amount of energy utilized for supplier to customer travel plays a fundamental role so that energy optimization algorithms are considered to be key strategies. To this end, this paper presents a novel solution for instant deliveries based on energy estimation based on experimental data obtained in Mexico City. The novelty and originality of this work relies on the fact that energy optimization is based on accurate models, including real map coordinates and road-map distribution for an interesting neighborhood in Mexico City. The results obtained using Python®, Matlab®-Simulink®, and CarSim® show that optimal routes are performed better compared with the previous version of the algorithm. However, for many customer coordinates representing the network nodes, the proposed approach could require extensive simulation time, which may represent a limitation of the proposed approach. In this respect, future work will be directed toward model simplification based on data obtained in this work to reduce the time taken by the simulations.
Author Contributions
Conceptualization, R.C. and A.B.G.-M.; methodology, R.C. and A.B.G.-M.; software, R.C. and A.B.G.-M.; validation, R.C., A.B.G.-M. and S.I.V.-S.; formal analysis, R.C. and A.B.G.-M.; investigation, R.C., A.B.G.-M. and S.I.V.-S.; resources, R.C., A.B.G.-M. and S.I.V.-S.; data curation, R.C., A.B.G.-M. and S.I.V.-S.; visualization, R.C., A.B.G.-M. and S.I.V.-S.; supervision, R.C.; project administration, R.C.; funding acquisition, R.C. All authors have read and agreed to the published version of the manuscript.
Funding
This research received no external funding.
Data Availability Statement
Data available on request due to restrictions.
Conflicts of Interest
The authors declare no conflict of interest.
Abbreviations
The following acronyms and symbols are used in this manuscript:
| CO | Carbon dioxide |
| CV | Commercial vehicles |
| DEM | Digital elevation model |
| EV | Electric vehicle |
| FOC | Field-oriented control |
| GHG | Greenhouse gases |
| IEA | International Energy Agency |
| MTPV | Maximum torque per volt |
| NOAA | National Oceanic and Atmospheric Administration |
| PI | Proportional-integral |
| PM | Permanent magnet |
| PMSM | Permanent magnet synchronous machine |
| SEMOVI | Secretaría de Movilidad |
| SDGs | Sustainable Development Goals |
| SVM | Space-vector modulation |
| ZMVM | Zona Metropolitana del Valle de México |
| v | Velocity |
| Traction force | |
| Aerodynamics force | |
| Rolling resistance force | |
| Road slop force | |
| Area of the frontal section of the bike | |
| Drag coefficient | |
| Air density | |
| Rolling resistance coefficient | |
| g | Gravity acceleration |
| Road slope | |
| Torque given by the electric motor | |
| External torque from the driver | |
| Wheel angular velocity | |
| r | Wheel radius |
| Mechanical power to the wheels | |
| Direct voltage | |
| Quadrature voltage | |
| Direct current | |
| Quadrature current | |
| Direct inductance | |
| Quadrature inductance | |
| p | Pole pairs |
| R | Phase resistance |
| Flux linkage of the rotor of the PMs | |
| Rotor angular speed of the motor | |
| Angle of the rotor | |
| Battery voltage | |
| Battery constant voltage | |
| K | Polarization constant or resistance |
| Q | Battery capacity |
| Actual battery charge | |
| A | The exponential zone amplitude |
| B | The exponential time constant inverse |
| R | Internal resistance |
| i | Battery current |
| The filtered current | |
| Longitudinal velocity | |
| Road slope | |
| Power to the wheels | |
| Energy consumption |
References
- Anderson, T.R.; Hawkins, E.; Jones, P.D. CO2, the greenhouse effect and global warming: From the pioneering work of Arrhenius and Calendar to today’s Earth System Models. Endeavour 2016, 40, 178–187. [Google Scholar] [CrossRef] [PubMed]
- Intergovernmental Panel on Climate Change (IPCC). Climate Change 2021: The Physical Science Basis. In Synthesis Report. Contribution of Working Group I to the Sixth Assessment Report of the Intergovernmental Panel on Climate Change; Approved Version; IPCC: Paris, France, 2021; Available online: https://www.ipcc.ch/site/assets/uploads/2018/02/SYR_AR5_FINAL_full.pdf (accessed on 10 January 2023).
- Ullah, I.; Liu, K.; Yamamoto, T.; Zahid, M.; Jamal, A. Modeling of machine learning with SHAP approach for electric vehicle charging station choice behavior prediction. Travel Behav. Soc. 2023, 31, 78–92. [Google Scholar] [CrossRef]
- Li, G.; Luo, T.; Song, Y. Climate change mitigation efficiency of electric vehicle charging infrastructure in China: From the perspective of energy transition and circular economy. Resour. Conserv. Recycl. 2022, 179, 106048. [Google Scholar] [CrossRef]
- Ullah, I.; Liu, K.; Yamamoto, T.; Shafiullah, M.; Jamal, A. Grey wolf optimizer-based machine learning algorithm to predict electric vehicle charging duration time. Transp. Lett. 2022, 1–18. [Google Scholar] [CrossRef]
- Li, C. Hidden Benefits of Electric Vehicles for Addressing Climate Change. Sci. Rep. 2015, 5, 9213. [Google Scholar] [CrossRef]
- Ullah, I.; Liu, K.; Yamamoto, T.; Zahid, M.; Jamal, A. Prediction of electric vehicle charging duration time using ensemble machine learning algorithm and Shapley additive explanations. Int. J. Energy Res. 2022, 46, 15211–15230. [Google Scholar] [CrossRef]
- Cerruti, G.; Chiola, M.; Bianco, V.; Scarpa, F. Impact of electric cars deployment on the Italian energy system. Energy Clim. Chang. 2023, 4, 100095. [Google Scholar] [CrossRef]
- United Nations Environment Programme (UNEP). Emissions Gap Report 2021: The Heat Is On—A World of Climate Promises Not Yet Delivered; United Nations Environment Programme & UNEP DTU Partnership: Nairobi, Kenya, 2021; Available online: https://wedocs.unep.org/bitstream/handle/20.500.11822/36990/EGR21.pdf (accessed on 10 January 2023).
- Myhre, G.; Shindell, D.; Bréon, F.M.; Collins, W.; Fuglestvedt, J.; Huang, J.; Koch, D.; Lamarque, J.F.; Lee, D.; Mendoza, B.; et al. Anthropogenic and Natural Radiative Forcing. In Climate Change 2013: The Physical Science Basis. Contribution of Working Group I to the Fifth Assessment Report of the Intergovernmental Panel on Climate Change; IPCC: Paris, France, 2013; Available online: https://www.ipcc.ch/site/assets/uploads/2018/02/WG1AR5_Chapter08_FINAL.pdf (accessed on 10 January 2023).
- Oficina de la Presidencia del Gobierno México & 2030 Agenda Initiative Project of Deutsche Gesellschaft für Internationale Zusammenarbeit (GIZ) GmbH. Crunching Numbers: Quantifying the Sustainable Development Co-Benefits of Mexico’s Climate Commitments. Deutsche Gesellschaft für Internationale Zusammenarbeit (GIZ) GmbH. 2019. Available online: https://www.gob.mx/cms/uploads/attachment/file/513402/Crunching_Numbers_cobenefits_vf_reduc.pdf (accessed on 10 January 2023).
- United Nations (UN). Country Classification; World Economic Situation and Prospects 2014; Department of Economic and Social Affairs, UN: Harare, Zimbabwe, 2014; Available online: https://www.worldbank.org/en/country/mexico (accessed on 10 January 2023).
- World Bank (WB). The World Bank in Mexico; The World Bank: Washington, DC, USA, 2021; Available online: https://www.worldbank.org/en/country/mexico (accessed on 10 January 2023).
- Secretaría de Energía (SENER). Balance Nacional de Energía 2018; SENER: Mexico City, Mexico, 2019; Available online: https://www.gob.mx/sener/documentos/balance-nacional-de-energia-2018 (accessed on 10 January 2023).
- Secretaría de Medio Ambiente y Recursos Naturales (SEMARNAT). Inventario Nacional de Emisiones de Gases y Compuestos de Efecto Invernadero (INEGyCEI); SEMARNAT/INECC: Mexico City, Mexico, 2018; Available online: https://datos.abiertos.inecc.gob.mx/Datos_abiertos_INECC/Inventario_Nacional_de_Gases_de_Efecto_Invernadero/INEGyCEI_2017/INEGyCEI_1990-2017_IPCC_2006.xlsx (accessed on 10 January 2023).
- Abu-Eisheh, S.; Kuckshinrichs, W.; Dwaikat, A. Strategic planning for sustainable transportation in developing countries: The role of vehicles. Transp. Res. Procedia 2020, 48, 3019–3036. [Google Scholar] [CrossRef]
- Chatziioannou, I.; Alvarez-Icaza, L.; Bakogiannis, E.; Kyriakidis, C.; Chias-Becerril, L. A structural analysis for the categorization of the negative externalities of transport and the hierarchical organization of sustainable mobility’s strategies. Sustainability 2020, 12, 6011. [Google Scholar] [CrossRef]
- United Nations (UN). World Urbanization Prospects: The 2018 Revision; Department of Economic and Social Affairs, Population Division, UN: Harare, Zimbabwe, 2019; Available online: https://population.un.org/wup/Publications/Files/WUP2018-Report.pdf (accessed on 10 January 2023).
- Secretaría del Medio Ambiente de la Ciudad de México (SEDEMA). Inventario de Emisiones de la Zona Metropolitana del Valle de México 2018. Contaminantes Criterio, Tóxicos y Gases y Compuestos de Efecto Invernadero de Efecto Invernadero; Dirección General de Calidad del Aire, Dirección de Proyectos de Calidad del Aire, Secretaría del Medio Ambiente de la Ciudad de México: Mexico City, Mexico, 2021; Available online: http://www.sadsma.cdmx.gob.mx:9000/datos/storage/app/media/docpub/sedema/InventarioDeEmisionesZMVM2018.pdf (accessed on 10 January 2023).
- Petrauskiene, K.; Dvarioniene, J.; Kaveckis, G.; Kliaugaite, D.; Chenadec, J.; Hehn, L.; Pérez, B.; Bordi, C.; Scavino, G.; Vignoli, A.; et al. Situation Analysis of Policies for Electric Mobility Development: Experience from Five European Regions. Sustainability 2020, 12, 2935. [Google Scholar] [CrossRef]
- Bouton, S.; Hannon, E.; Haydamous, L.; Heid, B.; Knupfer, S.; Naucler, T.; Florian, N.; Nijssen, J.T.; Ramanathan, S. An Integrated Perspective on the Future of Mobility, Part 2: Transforming Urban Delivery; McKinsey Center for Business and Environment, McKinsey & Company: Sydney, Australia, 2017. [Google Scholar]
- Schneider, M.; Stenger, A.; Goeke, D. The electric vehicle-routing problem with time windows and recharging stations. Transp. Sci. 2014, 48, 500–520. [Google Scholar] [CrossRef]
- Felipe, A.; Ortuño, M.; Righini, G.; Tirado, G. A heuristic approach for the green vehicle routing problem with multiple technologies and partial recharges. Transp. Res. Part E Logist. Transp. Rev. 2014, 71, 111–128. [Google Scholar] [CrossRef]
- Keskin, M.; Çatay, B. Partial recharge strategies for the electric vehicle routing problem with time windows. Transp. Res. Part C Emerg. Technol. 2016, 65, 111–127. [Google Scholar] [CrossRef]
- Keskin, M.; Çatay, B.; Laporte, G. A simulation-based heuristic for the electric vehicle routing problem with time windows and stochastic waiting times at recharging stations. Comput. Oper. Res. 2021, 125, 105060. [Google Scholar] [CrossRef]
- Desaulniers, G.; Errico, F.; Irnich, S.; Schneider, M. Exact algorithms for electric vehicle-routing problems with time windows. Oper. Res. 2016, 64, 1388–1405. [Google Scholar] [CrossRef]
- Montoya, A.; Guéret, C.; Mendoza, J.E.; Villegas, J.G. The electric vehicle routing problem with nonlinear charging function. Transp. Res. Part B Methodol. 2017, 103, 87–110. [Google Scholar] [CrossRef]
- Zhang, S.; Gajpal, Y.; Appadoo, S.S.; Abdulkader, M.M.S. Electric vehicle routing problem with recharging stations for minimizing energy consumption. Int. J. Prod. Econ. 2018, 203, 404–413. [Google Scholar] [CrossRef]
- Afroditi, A.; Boile, M.; Theofanis, S.; Sdoukopoulos, E.; Margaritis, D. Electric vehicle routing problem with industry constraints: Trends and insights for future research. Transp. Res. Procedia 2014, 3, 452–459. [Google Scholar] [CrossRef]
- Goeke, D.; Schneider, M. Routing a mixed fleet of electric and conventional vehicles. Eur. J. Oper. Res. 2015, 245, 81–99. [Google Scholar] [CrossRef]
- Lin, J.; Zhou, W.; Wolfson, O. Electric Vehicle Routing Problem. Transp. Res. Procedia 2016, 12, 508–521. [Google Scholar] [CrossRef]
- Jie, W.; Yang, J.; Zhang, M.; Huang, Y. The two-echelon capacitated electric vehicle routing problem with battery swapping stations: Formulation and efficient methodology. Eur. J. Oper. Res. 2019, 272, 879–904. [Google Scholar] [CrossRef]
- Buldeo Rai, H.; Verlinde, S.; Macharis, C. Shipping outside the box. Environmental impact and stakeholder analysis of a crowd logistics platform in Belgium. J. Clean. Prod. 2018, 202, 806–816. [Google Scholar] [CrossRef]
- Pourrahmani, E.; Jaller, M. Crowdshipping in last mile deliveries: Operational challenges and research opportunities. Socio-Econ. Plan. Sci. 2021, 78, 101063. [Google Scholar] [CrossRef]
- Alharbi, A.; Cantarelli, C.; Brint, A. Crowd models for last mile delivery in an emerging economy. Sustainability 2022, 14, 1401. [Google Scholar] [CrossRef]
- Galindo-Muro, A.B.; Mora-Vargas, J.; Cedillo-Campos, M.G.; Regis-Hernández, F. A genetic algorithm approach for a truck and trailer routing problem in a loading/unloading bays application. In Advances in Soft Computing; Lecture Notes in Computer Science; Springer International Publishing: Cham, Switzerland, 2020; pp. 296–310. [Google Scholar]
- Thejasree, G.; Maniyeri, R. E-Bike System Modeling and Simulation. In Proceedings of the 2019 IEEE International Conference on Intelligent Systems and Green Technology (ICISGT), Visakhapatnam, India, 29–30 June 2019; pp. 9–95. [Google Scholar]
- Abagnale, C.; Cardone, M.; Iodice, P.; Strano, S.; Terzo, M.; Vorraro, G. Model-based Control for an Innovative Power-assisted Bicycle. Energy Procedia 2015, 81, 606–617. [Google Scholar] [CrossRef]
- Soong, W.L.; Miller, T.J.E. Field-weakening performance of brushless synchronous AC motor drives. IEE Proc.-Electr. Power Appl. 1994, 141, 331–340. [Google Scholar] [CrossRef]
- Cespi, R.; Galluzzi, R.; Ramirez-Mendoza, R.A.; Di Gennaro, S. Artificial Intelligence for Stability Control of Actuated In–Wheel Electric Vehicles with CarSim® Validation. Mathematics 2021, 9, 3120. [Google Scholar] [CrossRef]
- Basso, R.; Kulcsár, B.; Egardt, B.; Lindroth, P.; Sanchez-Diaz, I. Energy consumption estimation integrated into the electric vehicle routing problem. Transp. Res. Part D Transp. Environ. 2019, 69, 141–167. [Google Scholar] [CrossRef]
- Kara, I.; Kara, B.Y.; Yetis, M.K. Energy minimizing vehicle routing problem. In Proceedings of the International Conference on Combinatorial Optimization and Applications, Xi’an, China, 14–16 August 2007; Springer: Berlin/Heidelberg, Germany, 2007; pp. 62–71. [Google Scholar]
- Wang, S.; Liu, X. Energy minimization vehicle routing problem with heterogeneous vehicles. In Proceedings of the 2016 13th IEEE International Conference on Service Systems and Service Management (ICSSSM), Kunming, China, 24–26 June 2016; pp. 1–5. [Google Scholar]
- Wang, S.; Liu, M.; Chu, F. Approximate and exact algorithms for an energy minimization traveling salesman problem. J. Clean. Prod. 2020, 249, 119433. [Google Scholar] [CrossRef]
Disclaimer/Publisher’s Note: The statements, opinions and data contained in all publications are solely those of the individual author(s) and contributor(s) and not of MDPI and/or the editor(s). MDPI and/or the editor(s) disclaim responsibility for any injury to people or property resulting from any ideas, methods, instructions or products referred to in the content. |
© 2023 by the authors. Licensee MDPI, Basel, Switzerland. This article is an open access article distributed under the terms and conditions of the Creative Commons Attribution (CC BY) license (https://creativecommons.org/licenses/by/4.0/).