Article

Impact of the Internal Combustion Engine Thermal State during Start-Up on the Exhaust Emissions in the Homologation Test

by
Monika Andrych-Zalewska
1,
Zdzislaw Chlopek
2,
Jerzy Merkisz
3 and
Jacek Pielecha
3,*
1
Faculty of Mechanical Engineering, Wroclaw University of Science and Technology, Wybrzeze Wyspianskiego 27, 50-370 Wroclaw, Poland
2
Faculty of Automotive and Construction Machinery Engineering, Warsaw University of Technology, Narbutta 84, 02-524 Warsaw, Poland
3
Faculty of Civil and Transport Engineering, Poznan University of Technology, pl. M. Sklodowskiej-Curie 5, 60-965 Poznan, Poland
*
Author to whom correspondence should be addressed.
Energies 2023, 16(4), 1937; https://doi.org/10.3390/en16041937
Submission received: 17 January 2023 / Revised: 10 February 2023 / Accepted: 13 February 2023 / Published: 15 February 2023
(This article belongs to the Special Issue Challenges and Research Trends of Exhaust Emissions)

Abstract

:
Due to the increasingly restrictive exhaust emissions requirements from conventional vehicles, the internal combustion engine start-up seems to be most important part of engine operation. The period immediately after starting the engine is the time when the exhaust emissions are highest, thus, this aspect is currently subject to heavy analysis. The article evaluates the impact of the engine thermal state during its start-up for a Euro 5 emission class vehicle type approval test. The engine thermal state during start-up turned out to have a crucial influence (throughout the approval test) on the results of the hydrocarbons road emission (a difference of about 1500%) and the road emission of carbon monoxide (63%). The remaining road exhaust emission values were less sensitive to the thermal state of the engine during start-up—the nitrogen oxides emission value increased by 18% (for a cold start compared to a hot start), and the road fuel consumption (and thus the emission of carbon dioxide) increased by about 6%. In conclusion, the authors refer to technical solutions that may have a significant impact on reducing the exhaust emissions in the considered period of engine cold start.

1. Introduction

Insufficient temperature of the engine—and the catalytic reactor—is considered to be one of the main reasons for the increased exhaust emission of harmful compounds from spark-ignition engines, both in research tests of cars carried out on a chassis dynamometer as well as in tests in real operation, especially over short distances. This situation occurs primarily during an engine cold start and in the initial period of operation when the engine is still heating up.
The authors have been investigating this issue for many years, as evidenced by publications [1,2,3,4,5,6,7,8,9,10]. The biggest problem that currently needs to be solved in terms of CO (carbon monoxide) and HC (hydrocarbons) exhaust emissions from the SI engine, as confirmed by the conducted analyzes and tests, is exhaust emission reduction during engine start-up and the initial several dozen seconds of its operation. It was also found that it is advisable to study the impact of these phases of engine operation on the total amount of these compounds emitted by the engine. It seems particularly important to study this problem at low ambient temperatures, including at sub-zero temperatures. The performed tests have shown that the exhaust emission of carbon monoxide and hydrocarbons is much higher at engine cold start than at temperatures that are more typical for conducting such measurements. The design solutions used in currently produced vehicles and engines (mainly catalytic reactors in the current version and the method of regulating the composition of the fuel–air mixture during engine start-up and warm-up) are in most cases not adapted for exhaust emission reduction in these compounds during engine start-up.

2. Literature Review

The operational properties of combustion engines depend on their operating conditions [11]. The operating conditions of a combustion engine is determined by its rotational speed, load, and thermal state. Torque or net power can be taken as a measure of engine load. Of course, such a measure can also be the mean effective pressure, mean indicated pressure, fuel consumption rate, air consumption rate, or engine load control. The measure of the thermal conditions of a combustion engine is calculated from a set of temperatures of engine components and their operating factors. The thermal state parameter is usually adopted as a measure of the thermal state of the engine, for which the temperature of the engine oil or engine cooling liquid is most often used [11].
For an engine used to power a road vehicle, the operating state of the engine is determined by the driving speed, especially in terms of engine rotational speed and load, which depends on the motion resistance [12]. Therefore, the operational properties of internal combustion engines of vehicles are tested in conditions simulating traffic. For passenger cars and light trucks, these are driving tests carried out on a chassis dynamometer as well as in real driving conditions (RDE—Real Driving Emissions) [13]. For trucks and buses, their engines are tested on an engine dynamometer in tests [14], corresponding to the operating states of the engines in actual operation in the vehicle. These include both static and dynamic tests [15].
When the engine is heated to the state of stabilized operating conditions, its properties are independent of its thermal state. On the other hand, when starting a cold engine, its properties may be strongly dependent on its thermal state—primarily pollutant emissions, fuel consumption, general efficiency, and useful power [16,17,18,19,20,21,22,23,24,25,26,27].
Three main aspects are responsible for the internal combustion engines performance characteristics deterioration in the engine warming up phase. First, the operating processes are disturbed—mainly the fuel supply, and above all the combustion process [11]. The second reason for the engine performance deterioration during warm-up resulting from the previous one is the need to supply the engines with a richer mixture. Consequently, there is a need to feed engines with a richer mixture, and this is the third reason for the deterioration of the performance of internal combustion engines during the warm-up phase. This leads to an increase in fuel consumption and an increase in exhaust emissions, primarily of substances with oxygen-reducing properties—mainly organic compounds and carbon monoxide, as well as particulate matter [16,23,26,27]. The third reason for the engine performance deterioration during the warm-up period is the low temperature of the exhaust aftertreatment systems, where low temperature lowers their efficiency [11,18,19,20,22,24].
The extent to which the engine thermal state affects its properties is strongly dependent on the engine type, such as whether it is a spark-ignition or a compression-ignition engine. It was estimated that in the case of spark-ignition engines, this effect is more significant [16,18,20,23,24,25].
Many papers concerning the operational properties of internal combustion engines in the warm-up phase are present in the scientific literature. These papers mainly concern spark-ignition engines, however, the operational properties of these engines are much more sensitive to the thermal state than in the case of compression-ignition engines [28].
Thus papers [12,16,17,18,21,23,27] approach this issue for spark-ignition engines.
The increase in the fuel dose during the engine cold start and the low temperature of the catalytic converter were recognized as the main causes responsible for the significant increase in the exhaust emission of hydrocarbons [16]. It was shown that when using gaseous fuels, the sensitivity of exhaust emissions to engine thermal state was significantly lower.
A simulation of urban driving, described in [2], with a vehicle powered by a spark ignition engine indicated an increase in the exhaust emissions of carbon monoxide (by approx. 41%) and hydrocarbons (by about 200 ppm) for the first 3 km of the test route travelled after an engine cold start.
The results of exhaust emission and fuel consumption tests in paper [12] were obtained during real operating conditions simulation of a passenger car. The test was carried out on a chassis dynamometer with the use of PIMOT driving simulation tests developed by the Automotive Industry Institute (PIMOT) based on the empirical tests of the passenger car speed process in real driving conditions in traffic jams, urban driving without congestion, rural driving, and high-speed driving (on motorways and highways). The tests were carried out in four repetitions of each of the vehicle speed processes and treated as stochastic processes. A Honda Civic car with a spark-ignition engine was used for the tests. A significant impact was found in all traffic conditions on the exhaust emission of mainly hydrocarbons (about 35%) and carbon monoxide (about 25%). Good repeatability of the determined values was found by comparing test results in individual repetitions of speed processes (difference of about 1%).
In [21], research was conducted on the impact of engine oil and cooling liquid temperature control on the exhaust emissions and fuel consumption of an engine during a cold start. In an idle engine test (for ambient temperature of 20 °C), the cooling liquid temperature in a modified cooling system configuration (using an electric pump to circulate the cooling liquid) reached a temperature of 60 °C about 40% sooner than for a non-modified system. The maximum cooling liquid temperature reached after 600 s of idle operation was 108 °C compared to 80 °C for the base configuration. The modified cooling system also speeds up the heating of the engine oil by a factor of 4 (54 °C compared to 29 °C at 600 s mark).
The influence of engine thermal state management on its properties was investigated in [23]. As a result of empirical research with various engine thermal management systems, it was found that the engine warm-up time could be shortened by about 30% and, consequently, the increase in both exhaust emissions and fuel consumption in this phase of engine operation could be reduced (about 20%).
Exhaust emission tests of a diesel engine Euro 6 vehicle equipped with an oxidation catalyst, a catalytic diesel particulate filter, and a selective nitrogen oxides reduction reactor were discussed in [24]. The test plan included NEEDC, WLTC, and CADC tests performed on a chassis dynamometer for various thermal conditions of the engine. For the engine hot start, hydrocarbon and carbon monoxide emissions were found to be 45–75% lower in the initial phases of testing compared to the cold start. The emission of nitrogen oxides for the WLTC test for engine hot start was greater by about 20% (compared to a cold start), and for the CADC test the difference was about 38%. The particle number value in the WLTC test for a cold start was about 10 times higher than for a hot start (6 × 10⁹ 1/km and 6 × 10⁸ 1/km, respectively).
The authors of [13] conducted an analysis of the impact of engine start-up during various stages of engine temperature change (cold, intermediate, and hot start-up), concerning the useful power, fuel consumption, and exhaust emissions from a compression-ignition engine. Empirical studies were carried out in static conditions at engine rotational speeds of 1500 min–1 and 2000 min–1. It was found that the cold engine start-up phase was longer than for the intermediate temperature. Warming up the oil by about 10 °C shortened the heating of the coolant. During the cold start-up phase, as the coolant temperature increased from 25 °C to 60 °C, the specific fuel consumption decreased by 10%. In the intermediate temperature start-up phase, when the coolant temperature reached 70 °C, road emission of nitrogen oxides increased by about 25%.
The solutions used in the exhaust system, cooling system, and lubrication system and their impact on fuel consumption and exhaust emissions in the NEDC test during the start-up of a cold turbocharged diesel engine were the subject of article [26]. The authors studied the effectiveness of waste heat recovery from exhaust gases immediately after engine start-up in order to accelerate engine oil heating. Significant reductions in fuel consumption (about 2%) and exhaust emissions (CO2—2.2%, CO—4.4%, HC—4.7%) during engine warm-up have been demonstrated by the proper utilization of the waste heat.
In the JCR (Journal Citation Reports) report [27], a review of works on the impact of passenger car engine heating in the RDE test was composed. The purpose of the report is to provide a rationale for the discussion on the inclusion of a cold start in the RDE test procedure. For this purpose, two separate analyzes are presented. First, an overview of the management of available information on the typical travel distance and frequency of cold starts in Europe was conducted. The results of this analysis could be used to determine the weighting factor for the nitrogen oxides exhaust emissions from a cold start versus warm start engine during the urban portion of the RDE test. Second, a scenario analysis was carried out that investigated the effect of cold starts and modification of the RDE test results on the calculated nitrogen oxide emissions.
Papers [18,19,20,22] consider the problem of efficiency of catalytic reactors for spark-ignition engines in the warm-up phase.
The analysis of catalytic reactor efficiency during a spark ignition engine cold start was described in [18]. The paper proposed a method of controlling the heating of the catalytic reactor. As a result of empirical research, the reactor operating temperature was increased from 40 °C to 90 °C, which was achieved by increasing the exhaust gas temperature in the system from 150 °C to 250 °C after 60 s from the engine start.
In papers [19,20], the authors reviewed the literature on the control of the thermal state of catalytic reactors, the aim of which was to significantly shorten their heating time and thus reduce exhaust emissions. The use of pre-reactors, secondary air injection, and electrically heated reactors was considered [19]. The use of insulating materials was also discussed [20], as they allow to reduce heat dissipation by about 90%, which increases the reactor efficiency from 80% to 95%.
The problem of catalytic reactor efficiency to reduce exhaust emissions from spark-ignition engines was considered in [22]. The article presented research on the impact of catalytic reactor parameters, both geometrical and their chemical composition, on the efficiency of reactors during the warm-up process of internal combustion engines.
The planned introduction of the Euro 7 emission norm, which would in practice mean an elimination of internal combustion engines, is a great challenge for modern combustion engine designs. This emission norm is likely to come into force in 2025, and fortunately in a relaxed form compared to the original assumptions. It is also believed that the emission limits in Euro 7 will not be lower than in Euro 6e. Engines will have to comply with the norm at cold start, during short periods of operation and in real-life operating conditions (in the RDE test).
The following changes to the design of combustion engine technologies and refined operation strategies are envisaged as a way to meet Euro 7:
  • Direct injection: multi phases, UHP > 35 (50+) MPa;
  • Extended Miller and Atkinson cycles;
  • Dethrottling: VVT and VVL;
  • Combined EGR; water injection;
  • Combined boosting (turbocharging; electric booster);
  • VCR;
  • Homogeneous and/or lean mixture;
  • HCCI;
  • Thermal management;
  • 48 V mild HEV (additionally 20–30 kW);
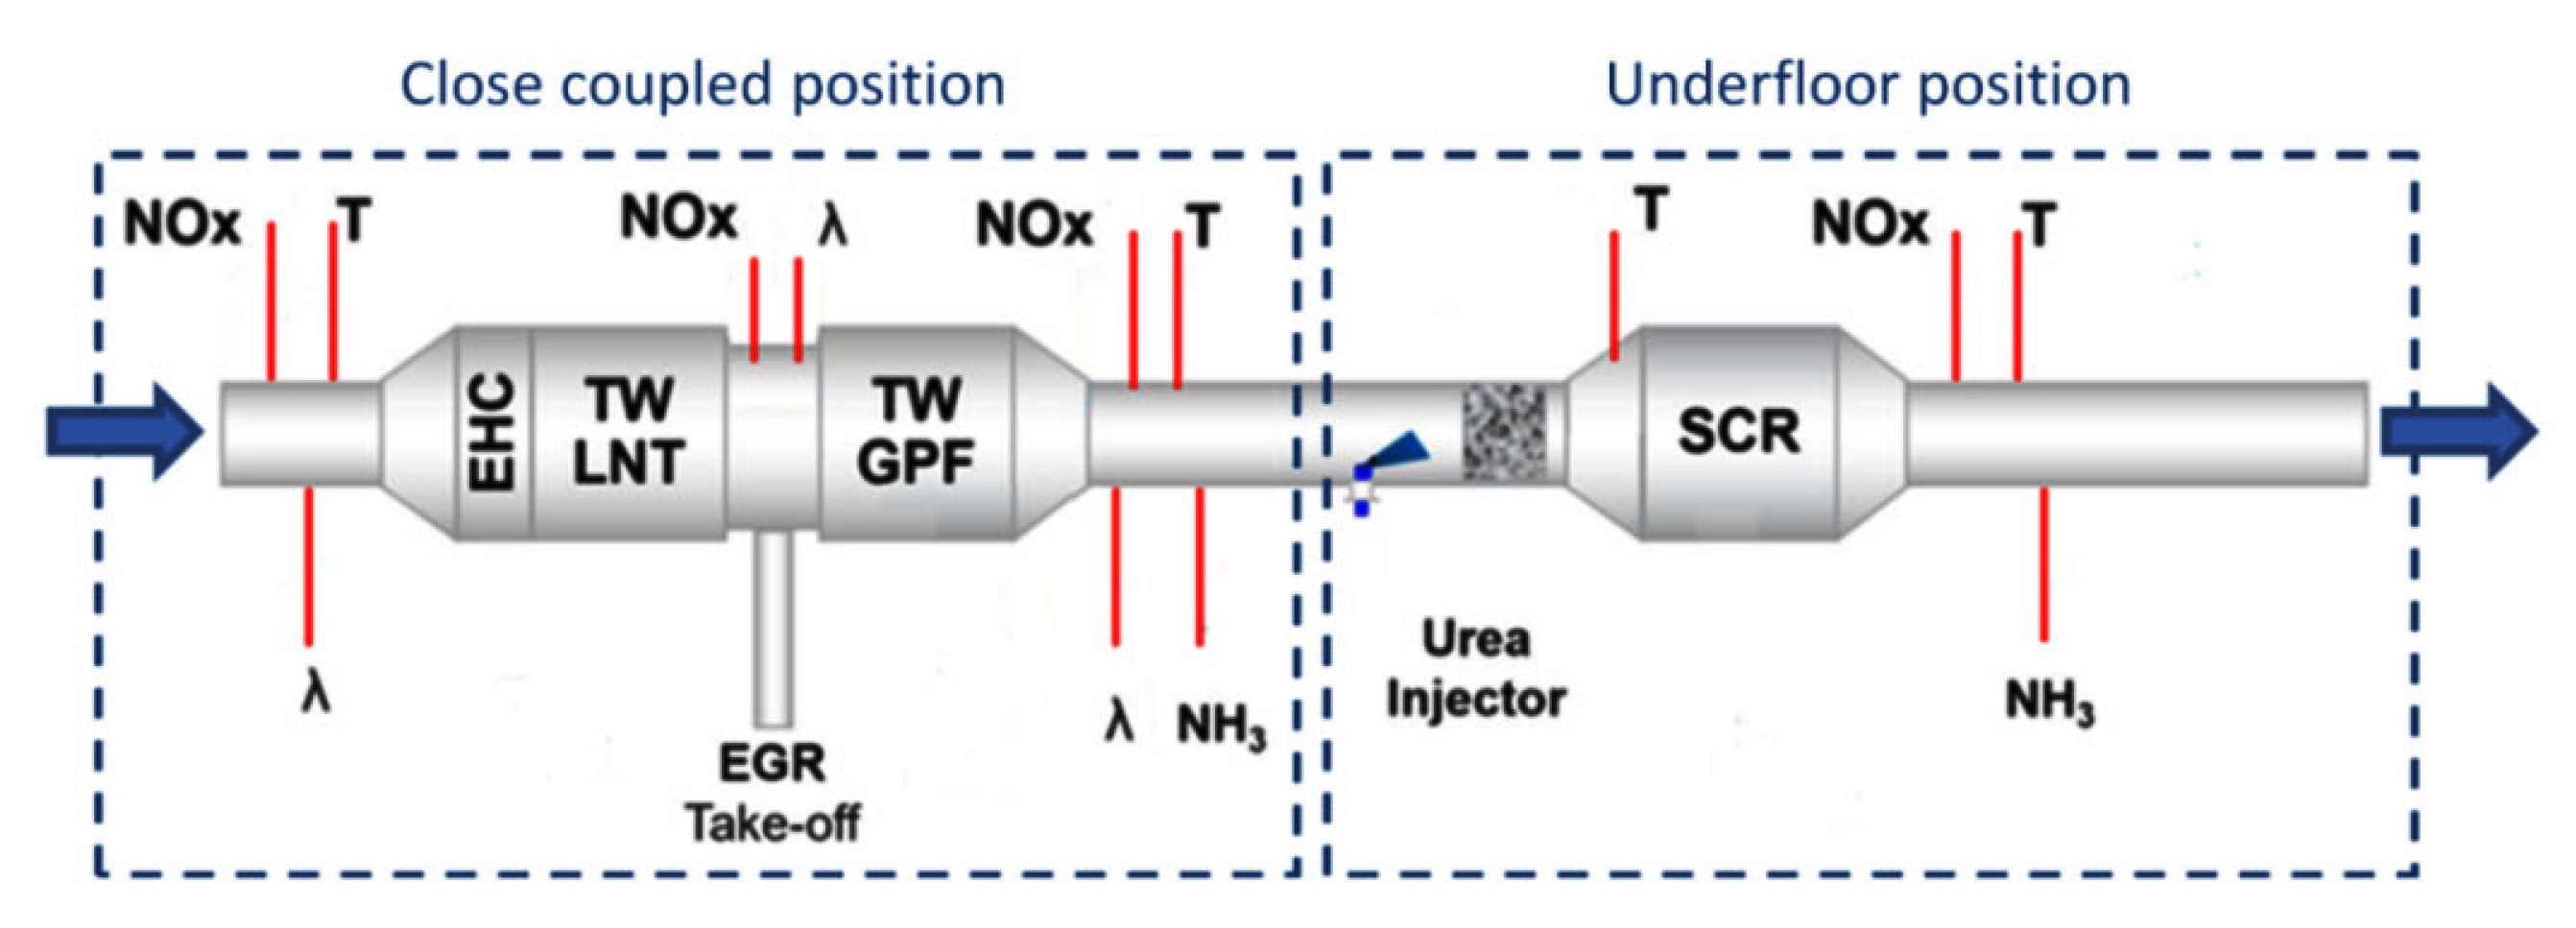
  • Advanced exhaust aftertreatment system.
Great emphasis must be placed on highly advanced and sophisticated aftertreatment systems, including an electrically heated catalytic converter (EHC) system, in order to meet the future Euro 7 emission norms (Figure 1).
An interesting solution proposed by the Authors is the concept of using a specifically designed internal catalyst, aimed at reducing the exhaust emission of toxic gas components and fuel consumption, as well as determining the best method of selection and placement of the catalytic layer. It is expected that the finished product would reduce the exhaust emission by about 20–30% [8]. The proposed solution is mainly intended to improve the combustion quality of internal combustion engines used in hybrid and electric vehicles, thus enabling them to meet the more demanding emission norms. However, it is possible to use this solution in traditional vehicles powered by an internal combustion engine, which could result in an improvement in the exhaust gas quality of the already existing vehicle models.

3. Research Methodology

The aim of the research was to assess the impact of internal combustion engine heating on exhaust emissions and fuel consumption. The tests were performed in the NEDC (New European Driving Cycle) test on a chassis dynamometer. The tests were performed for the start of the unheated engine (after the engine had cooled down for one day), and the test was then directly performed for the start of the heated engine. The test vehicle was a Porsche Macan passenger car with a four-cylinder spark-ignition engine The technical characteristics of the vehicle drive are shown in Table 1. The car, with a mileage of 8500 km, meets the requirements of the Euro 6 standard.
All emissions tests at the vehicle level were conducted in an air-conditioned emissions laboratory on a chassis dynamometer. This vehicle emissions testing facility is equipped with a 48-inch, single-roller two-wheel drive chassis dynamometer and a range of regulated emissions quantification equipment. The specification of the above-mentioned equipment meets the requirements of the EU legislation regarding exhaust emission testing (Directive 2007/46/EC—approval of motor vehicles and their trailers, and of systems, components, and separate technical units intended for such vehicles).
The laboratory was equipped with analyzers for measuring diluted and undiluted exhaust gases. The concentration of the measured exhaust components (CO, HC, NOx) was carried out using analyzers compliant with the requirements, whose characteristics are given in Table 2. The number of emitted particles was determined using a particle counter in accordance with the requirements of PMP (Particle Measurement Programme).
The exhaust emissions tests described in the article were for results obtained in NEDC tests on a chassis dynamometer. In doing so, the requirements in accordance with the requirements of the European Commission were met. The vehicle was seeded with the same fuel (5% biocomponents). The chassis dynamometer was equipped with an asynchronous AC motor (roller drive), a fan for cooling the vehicle with a flow rate proportional to the speed of the vehicle. The analyzers were calibrated and had valid approval for use. The particle counter, equipped with a dilution and thermal casing system, provided measurement of particles with dimensions of 19 nm and above.

4. Results and Discussion

Results of the empirical tests of the vehicle are shown in Section 4 and Section 5. Figure 2 presents the driving speed of the car in the NEDC test with a cold and hot engine start. The NEDC test consists of four driving phases corresponding to urban driving—UDC (Urban Driving Cycle) and EUDC (Extra Urban Driving Cycle) [13].
The vehicle speed curves with a cold and hot engine start-up had a very good repeatability, which proves that the tests were performed precisely. The vehicle speed characteristics were filtered using a second degree Savitzky–Golay filter in order to reduce the high frequency noise contribution.
The novelty of the presented research is identifying the impact of the engine thermal condition at its start-up on the exhaust emission intensity and the fuel mass consumption intensity. In comparison, in literature, only the results of the average road emission of these compounds in tests were presented. Thanks to the analysis of exhaust emission intensity, it was possible to identify clear differences in the initial and later parts of the test, in which, for the cold engine start-up, at least partial warming up was already observed.
The exhaust emission intensity curves of carbon monoxide, hydrocarbons, and nitrogen oxides for the NEDC test with cold engine start-up and hot engine start-up were obtained (Figure 3, Figure 4 and Figure 5), along with the particle number intensity curve (Figure 6). The comparison of carbon monoxide exhaust emission rates for a cold and hot engine is ambiguous (Figure 3). More unambiguous results were possible to obtain for averaged values, which was done in chapter 5.
In the case of the hydrocarbon emission (Figure 4), the influence of the engine thermal state was very strongly visible. After starting the engine, the hydrocarbon emission rate was much higher for the engine cold start, while for a warm engine, the hydrocarbon exhaust emission significantly increased in the EUDC test when the engine was under a heavier load than in the UDC test.
Figure 4. Hydrocarbon exhaust emissions (EHC) for cold and hot engine start.
Energies 16 01937 g004
In the case of the nitrogen oxides exhaust emission (Figure 5), the impact of the engine thermal state in the first UDC test was clearly visible when the catalytic reactor was not heated and, consequently, the efficiency of the catalytic reduction of nitrogen oxides was low. The difference in the particle number exhaust emission intensity (Figure 6) was very large for the UDC tests—the particle number for the hot engine start-up was much lower. At the same time, the particle number was higher for the hot engine start-up in the EUDC test, i.e., under high engine load conditions.
Figure 5. Nitrogen oxides exhaust emissions (ENOx) for cold and hot engine start.
Energies 16 01937 g005
Figure 6. Particle number exhaust emissions (EPN) for cold and hot engine start.
Energies 16 01937 g006
Figure 7 shows the carbon dioxide emission data for the NEDC test with a cold and hot engine start. The carbon dioxide exhaust emissions for the cold and hot engine start-up did not differ significantly.
Figure 7. Carbon dioxide exhaust emissions (ECO2) for cold and hot engine start.
Energies 16 01937 g007
Figure 8 shows the fuel mass consumption data for the NEDC test with the cold and hot engine start-up. The similarity in carbon dioxide exhaust emission could be confirmed by comparing that data with the fuel mass consumption rate data as this parameter also showed little difference between the cold and hot engine start.
Figure 8. Mass of fuel consumed (Gf) for cold and hot engine start.
Energies 16 01937 g008

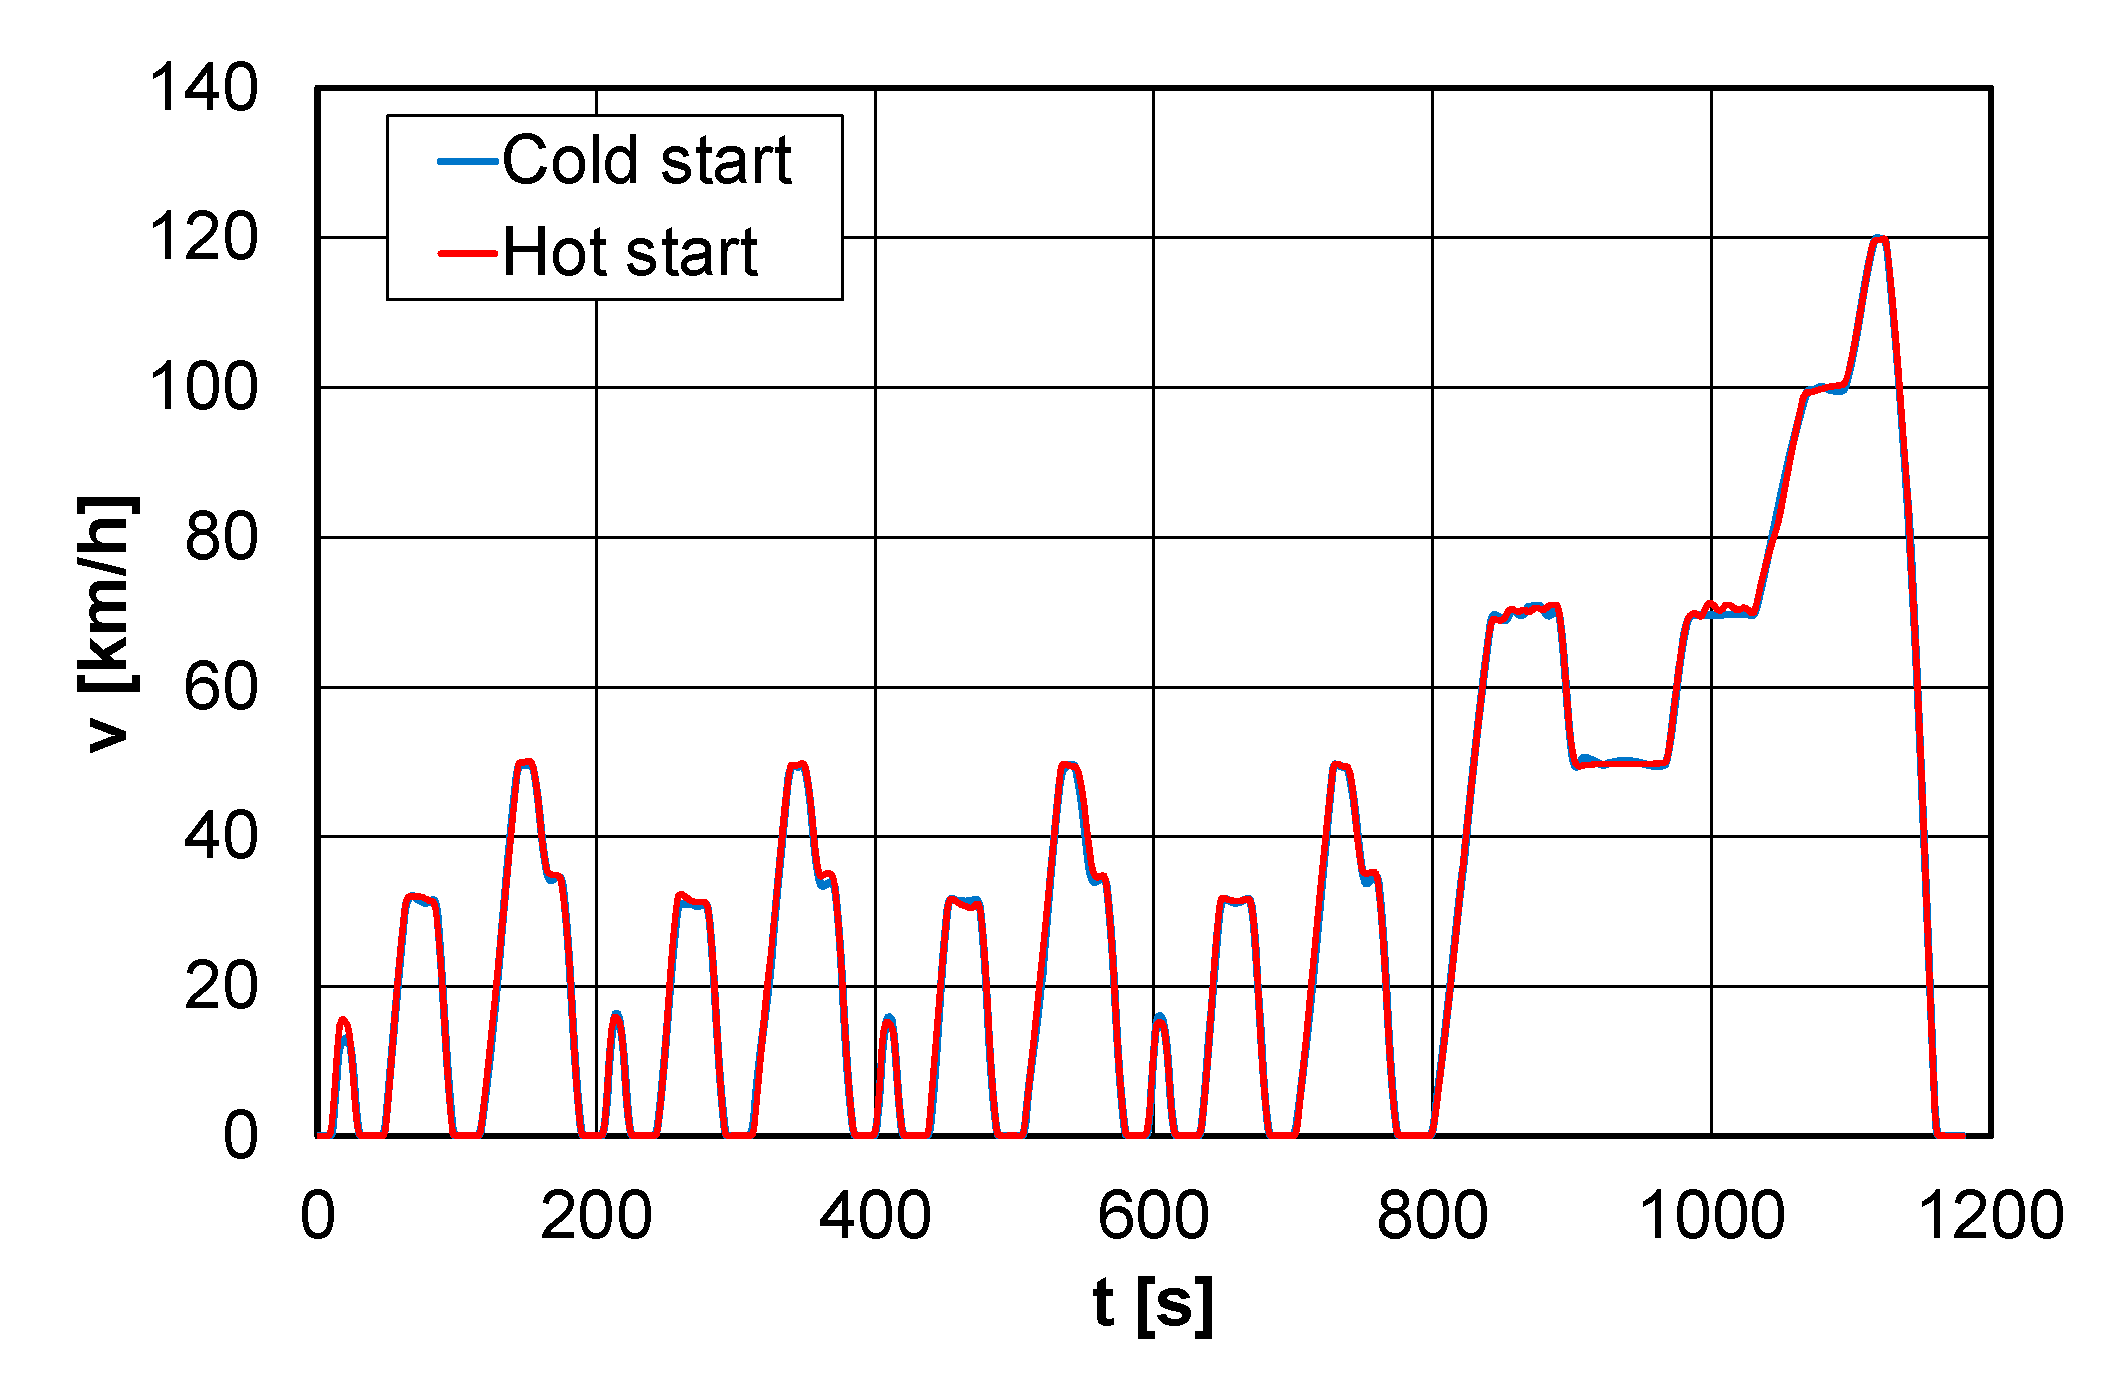
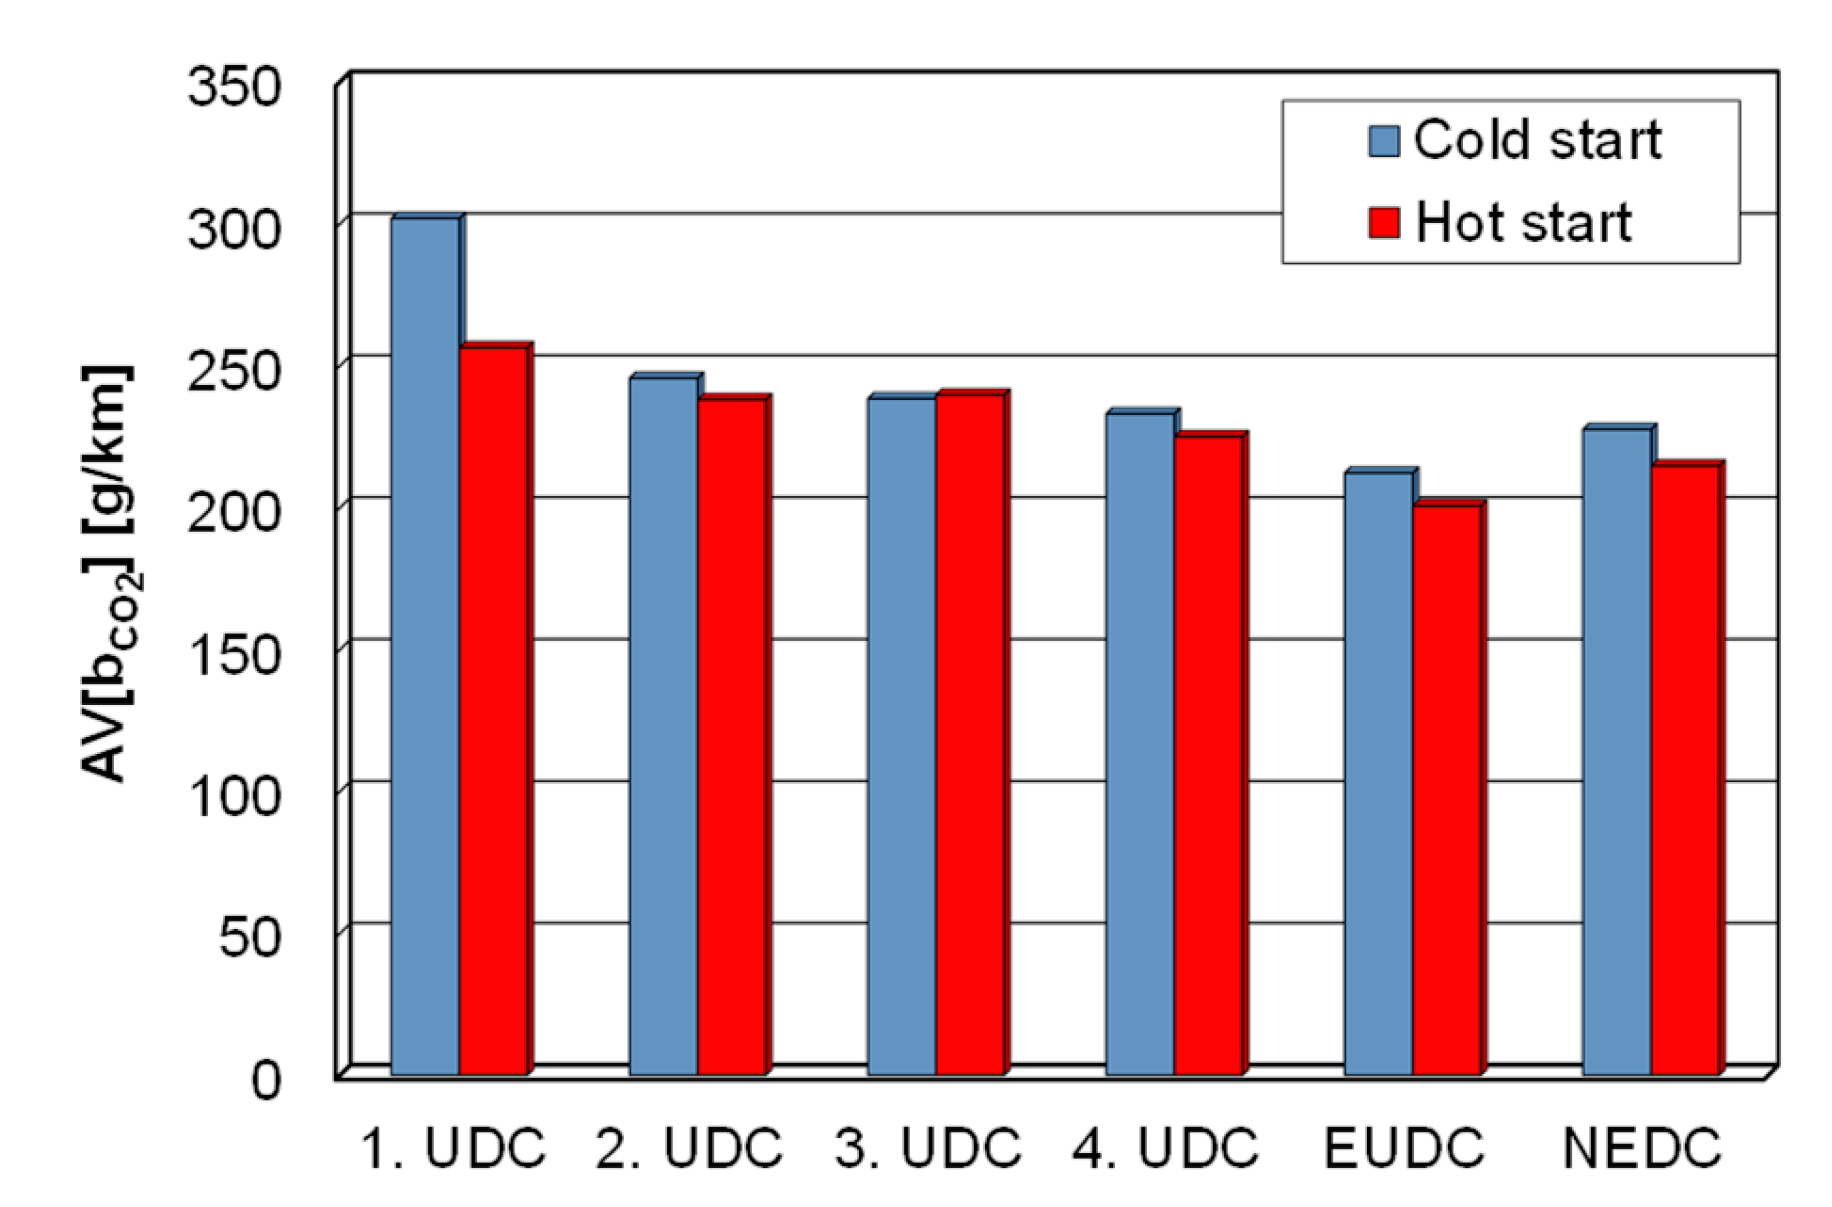
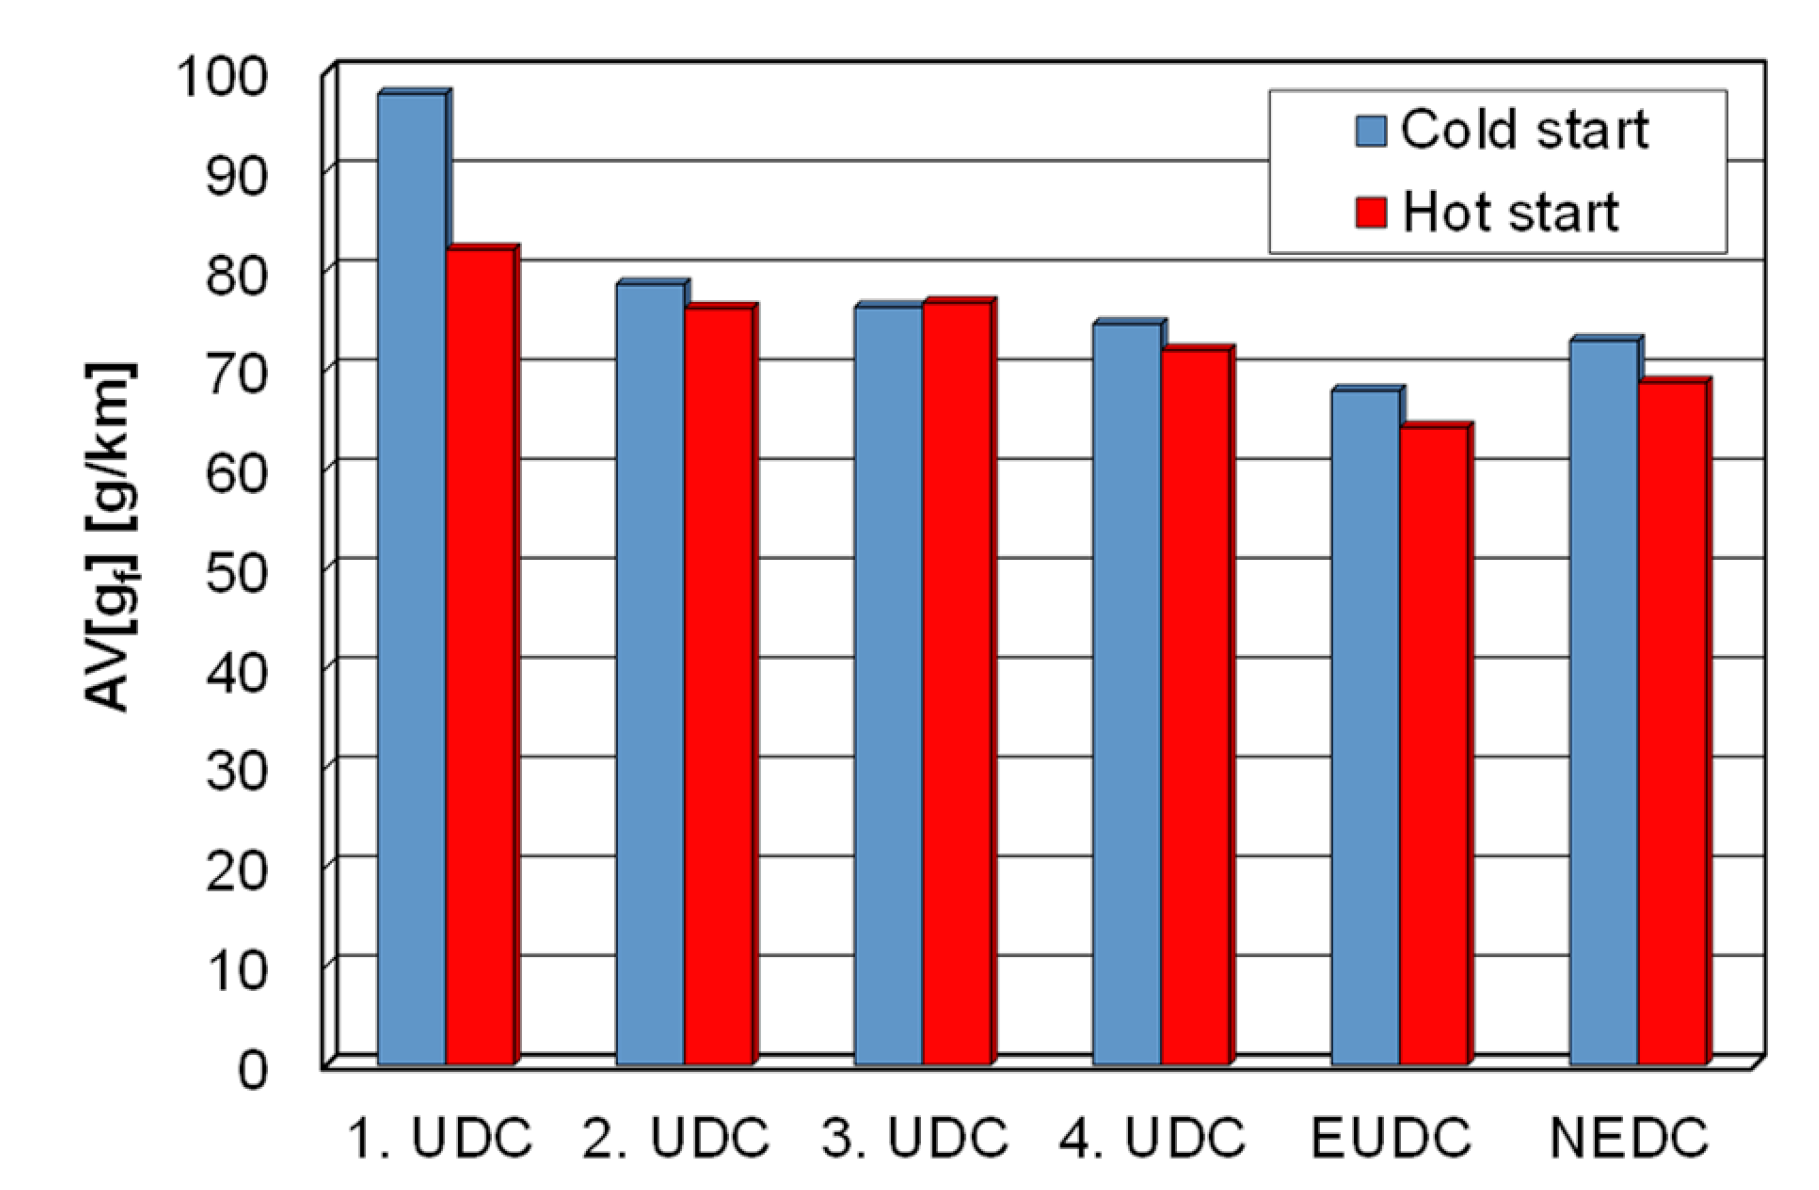
5. Analysis of the Empirical Tests Results for a Car in NEDC Tests

The test results analysis concerned the mean values in the individual test phases and in the whole NEDC test for parameters such as vehicle travel speed and road emissions of gaseous components, road emissions of particulates, and fuel mass consumption. The mean values of the road emission of both gaseous compounds as well as the number of particles were determined based on the obtained data of exhaust emission relative to the distance traveled by the vehicle.
The mean vehicle travel speed over the time period “b−e” was as follows:
A V [ v ] b e = 1 / t b e t b t e v ( t ) d t
where: tb−e–duration of the time interval “b−e”.
Therefore, the distance travelled by the vehicle in the time interval “b−e” was as follows:
L b e = A V [ v ] b e t b e
The mean road exhaust emission value “y” in the time interval “b−e” was as follows:
A V [ b y ] b e = 1 / t b e t b t e E y ( t ) d t
The mean road exhaust emission value of particle number in the time interval “b−e” was as follows:
A V [ b y P N ] b e = 1 / t b e t b t e E P N ( t ) d t
where: AV—average value operator, v—vehicle speed, t—time, E—exhaust emission intensity/particle number intensity, b—road exhaust emission/road emission of particle number.
These data were analyzed and compared (Figure 9, Figure 10, Figure 11, Figure 12, Figure 13, Figure 14 and Figure 15).
The mean speed values for cold and hot engine start were obtained for all the test phases and were very similar throughout the test (Figure 9).
Figure 9. Average vehicle speed (AV[v]) in four parts as well as in the NEDC test for cold and hot starts.
Energies 16 01937 g009
For mean road emission of carbon monoxide (Figure 10), a very large difference in values occurred primarily in the first phase of the UDC test—for the start-up of a cold engine, this value was almost five times greater than for the start-up of a heated engine. Therefore, the mean road emission value of carbon monoxide in the entire NEDC test was also clearly higher for the cold engine start-up.
Figure 10. Average carbon monoxide emissions (AV[bCO]) in four parts as well as in the NEDC test for cold and hot starts.
Energies 16 01937 g010
The difference in the mean road emission of hydrocarbons was even greater than it was for carbon monoxide (Figure 11). The impact that a cold engine start has on exhaust emissions of hydrocarbons can be clearly seen.
Figure 11. Average hydrocarbons emissions (AV[bHC]) in four parts as well as in the NEDC test for cold and hot starts.
Energies 16 01937 g011
The mean road exhaust emission for cold engine start-up was also significantly higher in the first phase of the UDC test in the case of nitrogen oxides (Figure 12), although the lower engine temperature normally favors the reduction in nitrogen oxide emissions. The decisive factor in this case, however, was the low efficiency of the unheated catalytic reactor.
Figure 12. Average nitrogen oxides emissions (AV[bNOx]) in four parts as well as in the NEDC test for cold and hot starts.
Energies 16 01937 g012
The greatest change in exhaust emissions was found for the number of particles (Figure 13). In the individual phases of the UDC test, the mean road emission value of the particle number was higher for the cold engine start, but a different relationship was observed in the case of the EUDC test and the entire NEDC test.
Figure 13. Average particle number emissions (AV[bPN]) in four parts as well as in the NEDC test for cold and hot starts.
Energies 16 01937 g013
The effect of cold starts on average road emissions of carbon dioxide (Figure 14) and road fuel mass consumption (Figure 15) were very similar. The biggest difference occurred in the first phase of the UDC test.
Figure 14. Average carbon dioxide emissions (AV[bCO2]) in four parts as well as in the NEDC test for cold and hot starts.
Energies 16 01937 g014
Figure 15. Average fuel mass consumption (AV[gf]) in four parts as well as in the NEDC test for cold and hot starts.
Energies 16 01937 g015
Figure 16 shows the relative decrease in the road gaseous emission values, the particle number emissions, and the road mass fuel consumption in the NEDC test for the warm engine start-up, relative to these values for the cold engine start-up.
The relative decrease in the individual quantities—x is defined as follows:
δ = x C x H x H
where the subscript “C” signifies a cold engine start, and the subscript “H” signifies a hot engine start.
Figure 16. The relative change (δ) of the measured road emissions, the road number of particles emitted, and the road fuel mass consumption in the NEDC test for a hot engine start in relation to those values for a cold engine start.
Energies 16 01937 g016
The greatest relative reduction as a result of a hot engine start by far was found for hydrocarbons—at almost 1500% less emission than for a cold start. For particulate matter, the increase in the mean road emission of particle number was negative. The impact of starting a cold engine on the mean road emission of carbon dioxide and the mean road fuel mass consumption was small—equal to only about 6%.

6. Conclusions

The article presents a comparison of exhaust emission results for vehicles equipped with spark-ignition engines. The test object was a modern engine meeting the Euro 6 emission standard, however, the environmental performance of even such an engine is strongly dependent on the starting conditions. The novelty, as well as the distinguishing feature of the conducted research, was the assessment of the exhaust emission intensity during cold and hot engine start. Such values were not found in other publications, and the conclusions were typically based on the final road emission results.
The impact of the cold engine start on the engine performance, both in research conducted by the Authors as well as the research found in the scientific literature, provided the basis for the following conclusions:
  • The cold engine start was found to have a significant impact on the engine’s operational and emission parameters for spark ignition engines.
  • The most important aspects responsible for the increase in fuel consumption and the exhaust emissions for cold engine starts, especially aspects with reducing properties in relation to oxygen, are the fact that the engine was supplied with richer mixtures due to disturbances in the power supply process and—even more so—the combustion process. In addition, the increased exhaust emission was favored by the low temperature of the exhaust aftertreatment systems. Even in the case of nitrogen oxides emission, where the low engine temperature favors a reduction in forming nitrogen oxides, the low temperature of the exhaust aftertreatment systems turned out to be decisive, resulting in the overall exhaust emissions being higher.
  • Starting a cold engine has the greatest impact on the increase in the exhaust emissions of organic compounds, nitrogen oxide, and particulate matter, especially the number of particles.
The specific conclusions from the conducted research, in particular regarding the comparison of exhaust emission intensity and their final values, were as follows:
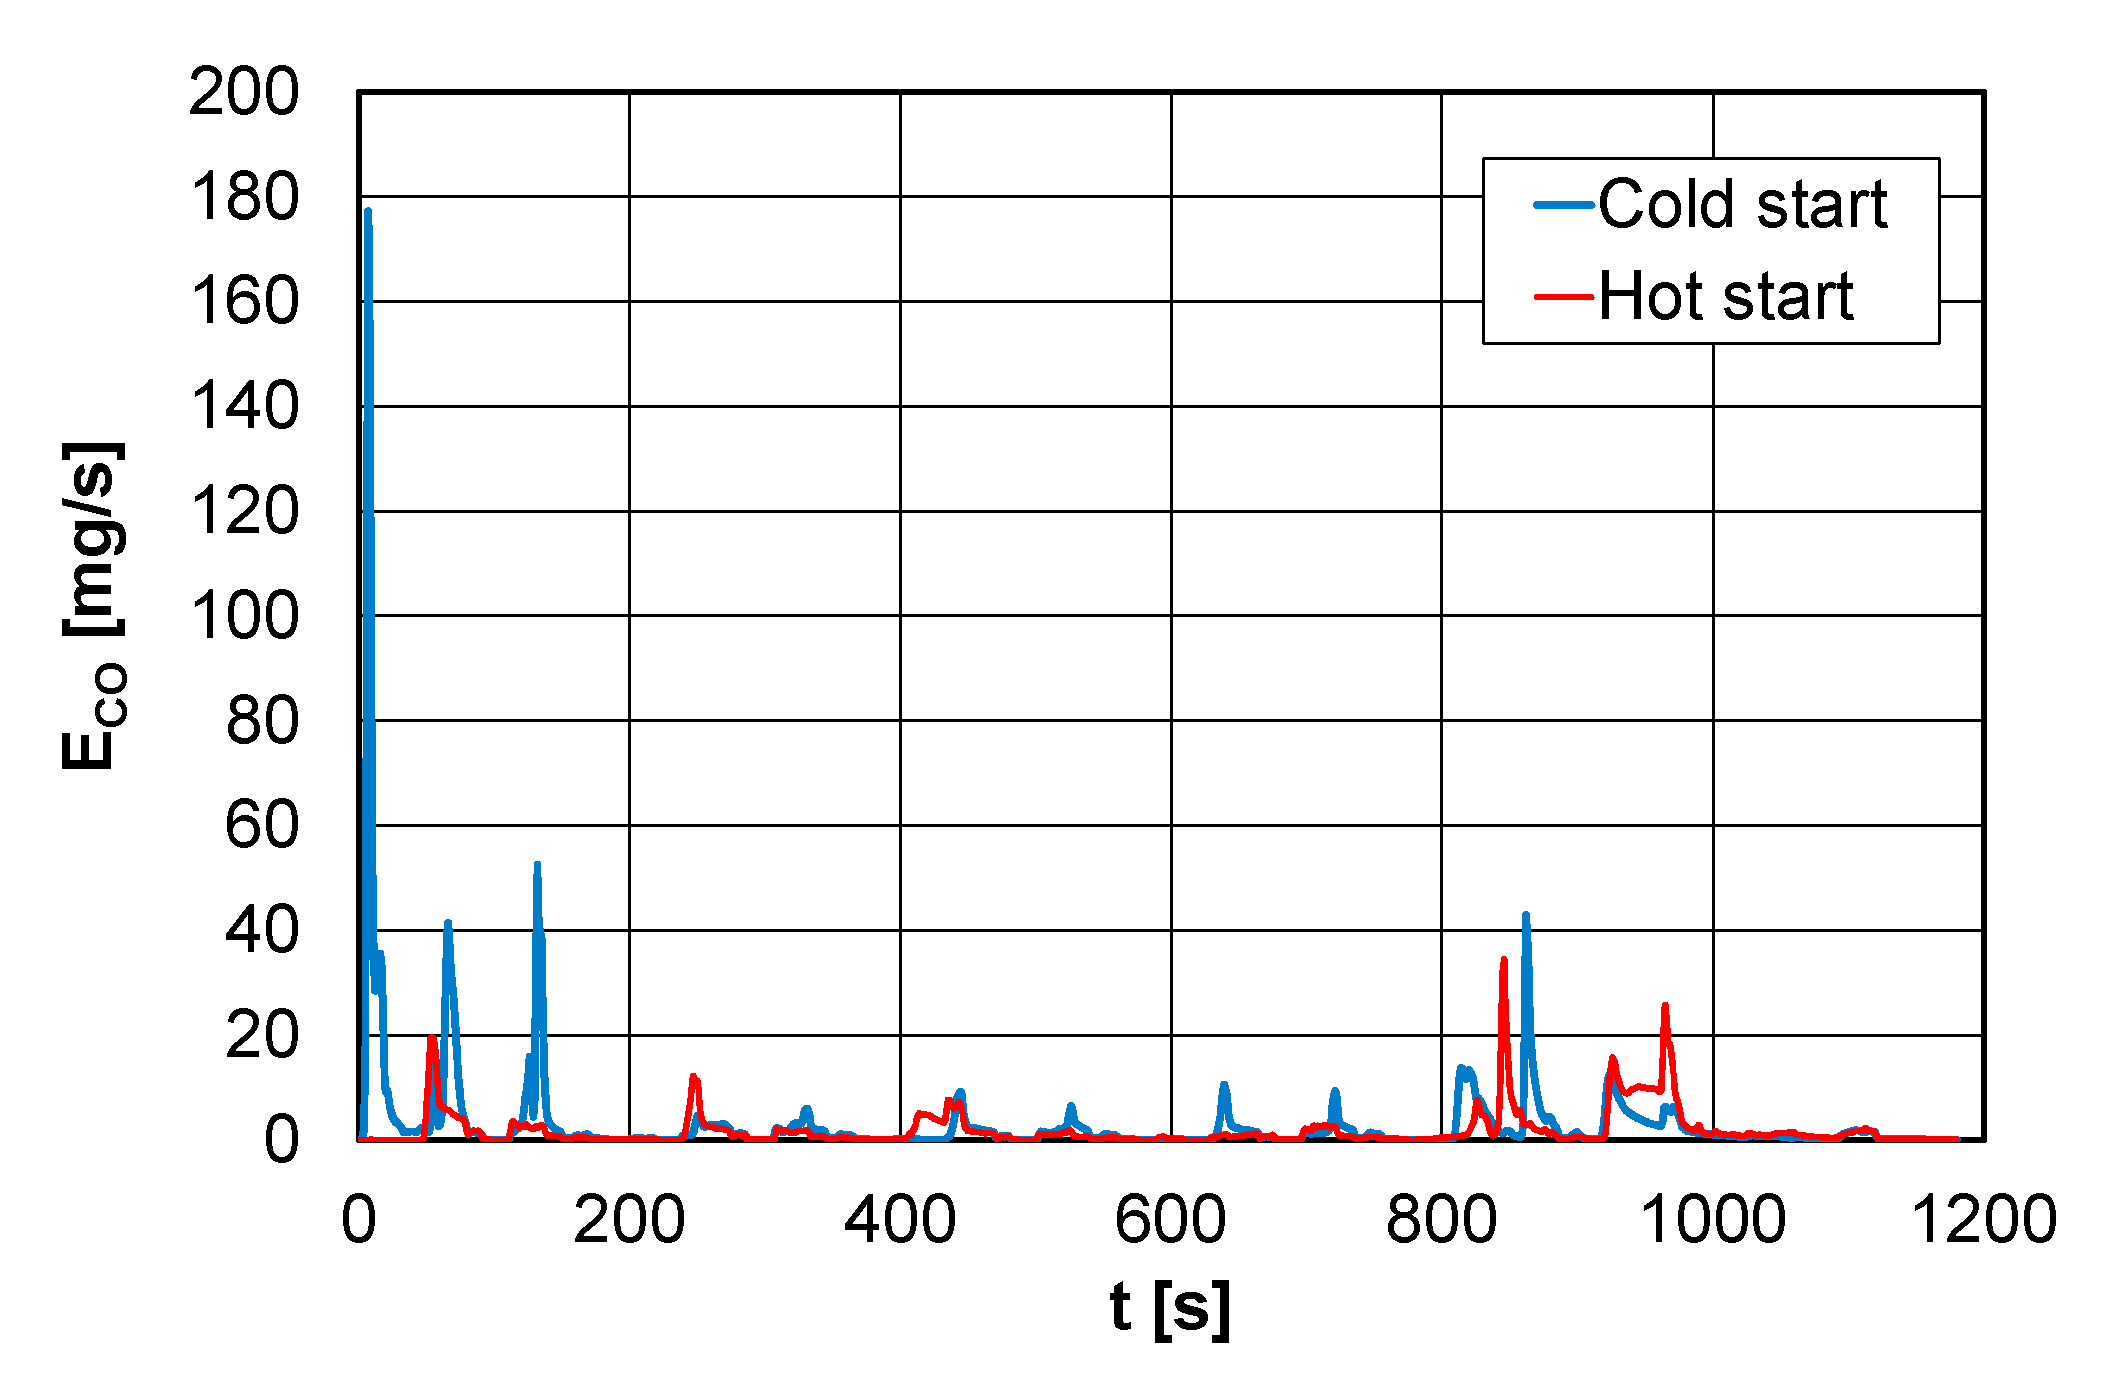
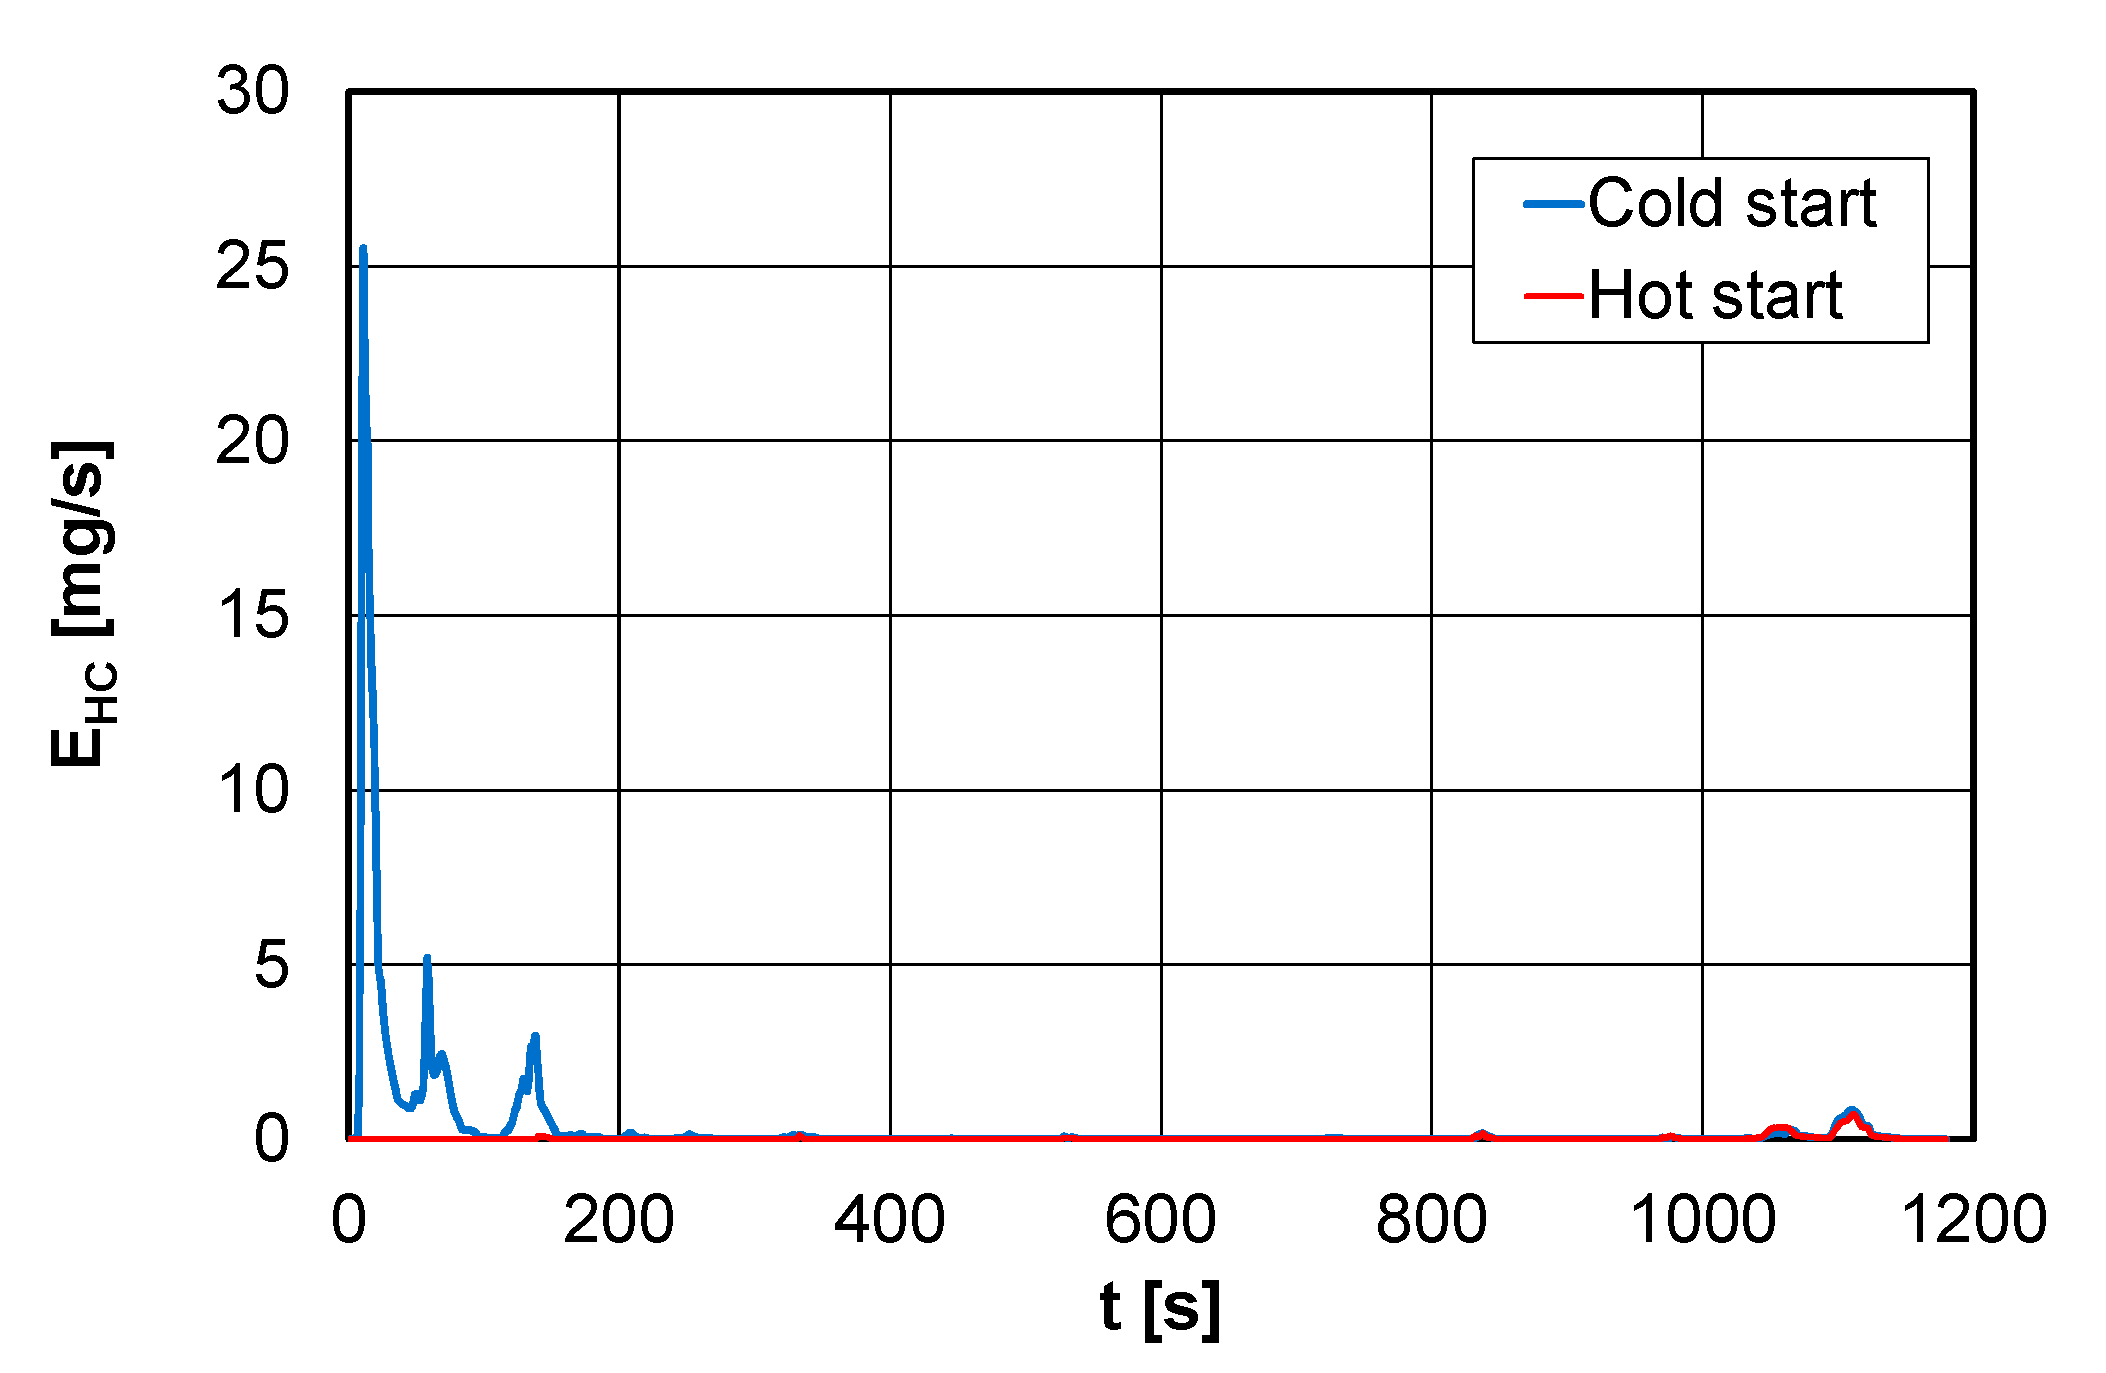
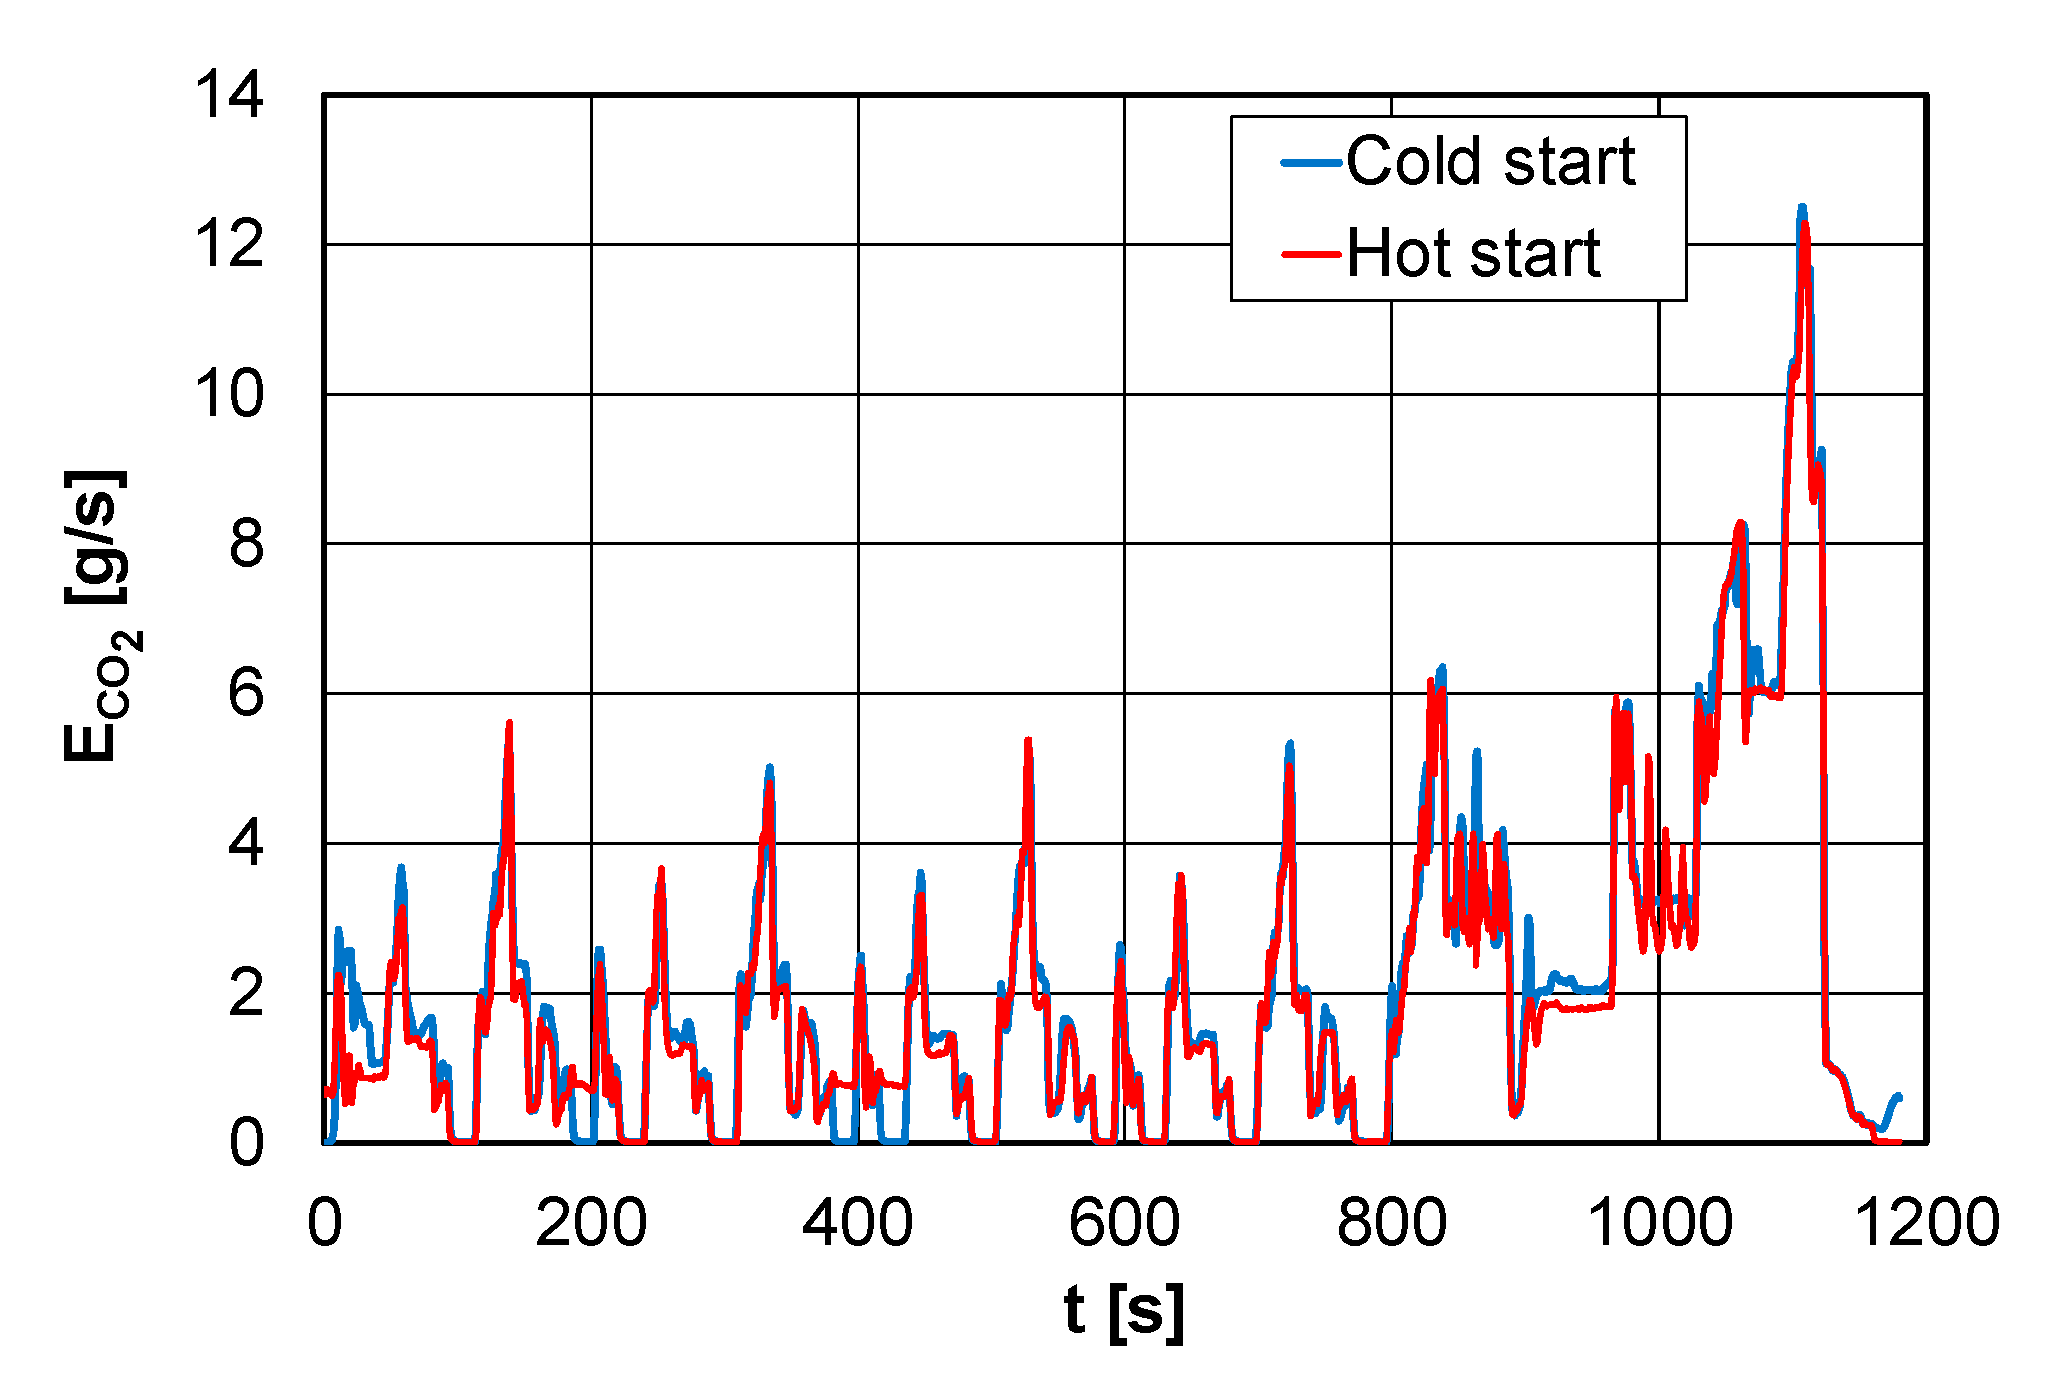
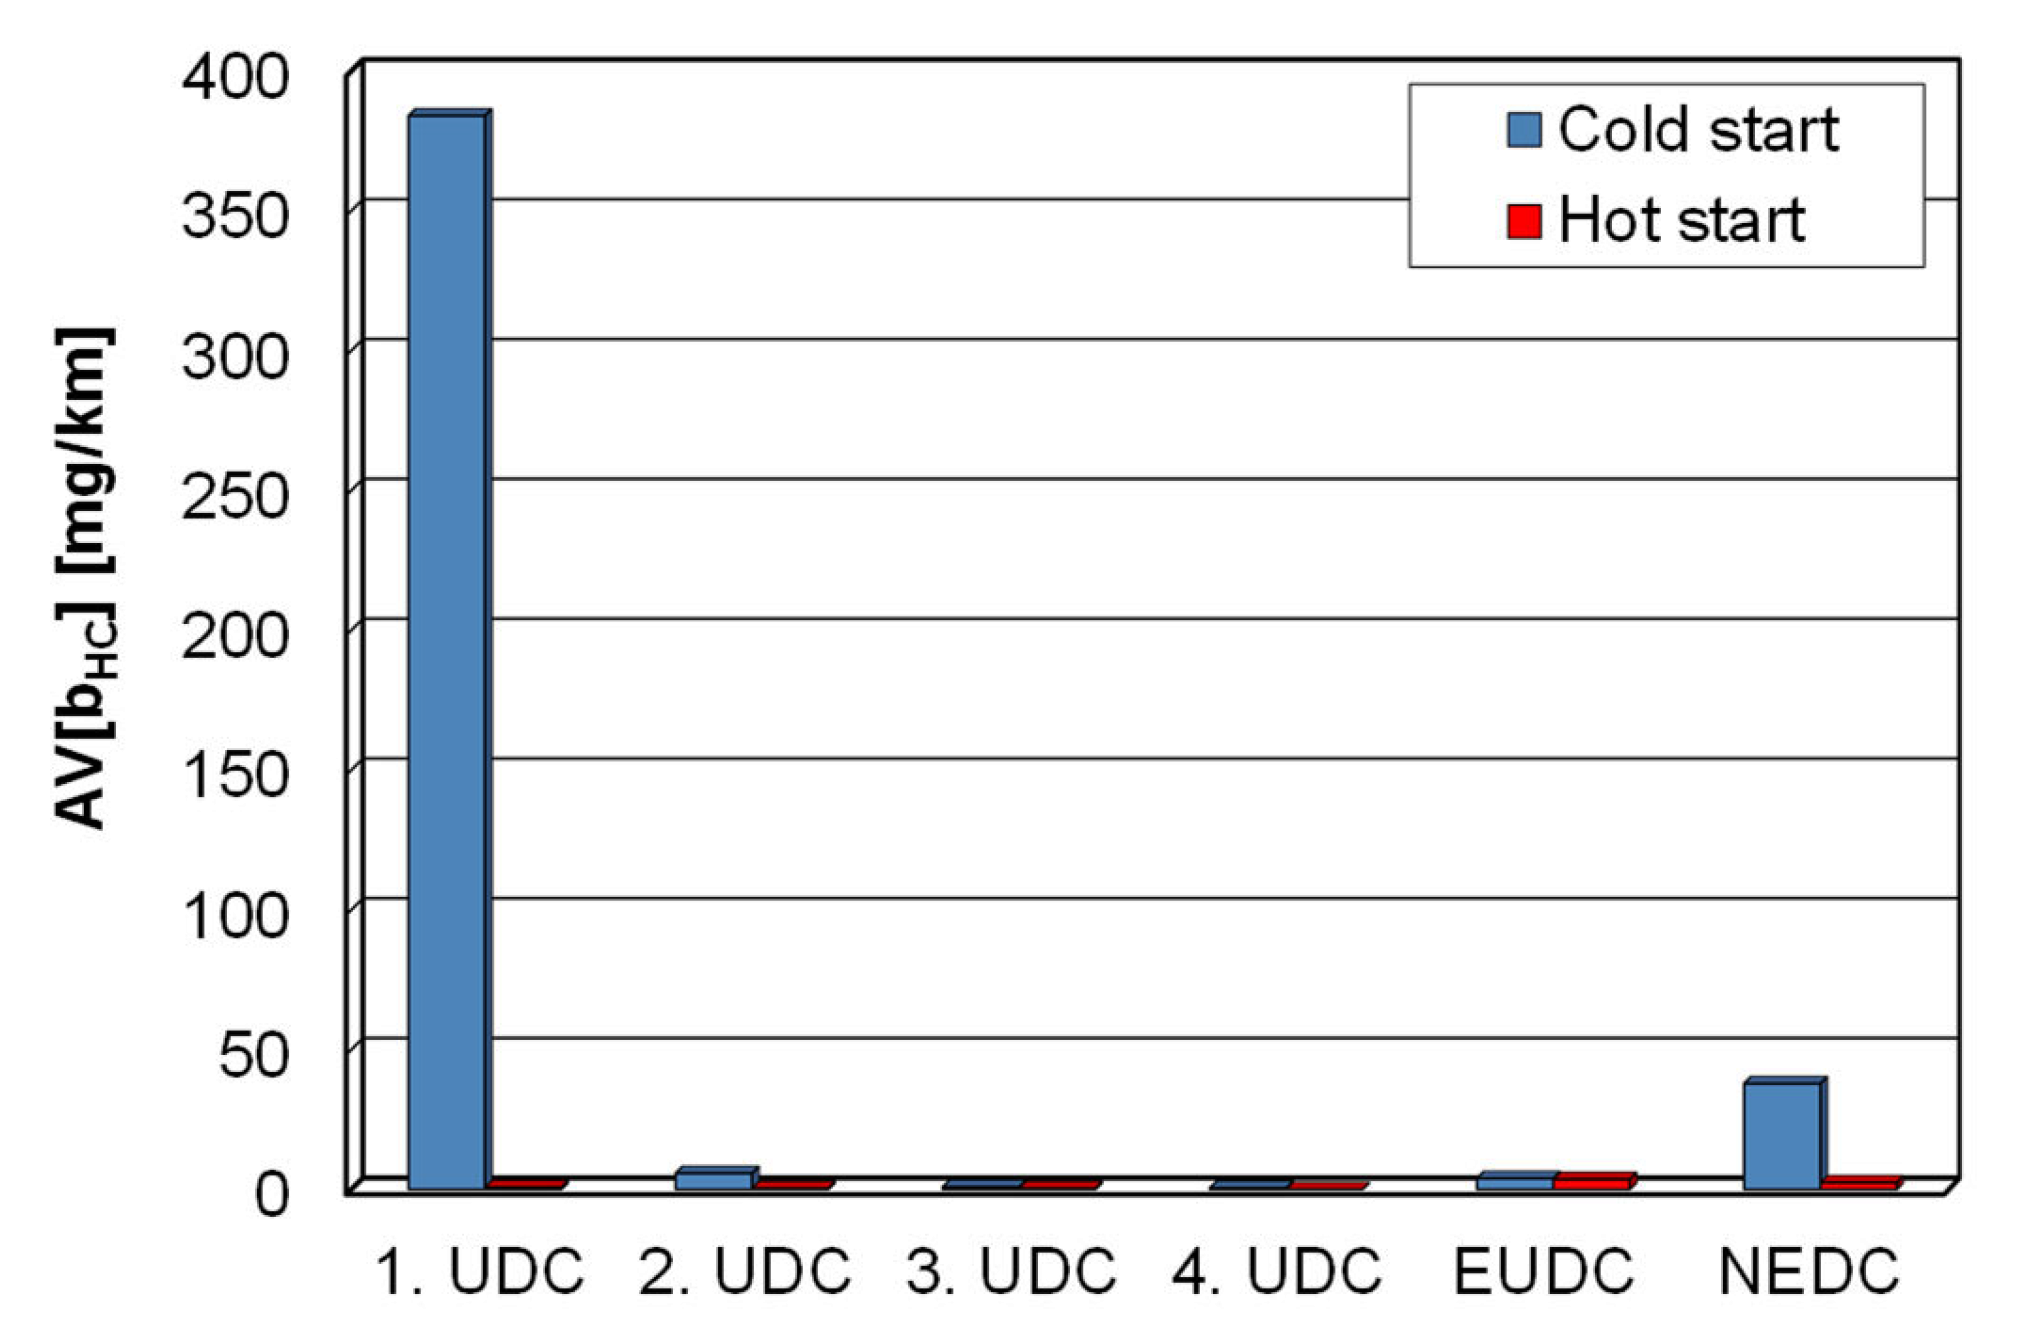
  • The carbon monoxide exhaust emission intensity during the engine cold start was several times greater (180 mg/s) than the emission intensity of this compound for a hot engine (20 mg/s); this applied to the first 200 s of the NEDC test. Thermal stabilization of the exhaust aftertreatment systems caused the emission intensity results to become more similar to each other in the later parts of the test. A similar situation occurred in the case of the hydrocarbon emission intensity.
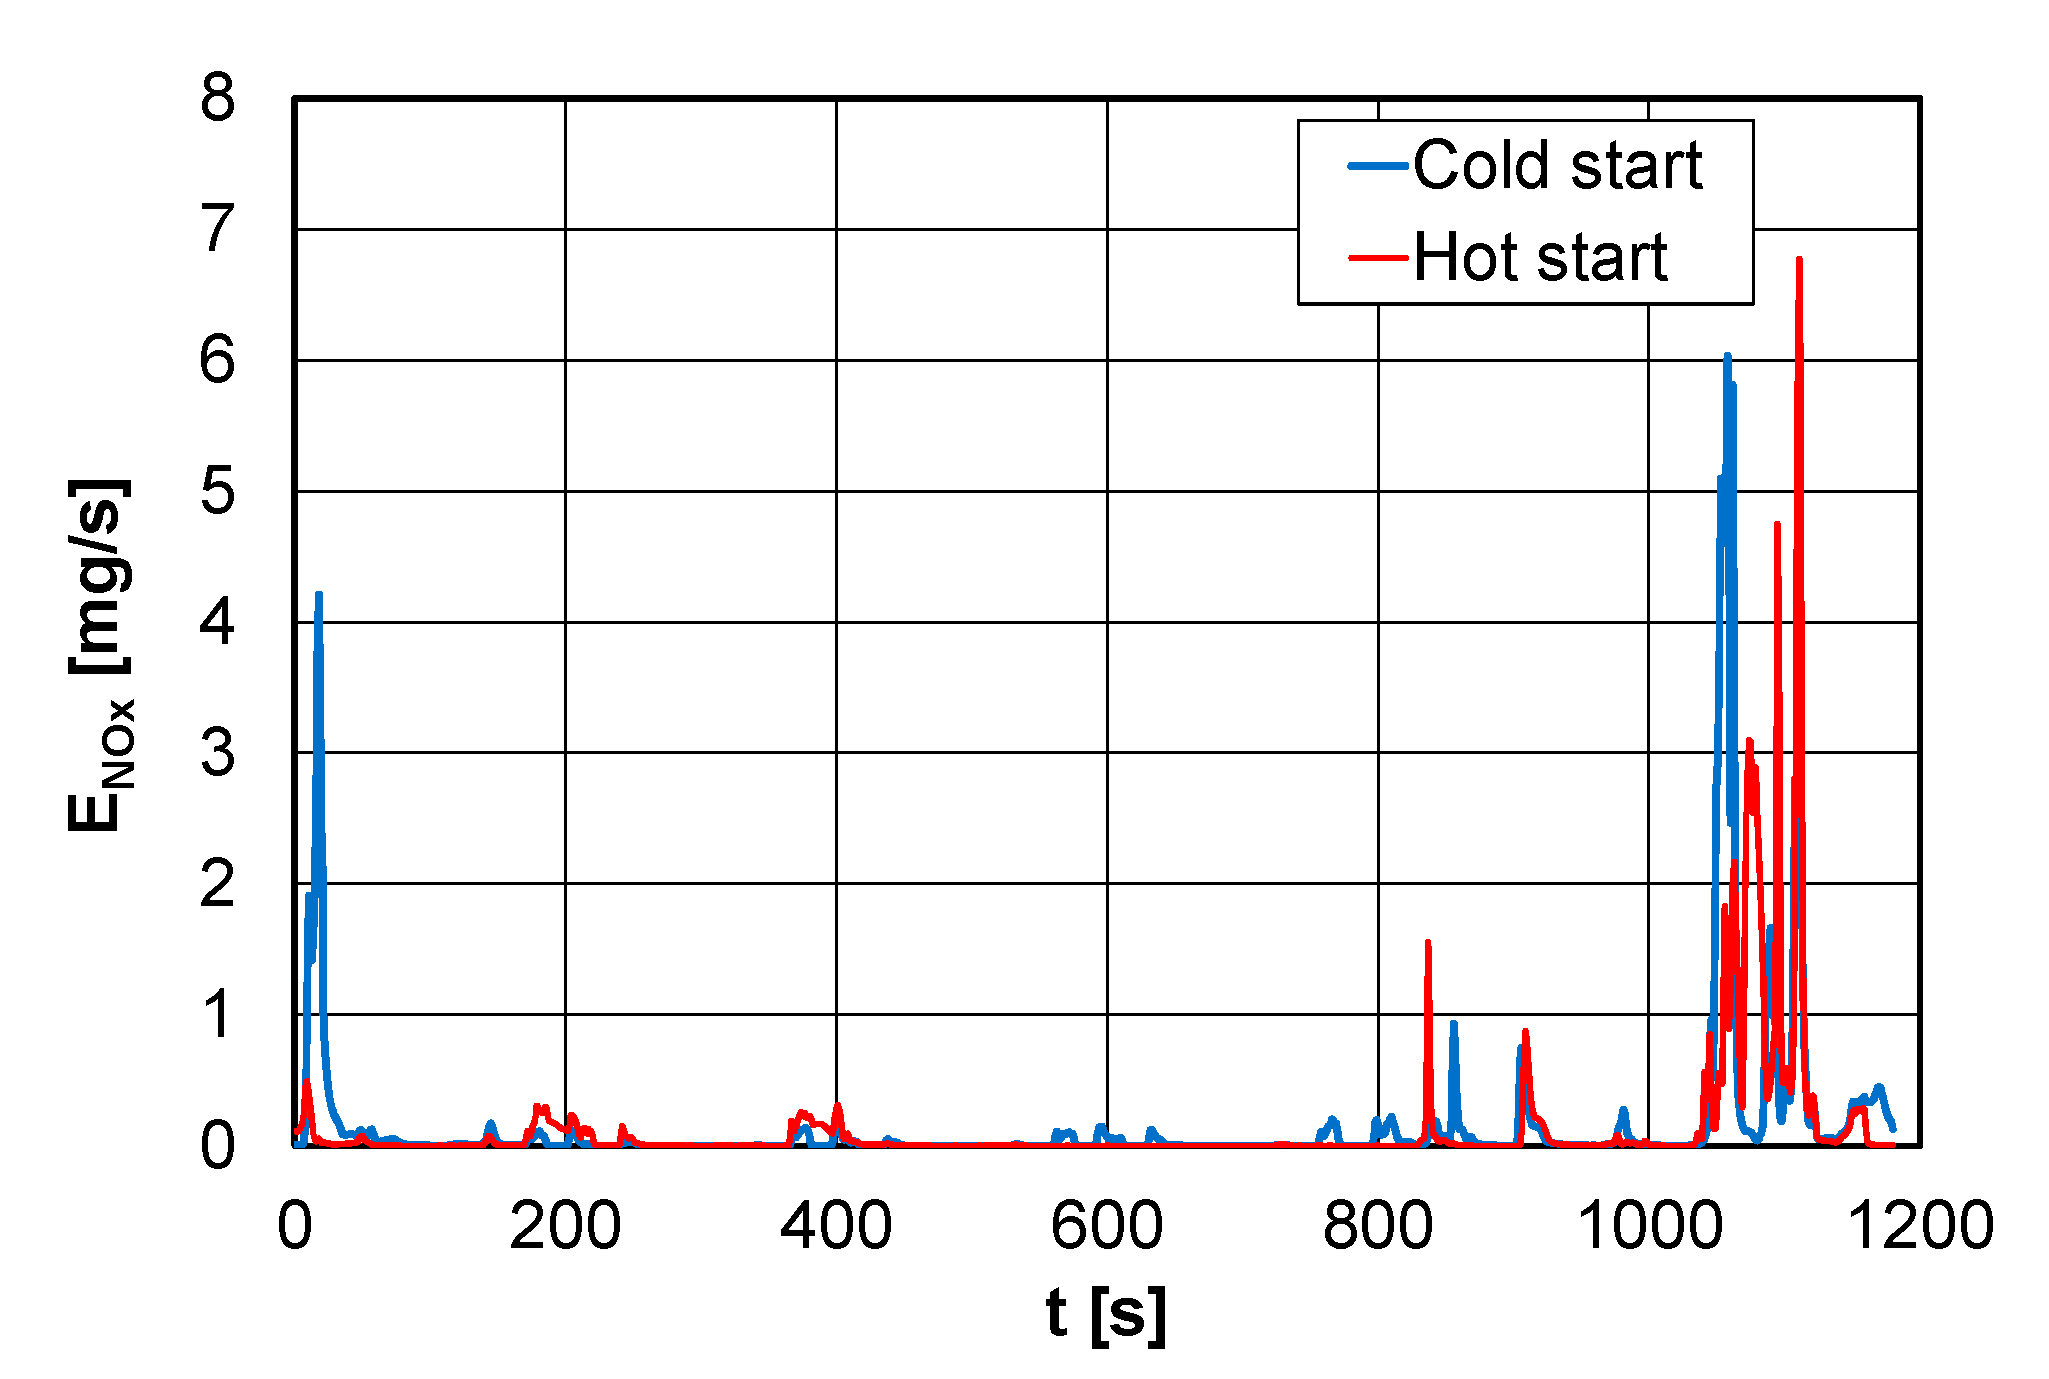
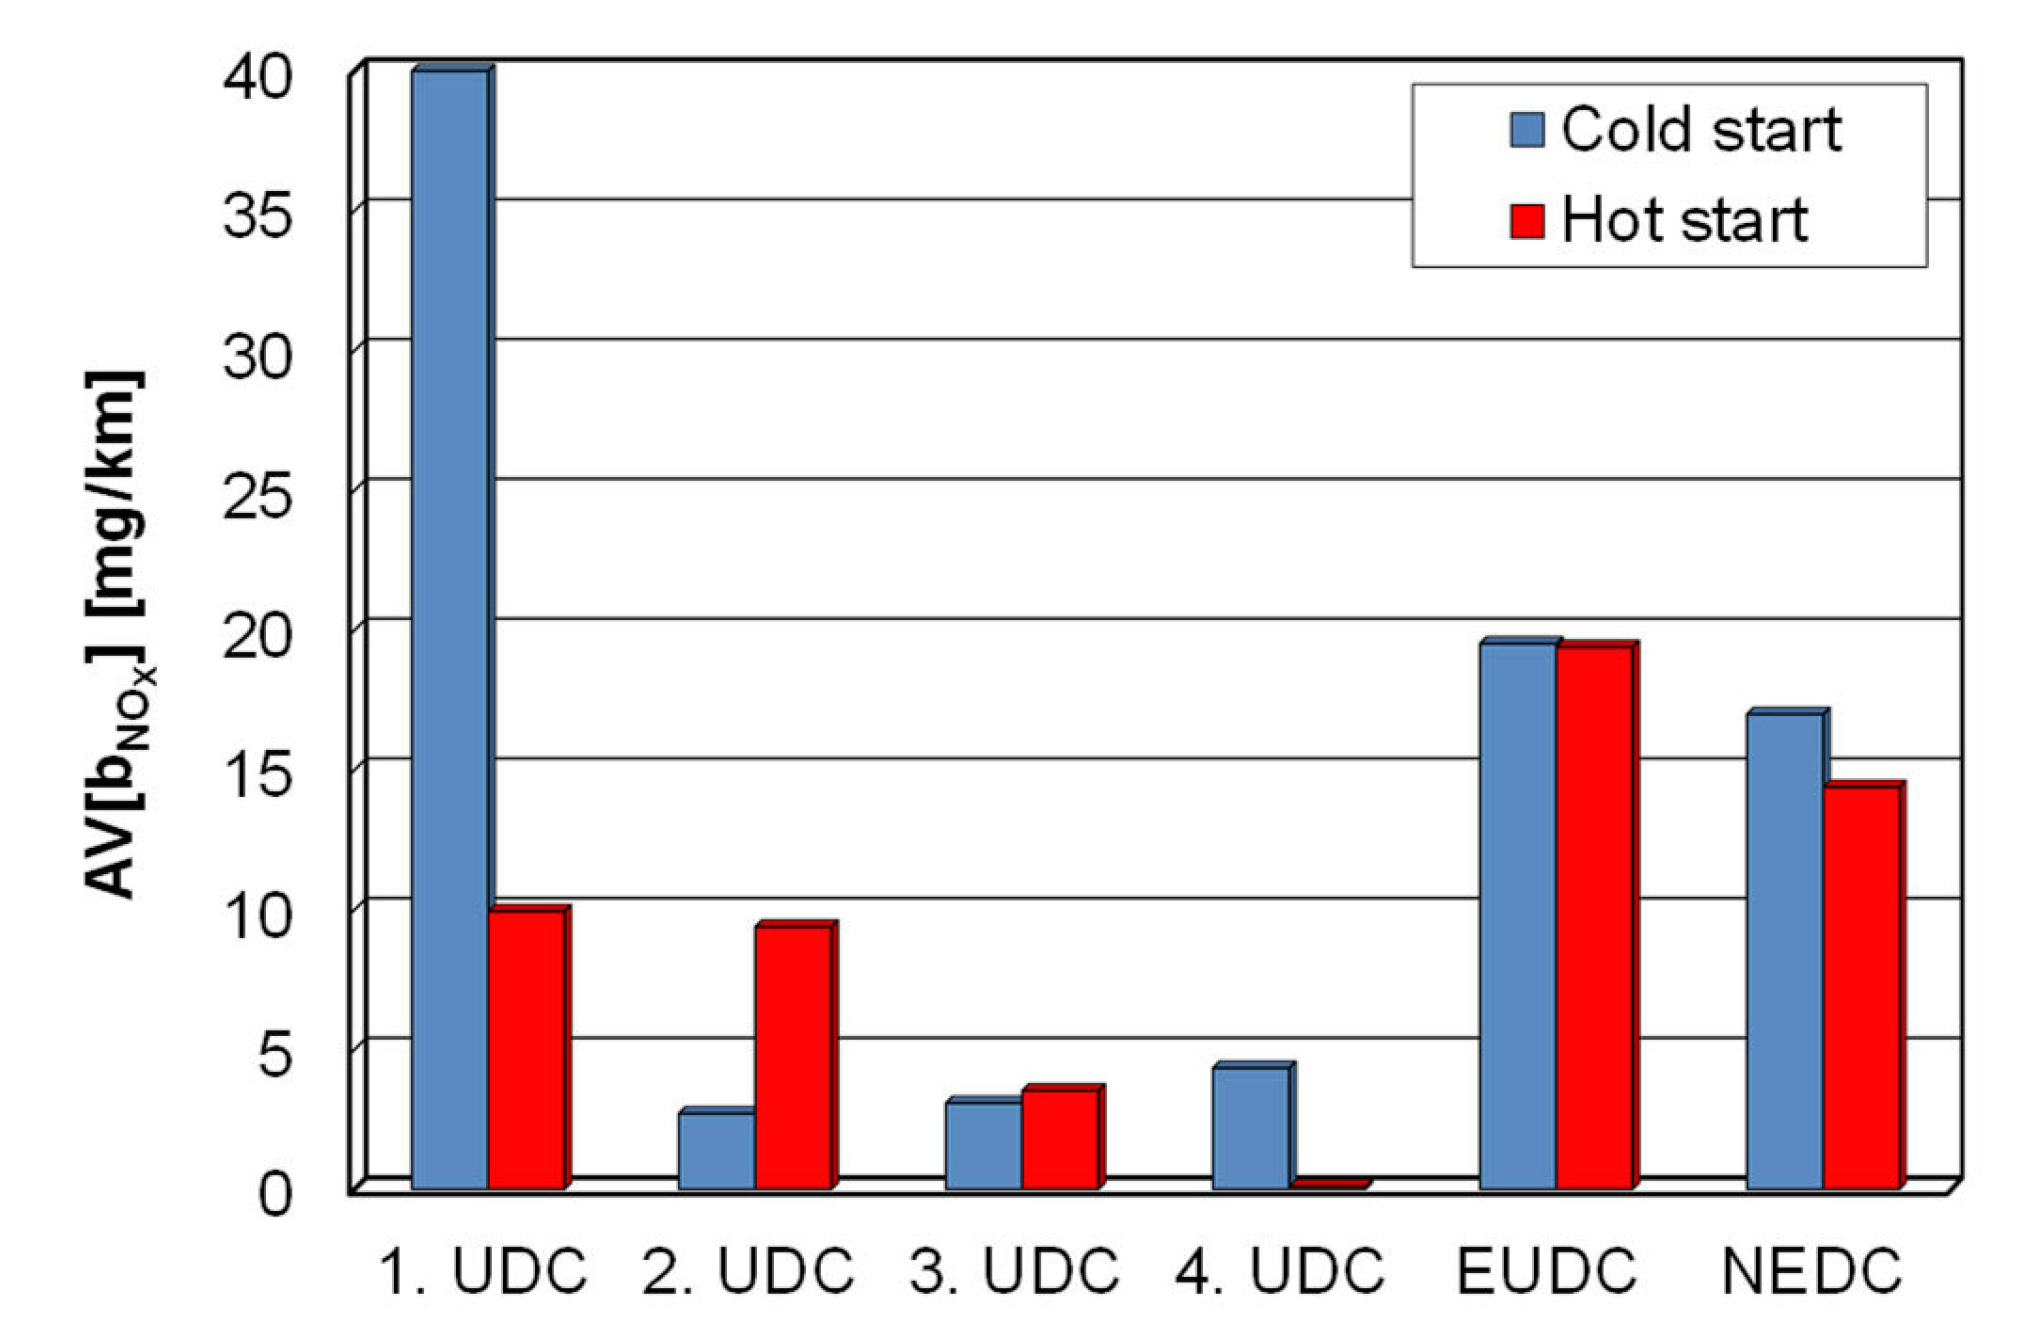
  • Increased emission of nitrogen oxides in the NEDC test occurred only during the first seconds after the cold engine start, stabilizing after a period of about 200 s. The last high-speed phase (EUDC) was not significant, since the efficiency of the exhaust aftertreatment system was similar due to the heating of the catalytic reactor.
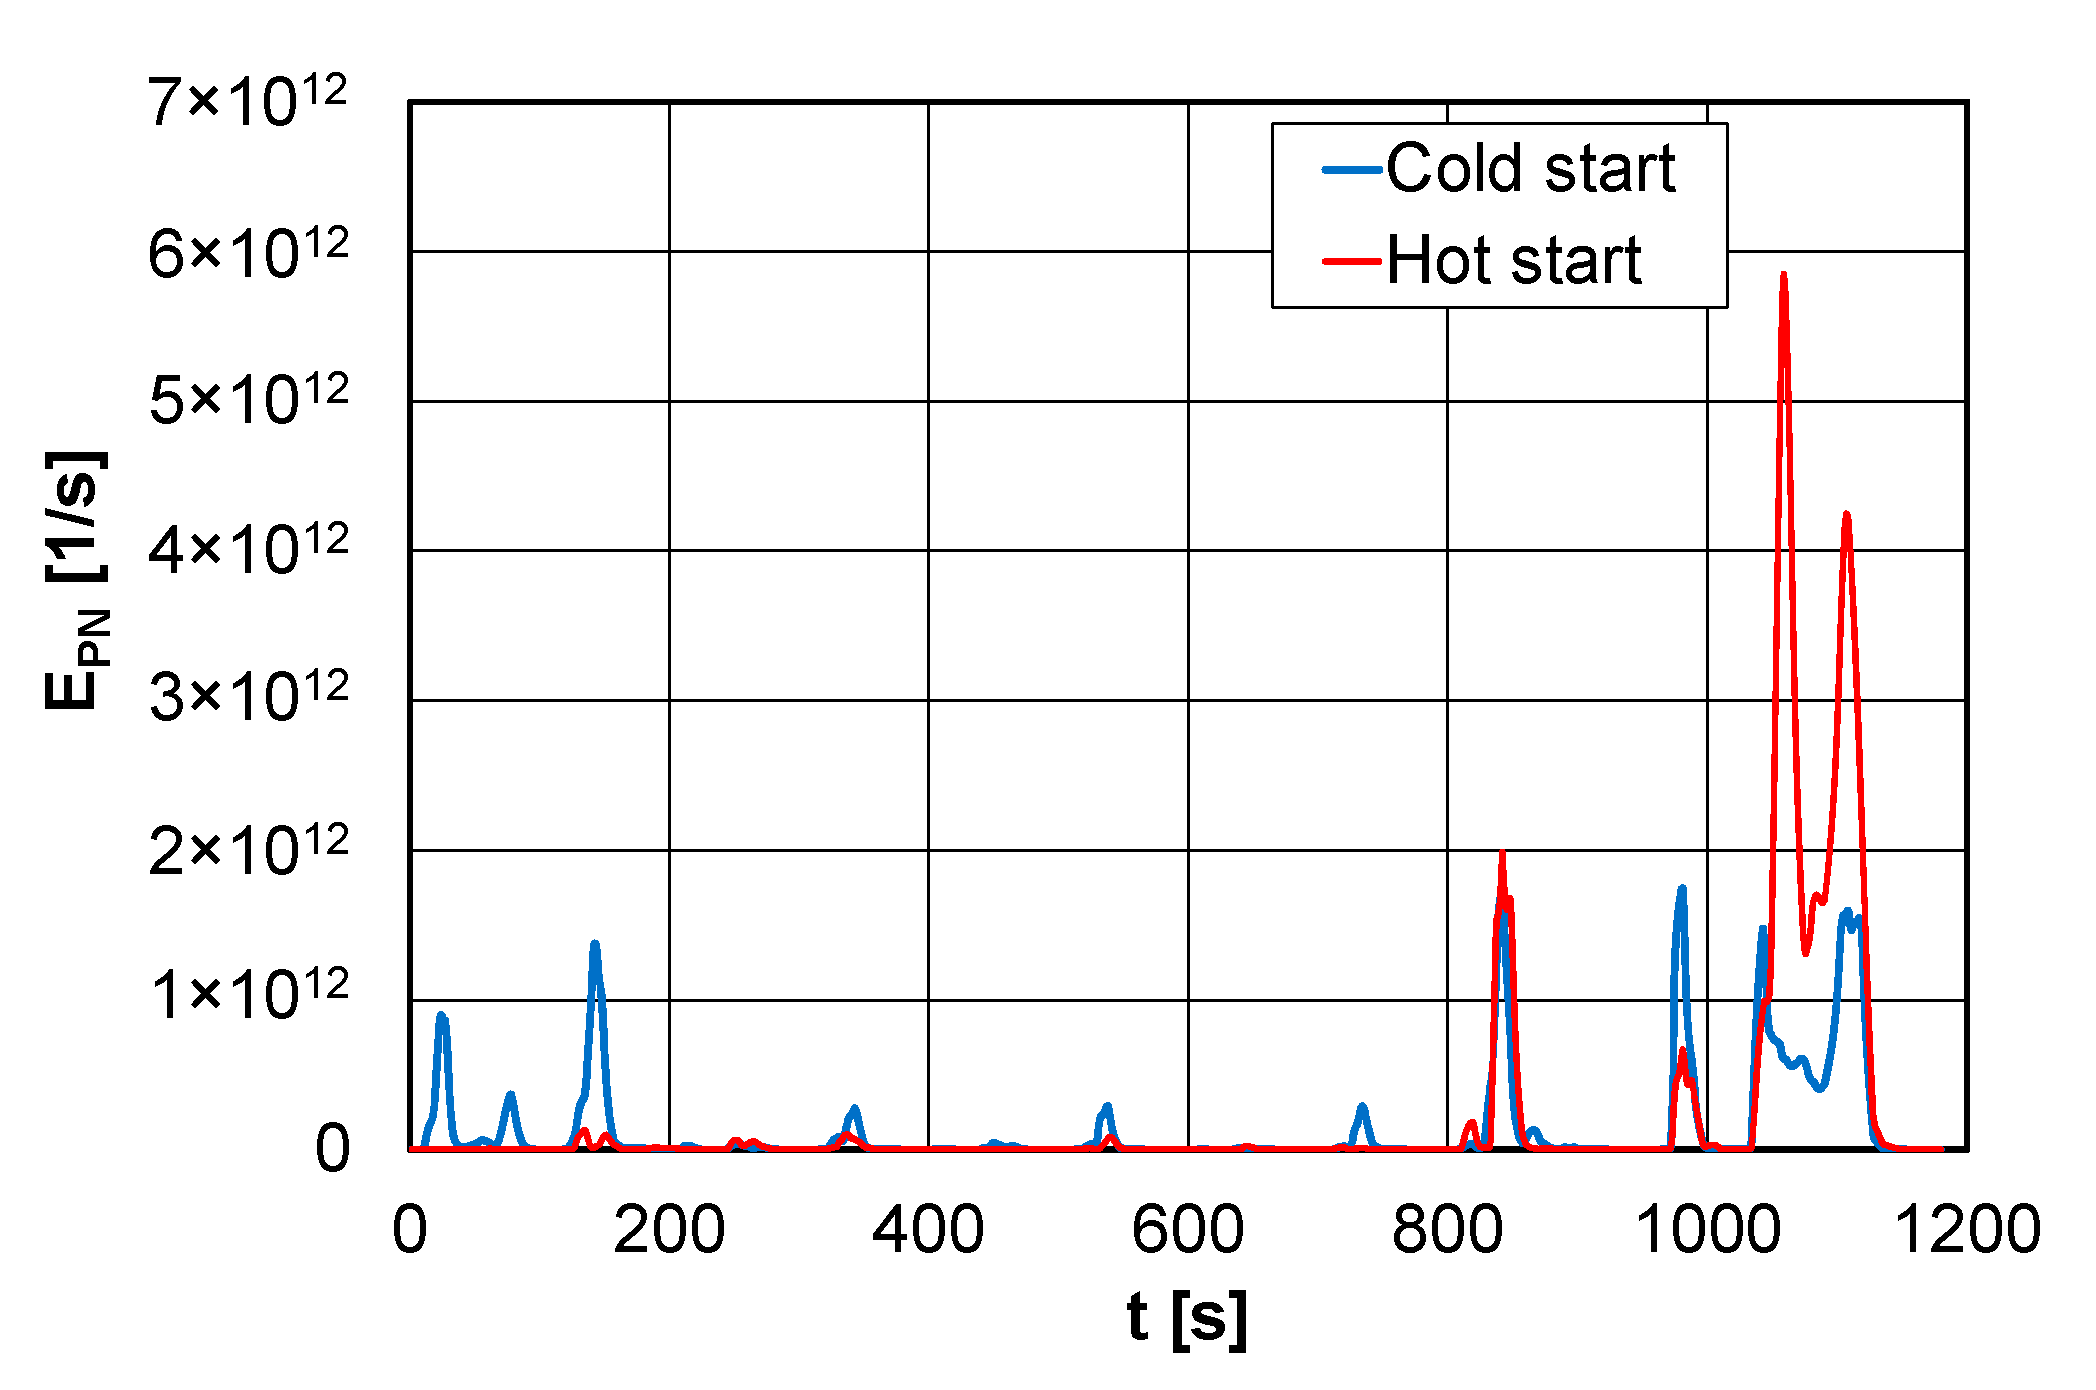
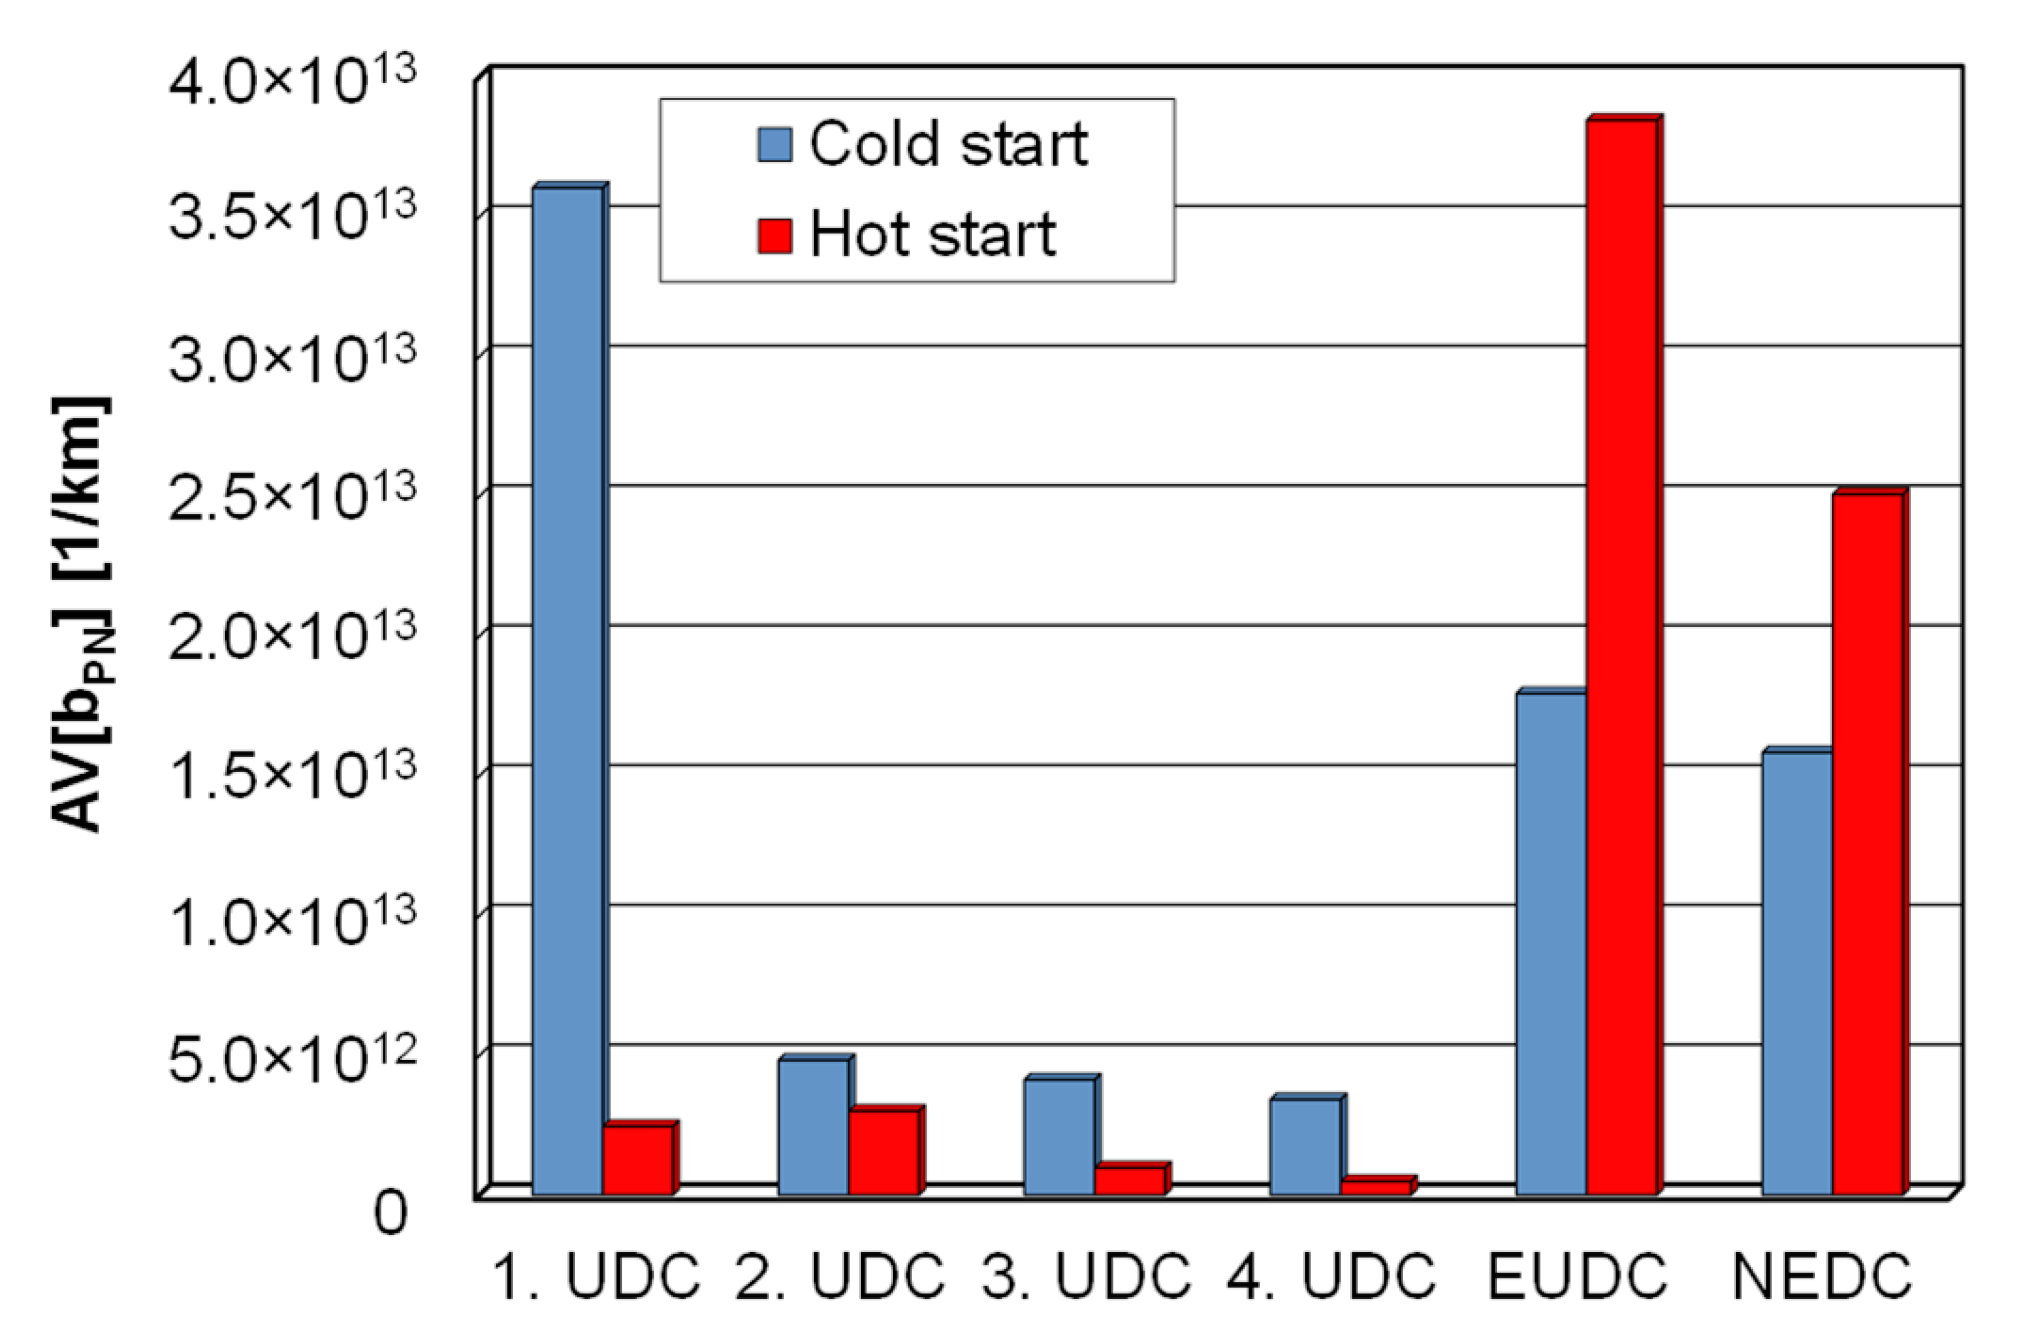
  • A significant increase in the number of emitted particles during the engine cold start (1 × 10¹² 1/s) was observed for about 150 s after the start of the test. In the rest of the NEDC test, the particle number intensity was similar.
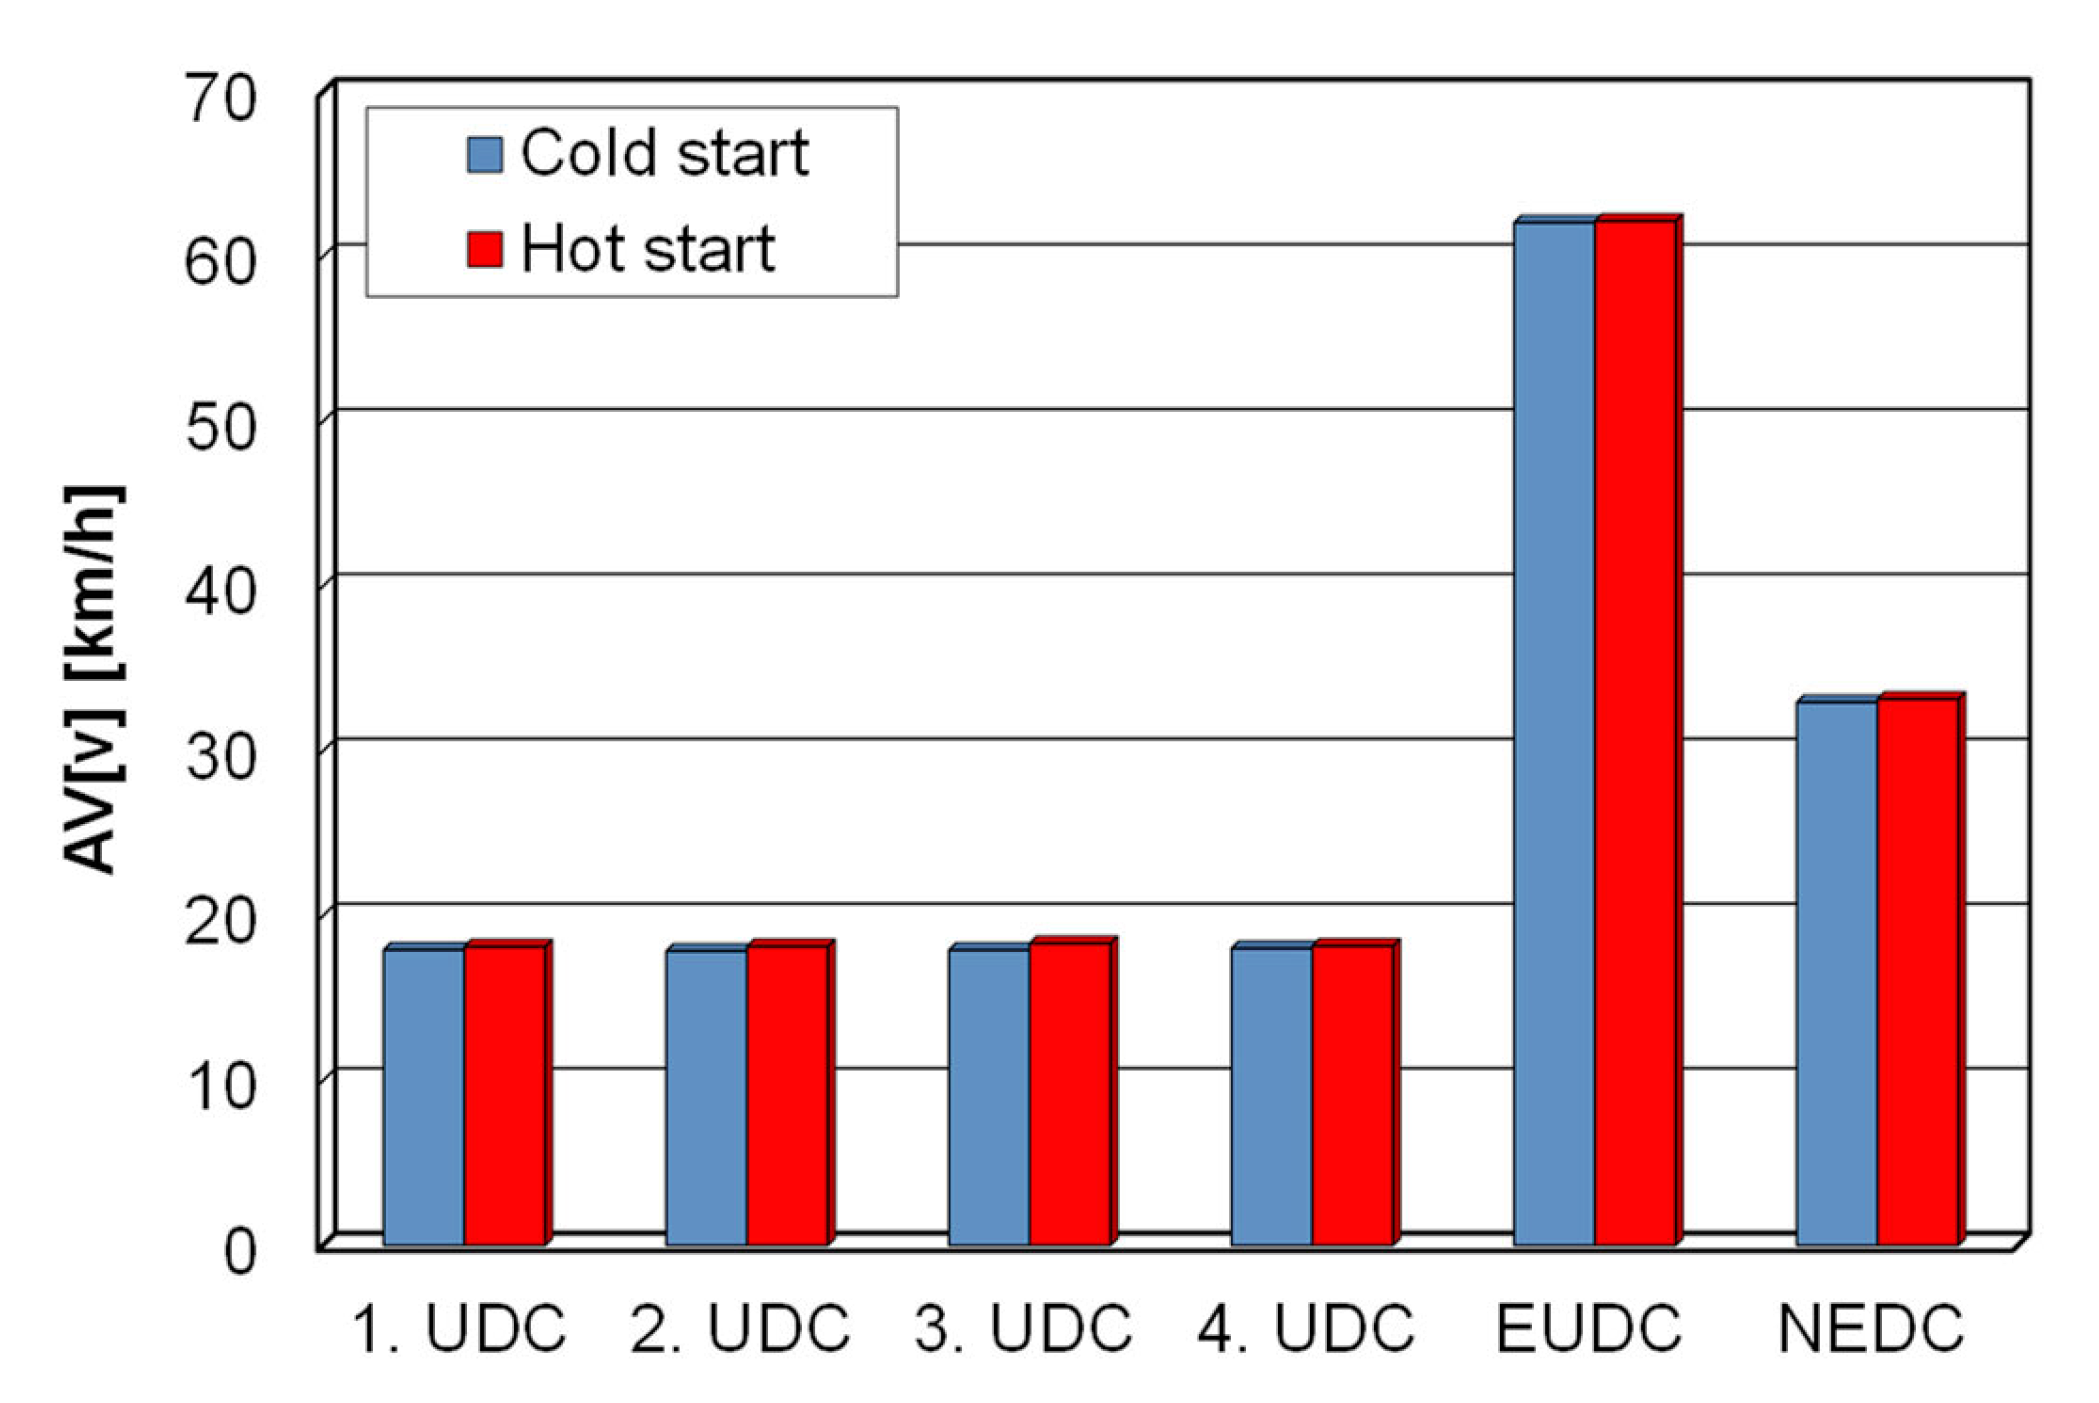
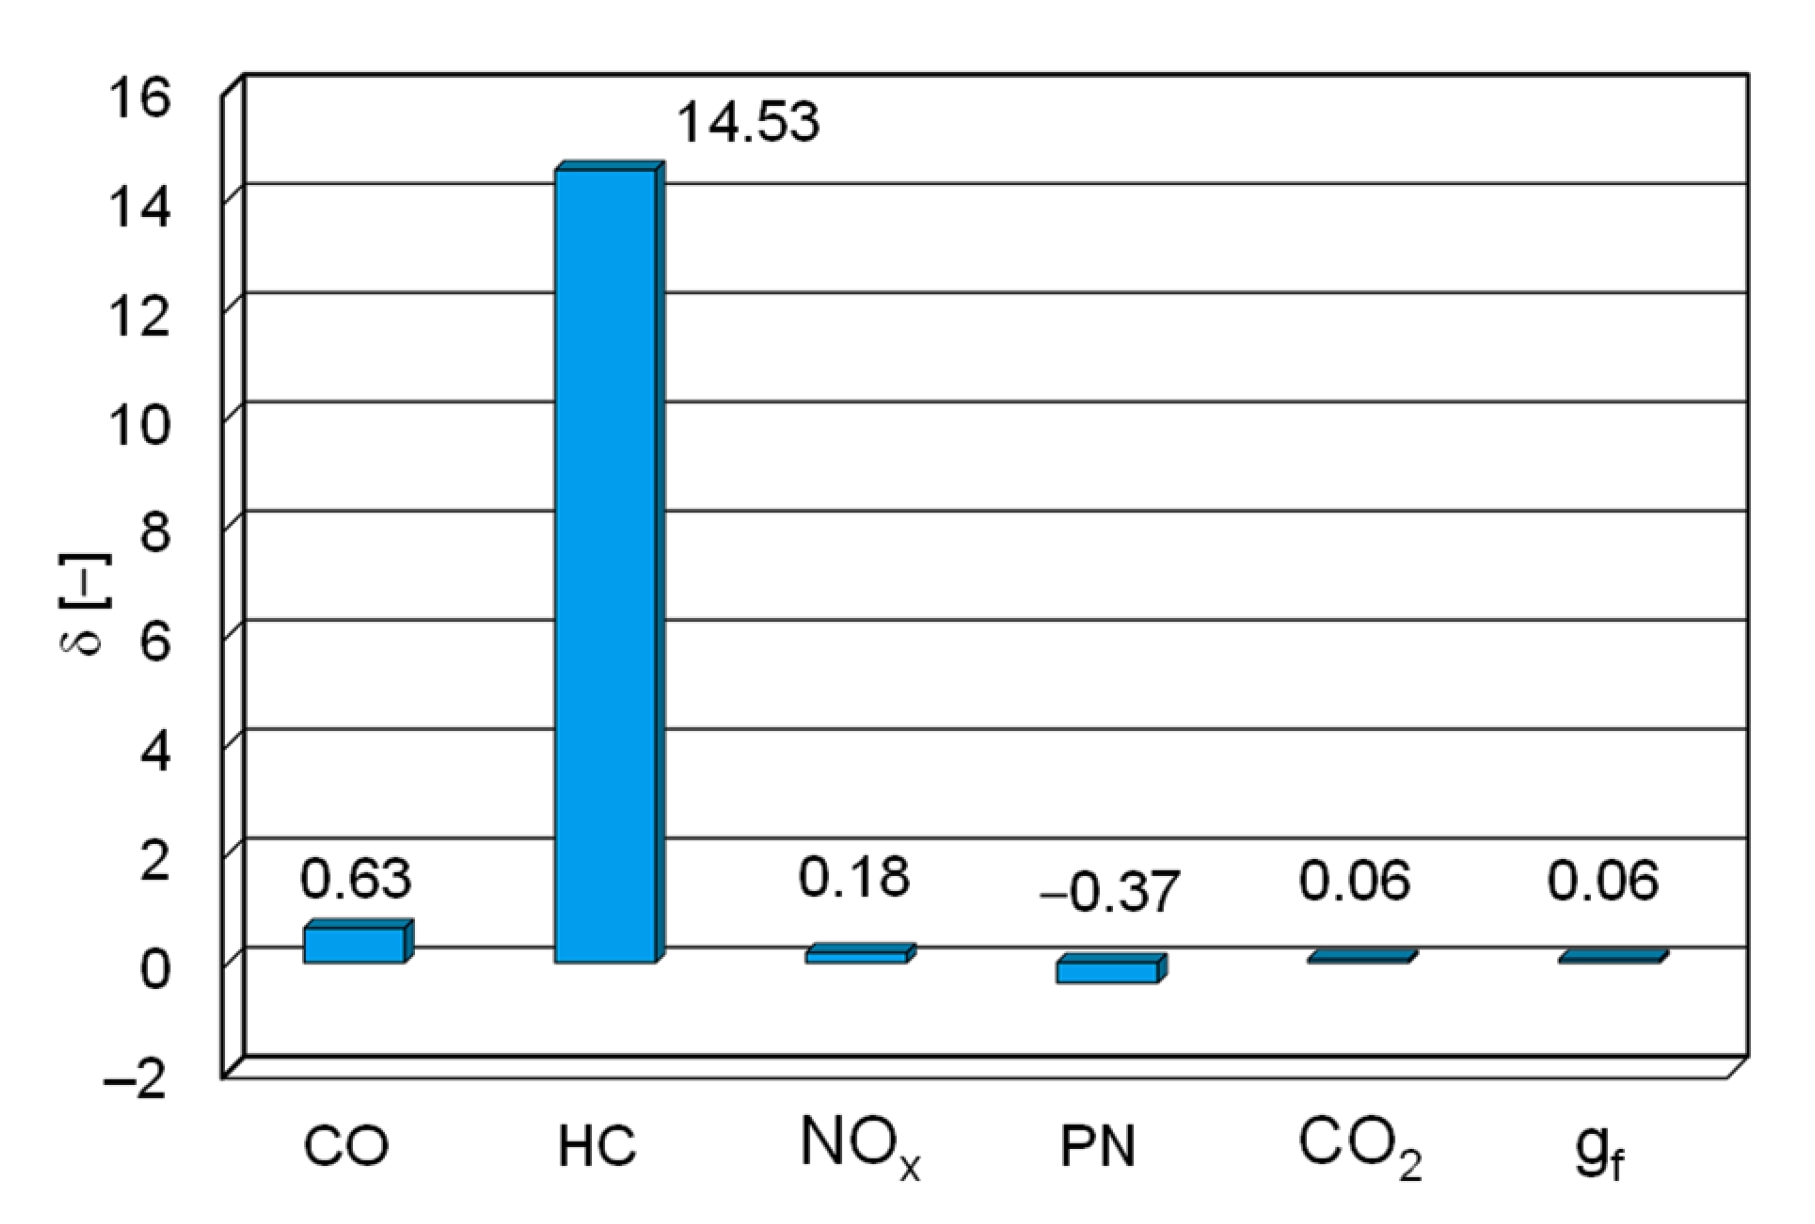
  • The obtained values of road emission of exhaust components in the NEDC test indicated that during the engine cold start (compared to the hot one), the following occurred:
    • road emission of CO was 63% greater,
    • road emission of HC was 1500% greater,
    • road emission of NOx was 18% greater,
    • number of emitted particles was 37% lower,
    • fuel consumption (road emission of CO2) was 6% greater.

7. Further Research

The results obtained from the conducted research are subject to certain limitations. First, conclusions were made based on one-time tests. The Authors are aware that this research should be further developed using the following steps:
  • Conducting research using a greater repetition of tests, thanks to which it would be possible to assess the repeatability of the obtained results.
  • Conducting research in accordance with other types of tests, making it possible to determine the impact of various vehicle motion characteristics on the operational properties of engines in the warm-up phase.
  • Conducting simulation tests representing the real conditions of vehicle operation, determined using the results of previous empirical tests. These tests could be considered the implementation of vehicle speed processes—stochastic processes in simulated traffic conditions.
  • Conducting research on the engine thermal state’s impact on its operational properties for various parameters, which is possible to achieve using various technical solutions. The results of these studies could provide a possibility of proposing practical technical solutions for engine warm up during its start-up phase.

Author Contributions

Conceptualization, Z.C., J.M., M.A.-Z. and J.P.; methodology, Z.C., J.M. and J.P.; software, J.P.; validation, Z.C., J.M., M.A.-Z. and J.P.; formal analysis, Z.C., J.M., M.A.-Z. and J.P.; investigation, Z.C., J.M. and J.P.; resources, Z.C. and J.M.; data curation, Z.C., J.M., M.A.-Z. and J.P.; writing—original draft preparation, Z.C. and J.M.; writing—review and editing, Z.C., J.M., M.A.-Z. and J.P.; visualization, Z.C. and J.P.; supervision, Z.C., J.M., M.A.-Z. and J.P.; project administration, Z.C., J.M., M.A.-Z. and J.P.; funding acquisition, Z.C., J.M., M.A.-Z. and J.P. All authors have read and agreed to the published version of the manuscript.

Funding

This research received no external funding.

Data Availability Statement

The data presented in this study are available on request from the corresponding author.

Conflicts of Interest

The authors declare no conflict of interest.

Abbreviations

ASCammonia slip catalyst
AVaverage value operator
broad emissions of gases/road emission of particles
Ccold (meaning a cold start of an engine)
COcarbon monoxide
CO2carbon dioxide
CLDchemiluminescence detector
CPCcondensation particle counter
Eexhaust emission intensity of gases/exhaust emission intensity of particles
EGRexhaust gas recirculation
EHCelectrically heated catalyst
Gffuel mass consumption
GPFgasoline particle filter
Hhot (meaning a hot start of an engine)
HCCIhomogeneous charger compression ignition
HEVhybrid electric vehicle
LNTlean trap NOx
NDIRnon-dispersive infrared detector
NEDCNew European Driving Cycle
NH3ammonia
NOxnitrogen oxides
PNparticle number
qfroad fuel mass consumption
UHPultra-high injection pressure
HChydrocarbons
TWCthree-way catalyst
TW GPFTWC + GPF
TW LNTTWC + LNT
VCRvariable compression ratio
VVLvariable valves lift
VVTvariable valves timing
vvehicle speed

References

  1. Bielaczyc, P.; Merkisz, J. Exhaust Emission from Passenger Cars during Engine Cold Start and Warm-Up; SAE Technical Paper; SAE: Warrendale, PA, USA, 1997; 970740. [Google Scholar] [CrossRef]
  2. Bielaczyc, P.; Merkisz, J. Cold Start Emissions Investigation at Different Ambient Temperatures Conditions; SAE Technical Paper; SAE: Warrendale, PA, USA, 1998; 980401. [Google Scholar] [CrossRef]
  3. Bielaczyc, P.; Merkisz, J. Euro III/Euro IV Emissions—A Study of Cold Start and Warm up Phases with a SI (Spark Ignition) Engine; SAE Technical Paper; SAE: Warrendale, PA, USA, 1999. [Google Scholar] [CrossRef]
  4. Bielaczyc, P.; Merkisz, J.; Pielecha, J. Exhaust Emission from Diesel Engine during Cold Start in Ambient Temperature Conditions; SAE Technical Paper; SAE: Warrendale, PA, USA, 2001. [Google Scholar] [CrossRef]
  5. Pielecha, J.; Skobiej, K.; Kurtyka, K. Testing and evaluation of cold-start emissions from a gasoline engine in RDE test at two different ambient temperatures. Open Eng. 2021, 11, 425–434. [Google Scholar] [CrossRef]
  6. Pielecha, J.; Merkisz, J.; Kurtyka, K.; Skobiej, K. Cold start emissions of passenger cars with gasoline and diesel engines in Real Driving Emissions tests. Combust. Engines 2019, 179, 160–168. [Google Scholar] [CrossRef]
  7. Merkisz, J.; Bielaczyc, P.; Pielecha, J.; Woodburn, J. RDE Testing of Passenger Cars: The Effect of the Cold Start on the Emissions Results; SAE Technical Paper; SAE: Warrendale, PA, USA, 2019. [Google Scholar] [CrossRef]
  8. Andrych-Zalewska, M.; Merkisz, J.; Pielecha, J. Analysis of the efficiency of the in-cylinder catalyst to reduce exhaust emissions during cold start combustion engine. Combust. Engines 2019, 177, 38–45. [Google Scholar] [CrossRef]
  9. Kurtyka, K.; Pielecha, J. Cold start emissions from a gasoline engine in RDE tests at different ambient temperatures. Combust. Engines 2020, 181, 24–30. [Google Scholar] [CrossRef]
  10. Bielaczyc, P.; Merkisz, J.; Pielecha, J.; Woodburn, J. RDE-Compliant PEMS Testing of a Gasoline Euro 6d-TEMP Passenger Car at Two Ambient Temperatures with a Focus on the Cold Start Effect; SAE Technical Paper; SAE: Warrendale, PA, USA, 2020. [Google Scholar] [CrossRef]
  11. Chłopek, Z. Modeling of Exhaust Emission Processes in the Conditions of Traction Operation of Internal Combustion Engines; Oficyna Wydawnicza Politechniki Warszawskiej: Warszawa, Poland, 1999. [Google Scholar]
  12. Chłopek, Z.; Biedrzycki, J.; Lasocki, J.; Wójcik, P. Assessment of the impact of dynamic states of an internal combustion engine on its operational properties. Eksploat. i Niezawodn. Maint. Reliab. 2015, 17, 35–41. [Google Scholar] [CrossRef]
  13. Worldwide Emission Standards. Passenger Cars and Light Duty Vehicles; Innovation for the Real World; Delphi: London, UK, 2020–2021. [Google Scholar]
  14. Worldwide Emission Standards. Heavy Duty & Off-Road Vehicles; Innovation for the Real World; Delphi: London, UK, 2020–2021. [Google Scholar]
  15. Marecka-Chłopek, E.; Budny, E.; Chłopek, Z.; Chłosta, M. Identification of combustion engine static states in real operation conditions of a building machine. Sci. Probl. Mach. Oper. Maint. 2008, 156, 69–84. Available online: https://t.tribologia.org/plik/spm/spmom-08v43n4_p-069.pdf (accessed on 15 November 2022).
  16. Alashaab, A.; Saleh, H.; Abo-Serie, E.; Rabee, B.; Aal, M.A. Gaseous fuel for lower emissions during the cold start and warming up of spark ignition engines. Int. J. Glob. Warm. 2016, 10, 115–132. Available online: https://www.inderscienceonline.com/doi/epdf/10.1504/IJGW.2016.077909 (accessed on 1 November 2022). [CrossRef] [Green Version]
  17. Birkavs, A.; Dukulis, I. Amount of Toxic Exhaust Gases Emitted during Engine Warm up. In Proceedings of the International Scientific Conference 2016, Jelgava, Latvia, 25–27 May 2016; Engineering for Rural Development. Available online: https://www.tf.llu.lv/conference/proceedings2016/Papers/N086.pdf (accessed on 12 December 2022).
  18. Fiengo, G.; Santini, S.; Glielmo, L. Emission reduction during TWC warm-up: Control synthesis and hardware-in-the-loop verification. Int. J. Model. Identif. Control 2008, 3, 233–246. [Google Scholar] [CrossRef]
  19. Gao, J.; Tian, G.; Sorniotti, A.; Karci, A.E.; Di Palo, R. Review of thermal management of catalytic converters to decrease engine emissions during cold start and warm up. Appl. Therm. Eng. 2019, 147, 177–187. [Google Scholar] [CrossRef]
  20. Hamedi, M.R.; Doustdar, O.; Tsolakis, A.; Hartland, J. Thermal energy storage system for efficient diesel exhaust aftertreatment at low temperatures. Appl. Energy 2019, 235, 874–887. [Google Scholar] [CrossRef]
  21. Ibrahim, T.M.; Syahir, A.Z.; Zulkifli, N.W.M.; Masjuki, H.H.; Osman, A. Enhancing vehicle’s engine warm up using integrated mechanical approach. IOP Conf. Ser. Mater. Sci. Eng. 2017, 210, 012064. [Google Scholar] [CrossRef]
  22. Jeong, S.-J.; Kim, W.-S. A new strategy for improving the warm-up performance of a light-off auto-catalyst for reducing cold-start emissions. Proc. Inst. Mech. Eng. Part D J. Automob. Eng. 2001, 215, 1179–1196. [Google Scholar] [CrossRef]
  23. Kaltakkıran, G.; Akif Ceviz, M.; Bakirci, K. Instantaneous energy balance and performance analysis during warm up period of a spark ignition engine under several thermal energy management strategies. Energy Convers. Manag. 2022, 269, 116102. [Google Scholar] [CrossRef]
  24. Leblanc, M.; Noël, L.; R’Mili, B.; Boreave, A.; D’Anna, B.; Raux, S. Impact of engine warm-up and DPF active regeneration on regulated & unregulated emissions of a Euro 6 Diesel SCR equipped vehicle. J. Earth Sci. Geotech. Eng. 2016, 6, 29–50. Available online: http://www.scienpress.com/Upload/GEO/Vol%206_4_3.pdf (accessed on 1 January 2023).
  25. Lodi, F.; Zare, A.; Arora, P.; Stevanovic, S.; Jafari, M.; Ristovski, Z.; Brown, R.J.; Bodisco, T. Engine performance and emissions analysis in a cold, intermediate and hot start diesel engine. Appl. Sci. 2020, 10, 3839. [Google Scholar] [CrossRef]
  26. Vittorini, D.; Di Battista, D.; Cipollone, R. Engine oil warm-up through heat recovery on exhaust gases—Emissions reduction assessment during homologation cycles. Therm. Sci. Eng. Prog. 2018, 5, 412–421. [Google Scholar] [CrossRef]
  27. Vlachos, T.; Bonnel, P.; Weiss, M. Including Cold-Start Emissions in the Real-Driving Emissions (RDE) Test Procedure: An Assessment of Cold-Start Frequencies and Emission Effects; Joint Research Centre, Publications Office of the European Union: Luxembourg, 2017. [Google Scholar] [CrossRef]
  28. Chłopek, Z.; Biedrzycki, J.; Lasocki, J.; Wójcik, P. Examination of pollutant emissions and fuel consumption at tests simulating the real conditions of operation of a passenger car. Arch. Automot. Eng. 2014, 65, 81–96. Available online: http://www.aaejournal.com/pdf-99350-31554?filename=Examination%20of%20pollutant.pdf (accessed on 25 December 2022).
  29. Demuynck, J.; Favre, C.; Bosteels, D.; Randlshofer, G.; Bunar, F.; Spitta, J.; Friedrichs, O.; Kuhrt, A.; Brauer, M. Integrated diesel system achieving ultra-low urban and motorway NOx emissions on the road. In Proceedings of the 40th International Vienna Motor Symposium, Vienna, Austria, 16 May 2019; Available online: https://www.aecc.eu/wp-content/uploads/2020/11/190516-AECC-IAV-IPA-Integrated-Diesel-System-achieving-Ultra-Low-NOx-on-the-road-Vienna-Symposium-1.pdf (accessed on 12 December 2022).
  30. Bunar, F. Holistic ECT Cost Estimation; Final Report (Executive Summary) v.2; Automotive Engineering. 2021. Available online: https://www.iav.com (accessed on 21 November 2021).
Figure 1. Future-proof exhaust after-treatment system for Euro 7, where EHC (48 V, 3 kW), TW LNT—for cold start, TW GPF (η > 90%, PM > 10 nm), SCR (T > 140 °C) NOx—ammonia sensor, T—temperature sensor, λ—lambda sensor (adapted from [29,30]).
Energies 16 01937 g001
Figure 2. Vehicle speed curve (v) for cold and hot engine start.
Energies 16 01937 g002
Figure 3. Carbon monoxide exhaust emissions (ECO) for cold and hot engine start.
Energies 16 01937 g003
Table 1. Technical parameters of the tested vehicles.
Technical ParametersVehicle
EngineGasoline, Turbo, R4, 16 V
Fuel systemdirect injection
Engine displacement1984 cm3
Max. power195 kW at 5000 rpm
Max. torque370 Nm/1600—4200 rpm
Transmissionautomatic, seven gears
Curb weight1770 kg
Specific power output9.1 kg/kW
Average CO2 emissions228 g/km (WLTC)
Euro standardEuro 6
Table 2. The characteristics of the exhaust emission analysers.
Technical ParametersDetails
Sample flow rate8 dm3/min
CO2 ranges (NDIR method)0–20%
CO ranges (NDIR method)0–10,000 ppm
HC ranges (FID method)0–5000 ppm
NOx ranges (CLD method)0–500 ppm
PN (CPC method)0–10,000 1/cm3
Disclaimer/Publisher’s Note: The statements, opinions and data contained in all publications are solely those of the individual author(s) and contributor(s) and not of MDPI and/or the editor(s). MDPI and/or the editor(s) disclaim responsibility for any injury to people or property resulting from any ideas, methods, instructions or products referred to in the content.

