Abstract
Natural gas is the primary source of energy, accounting for around 20% of the world’s energy production. It is also a key element in reducing CO2 emissions due to its key role in stabilizing renewable energy sources. At the same time, natural gas as a fossil fuel that emits CO2 should be limited. A natural candidate that can ensure the stabilization of RES and at the same time reduce the demand for fossil fuels is biogas. Successful use of biogas requires a thorough understanding of the potential, structure, and specifics of its sources and production technology. The presented study provides a perspective and a brief overview of the existing potential of biogas production. Poland was chosen as the case study and it was shown that almost 90% of the Polish biogas potential comes from sources with a capacity below 100 Nm3/h, which is the current minimum commercially available capacity of the biogas purification and liquefaction technologies. Consequently, full utilization of these sources would require a downsizing of these technologies.
1. Introduction
Natural Gas is one of the primary energy sources. The worldwide production of electricity from natural gas has increased from 2830 TWh (18% of the total production) in 2001 to about 6098 TWh (22% of the total electricity production) in 2021 [1]. Natural gas is becoming an important fuel, especially liquefied natural gas (LNG). Demand for LNG reached 400 million tons in 2020 and it is projected to grow to 500 million tons in 2030 [2]. Furthermore, due to low emissions, LNG has been officially approved for use as a marine fuel in Emission Control Areas [3], where stricter controls have been established to minimize air emissions produced by ships. Natural gas is also widely used in other sectors of the economy which can be clearly seen in the consumption of natural gas in the EU [4]. Since 2010, gas consumption has oscillated between 1.1 and 1.4 billion Nm3 per day. Natural gas is consumed by the following sectors (share in consumption in 2020): the electric power sector (29% of total consumption), the industrial sector (32% of total consumption), the residential sector (25% of total consumption), the commercial sector (13.5% of total consumption), and other (0.5% of total consumption). In addition, in the US, the consumption of natural gas has increased significantly in the last 70 years from 141.6 to 849.6 billion Nm3 per year. Sectors of the economy are similarly dependent on natural gas as the EU market [5].
Natural gas is also a strategic element of the European Union’s energy transformation policy towards net zero CO2 emissions. This is because the European Union policy of green energy transformation puts the main emphasis on unstable generation sources, such as wind and sun, which must be immediately replaced by other generation sources in the event of unfavorable weather conditions.
The scale of this necessity is evident when we consider the average power coefficient factor for solar and wind power plants. In the European regions with the highest irradiation, the is below 0.2 and mostly close to 0.1 [6,7]. The average value for onshore wind farms is 0.21 and for offshore wind farms, 0.32 [8]. Specific examples are the Margonin onshore wind farm with , the North Hoyle offshore wind farm with , and the Scroby Sands offshore wind farm with [7,9,10,11,12]. In addition, it should be noted that the additional power losses experienced by wind farms are related to their location and prevailing wind directions and can be as high as 23% for a badly designed wind farm, and even 12.5% for a properly designed wind farm [13,14].
The data quoted above mean that for a significant part of the year, these sources do not generate the rated power and must be replaced with conventional rapid-response power plants. Currently, the only technology that can meet these requirements are simple cycle gas turbines [15], which are characterized by high operational flexibility, but at the cost of low efficiency up to 35% [16].
The combination of renewable energy technologies and gas power plants as their primary substitute has created a very dangerous precedent. On the one hand, having a large amount of RES should theoretically lead to energy independence, but on the other hand, the more RES, the greater the demand for natural gas, which must be imported from outside the European Union.
This problem has recently become very visible in the EU due to the lack of sufficient diversification of gas supplies, and gas supply disruptions have been often political rather than technological in nature.
The current economy is strongly based on natural gas. At the same time, due to long-term energy transformation and circular economy policies, there is a need to abandon this energy source. The assumed direction of energy transformation in the European Union cannot be stopped at the moment, but it needs to be modified to ensure both the reduction of greenhouse gas emissions and energy independence. It seems that one of the ways to achieve this is through the development of effective technologies for the production of biogas from available wastes. Biomethane (which is a purified biogas) is chemically similar to natural gas, but can be considered as green due to its origin. Recent geopolitical events increase the importance of such actions in terms of energy independence. Therefore, this paper aims to present the perspectives related to biogas as a replacement of natural gas: report the potential of its production and structure of sources, sum up availability of technologies, and identify resulting roadblocks.
The approach presented in the work allows us to look at the challenges of the green transformation from a new perspective, in which biogas plays a key role. In addition, the analysis led to new and important findings and recommendations addressing the challenges of utilization of the biogas potential.
2. Future Critical Applications of Biogas
Natural gas helps to avoid greenhouse gas emissions in the short term and has been agreed to be a transition fuel on the way to a zero-emission economy based on renewable energy sources [17]. Ultimately, natural gas has to be phased out as a nonzero-emission fossil fuel, despite the fact that it plays an increasingly important role in the energy market. It makes its bioalternative a crucial part of future energy systems, as it is critical to the achievement of a very ambitious plan of green transformation to a zero-emission society and industry. The critical future applications of biogas and biomethane are briefly discussed below.
2.1. Circular Economy
One of the major challenges facing our society and the environment is the transition to a circular economy, which has been recognized by the European Union [18] and the United Nations (UN) [19]. Biogas is an important link in the circular economy chain in terms of energy and waste management. Biogas production not only enables the mitigation of unorganized emissions [20] from municipal and agricultural waste, which in Europe together with enteric fermentation and manure account for 78% of total methane emissions (17.6 out of 22.6 MT per year, 26.7 billion Nm3 out of 34.3 billion Nm3 per year) [21], but also turns it into a green, zero-emission fuel, chemical substrate or energy source.
2.2. Stabilization of Renewable Energy Sources
It is well known that wind and solar energy technologies are very variable RES, whose production is fully determined by weather conditions. In addition, they are uncertain and location-specific. Due to these three main disadvantages, the integration of RES with the electric network requires a significant number of additional power sources for immediate start-up and a large number of energy storage facilities [22].
Generally, the worst-case scenario would be weather conditions without enough wind and sun to run any of the RES installed. In practice, periods of 10 days without sufficient wind occur regularly across Europe, causing marginal production from wind farms [8,23] and thus indicating a high demand for immediate start-up energy sources (demand for flexibility).
There are many research data, summarized in [24,25], showing that any increase in RES installations would require additional immediate start-up energy sources and energy storage. The data collected in the [24] review shows that the required energy reserve that must be available ranges from 40% to 20% of the annual electricity demand, depending on the size of the network and the share of RES. The main conclusion of the work [8] analyzing power production by wind farms across Europe is even more pessimistic and states that RES practically requires 100% reserve in dispatch systems.
The above agrees well with the estimates presented in the works [23,26,27]. It was shown that assuming an annual demand for electricity in Poland of 174 TWh and in the case of a 100% RES-based system, the required storage capacity would be 2400 GWh and it would be necessary to install an additional 32.1 GW of capacity in gas-steam power plants. On the other hand, assuming the existence of 15 GW of power in the base, the required storage capacity was 1400 GWh and additionally 19 GW of power in gas-steam power plants.
The article [25] estimated the needs of the power system in terms of flexibility in various time and spatial scales. Net load ramp rates were shown to exceed 25% of peak load and begin to increase strongly already for systems with a RES share of over 30% of total energy.
The data and arguments cited above indicate the necessity for immediate start-up of other generation sources, and the only such reliable technology is currently Simple Cycle Gas Turbine [15]. It should be mentioned at this point that there is a large amount of research from which it can be concluded that an energy system fully based on wind and solar power generation would practically not be able to sustain and reproduce itself [22,28,29]. Especially, it would not be sufficient to sustain energy-intensive societies [30] and, as a result, would lead to a significant deterioration in the quality of life [31].
2.3. Alternative Fuel
Biogas is listed (in purified and liquefied form as liquefied biomethane) as preferable marine and aviation fuel by [32], due to its high energy density. Biogas can also be a fuel itself either as CBM (compressed biomethane) or as LBM (liquefied biomethane) replacing CNG or LNG, as chemically biomethane and natural gas are the same species. LNG is currently a rapidly growing fuel for marine transportation [33] and road trucks [34].
2.4. Green Ammonia Production
Biogas can also become an important component of green ammonia production. Currently, 80% of the ammonia production is used for fertilizers [35]. However, ammonia is also considered a zero-emission fuel for marine applications [36,37] and vehicles [38], which can disrupt fertilizer supply, negatively affecting the food market [36]. Most ammonia is produced by the Haber–Bosch process by steam methane reforming [36]. In 2017, the share of natural gas for global ammonia production was approximately 68% [36]. Moreover, natural gas has been reported to contribute 70–85% of ammonia production costs [36]. Achieving the goals of green transformation requires tackling the challenge of ammonia production without fossil fuels. Ammonia production can generally be achieved in two ways. The conventional pathway uses natural gas or gasified coal or biomass [36]. The produced ammonia cannot be considered a green one as it is produced from nonzero-emission components. In turn, the green pathway requires zero-emission energy source (electric or thermal) to produce green hydrogen and nitrogen which can be converted to ammonia in the Haber–Bosch process [36]. The alternative green pathway is the replacement of natural gas with biomethane [39]. This alternative green approach can help meet the growing demand for green ammonia. Moreover, ammonia can be also recovered from digestate during anaerobic digestion [40] which is a promising method for promoting the nitrogen cycle, energy saving, and GHG emission reduction.
Biogas will not only replace natural gas in its current applications, but is also an extremely important element of green transformation policies. Without biogas, it will be unlikely to ensure stable operation of an RES-based energy system, meet the increased demand for green ammonia (affecting the food market) or successfully replace fossil fuels with the green one.
3. Scale, Characteristics and Breakdown of Biogas Sources
The production potential of biomethane in the European Union is estimated at 45 billion Nm3 per year in 2030 and should reach 165 in 2050 [41]. In the case of Poland, which belongs to the largest and substantially industrialized European Union countries and can serve as a case study, the production potential of biomethane according to various sources is estimated at 4.3 [42] to 7.3 [43] billion Nm3 per year, which is one third of the domestic gas demand. Some less up-to-date sources [44] report that this potential is even greater than 14.5 billion Nm3. The highest amount of biomethane can potentially be obtained from wastes from the agriculture sector, which is widely developed in Poland. In addition to agriculture, municipal waste and sewage sludge can also be an important source. The structure of potential sources of biomethane is summarized in Table 1.

Table 1.
Structure of potential sources of biomethane in Poland [43].
Beside the overall production potential, for a correct analysis of the potential of the biomethane production sector in Poland, it is also crucial to determine the structure of individual sources by size. The results of the analysis for the selected biomethane sources are presented in Figure 1.
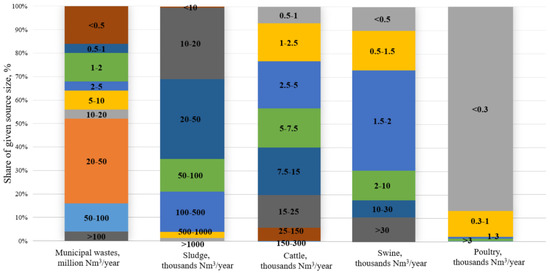
Figure 1.
The size distribution of biomethane sources. The labels indicate the range of sizes of the corresponding source in . The size of an individual colored block corresponds to the share of given range in %.
According to statistical data published by [45], in 2020, more than 13 MT of municipal waste were generated in Poland, of which 5.2 MT is intended for landfill and almost 1.6 is intended for fermentation. Importantly, the amount of waste landfilled each year slowly decreases, while the amount of waste for fermentation grows rapidly. In 2020, there were 271 landfills operating [45] and only such landfills were taken into account. The size distribution of the biomethane sources from landfills is presented in Figure 1.
The amount of municipal wastewater produced by the Polish society in 2020 exceeded 1 billion Nm3 [45], the wastewater was treated at 1524 sewage treatment plants [46]. The size distribution of the biomethane sources from sewage sludge is presented in Figure 1.
In 2020, almost 6 million head of cattle were bred in Poland on more than 270 thousand farms [47], the vast majority of breeding takes place in small farms not exceeding 25 cattle, which translates into an annual BM potential of 15 thousand Nm3. Approximately 9.5 million swines were bred on more than 83 thousand farms [47], the largest part of breeding takes place on farms with 10 to 49 breeding animals, the potential of which is estimated at 1.5–2 thousand Nm3/year. More than 132 million poultry were raised on more than 355 thousand farms [47], of which almost 310,000 are farms with less than 49 hens with a potential of less than 0.3 thousand Nm3/year. The size distribution of the biomethane sources from the cattle, swine, and poultry farms is presented in Figure 1.
Figure 2 shows the share of all sources of various sizes in the total production of biomethane in Poland. The available sources have capacities ranging from hundreds to tens of millions Nm3/year. The smallest available source, with a capacity of 150 Nm3/year, comes from poultry farming in henhouses with 1 to 50 hens. There are over 300,000 such henhouses in Poland.
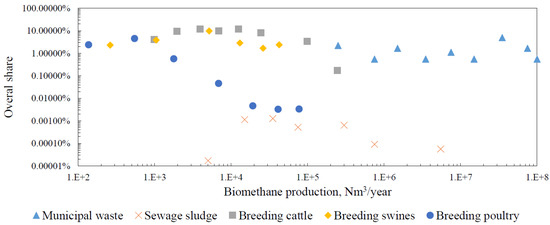
Figure 2.
The size distribution of biomethane from all sources.
4. Review of Biogas-Related Technologies
Biogas should to be purified before use, which requires complex purification processes. Due to the high distribution of the potential biogas sources and its usually distant location from inhabited areas (due to smell, noise, etc.), the liquefaction can be also a suitable technology. The biomethane liquefaction allows to omit the limitations of the lack of access to gas infrastructure by storing it in a high-density form and transporting it via so-called virtual gas pipelines. Such an approach enables one to utilize even small biogas sources that significantly contribute to the overall biogas production potential.
In order to liquefy the biomethane, its high purity must be guaranteed. The permissible levels of contaminants in biomethane before the liquefaction process are 0.5 ppm of H2O, 3.5 ppm of H2S, and 50–120 ppm of CO2 [48].
4.1. Purification of Biogas
Due to the fact that the CO2 content in raw biogas can reach 40–50%, its removal to the required level is the main problem. For this reason, the review of biomethane purification methods places the greatest emphasis on CO2 removal. Table 2 provides an overview of mature commercially available biogas purification technologies. Commercially available technologies enable deep purification of biogas (purity around 98%), through the following processes: adsorption [49,50], absorption [51,52,53,54,55], cryogenic [56,57], and membrane separation [48,58,59,60]. In the case of the adsorption process, the adsorbents used are activated carbons, zeolites, silica gels, molecular sieves, and metal–organic frameworks [61,62]. The absorption-based technologies use water or amines [63,64], whereas in the case of membrane technologies, polymer or carbon fibers are used [65,66]. From developing biogas purification methods biological methods such as biomethanation [67] and photosynthetic biogas upgrading [68] are promising.
In the case of the discussed topic, the use of cryogenic separation can be an extremely useful method. Due to the fact that the normal boiling point of biogas components differs significantly (H2S: −60 °C, CO2: −78.4 °C and CH4: −161.5 °C [69]), cryogenic processes can be used for biogas purification and its subsequent liquefaction. Most commercial gas cleaning methods require the removal of H2S and water vapor from the gas prior to the CO2 removal process. For H2S, the most widely used pre-cleaning method is adsorption in activated carbon filters [48]. For the removal of water vapor, cryogenic, and adsorption methods are used.
As a result of the analysis of the available biogas purification methods, it can be concluded that the offered installations are dedicated to purifying gas from sources with a capacity above 100 Nm3/h.
To the knowledge of the authors, there are no technological conditions that forbid biogas treatment for smaller sources but the unit costs of such installations may be higher than those presented in Table 2.
Table 2.
Comparison of commercially available methods of biogas purification.
4.2. Liquefaction of Biomethane
The liquefaction of biomethane simplifies its storage and transport. The review work [73] has compared the available market solutions for biomethane liquefaction and its summary is presented in Figure 3. The current market has a limited offer in the case of a liquefaction capacity below 100 Nm3/h of biomethane. The available technologies below 100 Nm3/h are characterized by high energy consumption per unit of LBM exceeding 1.2 kWh/kg and in the case of Stirling liquefiers, it can also be expensive. An additional solution that can be adjusted to a capacity below 100 Nm3/h is liquefaction through liquid nitrogen (LN). Most of the energy consumption of this technology is included in the price of LN.
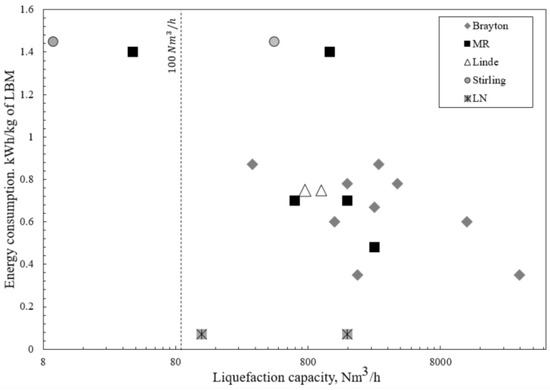
Figure 3.
Summary of the availability for biomethane liquefaction by capacity and energy consumption with respect to liquefaction technology [73].
Biogas-related technologies that enable its purification and liquefaction are commercially available, but mainly for capacities greater than 100 Nm3/h of biomethane.
5. Discussion
Analysis of the distribution of size of biogas sources indicates significant diversification. The largest sources identified with capacities exceeding 100 million Nm3/year (over 11,000 Nm3/h) are municipal landfills, where hundreds of thousands of tons of waste are stored annually. Sources with a capacity of 1 to 25 thousand Nm3/year (0.1–2.85 Nm3/h) are responsible for more than 70% of the total biomethane production in Poland. Sources of capacity not exceeding 100 Nm3/h comprise approximately 90% of total potential biomethane production.
On the one hand, utilization of such a small source can be challenging; on the other hand, the share of these sources is too significant to stay unused. Few solutions can be applied to overcome this limitation related to dispersion of the biomethane sources: actions resulting in consolidation of biogas sources, consolidation of wastes from dispersed sources, modification of the wastes logistics (by consolidation of waste streams) or local small-scale biogas production together with its upgrading to biomethane. The economic viability of these options obviously depends on many factors (such as the dispersion of waste sources, the prices of fuel and labor, the local legislation on waste management, and the current situation in the energy market) and should be further investigated. This paper focuses on the last option to identify potential roadblocks in this field.
The review of biogas-related technologies indicates that such technologies are commercially available, but mainly for capacities greater than 100 Nm3/h of biomethane. Breakdown analysis of biogas sources shows that a significant share of the potential biogas production is in the sources of capacity below 100 Nm3/h. Therefore, currently available technologies do not allow for full utilization of biogas potential. Biogas-related technologies such as purification and liquefaction should be downscaled in order to cover the smallest but also the most numerous biogas sources. Downscaling of biogas-related technologies will enhance the economic challenges: energy consumption per unit of biogas and investment costs of such systems.
6. Conclusions
Natural gas plays an important role in the current economy. It is likely that due to the ongoing green strategy, its importance will increase as it is one of only few energy sources capable of stabilizing wind and solar power plants. LNG becomes an important marine fuel as it meets the requirements of International Marine Organization regulations in Emission-Controlled Areas. On the other hand, the circular economy strategy increases the role of waste-to-product solutions. A potential answer to all the above-mentioned challenges can be the production of biogas.
Successful utilization of biogas requires a profound understanding of its potential, structure, and specificity of its production. The presented data show that biogas has significant potential and, for the selected case study, compares well with the current demand for natural gas.
An important issue to consider is the significant dispersion and remoteness of biogas sources. This can become a significant roadblock on the way to full utilization of biogas potential. Few solutions can be applied to overcome the limitations mentioned above: actions resulting in consolidation of biogas sources, consolidation of wastes from dispersed sources, the modification of waste logistics, and increasing the availability of purification and liquefaction technologies to utilize the sources as they are.
Therefore, the review of biogas-related technologies and potential sources sizes has shown that full utilization of these distributed biogas sources requires the downscaling of existing purification and liquefaction technologies. Almost 90% of the Polish biomethane potential comes from sources with capacities lower than 100 Nm3/h which is currently the minimum commercially available capacity of the biogas purification system.
The downscaling of existing purification and liquefaction technologies, together with alternative solutions listed above, appears to be required to successfully implement biogas production and fully utilize its potential. In addition, technology downscaling will probably be challenging, especially in terms of economics.
Author Contributions
Conceptualization, Z.R.; methodology, Z.R., M.S., D.Ł. and Z.M.; investigation, Z.R., M.S., D.Ł. and Z.M.; resources, Z.R., M.S., D.Ł. and Z.M.; writing—original draft preparation, Z.R., M.S., D.Ł. and Z.M.; writing—review and editing, Z.R., M.S., D.Ł. and Z.M.; visualization, Z.R. and M.S.; supervision, Z.R. All authors have read and agreed to the published version of the manuscript.
Funding
This research received no external funding.
Informed Consent Statement
Not applicable.
Data Availability Statement
Not applicable.
Conflicts of Interest
The authors declare no conflict of interest.
Abbreviations
The following abbreviations are used in this manuscript:
| CBM | Compressed biomethane |
| CNG | Compressed natural gas |
| LBM | Liquefied biomethane |
| LNG | Liquefied natural gas |
| RES | Renewable Energy Sources |
References
- Sönnichsen, N. Natural Gas Share in Electricity Production Worldwide from 2000 to 2021; Statista: Hamburg, Germany, 2022. [Google Scholar]
- Banaszkiewicz, T.; Chorowski, M.; Gizicki, W.; Jedrusyna, A.; Kielar, J.; Malecha, Z.; Piotrowska, A.; Polinski, J.; Rogala, Z.; Sierpowski, K.; et al. Liquefied natural gas in mobile applications—Opportunities and challenges. Energies 2020, 13, 5673. [Google Scholar] [CrossRef]
- DNV-GL. LNG as Ship Fuel the Future—Today; DNV-GL: Baerum, Norway, 2014; pp. 1–56. [Google Scholar]
- Wilczewski, V.Z.W. Europe Relies Primarily on Imports to Meet Its Natural Gas Needs; U.S. Energy Information Administration: Washington, DC, USA, 2022.
- U.S. Energy Information Administration. Use of Natural Gas; U.S. Energy Information Administration: Washington, DC, USA, 2021.
- Gallego-Castillo, C.; Heleno, M.; Victoria, M. Self-consumption for energy communities in Spain: A regional analysis under the new legal framework. Energy Policy 2021, 150, 112144. [Google Scholar] [CrossRef]
- Malecha, Z. Risks for a Successful Transition to a Net-Zero Emissions Energy System. Energies 2022, 15, 4071. [Google Scholar] [CrossRef]
- Linnemann, T.; Vallana, G. Wind energy in Germany and Europe Pt 2 Status, potentials and challenges for baseload application: European situation in 2017. Atw Int. Z. Kernenerg. 2019, 64, 141–148. [Google Scholar]
- Gawronska, G.; Gawronski, K.; Król, K.; Gajecka, K. Wind farms in Poland—Legal and location conditions. The case of Margonin wind farm. GLL Geomat. 2019, 3, 25–39. [Google Scholar] [CrossRef]
- DTI. Capital Grants Scheme for North Hoyle Offshore Wind Farm; Technical Report; UK Government: London, UK, 2006.
- DTI. Capital Grants Scheme for Scroby Sands Offshore Wind Farm; Technical Report; UK Government: London, UK, 2006.
- Burton, T.; Jenkins, N.; Sharpe, D.; Bossanyi, E. Wind Energy Handbook; Wiley: Hoboken, NJ, USA, 2011. [Google Scholar]
- Hansen, K.S.; Barthelmie, R.J.; Jensen, L.E.; Sommer, A. The impact of turbulence intensity and atmospheric stability on power deficits due to wind turbine wakes at Horns Rev wind farm. Wind Energy 2012, 15, 183–196. [Google Scholar] [CrossRef]
- Dahlberg, J.A.; Thor, S.E. Power performance and wake effects in the closely spaced Lillgrund offshore wind farm. In Proceedings of the European Offshore Conference, Stockholm, Sweden, 14–16 September 2009; p. 1. [Google Scholar]
- Gonzalez-Salazar, M.A.; Kirsten, T.; Prchlik, L. Review of the operational flexibility and emissions of gas- and coal-fired power plants in a future with growing renewables. Renew. Sustain. Energy Rev. 2018, 82, 1497–1513. [Google Scholar] [CrossRef]
- Milewski, J.; Badyda, K.; Miller, A. Gas Turbines in Unconventional Applications. In Efficiency, Performance and Robustness of Gas Turbines; InTech: Rijeka, Croatia, 2012. [Google Scholar] [CrossRef]
- Gürsan, C.; de Gooyert, V. The systemic impact of a transition fuel: Does natural gas help or hinder the energy transition? Renew. Sustain. Energy Rev. 2021, 138, 110552. [Google Scholar] [CrossRef]
- European Union. Circular Economy Action Plan; Technical Report; Publications Office of the European Union: Luxembourg, 2020. [Google Scholar] [CrossRef]
- United Nations. The Sustainable Development Goals Report 2022; Technical Report; United Nations: New York, NY, USA, 2022. [Google Scholar]
- Ciuła, A.J.; Kozik, V.; Generowicz, A.; Gaska, K.; Paździor, M.; Barbusiński, K.; Józef, C.; Violetta, K.; Agnieszka, G.; Krzysztof, G.; et al. Emission and Neutralization of Methane from a Municipal Landfill-Parametric Analysis. Energies 2020, 13, 6254. [Google Scholar] [CrossRef]
- UN Environment Programme. Benefits and Costs of Mitigating Methane Emissions | Climate & Clean Air Coalition; UN Environment Programme: Nairobi, Kenya, 2022. [Google Scholar]
- Weissbach, D.; Herrmann, F.; Ruprecht, G.; Huke, A.; Czerski, K.; Gottlieb, S.; Hussein, A. Energy intensitites, EROI (energy returned on invested), for electric energy sources. EPJ Web Conf. 2018, 189, 00016. [Google Scholar] [CrossRef]
- Jedral, W. Generation and storage of large amounts of electricity in the energy transition by 2050. Energetyka Ciepl. Zawodowa 2022, 816, 44–50. (In Polish) [Google Scholar]
- Kondziella, H.; Bruckner, T. Flexibility requirements of renewable energy based electricity systems—A review of research results and methodologies. Renew. Sustain. Energy Rev. 2016, 53, 10–22. [Google Scholar] [CrossRef]
- Huber, M.; Dimkova, D.; Hamacher, T. Integration of wind and solar power in Europe: Assessment of flexibility requirements. Energy 2014, 69, 236–246. [Google Scholar] [CrossRef]
- Jedral, W. Production of 100% electricity in Poland from RES—A real purpose or utopia? (in Polish). Rynek Energii 2022, 160, 3–15. [Google Scholar]
- Jedral, W. Energy storage and hydrogen power engineering in Poland as a result of the power engineering transformation. Rynek Energii 2022, 161, 8–15. (In Polish) [Google Scholar]
- Energy intensities, EROIs (energy returned on invested), and energy payback times of electricity generating power plants. Energy 2013, 52, 210–221. [CrossRef]
- Capellán-Pérez, I.; de Castro, C.; Miguel González, L.J. Dynamic Energy Return on Energy Investment (EROI) and material requirements in scenarios of global transition to renewable energies. Energy Strategy Rev. 2019, 26, 100399. [Google Scholar] [CrossRef]
- Trainer, T. Estimating the EROI of whole systems for 100supply capable of dealing with intermittency. Energy Policy 2018, 119, 648–653. [Google Scholar] [CrossRef]
- Lambert, J.G.; Hall, C.A.; Balogh, S.; Gupta, A.; Arnold, M. Energy, EROI and quality of life. Energy Policy 2014, 64, 153–167. [Google Scholar] [CrossRef]
- DNV. Maritime Forecast to 2050: Energy Transition Look 2022; Technical Report; DNV: Baerum, Norway, 2022. [Google Scholar]
- Maritime Executive. DNV: Orders for LNG-Fueled Ships at Record Pace; Maritime Executive: Plantation, FL, USA, 2022. [Google Scholar]
- NGVA Europe. NGVA Europe Has Published 2020 Gas Vehicle Statistics and Europe Has Reached a New Gas Refuelling Infrastructure Milestone; NGVA Europe: Brussels, Belgium, 2021; pp. 1–3. [Google Scholar]
- Chehade, G.; Dincer, I. Progress in green ammonia production as potential carbon-free fuel. Fuel 2021, 299, 120845. [Google Scholar] [CrossRef]
- Group Technology & Research, D.G. Ammonia as a Marine Fuel; Technical Report; DNV-GL: Baerum, Norway, 2020. [Google Scholar]
- Machaj, K.; Kupecki, J.; Malecha, Z.; Morawski, A.; Skrzypkiewicz, M.; Stanclik, M.; Chorowski, M. Ammonia as a potential marine fuel: A review. Energy Strategy Rev. 2022, 44, 100926. [Google Scholar] [CrossRef]
- International Energy Agency. The Future of Trucks Implications for Energy and the Environment; Technical Report; International Energy Agency: Paris, France, 2017. [Google Scholar]
- Bertilsson, O.B.; Kirchmann, H. Sustainable N fertilizer production based on a loop: Straw—Biogas —‘Haber-Bosch’ process. Agric. Syst. 2021, 190, 103100. [Google Scholar] [CrossRef]
- Yang, D.; Chen, Q.; Liu, R.; Song, L.; Zhang, Y.; Dai, X. Ammonia recovery from anaerobic digestate: State of the art, challenges and prospects. Bioresour. Technol. 2022, 363, 127957. [Google Scholar] [CrossRef] [PubMed]
- Alberici, S.; Grimme, W.; Toop, G. A Gas for Climate Report—Biomethane Production Potentials in the EU; Guidehouse: Utrecht, The Netherlands, 2022. [Google Scholar]
- National Energy and Climate Plan for the Years 2021–2030; Technical Report; Ministry of Climate and Environment: Warsaw, Poland, 2019.
- Piechota, G.; Igliński, B. Biomethane in Poland—Current Status, Potential, Perspective and Development. Energies 2021, 14, 1517. [Google Scholar] [CrossRef]
- Głodek-Bucyk, E.; Janecka, L. Pozyskiwanie i Energetyczne Wykorzystanie Biogazu Rolniczego; Wydawnictwo Instytut Śląski: Krakow, Poland, 2007. [Google Scholar]
- Housing Economy and Municipal Infrastructure in 2020; Technical Report; Statistics Poland: Warsaw, Poland, 2021.
- VI Update of the National Municipal Wastewater Treatment Program; Technical Report; Ministry of Infrastructure: Warsaw, Poland, 2022.
- General Agricultural Census in 2020; Technical Report; Statistics Poland: Warsaw, Poland, 2021.
- Bauer, F.; Hulteberg, C.; Persson, T.; Tamm, D. Biogas Upgrading—Review of Commercial Technologies; Technical Report; Svenskt Gastekniskt Center AB: Malmö, Sweden, 2013. [Google Scholar]
- Alonso-Vicario, A.; Ochoa-Gómez, J.R.; Gil-Río, S.; Gómez-Jiménez-Aberasturi, O.; Ramírez-López, C.; Torrecilla-Soria, J.; Domínguez, A. Purification and upgrading of biogas by pressure swing adsorption on synthetic and natural zeolites. Microporous Mesoporous Mater. 2010, 134, 100–107. [Google Scholar] [CrossRef]
- Grande, C.A. Biogas Upgrading by Pressure Swing Adsorption. In Biofuel’s Engineering Process Technology; dos Santos Bernardes, M.A., Ed.; IntechOpen: Rijeka, Croatia, 2011. [Google Scholar] [CrossRef]
- Ofori-Boateng, C.; Kwofie, E. Water Scrubbing: A Better Option for Biogas Purification for Effective Storage. World Appl. Sci. J. 2009, 5, 122–125. [Google Scholar]
- Paolini, V.; Tratzi, P.; Torre, M.; Tomassetti, L.; Segreto, M.; Petracchini, F. Chapter 3—Water scrubbing for biogas upgrading: Developments and innovations. In Emerging Technologies and Biological Systems for Biogas Upgrading; Aryal, N., Mørck Ottosen, L.D., Wegener Kofoed, M.V., Pant, D., Eds.; Academic Press: Cambridge, MA, USA, 2021; pp. 57–71. [Google Scholar] [CrossRef]
- Rochelle, G.T. Amine Scrubbing for CO2 Capture. Science 2009, 325, 1652–1654. [Google Scholar] [CrossRef] [PubMed]
- Kamopas, W.; Asanakham, A.; Kiatsiriroat, T. Absorption of CO2 in Biogas with Amine Solution for Biomethane Enrichment. J. Eng. Technol. Sci. 2016, 48, 231–241. [Google Scholar] [CrossRef]
- Bas, M.S.; Aragón, A.J.; Torres, J.C.; Osorio, F. Purification and upgrading biogas from anaerobic digestion using chemical asborption of CO2 with amines in order to produce biomethane as biofuel for vehicles: A pilot-scale study. Energy Sources Part A Recover. Util. Environ. Eff. 2022, 44, 10201–10213. [Google Scholar]
- Awe, O.; Zhao, Y.; Nzihou, A.; Pham Minh, D.; Lyczko, N. A Review of Biogas Utilisation, Purification and Upgrading Technologies. Waste Biomass Valorization 2017, 8, 267–283. [Google Scholar] [CrossRef]
- Yousef, A.M.; El-Maghlany, W.M.; Eldrainy, Y.A.; Attia, A. New approach for biogas purification using cryogenic separation and distillation process for CO2 capture. Energy 2018, 156, 328–351. [Google Scholar] [CrossRef]
- Ji, G.; Zhao, M. Membrane Separation Technology in Carbon Capture. In Recent Advances in Carbon Capture and Storage; Yun, Y., Ed.; IntechOpen: Rijeka, Croatia, 2017; Chapter 3. [Google Scholar] [CrossRef]
- Han, Y.; Ho, W.W. Polymeric membranes for CO2 separation and capture. J. Membr. Sci. 2021, 628, 119244. [Google Scholar] [CrossRef]
- Basu, S.; Khan, A.L.; Cano-Odena, A.; Liu, C.; Vankelecom, I.F.J. Membrane-based technologies for biogas separations. Chem. Soc. Rev. 2010, 39, 750–768. [Google Scholar] [CrossRef]
- Bekkering, J.; Broekhuis, A.; van Gemert, W. Optimisation of a green gas supply chain—A review. Bioresour. Technol. 2010, 101, 450–456. [Google Scholar] [CrossRef] [PubMed]
- Cavenati, S.; Grande, C.; Rodrigues, A.; Kiener, C.; Müller, U. Metal organic framework adsorbent for biogas upgrading. Ind. Eng. Chem. Res. 2008, 47, 6333–6335. [Google Scholar] [CrossRef]
- Nock, W.J.; Walker, M.J.; Kapoor, R.; Heaven, S. Modeling the Water Scrubbing Process and Energy Requirements for CO2 Capture to Upgrade Biogas to Biomethane. Ind. Eng. Chem. Res. 2014, 53, 12783–12792. [Google Scholar] [CrossRef]
- Arrhenius, K. Characterisation of Contaminants in Biogas before and after Upgrading to Vehicle Gas Rapport SGC 246; SGC: Malmo, Sweden, 2012. [Google Scholar]
- Petersson, A.; Wellinger, A. Biogas Upgrading Technologies-Developments and Innovations Task 37-Energy from Biogas and Landfill Gas; Technical Report; IEA Bioenergy: Paris, France, 2009. [Google Scholar]
- Baker, R.W. Membrane Technology and Applications, 2nd ed.; John Wiley & Sons: Hoboken, NJ, USA, 2004. [Google Scholar]
- Angelidaki, I.; Karakashev, D.; Batstone, D.J.; Plugge, C.M.; Stams, A.J. Chapter sixteen—Biomethanation and Its Potential. In Methods in Methane Metabolism, Part A; Rosenzweig, A.C., Ragsdale, S.W., Eds.; Methods in Enzymology; Academic Press: Cambridge, MA, USA, 2011; Volume 494, pp. 327–351. [Google Scholar] [CrossRef]
- Bose, A.; Lin, R.; Rajendran, K.; O’Shea, R.; Xia, A.; Murphy, J.D. How to optimise photosynthetic biogas upgrading: A perspective on system design and microalgae selection. Biotechnol. Adv. 2019, 37, 107444. [Google Scholar] [CrossRef] [PubMed]
- Lemmon, E.W.; Bell, I.H.; Huber, M.L.; McLinden, M.O. NIST Standard Reference Database 23: Reference Fluid Thermodynamic and Transport Properties-REFPROP; Version 10.0; National Institute of Standards and Technology: Gaithersburg, MD, USA, 2018. [CrossRef]
- Bishnoi, S.; Rochelle, G.T. Absorption of carbon dioxide in aqueous piperazine/methyldiethanolamine. Aiche J. 2002, 48, 2788–2799. [Google Scholar] [CrossRef]
- Pan, X.; Clodic, D.; Toubassy, J. CO2 capture by antisublimation process and its technical economic analysis. Greenh. Gases Sci. Technol. 2013, 3, 8–20. [Google Scholar] [CrossRef]
- Ahmed, S.; Rahman, M.M.; Tarannum, K.; Chowdhury, A.; Rafa, N.; Nuzhat, S.; Senthil Kumar, P.; Vo, D.V.; Lichtfouse, E.; Mahlia, T.M.I. Biogas upgrading, economy and utilization: A review. Environ. Chem. Lett. 2021, 19, 4137–4164. [Google Scholar] [CrossRef]
- Capra, F.; Magli, F.; Gatti, M. Biomethane liquefaction: A systematic comparative analysis of refrigeration technologies. Appl. Therm. Eng. 2019, 158, 113815. [Google Scholar] [CrossRef]


Disclaimer/Publisher’s Note: The statements, opinions and data contained in all publications are solely those of the individual author(s) and contributor(s) and not of MDPI and/or the editor(s). MDPI and/or the editor(s) disclaim responsibility for any injury to people or property resulting from any ideas, methods, instructions or products referred to in the content. |
© 2023 by the authors. Licensee MDPI, Basel, Switzerland. This article is an open access article distributed under the terms and conditions of the Creative Commons Attribution (CC BY) license (https://creativecommons.org/licenses/by/4.0/).