Article

Numerical Study on Thermodynamic Coupling Characteristics of Fluid Sloshing in a Liquid Hydrogen Tank for Heavy-Duty Trucks

1
Institute of Refrigeration and Cryogenic Engineering, Xi’an Jiaotong University, Xi’an 710049, China
2
Beijing Institute of Aerospace Testing Technology, Beijing 100074, China
*
Author to whom correspondence should be addressed.
Energies 2023, 16(4), 1851; https://doi.org/10.3390/en16041851
Submission received: 7 January 2023 / Revised: 6 February 2023 / Accepted: 9 February 2023 / Published: 13 February 2023
(This article belongs to the Special Issue Advances in Hydrogen Production and Hydrogen Storage)

Abstract

:
The large-amplitude sloshing behavior of liquid hydrogen in a tank for heavy-duty trucks may have adverse effects on the safety and stability of driving. With successful application of liquid hydrogen in the field of new energy vehicles, the coupled thermodynamic performance during liquid hydrogen large-amplitude sloshing becomes more attractive. In this paper, a three-dimensional numerical model is established to simulate the thermodynamic coupling characteristics during liquid hydrogen sloshing in a horizontal tank for heavy-duty trucks. The calculation results obtained by the developed model are in good agreement with experimental data for liquid hydrogen. Based on the established 3D model, the large-amplitude sloshing behavior of liquid hydrogen under extreme acceleration, as well as the effects of acceleration magnitude and duration on liquid hydrogen sloshing, is numerically determined. The simulation results show that under the influence of liquid hydrogen large-amplitude sloshing, the convective heat transfer of fluid in the tank is greatly strengthened, resulting in a decrease in the vapor temperature and an increase in the liquid temperature. In particular, the vapor condensation caused by the sloshing promotes a rapid reduction of pressure in the tank. When the acceleration magnitude is 5 g with a duration of 200 ms, the maximum reduction of ullage pressure is 1550 Pa, and the maximum growth of the force on the right wall is 3.89 kN. Moreover, the acceleration magnitude and duration have a remarkable influence on liquid hydrogen sloshing. With the increase in acceleration magnitude or duration, there is a larger sloshing amplitude for the liquid hydrogen. When the duration of acceleration is 200 ms, compared with the situation at the acceleration magnitude of 5 g, the maximum reductions of ullage pressure decrease by 9.46% and 55.02%, and the maximum growth of forces on the right wall decrease by 80.57% and 99.53%, respectively, at 2 g and 0.5 g. Additionally, when the acceleration magnitude is 5 g, in contrast with the situation at a duration of acceleration of 200 ms, the maximum-ullage-pressure drops decrease by 8.17% and 21.62%, and the maximum increase in forces on the right wall decrease by 71.80% and 88.63%, at 100 ms and 50 ms, respectively. These results can provide a reference to the safety design of horizontal liquid hydrogen tanks for heavy-duty trucks.

1. Introduction

To achieve the strategic goals of global carbon peak and carbon neutrality, hydrogen, as a renewable clean energy with high efficiency, has been attracting increasing attention [1]. In the application of hydrogen energy, hydrogen fuel cell is an important carrier for the hydrogen industrial chain [2]. Due to the excellent performances in terms of high energy density, high power, and zero emissions, hydrogen fuel cells are considered suitable for the long-distance transportation of heavy vehicles with large loads. At present, automobile manufacturers from all over the world are exploring the development of hydrogen vehicles using hydrogen fuel cells, such as Toyota’s “Beta FCET”, Foton’s “32T LH2 heavy truck”, Ford’s “F250”, Bavarian Motor Works (BMW)’s “BMW745i”, Dongfeng’s “Tianlong KL”, etc. In terms of existing automotive applications, there are three dominating methods for hydrogen storage in vehicle tanks: metal hydride, high-pressure gaseous hydrogen, and cryogenic liquid hydrogen [3,4,5,6,7,8,9]. Compared with the metal hydride and high-pressure gaseous hydrogen storage forms, cryogenic liquid hydrogen storage has the advantages of high-density storage, high vaporization purity, low storage pressure and low transportation costs. As such, storage of liquid hydrogen can reach a volumetric density of about 75 kg/m3 (for liquid hydrogen at 1 atm and 20 K), approximately double that of high-pressure gas cylinders (for compressed hydrogen at 350 or 700 bar at 300 K), and a gravimetric density (kg hydrogen/kg tank) of about 10% [10]. Therefore, utilizing the liquid hydrogen storage method can effectively improve the hydrogen carrying capacity of vehicles and the energy conversion efficiency of the system, extend the driving range of vehicles [11], and reduce the dependence on hydrogen refueling stations. As the crucial carrier of liquid hydrogen storage in the field of automobiles, the investigation of liquid hydrogen tanks for vehicles is of great significance.
Early in 1970s, Germany and France developed liquid hydrogen tanks for vehicles, based on their experience of the application of liquid hydrogen in space rockets [12]. In 1970, the first Ford pickup truck in world, carrying two LSH-150 liquid hydrogen tanks, was designed by the Perris Smogless Automobile Association (PSAA) [13]. In 1974, Billings Energy Corporation (BEC) developed a hydrogen-fueled Chevrolet Sedan, which carrying an 18-gallon Beech tank. The tank has a 4.9 percent daily hydrogen boiloff rate under normal venting conditions [14]. In 1980, Los Alamos Scientific Laboratory (LASL) developed a horizontal liquid hydrogen tank with a diameter of 0.712 m and a volume of 155 L. The heat leakage rate of the tank is 2 W and the daily evaporation rate is 4% [15]. In 1988, BMW launched a prototype of the BMW 735i converted to hydrogen, and equipped with a 120 L tank for LH2, which is capable of running for 200 km [16]. In 1997, the Messel company and BMW co-developed a 420-mm-diameter liquid hydrogen tank for buses, which can store 350 L of liquid hydrogen at a maximum operating pressure of 5 bar [17]. In 2000, Opel produced an experimental car (Opel Hydrogen 1) equipped with LH2-storage systems, and at the same year, 15 BMW hydrogen 7 cars were exhibited with H2-combustion engines and LH2 tanks from MAGNA STEYR [18]. In 2003, Chinese researchers independently developed the first liquid hydrogen tank test prototype in China. For the tank, the effective volume was 70 L, the diameter of the inner tank was 350 mm, and the theoretical daily evaporation rate of liquid hydrogen was 8.36% [19]. In 2006, BMW launched the first mass-produced BMW liquid hydrogen 7 sedan in world. The weight of the liquid hydrogen storage tank was 165 kg. In 2020, Foton launched the first 32T liquid hydrogen heavy truck in world.
As introduced above, the liquid hydrogen tank for vehicles is currently in the experimental stage. However, although the liquid hydrogen tank for vehicles has not been applied commercially on a large scale, a large amount of research has been performed to study the key technologies of liquid hydrogen tank for vehicles by scholars [20,21,22,23,24,25,26,27,28,29,30,31,32,33]. Escher [20] surveyed and summarized the application of liquid hydrogen tank technology in detail for highway vehicle fuel systems. Michel et al. [21] performed research on liquid hydrogen technologies for mobile use. The LH2 storage system was designed and optimized, achieving a weight reduction of about 50% and without decreasing the features of thermal quality and functionality. Ahluwalia et al. [22] researched the cryo-compressed hydrogen storage tank systems for automotive applications. The results showed that storing liquid hydrogen in insulated pressure vessels could effectively increase hydrogen storage density and extend vessel dormancy time. Maekawa et al. [23] developed an external-heating-type superconducting magnesium diboride (MgB2) level sensor for a liquid hydrogen (LH2) tank. Wallner et al. [24] evaluated the performance and techniques of BMW Hydrogen 7 Mono-Fuel demonstration vehicles. Schultheiß [25] developed a permeation barrier for lightweight liquid hydrogen tanks. The flow of hydrogen permeate gas through the inner vessel of liquid hydrogen tank was reduced by more than 7400 times. Zhang and Miao et al. [15,26] summarized the system structure, working mode and core components development of liquid hydrogen tank for vehicles. The existing key technical challenges were analyzed, and the development prospects of liquid hydrogen tank for vehicles was discussed. Wei et al. [27] tested the cryogenic response, temperature cycle performance and leakage of the liquid hydrogen valve.
From the above survey, although scholars have made some breakthroughs and progress in research on liquid hydrogen systems for vehicles, there are few studies on the thermodynamic coupling characteristics of liquid hydrogen tanks for vehicles under complex sloshing conditions. The fluid sloshing behavior has a significant impact on the strength design of liquid hydrogen tank, the flow stability of pressurized liquid supply systems, and the thermophysical distribution characteristics of the fluid within the tank after the blending of hot and cold fluids, especially for the sloshing of liquid hydrogen within tank. Due to its low viscosity, the liquid hydrogen is prone to severe liquid movements even under slight vibrations. The large-amplitude sloshing behavior of liquid hydrogen may cause serious disturbances to the thermodynamic equilibrium within the tank, to the detriment of operational stability for liquid hydrogen vehicles. When the liquid hydrogen in tank sloshes substantially, if the liquid is in a supercooled state, the vapor will be condensed under the cooling of subcooled liquid, which may lead to a depressurization for vapor phase within tank in serious case. In addition, under the large-amplitude liquid sloshing, the internal support structure of tank may be subjected to great impact pressure and disturbance moments. These factors may lead to the instability of pressure and flow control or the destruction of the tank support structure, posing a potential hazard to the driving safety of liquid hydrogen vehicles. Generally, liquid hydrogen vehicles exhibit varying amplitude of liquid sloshing during starting, accelerating, turning, braking and driving under bumpy road conditions. In particular, for large-amplitude liquid sloshing behavior, even though the duration is short, there is still a potential threat to the operational stability of liquid hydrogen vehicles, which may cause extremely serious consequences. Therefore, it is of great significance to investigate the large-amplitude sloshing characteristics of the fluid within the liquid hydrogen tank for vehicles and the liquid sloshing behavior under different acceleration magnitudes or durations.
At present, the research on fluid sloshing in the tank for vehicles is mainly focused on normal-temperature medium or cryogenic liquefied natural gas (LNG). Although there are few studies on the liquid hydrogen sloshing within the tank for vehicles, scholars have conducted relevant studies on the sloshing of cryogenic fluid in the field of aerospace [34,35,36,37,38,39,40,41,42,43,44,45,46,47,48,49,50,51,52,53,54], which can provide a reference for the research on fluid sloshing in liquid hydrogen tank for vehicles. Lacapere [42] conducted slosh experiments with cryogenic liquid nitrogen and liquid oxygen, and concluded that the pressure reduction inside the closed vessel was mainly attributed to the heat and mass transfer at interface during sloshing. Moran [43] performed some sloshing experiments with liquid hydrogen in a 62 cubic foot spherical tank for National Aero-Space Plane (NASP) project. Berglund et al. [44] numerically investigated the LH2 sloshing process in the second-stage tank during a coast period. The results showed that excessive LH2 sloshing could result in thrust imbalance. Sherif et al. [45] indicated that the fluid sloshing process within liquid hydrogen vessel for vehicles may transform the liquid impact energy to thermal energy, which eventually led to an increase in the evaporation rate of liquid hydrogen. Chung et al. [46] numerically investigated the sloshing process of liquid hydrogen in shipping tanks under three different filling level conditions. Liu [47] numerically and experimentally researched the anti-vibration performance of LNG tank for heavy-duty trucks subjected to external sloshing excitation. The anti-sway device inside the tank was designed and optimized. Zhang [48] experimentally and numerically investigated the nonlinear sloshing of liquid within automotive tanks. A numerical method based on a nonlinear sloshing calculation scheme was proposed.
According to the above literature, there have been many studies on cryogenic fluid sloshing currently, but most are focused on the aerospace field. Meanwhile, these studies mostly emphasize fluid sloshing dynamics, whereas the thermodynamic coupling performance during the cryogenic fluid sloshing have been less considered. Therefore, in this paper, to study the liquid hydrogen sloshing behavior in a horizontal tank for heavy-duty trucks, we plan to establish a three-dimensional CFD numerical simulation model considering the effects of fluid–structure interaction and non-uniform heat leakage. The thermodynamic characteristics of large-amplitude liquid hydrogen sloshing, and the influence of acceleration magnitude or duration on liquid hydrogen sloshing, are numerically conducted based on the developed model. The variations in fluid motion, temperature, pressure and the force on the wall within the tank during liquid hydrogen sloshing are obtained, which is of great significance to the design of liquid hydrogen tanks for heavy-duty trucks.

2. Establishment of Fluid–Solid Coupling Numerical Model

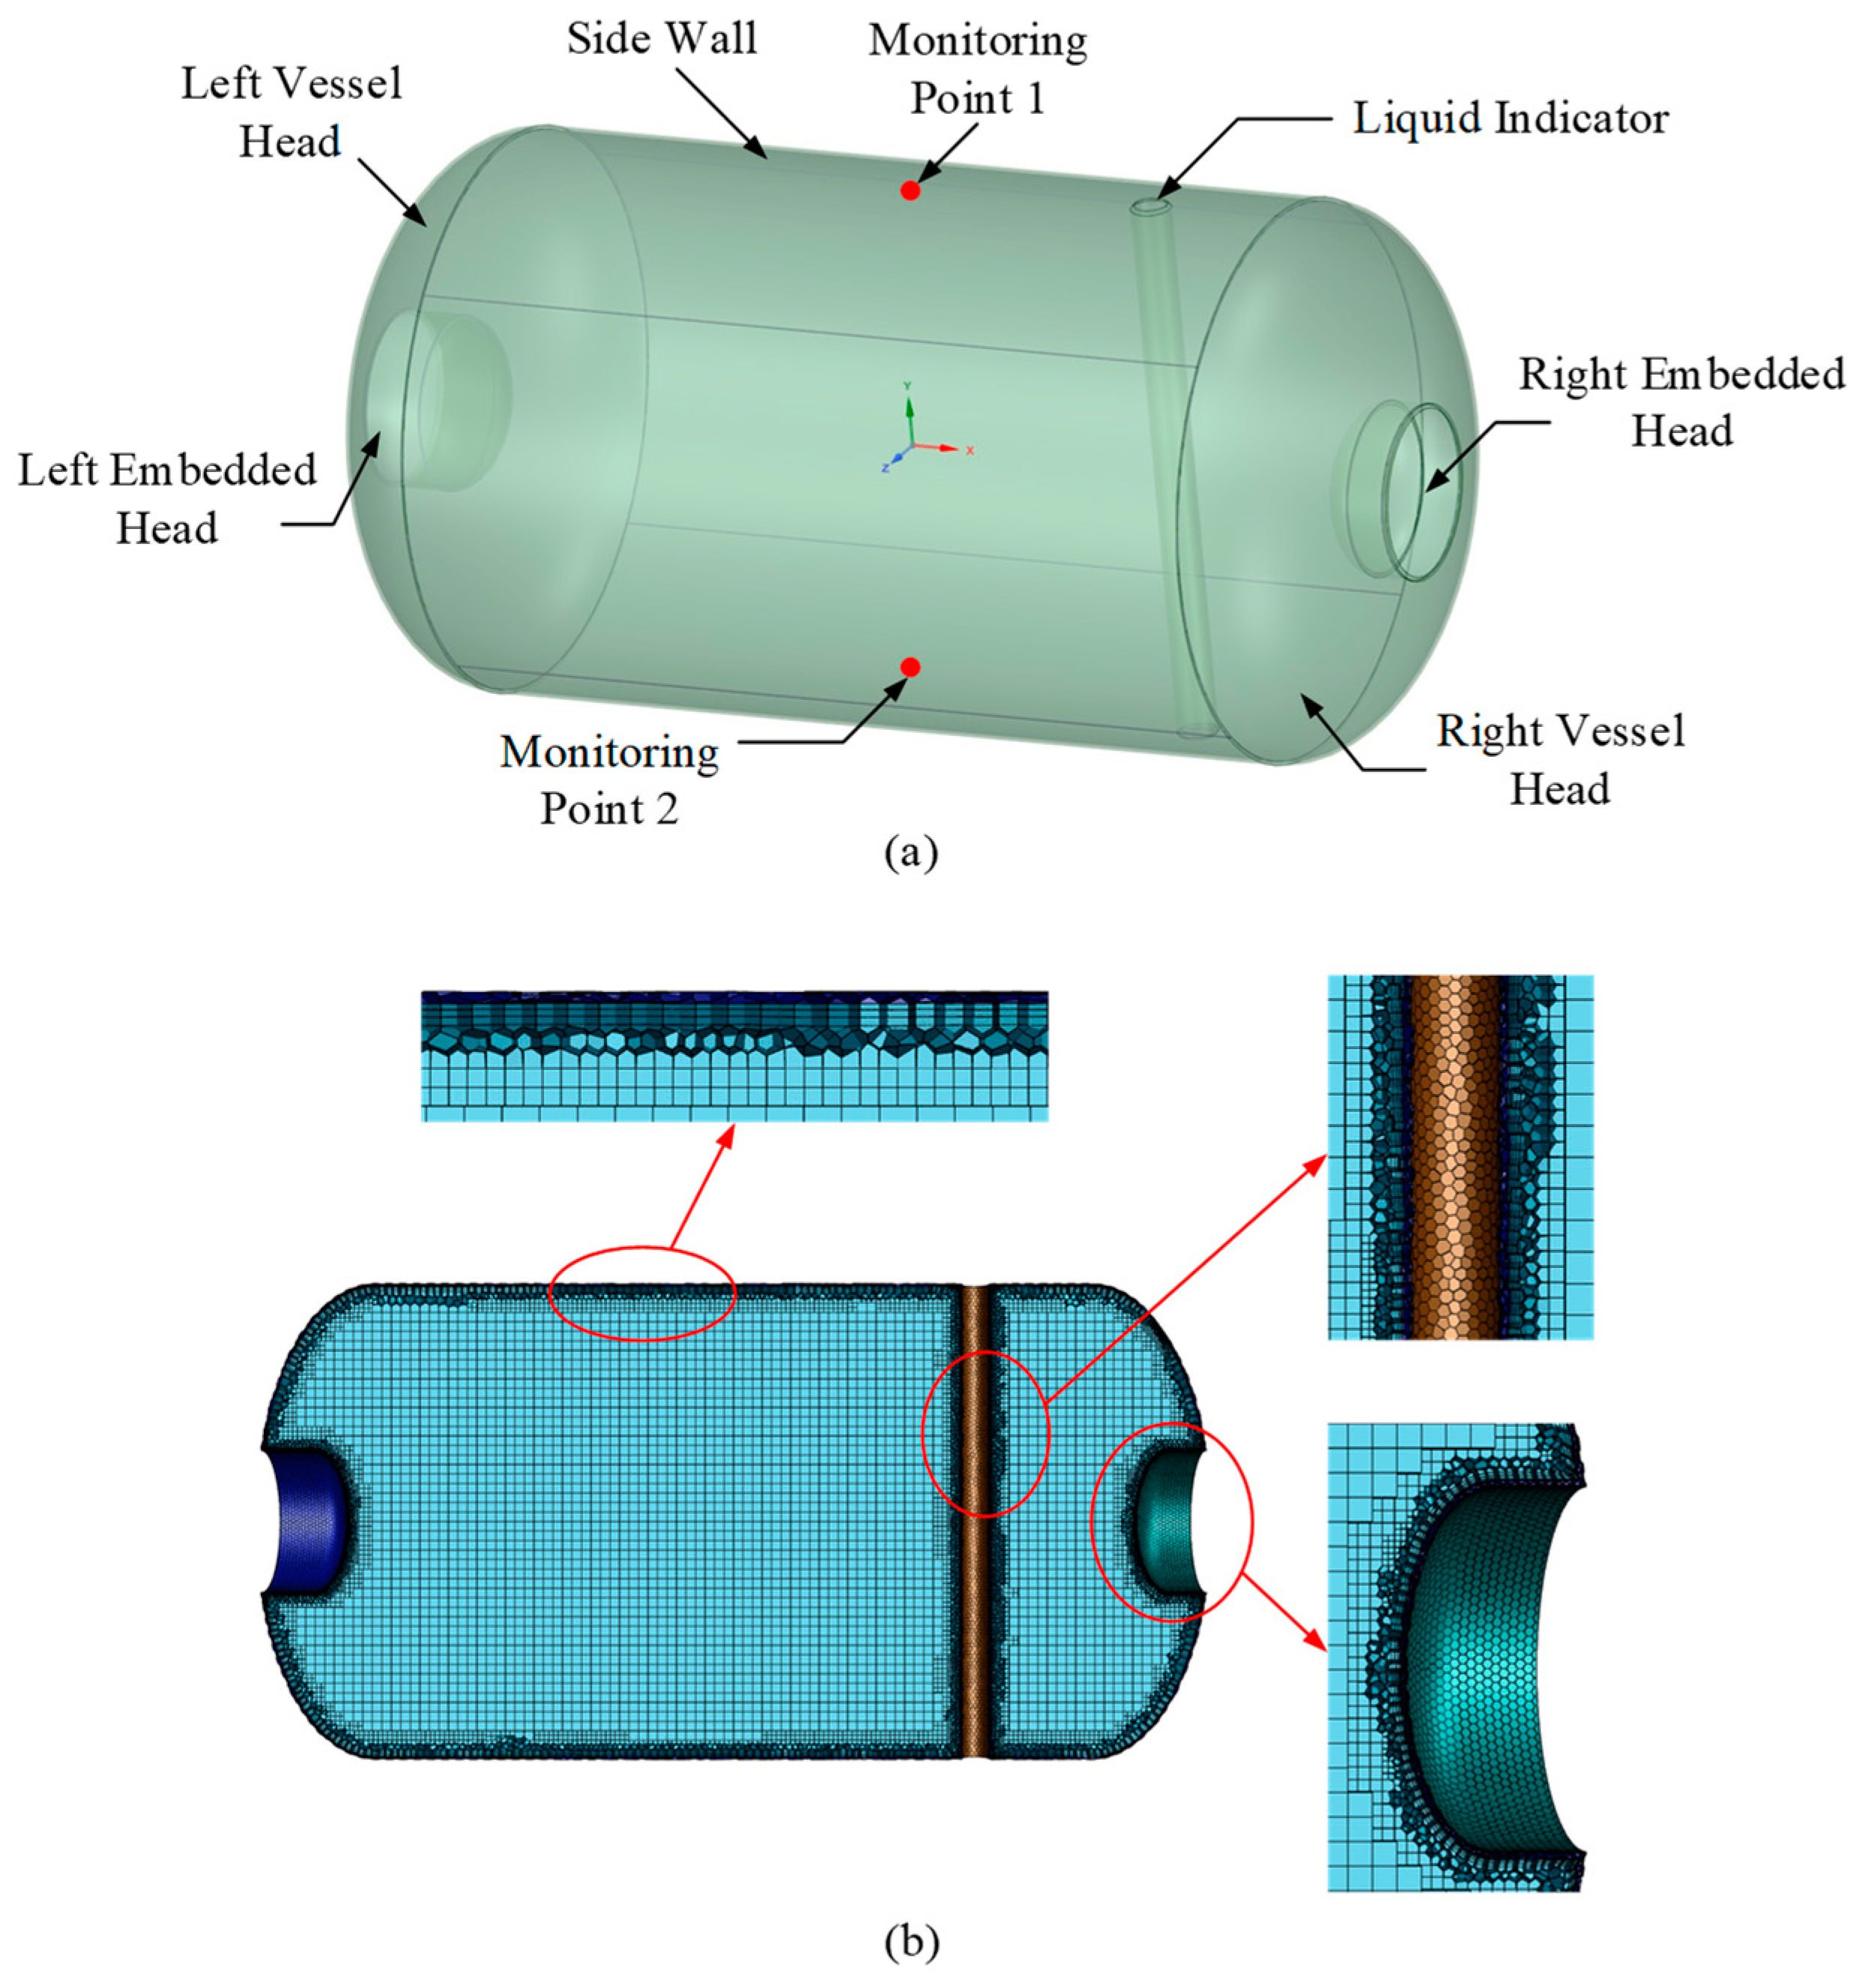
2.1. Geometric Object Description

In this paper, the actual horizontal liquid hydrogen tank for heavy-duty trucks is reasonably simplified, as shown in Figure 1a. It can be seen from Figure 1a that the X-axis direction is along the tank length direction, the Y-axis direction is along the gravity direction, and the Z-axis direction is along the horizontal radial direction. Moreover, the geometric structure consists of the side wall, the left and right embedded head, the left and right vessel head, and a liquid indicator through the tank with an external diameter of 70 mm. The tank wall is made of 316 L austenitic stainless steel with the thickness of 6 mm. The effect of fluid–structure coupling is considered. In addition, to precisely monitor the variations of temperature and pressure within the tank, testing point 1 and testing point 2 are set in the vapor- and liquid-phase regions, respectively.

2.2. Governing Equations

In this paper, the research object is a horizontal tank, which is difficult to simulate with two-dimensional axisymmetric models. Therefore, a three-dimensional model was constructed for simulation. The corresponding governing Equations (1)–(5) are as follows.
ρ t + ( ρ u ) x + ( ρ v ) y + ( ρ w ) z = 0
( ρ u ) t + div ( ρ U u ) = div ( μ grad u ) + S u p x
( ρ v ) t + div ( ρ U v ) = div ( μ grad v ) + S v p y
( ρ w ) t + div ( ρ U w ) = div ( μ grad w ) + S w p z
( ρ h ) t + ( ρ u h ) x + ( ρ v h ) y + ( ρ w h ) z = div ( λ grad T ) p div U + Φ + S h
where x, y, z are the coordinates of the axial direction, vertical radial direction and horizontal radial direction for the horizontal tank, respectively, u, v, w are the mean velocity in the axial, vertical and horizontal radial directions, respectively, and Su, Sv, Sw are the generalized source terms, which are defined by Equations (6)–(8).
S u = x ( μ u x ) + y ( μ v x ) + z ( μ w x ) + x ( λ ¯ div U )
S v = x ( μ u y ) + y ( μ v y ) + z ( μ w y ) + y ( λ ¯ div U )
S w = x ( μ u z ) + y ( μ v z ) + z ( μ w z ) + z ( λ ¯ div U )
where μ means the kinetic viscosity, λ ¯ means the second molecular viscosity, which is valued as −2/3μ for the vapor phase. In the energy equation, λ means the thermal conductivity, Sh means the energy source term, Φ means the dissipative function, which is defined by Equation (9).
Φ = 2 μ [ ( u x ) 2 + ( v y ) 2 + ( w z ) 2 ] + μ [ ( u y + v x ) 2 + ( v z + w y ) 2 + ( w x + u z ) 2 ] + λ ¯ ( div U ) 2

2.3. Turbulence Model

To study the fluid sloshing process, the selection of turbulence model is essential. For the sloshing process of cryogenic fluid in tank subjected to external excitation, the SST k-ω model is selected for numerical prediction, the corresponding Equations (10) and (11) are as follows.
( ρ k ) t + div ( ρ U k ) = div [ ( μ + μ t σ k ) grad k ] + G k Y k + S k + G b
( ρ ω ) t + div ( ρ U ω ) = div [ ( μ + μ t σ ω ) grad ω ] + G ω Y ω + S ω + G ω b
where Gk means the generation of turbulence kinetic energy generated by the mean velocity, Gω means the generation term of ω, Yk and Yω mean the dissipation rates of k and ω, respectively, caused by turbulence, Sk and Sω mean the source terms, Gb and Gωb mean the buoyancy terms, σk and σω, respectively, mean the turbulent Prandtl numbers of k and ω, and μt means the eddy viscosity, which is calculated using Equations (12)–(14).
μ t = ρ k ω 1 max [ 1 α * , S F 2 a 1 ω ]
F 2 = tanh ( ϕ 2 2 )
ϕ 2 = max [ 2 k 0.09 ω y , 500 μ ρ y 2 ω ]
Gk, Gω, Yk and Yω are defined by Equations (15)–(18).
G k = μ t S 2
G ω = α ω k G k
Y k = ρ β * f β * k ω
Y ω = ρ β f β ω 2

2.4. Multiphase Model

To accurately predict the interface fluctuation inside the liquid hydrogen tank for heavy-duty trucks, the volume of fluid (VOF) method is selected. The VOF model is a surface tracking technique that effectively captures the interface position between the fluids. In each cell, the changes at the interface are tracked by solving the continuity equation (Equation (19)) for the q th-phase volume fraction as follows.
1 ρ q [ t ( α q ρ q ) + · ( α q ρ q v q ) = S α q ]
The vapor and liquid volume fractions satisfy Formula (20).
α l + α v = 1
where α is the volume fraction at each cell, and the subscripts l and v represent the liquid and vapor phases, respectively.

2.5. Phase Change Model

To predict the phase change phenomenon within the tank, the Lee model is adopted. In this model, the relative magnitude of fluid temperature and saturated temperature is utilized to judge whether the phase change occurs. The source terms of the phase change model are given by Equations (21) and (22).
s m = { C c o n d α v ρ v ( T s a t T v ) / T s a t T v < T s a t C e v a p α l ρ l ( T s a t T l ) / T s a t T l T s a t
S h = S m h f g
where Sm and Sh mean the mass source term and the energy source term in the governing equations, respectively, C means the accommodation coefficient of phase change strength, hfg means the latent heat of phase change, kJ/kg, Tsat means the saturated temperature, K, and ρ means the density, kg/m3.
To ensure the accuracy and convergence of the solution, the fitting function (Formula (23)) of saturated temperature Tsat, corresponding to the fluid pressure, and the fitting function (Formula (24)) for latent heat of phase change hfg, determined by fluid temperature, are employed, as follows.
T s a t = 3.58996 × ( lg P ) 2 28.44835 × lg P + 72.80583
h f g = 1.47299 × T 5 + 175.87847 × T 4 8404.11972 × T 3 + 199,784.25742 × T 2 2,360,384.66986 × T + 1.155 × 10 7
where P means the cell pressure, Pa, and T means the cell temperature, K. Compared with the data exported from the NIST database, within the temperature range of 19 to 31 K, a maximum relative error of ±0.451% was obtained for the saturated temperature calculated by Formula (23), while the latent heat of phase change calculated using Formula (24) had a maximum relative error of ±0.274%.

2.6. Boundary Conditions and Initial Conditions

The wall thickness of the tank was set as 6 mm to consider the influence of solid thermal conduction. The outside walls of the tank are set as the constant heat flow boundary condition, and the inside walls of the tank are set as the coupled boundary type. In addition, the contact angles of the inside walls are set as 5°. For the heat leakage of the walls, according to the heat leakage calculation, the left embedded head is set as 45.4889 W/m2, the right embedded head is set as 36.6878 W/m2, and the remaining walls are set as 0.7437 W/m2.
For the initial setup, the liquid filling rate is set as 50%, the vapor pressure is set as 101.325 kPa, and the liquid temperature is set as 20.36 K. To obtain an initial thermophysical field with stable thermal-equilibrium state, the calculation results of parking and pressurizing for about 100 s under the above settings are taken as the initial state of sloshing case. At the initial moment of sloshing case, there is a liquid temperature of 20.4 K and a vapor temperature of 21.0 K, and an acceleration incentive is implanted into the numerical solver through the customized user-defined function (UDF). After a period of time, the acceleration excitation is removed, and then the liquid hydrogen in the tank sloshes freely under the inertance. Here, the density of liquid phase is considered to be the monotropic function of temperature, and the Boussinesq approximation is adopted. Moreover, the vapor phase is calculated with the ideal gas equation of state.

2.7. Solution Strategy

The solver ANSYS Fluent 2020 is utilized to numerically predict the thermophysical process of fluid sloshing in the liquid hydrogen tank for heavy-duty trucks. The second-order upwind difference method is used to discretize the convection terms, and the time terms are discretized by the first-order implicit algorithm. The pressure–velocity coupling terms are calculated by the Pressure–Implicit with Splitting of Operators (PISO) algorithm. Geometric reconstruction scheme is chosen to calculate the species equations. The time-step is set as 5.0 × 10⁻⁵. The residuals of the governing equations are monitored to determine the convergence of the numerical calculation. When the residuals of continuity equation, momentum equation and energy equation are below 1.0 × 10⁻³, 1.0 × 10⁻³ and 1.0 × 10⁻⁸, respectively, and the calculation results are considered to satisfy the requirements of convergence.

3. Mesh Independence Analysis and Model Validation

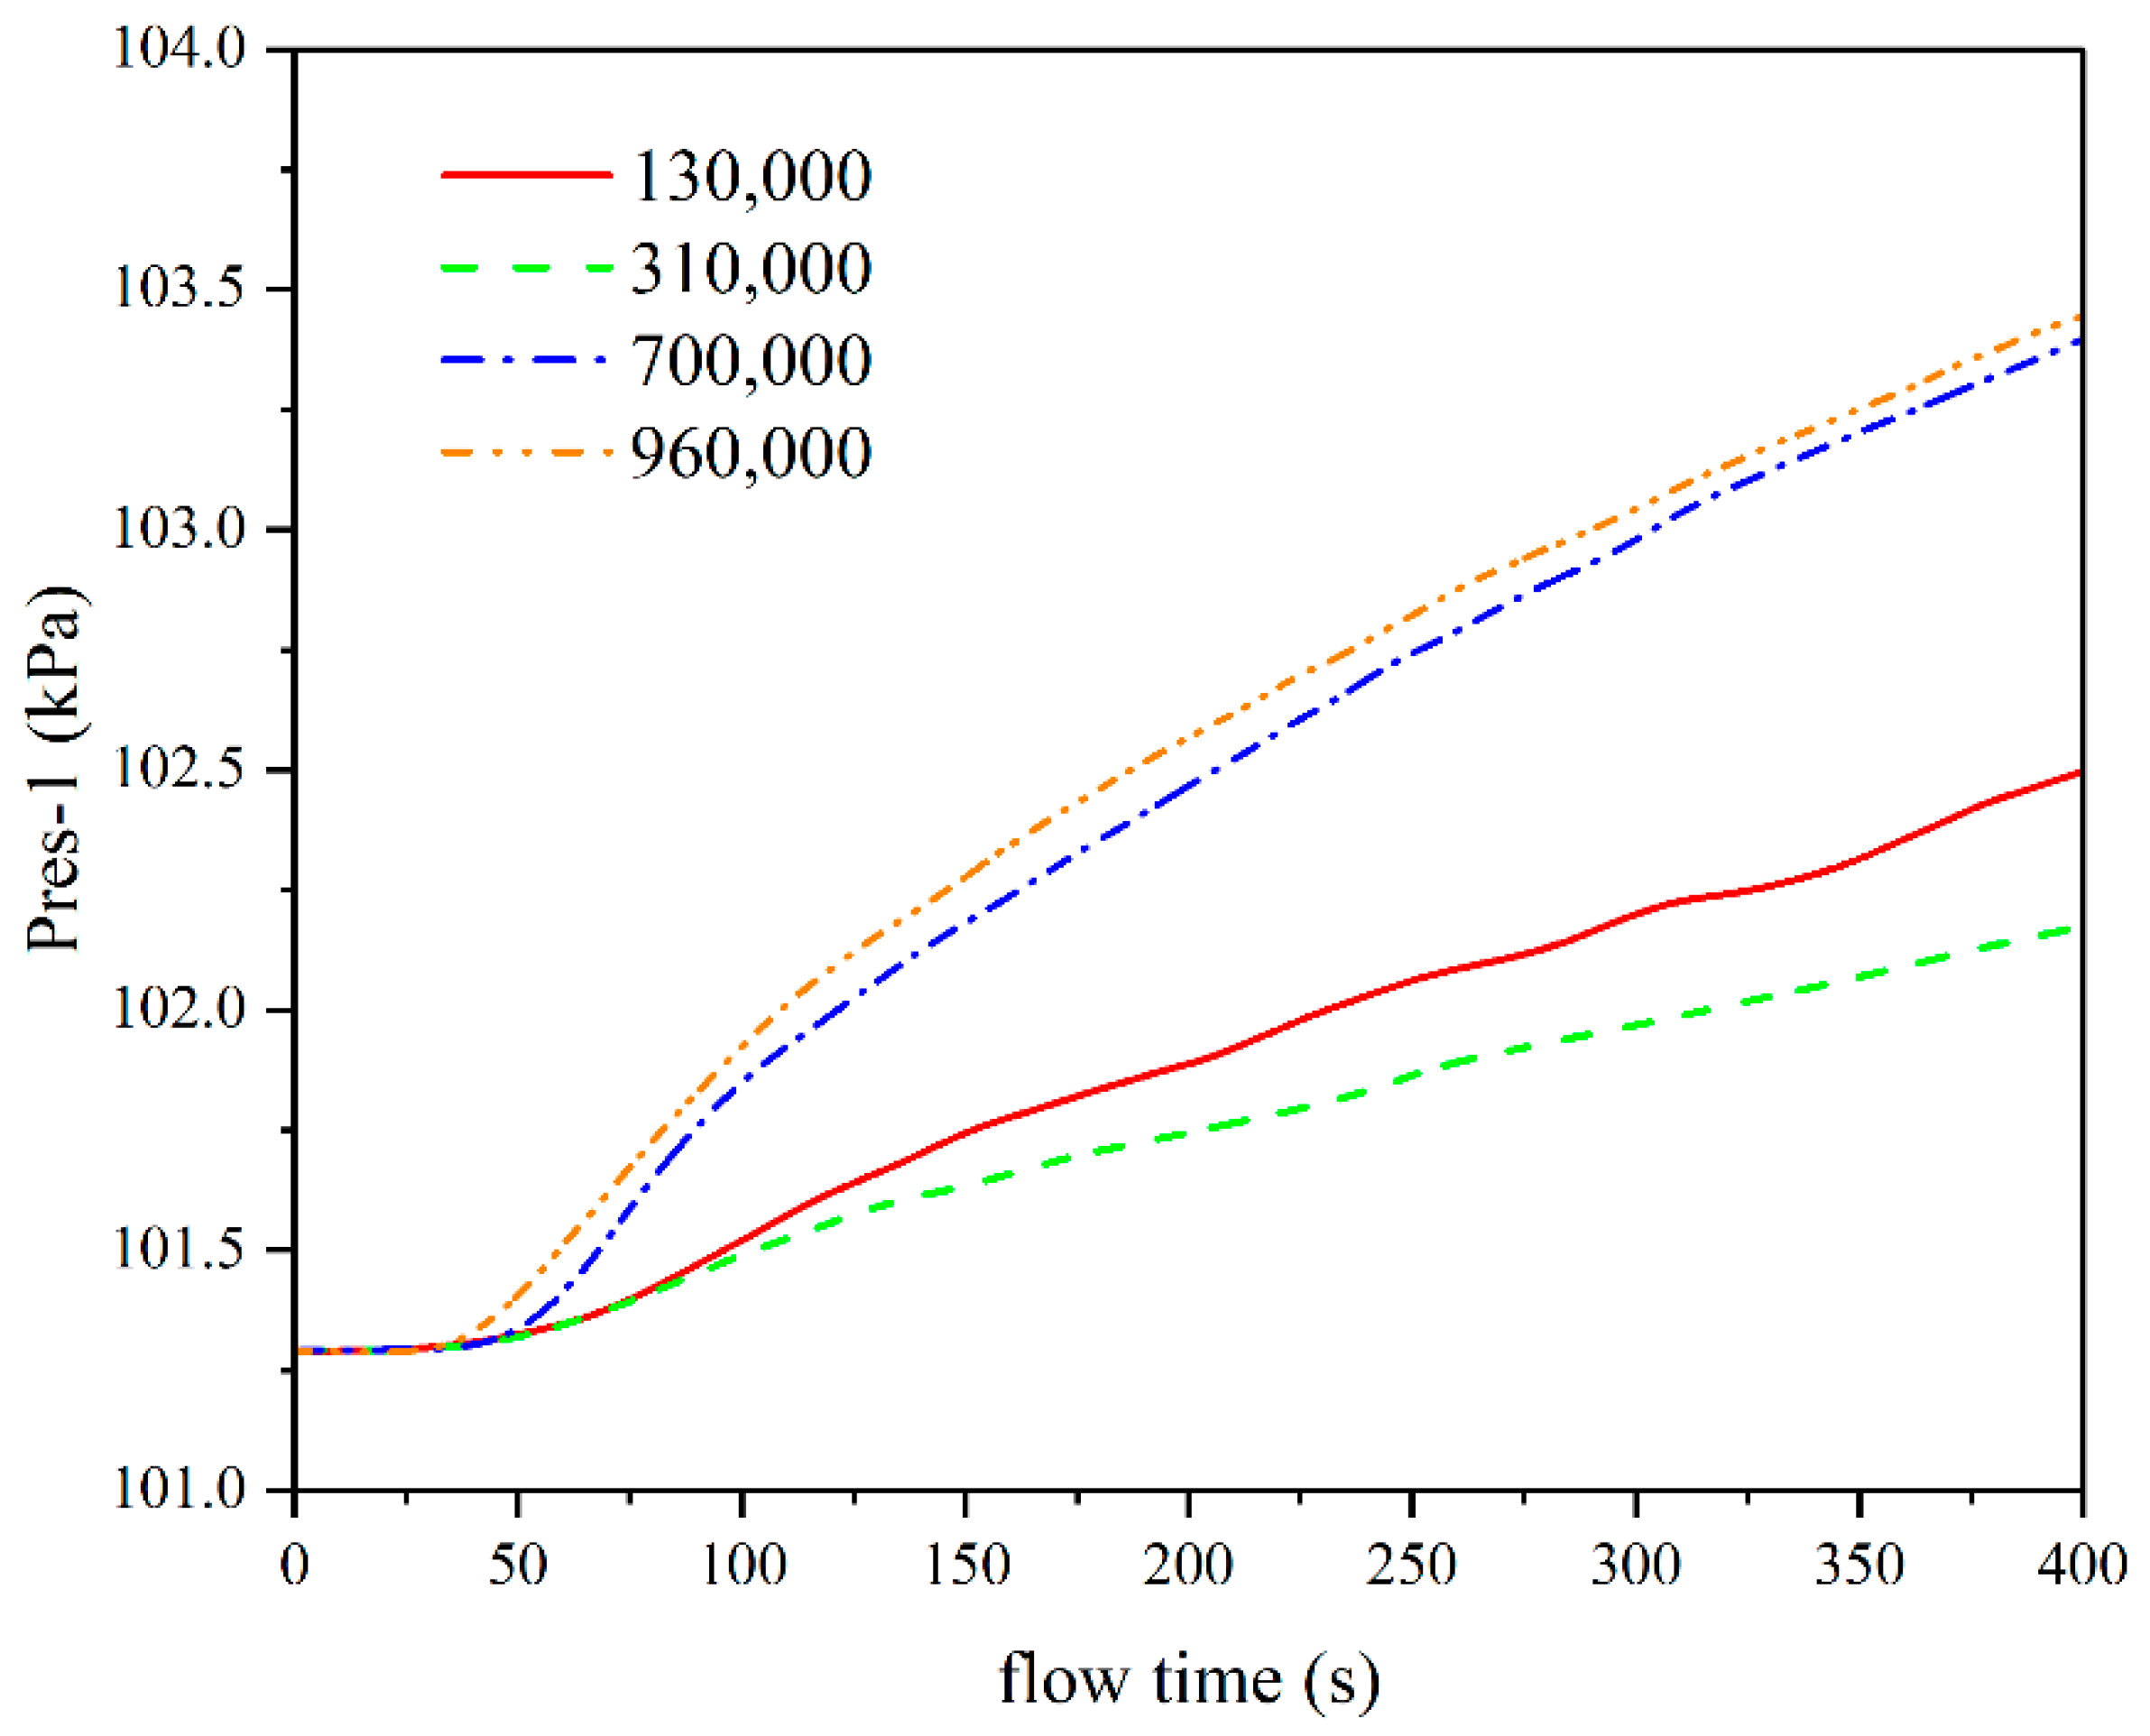
3.1. Mesh Independence Analysis

The three-dimensional object is meshed by utilizing the Fluent Meshing software. The advanced meshing technology, which uses the polyhedron and hexahedron as the core, is adopted. The meshing scheme of the main body sparsification and local refinement is considered. Furthermore, all the walls are equipped with four boundary layers for fluid transition. The mesh division scheme is shown in Figure 1b.
To reduce the discrete errors caused by the mesh quantity and ensure the accuracy of numerical calculations, a mesh independence analysis is conducted. In this paper, to verify the influence of grid quantity on numerical calculation results, four grid schemes of 130,000, 310,000, 700,000 and 960,000 are selected. The pressure for the self-pressurization case at testing point 1 is monitored and compared. As shown in Figure 2, the mesh quantity has a significant influence on the calculated results, and the maximum relative error obtained is within 1.3%. However, when the number of grid cells reaches 700,000, continuing to increase the mesh number has little impact on the calculation results. Based on the comprehensive consideration of calculation accuracy and calculation amount, the mesh number of 700,000 is selected for numerical calculation.

3.2. Independence Analysis of Phase Change Coefficient

From the current application of the Lee model, the phase change coefficient is a semi-empirical coefficient with various values for different research conditions. There is no uniformly applicable range of values for the phase change coefficient. When the value of phase change coefficient is too small, it may lead to the calculated results far different from the actual situation. Conversely, when the value of the phase change coefficient is too great, it may easily cause the computation divergence. Therefore, to verify the influence of phase change coefficient on the numerical calculation results, three phase change coefficients of 0.05, 0.5 and 5 are selected. The pressure for sloshing case is monitored and compared. As shown in Figure 3, the variation of calculated results from the three phase change coefficients are similar, and the maximum relative error obtained is within 1.5%. Based on ensuring the accuracy and non-divergence for calculation, the phase change coefficient 0.5 is selected for the numerical calculation.

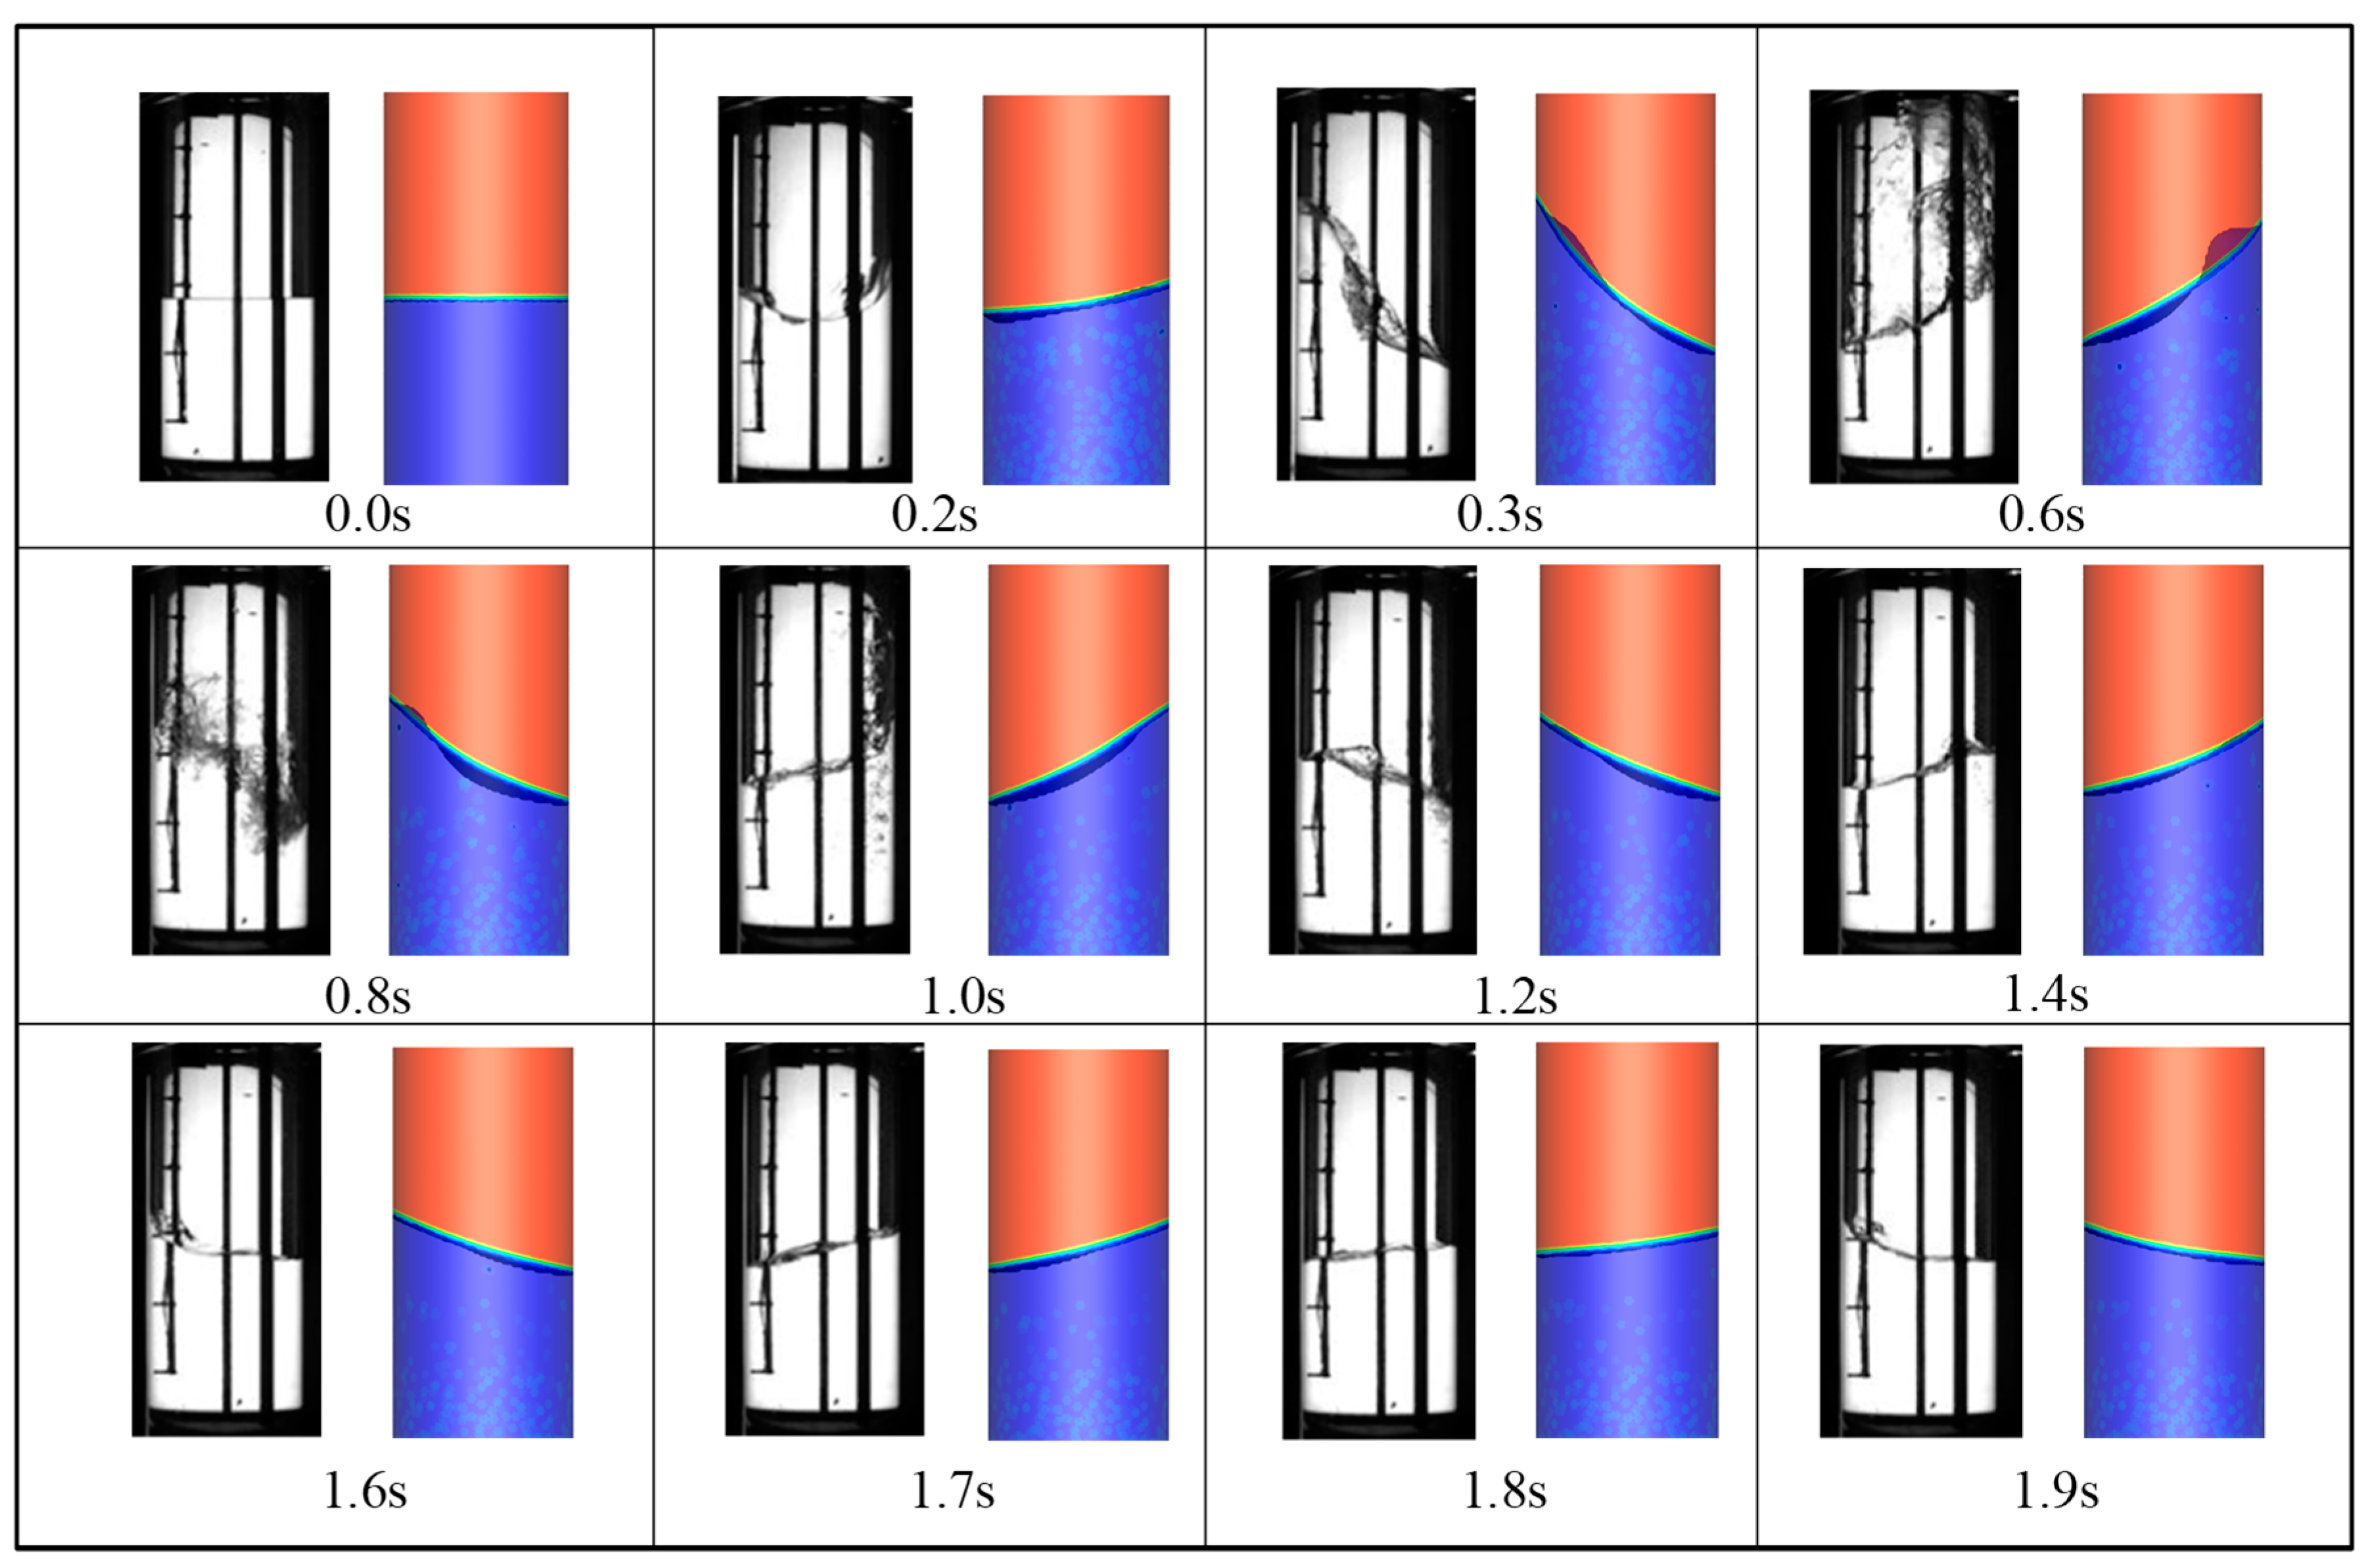
3.3. Model Validation

To verify the accuracy and effectiveness of the established numerical model, the liquid hydrogen sloshing experiments conducted by Takehiro Himeno et al. [55] are selected to perform the model validation. Based on the experimental settings, the numerical simulation of fluid sloshing under the same conditions is conducted. As the gas–liquid interface movement and the vapor pressure in the tank are monitored as part of the experiment, the photos of liquid sloshing experiment and the vapor pressure variation in tank are therefore compared with the simulation results.
The cylindrical transparent test tank with the vacuum heat shield had an inner diameter of 105 mm. The simulation conditions were set based on the experimental conditions shown in Table 1. The linear temperature distribution was set in vapor. In addition, the transverse sinusoidal acceleration was set according to Equation (25).
a x ( t ) = { A cos ( 2 π t / τ ) ( 0 t τ e ) 0 ( t > τ e )
Figure 4 shows the comparison between the phase distribution obtained by numerical simulation and the experimental photos. It is found that the movement variations of gas–liquid interface obtained from simulation are in good agreement with the experimental results. There is a high accuracy in the numerical simulation for both the capture of gas–liquid interface and the fluid movement variation.
The comparison and relative error between the vapor pressure obtained from the simulation and the experimental results are shown in Figure 5. The variation trend of vapor pressure from the simulation is basically fit that in the pressure decline and stabilization stage of experiment. However, the vapor pressure decreases earlier in the simulation than in the experiment. After the sloshing excitation is removed, the vapor pressure from the experiment gradually stabilizes around 266 kPa, but maintains a slow decline in the simulation. The reason for this discrepancy may be that the fluid in the tank has developed a relatively stable thermal stratification before the sloshing starts in the experiment, whereas the initial state of sloshing in simulation does not reach the stable thermodynamic state as the experiment. Therefore, compared with the simulation, under external excitation disturbance, it takes more time to destroy the originally stable thermal-equilibrium state and make the pressure decrease in the experiment. Furthermore, a new thermal equilibrium is established quickly after sloshing. However, due to the unstable initial state, it is easier to destroy the thermal equilibrium in the simulation. Therefore, the vapor pressure begins to decrease soon after adding the sloshing excitation, and it takes longer for stability to recover. It can be found that, although the pressure drop in the simulation occurs earlier than in the experiment, the maximum relative error is still limited to within 12%. Furthermore, after the vapor pressure stabilizes, the relative error is limited to within 5%, and tends to gradually decrease with time. Therefore, the numerical model established in this paper is practicable for simulating the fluid sloshing within liquid hydrogen tanks for vehicles.

4. Results and Discussion

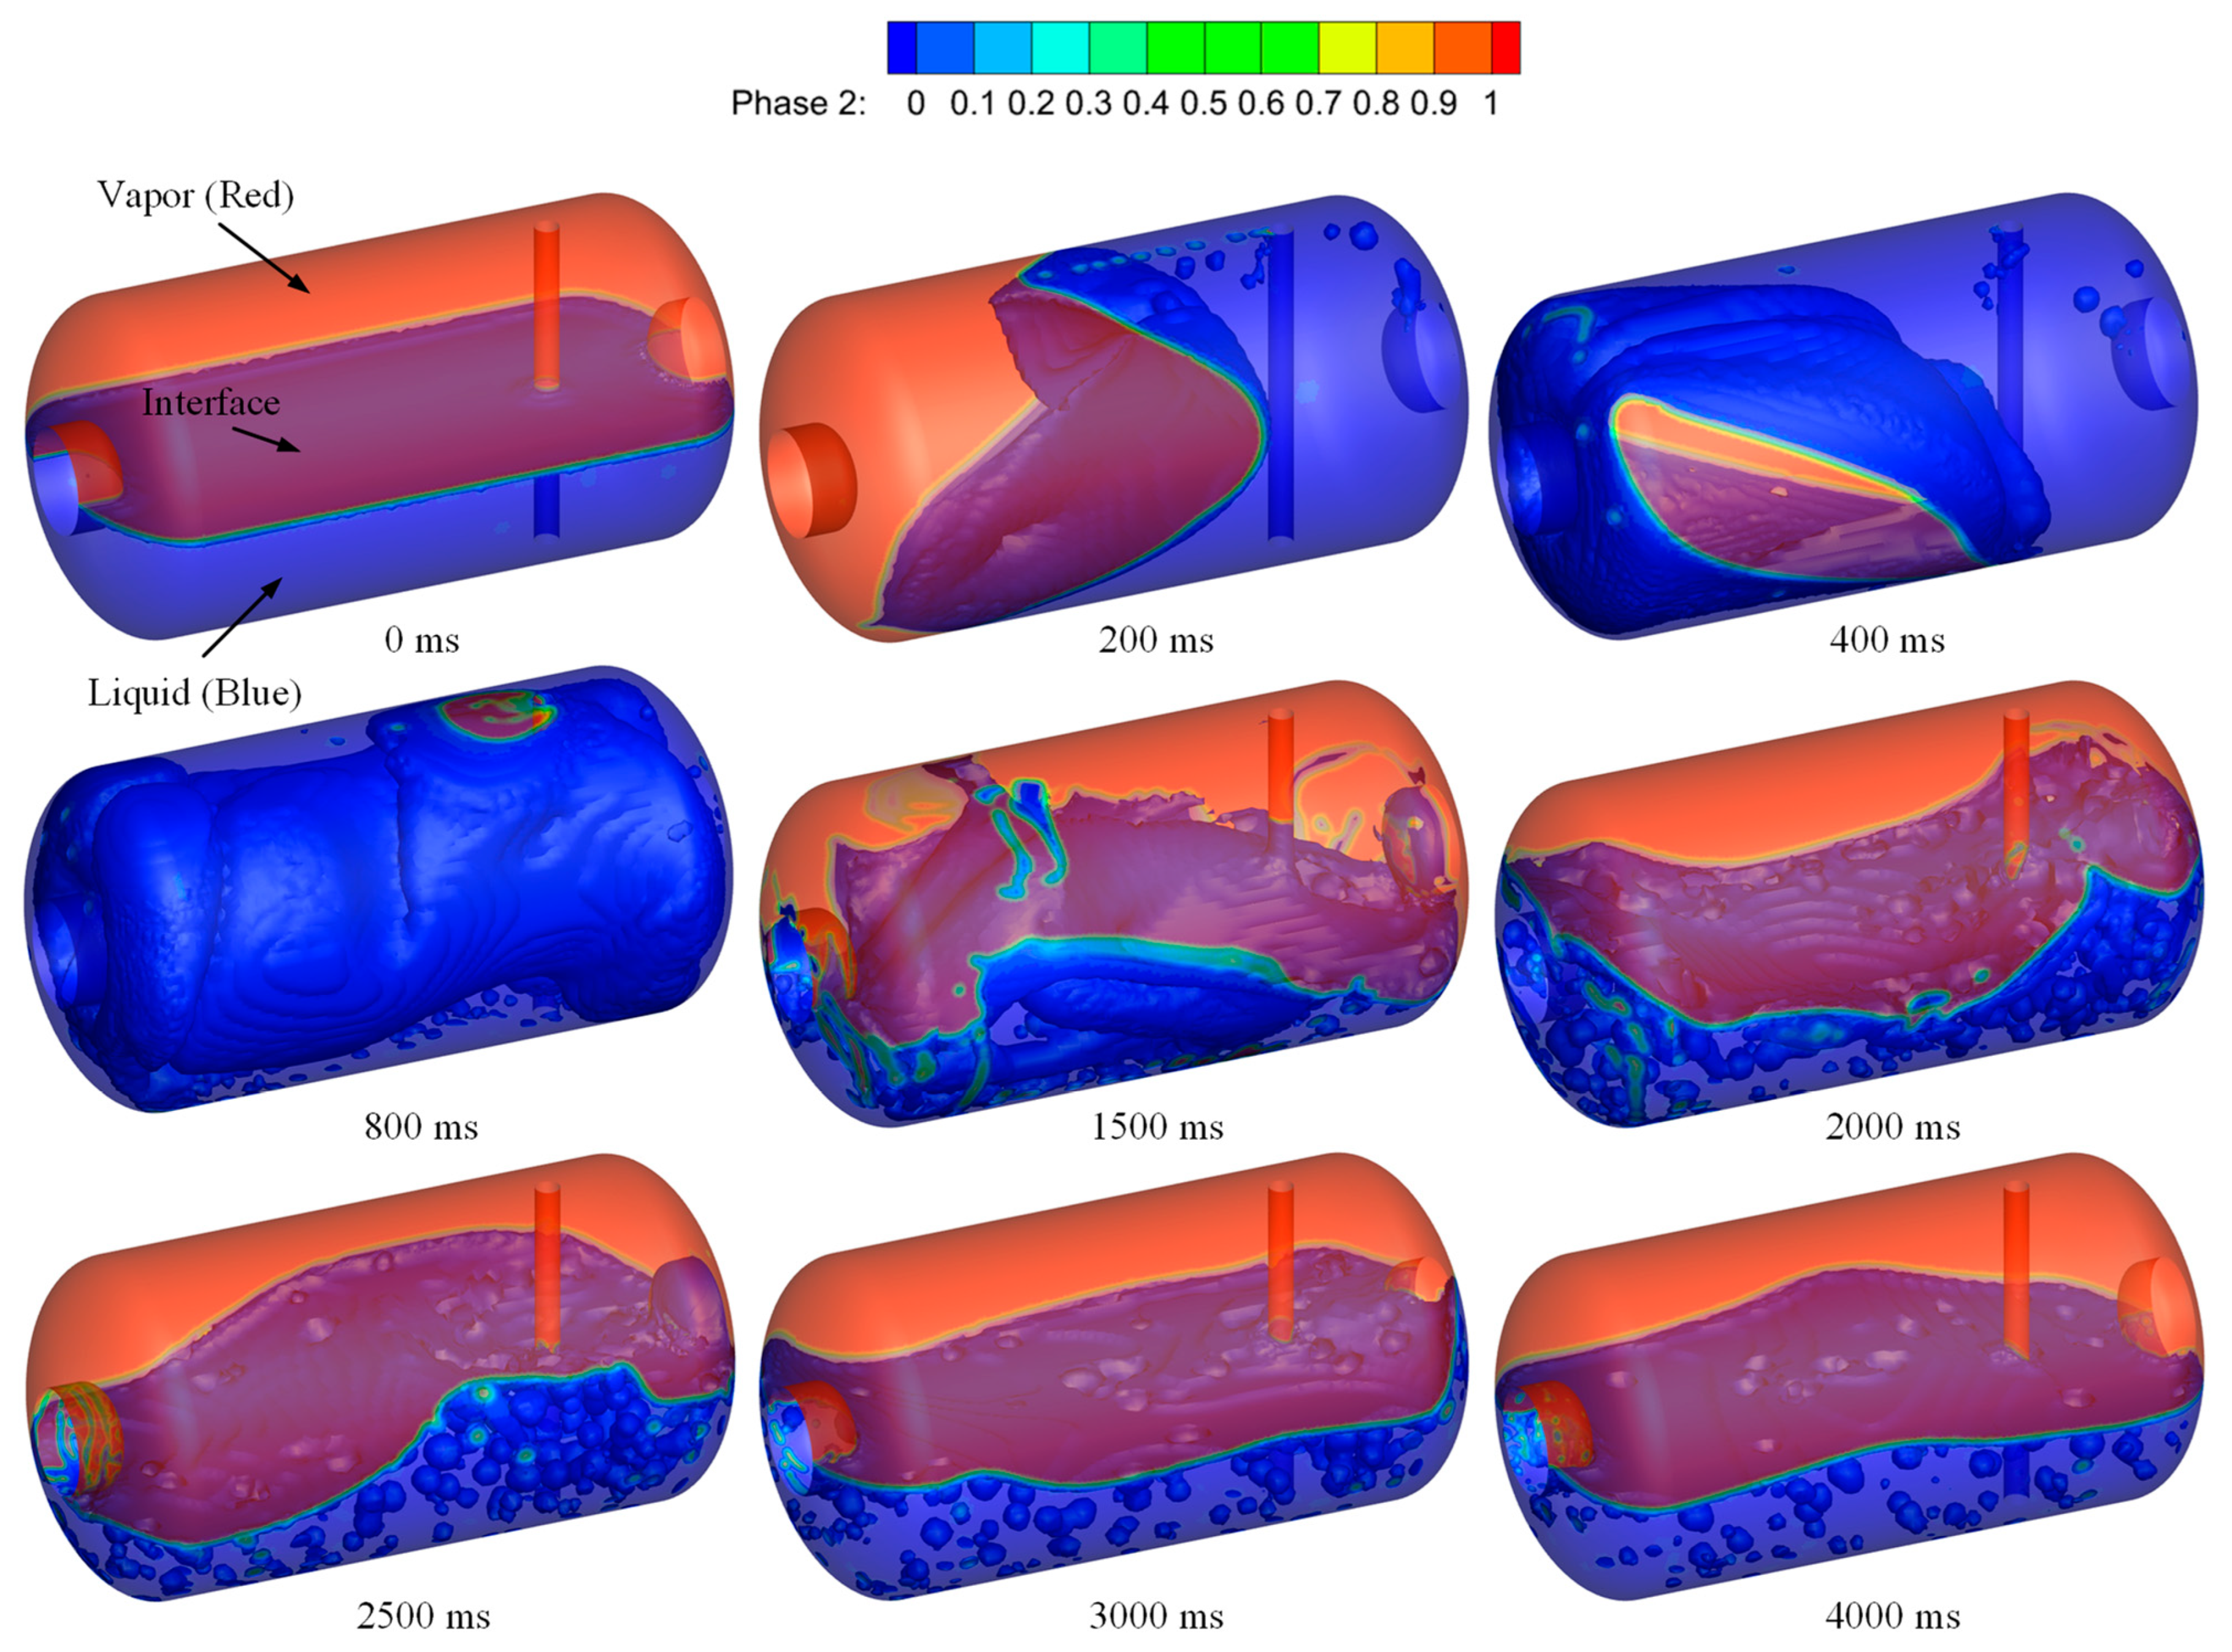
4.1. Thermodynamic Coupling Characteristics of Large-Amplitude Sloshing

For the liquid hydrogen tank with an initial filling rate of 50%, an acceleration magnitude of 5 g (g means the normal gravity acceleration, 9.81 m/s2) along the X-axis (the direction along the length of the tank) is applied at the initial moment and continuous 200 ms. Then, the acceleration excitation is removed, so that the liquid hydrogen sloshes freely under the effect of inertia. The variations of thermophysical field in the tank within 4000 ms are investigated. In this paper, the influence of initial temperature on the sloshing is not discussed, and only the sloshing condition under the determined initial temperature is considered.
Figure 6 shows the phase distribution within the horizontal liquid hydrogen tank under extreme acceleration condition. In the legend, the number 0 represents the liquid phase and the number 1 represents the vapor phase. According to Figure 6, it can be observed that due to the large acceleration excitation, the liquid hydrogen turns over toward the top of the tank after impacting the right wall, rather than returning directly. After 200 ms, the acceleration excitation is removed, and the liquid hydrogen sloshes freely under the effect of inertia. After 400 ms, part of the liquid hydrogen flows through the left wall and collides with the other liquid hydrogen in the bottom. Then, the liquid hydrogen occupies all the walls of the tank. The inside of the tank shows a phase distribution state of gas completely wrapped by liquid, which leads to an intense mixing between the vapor and the liquid. After 800 ms, most of the liquid hydrogen separates from the vapor under the effect of gravity and returns to the bottom of the tank. A large amount of vapor is carried by liquid hydrogen during the process of liquid falling. After the liquid hydrogen settles to the bottom of the tank, the liquid hydrogen performs the reciprocating motion under the effect of inertia, and the sloshing amplitude tends to decrease gradually due to the dissipation of kinetic energy for liquid hydrogen. At 4000 ms, the gas–liquid interface has gradually recovered to a stable state, and there are some bubbles in liquid hydrogen that have not yet been discharged, while the number of bubbles has been significantly reduced. According to the phase distribution changes, it can be found that the liquid hydrogen within the tank is prone to a large-amplitude sloshing behavior when subjected to large acceleration excitation, which can even cause the liquid hydrogen to overturn towards the top of the tank under the effect of inertia. In severe case, the large-amplitude sloshing behavior of liquid hydrogen may lead to the bottom of the tank completely occupied by gas within a period. In addition, the liquid hydrogen tends to carry a large amount of gas in the process of falling back to the bottom, resulting in many bubbles are contained in the liquid hydrogen. These factors may have an adverse effect on the operation of liquid hydrogen pump in the system and even lead to a sudden interruption or discontinuous supply of fuel flow during the vehicle driving, causing a potential hazard to vehicle driving safety.
Figure 7 shows the temperature field distribution of the middle section for the liquid hydrogen tank during the sloshing process. At the beginning, the fluid within the tank has obvious temperature difference, with a lower temperature of liquid phase and a higher temperature of vapor phase. The minimum temperature of the liquid phase is about 20.4 K, and the maximum temperature of the vapor phase is about 21 K. After the liquid sloshing, the high-temperature region of the vapor phase is constantly extruded by the low-temperature region of the liquid phase. After 400 ms, the vapor is gradually squeezed and wrapped by liquid hydrogen, and the convective heat transfer between the vapor and liquid is strengthened. It leads to the vapor temperature decreases significantly and the number of layers for temperature stratification is obviously reduced. Meanwhile, the liquid phase temperature increases significantly. After 800 ms, due to the liquid falls back to the bottom of tank, the temperature field returns to a distribution state of higher temperature at the top and lower temperature at the bottom. It can be observed that the gas–liquid temperature difference decreases significantly, and the vapor temperature is relatively uniform. Meanwhile, the liquid temperature is still stratified, and it is significantly higher than that before sloshing. After 1500 ms, there is no significant change in the value of gas–liquid temperature. Ultimately, at 4000 ms, the temperature of vapor phase is basically maintained at about 20.6 K, and the temperature of the liquid phase is kept at about 20.5 K. According to the temperature field variations during the sloshing process, it can be found that due to the large-amplitude sloshing behavior of liquid hydrogen, the originally stable temperature stratification of fluid is obviously destroyed, and the forced convective heat transfer between the gas and liquid phase is significantly strengthened. After the sloshing, the temperature distribution of the vapor and liquid phases are more uniform. The overall temperature of the gas phase decreases significantly, while the overall temperature of the liquid phase increases significantly. Such overall temperature changes may shorten the time required for liquid hydrogen to reach the saturation state.
Figure 8 shows the velocity field distribution and streamline change for the middle section of liquid hydrogen tank during the sloshing process. At the initial state, due to the natural convection caused by the heat leakage for tank, some small eddies appear in the gas region near the wall, and several large eddies gradually form in the liquid phase. The velocity in the overall field is relatively low. At 200 ms, due to fluid sloshing, the maximum of the velocity field increases significantly, and a huge eddy is formed in the flow field. Then, the flow field constantly changes with fluid movement, and the maximum velocity in the velocity field decreases significantly due to the dissipation of fluid kinetic energy. From 1500 ms to 4000 ms, the vapor flow is driven by the reciprocating motion of liquid hydrogen. Obvious eddies appear in both gas and liquid phases of the flow field, and the velocity value at the center of the vortex is low. In addition, the maximum value of the velocity field gradually decreases, and the flow field tends to gradually become stable.
Figure 9 shows the pressure field distribution for the middle section of the liquid hydrogen tank in the sloshing process. At the beginning, the pressure distribution in the gas-phase region is relatively uniform. However, due to the hydrostatic pressure of liquid hydrogen, the pressure stratification in the liquid-phase region has increasing pressure values from top to bottom. Then, the distribution of pressure field changes with the movement of liquid hydrogen. It can be found that due to the vapor condensation caused by the gas–liquid heat transfer, the vapor pressure decreases significantly with time. From 1500 ms to 4000 ms, the pressure of vapor phase gradually tends to be stable, and the pressure stratification in liquid phase appears again. Moreover, the distribution of pressure field changes continuously with the movement of liquid hydrogen, while the pressure value hardly changes. Compared with the initial moment, the maximum and minimum pressure values of the pressure field decrease significantly.

4.2. Influence of Acceleration Magnitude on the Fluid Sloshing

To study the influence of acceleration magnitude on the thermodynamic characteristics of the liquid hydrogen sloshing within the tank, the numerical simulation was conducted for acceleration magnitudes of 0.5 g, 2 g and 5 g, respectively. The other conditions were set as in Section 4.1.
Figure 10 compares the position changes in the liquid hydrogen centroid along the X-axis (a), Y-axis (b), Z-axis (c), respectively, and the forces on the right wall (d) under different acceleration magnitudes. According to Figure 10a–c, it can be found that the liquid hydrogen centroid has the greatest variation magnitude along the X-axis, and the lowest variation magnitude along the Z-axis. In addition, the larger the acceleration magnitude, the greater the variation amplitude of the liquid hydrogen centroid along different directions. Compared with the situation at an acceleration magnitude of 5 g, for the maximum change amplitudes of liquid hydrogen centroid at 2 g and 0.5 g, they decrease by 5.70% and 50.85% in the X-axis direction, and decrease by 29.83% and 88.77% in the Y-axis direction, respectively. Additionally, although the liquid hydrogen has a greater kinetic energy when the acceleration magnitude is greater, the kinetic energy dissipates faster, which means the sloshing amplitude decreases more quickly. To study the effect of acceleration magnitude on the wall force, the forces on the right wall under different acceleration magnitudes are compared. As shown in Figure 10d, when the acceleration magnitude is 5 g, the maximum increase in the force on the right wall is 3.89 kN. In addition, the greater the acceleration magnitude, the greater the force change amplitude of the right wall, and the faster the force peak is reached. Moreover, compared with the situation at an acceleration magnitude of 5 g, the maximum increase in forces on the right wall at 2 g and 0.5 g is reduced by 80.57% and 99.53%, respectively.
Figure 11 compares the changes in thermal parameters in the sloshing process under different acceleration magnitudes, where (a) is the mass change in vapor phase, (b) is the mass change in liquid phase, (c) is the pressure change at testing point 1, and (d) is the temperature changes at testing points 1 and 2. According to Figure 11a,b, it can be found that due to the vapor within the tank continuously condensing into liquid, the mass of the vapor phase gradually decreases, while the liquid mass gradually increases with time. Moreover, the larger the acceleration magnitude, the faster the condensation rate and the greater the amount of vapor condensation within the tank. Compared with the situation at an acceleration magnitude of 5 g, the amounts of vapor condensation decrease by 46.46% and 80.81% at 2 g and 0.5 g, respectively. As shown in Figure 11c, it can be observed that the vapor condensation plays a dominant role after the sloshing occurs, resulting in a rapid decline in ullage pressure within a short time, and then the vapor phase gradually re-enters a thermal equilibrium state. In addition, when the acceleration magnitude is greater, the ullage pressure has a faster rate of decrease and a greater reduction range, and it more quickly returns to a stable state. When the acceleration magnitude is 5 g, the maximum reduction of ullage pressure is 1550 Pa and the average pressure drop rate within 1000 ms is 1.5012 Pa/ms. Compared with the situation at an acceleration magnitude of 5 g, the maximum pressure drops of ullage are reduced by 9.46% and 55.02% at 2 g and 0.5 g, respectively. According to Figure 11d, due to the intense forced convection heat transfer between the gas and the liquid phase, the vapor temperature significantly decreases and the liquid temperature markedly increases during the sloshing process. Moreover, for both the vapor and the liquid, when the acceleration magnitude is greater, there is a wider temperature variation range and a smaller temperature difference after the temperature variation stabilizes. Compared to the situation at an acceleration magnitude of 5 g, the ultimate temperature differences between vapor and liquid is increased by 8.60% and 189.59% at 2 g and 0.5 g, respectively. Additionally, due to the small sloshing amplitude at an acceleration magnitude of 0.5 g, no vapor–liquid alternations occur at the monitoring points, so that the temperature changes for both vapor and liquid do not fluctuate significantly. It is worth mentioning that although the large-amplitude sloshing of liquid hydrogen exhibits a rapid reduction in pressure within a short time, the sloshing process strengthens the forced convective heat transfer between gas and liquid, significantly increases the temperature of liquid hydrogen, and accelerates the process of liquid hydrogen reaching saturation temperature.
Figure 12 compares the gas–liquid phase distribution changes with different acceleration magnitudes. When the acceleration magnitude is 0.5 g, the liquid hydrogen returns to the original path after reaching the peak, and without turning over the top of the tank. There are no fluctuations at the gas–liquid interface, and only a few small bubbles are contained in the liquid hydrogen. When the acceleration magnitude is 2 g, a small amount of liquid hydrogen turns over the top of the tank under the effect of inertia. The gas–liquid interface fluctuates greatly, and some large bubbles can be clearly observed in the liquid hydrogen. In particular, when the acceleration magnitude reaches 5 g, a large amount of liquid hydrogen crosses the top of tank. The liquid hydrogen within the tank tumbles violently, resulting in a dramatic mixing of vapor and liquid. On the basis of the comparison, it can be found that the greater the acceleration magnitude, the greater the sloshing amplitude of liquid hydrogen, and the more intense the gas–liquid convective contact. When the acceleration magnitude is low, the liquid hydrogen only sloshes in a small amplitude within a certain range, and the gas–liquid interface is relatively stable. However, when the acceleration magnitude is high, the liquid hydrogen may even cross the top of the tank under the effect of inertia. In this situation, the collision of fluid strengthens the convective contact between the gas and liquid, and the liquid hydrogen carries a lot of vapor in the process of falling to the bottom, further enhancing the mixing of the gas and liquid.
Figure 13 compares the temperature field distribution changes under different acceleration magnitudes. When the acceleration magnitude is 0.5 g, due to the liquid hydrogen not crossing the top of the tank, the temperature stratification structure within the tank is not obviously damaged. Only the temperature distribution area changes with liquid movement. Moreover, the temperature field distribution exhibits a trend of spreading to both side areas for the highest temperature in the vapor phase and the lowest temperature in the liquid phase. When the acceleration magnitudes are 2 g and 5 g, due to the liquid hydrogen having a rolling sloshing motion, the gas–liquid convective heat transfer is greatly strengthened. The original temperature stratification structure is dramatically destroyed. After the fluid sloshing, the temperature of the vapor phase is relatively uniform, while liquid temperature stratification is still present. However, with increasing magnitude of acceleration, the number of layers in the liquid temperature stratification decreases significantly. It can be found that the greater the acceleration magnitude, the more thoroughly the temperature stratification structure in the tank is destroyed, the stronger the gas–liquid convection heat transfer, and the more uniform the temperature of the gas phase and liquid phase after heat exchange.
Figure 14 compares the velocity field distributions and streamline changes under different acceleration magnitudes. According to the changes in the velocity field, the greater the acceleration magnitude, the greater the maximum velocity value during liquid hydrogen sloshing, and the faster the velocity attenuation after sloshing. From the changes in the streamline, when the acceleration magnitude is 0.5 g, the reciprocating motion of liquid hydrogen drives the flow of gas, and the flow field is always presented as a huge eddy during fluid sloshing. When the acceleration magnitudes are 2 g and 5 g, the large eddy only appears during the dramatic tumbling of liquid hydrogen. Moreover, after liquid hydrogen falls to the bottom under the effect of gravity, the gas and liquid oscillate violently, and the flow field becomes highly disordered. Then, the flow field gradually recovers stability.

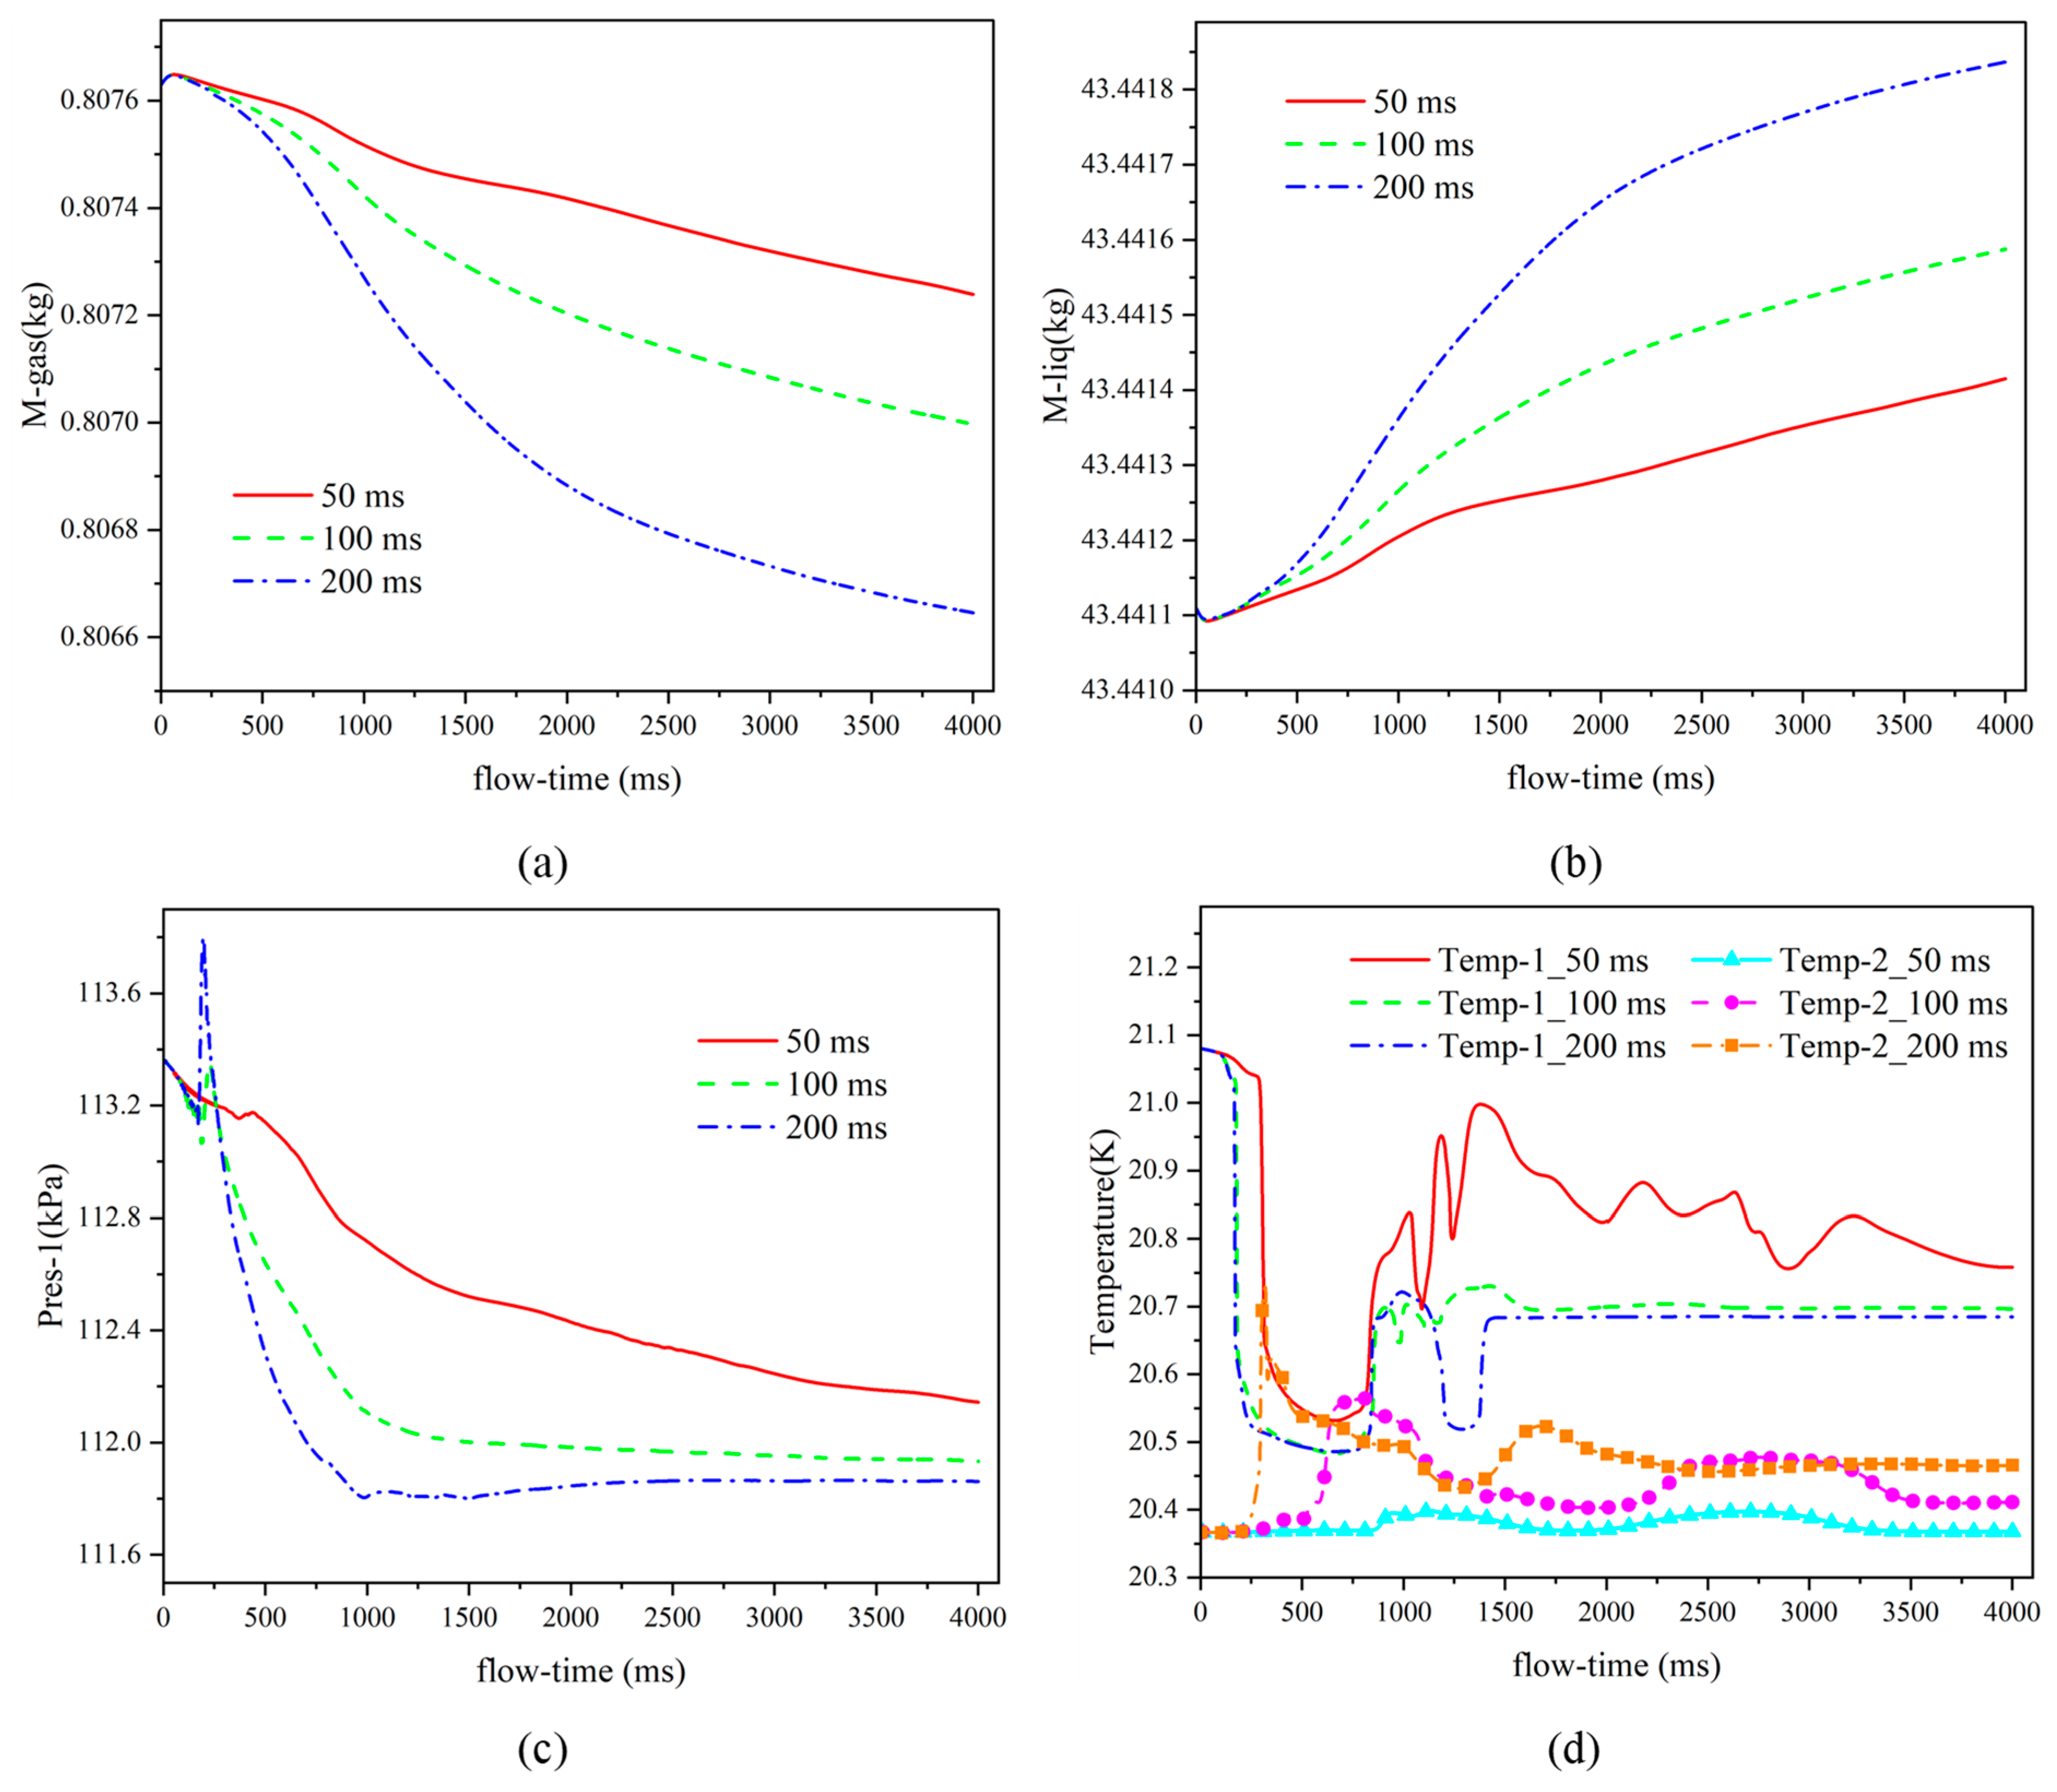
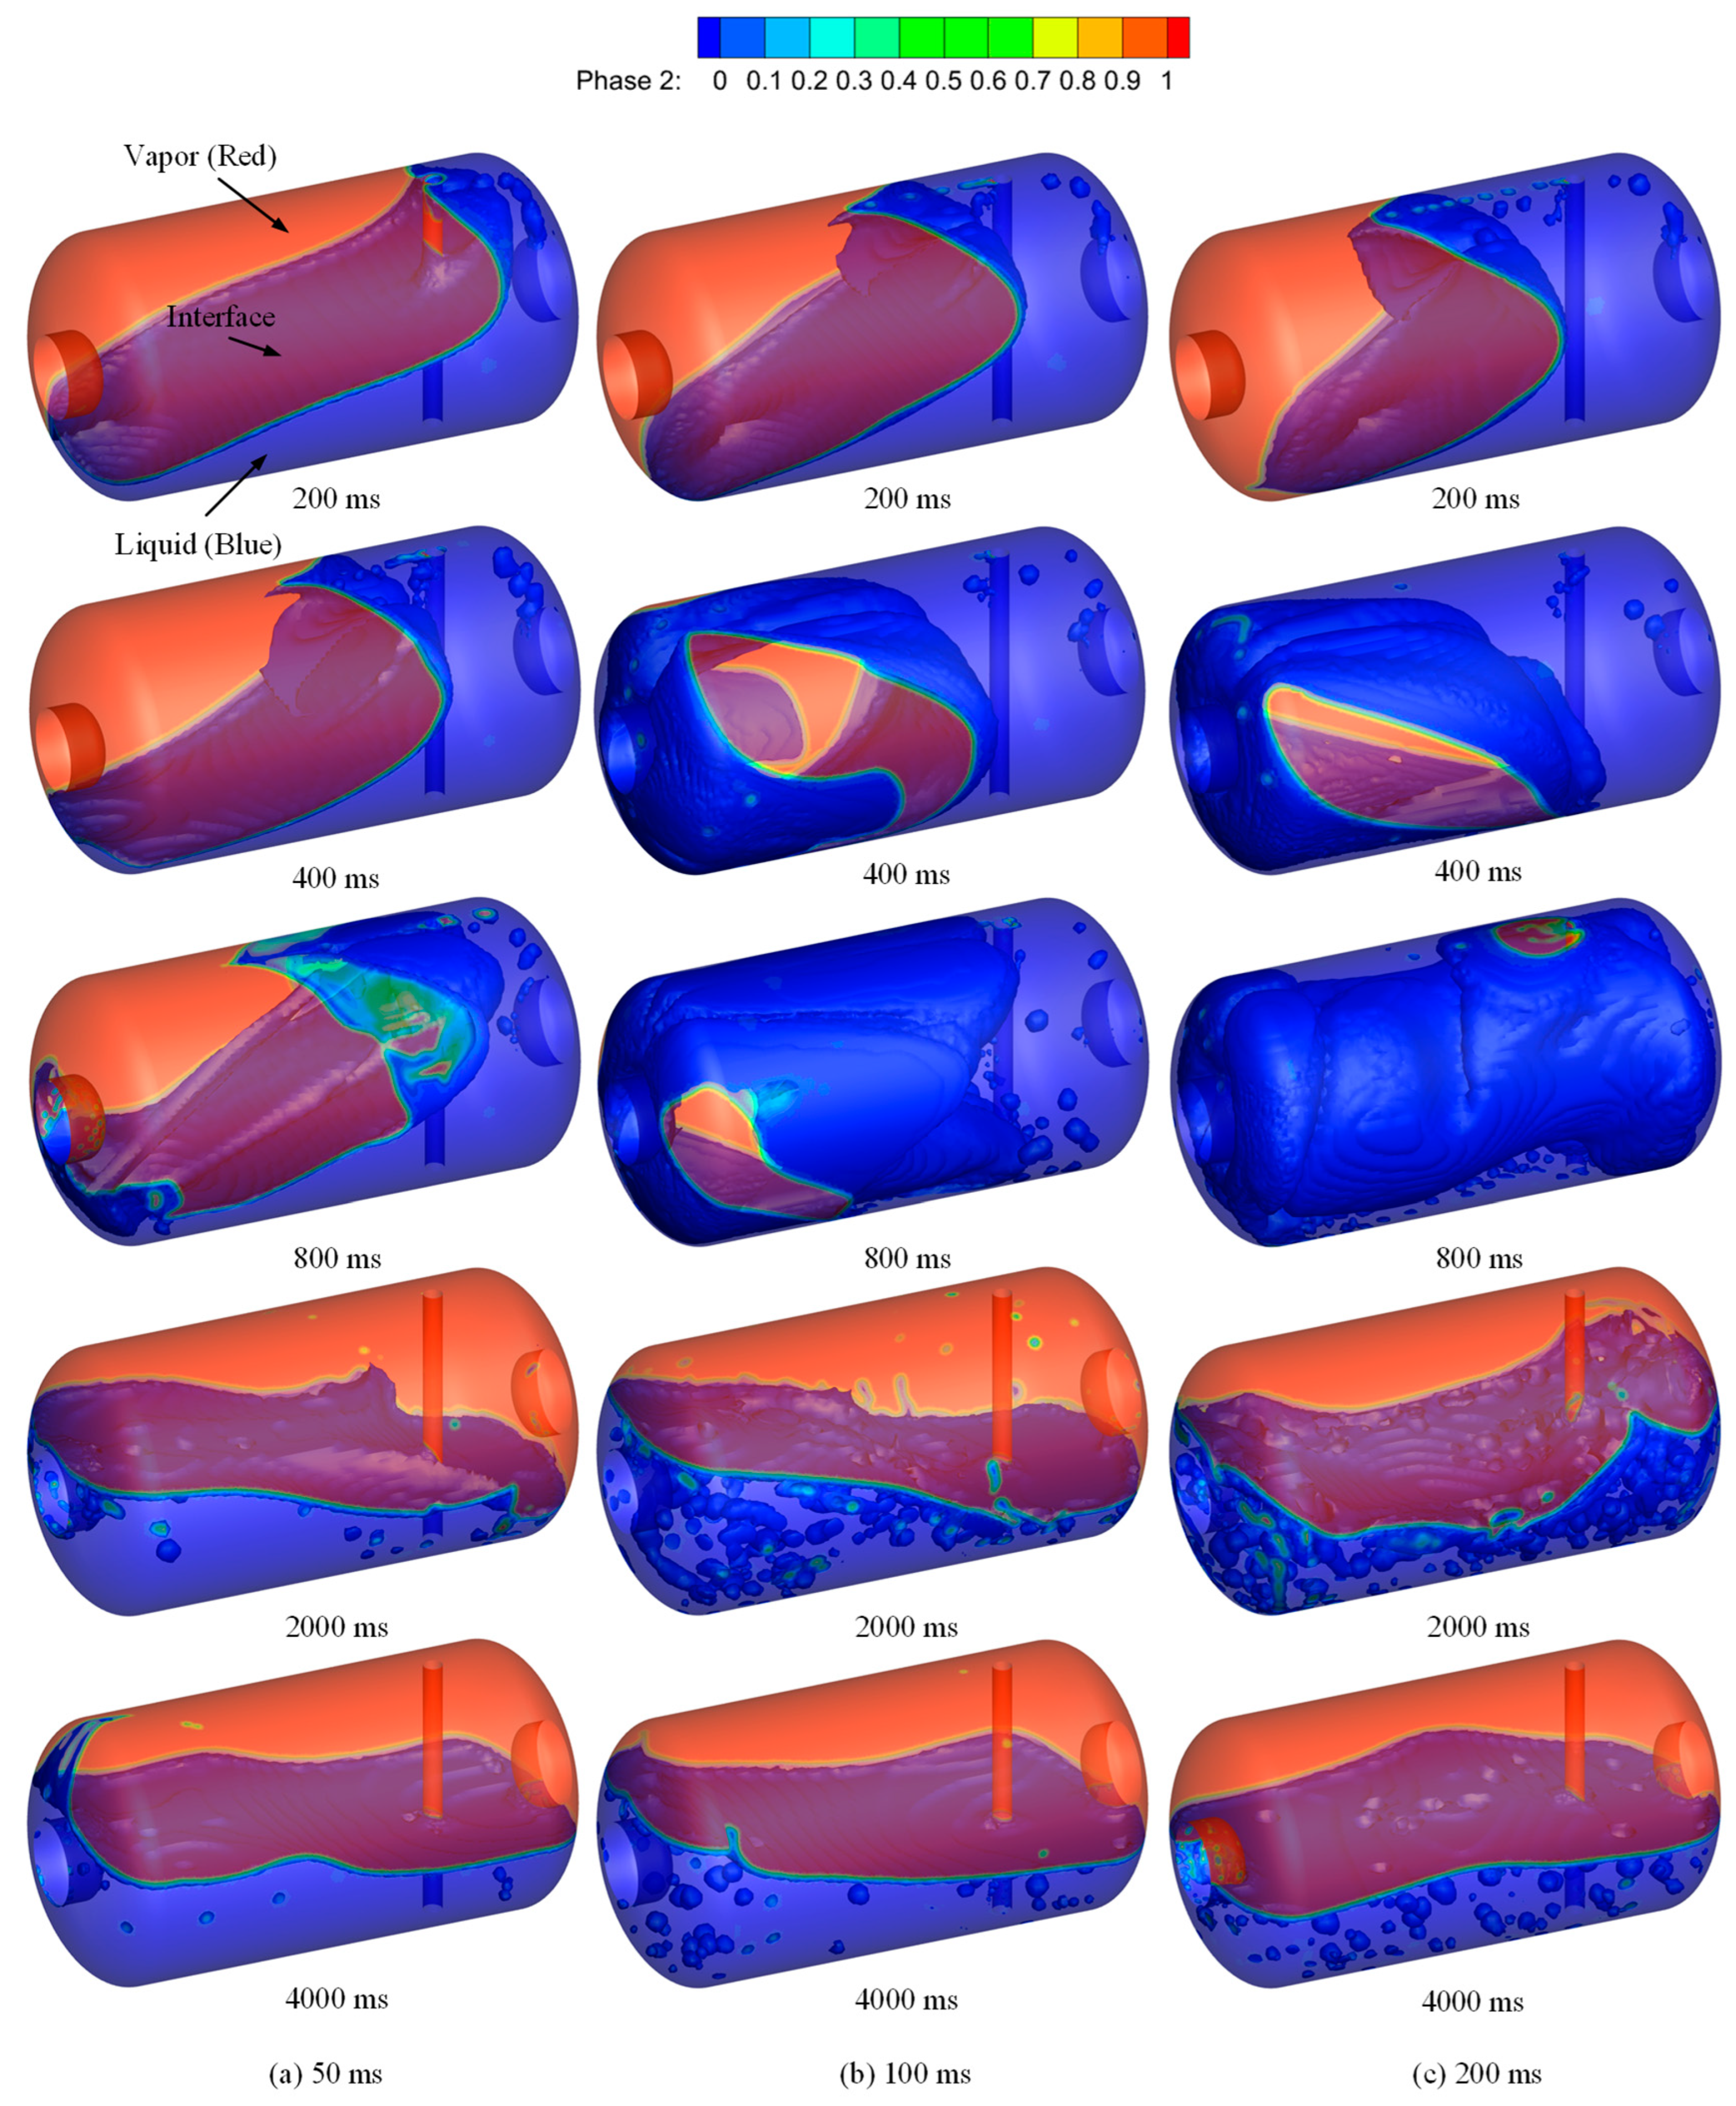
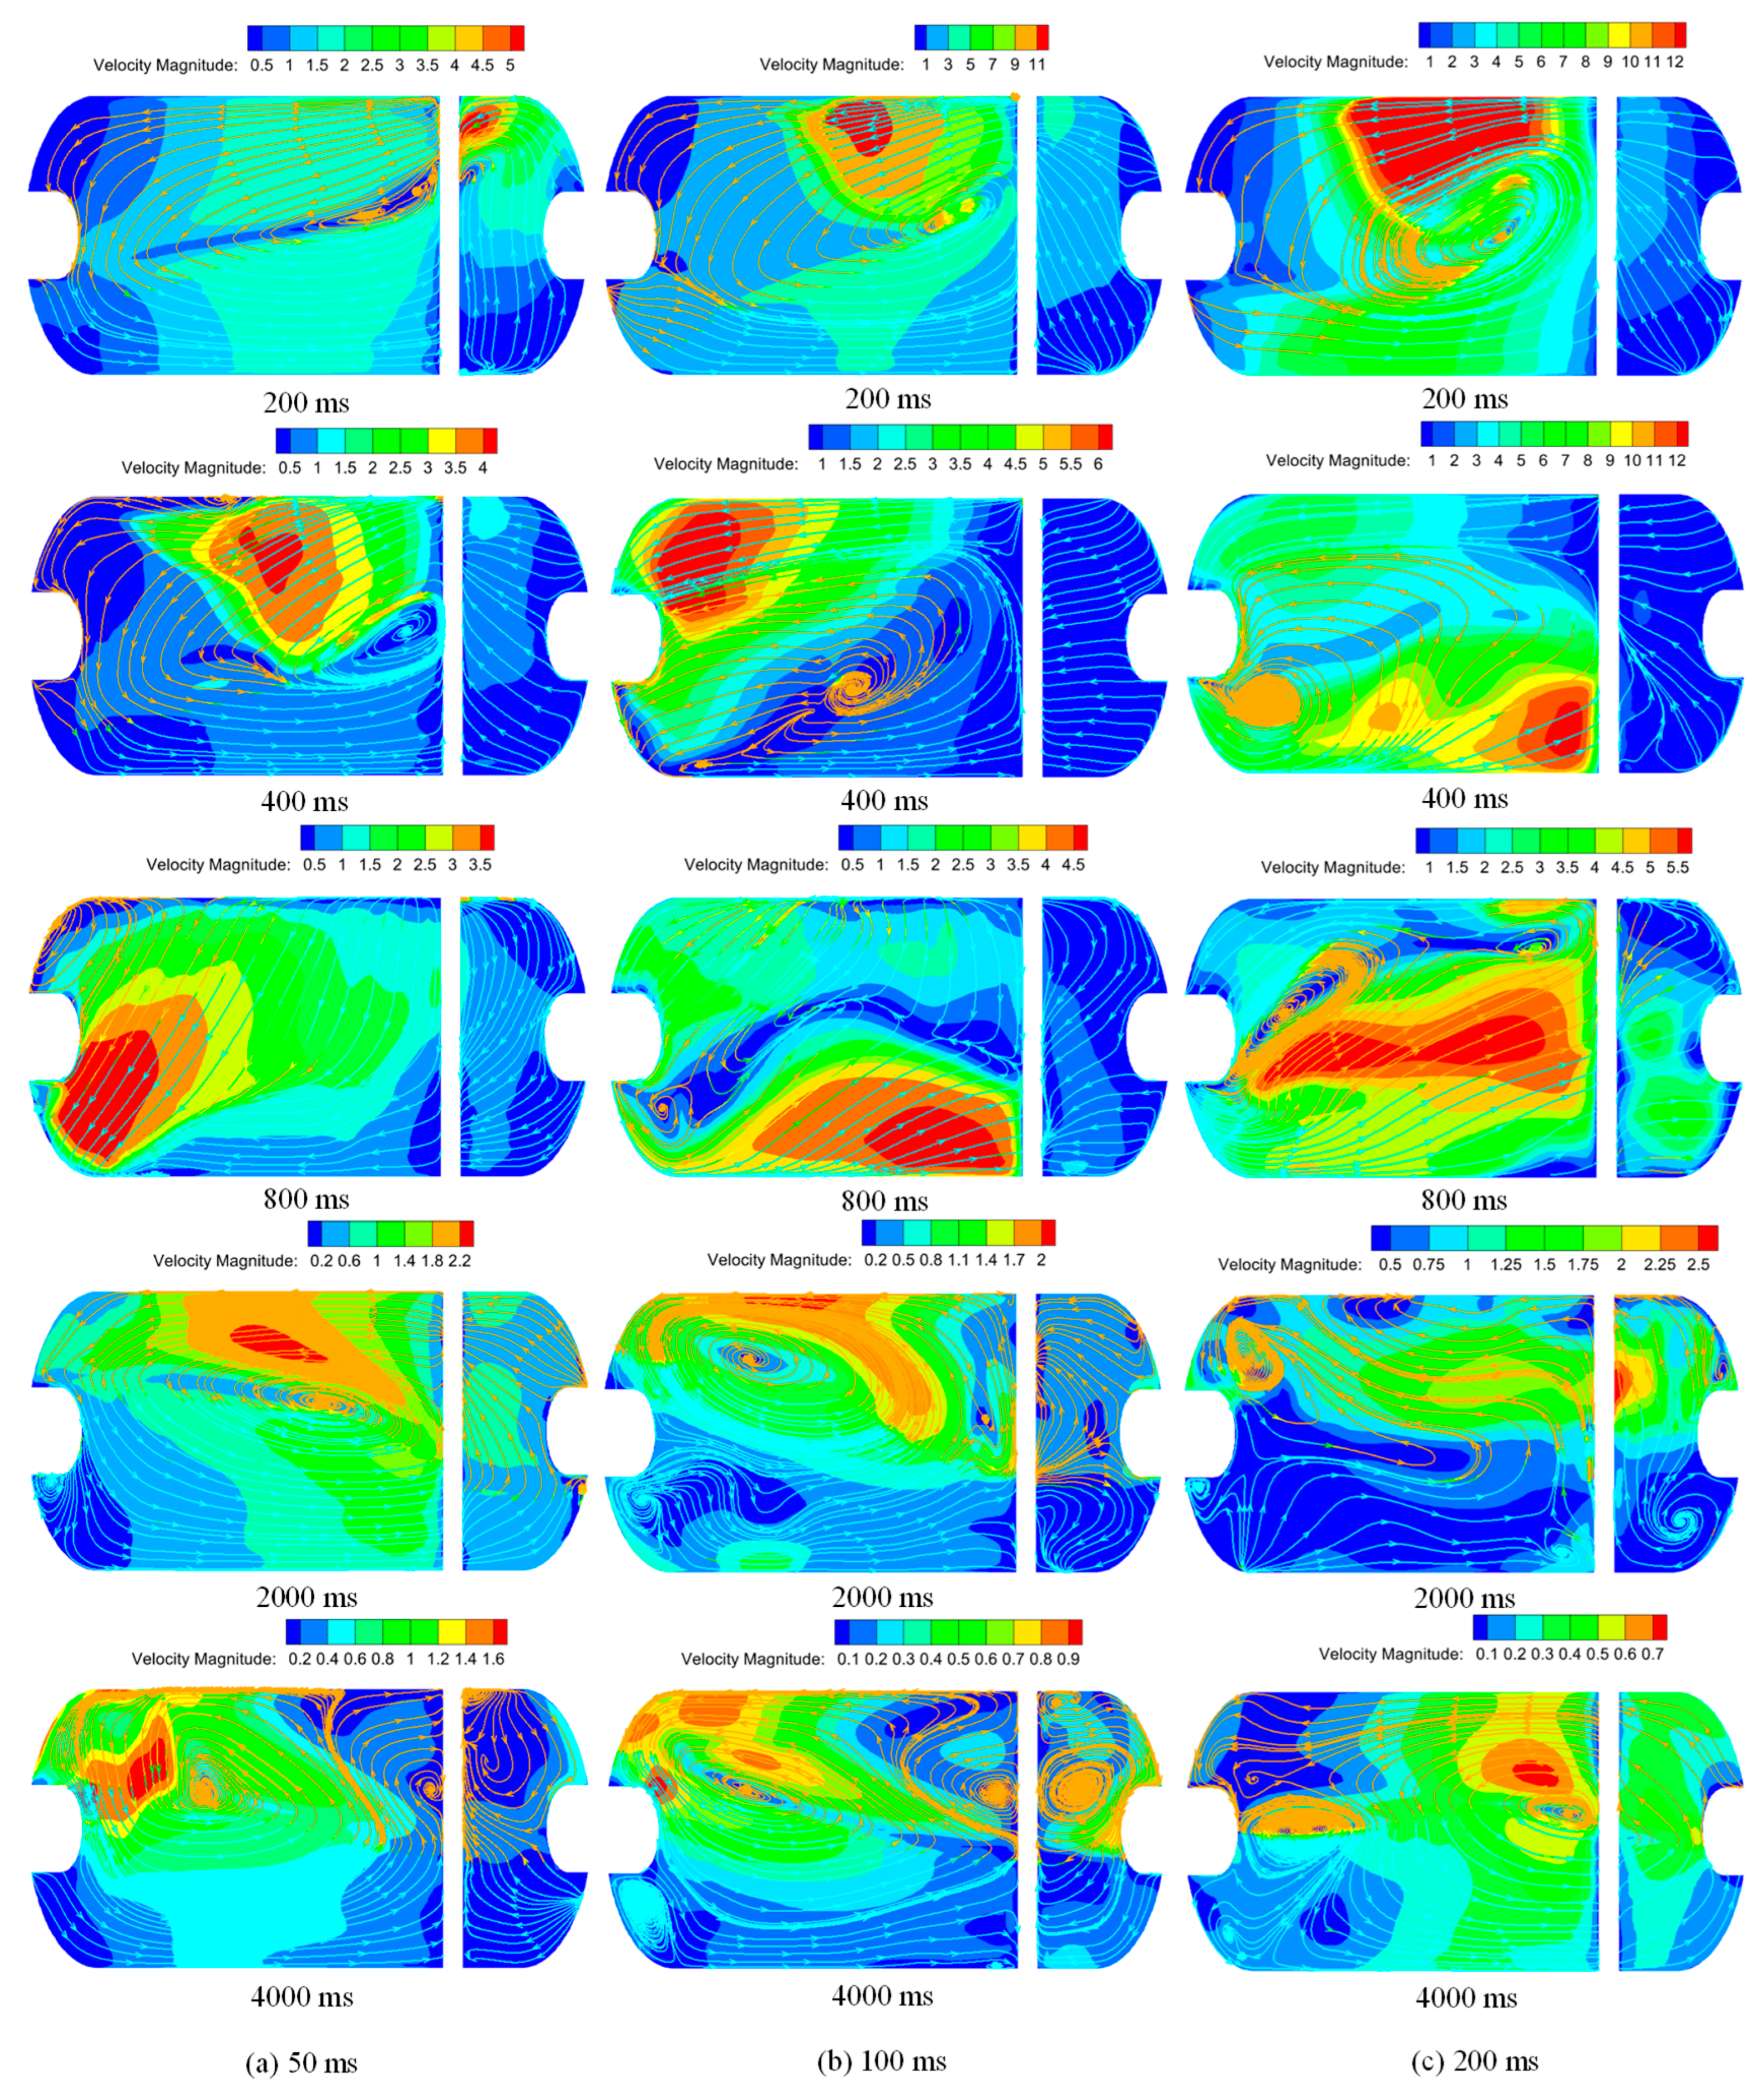
4.3. Influence of Duration of Acceleration on Fluid Sloshing

To research the effect of duration of acceleration on the sloshing of liquid hydrogen within the tank for heavy-duty trucks, the numerical simulation is carried out for durations of acceleration of 50 ms, 100 ms and 200 ms, respectively, with the other conditions being set as in Section 4.1.
Figure 15 compares the position changes in liquid hydrogen centroid along the X-axis (a), Y-axis (b), Z-axis (c), respectively, and the forces on the right wall (d) under different acceleration durations. According to Figure 15a–c, the longer the acceleration duration, the greater the variation amplitude of liquid hydrogen centroid along different directions. Compared with the situation at the duration of acceleration of 200 ms, the maximum change amplitudes of the liquid hydrogen centroid at 100 ms and 50 ms decreased by 6.25% and 13.55% in the X-axis direction, and by 21.86% and 53.74% in the Y-axis direction, respectively. To study the effect of duration of acceleration on the wall force, the forces on the right wall under different acceleration durations are compared. As shown in Figure 15d, the longer the acceleration duration, the greater the force change amplitude of the right wall, but the more slowly the force reaches a peak. Moreover, compared with the situation at the duration of acceleration of 200 ms, the maximum increase in forces on the right wall at 100 ms and 50 ms are reduced by 71.80% and 88.63%, respectively.
Figure 16 compares the changes in thermal parameters in the sloshing process under different acceleration durations. Where (a) is the vapor mass change, (b) is the liquid mass change, (c) is the pressure change at testing point 1, and (d) is the temperature changes at testing points 1 and 2. According to Figure 16a,b, when the duration of acceleration is longer, it has a faster condensation rate and a more condensation amount of vapor within the tank. Compared with the situation at a duration of acceleration of 200 ms, the amounts of vapor condensation decrease by 36.36% and 60.61% at 100 ms and 50 ms, respectively. As shown in Figure 16c, when the duration of acceleration is longer, the ullage pressure has a faster decrease rate and a greater reduction range. Compared with the situation at a duration of acceleration of 200 ms, the maximum ullage pressure drops are reduced by 8.17% and 21.62%, respectively, at 100 ms and 50 ms. According to Figure 16d, compared with the situation at the duration of acceleration of 200 ms, the ultimate temperature differences between vapor and liquid increase by 29.41% and 76.92% at 100 ms and 50 ms, respectively.
Figure 17 compares the gas–liquid phase distribution changes with different acceleration durations. When the duration of acceleration is 50 ms, the liquid hydrogen moves to the middle-top of the tank and immediately falls to the bottom under gravity. Although the liquid hydrogen does not cross the top of the tank, the gas–liquid interface obviously fluctuates. A small number of bubbles can be observed in the liquid hydrogen. When the duration of acceleration is 100 ms, a small amount of liquid hydrogen crosses the top of tank under the effect of inertia. In this situation, gas–liquid convection is strengthened, and obvious large bubbles are contained in the liquid. When the duration of acceleration reaches 200 ms, compared with the other two situations, the amount of liquid hydrogen crossing the top of tank increases significantly, and the gas–liquid convective mixing becomes more intense. Moreover, after the gas–liquid interface stabilizes, the number of bubbles within liquid hydrogen increases significantly. According to the comparison, it can be found that the longer the acceleration duration, the larger the sloshing amplitude of liquid hydrogen, and the more intense the gas–liquid convective mixing. When the duration of acceleration is short, only a small amount of liquid hydrogen moves to the top of tank. However, with the increase in the acceleration duration, more liquid hydrogen crossed the top of tank under the effect of acceleration excitation and inertia.
Figure 18 compares the temperature field distribution changes under different acceleration durations. According to the comparison, it can be found that after fluid sloshing, the temperature of the gas phase is relatively uniform, and the temperature stratification of the liquid phase is still present. However, the longer the duration of acceleration, the more thoroughly the temperature stratification structure in the tank is destroyed, the stronger the gas–liquid convection heat transfer, and the smaller the number of layers of liquid temperature stratification after heat exchange.
Figure 19 compares the velocity field distributions and streamline changes under different acceleration durations. According to the changes in the velocity field, the longer the duration of acceleration, the greater the maximum velocity value during liquid hydrogen sloshing, and the faster the velocity attenuation after sloshing. Based on the changes in the streamline, when the duration of acceleration is 50 ms, a large eddy always exists in the flow field during the sloshing, while the position of the vortex center is constantly changing. Furthermore, the obstruction effect of the liquid level gauge on liquid hydrogen sloshing, makes it easy to generate the small eddies near the wall of the liquid level gauge. When the acceleration durations are 100 ms and 200 ms, a huge eddy only occurs in the flow field during the large tumbling of liquid hydrogen. Moreover, after liquid hydrogen falls into the bottom under the gravity, the violent oscillation of gas and liquid makes the flow field more disordered, and the obvious eddies can be observed in both the liquid and vapor phases near the wall.

5. Conclusions

In this paper, a three-dimensional numerical model was established to study the fluid sloshing behavior in a horizontal liquid hydrogen tank for heavy-duty trucks. Based on the developed model, the thermodynamic characteristics of large-amplitude sloshing for liquid hydrogen are conducted. Some conclusions are given, as follows:
(1)
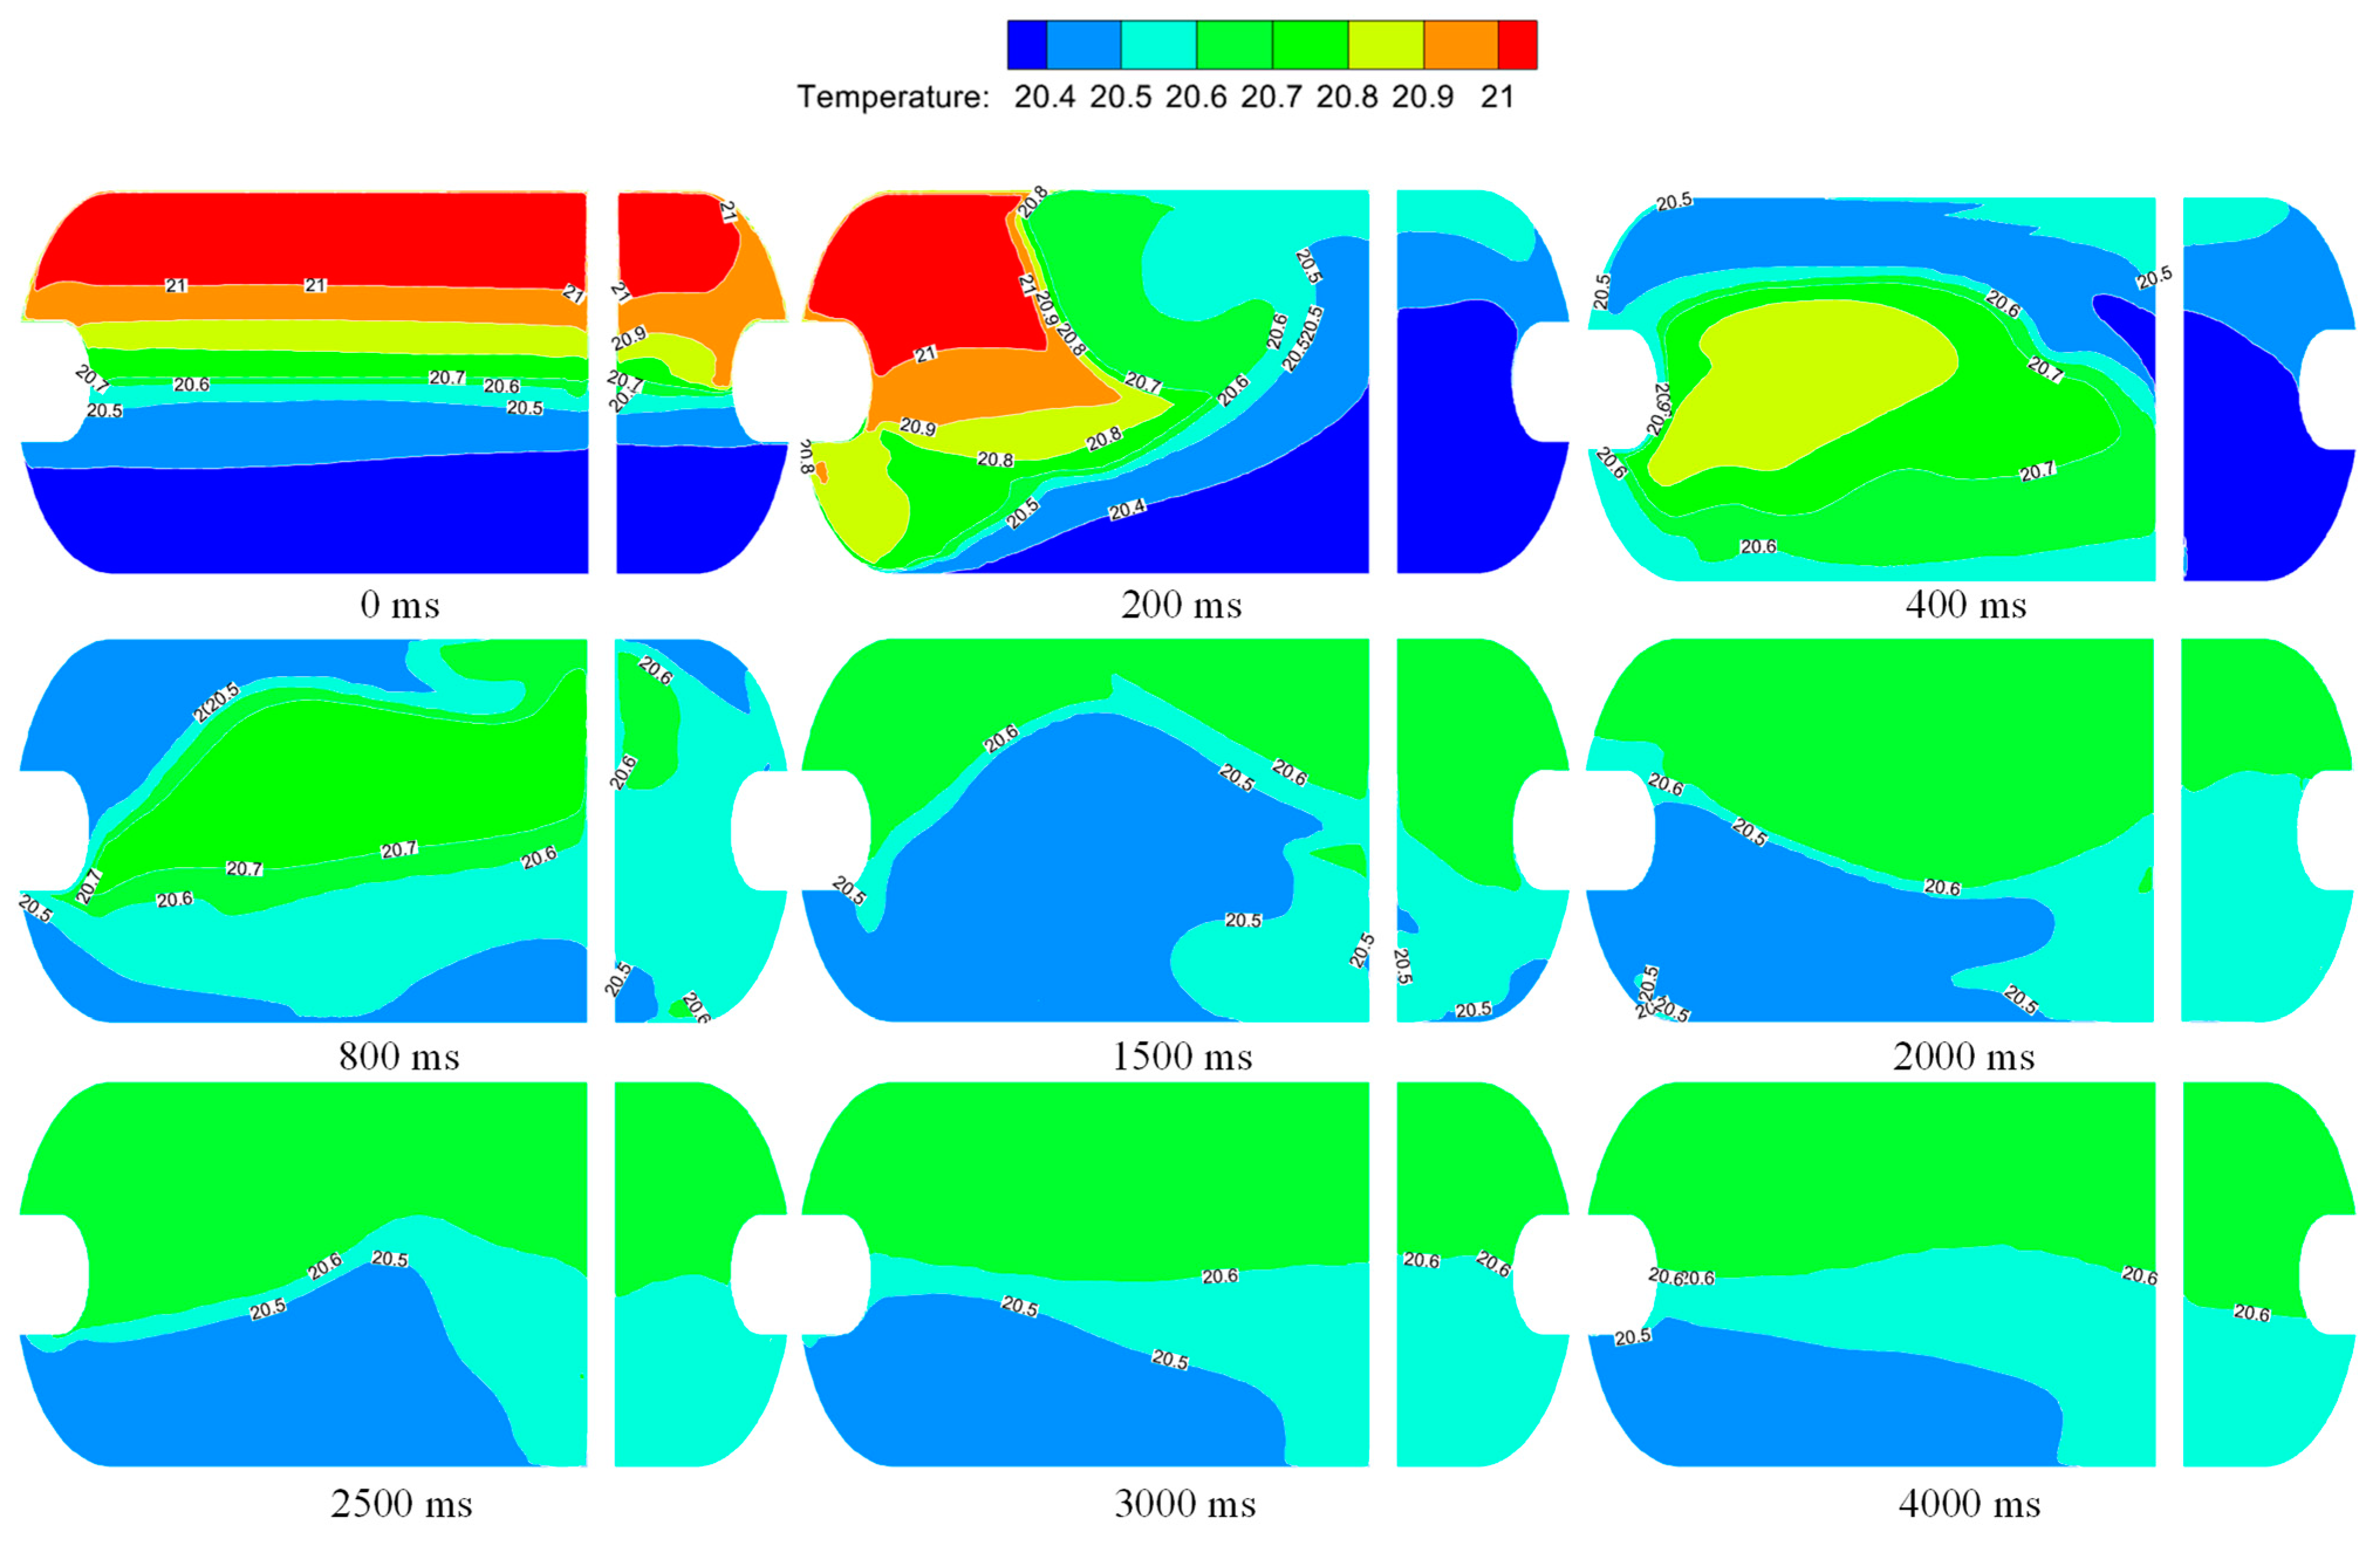
The large-amplitude sloshing of liquid hydrogen within the tank destroys the temperature stratification, resulting in a significant decrease in vapor temperature and an obvious increase in liquid temperature. Moreover, a large amount of hydrogen vapor is condensed, causing a rapid decline in ullage pressure within the tank. Even so, the liquid temperature prominently increases under the effect of heat exchange, tremendously accelerating the process of liquid hydrogen reaching a saturation state.
(2)
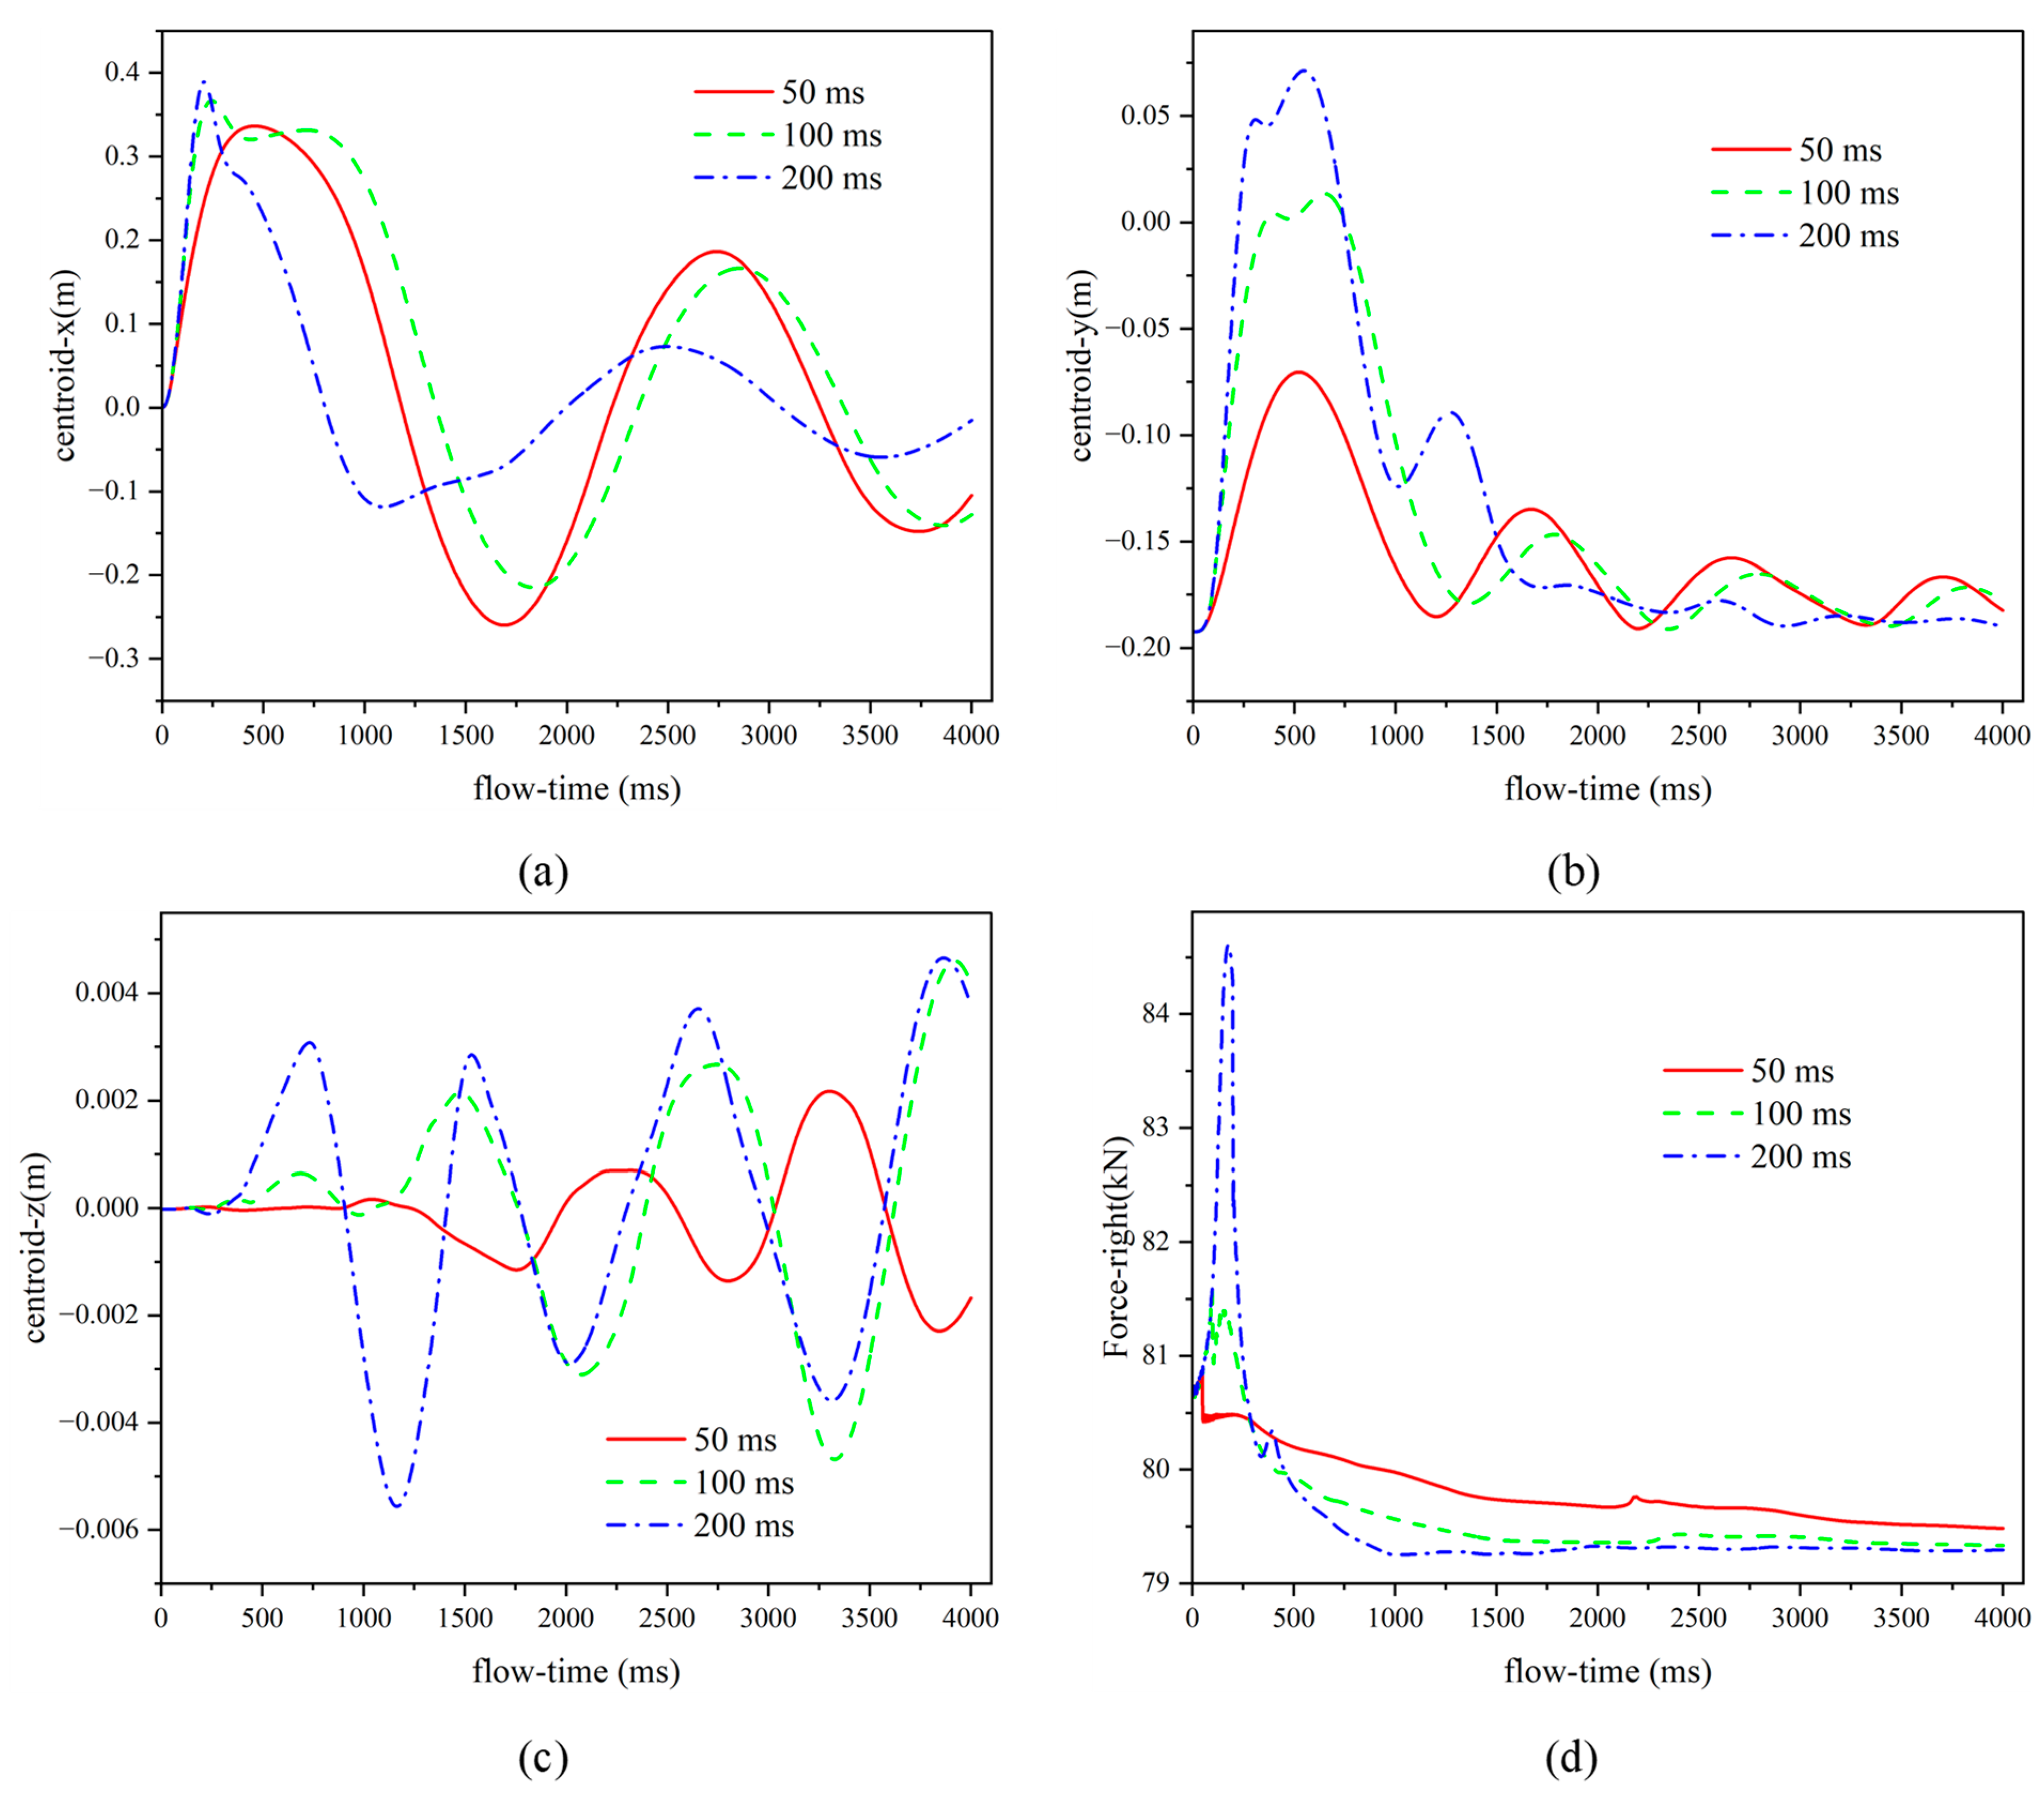
Under extreme acceleration (5 g and 200 ms), the maximum growth of the force on the right wall is 3.89 kN. In addition, the acceleration magnitude and the duration of acceleration greatly affect the force variation on the right wall. With a duration of acceleration of 200 ms, the maximum increase in forces on the right wall is reduced by 80.57% at 2 g and 99.53% at 0.5 g, compared with the circumstances at 5 g. Meanwhile, at an acceleration magnitude of 5 g, the maximum growth of forces on the right wall is decreased by 71.80% at 100 ms and 88.63% at 50 ms in contrast to the circumstances at a duration of 200 ms. This can serve as a reference for the strength design of liquid hydrogen tanks for heavy-duty trucks.
(3)
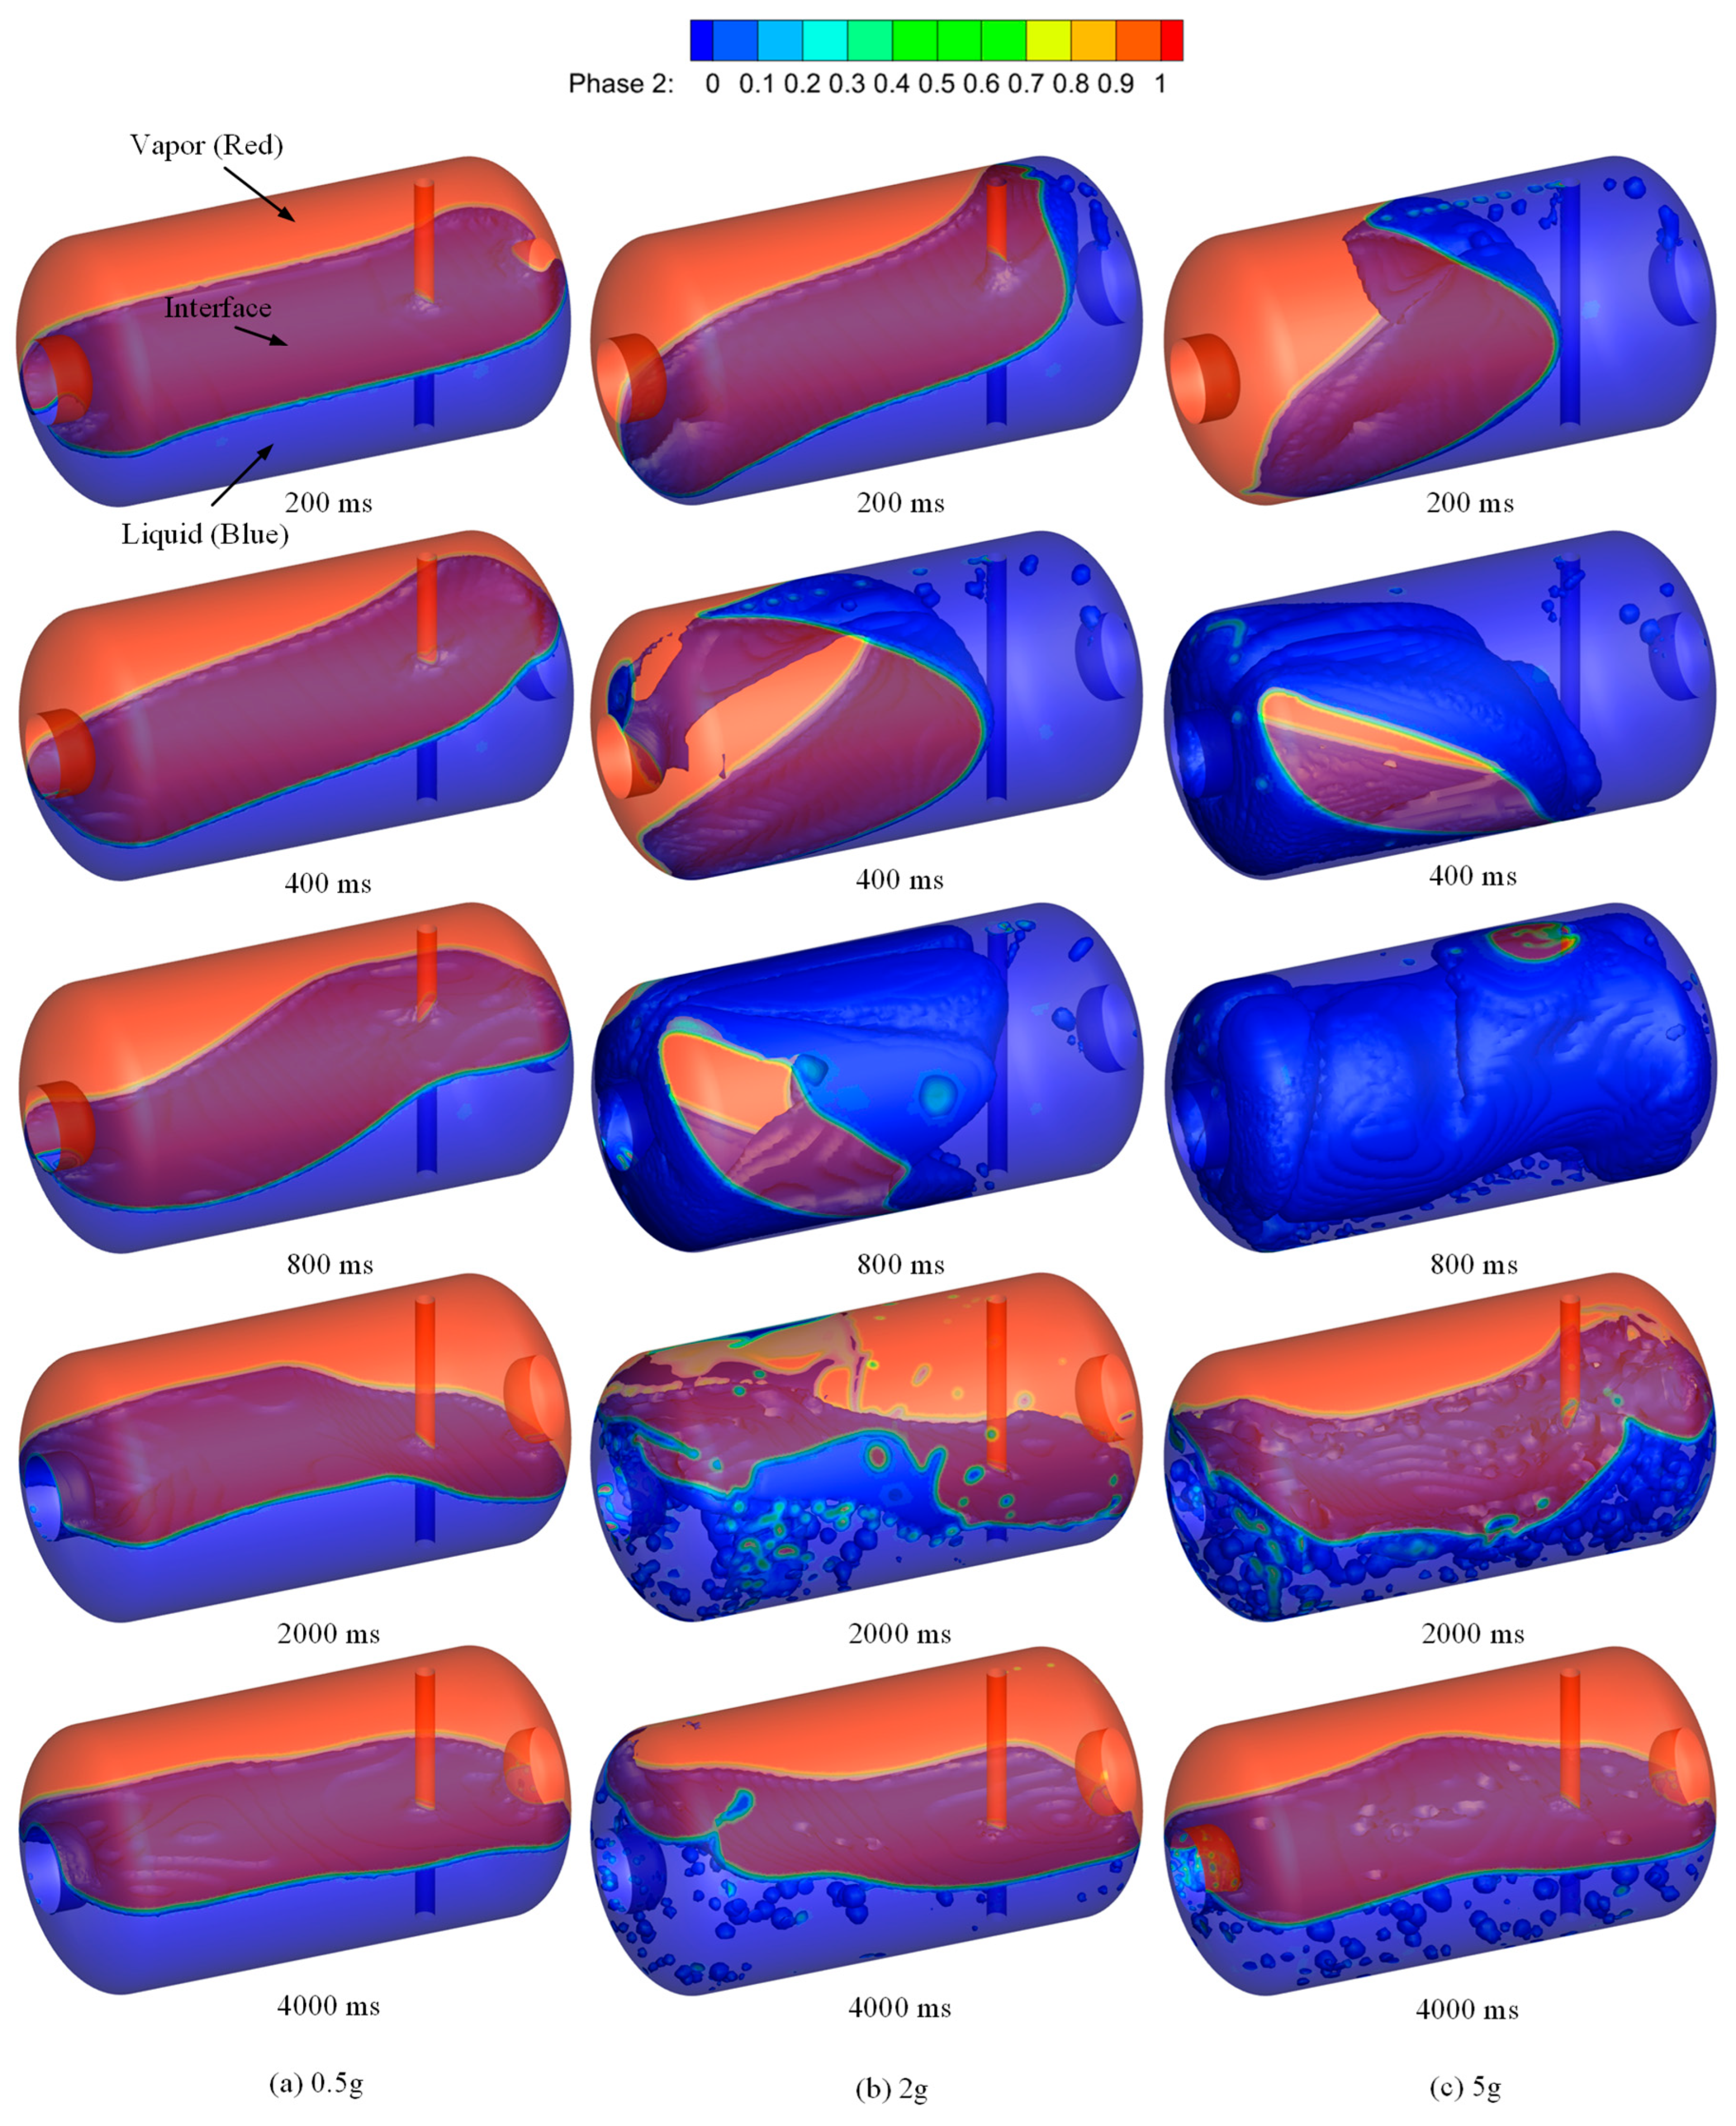
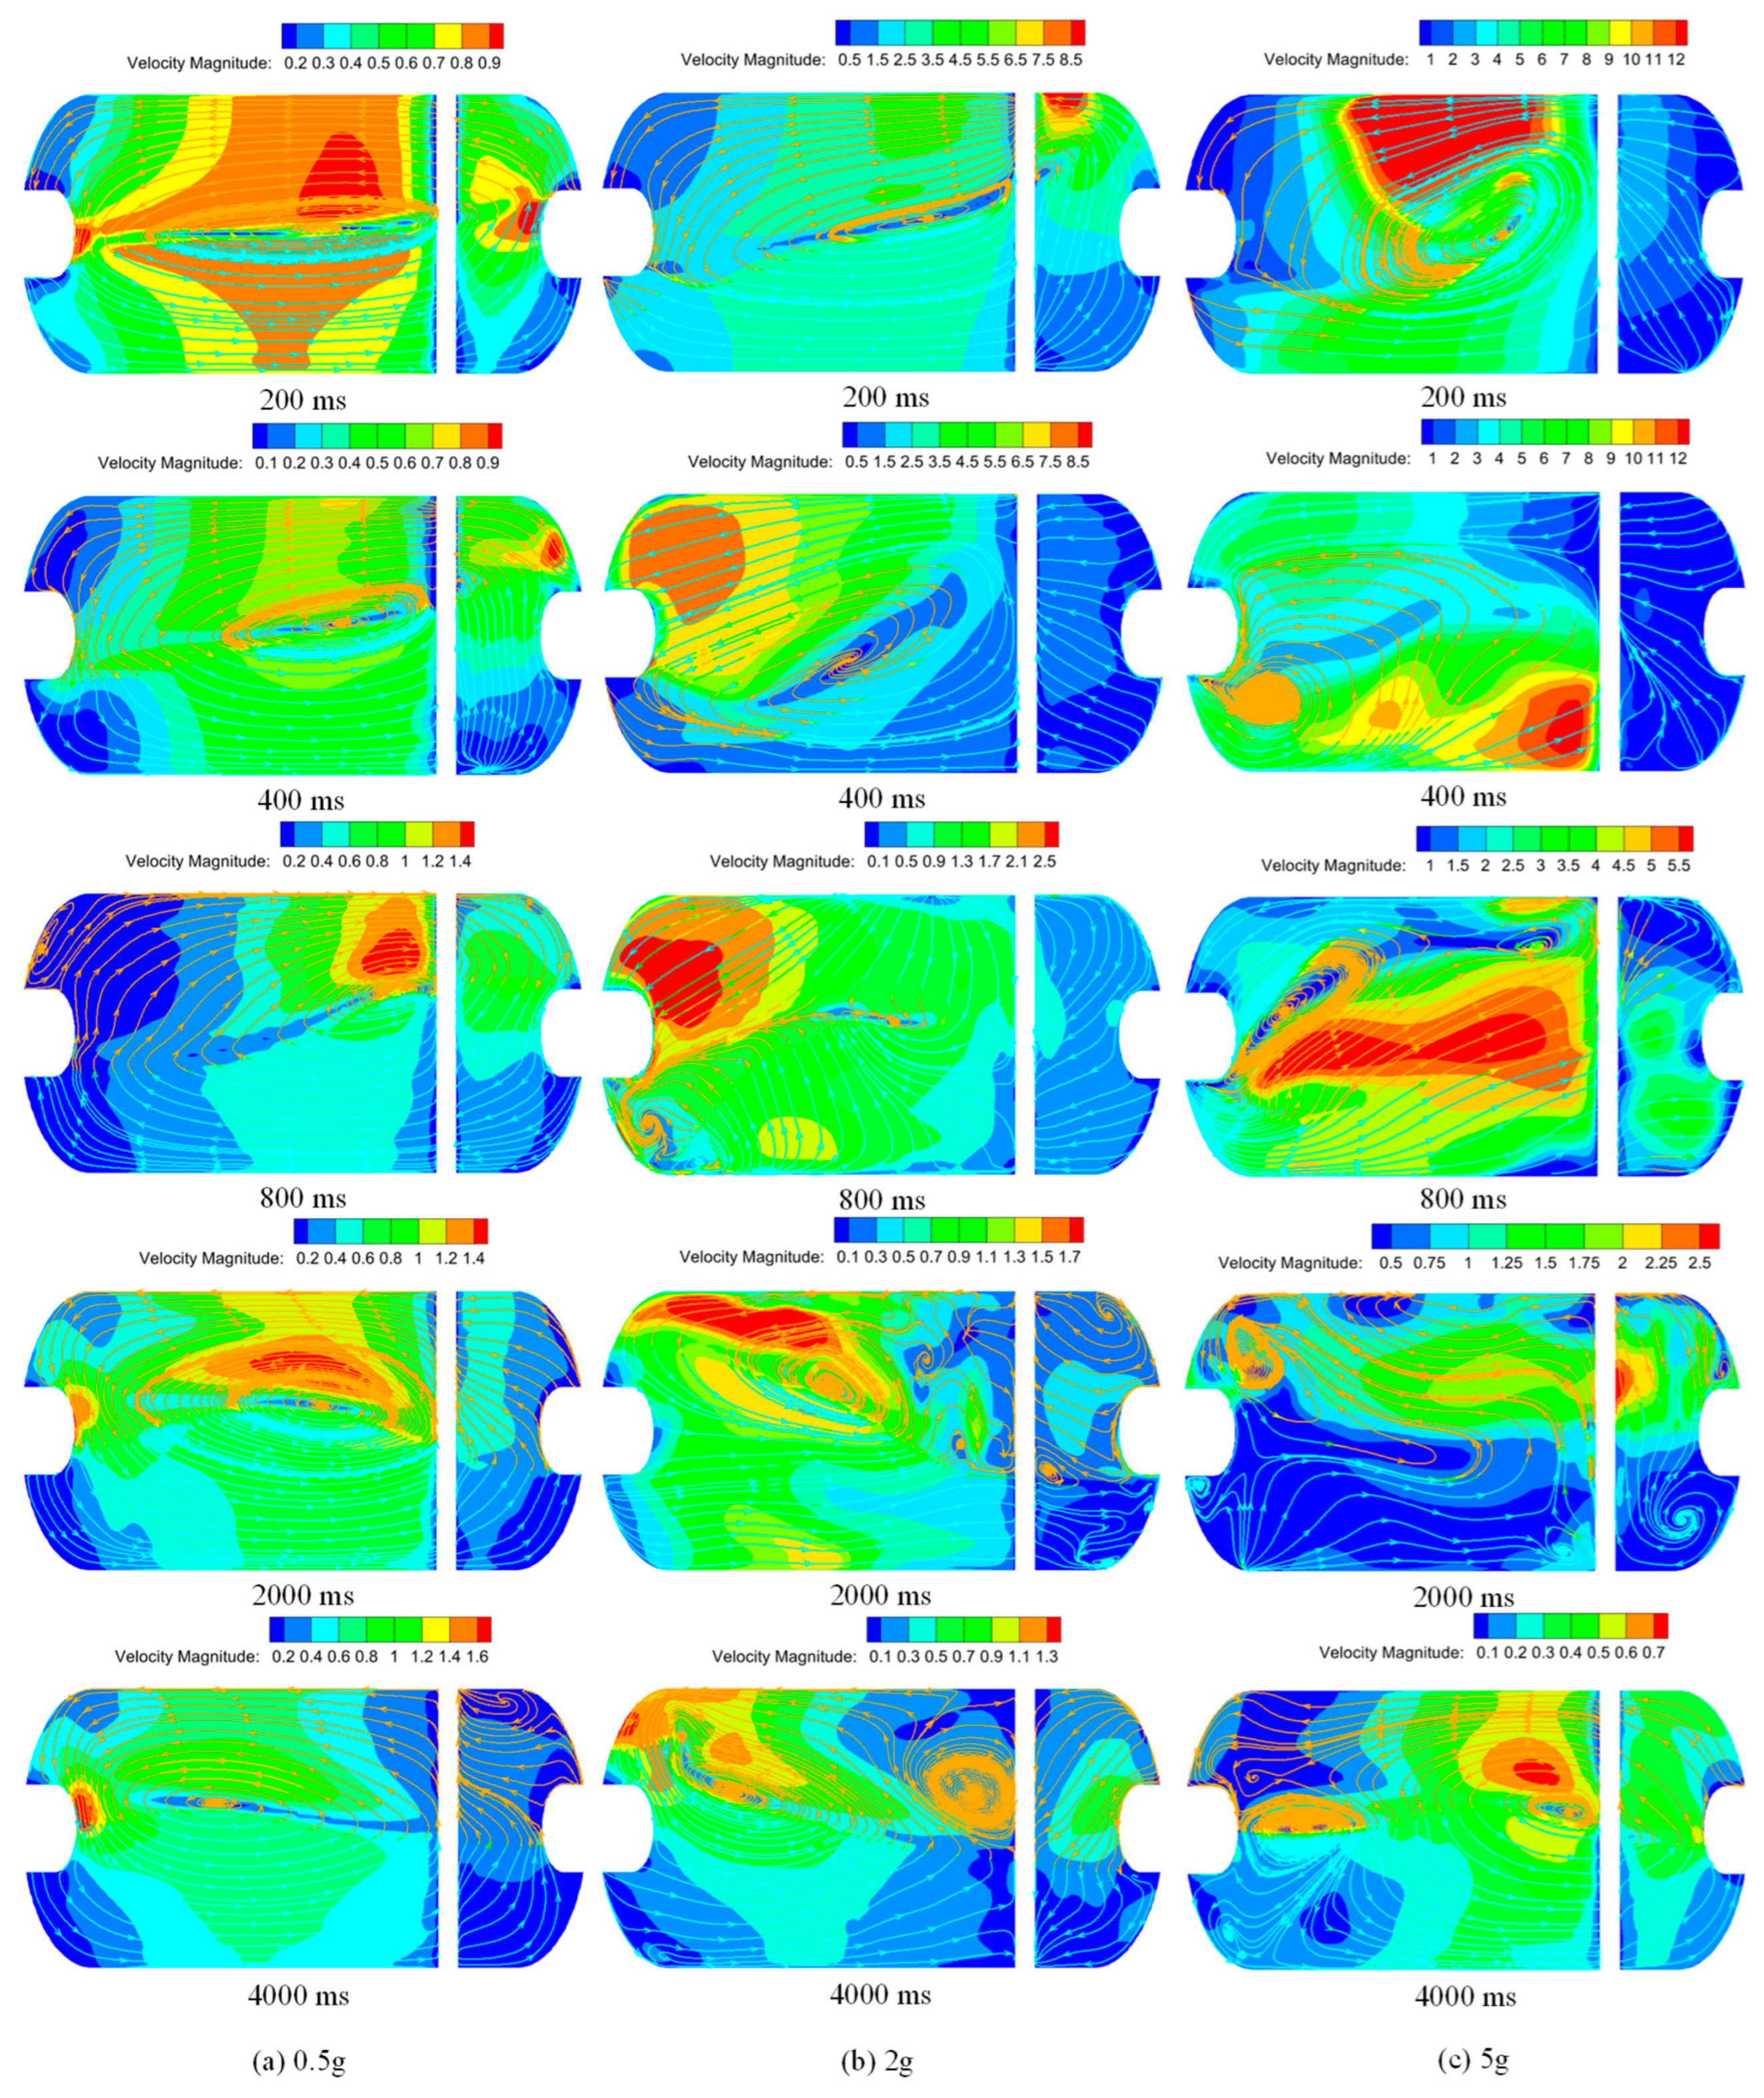
When subjected to excitation with a large acceleration magnitude or a long acceleration duration, the liquid hydrogen within the tank is prone to a large-amplitude sloshing behavior, which can even cause the liquid hydrogen to turn over towards the top of the tank under the effects of inertia. In particular, in severe cases, under the effect of large-amplitude sloshing of liquid hydrogen, vapor may fill the bottom of the tank over a period of time. Moreover, after the liquid hydrogen falls back to the bottom under the gravity, it carries a large amount of vapor, and the liquid contains many bubbles.
(4)
The acceleration magnitude and duration have a significant effect on the ullage pressure and ultimate temperature differences between vapor and liquid. In contrast to the case at 5 g, the maximum reductions in ullage pressure are decreased by 9.46% and 55.02%, and the ultimate temperature differences between vapor and liquid increase by 8.60% and 189.59% at 2 g and 0.5 g, respectively. Furthermore, compared with the case at a duration of acceleration of 200 ms, the maximum ullage pressure drops are reduced by 8.17% and 21.62%, and the ultimate temperature differences between vapor and liquid increase by 29.41% and 76.92% at 100 ms and 50 ms, respectively.

Author Contributions

Conceptualization, F.X. and Y.Z.; methodology, F.X. and Y.Z.; software, Y.Z.; validation, Y.Z. and F.X.; formal analysis, Y.Z. and F.X.; investigation, Y.Z.; resources, Y.Z.; data curation, Y.Z.; writing—original draft preparation, F.X. and Y.Z.; writing—review and editing, F.X. and Y.Z.; visualization, W.G. (Wan Guo) and Y.Z.; supervision, F.X. and Y.L.; project administration, Y.B. and W.G. (Wanli Gao); funding acquisition, Y.B. and W.G. (Wanli Gao). All authors have read and agreed to the published version of the manuscript.

Funding

This work was supported by National Natural Science Foundation of China (52276018), National Key R&D Program of China (2019YFB1504900), and China Postdoctoral Science Foundation (2021T140538).

Data Availability Statement

No new data were created or analyzed in this study. Data sharing is not applicable to this article.

Conflicts of Interest

The authors declare no conflict of interest.

References

  1. Shi, X.; Cai, L.; Li, Z.; Cui, Y. Exploring Technological Solutions for Onboard Hydrogen Storage Systems through a Heterogeneous Knowledge Network: From Current State to Future Research Opportunities. Front. Energy Res. 2022, 10, 2–16. [Google Scholar] [CrossRef]
  2. Inal, Ö.; Dere, Ç.; Deniz, C. Onboard hydrogen storage for ships: An overview. In Proceedings of the 5th International Hydrogen Technologies Congress (IHTEC-2021), Niğde, Turkey, 26–28 May 2021. [Google Scholar]
  3. Galassi, M.C.; Acosta-Iborra, B.; Baraldi, D.; Bonato, C.; Harskamp, F.; Frischauf, N.; Moretto, P. Onboard compressed hydrogen storage: Fast filling experiments and simulations. Energy Procedia 2012, 29, 192–200. [Google Scholar] [CrossRef]
  4. Aceves, S.M.; Berry, G.D.; Rambach, G.D. Insulated pressure vessels for hydrogen storage on vehicles. Int. J. Hydrogen Energy 1998, 23, 583–591. [Google Scholar] [CrossRef]
  5. Aceves, S.M.; Espinosa-Loza, F.; Ledesma-Orozco, E.; Ross, T.O.; Weisberg, A.H.; Brunner, T.C.; Kircher, O. High-density automotive hydrogen storage with cryogenic capable pressure vessels. Int. J. Hydrogen Energy 2010, 35, 1219–1226. [Google Scholar] [CrossRef]
  6. Ahluwalia, R.K.; Hua, T.Q.; Peng, J.K. On-board and Off-board performance of hydrogen storage options for light-duty vehicles. Int. J. Hydrogen Energy 2012, 37, 2891–2910. [Google Scholar] [CrossRef]
  7. Hwang, H.T.; Varma, A. Hydrogen storage for fuel cell vehicles. Curr. Opin. Chem. Eng. 2014, 5, 42–48. [Google Scholar] [CrossRef]
  8. Durbin, D.J.; Malardier-Jugroot, C. Review of hydrogen storage techniques for on board vehicle applications. Int. J. Hydrogen Energy 2013, 38, 14595–14617. [Google Scholar] [CrossRef]
  9. Felderhoff, M.; Weidenthaler, C.; von Helmolt, R.; Eberle, U. Hydrogen storage: The remaining scientific and technological challenges. Phys. Chem. Chem. Phys. 2007, 9, 2643–2653. [Google Scholar] [CrossRef] [PubMed]
  10. Raucci, C.; Calleya, J.; Suarez De La Fuente, S.; Pawling, R. Hydrogen on board ship: A first analysis of key parameters and implications. In Proceedings of the SCC Conference 2015, New York City, NY, USA, 27 June–2 July 2015; University of Strathclyde: Glasgow, UK, 2015. [Google Scholar]
  11. Mori, D.; Hirose, K. Recent challenges of hydrogen storage technologies for fuel cell vehicles. Int. J. Hydrogen Energy 2009, 34, 4569–4574. [Google Scholar] [CrossRef]
  12. Peschka, W. Hydrogen: The future cryo-fuel in internal combustion engines. Int. J. Hydrogen Energy 1998, 23, 27–43. [Google Scholar] [CrossRef]
  13. Escher, W.J.D. Hydrogen-fueled internal combustion engine, a technical survey of contemporary US projects. NASA STI/Recon Tech. Rep. N 1975, 76, 31692. [Google Scholar]
  14. Billings, R.E. Hydrogen Storage in Automobiles Using Cryogenics and Metal Hydrides. In Proceedings of the Hydrogen Economy Miami Energy (THEME) Conference, Miami Beach, FL, USA, 1–3 March 1975; pp. S8–S51. [Google Scholar]
  15. Zhang, Z.Y.; Wang, F.; Zhao, Y.Z.; Lu, M.; Lu, H. Review of research on hydrogen storage system of automobile based on Cryogenic technology. Cryog. Spec. Gas 2020, 38, 1–8. [Google Scholar]
  16. Ustolin, F.; Campari, A.; Taccani, R. An Extensive Review of Liquid Hydrogen in Transportation with Focus on the Maritime Sector. J. Mar. Sci. Eng. 2022, 10, 1222. [Google Scholar] [CrossRef]
  17. Michel, F.; Fieseler, H.; Meyer, G.; Theiβen, F. On-board equipment for liquid hydrogen vehicles. Int. J. Hydrogen Energy 1998, 23, 191–199. [Google Scholar] [CrossRef]
  18. Böhm, M.; Del Rey, A.F.; Pagenkopf, J.; Varela, M.; Herwartz-Polster, S.; Calderón, B.N. Review and comparison of worldwide hydrogen activities in the rail sector with special focus on on-board storage and refueling technologies. Int. J. Hydrogen Energy 2022, 47, 38003–38017. [Google Scholar] [CrossRef]
  19. Nie, Z.S.; Li, Q.; Hong, G.T.; Yu, X.E. Theoretical and experimental study on evaporation Rate of liquid hydrogen Dewar on vehicle. Cryog. Eng. 2004, 4, 55–58. [Google Scholar]
  20. Escher, W.J.D. Survey of Liquid Hydrogen Container Techniques for Highway Vehicle Fuel System Applications; Escher Technology Associates: St. Johns, MI, USA, 1978. [Google Scholar]
  21. Michel, F.; Fieseler, H.; Allidieres, L. Liquid hydrogen technologies for mobile use. In Proceedings of the WHEC, Lyon, France, 13–16 June 2006; p. 16. [Google Scholar]
  22. Ahluwalia, R.K.; Hua, T.Q.; Peng, J.K.; Lasher, S.; McKenney, K.; Sinha, J.; Gardiner, M. Technical assessment of cryo-compressed hydrogen storage tank systems for automotive applications. Int. J. Hydrogen Energy 2010, 35, 4171–4184. [Google Scholar] [CrossRef]
  23. Maekawa, K.; Takeda, M.; Matsuno, Y.; Fujikawa, S.; Kuroda, T.; Kumakura, H. Fundamental study of tank with MgB2 level sensor for transportation of liquid hydrogen. Phys. Procedia 2015, 67, 1164–1168. [Google Scholar] [CrossRef]
  24. Wallner, T.; Lohse-Busch, H.; Gurski, S.; Duoba, M.; Thiel, W.; Martin, D.; Korn, T. Fuel economy and emissions evaluation of BMW Hydrogen 7 Mono-Fuel demonstration vehicles. Int. J. Hydrogen Energy 2008, 33, 7607–7618. [Google Scholar] [CrossRef]
  25. Schultheiß, D. Permeation Barrier for Lightweight Liquid Hydrogen Tanks; U.S. Department of Energy Office of Scientific and Technical Information: Oak Ridge, TN, USA, 2007.
  26. Miao, C.; Zhang, Y.; Huang, L. Key Technologies of Vehicle Liquid Hydrogen Container. Cryog. Supercond. 2022, 50, 71–74. [Google Scholar] [CrossRef]
  27. Wei, J.Y.; Song, J.J.; Liu, B. Experimental study on Sealing Performance of Liquid Hydrogen Valve of Hydrogen Energy Vehicle and Real Medium. Vac. Cryog. 2021, 27, 378–384. [Google Scholar]
  28. Wang, X.; Duan, W.H.; Wu, H.M.; Wang, Y.H. Design of Control Module for Vehicle Liquid Hydrogen Storage and Supply System. Manuf. Upgrad. Today 2022, 5, 67–69. [Google Scholar]
  29. Zhao, K. Research on Heat Transfer of Vehicle-Mounted Liquid Hydrogen Vaporizer; The First Research Institute of China Aerospace Science and Technology Corporation: Beijing, China, 2018. [Google Scholar]
  30. Zhang, X.B. Research on Ultimate Bearing Capacity of Cryogenic Liquid Hydrogen Tank; Taiyuan University of Technology: Taiyuan, China, 2020. [Google Scholar] [CrossRef]
  31. Yang, M.; Hu, S.; Yang, F.; Xu, L.; Bu, Y.; Yuan, D. On-Board Liquid Hydrogen Cold Energy Utilization System for a Heavy-Duty Fuel Cell Hybrid Truck. World Electr. Veh. J. 2021, 12, 136. [Google Scholar] [CrossRef]
  32. Rao, G.L. Performance Research and Improvement of Hydrogen Vehicle Powertrain; Shanghai Jiao Tong University: Shanghai, China, 2013. [Google Scholar]
  33. Li, H.; Hu, Z.Y.; Hu, J.Y.; Dong, J.C.; Li, J.Q.; Xu, L.F.; Ouyang, M.G.; Bu, Y.; Wang, L.J.; Qin, Z.D. Design, Analysis and Validation of a New Distributed Drive Liquid Hydrogen Fuel Cell Heavy Duty Commercial Vehicle. Automot. Eng. 2022, 44, 1183–1198+1250. [Google Scholar] [CrossRef]
  34. Kartuzova, O.; Kassemi, M. Validation of a CFD Model Predicting the Effect of High Level Lateral Acceleration Sloshing on the Heat Transfer and Pressure Drop in a Small-Scale Tank in Normal Gravity. In Proceedings of the ASME 2018 5th Joint US-European Fluids Engineering Division Summer Meeting, Montreal, QC, Canada, 15–18 July 2018. [Google Scholar]
  35. Konopka, M.; Noeding, P.; Klatte, J.; Behruzi, P.; Gerstmann, J.; Stark, A.; Darkow, N. Analysis of LN2 filling, draining, stratification and sloshing experiments. In Proceedings of the 46th AIAA Fluid Dynamics Conference, Washington, DC, USA, 13–17 June 2016; p. 4272. [Google Scholar]
  36. Ludwig, C.; Dreyer, M.E.; Hopfinger, E.J. Pressure variations in a cryogenic liquid storage tank subjected to periodic excitations. Int. J. Heat Mass Transf. 2013, 66, 223–234. [Google Scholar] [CrossRef]
  37. Arndt, T.; Dreyer, M.; Behruzi, P.; Winter, M. Laterally excited sloshing tests with liquid nitrogen LN2. In Proceedings of the 44th AIAA/ASME/SAE/ASEE Joint Propulsion Conference & Exhibit, Hartford, CT, USA, 21–23 July 2008; p. 4551. [Google Scholar]
  38. Zhou, Q.Q.; Tan, Y.H.; Xu, Z.L.; Wang, J.; Wang, Z. Numerical Simulation of Propellant Slosh in Cylindrical Tank of Launch Vehicle. Propuls. Technol. 2022, 43, 358–364. [Google Scholar] [CrossRef]
  39. Yang, H.; Peugeot, J. Propellant sloshing parameter extraction from CFD analysis. In Proceedings of the 46th AIAA/ASME/SAE/ASEE Joint Propulsion Conference & Exhibit, Nashville, TN, USA, 25–28 July 2010; p. 6889. [Google Scholar]
  40. Kim, S.; West, J. Sloshing in the Liquid Hydrogen and Liquid Oxygen Propellant Tanks After Main Engine Cut Off. In Proceedings of the JANNAF 5th Spacecraft Propulsion Subcommittee Meeting, Huntsville, AL, USA, 5–9 December 2011. (M11-1244). [Google Scholar]
  41. Arndt, T.; Dreyer, M.; Behruzi, P.; Winter, M.; vanForeest, A. Cryogenic sloshing tests in a pressurized cylindrical reservoir. In Proceedings of the 45th AIAA/ASME/SAE/ASEE Joint Propulsion Conference & Exhibit, Denver, Colorado, 2–5 August 2009; p. 4860. [Google Scholar]
  42. Lacapere, J.; Vielle, B.; Legrand, B. Experimental and numerical results of sloshing with cryogenic fluids. Prog. Propuls. Phys. 2009, 1, 267–278. [Google Scholar]
  43. Moran, M.E.; McNelis, N.B.; Kudlac, M.T.; Haberbusch, M.S.; Satornino, G.A. Experimental results of hydrogen slosh in a 62 cubic foot (1750 liter) tank. In Proceedings of the Joint Propulsion Conference, Indianapolis, IN, USA, 27–29 June 1994. (E-8916). [Google Scholar]
  44. Berglund, M.D.; Bassett, C.E.; Kelso, J.M.; Mishic, J.; Schrage, D. The Boeing Delta IV launch vehicle—Pulse-settling approach for second-stage hydrogen propellant management. Acta Astronaut. 2007, 61, 416–424. [Google Scholar] [CrossRef]
  45. Sherif, S.A.; Zeytinoglu, N.; Veziroǧlu, T.N. Liquid hydrogen: Potential, problems, and a proposed research program. Int. J. Hydrogen Energy 1997, 22, 683–688. [Google Scholar] [CrossRef]
  46. Chung, S.M.; Jeon, G.M.; Park, J.C. Numerical approach to analyze fluid flow in a type C tank for liquefied hydrogen carrier (part 1: Sloshing flow). Int. J. Hydrogen Energy 2022, 47, 5609–5626. [Google Scholar] [CrossRef]
  47. Liu, R. Influence of Liquid Sloshiness on Vibration Characteristics of Truck-Mounted LNG Gas Tanks and Its Measures; Dalian University of Technology: Dalian, China, 2020. [Google Scholar] [CrossRef]
  48. Zhang, H.T. Numerical Study on Nonlinear Slosh of Liquid and Its Application in Tank Vehicle; Southeast University: Nanjing, China, 2016. [Google Scholar]
  49. Himeno, T.; Ohashi, A.; Anii, K.; Daichi, H.; Sakuma, Y.; Watanabe, T.; Inoue, C.; Umemura, Y.; Negishi, H.; Nonaka, S. Investigation on phase change and pressure drop enhanced by violent sloshing of cryogenic fluid. In Proceedings of the 2018 Joint Propulsion Conference, Cincinnati, OH, USA, 9–11 July 2018; p. 4755. [Google Scholar]
  50. Xu, H.Y.; Yang, N.X.; Liang, L.; Liu, R.; Fan, H.G.; Liu, P.Q. Comparison of Numerical Analysis Methods for Liquid Slosh in Vehicle LNG Tanks. Press. Vessel 2021, 38, 44–52. [Google Scholar]
  51. Liu, Z.; Feng, Y.Y.; Li, Y.Z. Dynamic response of slosh at free interface of Cryogenic liquid oxygen tank. J. Eng. Phys. 2020, 41, 1087–1094. [Google Scholar]
  52. Liu, D.Y. Dynamic Characteristics Analysis of Truck-Mounted LNG Tanks; Lanzhou University of Technology: Lanzhou, China, 2016. [Google Scholar]
  53. Zhang, E.; Zhu, W.; Wang, L. Influencing analysis of different baffle factors on oil liquid sloshing in automobile fuel tank. Proc. Inst. Mech. Eng. Part D J. Automob. Eng. 2020, 234, 3180–3193. [Google Scholar] [CrossRef]
  54. Zhao, G.Y.; Chen, S.P.; Xie, G.F. Effect of slosh on Heat Transfer and Pressure Drop of Liquid Hydrogen Tank. Cryog. Supercond. 2020, 48, 30–36. [Google Scholar] [CrossRef]
  55. Himeno, T.; Sugimori, D.; Ishikawa, K.; Umemura, Y.; Uzawa, S.; Inoue, C.; Watanabe, T.; Nonaka, S.; Naruo, Y.; Inatani, Y.; et al. Heat exchange and pressure drop enhanced by sloshing. In Proceedings of the 47th AIAA/ASME/SAE/ASEE Joint Propulsion Conference & Exhibit, San Diego, CA, USA, 31 July–3 August 2011; p. 5682. [Google Scholar]
Figure 1. Geometric structure (a) and mesh scheme (b) of the vehicle tank.
Energies 16 01851 g001
Figure 2. Pressure changes in self-pressurization case with different grid schemes.
Energies 16 01851 g002
Figure 3. Pressure variations for sloshing case with different phase change coefficients.
Energies 16 01851 g003
Figure 4. Comparison between simulation and experiment results of gas–liquid phase distribution.
Energies 16 01851 g004
Figure 5. Comparison and relative error between simulation and experiment results of vapor pressure.
Energies 16 01851 g005
Figure 6. Phase distribution within liquid hydrogen tank.
Energies 16 01851 g006
Figure 7. Temperature field distribution within liquid hydrogen tank.
Energies 16 01851 g007
Figure 8. Velocity field distribution and streamline change in sloshing process.
Energies 16 01851 g008
Figure 9. Pressure field distribution within liquid hydrogen tank.
Energies 16 01851 g009
Figure 10. Comparison of dynamic parameters under different acceleration magnitudes.
Energies 16 01851 g010
Figure 11. Comparison of thermal parameters under different acceleration magnitudes.
Energies 16 01851 g011
Figure 12. Comparison of phase distributions under different acceleration magnitudes.
Energies 16 01851 g012
Figure 13. Comparison of temperature field distributions under different acceleration magnitudes.
Energies 16 01851 g013
Figure 14. Comparison of velocity field distributions and streamline changes under different acceleration magnitudes.
Energies 16 01851 g014
Figure 15. Comparison of dynamic parameters under different acceleration durations.
Energies 16 01851 g015
Figure 16. Comparison of thermal parameters under different acceleration durations.
Energies 16 01851 g016
Figure 17. Comparison of phase distributions under different acceleration durations.
Energies 16 01851 g017
Figure 18. Comparison of temperature field distributions under different acceleration durations.
Energies 16 01851 g018
Figure 19. Comparison of velocity field distributions and streamline changes under different acceleration durations.
Energies 16 01851 g019
Table 1. Experimental conditions.
FluidInitial Liquid LevelInitial PressureInitial TemperatureAττe
(Gas/Liquid)
Liquid hydrogen–Hydrogen143 mm0.31 MPa38 K/22 K0.5 g0.56 s0.448 s
Disclaimer/Publisher’s Note: The statements, opinions and data contained in all publications are solely those of the individual author(s) and contributor(s) and not of MDPI and/or the editor(s). MDPI and/or the editor(s) disclaim responsibility for any injury to people or property resulting from any ideas, methods, instructions or products referred to in the content.

