Article

Ammonia Production as Alternative Energy for the Baltic Sea Region

by
Gunnar Prause
1,2,*,
Eunice O. Olaniyi
3 and
Wolfgang Gerstlberger
1
1
School of Business and Governance, Tallinn University of Technology, Akadeemia tee 3, 12618 Tallinn, Estonia
2
Wismar Business School, Wismar University, Philipp-Müller-Str. 14, 23966 Wismar, Germany
3
Department of Geography and Geology, University of Turku, 20014 Turku, Finland
*
Author to whom correspondence should be addressed.
Energies 2023, 16(4), 1831; https://doi.org/10.3390/en16041831
Submission received: 16 January 2023 / Revised: 6 February 2023 / Accepted: 10 February 2023 / Published: 12 February 2023

Abstract

:
One of the consequences of the conflict in Ukraine relates to the growing shortfall in global ammonia production. There are additional negative global impacts on the availability of fertilizers and prices of ammonia (NH3). The shortage in ammonia production does not only influence the agroindustry but also the global shipping industry, as ammonia is positioned as a promising zero-carbon fuel and as a storage and transport medium for hydrogen. There are plans underway to start ammonia production in Estonia to minimize the consequences of the import stop of Russian ammonia in the context of the Ukrainian crisis. This study investigated the Baltic Sea Region (BSR) ammonia market and analyzed the economic implications of building an ammonia plant within the BSR. Using fuzzy real options models as the conceptual framework, together with secondary data analysis, case studies and expert interviews, the authors chart possible courses for the construction of ammonia production facilities within the region. Based on the case of the NH3 production plant, as well as the underlying distribution system, the study provides new economic perspectives for lower carbonization for the shipping industry, an attempt at creating a model for other European regions toward climate change mitigation.

1. Introduction

Until the end of 2021, the Russian Federation was the second largest ammonia (NH3) producer worldwide, with an annual production volume of 16 million metric tons (Mt), of which about a quarter went to export [1]. About half of the Russian NH3 export volume was handled via the Baltic ports (i.e., the volume of about two million/Mt of ammonia was majorly handled via the ports of Sillamäe in Estonia and Ventspils in Latvia). In the case of the Sillamäe Port, Russian ammonia was delivered through a pipeline from Russia, supplying up to about 1.4 million Mt of ammonia annually [2]. Furthermore, the Port of Sillamäe is equipped with ammonia storage tanks that serve as ammonia terminals in the harbor [3]. However, after the start of the conflict in Ukraine, the European Union enforced strong trade sanctions against Russia, which put an end to the ammonia exports via Baltic ports and consequently led to gaps in the ammonia supply. Consequently, the ammonia supply gaps worsened after the reduction of its production in European plants due to high oil and gas prices. Thus, ammonia prices increased from a previous range of USD 200–400 per Mt seen between 2017 and 2020 to USD 1300 by the summer of 2022 [4].
This situation provoked consideration from Eastern Europe, particularly Estonia, to construct an ammonia production plant in Eastern Estonia, aiming at a prospering regional development strategy [5]. The plan is to find a reasonable economic use for oil shale and to utilize the existing ammonia infrastructure in the region, especially in the Port of Sillamäe located in the northeastern parts of the country (Ida-Virumaa County).
The NH3 issue touches the maritime sector since the most frequently discussed future marine fuels are electricity, hydrogen (H2), and ammonia (NH3) [6]. Among the three, NH3 seems to enjoy a vanguard position as a future bunker fuel. According to Gerlitz et al. [3], ammonia is the most cost-effective carbon-free fuel when the properties and potentials of the earlier-mentioned fuels are compared. For instance, the physical properties and economic, technological, and social factors appear to be superior to those of other fuels (DNV-GL 2020) [7]. Furthermore, ammonia is easier to handle and distribute if the infrastructure is in place, because it has a higher volumetric energy density and would result in cheaper costs per unit of stored energy [8].
For the shipping industry, this is a welcoming development, as one of the long-term objectives of the International Maritime Organization (IMO) on GHG emissions’ reduction seeks to increase the supply of non-fossil fuel by 2050 (as also supported by the EU 2019 climate and transport policy) [9]. This reduction of GHG emissions in shipping also means long-term total independence of the Baltic States from Russian oil. Before investing in the construction of an ammonia plant, a detailed investment appraisal would need to be undertaken that should include the infrastructural, technical, logistics, operations, environmental, and economic aspects [10].
Given the above discussions, the objectives of this paper are to develop a fuzzy real options approach to first explore the value of multiple options available for the ammonia plant investment and its production facilities in the Baltic Sea Region (BSR) and then to evaluate the Baltic Sea ammonia markets with an enlarged focus on the economic aspects. Given the objectives, the research seeks to answer the following questions: What are the economic implications of building an ammonia plant and its infrastructure in the BSR (RQ1)? How do we value the probable options available for strategic investment (RQ2)? Finally, to what extent would the future ammonia demand in the maritime sector impact investment plans (RQ3)?
The financial analysis of this non-fossil-fuel plant uses the fuzzy real options model to estimate uncertain intervals for the costs of the ammonia plant. The authors use the fuzzy real options to correct the shortcomings of traditional appraisal methods. Usually, investment assessment involves classical capital budgeting based on NPV (net present value) and DCF (discounted cash flow), where project valuation assumes an immediate project start and a continuous operation when there are predictable cash flows until the end of the investment lifetime [11]. However, these methods are not adequate in the case of investments of a magnitude typical of oil and gas production investment such as the ammonia plant, because changes in discount rates or changes in market conditions may jeopardize the estimations of the underlying investment value [12]. Flexible evaluation approaches such as the options given provide fitting choices, especially when the economic life of such a plant ranges up to 15 years [13]. Moreover, managerial flexibilities must be included in the assessment of an investment with high value in an uncertain or volatile market [14,15] such as the oil and maritime markets.
Concentrating on both technological and market uncertainties, the authors took into consideration an incremental continuous strategy, the radical changing strategy, and the explorative pilot strategy, as elucidated by Carlsson et al. [16], effectively plan and coordinate the demand for ammonia and its supply as a bunker fuel. Since the exact values of the ammonia plant under consideration are not specified with clarity yet, the fuzzy real options model, which has been successfully applied to several investments in natural resources and long-term high-volume investment, i.e., [17,18,19,20,21], is employed.
The fuzzy real options are ideal because this approach to project evaluation improves the inadequacies of traditional appraisal methods such as capital budgeting (i.e., rate of return, payback period, net present value, and profitability index) [22].
The authors estimated the investment sum, as well as the future cash flows by trapezoidal fuzzy numbers based on technical data from various legal European reports and complemented them with data from expert interviews and case studies. By doing so, fuzzy real options analysis offers new insights into the value of investments that are discussed in the context of the current literature.
The foundation of real options for this study is the idea that there is an underlying source of uncertainty for the future project, such as the cost of goods, the results of a study, etc., and that the real option estimation assesses investments and flexible decision-making through option evaluation simulations. This method is valuable for managerial strategy and proves that an investment could still have a better value in an unstable or uncertain market if the investment decision is flexible. Uncertainty in the study is used in place of risk in portfolio selection because it is complicated to estimate cash flow alongside quality, as both of them have different criteria for merit and can be conflicting. While the former is linked to profitability, the latter is connected to productivity. This complicated relationship between cash flow and quality is what managerial flexibility solves.
The remaining parts of the work are organized in the following manner: The next section is a reviewed summary of the maritime industry’s responses to emissions, the current state of ammonia production in the BSR, and the importance of fuzzy option selection in future projects. This is followed by a detailed account of the methods used in Section 3. Section 4 highlights the study results and the implications. The authors conclude the study in the last section.

2. Background

2.1. Ammonia Production in a Global Scope

Ammonia is an inorganic compound of nitrogen (N2) and hydrogen (H2) that forms the formula NH3. The result is a colorless gas with a distinct pungent smell, and there are numerous large-scale ammonia plants worldwide [23]. China is the leading producer, producing about 32% of the total world’s total NH3 production, followed by Russia, with about 9%. India produces about 7.5% of the world’s total volume, and the USA produces about 7%. The produced annual volume of ammonia was above 150 million/Mt in 2021 [24]. Until 2020, the price for ammonia ranged between 200 and 400 USD/Mt, but the situation changed dramatically in 2022 when the prices went up to 1300 USD/Mt as a result of the rise in natural gas prices that builds the base of fossil fuel for ammonia production [23].
The NH3 price increase provoked a reduction of NH3 production volume in the European Union that further led to its supply shortage in 2021 [2]. The situation worsened when the export volume of Russian ammonia was reduced due to the conflict in Ukraine. Before the conflict, Russia could export about 30% (4.4. million) of its annual 16 million Mt of NH3 production [1]. Sadly, this NH3 volume is currently missing in the international markets. Beyond this, the critical challenge of ammonia production lies in making sure ammonia is produced as a green and GHG-emissions-free fuel [24]. This is because, during the classical Haber–Bosch process that produces ammonia, the synthesis of NH3 generates 2 Mt of CO2 per ton of ammonia. Ammonia in this form is called “brown ammonia” because of the fossil energy used for its processing. About 2% of all annual fossil fuel emissions of about 400 million Mt of CO2 is linked to brown ammonia [25].
When it comes to green ammonia, its production starts from using renewable energy (e.g., wind energy) for the production of H2 by electrolysis, followed by capturing nitrogen from the air so that the full ammonia synthesis process is realized without GHG emissions. If this process successfully replaces the old production on a large scale, it becomes a big climatic win for the energy and maritime industries. Already, the International Energy Agency (IEA) [26] (p. 294) predicts that, although fuels produced from green H2 are biofuels and are more expensive, by 2040, the price of electrolysis technology will become low enough for ammonia to compete strongly with other liquid biofuels. If this is so, the production technology must become market-matured, as the oil production industry expects the first zero-emission ships to reach the sea by 2030 [27] (p. 6).
So far, around 120 ports globally have ammonia trading capabilities, and six of them are situated in the BSR [3], thus creating an urgency for an integrated and agile supply chain for ammonia. Although it is encouraging that there is already up to 196 million Mt of produced ammonia in the world today, there remain production capacities for up to 230 million Mt, mostly used for fertilizers (70% or 130 million Mt) around the world [25]. This reflects a critical production base requisite in supply chains, infrastructure, and skills to handle ammonia’s production and distribution.

2.2. Shipping Sustainability and the Quest for Emissions-Free Bunker Fuel

A strategic goal of the IMO is to cut GHG emissions, particularly CO2 emissions, by 50% by the year 2050 [21]. Sys [28] explains that to avoid the cost of investment delay and possible financial trap for shipowners and fuel producers, it is imperative to solve the huge sub-optimal compliance investment challenge on emission regulations, devise a strategy to minimize loss and maximize the ensuing profit within the industry. Evidence from the study of Psaraftis [29] indicates that most available studies on emissions, engine efficiency measures and other possible market-based measures for GHGs mostly centred on the short-term plan of the IMO that only include monitoring, reporting, verification (MRV) of emissions from shipping activities and abatement technologies.
Unfortunately, there are still no clear-cut long-term strategies or sustainable measures to tackle most shipping emissions challenges. What the industry has witnessed to date has been suboptimal technological and operational solutions that have only added economic deadlock. Most technological compliance measures taken up have been very expensive and had involved high cyclicality and capital utilization that may have gone to waste [21]. For example, shipowners who decided to install the scrubber to comply with the SECA regulations experienced additional fuel consumption resulting in further CO2 emissions that partly cancelled out the original intention of emissions reductions [15]. For those ships, the scrubber cannot reduce the CO2 emissions and necessitate the need for another supplementary abatement device for energy efficiency [13].
Many studies have attempted to solve the emission compliance costs challenge by suggesting various project evaluation methods so that shipowners can make informed investment decisions. For instance, Schinas and Stefanakos [30] proposed stochastic programming; Jiang et al. [31] used cost-benefit analysis. Ren and Lützen [32] suggested the multi-criteria approach; Lindstad et al. [33] calculated the cost function of emission abatement alternatives and Atari et al. [13] used value-at-risk assessment for the scrubber installation investment. However, besides the apparent high costs of these compliance investments recorded by these studies, Psaraftis [29] argued that most of the available compliance approaches are only interim and cannot drive the industry forward.
The shipping emissions challenge is an opportunity to respond to new needs through the creation and evaluation of the new standard and futuristic rationale in the industry to create an unprecedented opportunity for industry growth [27] (p. 1). Right now, the growing usage of LNG in shipping might be seen as the start of the decarbonization process but LNG (Liquefied Natural Gas) is made of methane gas and due to the issue of methane slip from the gas engine, LNG is unable to use its emission reduction potential beyond 20% [34]. Alternatively, zero-carbon fuels such as biodiesel, liquefied biogas (LBG), and other comparable fuels are gaining attention from the market, in addition to large financial incentives and the utilization of a variety of solutions needed for long-term and decarbonization [15].
Despite the high level of its usage in the agricultural sector, the use of ammonia as maritime fuel calls for the construction of adequate NH3 infrastructure, as well as several legislative restrictions and technical solutions [3]. Several experts (see [34,35]) expect, on average, a market share of about 25% in the global marine fuel mix. Ammonia as a fuel emits no carbon, thus making it an excellent choice for clean transport that satisfies the IMO standards. Ammonia (NH3) offers good handling and storage benefits, as well as lengthy sea journeys without a considerable loss in cargo space at a fair price. Ammonia, therefore, has a tremendous potential to reduce the environmental impact of international shipping [2]. The conventional NH3 energy prices are comparable to those of Very Low Sulphur Fuel Oil (VLSFO) [36], and the NH3 supply is guaranteed on a global scale. This explains why maritime dual-fuel engines that run on VLSFO and NH3 are already in use, making maximum flexibility with low fuel costs practical as an option in the future [37].
The deployment of ammonia seems possible in inland, coastal, and short-sea shipping when it comes to environmental responsibility, sustainability-driven growth, and regional growth development [38]. Its application and further development in the BSR appear to be feasible from an environmental, economic, regulatory, safety, and technological standpoint [39]. Note that, from the perspective of the life cycle, ammonia has a great prospect as an alternative fuel if its production is on renewable energy sources that utilized green H2 synthesis [40].
The IMO emissions regulations’ compliance journey so far has been very tedious, and even though the low price of fuel since 2014 cushions some negative economic effects, especially for the shipowners, fuel remains one of the most critical focuses in the shipping industry so that the optimization of fuel consumption has become essential for environmental and economic reasons. In this regard, greenhouse gas (GHG) emissions’ reduction will likely be the definitive future decision-making factor and the most feasible pathway to transforming marine transport bunkering [39]. This is why a pertinent aspect of this study boils down to the generating the economic and logistics implications of building a non-fossil-fuel plant—in particular, ammonia and its infrastructure—in the BSR to deliver accurate future projections for cost-effective outcomes [40].

2.3. Ammonia Situation in the Baltic Sea Region

Ammonia terminals along the coast of the BSR are few in number. Only a small number of port-based NH3 terminals are established in the BSR nations, making the development of the NH3 infrastructure a key concern for the broad use of NH3 as a sustainable maritime fuel [39]. Ammonia is transported by sea as liquid cargo, and currently, the most significant NH3 terminals are located in Sillamäe (EE), Ventspils (LV), and Police (PL); however, none of these ports is utilized for marine fuel bunkering [41].
The Port of Sillamäe is located in Ida-Virumaa County in Eastern Estonia. Ida-Viru County is an area in Estonia with a population of 143,000 (2017); it is an oil shale-producing region [5]. The country is famous for its oil shale reserves, and the Estonian oil shale industry, second only to the USA, represents up to 5% of the national economy, and plays a significant role in a weakly developed region that shares a common border with Russia and hosts the majority of Russian-speaking Estonians [42]. As the oil shale industry plays a crucial role in the county’s economic well-being, it further contributes significantly to Estonia’s energy production and is a base for the country’s chemical industry. Estonia is the least energy-importation-dependent country in Europe (10.6%) due to shale oil production but also represents the most carbonized economy in European Union due to shale oil production [43]. Decarbonization effort is a high priority in Estonian regional-development plans and new concepts for a green transition of Eastern Estonia are often discussed [5].
Ida-Viru County was also an important region in the Estonian ammonia business sector until February 2022. A 2022 Report from Kotenjova [44] showed that, between 2016 and 2021, Sillamäe Port employed a container terminal for continuous container shipments. This recent initiative promoted the development of the port and the creation of new terminals. Consequently, the share of local producers increased to 25% of the total exported goods. The Kotenjova report also showed that in 2017, a two-level intersection of the Tallinn highway and the port railway was completed. The turnover of goods considerably fluctuated during this time between EUR 4,251,026 (Quarter 1 of 2016) and EUR 10,223,800 (Quarter 1 of 2021).
Until 2022, the region had played the role of an export hub for Russian-produced ammonia since the Port of Sillamäe was connected with a pipeline for ammonia transport from Russia to the port, and the port is equipped with an ammonia terminal and storing facilities [3]. This business opportunity collapsed at the start of the conflict in Ukraine, and the NH3 facilities remain unused. The environmental regulations and decarbonization efforts of the European Union have further threatened the socioeconomic stability of this county [45]. Hence, one important regional development path for Ida-Virumaa County would be to use oil shale for the production of ammonia in the local plant and then seaborne export the produced ammonia via the Sillamäe Port terminal.
By 2050, the market share of ammonia as a marine fuel is expected to reach about 25% (2.9 million Mt) of the current 1.25 million Mt of BSR marine fuel capacity. Considering the energy equivalent of NH3 and MGO in Mt, an increasing market share of NH3 within the upcoming 25 years will lead to a linear annual growth of marine NH3 demand of 1% per year or 115 Mt per year calculated [2]. This implies that, between 2025 and 2050, the maritime sector in BSR would drive the ammonia demand by more than 100,000 additional Mt per year. This short reflection reveals that the additional demand for ammonia from the maritime sector in BSR expected in 2050 exceeds the former exported NH3 volume via Baltic ports from Russia (1.9 million Mt only in 2021). Note that this result is achieved by considering only the maritime NH3 demand for combustion purposes without taking into account other uses of NH3 as H2-transport media, as well as additional demands from the outside shipping sector [10].
Therefore, together with the oil shale, the ammonia industry dominates the national energy and chemical industry in Estonia. Here, one tentative measure to reduce the CO2 emissions and decarbonize the national economy, as explained by Kent et al. [46], is to bind the CO2 emissions during urea production. In such a case, up to about 1 million Mt of CO2 production is bonded annually. As one ton of urea requires 0.58 Mt of ammonia and 0.76 Mt of CO2, an additional NH3 demand might be spurred in future production.

2.4. Real Options, Fuzzy Logic, and Investment Decision-Making

Taking on an investment, especially one as large as a production plant, does not necessarily translate into the best returns because it is difficult to separate the best financial returns and the associated risk exposure [47]. Investments are usually long-term and are carefully chosen to enable diversification into a broad variety of assets (portfolios) and further adjustment to match the company’s strategic aims and objectives [48]. Usually, over a period, goals change to match the volatility of the environment [16]. For example, new technologies witnessed in the maritime industry because of emission-reduction efforts represent unprecedented, new, and great variables for investments and market views.
In a project evaluation, the traditional discounted cash flow (DCF) approach implicitly presumes that once a project starts, it runs continuously until the end of its projected useful life [14]. The evaluation foresees no possibility of postponing or cancelling the project if market conditions deteriorate or change but uses positive NPVs to declare independent investment possibilities [11]. This traditional budgeting method may undervalue projects and mislead decision-makers because they only consider the current predictable cash flows, disregard possible future flexibility, and may also use higher discount rates of project cash flows for trade-offs or compensation for high-risk investment projects [49]. Higher discount rates, however, can cause project value underestimation and project rejection [48].
When it comes to option valuations, savings represent future cash-flow parameters and the cash flows for each period in the traditional methods. In actuality, the NPV of the investment project only determines the present value of the underlying asset. The exercising value, on the other hand, is an additional cost incurred to execute the embedded option [14].
The options selection method focuses on selecting optimal portfolios as opposed to optimal assets to minimize the risk of a given level of expected return. To understand the properties of multiple portfolios, the average figures of highly correlated outcomes from these portfolios are assessed for logical consequences of options obtained from the information on the intended investments [47]. The decision-makers consequently assess and adjust the risks by reviewing the company’s tolerance for volatility. The option to start, abandon, or defer a project is made after using available information to judge or predict the cash flow for the newly considered project [49]. These are real management decisions that connect available assets to a future investment or project. In a normal setting, where options’ generation is for strategic purposes, the option to start or abort a project is executed without probing for further options [14]. If the project requires flexible output, then the project can make use of the “incremental continuation or strategy of radical change” suggested by Carlsson et al. [16] where the project takes advantage of possible innovation and technologies to succeed. Detailed derivatives and valuations of the NPV, capital budgeting, and real options are in Ho and Liao, Atari et al., and Olaniyi and Prause [12,13,21].
According to Collan et al. [47], several options offer more value than a single option, as well as greater flexibility. The value of several options, however, does not always equal the sum of the values of the individual options. Due to the nonlinear process in the valuation model and the trade-off between the two options through the hedging process, the value does not increase linearly.
In fuzzy sets, however, a class of objects in a range of gradation numbers are arranged at intervals, using future cash-flow projections, to which human reasoning is particularly adapted. This number set determines the accuracy that exists in human decision-making [50]. Therefore, beyond using the probability of call options to treat uncertainties for future projects or investments, the fuzzy logic and sets offer a viable foundation to handle all hazy knowledge brought by ambiguity or imprecision [51].
In investment application, the fuzzy theory was first introduced when Buckley [17] used fuzzy sets to develop future value, present value, and internal rate of return. Carlsson and Fullér [18] went further to apply the internal rate of return to evaluate investments and later used the fuzzy cash flow instead of capital budgeting for a case investment in Carlsson and Fullér [19]. Olaniyi and Prause [21] used the fuzzy cash flow for the first time to evaluate the waste-heat recovery systems’ investment in ship engines, a situation that focuses on ships’ engine efficiency. Despite these studies, the fuzzy sets and real options remain unexplored approaches in industrial production and shipping industries.
To quantify arbitrary fuzzy observations or estimations, fuzzy set theory employs fuzzy numbers that are consistent with the estimation of future cash flows and discount rates, which often involve estimated speculations, usually from estimated numbers [17]. Trapezoidal and triangular fuzzy numbers are most used in real-world applications and are employed because they enable numerous operations that are easily interpreted by intuition [20]. In the case of this study, where the costs of the intended plant can be generated, a fixed value for the investment costs (i.e., CAPEX) is used—assuming a range of NPV can reach a trapezoid function with the base points.
Although predictions of the future are not foolproof, a fuzzy set becomes a group of elements without discrimination between two sets of full members or non-full members [47]. Using the formula from Zadeh’s [52] theory that permits the consideration of virtual decisions in an uncertain environment, Collan et al. [47] drew up a fuzzy subset, A, a nonempty X that represents a range of values at [0, 1] intervals. Note that the fuzzy subset, Subset A (membership), of a nonempty X set is the set of ordered pairs where the entire first element is from X and the second element is from the interval of [0, 1] of X. One ordered pair represents each element of X and establishes a mapping formula between 0 and 1, as shown:
μ A :   A     0 ,   1
where 0 = complete non-membership, 1 = complete membership, and μA = membership function of A. The degree to accept that X (i.e., the universe of discourse for the fuzzy subset) is in A is by finding the set of (x, μA (x)), where A is determined by a finite-ordered sequence of elements:
A = { x ,   μ A   x   | x   X }  
To stimulate the probability distributions for an NPV future investment, the results determine the beginning or the termination of the project. In this case, the payoff distribution is condensed into a zero payoff where the real option value is assumed to be the probability-weighted average value of how the resulting payoff is distributed; that is, the real-option value is seen as the probability-weighted average of the payoff distribution. The fuzzy numbers then become the future distribution of likely investment costs, income, and all profits’ (NPV) results. This profit, i.e., positive NPV, is a fuzzy number that is said to be the payoff distribution from the project, which is the real option value of the investment [53]. Here, the weighted average value (fuzzy) becomes the value of the positive NPV result.
To calculate the Return of Value (ROV) from a fuzzy mean of the possibility distribution, all values above zero are regarded as positive (+), while values below zero are negative (−). As a result, instead of using scenarios (usually generated from past numbers, variables, trends, and future market predictions), the fuzzy payoff method makes use of fuzzy sets to replace the scenarios to generate the fuzzy NPV used as a payoff distribution for the investment. In short, it can boycott the need for different scenarios. Carlsson et al. [54] referred to this as the fuzzy net present value (FNPV). The flexibility of this method makes it useful even when information changes for future cash flow because, as the uncertainty increases, so will the width of the distribution. The decision rule for ROV remains the same even in fuzzy calculations; that is, whenever the value of NPV is greater than zero, the single number NPV will be the ROV, which is an indication for a go-ahead to invest [53]. The authors refer to this as the Fuzzy Return of Value (FROA).

3. Materials and Methods

The research methodology follows a triangulation approach based on different empirical data. A review of the literature and document review of archives, reports, and case studies were carried out to set the premise for research questions and to provide a background for the research approach. All empiric activities took place between August and November 2022.
The proposed Estonia ammonia production plant is a single study unit used to empirically test and validate the investment evaluations and risks analysis of ammonia production and distribution, according to Gillham [55], on case-study research methods.
Expert interviews were conducted face-to-face and via phone calls and based on semi-structured questionnaires that involved managers and executives actively involved in the day-to-day strategic decisions (i.e., ammonia-producing plant, shipbuilders, and port authorities). The authors conducted eight interviews around the BSR. Experts from ammonia plants provided in-depth knowledge of the parameters of ammonia fuel; energy demand; prevailing cost of electricity; and expected life span of a fuel production plant and its production processes, such as bunkering and its environmental safety routine. From the shipbuilders and port technical officials, the interviews reveal concise and benchmarked information on required energy/power consumption and port bunkering facilities, existing ammonia pipeline systems, etc. The shipowners and ship operators gave insight into energy demand and supply. The interviews also comprise questions on financial and operational issues of an ammonia plant, investment volumes (CAPEX), the operational expenses per ton of produced NH3 (OPEX), logistics, and forecasts of ammonia prices and demands, as well as financial topics comprising inflation and interest-rate developments. These data were taken into the account to feed the fuzzy Return on Assets (ROAs) model for the planned NH3 plant.
After the fuzzy ROA modeling, the authors enriched the analysis by calculating a fuzzy value at risk (FVaR) indicator based on the underlying set, A, and the related membership function, μA. The FVaR enjoys an analogous definition to the traditional value at risk, but this time in a fuzzy context [56]. The classical value at risk (VaR) represents a commonly used metric ton to determine the extent and probabilities of potential losses of a portfolio or an investment by quantifying the risk of potential losses of an investment over a specific period.
The approach for finding the fuzzy intervals for the ROA model involves taking averages over the experts’ answers. As an orientation, the authors confronted the experts with figures from the literature and document review by highlighting the results from Brown [57], who fixed the CAPEX per ton capacity of NH3 in the interval between USD 900 and USD 1200 for a plant based on natural gas by 340 days of operations per year. The OPEX per ton of produced NH3 ranges between USD 270 and USD 450 depending on the process of hydrogen (H2) production. The figures for electrolysis-based H2 production are placed on the higher edge; that is, for a green ammonia factory, CAPEX per ton capacity ranges around USD 1000–1200, and the OPEX is around USD 450 per ton, depending on the energy price.
Other energy- and business-related factors used for the assessment included the exogenous baseline of the fuel costs (benchmarking costs through the historical price of ammonia per energy content) and the environmental sustainability index (ESI), and financial and environmental cooperate governance performance indicators of sustainability-driven companies. The authors first used a descriptive analysis of the interview data, putting each statement in a grid to classify all responses. An accumulated reflective overview of the summaries of the data was made to discover how multiple sources of evidence are related. This was followed by the interpretation and narration of the data according to Yin [58].

4. Results and Discussions

For the realization of the ammonia production plant, different scenarios are used. Since oil shale is a special type of resource that is comparable to brown coal, the first impression was to include the oil shale in the production process. This inclusion is considered in two ways:
  • Use oil shale for H2 production with a reactor like in the traditional Haber–Bosch process.
  • Use the technology of electrolysis to produce H2, which requires a lot of energy.
Using oil shale for H2 production with a reactor, as seen in the classical Haber–Bosch process, is the basic processing of a coal-based ammonia plant that consists of a separate module to separate O2 and N2 from the air, the gasifier, the sour-gas-shift module, the acid-gas-removal module, and the ammonia-synthesis module (an air separation process). Oxygen from the air-separation module is fed to the gasifier to convert coal into synthesis gas (H2, CO, CO2, and CH4). There are many gasifier designs, but most gasifiers are based on fluidized beds that operate above atmospheric pressure and can utilize different coal feeds.
Note again that the ammonia (NH3) production process is based on coal that is widely used in large producing countries, such as China, Russia, and India. Since oil shale is chemically comparable to brown coal, the ammonia process for the proposed NH3 plant should be compared to the technical and economic process parameters of the Chinese and Russian values. However, the disadvantage of the coal-based hydrogen (H2) approach is the emission of CO2 and the production of brown ammonia, which implies that the later use of NH3 as a carbon-free fuel is ruined by carbon emissions during the production process.
The authors therefore recommend and put forward the technology of electrolysis to produce H2 for the production of green ammonia even though it requires very significant amounts of energy. Fortunately, the oil shale infrastructure of the proposed plant has enough capacity to produce the needed electrical energy, i.e., the process of burning oil shale in the existing electrical plant. This process is not CO2 emissions-free either but remains better, as later shown, when compared to producing H2 with a Haber–Bosch-process-like reactor. Based on this, the authors decided to focus on the production of H2 through electrolysis.

4.1. Technical and Economical Preliminaries of NH3 Production

To address RQ1—what are the economic implications of building an ammonia plant and its infrastructure in the BSR?—the authors evaluated the technical and economical preliminaries of ammonia production.
In Kirova-Yordanova’s work [59], the author precisely delineates the limits of energy demands for ammonia synthesis, where the baseline for the energy demand for ammonia production is about 27 GJ per ton of NH3. This is equal to 7.5 MWh per Mt of NH3 produced. However, a study from Fermi Energia [60] estimates the needed energy consumption to be slightly higher, with 100 MWh of electricity for 9 Mt of ammonia. Further important techno-economic data of the Estonian oil shale industry are as follows:
  • 1 Mt of oil shale produces 850 kWh of electricity with a cost level of about 130 EUR/MWh that includes CO2 emissions taxes.
  • 1.5 kg of oil shale produces 1 kWh of electricity.
  • CO2 emissions of Estonian oil shale electricity production is 1600 kg CO2/MWh [61].
Answers from experts’ interviews, however, revealed that even with the rapidly rising price level of CO2, electricity can still be obtained in Estonian oil shale plants at 120–140 EUR/MWh. However, since Estonia is part of the Nord Pool Energy Exchange, the ongoing energy crisis since spring 2022 levelled the average electricity prices during the first 9 months of 2022, i.e., around 184 EUR/MWh. This energy-cost disparity between Estonia’s energy capacity and the Nord Pool Energy Exchange spurred policy-based debates in Estonia with a strong political inclination toward leaving the Nord Exchange and building a country-owned nuclear power plant.
Based on the above considerations, when asked about the most likely technology for the new NH3 plant in Estonia and the corresponding technological and economical parameters, the experts gave the following explanations.
Firstly, the current unused annual NH3 handling volume in Estonia, which equals around 2 million Mt of ammonia, represents the missing Russian export volume via the Baltic ports. Ammonia pipelines from Russia to the Baltic ports safeguarded the NH3 handling volume and could serve as supply infrastructure for the future NH3 terminals in the Baltic ports. Focusing only on the Port of Sillamäe with an annual handling capacity of 1.4 million Mt of NH3, the construction of new Estonian ammonia plants will open up the possibility of an annual production capacity of 1.3–1.4 million Mt that represents about 2/3 of the Russian export volume via the Baltic States. Assuming 340 working days of such an ammonia plant per year yields a daily ammonia production volume of approximately 3800 Mt per day. The distribution of such an NH3 production volume is easily handled seaborne through the Port of Sillamäe, using the existing pipeline system (easily adaptable) to link the location of the new plant. The estimated construction time for the plant is about 3 years, and the expected lifetime of the NH3 plant is 15 years.
Secondly, to make estimations for the costs of the NH3 plant in Estonia, it would be sensible to use a large-scale ammonia plant, as seen in the Gulf Coast Ammonia (GCA) plant in Texas City, which has an annual production volume of 1.3 million Mt of NH3. However, the process uses traditional methane gas to produce ammonia, which leads to brown ammonia. In the case of a country like Estonia, whose focus is green NH3 production to reduce CO2 emissions, the GCA cannot be used as a comparable case. Rather, Freeport in Texas, where Yara International and BASF Corporation (both chemical companies) built a green ammonia plant with an annual capacity of 750,000 Mt of NH3, fits this context. Another practical case would be the plant in the Coega Special Economic Zone along the Port of Ngqura in South Africa with an annual production volume of 780,000 Mt of NH3 where the investment costs (CAPEX) are about half of the CAPEX of the Texas plant. Meanwhile, the CAPEX for the Yara/BASF plant was about USD 600 million.
In the end, when it comes to the cost of the proposed NH3 plant, the authors followed the Brown’s study [56], which gave the cost estimations for NH3 plants in the USA and Nepal from experts who participated in a Delphi program. From this, the CAPEX estimation of the Estonian green ammonia plant is projected to have an annual production capacity of 750,000 Mt of ammonia based on electrolysis would cost between USD 800 million and 1000 million, which equals USD 900–1200 per annual ton capacity. The corresponding OPEX values are estimated to be about USD 450–500 per ton of NH3 due to increased energy prices.
Note that some of the study’s expert interviews took place between October 2022 and November 2022 when USD 1 equaled about EUR 1, so the actual prices were taken under account, especially the costs for electricity, which was about 130 EUR/MWh in 2021 but increased by about 40% in 2022. Therefore, if a higher OPEX value might appear in the calculation, it was already considered using the Fermi Energia [60]; the report analyzed the production of ammonia on the bases of nuclear power to costs approximately EUR 815 per ton of produced NH3.

4.2. Energetical Analysis

Consequently, instead of minimizing energy consumption, the optimization of energy becomes critical. Using the heat generated in the process of ammonia production for other on-site purposes at this point would be the best practice. Optimization also refers to the balancing of capital investment and operational costs, so the authors considered the impact of climatic conditions on energy demands. Hence, the assumed daily production volume of ammonia in the studied case plant with an annual production volume of 750,000 Mt of ammonia amounts to about 2200 Mt on the bases of 340 annual production days. Furthermore, the needed energy consumption for the annual production volume of 750,000 Mt sums up to an additional daily energy consumption of 16,500 MWh, or 16.5 GWh; that is, for the full annual production volume of 750,000 Mt of ammonia, an annual energy of about 12 TWh is needed. A comparison with the total annual Estonian electricity production ranging between 9 and 12 TWh already shows that the needed energy supply for a new NH3 plant could be challenging.
Therefore, to improve energy generation, three options were tabled for discussion. The options are the use of nuclear power; increased use of fossil fuel, especially oil shale; and, lastly, the use of wind energy. The construction of a nuclear plant in Estonia was discussed extensively, but, currently, there are no concrete plans to realize such a project. The second option that involves the use of fossil fuels for energy production would involve oil shale, which is the largest part of Estonian electricity production complemented by oil. However, strictly speaking, it also means that the needed annual energy amount of 12 TWh for the new ammonia plant corresponds to 18 million Mt of oil shale with related CO2 emissions of about 19 million Mt of CO2, which leaves the third option open.
In some of the interviews, the experts recommend that, to produce green ammonia, the use of oil shale for energy production must be replaced by a renewable energy source. Looking in this direction, wind energy remains the most promising option, since hydroelectric power, as well as photovoltaic power, is not suitable for Estonian conditions (i.e., geography and location).
A more detailed assessment of the Estonian wind-energy situation reveals that, currently, 144 wind turbines are installed with a total capacity of 320 MW and produced 730 GWh of energy in 2021 [62]. Hence, the average wind turbine has a capacity of about 2.2 MW and generates about 5 GWh annually. Full green energy production from wind farms for the new ammonia plant requires an annual energy volume of 12 TWh, which equals the installation of 2400 new turbines with the same average performance similar to those already installed. Following the Stehly and Duffy [63] calculations, the installation of such 2400 new wind turbines with a capacity of about 2.8 MW on an onshore site near the new ammonia plant would generate a CAPEX of about USD 8 billion (using an average CAPEX for each of the 2400 turbines of about USD 3.3 million).
The number of windmills can be reduced by using turbines with higher performance onshore wind farms or offshore wind parks. The use of offshore wind parks especially is linked with the possibility to use windmills with a power up to 15 MW that reduces the number of needed turbines to only 400. The cost of the electric energy from the 2400 wind turbines is comparable to the prices of brown coal or oil shale energy plants.

4.3. Fuzzy Real Option Analysis

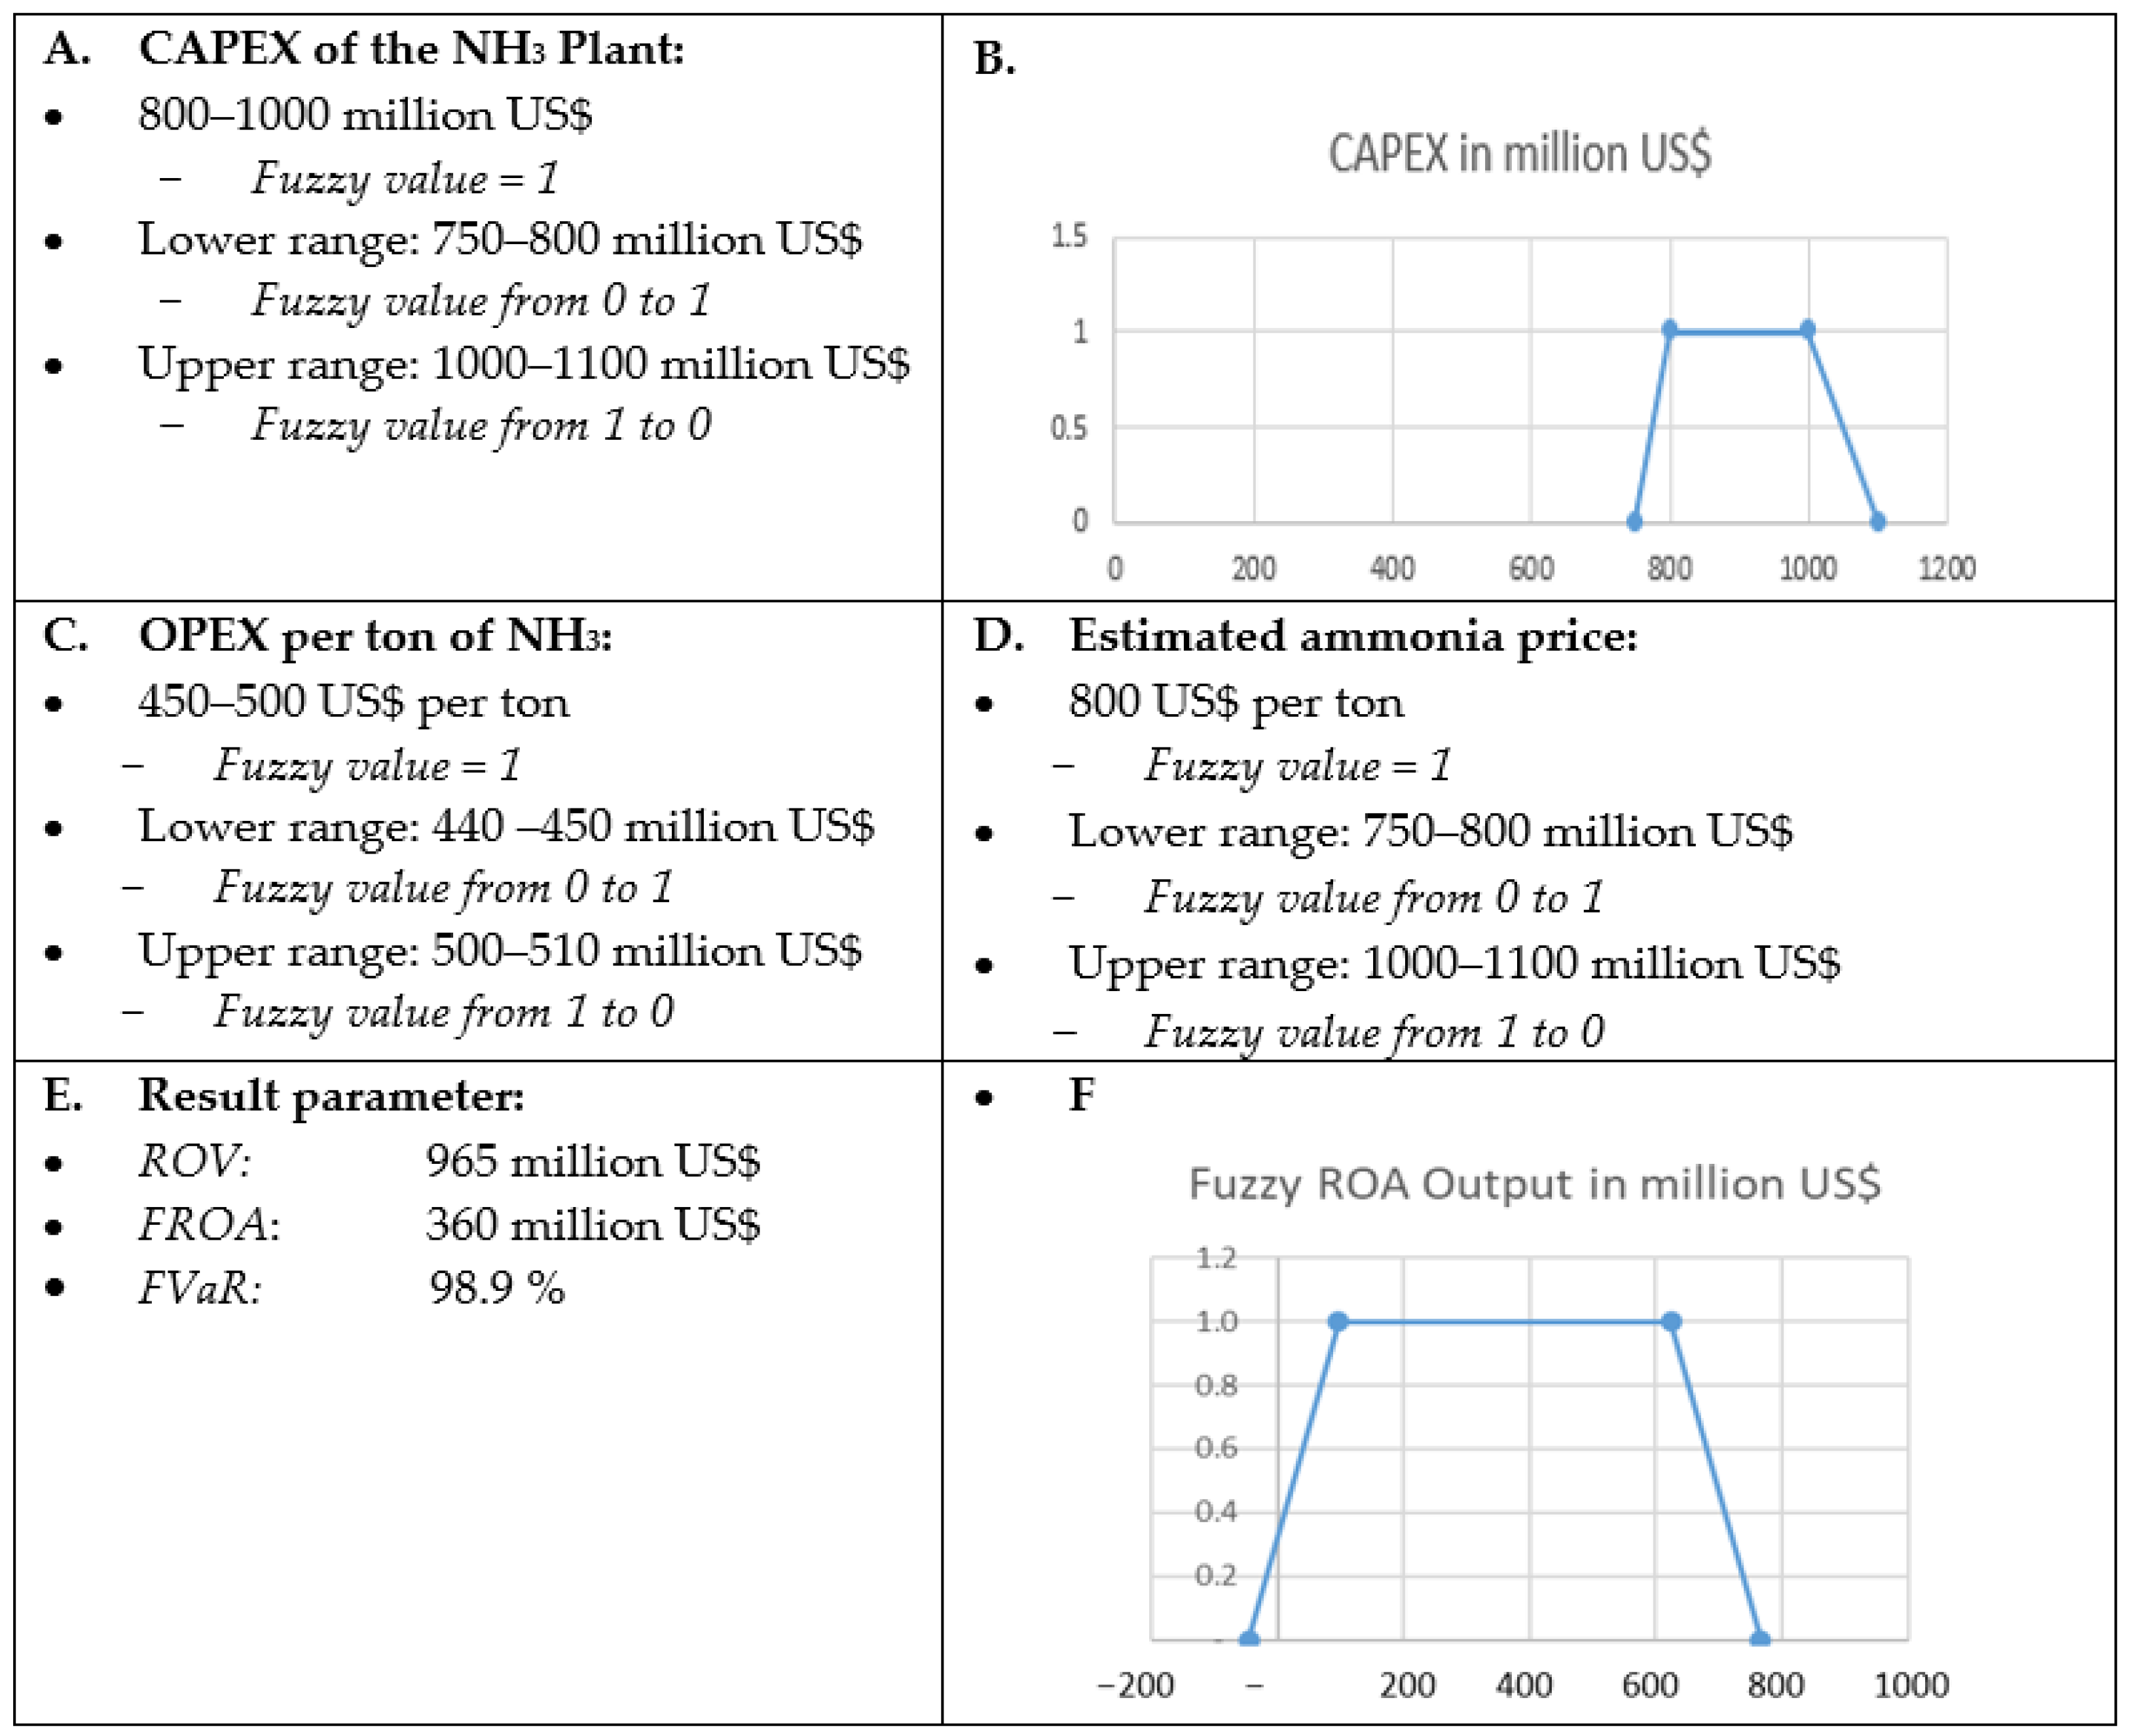
The application of a real options model helps value probable options available for strategic investment (RQ2). First, the assessment of investments requires the fixation of several parameters. The parameters for the new Estonian ammonia plant elucidated above are all elaborated in cooperation with the expert group. Here, the authors present the relevant parameter in data blocks used to calculate the indicators of the model in Table 1.
Moreover, Table 2 describes the economic parameters. This task is realized by an economic data block that includes the financial circumstances of the investment shown.
Based on the set data, the authors first calculated the investment indicators by using classical capital budgeting. As already mentioned, the study assumes an exchange rate parity between the EUR and USD in a ratio of 1:1, which was the reality in November 2022; therefore, the presented financial figures can be interpreted in Euros or USD in Table 3.
The result of this classical analysis delivers the first economic assessment of the investment plan, which currently neglects a dynamic consideration of the volatile business environment touching energy prices, the market price of ammonia, and global changes in demand and supply. Nevertheless, the result indicators of the capital budgeting approach highlight that, under current conditions, the ammonia plant investment seems to be a favorable decision, especially considering that the demand for ammonia has the prospective to grow considerably in the future, considering the importance of ammonia for decarbonization efforts.
The inability of the classical capital budgeting approach to take into account the energy price volatility can be bridged by the real options analysis or, better still, by applying the modeling and estimation of fuzzy data through the fuzzy real options analysis (FROA). The authors extracted the confidence intervals for the listed parameters already benchmarked with the literature. It is important to note that, in the assessment of the ammonia plant, the cost ranges for the CAPEX, OPEX, and market prices for ammonia should model the investment decision, as well as the upcoming years of operations of the plant. The calculations revealed the following fuzzy data shown in Figure 1.
The result parameter of the fuzzy model formula reveals the real option value (ROV) of the investment that yields USD 965 million; that is, the financial indicator for the investment is more favorable than the classical indicator. The underlying standard deviation for the NPV of the expected cash flows is 15%.
However, the uncertainty of the cost and price ranges of the input parameter of the investment leads to a trapezoidal fuzzy number that is presented on the right side of the result parameter in Figure 1B,F. Following Carlsson and Fullér [19], the fuzzy number can be described as a corresponding expectation value, which is called the result parameter for the fuzzy real options analysis (FROA) and ranges around USD 360 million (Figure 1E). This FROA value integrates the output, which is a geometrical figure.
Furthermore, the trapezoidal fuzzy number touches the 0-line, implying that, under the parameters of the fuzzy model, there is a possibility that the result of the investment might be negative. To describe the risk of a negative outcome of the investment, the authors calculate the trapezoid area that is based on an x-value greater or equal to zero and compare this part with the total surface area of the trapezoid. The corresponding parameter can be interpreted as a fuzzy value at risk (FVaR), and this value is 98.9% (Figure 1E), suggesting the possibility that the investment ends up with a negative sign is rather low.
In addition to the directly calculated FROA indicators, the authors also executed a sensitivity analysis with the future market price of ammonia since the ammonia price lays out the influence of the NH3 plant, so the high volatility of the ammonia price represents a possible risk factor. However, as long as the ammonia price stays above a threshold of USD 530 per ton, the NH3 plant will operate within a profitable zone.

4.4. Strategic Perspective of the Ammonia Plant

Finally, the study looked into various strategic perspectives of building an ammonia plant at this point and, in a particular, in the Eastern Estonia region to provide the answer to the extent to which the future ammonia demand for the maritime sector might influence the investment plans (RQ3).
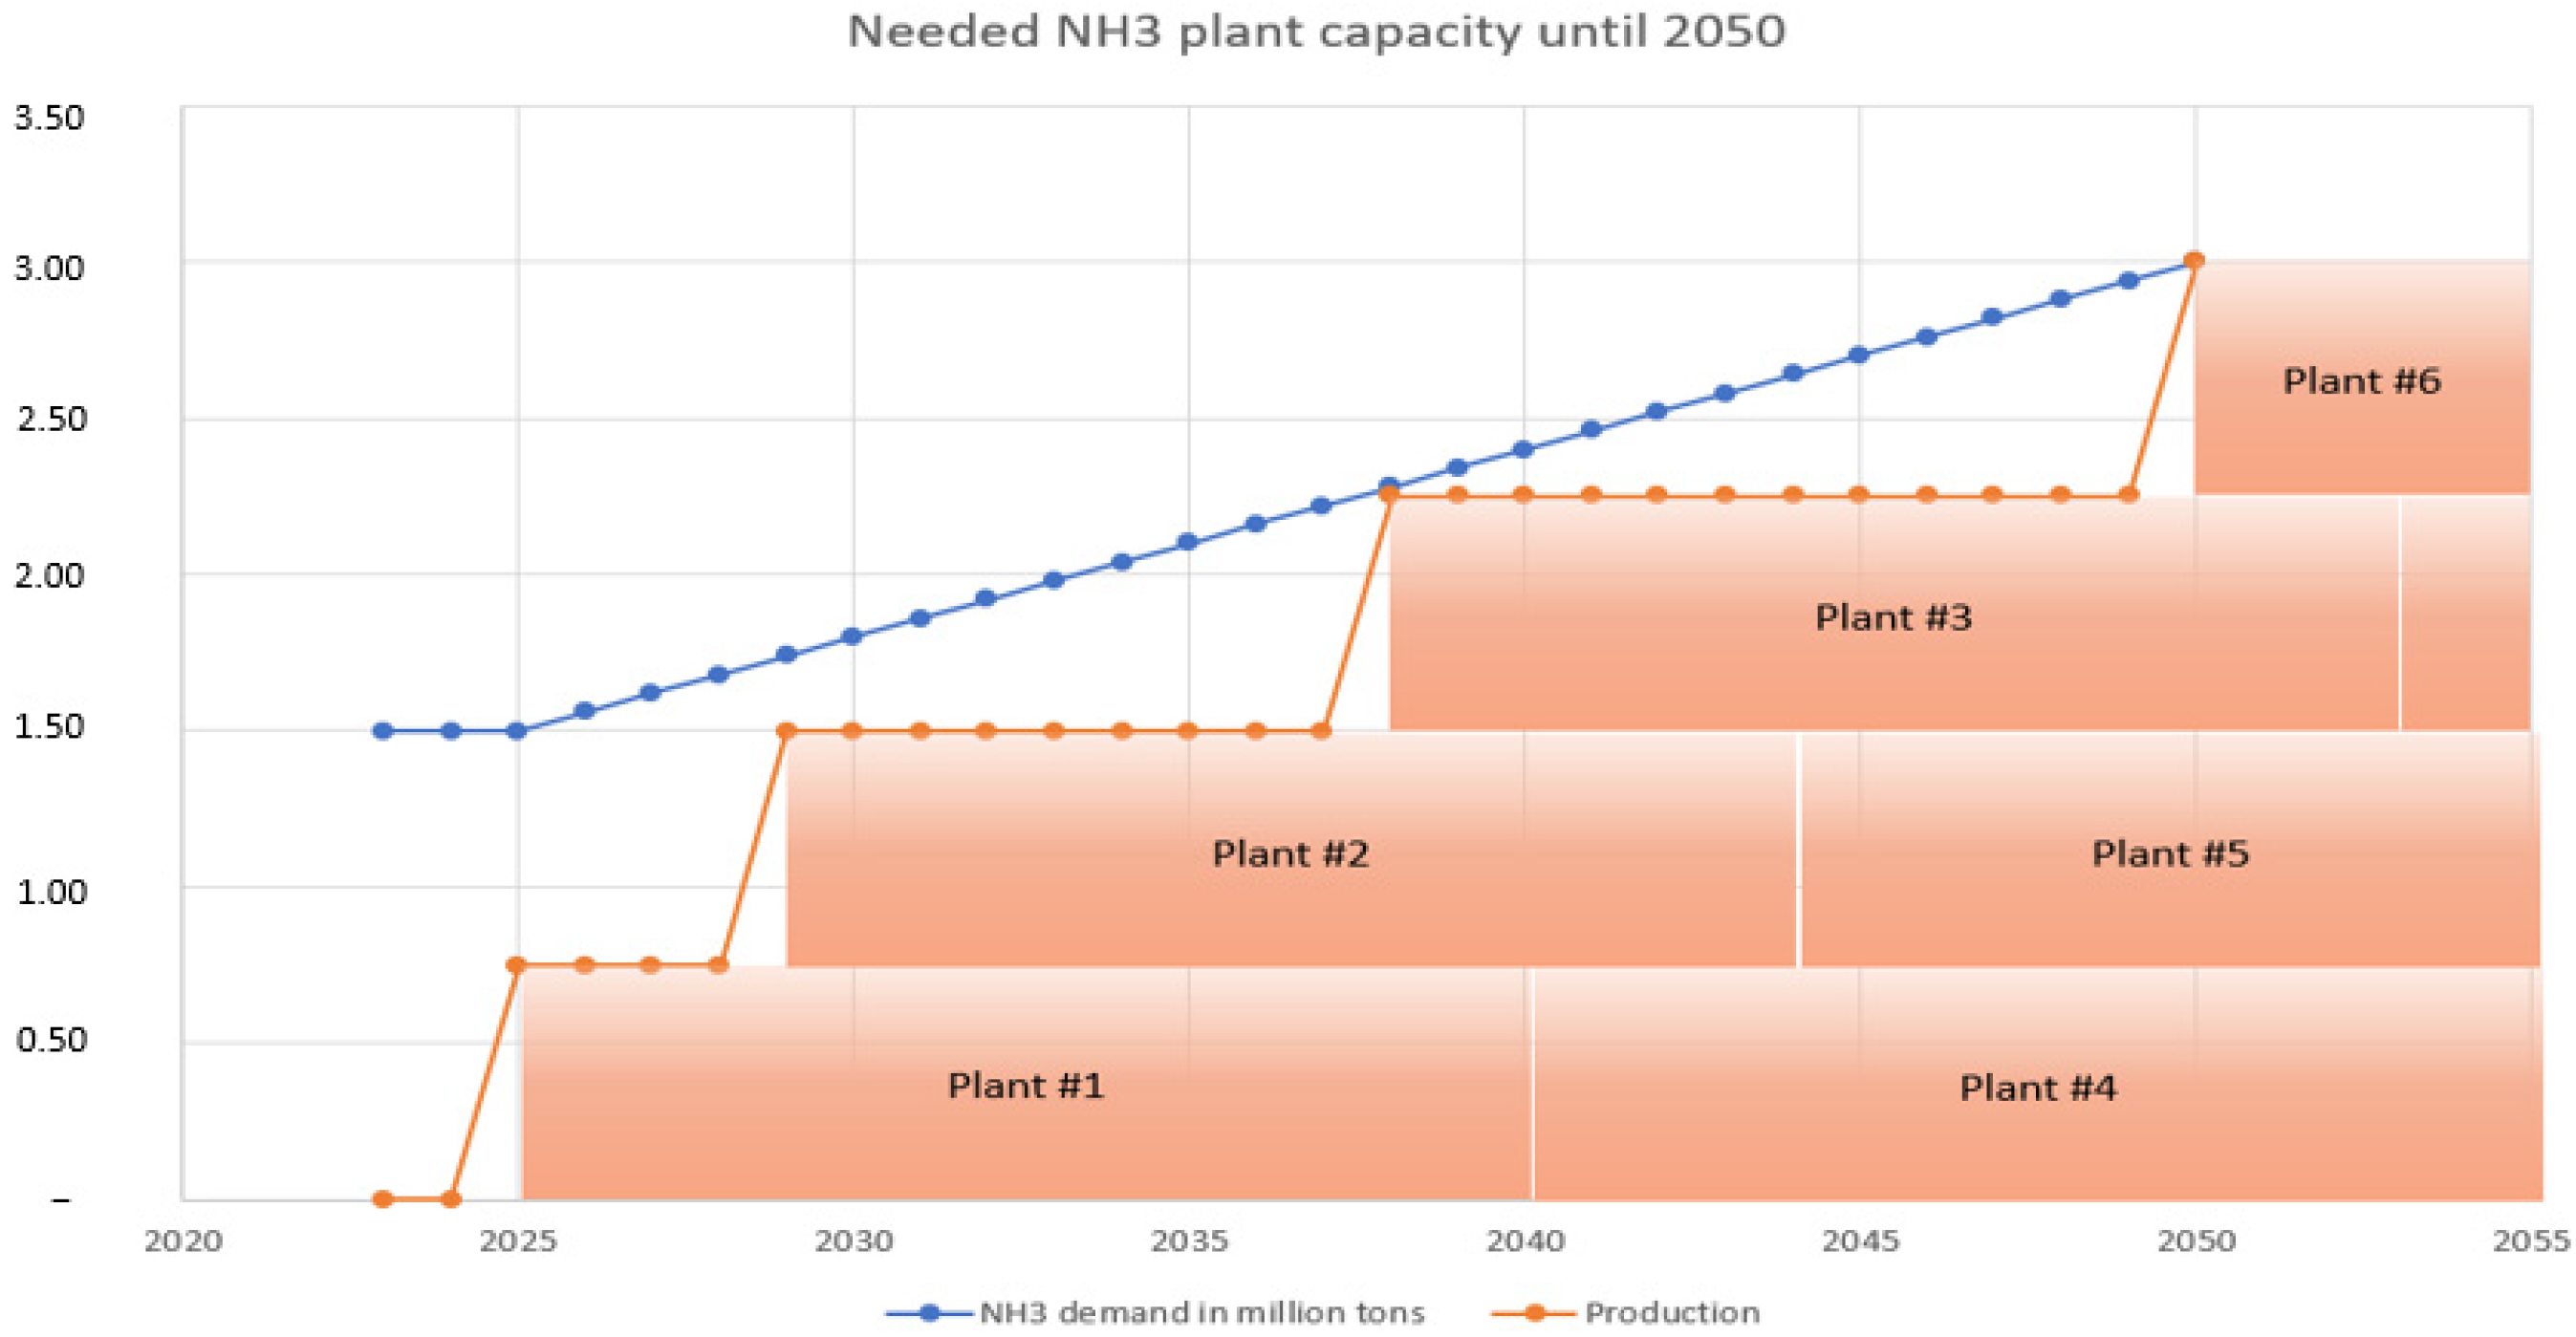
The current gap witnessed in ammonia exports through Baltic ports from the Russian exports summed up to about 1.5 million Mt of NH3 annually for Estonia. If Estonia wants to fill this gap, two ammonia production plants with an annual production capacity of 750,000 Mt are eminent. Afterward, the annual production of 1.5 million must double to 3 million Mt of NH3 yearly by 2050 due to the rising demand from the maritime sector; that is, by 2050, four ammonia production plants having an annual production volume of 750,000 Mt must operate in parallel to fulfil the expected demand. The construction of additional NH3 plants makes the growth process flexible and scalable and reduces the investment risk over the next 33 years, as shown in Figure 2. Considering that the lifetime of a production plant is limited to 15 years, the time until 2050 has to be bridged by at least six ammonia plants.
Together, six plants representing a total CAPEX of 3.6 (=6 × 600) billion Euros until 2050 is the necessary investment volume to put in place. In addition to the investment sum for the NH3 plant, wind farms can safeguard the green production process for ammonia. Stehly and Duffy [63] estimated the lifetime of a wind turbine to be 20–30 years, i.e., until 2050, so the additional investment of wind farms is necessary. The current study revealed that the investment into the production of green electricity currently reaches a financial volume that lies beyond the costs of the ammonia plants.
A final remark is the idea to construct a urea factory (usually for urea used as fertilizer, feed supplement, etc.) to bind 1 million Mt of CO2 emissions, but it requires an additional production volume of ammonia up to about 760,000 Mt annually. This implies that, for the next 25 years, an additional two NH3 plants have to be constructed to safeguard a continuous process flow. The energy for the operation of the ammonia plants, together with the urea plant, will then come from oil shale. The corresponding electricity prices will be comparable to those of wind energy. Nevertheless, further research has to be performed to describe the detailed economic differences between the considered technologies.

5. Conclusions

The study evaluated how the Baltic Sea Region is impacted heavily by ongoing global turbulences up to an annual two million Mt supply of ammonia. Estonia, in particular, was an export harbor for Russian ammonia production, and this explains the current plans to construct an ammonia production infrastructure in Eastern Estonia. The authors thus developed fuzzy real options to explore the value of multiple options available for the investment and evaluated the Baltic Sea ammonia market and the corresponding investment on ammonia production facilities in the Baltic Sea Region (BSR), with an enlarged focus on the economic aspects.
The results show that the creation of the ammonia-production capacity in Eastern Estonia is technically and economically reasonable if the focus is green ammonia production. The investigated investment model proposes a scalable ammonia production from 2025 until 2050 which reaches a production capacity of 750,000 Mt of ammonia in 2025 (one plant) up to 3 million Mt in 2050 (four plants). The time from 2025 until 2050 requires the construction of six ammonia plants, each with an annual production volume of 750,000 Mt. The costs of the investment to build the ammonia plants sum up to about USD 3.3 billion. This investment sum has to be complemented by the costs for the installation of green electricity production that can be realized by wind farms. The investment volume for the proposed green electricity production currently goes beyond the investments of the plants by the demand, but the current pricing of ammonia markets ensures a financially secured investment covered by expected future cash flow.
This prediction is supported by an expected growing demand from the maritime sector in BSR. The study also reveals significant extra investment for the construction of ammonia plants, together with wind farms. Furthermore, from 2025, the current ammonia capacity needs will start at 1.5 million Mt annually until it reaches about 3 million Mt in 2050. The doubling of the demand will likely come from the maritime sector in BSR. Already the BSR has an estimated demand of about 1.5 million Mt of ammonia as marine fuel, representing 25% of the current marine consumption within the BSR. The portfolio option selection of the investment determines the investment decision factors and their relative significance of investments in ammonia production plants.
The current global turbulences increase the strong need for continuous detailed recommendations and future research to develop the applied database and findings of the current study in several ways. An interesting path could explore and empirically test different conceptual variations of the fuzzy real options analysis. The study would also benefit the formulation of more detailed managerial and policy recommendations in the wider field of ammonia production, transport, and infrastructure.

Author Contributions

Conceptualization, G.P. and E.O.O.; methodology, G.P. and E.O.O.; validation, G.P., W.G. and E.O.O.; formal analysis, G.P.; investigation, G.P., W.G. and E.O.O.; data curation, G.P.; writing—original draft preparation, G.P.; writing—review and editing, G.P., E.O.O. and W.G. All authors have read and agreed to the published version of the manuscript.

Funding

This research received no external funding.

Institutional Review Board Statement

Studies not involving humans or animals.

Informed Consent Statement

Not applicable.

Data Availability Statement

Data used is contained within the article.

Conflicts of Interest

The authors declare no conflict of interest.

References

  1. Reuters. Explainer: How UN Plan for Russian Ammonia, Export Could Help Global Fertilizer Market, 14 September 2022. Available online: https://www.reuters.com/markets/commodities/how-un-plan-russian-ammonia-export-could-help-global-fertiliser-market-2022-09-14/ (accessed on 5 October 2022).
  2. Prause, F.; Prause, G.; Philipp, R. Inventory Routing for Ammonia Supply in German Ports. Energies 2022, 15, 6485. [Google Scholar] [CrossRef]
  3. Gerlitz, L.; Mildenstrey, E.; Prause, G. Ammonia as Clean Shipping Fuel for the Baltic Sea Region. Transp. Telecommun. J. 2022, 23, 102–112. [Google Scholar] [CrossRef]
  4. EIA. U.S. Ammonia Prices Rise in Response to Higher International Natural Gas Prices; US Energy Information Administration: Washington, DC, USA, 2022.
  5. Prause, G.; Tuisk, T.; Olaniyi, E.O. Between sustainability, social cohesion and security. Regional development in North-Eastern Estonia. Entrep. Sustain. Issues 2019, 6, 1235–1254. [Google Scholar] [CrossRef] [PubMed]
  6. Ampah, J.D.; Yusuf, A.A.; Afrane, S.; Jin, C.; Liu, H. Reviewing two decades of cleaner alternative marine fuels: Towards IMO’s decarbonization of the maritime transport sector. J. Clean. Prod. 2021, 320, 128871. [Google Scholar] [CrossRef]
  7. DNV-GL. Ammonia as Marine Fuel; White Paper 2020: Høvik, Norway, 2020. [Google Scholar]
  8. Klerke, A.; Christensen, C.H.; Nørskov, J.K.; Vegge, T. Ammonia for hydrogen storage: Challenges and opportunities. J. Mater. Chem. 2008, 18, 2304–2310. [Google Scholar] [CrossRef]
  9. IMO. Actions to Reduce Greenhouse Gas Emissions from International Shipping—Implementing the Initial IMO Strategy on Reduction of GHG Emissions from Ships 2019. Available online: http://www.imo.org/en/MediaCentre/HotTopics/Documents/ (accessed on 7 August 2020).
  10. Macfarlane, D.; Cherepanov, P.; Choi, J.; Suryanto, B.; Hodgetts, R.; Bakker, J.; Vallana, F.; Simonov, A. A Roadmap to the Ammonia. Economy 2020, 4, 1186–1205. [Google Scholar] [CrossRef]
  11. Yeo, K.T.; Qiu, F. The value of managerial flexibility—A real options approach to investment evaluation. Proj. Manag. 2003, 21, 243–250. [Google Scholar] [CrossRef]
  12. Ho, S.H.; Liao, S.H. A fuzzy real option approach for investment project valuation. Expert Syst. 2011, 38, 15296–15302. [Google Scholar] [CrossRef]
  13. Atari, S.; Bakkar, Y.; Olaniyi, E.O.; Prause, G. Real options analysis of abatement investments for Sulphur emission control compliance. Entrep. Sustain. Issues 2019, 6, 1062. [Google Scholar] [CrossRef]
  14. Bellman, R.E.; Zadeh, L.A. Decision-making in a fuzzy environment. Manag. Sci. 1970, 17, B-141. [Google Scholar] [CrossRef]
  15. Olaniyi, E.O.; Atari, S.; Prause, G. Maritime Energy Contracting for Clean Shipping. Transp. Telecommun. J. 2018, 19, 31–44. [Google Scholar] [CrossRef]
  16. Carlsson, C.; Fuller, R.; Heikkilä, M.; Majlender, P. A fuzzy approach to R&D project portfolio selection. Int. Jour. Approx. Reason. 2007, 44, 93–105. [Google Scholar]
  17. Buckley, J.J. The fuzzy mathematics of finance. Fuzzy Sets Syst. 1987, 21, 257–273. [Google Scholar] [CrossRef]
  18. Carlsson, C.; Fullér, R. On Fuzzy Internal Rate of Return; TUCS-Turku Centre for Computer Science (No. 211); Tech. Rep.; Springer: Turku, Finland, 1998. [Google Scholar]
  19. Carlsson, C.; Fullér, R. Capital budgeting problems with fuzzy cashflows. Mathw. Soft Comput. 1999, 6, 1. [Google Scholar]
  20. Zadeh, L.A. Is there a need for fuzzy logic? Inf. Sci. 2008, 178, 2751–2779. [Google Scholar] [CrossRef]
  21. Olaniyi, E.O.; Prause, G. Maritime Investment Appraisal: The Case of Waste Heat Recovery Systems Installation. In Reliability and Statistics in Transportation and Communication; Kabashkin, I., Yatskiv, I., Prentkovskis, O., Eds.; RelStat 2020. Lecture Notes in Networks and Systems; Springer: Cham, Switzerland, 2021; Volume 195. [Google Scholar] [CrossRef]
  22. Peterson, P.P.; Fabozzi, F.J. Capital Budgeting: Theory and Practice; John Wiley and Sons: New York, NY, USA, 2002. [Google Scholar]
  23. Pattabathula, V.; Richardson, J. Introduction to ammonia production. Chem. Eng. Prog 2016, 112, 69–75. [Google Scholar]
  24. Apodaca, L.U.S. Geological Survey. In Mineral Commodity Summaries; USGS: Washington, DC, USA, 2022. [Google Scholar]
  25. Ghavam, S.; Vahdati, M.; Wilson, I.A.G.; Styring, P. Sustainable Ammonia Production Processes. Front. Energy Res. 2021, 9, 580808. [Google Scholar] [CrossRef]
  26. IEA. World Eergy Outlook 2020. Available online: https://www.iea.org/reports/world-energy-outlook-2020 (accessed on 11 July 2022).
  27. Shell. Our Climate Target. 2022. Available online: https://www.shell.com/energy-and-innovation/the-energy-future/our-climate-target.html (accessed on 11 July 2022).
  28. Sys, C.; Vanelslander, T.; Adriaenssens, M.; Van Rillaer, I. International Emission Regulation in Sea Transport: Economic feasibility and Impact. Trans. Res. Part D Trans. Environ. 2016, 45, 139–151. [Google Scholar] [CrossRef]
  29. Psaraftis, H.N. Decarbonization of maritime transport: To be or not to be? Marit. Econ. Logist. 2019, 21, 353–371. [Google Scholar] [CrossRef]
  30. Schinas, O.; Stefanakos, C.N. Cost assessment of environmental regulation and options for marine operators. Trans. Res. Part C Emerg. Technol. 2012, 25, 81–99. [Google Scholar] [CrossRef]
  31. Jiang, L.; Kronbak, J.; Christensen, L.P. The costs and benefits of sulphur reduction measures: Sulphur scrubbers versus marine gas oil. Transp. Res. Part D Trans. Environ. 2014, 28, 19–27. [Google Scholar] [CrossRef]
  32. Ren, J.; Lützen, M. Fuzzy multi-criteria decision-making method for technology selection for emissions reduction from shipping under uncertainties. Trans. Res. Part D Trans Environ. 2015, 40, 43–60. [Google Scholar] [CrossRef]
  33. Lindstad, H.; Sandaas, I.; Strømman, A.H. Assessment of cost as a function of abatement options in maritime emission control areas. Trans. Res. Part D Trans. Environ. 2015, 38, 41–48. [Google Scholar] [CrossRef]
  34. Johannessen, T. Ammonia & Maritime Decarbonization, Ammonia Energy Conference 2020. Available online: https://www.ammoniaenergy.org/wp-content/uploads/2020/12/Tue-Johannssen.pdf (accessed on 28 October 2022).
  35. Atchison, J. Marine Ammonia: Panel Wrap-Up from the 2020 Ammonia Energy Conference. 2021. Available online: https://www.ammoniaenergy.org/articles/marine-ammonia/ (accessed on 28 October 2022).
  36. Kim, K.; Roh, G.; Kim, W.; Chun, K. A Preliminary Study on an Alternative Ship Propulsion System Fuelled by Ammonia: Environmental and Economic Assessments. J. Mar. Sci. Engr. 2020, 8, 183. [Google Scholar] [CrossRef]
  37. Xing, H.; Spence, S.; Chen, H. A comprehensive review on countermeasures for CO2 emissions from ships. Renew. Sustain. Energy Rev. 2020, 134, 110222. [Google Scholar] [CrossRef]
  38. Ahlgren, J. Circular Baltic 2030–Circular Economy in the Baltic Sea Region and Beyond. Global Utmaning for Interreg Baltic Sea Region Programme and BSSSC, Stockholm, 2019. Available online: https://circulareconomy.europa.eu/platform/en/knowledge/circular-baltic-2030-circular-economy-baltic-sea-region-and-beyond (accessed on 2 September 2022).
  39. Will, M. Realization of Large-Scale Green Ammonia Plants Engineering Tomorrow Together. AIChE Annual Meeting—NH3 Energy+ Topical Conference, 2018. Thyssenkrupp Industrial Solutions. Available online: https://nh3fuelassociation.org/wp-content/uploads/2018/12/1630-Realization-of-Large-Scale-Green-Ammonia-Plants-tkIS.pdf (accessed on 28 October 2022).
  40. Beyersdorff, S.; Lanthen, E. Baltic 2030: Bumps on the Road. How the Baltic Sea States Are Performing on the SDGs; Nordic Council of Ministers and Council of the Baltic Sea States: Copenhagen, Denmark, 2018; Available online: http://norden.diva-portal.org/smash/get/diva2:1209827/FULLTEXT02.pdf (accessed on 28 October 2022).
  41. Topsoe. Ammonia—An Industrial View of Ammonia as a Marine Fuel; Alfa Laval, Hafnia, Haldor Topsoe, Vestas, and Siemens Gamesa; Denmark 2020. Available online: https://www.topsoe.com/hubfs/DOWNLOADS/DOWNLOADS%20-%20White%20papers/Ammonfuel%20Report%20Version%2009.9%20August%203_update.pdf (accessed on 28 October 2022).
  42. Olaniyi, E.O.; Viirmäe, M. The Economic Impact of Environmental Regulations on a maritime Fuel Production Company. Res. Econs. Bus. Cent. East. Eur. 2016, 8, 58–84. [Google Scholar]
  43. Eurostat. Energy Dependence. 2022. Available online: https://ec.europa.eu/eurostat/databrowser/view/t2020_rd320/default/table?lang=en (accessed on 5 October 2022).
  44. Kotenjova, J. Keskkonnaohtlikud Veosed Sillamäel Ning Nendega Kaasnevad Ohutegurid. Master’s Thesis, Tallinn University of Technology, Tallinn, Estonia, 2022. Available online: https://digikogu.taltech.ee/testimine/et/Item/1c6a073c-fb16-4a66-99de-35ad062adbeb (accessed on 11 July 2022).
  45. Olaniyi, E.O.; Prause, G.; Gerasimova, V.; Inkinen, T. Clean Cruise Shipping: Experience from the BSR. Sustainability 2022, 14, 5002. [Google Scholar] [CrossRef]
  46. Kent, J. Kent and Riegel’s Handbook of Industrial Chemistry and Biotechnology; Springer: New York, NY, USA, 2007. [Google Scholar] [CrossRef]
  47. Collan, M.; Fullér, R.; Mezei, J. A fuzzy pay-off method for real option valuation. In Advances in Decision Sciences; Hindawi: London, UK, 2009; Volume 2009, p. 238196. [Google Scholar] [CrossRef]
  48. Dixit, A.K.; Pindyck, R.S. The options approach to capital investment. Harv. Bus. Rev. 1995, 73, 105–115. [Google Scholar]
  49. Bowman, E.H.; Moskowitz, G.T. Real options analysis and strategic decision making. Organ. Sci. 2001, 12, 772–777. [Google Scholar] [CrossRef]
  50. Tarrazo, M. A methodology and model for qualitative business planning. Int. J. Bus. Res. 1997, 3, 41–62. [Google Scholar]
  51. Sheen, J.N. Fuzzy financial profitability analyses of demand side management alternatives from participant perspective. Inf. Sci. 2005, 169, 329–364. [Google Scholar] [CrossRef]
  52. Zadeh, L.A. Fuzzy sets. Inf. Control. 1965, 8, 338–353. [Google Scholar] [CrossRef]
  53. Ponsard, C. Fuzzy mathematical models in economics. Fuzzy Sets Syst. 1988, 28, 273–283. [Google Scholar] [CrossRef]
  54. Carlsson, C.; Fullér, R. A fuzzy approach to real option valuation. Fuzzy Sets Syst. 2003, 139, 297–312. [Google Scholar] [CrossRef]
  55. Gillham, B. Case Study Research Methods; Bloomsbury Publishing: London, UK, 2000. [Google Scholar]
  56. Hull, J. Risk Management, 4th ed.; John Wiley & Sons: Hoboken, NJ, USA, 2015; ISBN 978-1118955949. [Google Scholar]
  57. Brown, T. Ammonia Plant Cost Comparisons: Natural Gas, Coal or Electrolysis, Ammonia Energy Association. 2017. Available online: https://www.ammoniaenergy.org/articles/ammonia-plant-cost-comparisons-natural-gas-coal-or-electrolysis/ (accessed on 21 July 2022).
  58. Yin, R.K. Case Study Research: Design and Methods, Revised Edition; Applied Social Research Methods Series; Sage: Washington DC, USA, 1989; Volume 5. [Google Scholar]
  59. Kirova-Yordanova, Z. Thermodynamic evaluation of energy integration and cogeneration in ammonium nitrate production complexes. Int. J. Thermodyn. 2013, 16, 163–171. [Google Scholar] [CrossRef]
  60. Fermi Energia. Feasibility Analysis of the Suitability of a Small Modular Reactor (SRM) to Ensure Energy Supply and Meet Climate Goals 2030+ Part II 2020. Teostatavusanalüüs Väikse Moodulreaktori (Vmr) Sobivusest Eesti Energiavarustuse Tagamiseks Ja Kliimaeesmärkide Täitmiseks 2030+ Osa ii. Available online: https://fermi.ee/wp-content/uploads/2021/02/uuringud-2020-fe-final.pdf (accessed on 1 September 2022).
  61. VKG Strateegia (n.d.). Global Climate Neutrality: Opportunities and Risks of Viru Kemiaa Group. Available online: https://www.vkg.ee/wpcontent/uploads/2021/05/VKG_strateegia_kliimaneutraalses_maailmas_MR_final_draft.pdf_(n.d) (accessed on 11 July 2022).
  62. Tuule. Tuuleenergia Assotsiatsion. 2022. Available online: https://tuuleenergia.ee (accessed on 17 November 2022).
  63. Stehly, T.; Duffy, P. Cost of Wind Energy Review. Golden, CO: National Renewable Energy Laboratory. 2020. NREL/TP-5000-81209. Available online: https://www.nrel.gov/docs/fy22osti/81209.pdf (accessed on 13 August 2022).
Figure 1. Fuzzy real options analysis (FROA) for Estonia’s Ammonia Plant. (A) CAPEX of the NH3 Plant at fuzzy value. (B) Trapezoidal CAPEX from fuzzy calculation. (C) OPEX per ton of NH3 at fuzzy value. (D) Estimated ammonia price at fuzzy value. (E) Results of the FROA, Return of Value (ROV) from the fuzzy mean of the possibility distribution, and fuzzy value at risk (FVaR). (F) Final FROA trapezoid.
Energies 16 01831 g001
Figure 2. Ammonia-plant capacity until 2050.
Energies 16 01831 g002
Table 1. Technical data block parameters.
Technical ParametersData
Annual production volume750,000 Mt of NH3
Number of annual days of operation340 days
Daily production volume2200 Mt of NH3
The lifetime of the NH3 plant:15 Years
Planning and construction time3 Years
Table 2. Economic data block parameters.
Economic ParametersData
CAPEX of the plantUSD 800–1000 million
OPEX per ton of NH3USD 450–500 per ton
Estimated ammonia priceUSD 800 per ton
Long-term interest rate7.5% annually
Table 3. Investment indicators from classical capital budgeting.
Investment IndicatorsData
Estimated CAPEXUSD 900 million
Estimated OPEX per tonUSD 475
Estimated ammonia price per tonUSD 800 per ton
Net present valueUSD 1417 million
Internal rate of returnapprox. 28%
Payback periodapprox. 4.5 years
Static break-even pointapprox. 200,000 Mt of NH3 per year
Disclaimer/Publisher’s Note: The statements, opinions and data contained in all publications are solely those of the individual author(s) and contributor(s) and not of MDPI and/or the editor(s). MDPI and/or the editor(s) disclaim responsibility for any injury to people or property resulting from any ideas, methods, instructions or products referred to in the content.

